Embed Size (px)
Citation preview

Moisture Sorption Analysis of Pharmaceuticals
Robert L. Hassel, Ph.D.
TA Instruments, 109 Lukens Drive, New Castle, DE 19720, USA
ABSTRACT This paper describes the design features of the Q5000 SA, a new analyzer designed for evaluating
moisture adsorption / desorption behavior of materials, and its use in the analysis of pharmaceuticals.
INTRODUCTION Because moisture affects the properties of many pharmaceutical materials, manufacturers must
understand not only the quantity of moisture present in their materials, but also their moisture adsorption / desorption behavior as they are exposed to humidity during processing, storage and in end-use.
Q5000 SA Figure 1 shows a schematic of the Q5000 SA. The analyzer is based on a vertical nulling
microbalance, in which the sample and reference hang-down wires and pans are enclosed in a humidity and temperature controlled chamber. The balance is thermally isolated from the measurement zone and maintained at a constant 40 ºC during experiments to provide the long-term baseline stability required for sorption analysis (Figure 2). The hang-down wires and sample pan / boat (metallicized quartz, platinum or sealed aluminum) are grounded to the balance enclosure to eliminate static effects. A dry nitrogen gas purge at 10 mL/minute assures the dryness of the balance housing. A separate dry nitrogen purge stream at 200 mL/minute is split into two components for generation of the desired percent relative humidity (% RH) environment. One part of the stream remains dry while the other is passed through a water saturation chamber, where it is brought to 100% RH at the temperature of the analysis. High precision mass flow controllers regulate the proportions of dry and wet gas to obtain the % RH desired for the analysis. Capacitance-type sensors located near the sample and reference pans monitor the % RH to confirm that it is at the desired level. The temperature of the oven enclosure, which surrounds the humidity chamber, is regulated by four Peltier elements on the outside of the enclosure.
purge purge
BALANCE CHAMBERMFC
N2
REMOVABLE ASSEMBLY ALSO INCLUDES: HOUSING COVERS PELTIER HEAT PUMPS HEAT SINKS HUMIDITY SENSORS DRYING SOLENOIDS
REF SAMPLE
MFC1
MFC2 H20
Humidity Sensor
Symmetric system
Thermally isolated balance
Static-resistant hang-down arrangement
Calibrated mass flow controllers
Figure 1: Q5000SA Simplified Schematic
TP 329 1

The whole enclosure is very compact, and hence highly responsive to changes in % RH or in temperature. The Q5000 SA can run isothermal experiments in the range of 5-60 ºC, where the humidity is stepped (in >0.1 %RH steps) or ramped at 0.1-0.2 %RH/minute. It can also perform isohumidity (isohum) experiments, where the temperature is stepped or ramped at rates of up to 0.5 ºC/minute). The humidity range covered is 0-95 %RH.
Figure 2 shows the excellent Q5000 SA baseline as judged by the Y-axis displacement (4 µg) on an isothermal, constant humidity experiment over nearly 64 hours at ambient temperature.
Figure 2: Q5000SA Baseline Drift over 2.5 Days APPLICATIONS
Most moisture sorption analysis experiments are performed by stepping the humidity (% RH) over a broad range at constant temperature. Since many materials do not desorb water at the same rate as they originally adsorbed the water, the actual experiments often consist of a more complex stepped humidity experiment, where the humidity is increased, then decreased, and finally increased a second time to determine if the material’s structure and behavior are changed during the initial exposure to higher humidity. Faster water adsorption on the second set of increasing humidity steps usually indicates that the material’s structure has changed, such as from a crystalline to more amorphous structure. Most results are plotted as “% weight change” versus % RH, and materials can be evaluated either “as received” or dried. If the molecular weight of the sample material is known, the results can be reported as “weight (moles) of adsorbed water per weight (moles) of sample”. To obtain those values, however, the sample must be dried prior to analysis and a true “dry weight” obtained. Drying prior to analysis is achieved by holding the material at 0 %RH for multiple hours at modest temperatures (25-60 ºC). Drying under more strenuous conditions such as high temperature or vacuum is avoided because those conditions could change the structure of the material (eg, waters of hydration could be lost).
Figure 3 shows the raw experimental data for a typical stepped humidity - constant temperature experiment. The sample is PVP (polyvinylpyrollidone), a common excipient used in pharmaceutical formulations. The blue curve shows the humidity steps, while the green curve displays the resultant weight gains that occur as the humidity is increased. Note the long experimental time. Moisture sorption analyses are usually lengthy because of the time required for the material to reach equilibrium at a specific humidity. Typically, the equilibrium time increases as the % RH increases. With appropriate software, sorption experiments can be programmed so that either total elapsed time (dwell time), or the decay of the weight derivative signal, determines when equilibrium at each humidity step has occurred. The latter approach helps reduce the total experimental time, while maintaining the accuracy of the results. Figure 4 is the final adsorption curve for PVP. This plot is generated by taking a single point after equilibrium at each humidity level. The value of interest in assessing PVP is the total % weight change of (42 +/- 2%) at 80 %RH. The amount of water adsorbed by PVP is large by pharmaceutical standards, but is typical of excipients. Crystalline materials used as active ingredients in pharmaceutical formulations commonly adsorb <5 % water.
TP 329 2

0
10
20
30
40
50
60
70
80
90
Ref
Rel
ativ
e H
umid
ity (%
)
-10
0
10
20
30
40
50
Wei
ght C
hang
e (%
)
200 300 400 500 600 700
Time (min)
Figure 3: PVP Experimental Data
0
1 0
2 0
3 0
4 0
5 0
0 1 0 2 0 3 0 4 0 5 0 6 0 7 0 8 0 9 0
A d s o r p t io n Is o t h e r m o fP V P a t 2 5 ° C
% A d s or p t io n
% W
eigh
t Cha
nge
% R e la t iv e H u m id it y
Figure 4: PVP Sorption Isotherm
Deliquescence is another common behavior, which can be exhibited by pharmaceutical materials when exposed to moisture. Deliquescent materials absorb very little water as the humidity is raised until the %RH reaches a “critical” (deliquescence) level. At that %RH and temperature, the material suddenly starts absorbing any available moisture. Lithium chloride (Figure 5) represents “ideal” onset of deliquescence from an analysis perspective because the % weight change with humidity is so abrupt that it is easy to determine the deliquescence point as either the first deviation from baseline or as the extrapolated onset of adsorption. Materials like urea, however, exhibit a more gradual deliquescence point (green curve in Figure 6) and hence its determination is more subjective based on where the extrapolated onset of uptake (weight gain) is measured. This difficulty can be eliminated by plotting the change in mass with respect to change in humidity during a ramped humidity experiment. The point where that curve (blue curve in Figure 6) crosses zero (i.e., the point where the material is neither adsorbing or desorbing water) during the decreasing humidity ramp is recognized as the deliquescence point. There is a third method used for
TP 329 3

determining the deliquescence point. That method is based on raising the humidity above the onset of deliquescence and then stepping down in humidity. The maximum point in the downward %weight change curve is considered the deliquescence point (Figure 7). Since the region of interest in this latter type of plot is often only several %RH wide (as is the case with urea), it is necessary to use small (0.1%RH) steps to obtain accurate results.
0
5
10
15
20
25
30
0 2 4 6 8 10 12 14
Adsorption Isotherm ofLiCl at 25°C
% W
eigh
t Cha
nge
% Relative Humidity
Figure 5: Lithium Chloride Deliquescence
Figure 6: Urea Deliquescence (Ramp Humidity) at 25 ºC
TP 329 4

Figure 7: Urea Deliquescence (Step Down Humidity) at 25 ºC
When evaluating pharmaceuticals, particularly in the active ingredient screening & preformulation stage, it is common for only small amounts of material to be available for conducting multiple analytical tests including sorption analysis. Hence, the ability to work with small samples is beneficial. In addition, working with smaller samples allows the material to equilibrate more rapidly at the various humidity steps, thereby shortening the experiment. The low baseline drift of the Q5000SA (Figure 2) means that good results can be obtained on as little as10-20 milligrams of crystalline drugs such as prednisone (Figures 8-9), which adsorb <1% moisture over a broad humidity range. The sorption results shown in Figure 8 represent about 15 micrograms of weight change full-scale. The larger sample shown in Figure 9 yields the same general profile indicating that the results on the smaller sample are valid. The reversibility (lack of hysteresis) in the sorption / desorption profile for prednisone indicates that the moisture adsorbed is loosely held on the surface of the material rather than being adsorbed into its structure.
Figure 8: Prednisone...small sample (25C)
TP 329 5
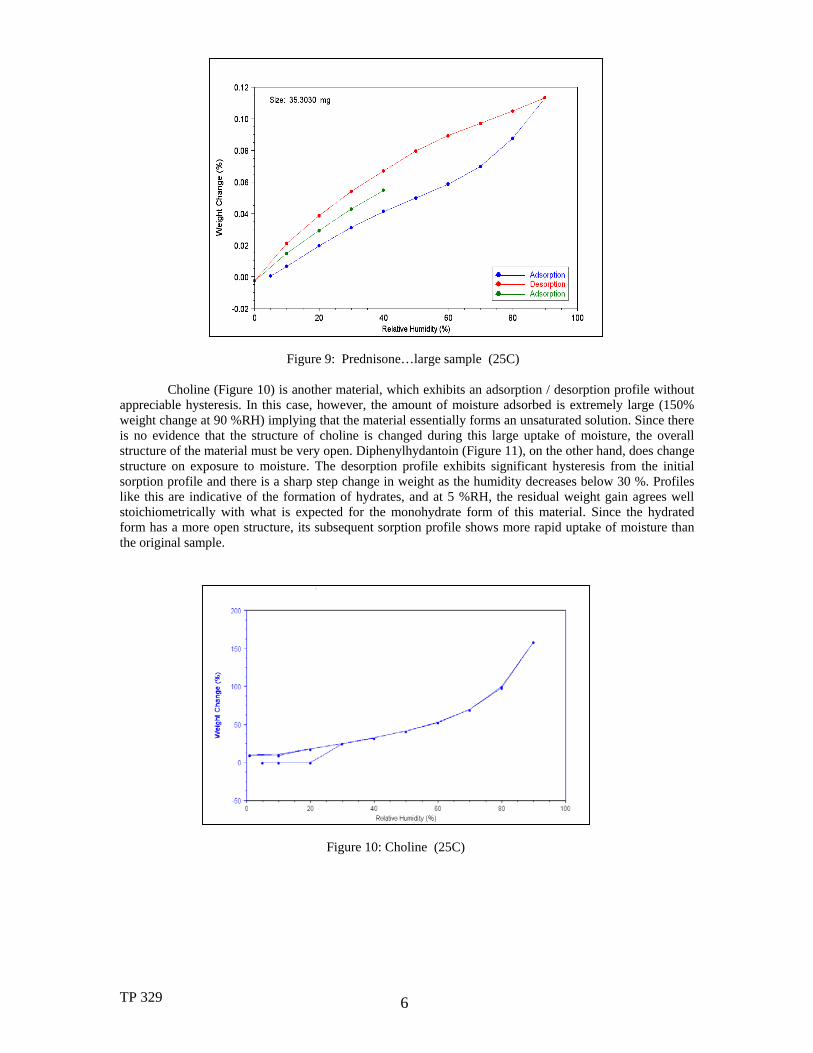
Figure 9: Prednisone…large sample (25C)
Choline (Figure 10) is another material, which exhibits an adsorption / desorption profile without appreciable hysteresis. In this case, however, the amount of moisture adsorbed is extremely large (150% weight change at 90 %RH) implying that the material essentially forms an unsaturated solution. Since there is no evidence that the structure of choline is changed during this large uptake of moisture, the overall structure of the material must be very open. Diphenylhydantoin (Figure 11), on the other hand, does change structure on exposure to moisture. The desorption profile exhibits significant hysteresis from the initial sorption profile and there is a sharp step change in weight as the humidity decreases below 30 %. Profiles like this are indicative of the formation of hydrates, and at 5 %RH, the residual weight gain agrees well stoichiometrically with what is expected for the monohydrate form of this material. Since the hydrated form has a more open structure, its subsequent sorption profile shows more rapid uptake of moisture than the original sample.
Figure 10: Choline (25C)
TP 329 6
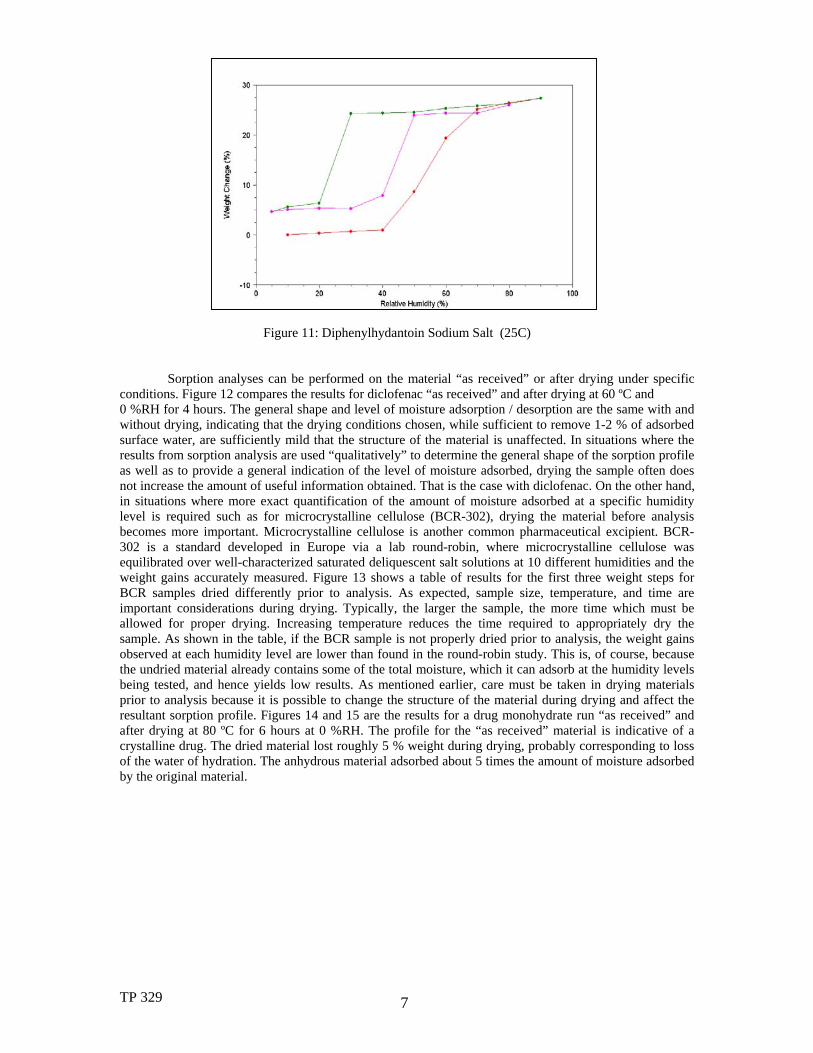
Figure 11: Diphenylhydantoin Sodium Salt (25C)
Sorption analyses can be performed on the material “as received” or after drying under specific conditions. Figure 12 compares the results for diclofenac “as received” and after drying at 60 ºC and 0 %RH for 4 hours. The general shape and level of moisture adsorption / desorption are the same with and without drying, indicating that the drying conditions chosen, while sufficient to remove 1-2 % of adsorbed surface water, are sufficiently mild that the structure of the material is unaffected. In situations where the results from sorption analysis are used “qualitatively” to determine the general shape of the sorption profile as well as to provide a general indication of the level of moisture adsorbed, drying the sample often does not increase the amount of useful information obtained. That is the case with diclofenac. On the other hand, in situations where more exact quantification of the amount of moisture adsorbed at a specific humidity level is required such as for microcrystalline cellulose (BCR-302), drying the material before analysis becomes more important. Microcrystalline cellulose is another common pharmaceutical excipient. BCR-302 is a standard developed in Europe via a lab round-robin, where microcrystalline cellulose was equilibrated over well-characterized saturated deliquescent salt solutions at 10 different humidities and the weight gains accurately measured. Figure 13 shows a table of results for the first three weight steps for BCR samples dried differently prior to analysis. As expected, sample size, temperature, and time are important considerations during drying. Typically, the larger the sample, the more time which must be allowed for proper drying. Increasing temperature reduces the time required to appropriately dry the sample. As shown in the table, if the BCR sample is not properly dried prior to analysis, the weight gains observed at each humidity level are lower than found in the round-robin study. This is, of course, because the undried material already contains some of the total moisture, which it can adsorb at the humidity levels being tested, and hence yields low results. As mentioned earlier, care must be taken in drying materials prior to analysis because it is possible to change the structure of the material during drying and affect the resultant sorption profile. Figures 14 and 15 are the results for a drug monohydrate run “as received” and after drying at 80 ºC for 6 hours at 0 %RH. The profile for the “as received” material is indicative of a crystalline drug. The dried material lost roughly 5 % weight during drying, probably corresponding to loss of the water of hydration. The anhydrous material adsorbed about 5 times the amount of moisture adsorbed by the original material.
TP 329 7

Figure 12: Diclofenac Sodium Salt (25C)
3.604.053.894.25+/-0.094.1533.0
2.673.243.123.25+/-0.123.2422.5
1.442.041.952.06+/-0.112.1311.1
As received
Dried at 25C (2mg)
Dried at 25C (10mg)
Dried at 60C (10mg)
Confidence Interval
Weight Gain
%RH
3.604.053.894.25+/-0.094.1533.0
2.673.243.123.25+/-0.123.2422.5
1.442.041.952.06+/-0.112.1311.1
As received
Dried at 25C (2mg)
Dried at 25C (10mg)
Dried at 60C (10mg)
Confidence Interval
Weight Gain
%RH
Figure 13: Microcrystalline Cellulose (BCR) Results
Figure 14: Drug Monohydrate (as received)
TP 329 8

Figure 15: Drug Monohydrate (after drying)
Further illustrative examples of other types of measurements, which can be made on pharmaceuticals, are shown in Figures 16-18. Samples that readily adsorb moisture (hygroscopic materials) are often difficult to evaluate since their weight changes dynamically in the process of determining the initial starting weight for the purposes of expressing later weight changes as “%weight change”. Another way to evaluate those materials is to expose them to different humidity levels until the material comes to equilibrium and designate that point as the starting weight for subsequent comparisons. Then, the “moisture-equilibrated” materials are “dried” by raising them to an elevated temperature at 0 %RH until equilibrium is attained. The weight losses during “drying” provide an indication of the total amount of water adsorbed by the material at each humidity level. Drying the material before analysis is another potential approach. However, the peptide material shown in Figure 16 could not be evaluated that way since it was known to readily lose waters of hydration, which changed the material’s structure. In Figure 17, the goal is to determine proper drying parameters for the material during processing (i.e., the lowest humidity which can be used at a specific drying temperature without changing the structure by removing any weakly held water(s) of hydration). The results were obtained by stepping humidity from a high starting level to a lower level (right to left in the Figure). The humidity where a significant weight change occurs indicates loss of the water of hydration. At 25 ºC drying temperature, humidities as low as 10 %RH can be used. At 40 ºC and above, the humidity during drying must be at least 15 %RH to avoid issues. In this material, the impact of sample form (milled versus unmilled) has little effect on the drying properties.
Figure 16: Peptide Hygroscopicity
TP 329 9
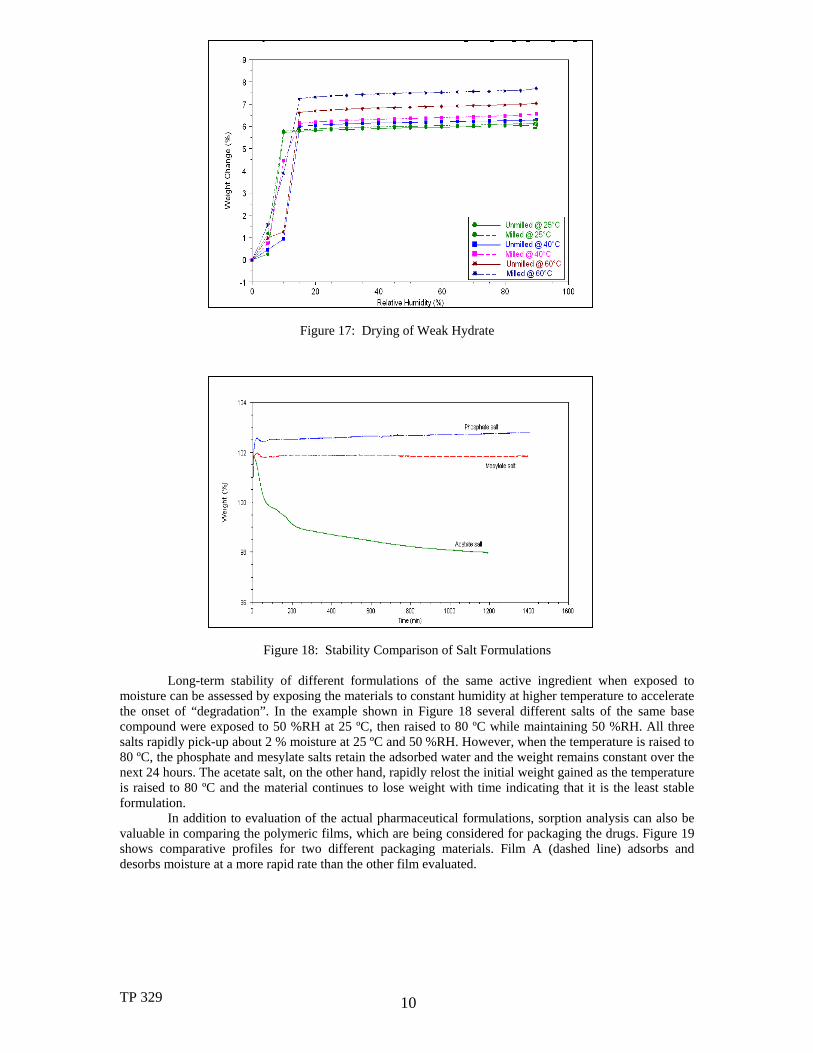
Figure 17: Drying of Weak Hydrate
Figure 18: Stability Comparison of Salt Formulations
Long-term stability of different formulations of the same active ingredient when exposed to
moisture can be assessed by exposing the materials to constant humidity at higher temperature to accelerate the onset of “degradation”. In the example shown in Figure 18 several different salts of the same base compound were exposed to 50 %RH at 25 ºC, then raised to 80 ºC while maintaining 50 %RH. All three salts rapidly pick-up about 2 % moisture at 25 ºC and 50 %RH. However, when the temperature is raised to 80 ºC, the phosphate and mesylate salts retain the adsorbed water and the weight remains constant over the next 24 hours. The acetate salt, on the other hand, rapidly relost the initial weight gained as the temperature is raised to 80 ºC and the material continues to lose weight with time indicating that it is the least stable formulation.
In addition to evaluation of the actual pharmaceutical formulations, sorption analysis can also be valuable in comparing the polymeric films, which are being considered for packaging the drugs. Figure 19 shows comparative profiles for two different packaging materials. Film A (dashed line) adsorbs and desorbs moisture at a more rapid rate than the other film evaluated.
TP 329 10

Drying at 60C
Drying at 30C
70%RH at 30CDrying at 60C
Drying at 30C
70%RH at 30C
Figure 19: Packaging Films SUMMARY
Sorption analysis is an important analytical tool for the characterization of pharmaceuticals during the screening of active ingredients and preformulations. The new Q5000 SA from TA Instruments (Figure 20) incorporates many unique features, including a 10-position autosampler and software for scheduling automatic unattended validation of performance and calibration, which should make obtaining these important results faster and easier. Furthermore, the instrument is totally self-contained and requires minimal bench space compared to traditional sorption analyzers.
Figure 20: Q5000 SA
TP 329 11

KEY WORD Q5000 SA, sorption analysis, moisture sorption analysis, adsorption, desorption, humidity, relative humidity, pharmaceuticals, active ingredients, preformulation
© COPYRIGHT 2005 TA INSTRUMENTS
TA INSTRUMENTS United States, 109 Lukens Drive, New Castle, DE 19720 • Phone: 1-302-427-4000 • Fax: 1-302-427-4001 E-mail: [email protected] Spain • Phone: 34-93-600-9300 • Fax: 34-93-325-9896 • E-mail: [email protected]
United Kingdom • Phone: 44-1-293-658900 • Fax: 44-1-293-658901 • E-mail: [email protected] Belgium/Luxembourg • Phone: 32-2-706-0080 • Fax: 32-2-706-0081 E-mail: [email protected] Netherlands • Phone: 31-76-508-7270 • Fax: 31-76-508-7280 E-mail: [email protected] Germany • Phone: 49-6023-9647-0 • Fax: 49-6023-96477-7 • E-mail: [email protected] France • Phone: 33-1-304-89460 • Fax: 33-1-304-89451 • E-mail: [email protected] Italy • Phone: 39-02-27421-283 • Fax: 39-02-2501-827 • E-mail: [email protected] Sweden/Norway • Phone: 46-8-594-69-200 • Fax: 46-8-594-69-209 E-mail: [email protected] Japan • Phone: 813 5479 8418 • Fax: 813 5479 7488 • E-mail: [email protected] Australia • Phone: 613 9553 0813 • Fax: 61 3 9553 0813 • E-mail: [email protected] To contact your local TA Instruments representative visit our website at www.tainst.com
TP 329 12