Embed Size (px)
Citation preview
Page 1 of 12
FOOD SCIENCE & TECHNOLOGY | RESEARCH ARTICLE
Moisture dependent thermal properties of cassiaBhupendra M. Ghodki, A.D. Srikanth Tangirala and T.K. Goswami
Cogent Food & Agriculture (2016), 2: 1227110
1000
1500
2000
2500
3000
3500
6 8 10 12 14 16
Spec
ific
hea
t (J
Kg-1
oC
-1)
Moisture Content (% d.b.)
(-) 90 Degree Celcius
30 Degree Celcius
Ghodki et al., Cogent Food & Agriculture (2016), 2: 1227110http://dx.doi.org/10.1080/23311932.2016.1227110
FOOD SCIENCE & TECHNOLOGY | RESEARCH ARTICLE
Moisture dependent thermal properties of cassiaBhupendra M. Ghodki1, A.D. Srikanth Tangirala1 and T.K. Goswami1*
Abstract: Thermal and mechanical properties of cassia are primarily required in the study of its different thermal and mechanical operations. The thermal proper-ties of cassia bark viz., specific heat, glass transition temperature (Tg), bulk thermal conductivity, and bulk thermal diffusivity were determined for a moisture range of 8–14% dry basis (d.b). Compression test was performed by Universal Testing Machine to examine the breaking characteristics of cassia along its three orthogo-nal directions at 11.10% d.b. moisture level. Results revealed that the specific heat increased from 1,553.12 to 3,232.90 J kg−1 °C−1 with an increase in moisture at 30°C. Whereas Tg decreased linearly from −66.67 to −86.09°C and the bulk thermal conductivity increased linearly from 0.10 to 0.14 W m−1 °C−1 with a rise in moisture content of the sample. Moreover, the bulk thermal diffusivity of cassia bark de-creased from 2.75 × 10⁻⁷ to 1.62 × 10⁻⁷ m2 s−1 with an increase in moisture level. The average rupture forces for cassia bark through the minor axis, major and intermedi-ate axis were 0.130, 0.123 and 0.109 kN, respectively, and corresponding average deformations at rupture were 1.36, 1.30 and 0.91 mm, respectively. In conclusion, the thermal properties of cassia were significantly affected by the variation in the moisture level. Also, the mechanical properties such as rupture force and rupture deformation demonstrated a prominent difference in their values along the three axes of the sample.
Subjects: Biophysics; Food Science & Technology; Processing
Keywords: cassia; specific heat; glass transition temperature; bulk thermal conductivity; rupture force
*Corresponding author: T.K. Goswami, Agricultural and Food Engineering Department, Indian Institute of Technology Kharagpur, Kharagpur 721302, India. E-mail: [email protected]
Reviewing editor:Fatih Yildiz, Middle East Technical University, Turkey
Additional information is available at the end of the article
ABOUT THE AUTHORT.K. Goswami is a renowned Professor of Food Engineering and Technology. He has more than 25 years of research experience. Dr Goswami has contributed nearly 100 research papers in esteemed national and international journals. Also, he has two books, four book chapters and five patents to his credit. He has been awarded as Fellow of various Indian research academy/association for his significant contribution in the research field: cryogenics grinding of spices, quick freezing technology, controlled and modified atmosphere storage of fruits and vegetables, and application of computational fluid dynamics along with computational particle mechanics technique in different food processing operations.
PUBLIC INTEREST STATEMENTIn this study, thermal properties of cassia (spice) were determined in the permissible moisture level, along with its breaking characteristics as a function of its orientation (length, width, and thickness). The results of this research would serve as input parameters in modeling and simulation of complex particle mechanics and heat transfer in the thermal/mechanical operations like grinding/cryogenic grinding, drying, freezing, cold storage, transportation, etc. Further, higher quality of end product and lower expenditure can be ensured by selecting required measured properties of cassia for precise designing/modeling of a machine or process.
Received: 14 June 2016Accepted: 17 August 2016First Published: 20 August 2016
© 2016 The Author(s). This open access article is distributed under a Creative Commons Attribution (CC-BY) 4.0 license.
Page 2 of 12
Page 3 of 12
Ghodki et al., Cogent Food & Agriculture (2016), 2: 1227110http://dx.doi.org/10.1080/23311932.2016.1227110
1. IntroductionSpices are one of the essential agricultural commodities that perform a crucial role in our present day life as a flavoring and preserving agent in foods, including pharmaceuticals and cosmetic ap-plications (Ghodki & Goswami, 2016a, 2016b, 2016c, 2016d). Cinnamon and cassia are the dried bark of evergreen trees belonging to genus Cinnamomum which has 250 species, and most of them are aromatic and flavoring. A classification system in these spices has evolved by the country of origin and climatic conditions in which they are grown because each type has distinctive flavoring charac-teristics. Hence, cinnamon and cassia have been separated into two distinct species in the past: Cinnamomum verum Presl L. as cinnamon; while, Cinnamomum cassia Presl L., Cinnamomum loureirii Nees L., Cinnamomum burmannii Blume L. are considered as cassia (Ghodki & Goswami, 2015; Tainter & Grenis, 2001). Ceylon Cinnamon or true cinnamon is the most common name of the cin-namon in Spice Industry which is indigenous to Sri Lanka; while cassia may be grown in Indonesia, China, Vietnam, and India (Peter, 2006).
Cassia (Cinnamomum loureirii Nees L.) belongs to the family of Lauraceae commonly known as Saigon or Vietnamese Cassia, native to Vietnam, and is one of the major economic species of Cinnamomum (Goswami & Ghodki, 2015; Peter, 2006). Vietnam’s annual export of cassia bark is about 2,000 to 3,000 tons, which is 8–10% of world trade (Iqbal, 1993). Further, Cassia is known for its higher volatile oil content and sweeter flavor (Ghodki & Goswami, 2016d).
The knowledge of mechanical and thermal properties is necessary for engineering as well as in the process design such as simulation and modeling of heat transfer in the freeze dryer, cold storage, grinders and cooling system for a cryogenic grinder. The heat generated in the conventional grinding technique is detrimental to the spice (cassia) powder quality (Ghodki & Goswami, 2015). Further, the thermo-mechanical properties of spices are preliminary requirements for thermal analysis of the mechanical processes involving heating or cooling. For example, the heat transfer modeling tech-niques like Discrete Element Modeling and Computational Fluid Dynamics requires the sample (spice) properties such as specific heat, thermal conductivity, stress, etc. as a set of input data to model the thermal transport phenomena of a mechanical process such as grinding. Further, the thermal analysis of the grinding operation would help in understating the heat generation mecha-nism in the process. Moreover, it is essential to know and interpret the thermal and mechanical properties of the biomaterials at various stages of the production, processing, and preservation. In agricultural materials, thermal properties are significantly influenced by the change in moisture (Mohsenin, 1980). Also, mechanical properties of cassia are vital in the design of size reduction op-eration such as grinding. Hence, the objectives of this study are: (1) To investigate the effect of moisture content on thermal properties of cassia; (2) To determine the influence of compression along the orthogonal axes of the sample on its breaking characteristics.
2. Materials and methods
2.1. Raw materialCassia bark (Cinnamomum loureirii Nees L.) was procured from Tien Thanx Trading and Production Co. Ltd., Hamo commune village, Dan Phuong district, Hanoi city, Vietnam. The cleaned cassia bark was broken into small pieces of length less than or equal to 50 mm for analysis of the thermal prop-erties and breaking characteristics (Ranganna, 1986).
2.2. Moisture contentMoisture content of the sample was measured by entrainment method as recommended in US ISO 939 (Klimánková et al., 2008). Moisture level range of 8–14% d.b. was selected (8, 10, 12, and 14% d.b.) each with a standard deviation of ± 0.1% d.b. to study the influence of moisture on thermal properties of cassia. A similar procedure was adopted to maintain and preserve the sample at differ-ent moisture levels as reported in the author’s previous study (Ghodki & Goswami, 2015). Proper care was taken to check the moisture content of the sample before determination of the properties
Page 4 of 12
Ghodki et al., Cogent Food & Agriculture (2016), 2: 1227110http://dx.doi.org/10.1080/23311932.2016.1227110
(Altuntaş & Yıldız, 2007; Singh & Goswami, 1996). Five replicates were taken for all the moisture levels, and average values are reported.
2.3. Specific heat and glass transition temperatureDifferential scanning calorimetry (DSC) (Model Pyris Diamond DSC, Perkin Elmer, USA) was used for the measurement of specific heat at −90 and 30°C along with glass transition temperature (Tg). The Diamond DSC was controlled by Pyris Software (Version: 8.0.0.0172, Perkin Elmer, USA) via a tem-perature control program. The specific heat and Tg of a sample were measured experimentally, after calibration the DSC with a thermally and chemically inert standard Indium (−156.90°C peak) of known mass and specific heat, according to the manufacturer’s specification to obtain an accuracy level of ±1%. About five cassia barks were selected randomly from each moisture levels for their thermal analysis. The DSC sample (cassia bark) was taken as small pieces of 1–1.2 mm length and weighed accurately (6–8 mg) in an open aluminium pan (30 μL) and placed in a DSC module with a reference pan (same empty aluminium pan). Both the pans were capped with an aluminium cap and sealed to restrict any changes during the experimentation process (heating/cooling). The tempera-ture range of DSC analysis was −160 to 65°C at a steady heating rate of 10°C min−1. Moreover, the DSC thermogram was observed as an output of the test. The ordinate of the thermogram represents the rate of heat evaluation/absorption while the abscissa of thermogram provides a measure of temperature or time. Further, the thermogram was analyzed for specific heat and Tg by the Pyris Software. The rate of heat flow in the sample was proportional to its specific heat and displacement of the sample run from the baseline was measured to determine the specific heat (Dodd, Tonge, & Currell, 1987). While Tg was determined as the midpoint of the temperature range at which changes in heat capacity thermogram occurs (Ibrahim, Zakaria, Sipaut, Sulaiman, & Hashim, 2011). Moreover, thermal parameters viz., Peak temperature (Tpeak), onset temperature (Tonset), endset tempera-ture (Tendset), and change in specific heat (ΔCp) were calculated for heating sweeps. The properties analyzed by DSC in the lower temperature regime would be helpful in the study of the operations such as cryogenic grinding, cryogenic freezing, freeze drying, etc.
2.4. Bulk thermal conductivityTransient-hot-wire method was used for determination of the bulk thermal conductivity of the cas-sia. “This approach involves a thin heating wire located at the interface between the sample and a reference of known thermal conductivity” (Sahin & Sumnu, 2006). The temperature of the thin heat-ing wire increased when the electric power was applied continuously to the wire which was stretched straight through a rectangular sample. A Quick Thermal Conductivity Meter (QTM-D3, Kyoto Electronics Manufacturing Co. Ltd., Japan) (Meghwal & Goswami, 2011) was used for determination of the bulk thermal conductivity of the samples at 30 ± 1°C with an accuracy of ±5% reading value per reference plate. The average values of five replicas at each moisture level are reported.
2.5. Bulk densityBulk density of the cassia at different moisture levels (8, 10, 12, and 14% d.b.) were determined using a circular container of volume 1.482 × 10⁻³ m3, which was filled with cassia sample to its full volume and was gently tapped with proper care to avoid compaction of cassia in the container. Bulk density was calculated as the ratio of the weight of the sample to the volume of the container (Ghodki & Goswami, 2016c). Five replicates were taken at all moisture contents, and the average values are reported.
2.6. Bulk thermal diffusivityBulk thermal diffusivity of cassia was computed using experimental values of bulk density, specific heat and bulk thermal conductivity using Equation (1) as reported by (Aviara, Haque, & Ogunjimi, 2008).
(1)�b =kb
�bcp
Page 5 of 12
Ghodki et al., Cogent Food & Agriculture (2016), 2: 1227110http://dx.doi.org/10.1080/23311932.2016.1227110
where αb is the bulk thermal diffusivity (m2 s−1); kb is the bulk thermal conductivity (W m−1 °C−1); Cp is the specific heat (J kg−1 °C−1); ρb is the bulk density (kg m−3).
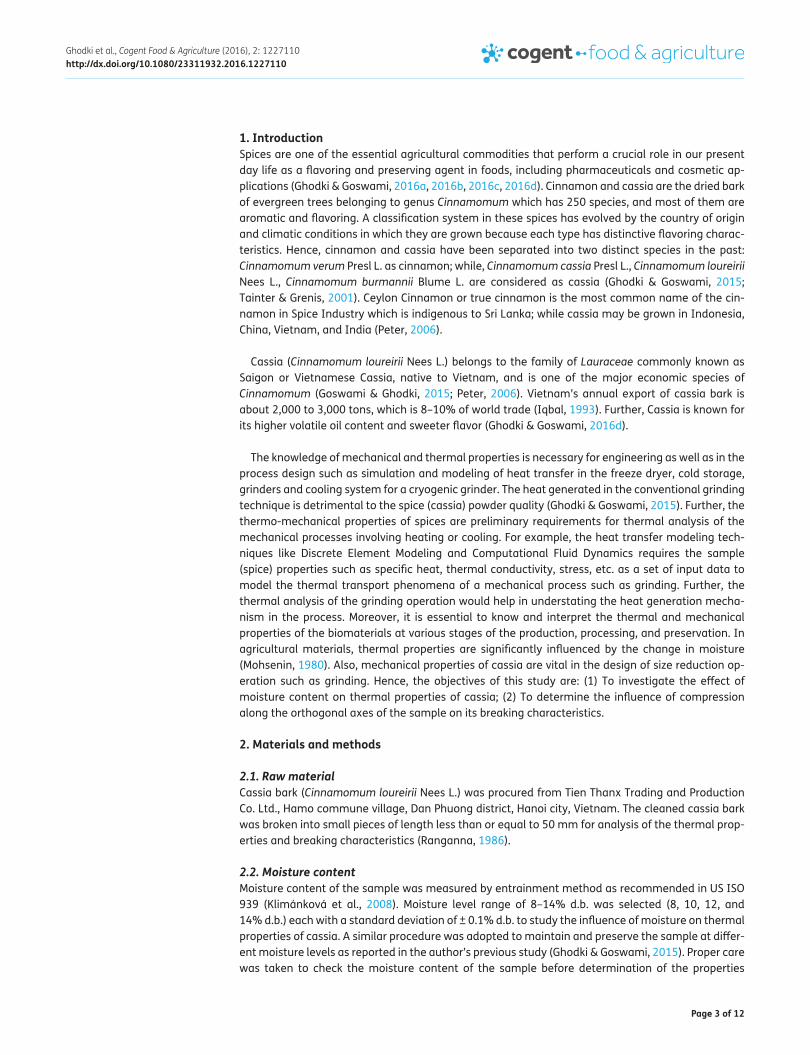
2.7. DimensionsThe average dimensions of cassia barks were determined at the initial moisture level of 11.10% d.b. along the three orthogonal axes of cassia using dial calipers (Mitutoyo Corporation, Japan) reading to an accuracy of ±0.02 mm. Twenty samples were randomly selected from the moisture resistant polyethene bag to determine principal dimensions, namely major (length, L), intermediate (width, B) and minor (thickness, T) axes, respectively, measured at three different points of the respective di-mensions, viz., two endpoints and a midpoint. After determining the dimensions, the same samples were tested to determine the mechanical properties.
2.8. Mechanical propertiesThe breaking characteristics viz., average rupture force (peak load) and average deformation (peak deformation) at rupture were investigated at three loading position at a moisture level of 11.10 ± 0.1% d.b. as shown in Figure 1. A Twin-column Universal Tester (UTM) (UTB9052, Dak system Inc., India) was used to perform the tests. The samples with minimal defects like cracks (observed by a magnifying glass) were taken for the analysis. Dak System Inc. Software was used to control the UTM as well as to analyze the results. Compression test was performed along three orthogonal axes of the sample by UTM equipped with a 4,905 N load cell (Cárcel et al., 2012) and a crosshead speed of 1 mm min−1 was kept constant throughout the test. A similar experimental procedure was fol-lowed as reported for determination of breaking characteristics of Shea kernel (Manuwa & Muhammad, 2011).
Figure 1. Representation of axial forces Fx, Fy and Fz acting along major, intermediate and minor axis respectively; the three axes and three perpendicular dimensions of cassia bark: X-axis, longitudinal axis (major axis, length, L); Y-axis, transverse axis containing the intermediate dimension (intermediate axis, width, W) at right angles to the longitudinal axis; Z-axis, transverse axis containing the minor dimension (minor axis, thickness, T).
Page 6 of 12
Ghodki et al., Cogent Food & Agriculture (2016), 2: 1227110http://dx.doi.org/10.1080/23311932.2016.1227110
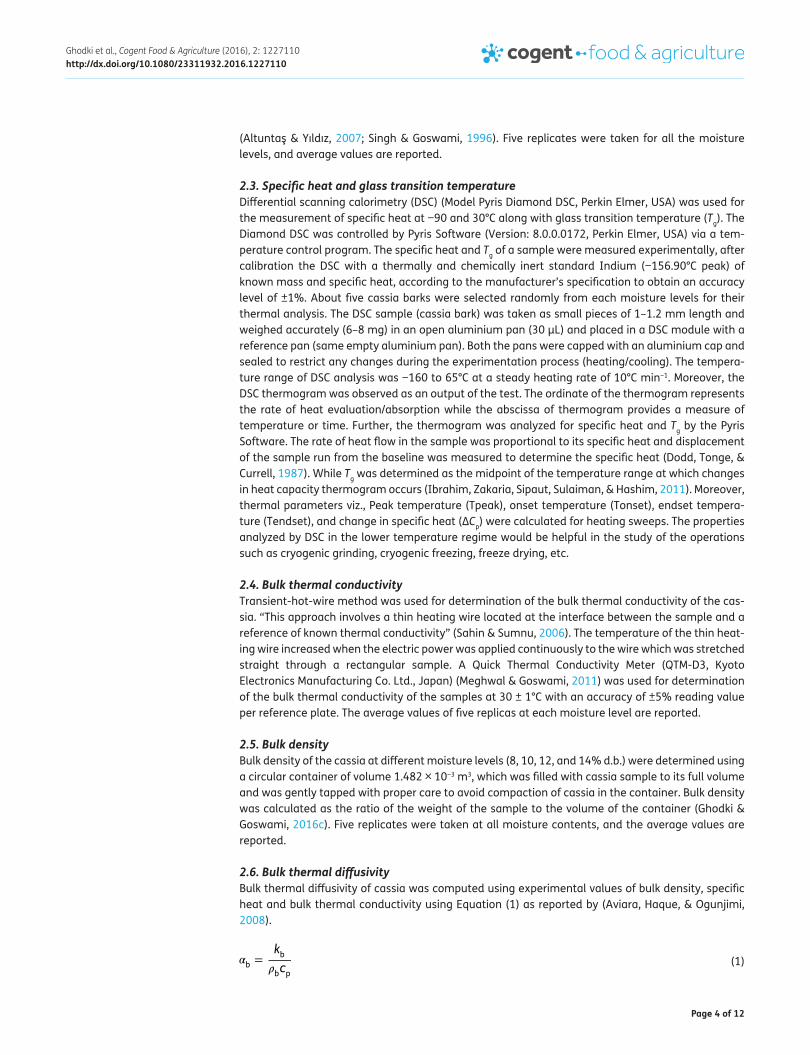
The output of the test was in the graphical form of the force-deformation (load-deformation) curve as shown in Figure 2 for a sample. Parameters like rupture force which corresponds to a bio-yield point in force-deformation curve and deformation at rupture were recorded and reported. The UTM also provides the actual values of rupture force and deformation via the analysis software. The measurement accuracy of UTM was ±0.0001 N for force and 0.0001 mm for deformation.
2.9. Statistical analysisThe results observed were subjected to analysis of variance and Duncan test to evaluate for statisti-cal significance of observed differences among treatment means using statistical software SPSS 20.0 (IBM Corporation, USA). Origin 2015 (OriginLab Corporation, USA) data analysis and graphing software was used for analysis of regression and plotting graphs. Statistical significance was ex-pressed at 95% (p ≤ 0.05) confidence interval.
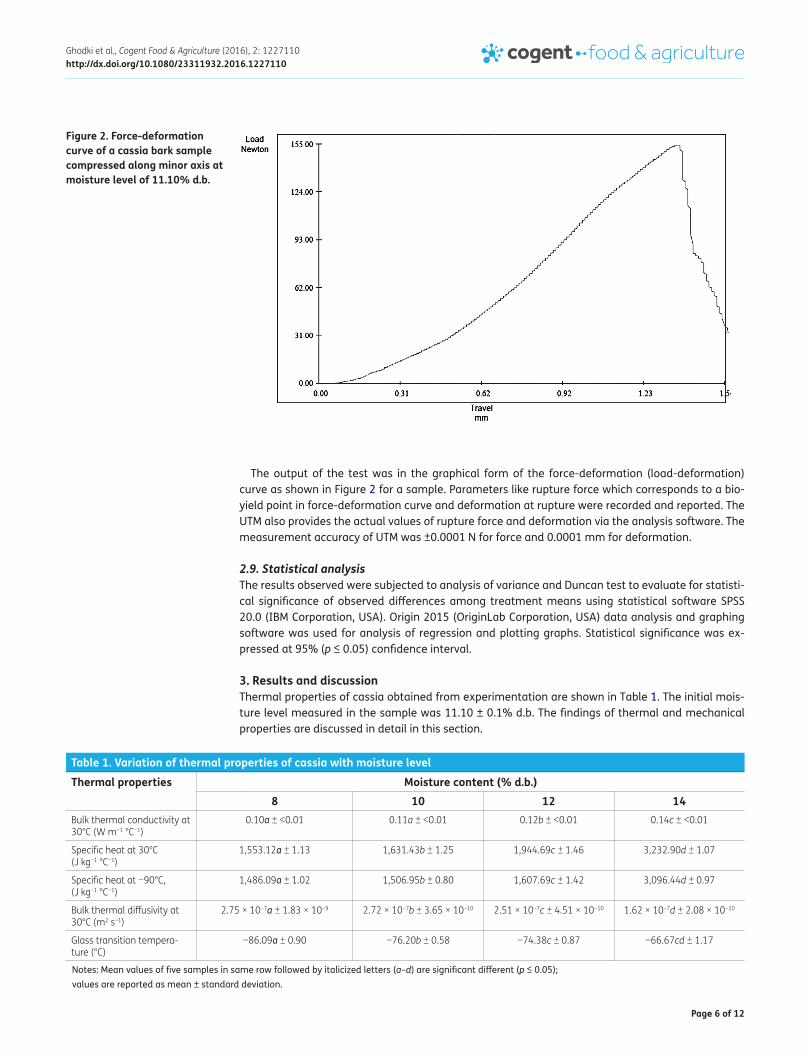
3. Results and discussionThermal properties of cassia obtained from experimentation are shown in Table 1. The initial mois-ture level measured in the sample was 11.10 ± 0.1% d.b. The findings of thermal and mechanical properties are discussed in detail in this section.
Figure 2. Force-deformation curve of a cassia bark sample compressed along minor axis at moisture level of 11.10% d.b.
Table 1. Variation of thermal properties of cassia with moisture level
Notes: Mean values of five samples in same row followed by italicized letters (a–d) are significant different (p ≤ 0.05); values are reported as mean ± standard deviation.
Thermal properties Moisture content (% d.b.)8 10 12 14
Bulk thermal conductivity at 30°C (W m−1 °C−1)
0.10a ± <0.01 0.11a ± <0.01 0.12b ± <0.01 0.14c ± <0.01
Specific heat at 30°C (J kg−1 °C−1)
1,553.12a ± 1.13 1,631.43b ± 1.25 1,944.69c ± 1.46 3,232.90d ± 1.07
Specific heat at −90°C, (J kg−1 °C−1)
1,486.09a ± 1.02 1,506.95b ± 0.80 1,607.69c ± 1.42 3,096.44d ± 0.97
Bulk thermal diffusivity at 30°C (m2 s−1)
2.75 × 10⁻⁷a ± 1.83 × 10⁻⁹ 2.72 × 10⁻⁷b ± 3.65 × 10⁻¹⁰ 2.51 × 10⁻⁷c ± 4.51 × 10⁻¹⁰ 1.62 × 10⁻⁷d ± 2.08 × 10⁻¹⁰
Glass transition tempera-ture (°C)
−86.09a ± 0.90 −76.20b ± 0.58 −74.38c ± 0.87 −66.67cd ± 1.17
Page 7 of 12
Ghodki et al., Cogent Food & Agriculture (2016), 2: 1227110http://dx.doi.org/10.1080/23311932.2016.1227110
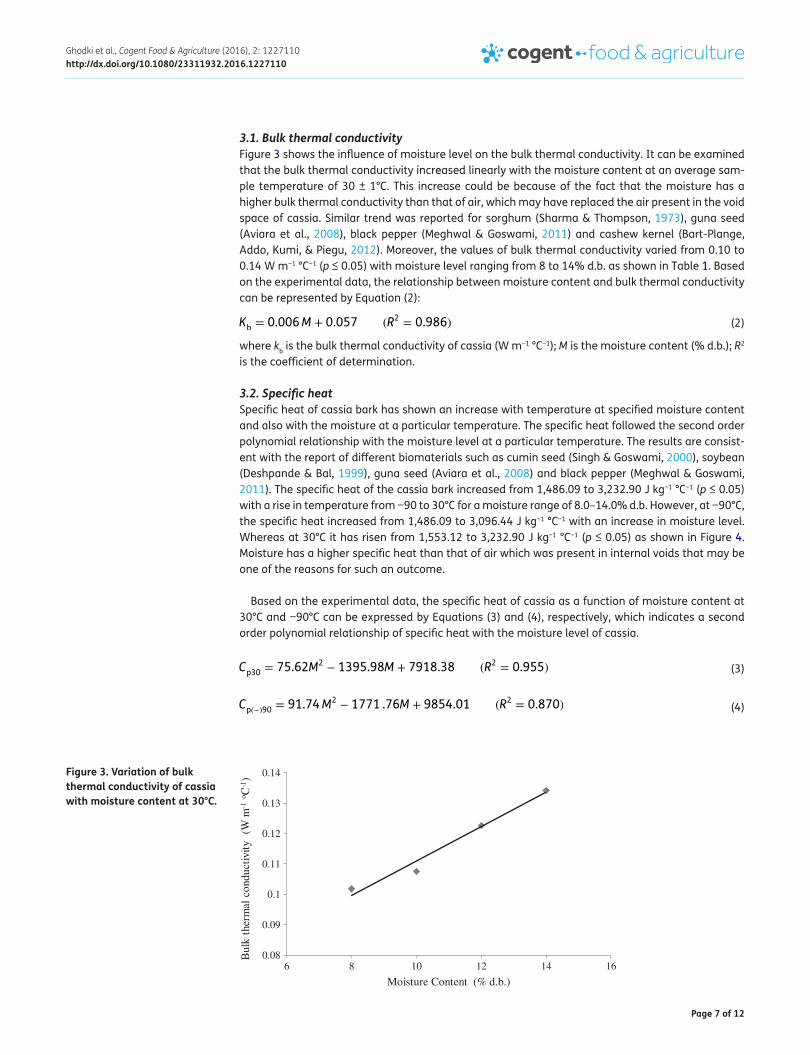
3.1. Bulk thermal conductivityFigure 3 shows the influence of moisture level on the bulk thermal conductivity. It can be examined that the bulk thermal conductivity increased linearly with the moisture content at an average sam-ple temperature of 30 ± 1°C. This increase could be because of the fact that the moisture has a higher bulk thermal conductivity than that of air, which may have replaced the air present in the void space of cassia. Similar trend was reported for sorghum (Sharma & Thompson, 1973), guna seed (Aviara et al., 2008), black pepper (Meghwal & Goswami, 2011) and cashew kernel (Bart-Plange, Addo, Kumi, & Piegu, 2012). Moreover, the values of bulk thermal conductivity varied from 0.10 to 0.14 W m−1 °C−1 (p ≤ 0.05) with moisture level ranging from 8 to 14% d.b. as shown in Table 1. Based on the experimental data, the relationship between moisture content and bulk thermal conductivity can be represented by Equation (2):
where kb is the bulk thermal conductivity of cassia (W m−1 °C−1); M is the moisture content (% d.b.); R2 is the coefficient of determination.
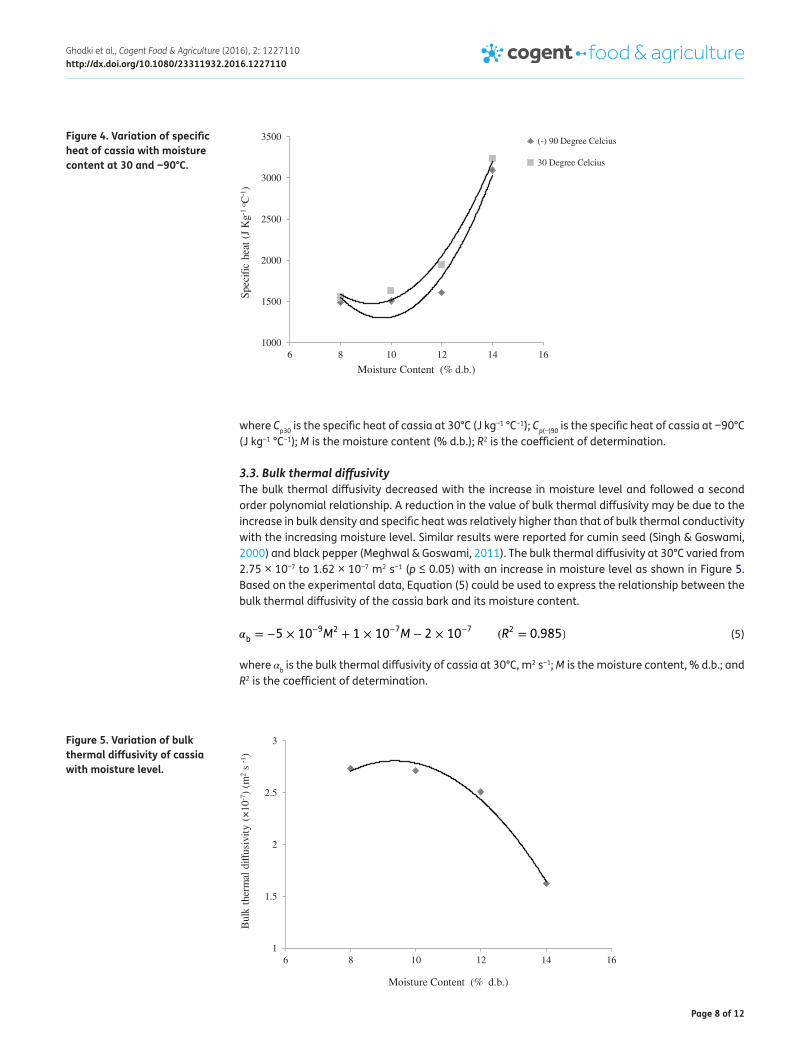
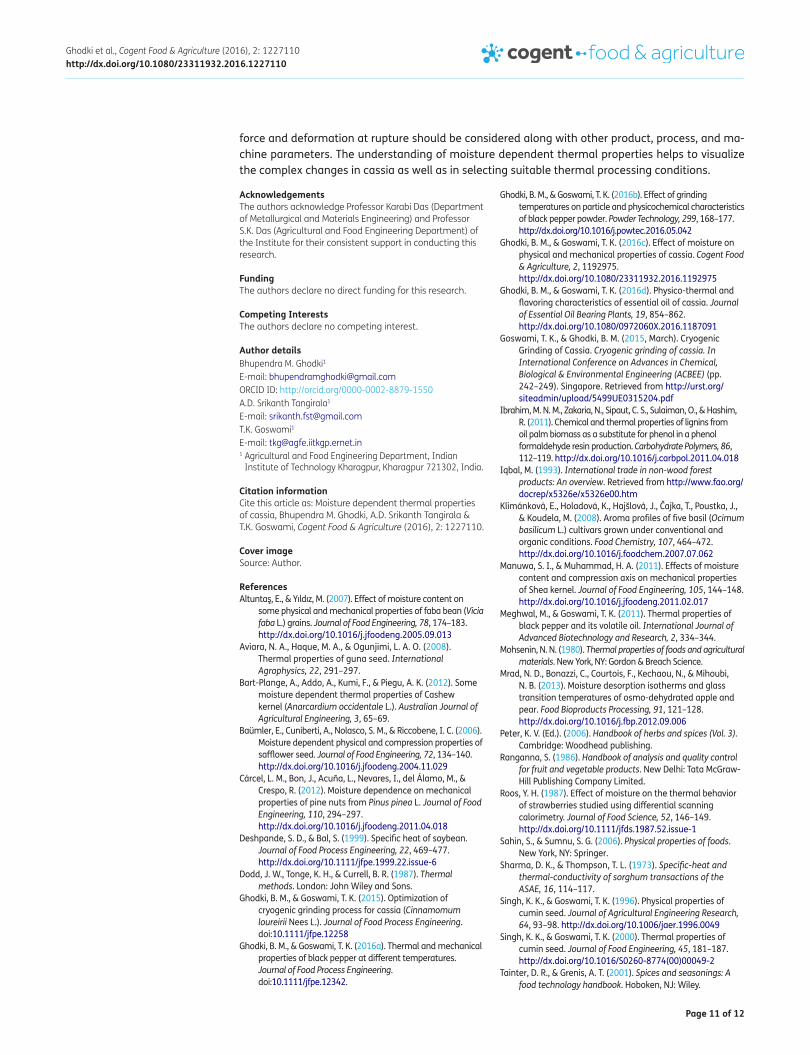
3.2. Specific heatSpecific heat of cassia bark has shown an increase with temperature at specified moisture content and also with the moisture at a particular temperature. The specific heat followed the second order polynomial relationship with the moisture level at a particular temperature. The results are consist-ent with the report of different biomaterials such as cumin seed (Singh & Goswami, 2000), soybean (Deshpande & Bal, 1999), guna seed (Aviara et al., 2008) and black pepper (Meghwal & Goswami, 2011). The specific heat of the cassia bark increased from 1,486.09 to 3,232.90 J kg−1 °C−1 (p ≤ 0.05) with a rise in temperature from −90 to 30°C for a moisture range of 8.0–14.0% d.b. However, at −90°C, the specific heat increased from 1,486.09 to 3,096.44 J kg−1 °C−1 with an increase in moisture level. Whereas at 30°C it has risen from 1,553.12 to 3,232.90 J kg−1 °C−1 (p ≤ 0.05) as shown in Figure 4. Moisture has a higher specific heat than that of air which was present in internal voids that may be one of the reasons for such an outcome.
Based on the experimental data, the specific heat of cassia as a function of moisture content at 30°C and −90°C can be expressed by Equations (3) and (4), respectively, which indicates a second order polynomial relationship of specific heat with the moisture level of cassia.
(2)Kb = 0.006M + 0.057 (R2= 0.986)
(3)Cp30 = 75.62M2− 1395.98M + 7918.38 (R
2= 0.955)
(4)Cp(−)90 = 91.74M2− 1771 .76M + 9854.01 (R
2= 0.870)
Figure 3. Variation of bulk thermal conductivity of cassia with moisture content at 30°C.
0.08
0.09
0.1
0.11
0.12
0.13
0.14
6 8 10 12 14 16
Bul
k th
erm
al c
ondu
ctiv
ity
(W m
-1o C
-1)
Moisture Content (% d.b.)
Page 8 of 12
Ghodki et al., Cogent Food & Agriculture (2016), 2: 1227110http://dx.doi.org/10.1080/23311932.2016.1227110
where Cp30 is the specific heat of cassia at 30°C (J kg−1 °C−1); Cp(−)90 is the specific heat of cassia at −90°C (J kg−1 °C−1); M is the moisture content (% d.b.); R2 is the coefficient of determination.
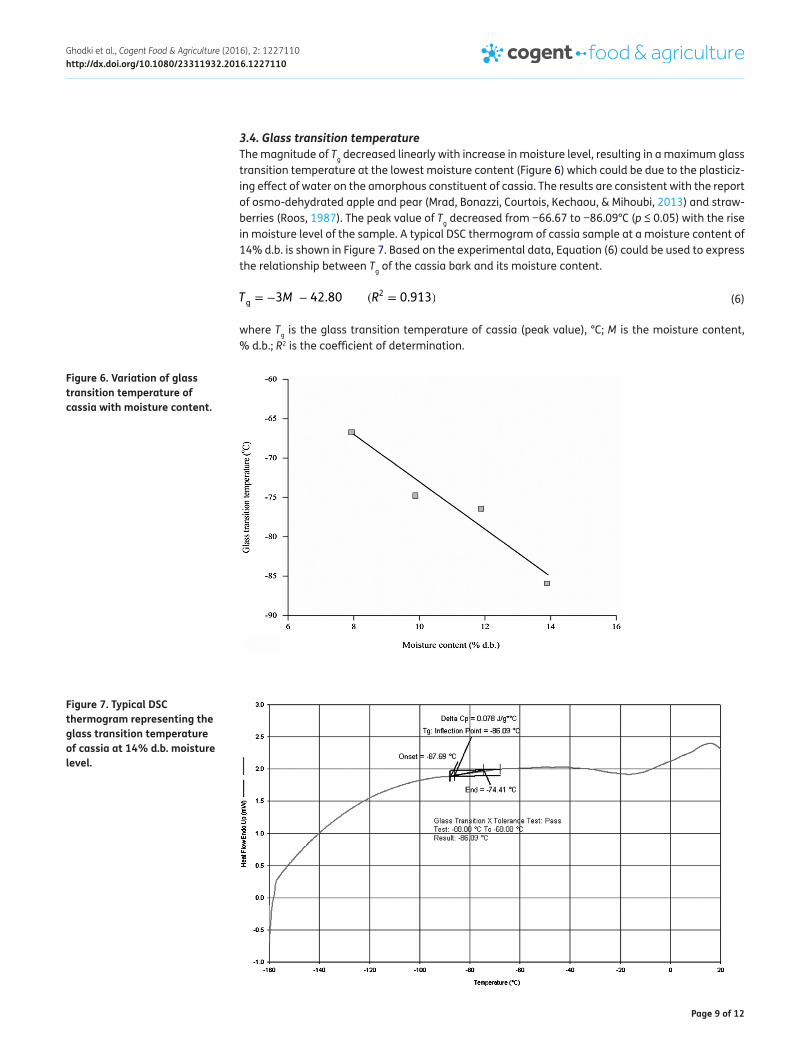
3.3. Bulk thermal diffusivityThe bulk thermal diffusivity decreased with the increase in moisture level and followed a second order polynomial relationship. A reduction in the value of bulk thermal diffusivity may be due to the increase in bulk density and specific heat was relatively higher than that of bulk thermal conductivity with the increasing moisture level. Similar results were reported for cumin seed (Singh & Goswami, 2000) and black pepper (Meghwal & Goswami, 2011). The bulk thermal diffusivity at 30°C varied from 2.75 × 10⁻⁷ to 1.62 × 10⁻⁷ m2 s−1 (p ≤ 0.05) with an increase in moisture level as shown in Figure 5. Based on the experimental data, Equation (5) could be used to express the relationship between the bulk thermal diffusivity of the cassia bark and its moisture content.
where αb is the bulk thermal diffusivity of cassia at 30°C, m2 s−1; M is the moisture content, % d.b.; and R2 is the coefficient of determination.
(5)�b = −5 × 10⁻⁹M2+ 1 × 10⁻⁷M − 2 × 10⁻⁷ (R
2= 0.985)
Figure 4. Variation of specific heat of cassia with moisture content at 30 and −90°C.
1000
1500
2000
2500
3000
3500
6 8 10 12 14 16
Spec
ific
hea
t (J
Kg-1
oC
-1)
Moisture Content (% d.b.)
(-) 90 Degree Celcius
30 Degree Celcius
Figure 5. Variation of bulk thermal diffusivity of cassia with moisture level.
1
1.5
2
2.5
3
6 8 10 12 14 16
Bul
k th
erm
al d
iffus
ivit
y (×
10-7
) (m
2s-1
)
Moisture Content (% d.b.)
Page 9 of 12
Ghodki et al., Cogent Food & Agriculture (2016), 2: 1227110http://dx.doi.org/10.1080/23311932.2016.1227110
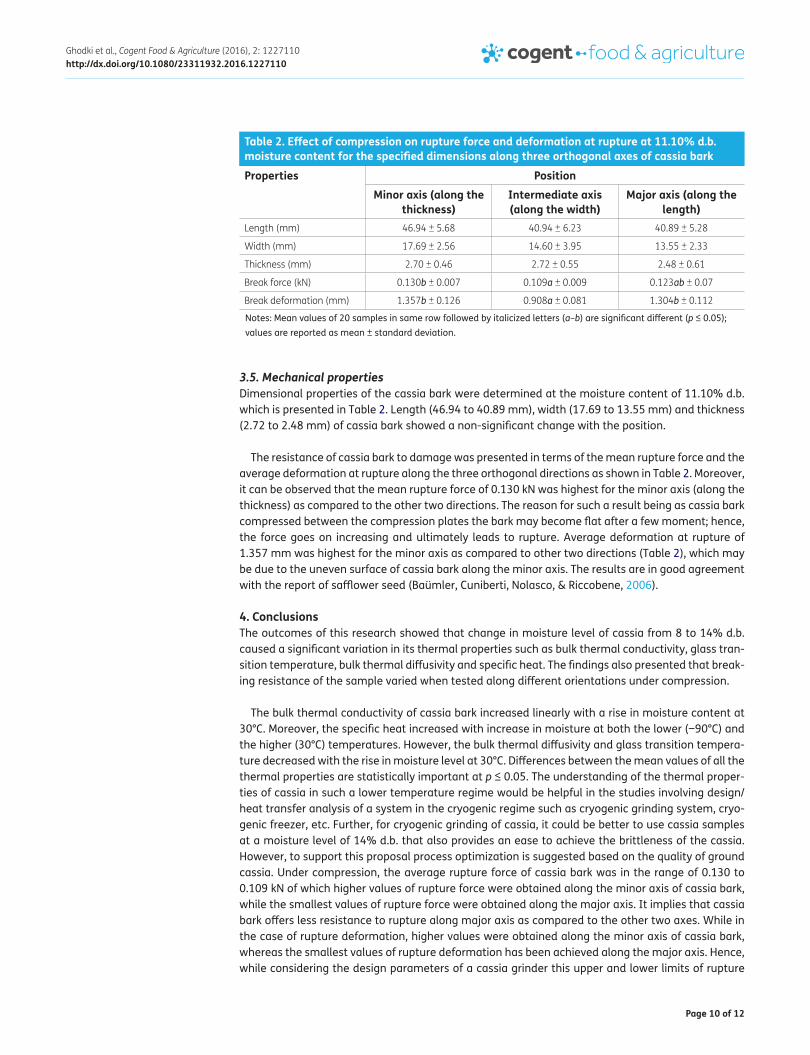
3.4. Glass transition temperatureThe magnitude of Tg decreased linearly with increase in moisture level, resulting in a maximum glass transition temperature at the lowest moisture content (Figure 6) which could be due to the plasticiz-ing effect of water on the amorphous constituent of cassia. The results are consistent with the report of osmo-dehydrated apple and pear (Mrad, Bonazzi, Courtois, Kechaou, & Mihoubi, 2013) and straw-berries (Roos, 1987). The peak value of Tg decreased from −66.67 to −86.09°C (p ≤ 0.05) with the rise in moisture level of the sample. A typical DSC thermogram of cassia sample at a moisture content of 14% d.b. is shown in Figure 7. Based on the experimental data, Equation (6) could be used to express the relationship between Tg of the cassia bark and its moisture content.
where Tg is the glass transition temperature of cassia (peak value), °C; M is the moisture content, % d.b.; R2 is the coefficient of determination.
(6)Tg = −3M − 42.80 (R2= 0.913)
Figure 6. Variation of glass transition temperature of cassia with moisture content.
Figure 7. Typical DSC thermogram representing the glass transition temperature of cassia at 14% d.b. moisture level.
Page 10 of 12
Ghodki et al., Cogent Food & Agriculture (2016), 2: 1227110http://dx.doi.org/10.1080/23311932.2016.1227110
3.5. Mechanical propertiesDimensional properties of the cassia bark were determined at the moisture content of 11.10% d.b. which is presented in Table 2. Length (46.94 to 40.89 mm), width (17.69 to 13.55 mm) and thickness (2.72 to 2.48 mm) of cassia bark showed a non-significant change with the position.
The resistance of cassia bark to damage was presented in terms of the mean rupture force and the average deformation at rupture along the three orthogonal directions as shown in Table 2. Moreover, it can be observed that the mean rupture force of 0.130 kN was highest for the minor axis (along the thickness) as compared to the other two directions. The reason for such a result being as cassia bark compressed between the compression plates the bark may become flat after a few moment; hence, the force goes on increasing and ultimately leads to rupture. Average deformation at rupture of 1.357 mm was highest for the minor axis as compared to other two directions (Table 2), which may be due to the uneven surface of cassia bark along the minor axis. The results are in good agreement with the report of safflower seed (Baümler, Cuniberti, Nolasco, & Riccobene, 2006).
4. ConclusionsThe outcomes of this research showed that change in moisture level of cassia from 8 to 14% d.b. caused a significant variation in its thermal properties such as bulk thermal conductivity, glass tran-sition temperature, bulk thermal diffusivity and specific heat. The findings also presented that break-ing resistance of the sample varied when tested along different orientations under compression.
The bulk thermal conductivity of cassia bark increased linearly with a rise in moisture content at 30°C. Moreover, the specific heat increased with increase in moisture at both the lower (−90°C) and the higher (30°C) temperatures. However, the bulk thermal diffusivity and glass transition tempera-ture decreased with the rise in moisture level at 30°C. Differences between the mean values of all the thermal properties are statistically important at p ≤ 0.05. The understanding of the thermal proper-ties of cassia in such a lower temperature regime would be helpful in the studies involving design/heat transfer analysis of a system in the cryogenic regime such as cryogenic grinding system, cryo-genic freezer, etc. Further, for cryogenic grinding of cassia, it could be better to use cassia samples at a moisture level of 14% d.b. that also provides an ease to achieve the brittleness of the cassia. However, to support this proposal process optimization is suggested based on the quality of ground cassia. Under compression, the average rupture force of cassia bark was in the range of 0.130 to 0.109 kN of which higher values of rupture force were obtained along the minor axis of cassia bark, while the smallest values of rupture force were obtained along the major axis. It implies that cassia bark offers less resistance to rupture along major axis as compared to the other two axes. While in the case of rupture deformation, higher values were obtained along the minor axis of cassia bark, whereas the smallest values of rupture deformation has been achieved along the major axis. Hence, while considering the design parameters of a cassia grinder this upper and lower limits of rupture
Table 2. Effect of compression on rupture force and deformation at rupture at 11.10% d.b. moisture content for the specified dimensions along three orthogonal axes of cassia bark
Notes: Mean values of 20 samples in same row followed by italicized letters (a–b) are significant different (p ≤ 0.05); values are reported as mean ± standard deviation.
Properties PositionMinor axis (along the
thickness)Intermediate axis (along the width)
Major axis (along the length)
Length (mm) 46.94 ± 5.68 40.94 ± 6.23 40.89 ± 5.28
Width (mm) 17.69 ± 2.56 14.60 ± 3.95 13.55 ± 2.33
Thickness (mm) 2.70 ± 0.46 2.72 ± 0.55 2.48 ± 0.61
Break force (kN) 0.130b ± 0.007 0.109a ± 0.009 0.123ab ± 0.07
Break deformation (mm) 1.357b ± 0.126 0.908a ± 0.081 1.304b ± 0.112
Page 11 of 12
Ghodki et al., Cogent Food & Agriculture (2016), 2: 1227110http://dx.doi.org/10.1080/23311932.2016.1227110
force and deformation at rupture should be considered along with other product, process, and ma-chine parameters. The understanding of moisture dependent thermal properties helps to visualize the complex changes in cassia as well as in selecting suitable thermal processing conditions.
AcknowledgementsThe authors acknowledge Professor Karabi Das (Department of Metallurgical and Materials Engineering) and Professor S.K. Das (Agricultural and Food Engineering Department) of the Institute for their consistent support in conducting this research.
FundingThe authors declare no direct funding for this research.
Competing InterestsThe authors declare no competing interest.
Author detailsBhupendra M. Ghodki1
E-mail: [email protected] ID: http://orcid.org/0000-0002-8879-1550A.D. Srikanth Tangirala1
E-mail: [email protected]. Goswami1
E-mail: [email protected] Agricultural and Food Engineering Department, Indian
Institute of Technology Kharagpur, Kharagpur 721302, India.
Citation informationCite this article as: Moisture dependent thermal properties of cassia, Bhupendra M. Ghodki, A.D. Srikanth Tangirala & T.K. Goswami, Cogent Food & Agriculture (2016), 2: 1227110.
Cover imageSource: Author.
ReferencesAltuntaş, E., & Yıldız, M. (2007). Effect of moisture content on
some physical and mechanical properties of faba bean (Vicia faba L.) grains. Journal of Food Engineering, 78, 174–183. http://dx.doi.org/10.1016/j.jfoodeng.2005.09.013
Aviara, N. A., Haque, M. A., & Ogunjimi, L. A. O. (2008). Thermal properties of guna seed. International Agrophysics, 22, 291–297.
Bart-Plange, A., Addo, A., Kumi, F., & Piegu, A. K. (2012). Some moisture dependent thermal properties of Cashew kernel (Anarcardium occidentale L.). Australian Journal of Agricultural Engineering, 3, 65–69.
Baümler, E., Cuniberti, A., Nolasco, S. M., & Riccobene, I. C. (2006). Moisture dependent physical and compression properties of safflower seed. Journal of Food Engineering, 72, 134–140. http://dx.doi.org/10.1016/j.jfoodeng.2004.11.029
Cárcel, L. M., Bon, J., Acuña, L., Nevares, I., del Álamo, M., & Crespo, R. (2012). Moisture dependence on mechanical properties of pine nuts from Pinus pinea L. Journal of Food Engineering, 110, 294–297. http://dx.doi.org/10.1016/j.jfoodeng.2011.04.018
Deshpande, S. D., & Bal, S. (1999). Specific heat of soybean. Journal of Food Process Engineering, 22, 469–477. http://dx.doi.org/10.1111/jfpe.1999.22.issue-6
Dodd, J. W., Tonge, K. H., & Currell, B. R. (1987). Thermal methods. London: John Wiley and Sons.
Ghodki, B. M., & Goswami, T. K. (2015). Optimization of cryogenic grinding process for cassia (Cinnamomum loureirii Nees L.). Journal of Food Process Engineering. doi:10.1111/jfpe.12258
Ghodki, B. M., & Goswami, T. K. (2016a). Thermal and mechanical properties of black pepper at different temperatures. Journal of Food Process Engineering. doi:10.1111/jfpe.12342.
Ghodki, B. M., & Goswami, T. K. (2016b). Effect of grinding temperatures on particle and physicochemical characteristics of black pepper powder. Powder Technology, 299, 168–177. http://dx.doi.org/10.1016/j.powtec.2016.05.042
Ghodki, B. M., & Goswami, T. K. (2016c). Effect of moisture on physical and mechanical properties of cassia. Cogent Food & Agriculture, 2, 1192975. http://dx.doi.org/10.1080/23311932.2016.1192975
Ghodki, B. M., & Goswami, T. K. (2016d). Physico-thermal and flavoring characteristics of essential oil of cassia. Journal of Essential Oil Bearing Plants, 19, 854–862. http://dx.doi.org/10.1080/0972060X.2016.1187091
Goswami, T. K., & Ghodki, B. M. (2015, March). Cryogenic Grinding of Cassia. Cryogenic grinding of cassia. In International Conference on Advances in Chemical, Biological & Environmental Engineering (ACBEE) (pp. 242–249). Singapore. Retrieved from http://urst.org/siteadmin/upload/5499UE0315204.pdf
Ibrahim, M. N. M., Zakaria, N., Sipaut, C. S., Sulaiman, O., & Hashim, R. (2011). Chemical and thermal properties of lignins from oil palm biomass as a substitute for phenol in a phenol formaldehyde resin production. Carbohydrate Polymers, 86, 112–119. http://dx.doi.org/10.1016/j.carbpol.2011.04.018
Iqbal, M. (1993). International trade in non-wood forest products: An overview. Retrieved from http://www.fao.org/docrep/x5326e/x5326e00.htm
Klimánková, E., Holadová, K., Hajšlová, J., Čajka, T., Poustka, J., & Koudela, M. (2008). Aroma profiles of five basil (Ocimum basilicum L.) cultivars grown under conventional and organic conditions. Food Chemistry, 107, 464–472. http://dx.doi.org/10.1016/j.foodchem.2007.07.062
Manuwa, S. I., & Muhammad, H. A. (2011). Effects of moisture content and compression axis on mechanical properties of Shea kernel. Journal of Food Engineering, 105, 144–148. http://dx.doi.org/10.1016/j.jfoodeng.2011.02.017
Meghwal, M., & Goswami, T. K. (2011). Thermal properties of black pepper and its volatile oil. International Journal of Advanced Biotechnology and Research, 2, 334–344.
Mohsenin, N. N. (1980). Thermal properties of foods and agricultural materials. New York, NY: Gordon & Breach Science.
Mrad, N. D., Bonazzi, C., Courtois, F., Kechaou, N., & Mihoubi, N. B. (2013). Moisture desorption isotherms and glass transition temperatures of osmo-dehydrated apple and pear. Food Bioproducts Processing, 91, 121–128. http://dx.doi.org/10.1016/j.fbp.2012.09.006
Peter, K. V. (Ed.). (2006). Handbook of herbs and spices (Vol. 3). Cambridge: Woodhead publishing.
Ranganna, S. (1986). Handbook of analysis and quality control for fruit and vegetable products. New Delhi: Tata McGraw-Hill Publishing Company Limited.
Roos, Y. H. (1987). Effect of moisture on the thermal behavior of strawberries studied using differential scanning calorimetry. Journal of Food Science, 52, 146–149. http://dx.doi.org/10.1111/jfds.1987.52.issue-1
Sahin, S., & Sumnu, S. G. (2006). Physical properties of foods. New York, NY: Springer.
Sharma, D. K., & Thompson, T. L. (1973). Specific-heat and thermal-conductivity of sorghum transactions of the ASAE, 16, 114–117.
Singh, K. K., & Goswami, T. K. (1996). Physical properties of cumin seed. Journal of Agricultural Engineering Research, 64, 93–98. http://dx.doi.org/10.1006/jaer.1996.0049
Singh, K. K., & Goswami, T. K. (2000). Thermal properties of cumin seed. Journal of Food Engineering, 45, 181–187. http://dx.doi.org/10.1016/S0260-8774(00)00049-2
Tainter, D. R., & Grenis, A. T. (2001). Spices and seasonings: A food technology handbook. Hoboken, NJ: Wiley.
Page 12 of 12
Ghodki et al., Cogent Food & Agriculture (2016), 2: 1227110http://dx.doi.org/10.1080/23311932.2016.1227110
© 2016 The Author(s). This open access article is distributed under a Creative Commons Attribution (CC-BY) 4.0 license.You are free to: Share — copy and redistribute the material in any medium or format Adapt — remix, transform, and build upon the material for any purpose, even commercially.The licensor cannot revoke these freedoms as long as you follow the license terms.
Under the following terms:Attribution — You must give appropriate credit, provide a link to the license, and indicate if changes were made. You may do so in any reasonable manner, but not in any way that suggests the licensor endorses you or your use. No additional restrictions You may not apply legal terms or technological measures that legally restrict others from doing anything the license permits.
Cogent Food & Agriculture (ISSN: 2331-1932) is published by Cogent OA, part of Taylor & Francis Group. Publishing with Cogent OA ensures:• Immediate, universal access to your article on publication• High visibility and discoverability via the Cogent OA website as well as Taylor & Francis Online• Download and citation statistics for your article• Rapid online publication• Input from, and dialog with, expert editors and editorial boards• Retention of full copyright of your article• Guaranteed legacy preservation of your article• Discounts and waivers for authors in developing regionsSubmit your manuscript to a Cogent OA journal at www.CogentOA.com