Embed Size (px)
Citation preview
MOISST Flux Tower, PhenoCam, and MODIS VIs
Jeffrey B. Basara
Pradeep Wagle
Rajen Bajgain &
Xiangming Xiao
University of Oklahoma, Norman, OK
June 5, 2014
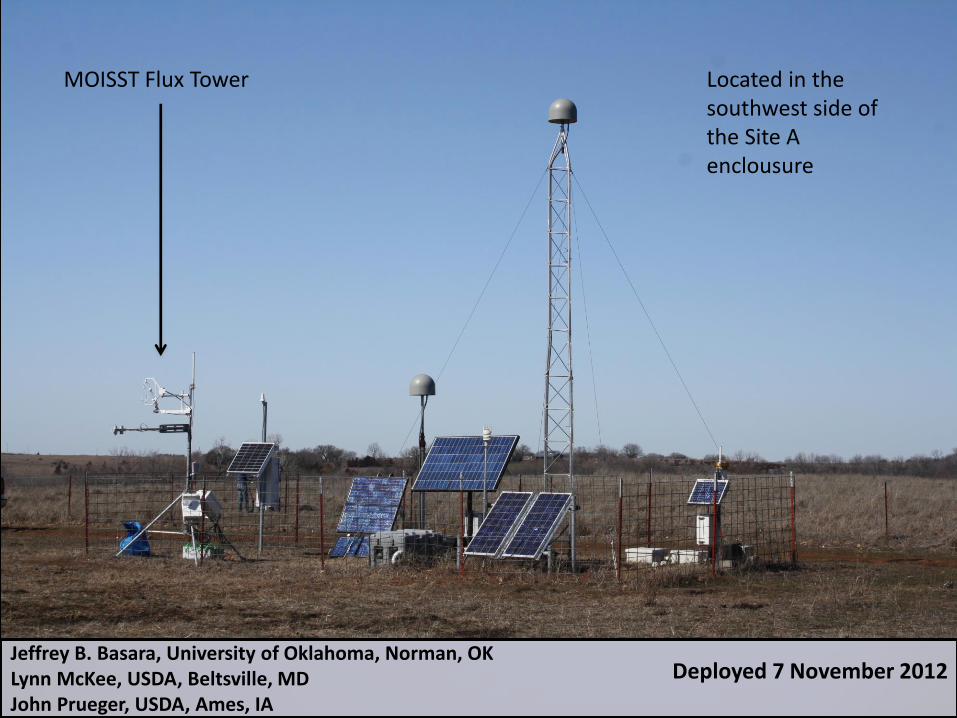
MOISST Flux Tower Located in the southwest side of the Site A enclousure
Deployed 7 November 2012 Jeffrey B. Basara, University of Oklahoma, Norman, OK Lynn McKee, USDA, Beltsville, MD John Prueger, USDA, Ames, IA
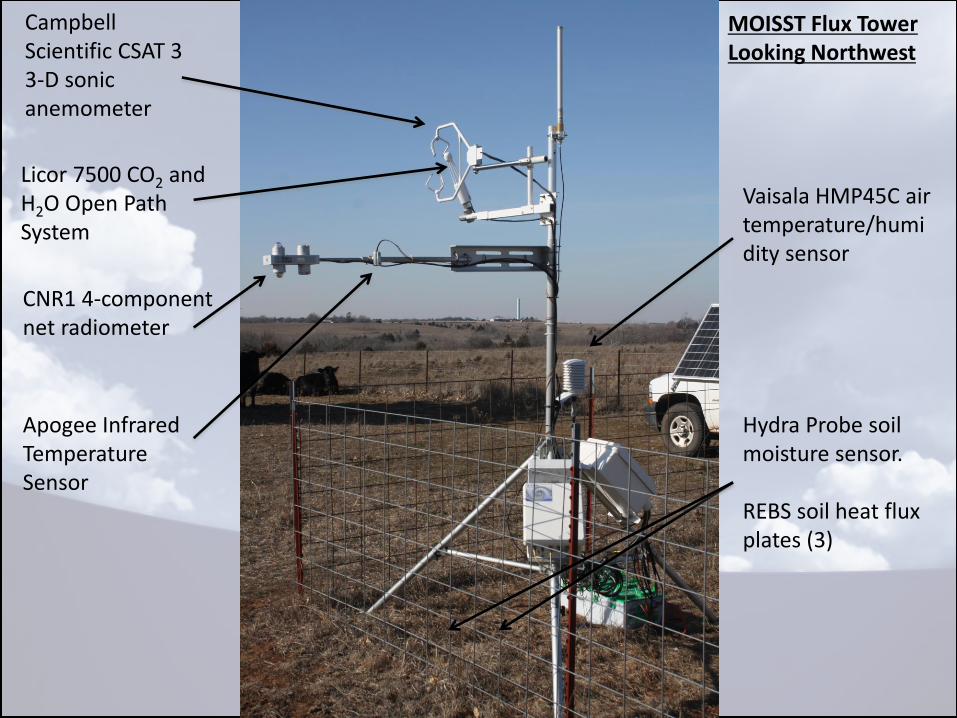
Campbell Scientific CSAT 3 3-D sonic anemometer
CNR1 4-component net radiometer
Licor 7500 CO2 and H2O Open Path System
Vaisala HMP45C air temperature/humidity sensor
Hydra Probe soil moisture sensor. REBS soil heat flux plates (3)
Apogee Infrared Temperature Sensor
MOISST Flux Tower Looking Northwest
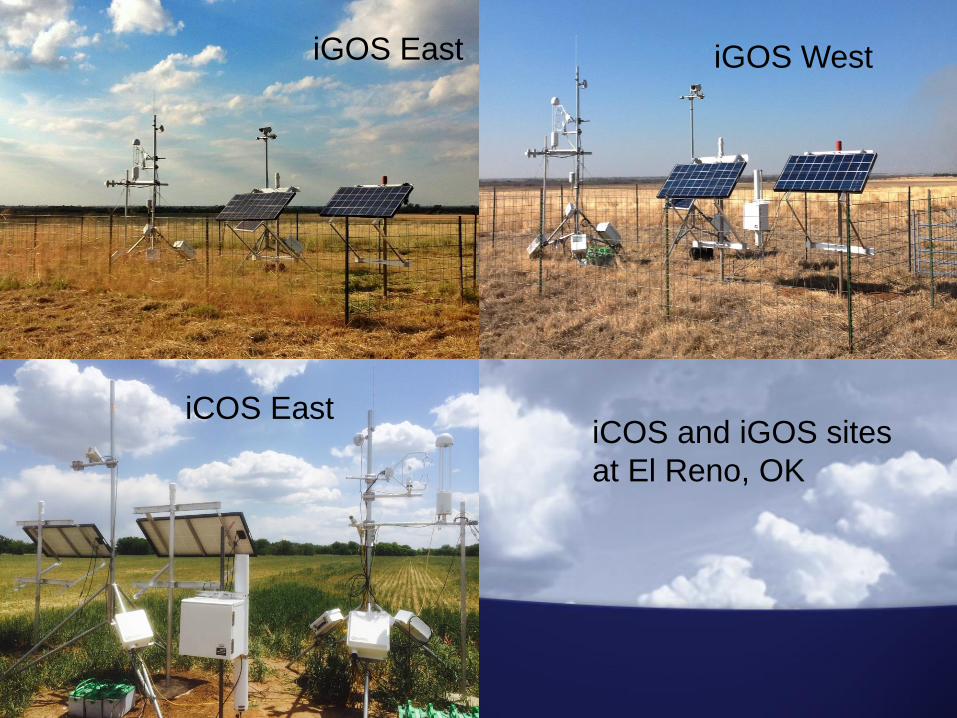
iGOS East iGOS West
iCOS East iCOS and iGOS sites
at El Reno, OK
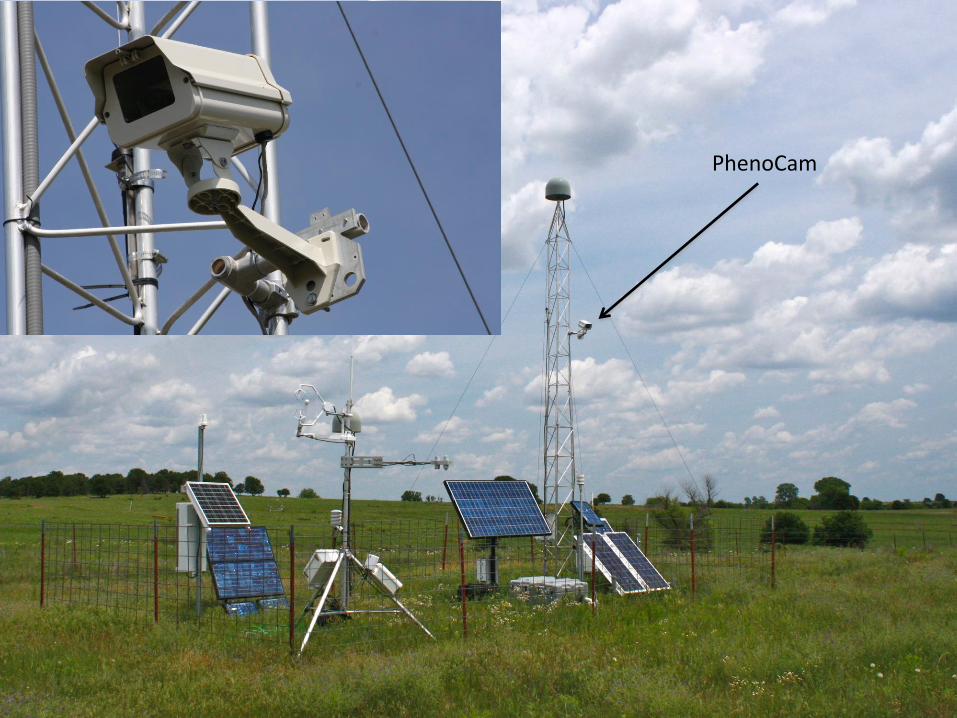
PhenoCam
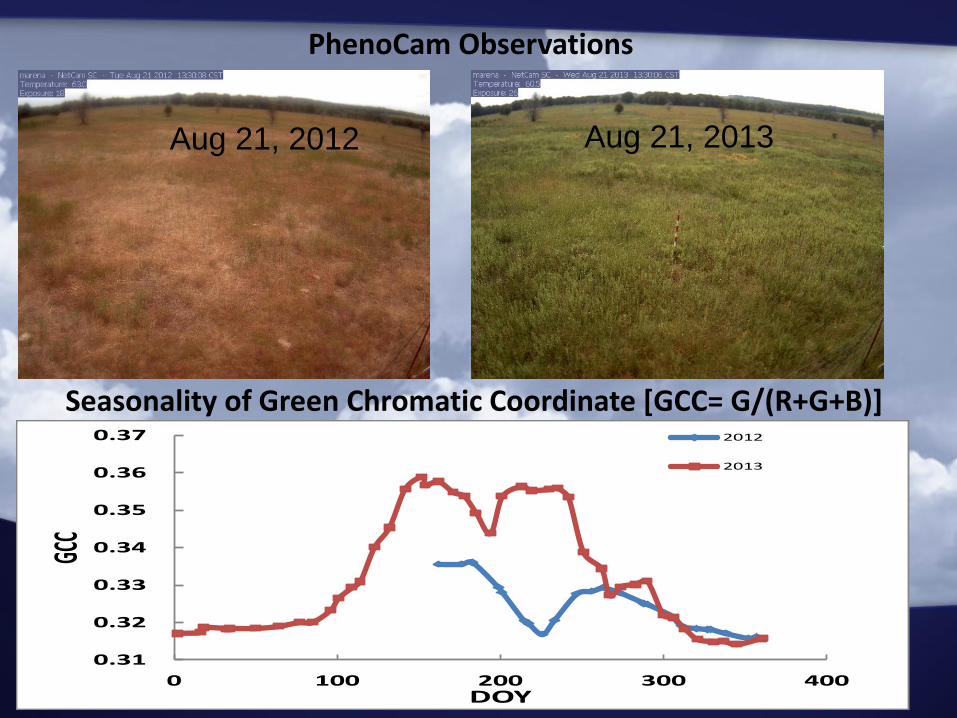
PhenoCam Observations
0.31
0.32
0.33
0.34
0.35
0.36
0.37
0 100 200 300 400
GCC
DOY
2012
2013
Seasonality of Green Chromatic Coordinate [GCC= G/(R+G+B)]
Aug 21, 2012 Aug 21, 2013
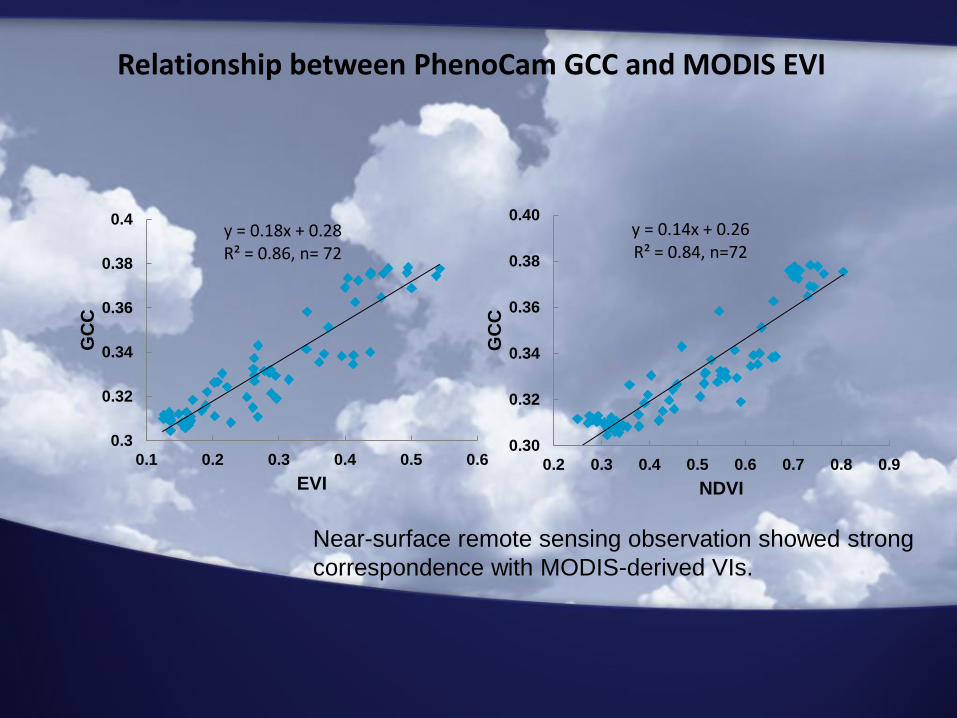
Relationship between PhenoCam GCC and MODIS EVI
y = 0.14x + 0.26 R² = 0.84, n=72
0.30
0.32
0.34
0.36
0.38
0.40
0.2 0.3 0.4 0.5 0.6 0.7 0.8 0.9
GC
C
NDVI
y = 0.18x + 0.28 R² = 0.86, n= 72
0.3
0.32
0.34
0.36
0.38
0.4
0.1 0.2 0.3 0.4 0.5 0.6
GC
C
EVI
Near-surface remote sensing observation showed strong
correspondence with MODIS-derived VIs.
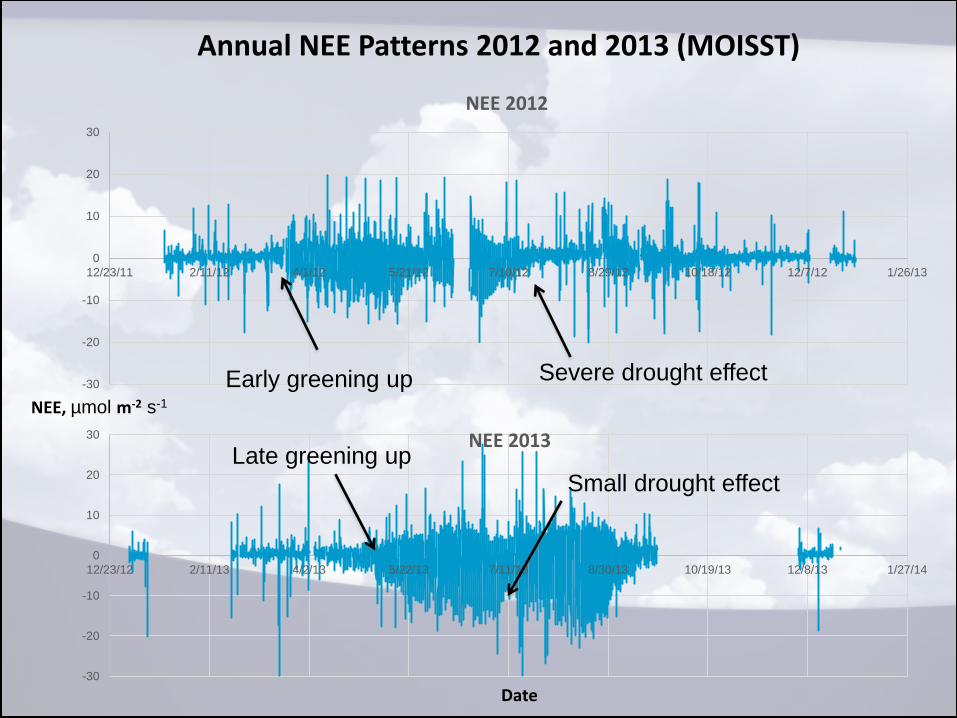
Annual NEE Patterns 2012 and 2013 (MOISST)
Date
NEE, µmol m-2 s-1
-30
-20
-10
0
10
20
30
12/23/11 2/11/12 4/1/12 5/21/12 7/10/12 8/29/12 10/18/12 12/7/12 1/26/13
NEE 2012
-30
-20
-10
0
10
20
30
12/23/12 2/11/13 4/2/13 5/22/13 7/11/13 8/30/13 10/19/13 12/8/13 1/27/14
NEE 2013
Early greening up
Late greening up
Severe drought effect
Small drought effect
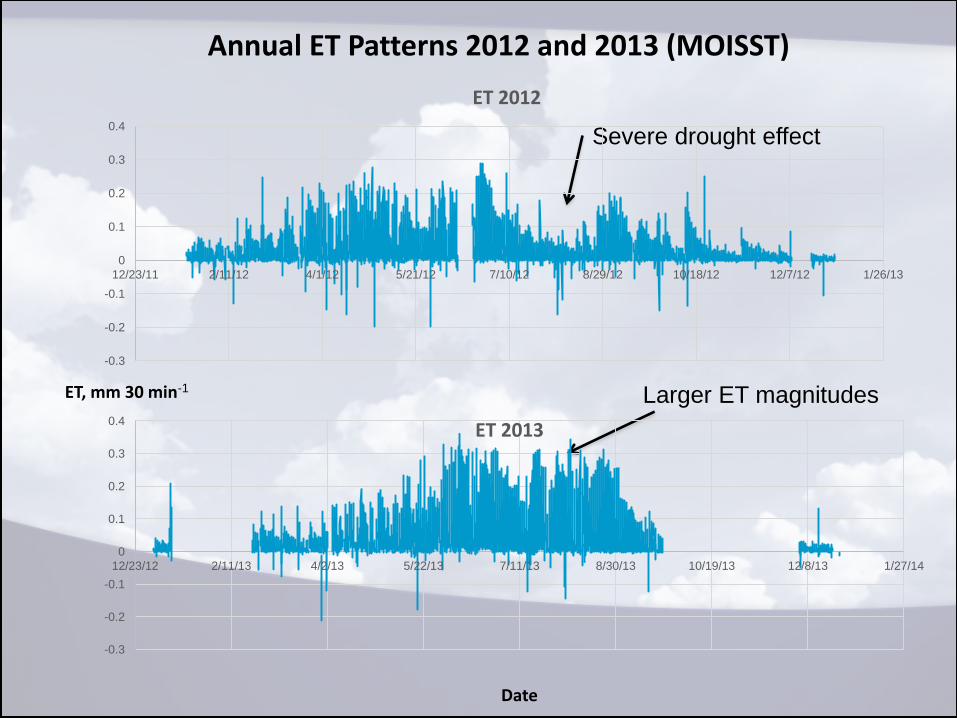
Annual ET Patterns 2012 and 2013 (MOISST)
Date
ET, mm 30 min-1 Larger ET magnitudes
Severe drought effect
-0.3
-0.2
-0.1
0
0.1
0.2
0.3
0.4
12/23/11 2/11/12 4/1/12 5/21/12 7/10/12 8/29/12 10/18/12 12/7/12 1/26/13
ET 2012
-0.3
-0.2
-0.1
0
0.1
0.2
0.3
0.4
12/23/12 2/11/13 4/2/13 5/22/13 7/11/13 8/30/13 10/19/13 12/8/13 1/27/14
ET 2013
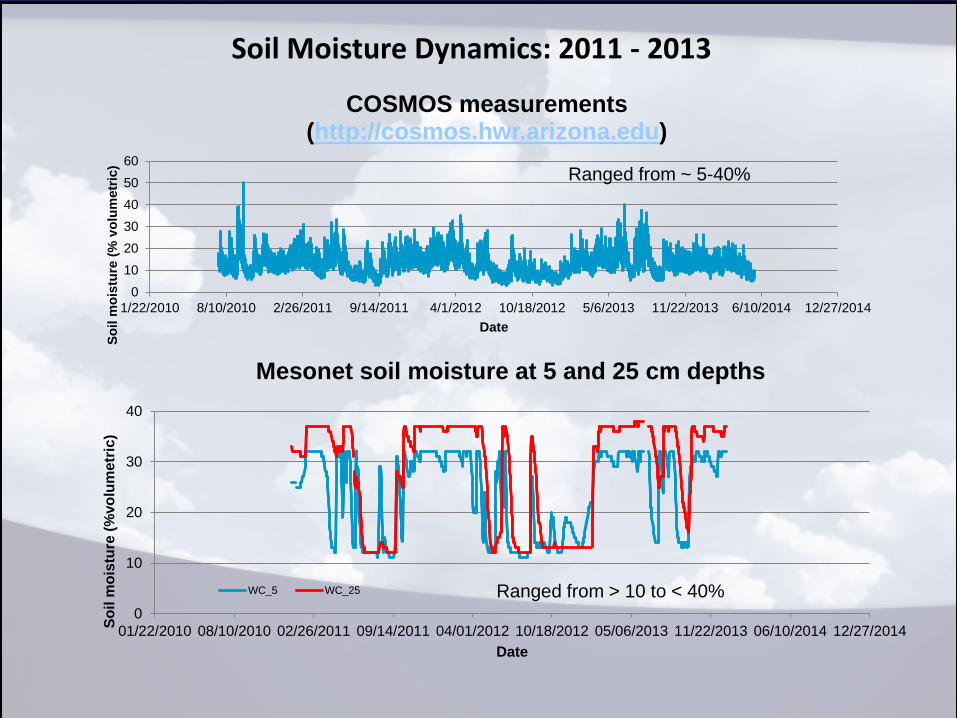
Soil Moisture Dynamics: 2011 - 2013
0
10
20
30
40
50
60
1/22/2010 8/10/2010 2/26/2011 9/14/2011 4/1/2012 10/18/2012 5/6/2013 11/22/2013 6/10/2014 12/27/2014
So
il m
ois
ture
(%
vo
lum
etr
ic)
Date
COSMOS measurements (http://cosmos.hwr.arizona.edu)
Mesonet soil moisture at 5 and 25 cm depths
0
10
20
30
40
01/22/2010 08/10/2010 02/26/2011 09/14/2011 04/01/2012 10/18/2012 05/06/2013 11/22/2013 06/10/2014 12/27/2014
So
il m
ois
ture
(%
vo
lum
etr
ic)
Date
WC_5 WC_25
Ranged from ~ 5-40%
Ranged from > 10 to < 40%
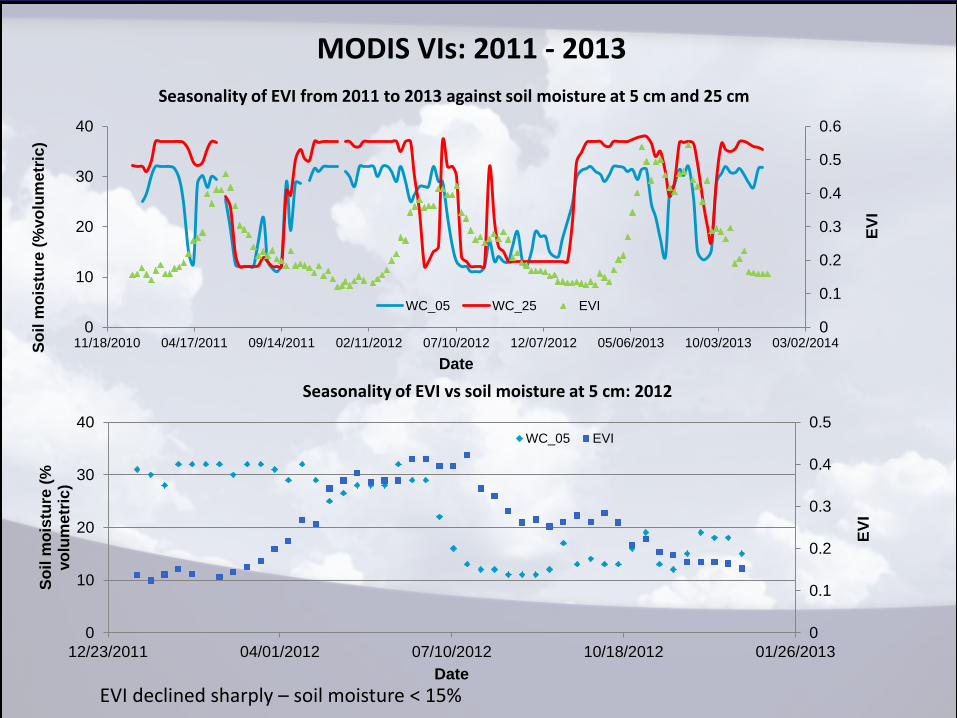
MODIS VIs: 2011 - 2013
Seasonality of EVI from 2011 to 2013 against soil moisture at 5 cm and 25 cm
0
0.1
0.2
0.3
0.4
0.5
0.6
0
10
20
30
40
11/18/2010 04/17/2011 09/14/2011 02/11/2012 07/10/2012 12/07/2012 05/06/2013 10/03/2013 03/02/2014
EV
I
So
il m
ois
ture
(%
vo
lum
etr
ic)
Date
WC_05 WC_25 EVI
Seasonality of EVI vs soil moisture at 5 cm: 2012
0
0.1
0.2
0.3
0.4
0.5
0
10
20
30
40
12/23/2011 04/01/2012 07/10/2012 10/18/2012 01/26/2013
EV
I
So
il m
ois
ture
(%
vo
lum
etr
ic)
Date
WC_05 EVI
EVI declined sharply – soil moisture < 15%
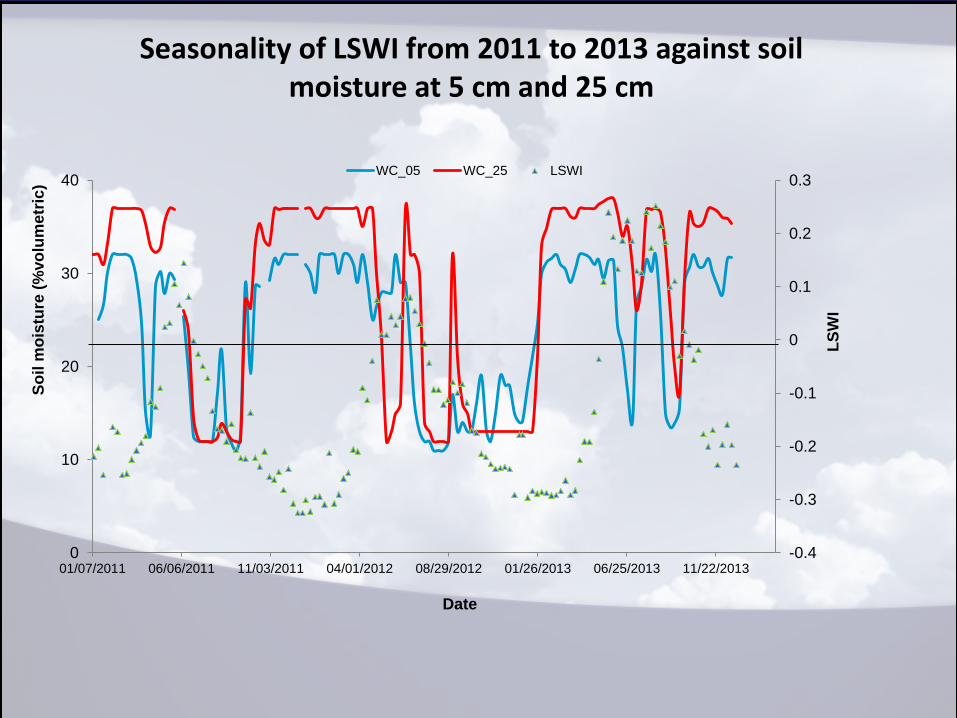
Seasonality of LSWI from 2011 to 2013 against soil moisture at 5 cm and 25 cm
-0.4
-0.3
-0.2
-0.1
0
0.1
0.2
0.3
0
10
20
30
40
01/07/2011 06/06/2011 11/03/2011 04/01/2012 08/29/2012 01/26/2013 06/25/2013 11/22/2013
LS
WI
So
il m
ois
ture
(%
vo
lum
etr
ic)
Date
WC_05 WC_25 LSWI
Future Work
1) Hiring a GRA to specifically work on flux tower data at MOISST
(research and requests) and similar sites.
2) Similar flux towers (and a COSMOS system) are also being
deployed at the Grazinglands Research Laboratory near El
Reno, OK.
3) Expand work related to the Mesonet Evapotranspiration Model
(MEMo) using MOISST Flux data.
4) Expand work on the 2012 flash drought analysis and compare it
with 2013 flash recovery observations.
5) Integrate/link the flux tower data with the other existing datasets
and collaborative projects.

Questions?