Embed Size (px)
Citation preview
REDUCING HARMONIC VOLTAGE AT INDUSTRIAL AREA DISTRIBUTION NETWORK
USING NETWORK CONFIGURATION MANAGEMENT
MOHD SHAHED BIN LATIF
UNIVERSITI SAINS MALAYSIA
2008
REDUCING HARMONIC VOLTAGE AT INDUSTRIAL AREA DISTRIBUTION NETWORK USING NETWORK CONFIGURATION
MANAGEMENT
by
MOHD SHAHED BIN LATIF
Thesis submitted in fulfillment of the requirements for the degree of
MSc. (Electrical & Electronic Engineering)
March 2008
ii
ACKNOWLEDGEMENTS
This research could not been completed and this thesis cannot be written
without the scholarship and resources provided by Tenaga Nasional Berhad.
Thanks to my supervisor, Dr. Ir. Syafruddin Masri, for the guidance and
encouragement during my study process. Also thanks to my colleagues at
Gelugor Power Station, Penang who always support and encourage me and,
the staff at Regional Control Centre, Bayan Lepas who provided me all the
information required for my research. And finally, thanks to my family, especially
my departed wife who offered moral support and endured this long process with
me.
iii
TABLE OF CONTENTS
PAGE ACKNOWLEDGEMENTS ii
TABLE OF CONTENTS iii
LIST OF TABLES vi
LIST OF FIGURES viii
LIST OF ABBREVIATION x
ABSTRAK xi
ABSTRACT xii
CHAPTER ONE : INTRODUCTION
1.1 Overview on Harmonic 1
1.2 Standards on Harmonic 3
1.3 Harmonic Mitigation 4
1.4 Time-Varying Harmonic 5
1.5 Industrial Area 6
1.6 Factors Contributing to Harmonic Fluctuation 7
1.7 Evaluating Harmonic Characteristic 8
1.8 Objective and Scope of Research 8
1.9 Methodology 9
1.10 Contribution of This Study 10
1.11 Overview of Thesis 11
CHAPTER TWO : LITERATURE SURVEY
2.1 Background 12
2.2 Basic on Harmonics 12
2.3 Harmonic Characteristic of Industrial Area 16
2.4 Harmonic Standards 19
2.5 Time Varying Harmonic 22
2.6 Harmonic Mitigation and Economic Consideration 24
iv
2.7 Identifying Harmonic Source 26
CHAPTER THREE : SIMULATION AND ANALYSIS
3.1 Effect of Consumer Load Fluctuation Size 30
3.2 Effect of Consumer Location 31
3.3 Effect of Different Network Configuration 33
3.4 Effect of Network Total Load 33
3.5 Voltage Total Harmonic Distortion Calculation 34
3.6 Baseline for Comparison 36
3.7 Evaluating Probabilistic Aspect of Harmonic Voltage 38
3.8 Simulation on Effect of Consumer Load Fluctuation Size 40
3.9 Simulation on Effect of Consumer Location in Network Branch
41
3.10 Simulation on Effect of Different Network Configuration 42
3.11 Simulation on Effect of Adding New Load 42
CHAPTER FOUR : TEST NETWORK, MODELING AND
PARAMETERS
4.1 Industrial Area Distribution Network 43
4.2 Component Rated Values and Impedance Modeling 45
4.2.1 Transmission System 45
4.2.2 Transformer 47
4.2.3 Cables
48
4.2.4 Consumer Loads 50
4.2.5 Harmonic Source 51
4.3 Probability of Network Loading 52
4.4 Simulation Software 53
CHAPTER FIVE : SIMULATION RESULTS AND DISCUSSION
5.1 Rated Voltage Total Harmonic Distortion 58
5.2 Simulation I Results And Analysis 59
5.3 Simulation II Results And Analysis 62
v
5.4 Analysis of Distance of Disturbance on THDv Variation 63
5.5 Results and Analysis for Configuration B and C 65
5.6 Analysis for Different Branch Loading 69
5.7 Result of Adding New Linear Load 70
5.8 Discussions 71
CHAPTER SIX : CONCLUSIONS AND RECOMMENDATION
6.1 Conclusions 75
6.2 Recommendation for Future Study 77
REFERENCES
78
APPENDICES Appendix A - Table of Random Load Level Appendix B - Results for Effect of Load Variability in Configuration A Appendix C - Results for Effect of Load Variability in Configuration A
at 2/3 Current Harmonic
Appendix D - Results for Effect of Load Variability in Configuration A at 1/3 Current Harmonic
Appendix E - Load Variability Results for Configurations A, B and C Appendix F - Difference in Network Branch Load and Difference In
THDv Between Configuration B and C
vi
LIST OF TABLES
PAGE
2.1 Harmonic Phase Sequence
15
2.2 Basis for harmonic current limits based on IEEE 519-1992
20
2.3 Current distortion limit for general distribution systems (120V through 69000V)
20
2.4 Voltage Distortion Limits
21
3.1 Load Variability Level
39
4.1 System Base Value
45
4.2 Transmission System Parameter
46
4.3 Cables Data
48
4.4 Consumer Plant Rated Load and Power Factor
50
4.5 Harmonic Current Spectrum
52
4.6 Probability of Network Loading
53
5.1 Configuration A – Average THDv for Range of Network Load Demand
60
5.2 Configuration A - Probability and Cumulative Probability of Ranged THDv
60
5.3 Variation of THDv Result for Total Tripping Of Each Consumer Load
62
5.4 THDv Variability Result for Total Tripping of Each Consumer Based on Consumer Distance to PCC
64
5.5 Configuration B - Average THDv for Range of Network Load Demand
66
5.6 Configuration B - Probability and Cumulative Probability of Ranged THDv
67
5.7 Configuration C - Average THDv for Range of Network Load Demand
67
vii
5.8 Configuration C - Probability and Cumulative Probability of Ranged THDv
67
5.9 THDv at PCC as a Result of Adding New Load
70
viii
LIST OF FIGURES
PAGE
1.1 Methodology flow chart
10
2.1 Harmonic Current and Voltage Distortion
13
2.2 A 33KV Industrial Area Distribution Network
17
2.3 Balanced harmonic characteristic at industrial area network
18
2.4 Minimal levels of triplen and even current harmonic
18
2.5 Typical distribution network of an industrial area
19
2.6 Harmonic voltage fluctuation at an industrial area incoming feeder
22
3.1 Factors affecting harmonic voltage fluctuation and factors within utility’s control
29
3.2 Effect of consumer distance from PCC
32
3.3 Process flowcharts for calculating total harmonic voltage distortion (THDv) at PCC
35
3.4 A 33KV Test distribution network (Configuration A)
37
3.5 Network Configuration B
37
3.6 Network Configuration C
38
4.1 A 33KV test distribution network 44
4.2 Equivalent pi-circuit model for cables
48
4.3 Aggregate load model
51
4.4 Sample of component model programming using spreadsheet
54
5.1 Harmonic voltage at each harmonic order for configuration A
58
5.2 Harmonic voltage Distortion characteristic for network configuration A at maximum current harmonic and varying consumer loads
59
ix
5.3 Configuration A THDv pdf and cpf
61
5.4 Scatter plot for different level of current harmonic
62
5.5 Correlation between load fluctuation size and THDv variability
63
5.6 Correlation between consumer load distance to PCC and THDv variability range at PCC due to total tripping of each load
64
5.7 Harmonic voltage level at each harmonic for configuration B and C using the same random load level data, simulation and calculation
65
5.8 Scatter plot of THDv for the three different configuration at random load level
66
5.9 Configuration B THDv pdf and cpf
68
5.10 Configuration C THDv pdf and cpf
68
5.11 Correlation between difference in branches total load and difference in configuration B and C THDv
69
x
LIST OF ABBREVIATION
ASD Adjustable speed drives
BK Breaker
Cpf Cumulative probability function
CIGRE International Congress of Large Power Systems
IEC International Electrotechnical Commission
IEEE Institute of Electrical and Electronics Engineers
IEEE PES IEEE Power Engineering Society
ISC Short Circuit Current
IL Load Current
LPC Large Power Consumer
MS Microsoft
MVA Mega Volt Ampere
NOP Normally open position
Pdf Probability density function
PCC Point of Common Coupling
SCC Short Circuit Current
SCR Short Circuit Ratio
SHI Shunt Harmonic Impedance
THD Total Harmonic Distortion
THDv Voltage Total Harmonic Distortion
xi
MENGURANGKAN VOLTAN HARMONIK DI RANGKAIAN PEMBAHAGIAN KAWASAN INDUSTRI MENGGUNAKAN PENGURUSAN KONFIGURASI
RANGKAIAN
ABSTRAK
Syarikat pembekal elektrik diperlukan untuk mengekalkan tahap voltan
harmonik di dalam sistem di bawah batas piawaian. Namun, voltan harmonik
berubah mengikut masa dan disebabkan oleh naik turun tahap arus harmonik
dan perubahan impedans rangkaian. Mengurangkan harmonik menggunakan
kaedah sedia ada adalah mahal untuk pembekal tenaga dan memerlukan
pertimbangan ekonomi. Pemerhatian dan analisa ke atas rangkaian
pembahagian kawasan industri menunjukkan perubahan pada impedans
rangkaian disebabkan oleh perubahan beban pelanggan dan perubahan
konfigurasi rangkaian boleh menyebabkan perubahan ketara terhadap kadar
voltan ‘total harmonic distortion’ (THD) pada ‘point of common coupling’ (PCC).
Simulasi terhadap rangkaian pembahagian ujian, menganalisa faktor seperti
saiz perubahan beban pelanggan dan lokasi beban sepanjang rangkaian, dapat
mengurangkan perubahan maksima voltan THD sebanyak 21.7% dari satu
pelanggan. Mengubah konfigurasi rangkaian dapat mengurangkan voltan THD
sebanyak 10.6% sementara menambah 5MVA beban tambahan mengurangkan
voltan THD sebanyak 3.5%. Jumlah pengurangan adalah bermakna
memandangkan caranya yang mudah dengan kos yang minima menjadikannya
sesuai untuk pembekal tenaga atau pelanggan gunakan sebagai cara
tambahan menghalang voltan harmonik daripada melebihi had piawaian atau
memperbaiki bentuk gelombang voltan.
xii
REDUCING HARMONIC VOLTAGE AT INDUSTRIAL AREA DISTRIBUTION NETWORK USING NETWORK CONFIGURATION MANAGEMENT
ABSTRACT
Electric utility company is required to maintain harmonic voltage level in the
system below the standard’s limit. However, harmonic voltage is time variant
and is caused by fluctuation of current harmonic level and changes in network
impedance. Mitigating harmonic using existing methods is costly for utility and
requires economic consideration. Observation and analysis on an industrial
area distribution network shows that network impedance fluctuation caused by
consumer loads variability and changing network configuration can significantly
change voltage total harmonic distortion (THD) level at point of common
coupling (PCC). Simulation on a test distribution network, analyzing factors
such as size of fluctuating consumer load and location of load along radial
network, is able to reduce maximum voltage THD variability from a single load
up to 21.7%. Changing network configuration can achieve voltage THD
reduction up to 10.6% while adding 5MVA additional load into the network
reduced voltage THD up to 3.5%. Amount of reduction is significant considering
the method’s simplicity and with minimum cost which makes it feasible for utility
or consumer to use as an additional method to prevent harmonic voltage from
exceeding the standard’s limit or to improve voltage waveform.
1
CHAPTER ONE
INTRODUCTION
Demand for quality power supply is becoming a major issue for
consumer, especially large power consumer (LPC) such as industrial
community. Electric utility company is expected to comply with power quality
standards. One of power quality index is related to harmonic distortion. Unlike
other power quality indexes such as transient, sag and swell which occur
intermittently, harmonic distortion exist continuously in electrical network. This
chapter describes issues regarding harmonic distortion at an industrial area
distribution network from utility’s perspective.
1.1 Overview on Harmonic Harmonics in electrical power system is becoming a major concern for electric
utility company and consumers. It is produced by power electronics and other
equipments which are called non-linear loads. Examples of nonlinear loads are
computers, fluorescent lamp and television in residential while variable speed
drives, inverters and arc furnaces are mostly common in industrial areas.
Increasing numbers of these loads in electrical system for the purpose of, such
as improving energy efficiency, has caused an increase in harmonics pollution.
These loads draw non-sinusoidal current from the system. The waveform is
normally periodic according to supply frequency which is either 50Hz or 60Hz
depending on the country.
2
Effect of high level of voltage or current harmonics can cause transformer
heating, nuisance tripping of fuse, circuit breaker and protective devices, high
current in neutral conductor and distorted voltage waveform. Capacitors are
sensitive to harmonic voltage while transformers are sensitive to current
harmonics. There are many researches which study the effect of harmonics
which affects both utility and consumers. Greater concerns have been
expressed by industries which have equipment or processes that are sensitive
to distortion on the supply voltage which affect their plant operation and
productivity.
Resonance is another problem related to harmonics. It occurs when
harmonic current produced by non-linear load interacts with system impedance
to produce high harmonic voltage. Two types of resonance can occur in the
system, either series resonance or parallel resonance, depending on the
structure of the network. This problem is most common in industrial plant due to
the interaction of series of power factor correction capacitors and transformer’s
inductance.
All triplen harmonics (odd multiples of three i.e. 3, 9, 15 …) is zero
sequence and cannot flow in a balanced three-wire systems or loads.
Therefore, the delta-wye-grounded transformer at the entrance of industrial
plant can block the triplen harmonic from entering utility distribution system.
However, triplen harmonic current flows in neutral conductor and are three
times in magnitude.
3
1.2 Standards on Harmonic
Institute of Electrical and Electronics Engineers (IEEE) has come out with
standards and guidelines regarding harmonics. One of the standards, IEEE
Standard 519-1992, provides comprehensive recommended guidelines on
investigation, assessment and measurement of harmonics in power system.
The standard includes steady state limits on current harmonic and harmonic
voltages at all system voltage levels. The limit was set for a steady state
operation and for worst case scenario.
Another international standards and conformity assessment body,
International Electrotechnical Commission (IEC), produced a standard, IEC
61000-3-6, which also provides guidelines to address harmonics issue with sets
of steady state limits. Both standards are in common where the limits were
derived based on a basic principle of insuring voltage quality and shared
responsibility between utility and customer (Halpin, 2005). Both lay the
responsibility on consumer to limit the penetration of current harmonic into
power system while utility company is responsible to limit harmonic voltage at
point of common coupling (PCC). According to IEEE definition, point of common
coupling is a point anywhere in the entire system where utility and consumer
can have access for direct measurement and the indices is meaningful to both.
Example of steady state harmonic voltage limit from IEEE Std. 519-1992
at PCC for medium voltage level (< 69 kV) is 5% THD and 3% individual voltage
distortion. In reality, harmonic is time-variant and it changes over time due to
several factors. Both standards recognize this condition and allow the limits to
4
be exceeded for short duration. IEC has provided a set of time-varying limits
based on percentile over a period of time i.e. 95th and 99th for very short time (3
second) and short time (10 minute) aggregate measurements.
1.3 Harmonic Mitigation
Several methods of mitigating harmonics have been developed over the
years. The most common method is using filter, either passive or active.
Passive filter block certain harmonic bandwidth while active filter injects current
into the system to cancel the current harmonic waveforms. Both methods have
their advantages and disadvantages, for example, advantage of passive filter is
easy to design and active filter can monitor many frequencies simultaneously
while disadvantage of passive filter is bulky in size and active filter is costly
(Izhar et. al., 2003). Harmonic filters are useful and practical to be implemented
by consumer near the proximity of the non-linear load at the low voltage system.
Another method which is normally used by consumers is using phase
cancellation method using twelve pulse converters instead of six pulse
converters.
Similar application using filters for utility at higher voltage level such as
distribution network requires extensive economic consideration. This is due to
the size and cost of the equipment while most of harmonic pollutant is caused
by consumer. There is little study on a feasible and cost effective means for
utility to mitigate harmonic, especially harmonic voltage. A study was conducted
on method using shunt harmonic impedance (Ryckaert et. al., 2004 ) which can
act like a central damper to reduce harmonic at distribution network. This
5
method is considered to be less expensive compared to active filter. The
method uses power electronic to emulate resistive behavior for harmonic.
However, the method is still under further study. Currently, all harmonic
mitigation techniques involve equipment required to be installed on the system.
There is yet a study on using other factors which can affects harmonic voltage
distortion such as network impedance. Optimizing network impedance to
mitigate harmonic can be cost effective for utility to apply. Because of mitigating
harmonic is expensive, many utility company have resorted in imposing penalty
to consumer for injecting current harmonic above the standard steady state limit
into the system. This process requires method on determining harmonic
contribution by the consumers (Li, et. al., 2004) and the equipment need to be
installed at all consumers’ feeder which is very costly.
1.4 Time-Varying Harmonic
Many recent studies on harmonic limit focus on development of time
varying limit and probabilistic aspects of harmonics in power system (Baghzouz,
2005). This includes the probabilistic modeling of power system (Carbone, et.
al., 2000) and probabilistic aspects of harmonic impedance (Testa, et. al.,
2002). In order to comply with time varying harmonic limits, prediction of the
system’s time varying harmonic characteristic is crucial. Simulation is still the
best method of assessment but calculation based on steady state design value
does not reflect the actual fluctuation of harmonic. This is due to the fact that
current harmonic and network impedance changes over time. Therefore it is
imperative for utility to be able to predict the time varying characteristic of
harmonic voltage of a distribution network at PCC based on the varying factors
6
within distribution system, especially factor that within its influence where they
can be controlled or managed. The factors which can contribute to harmonic
voltage fluctuation will be discussed in detail in section 1.6.
1.5 Industrial Area
Setting up of an industrial area or industrial zone has become a common
practice in many countries where all industrial plant is located within a certain
geographical area. There are many reasons for the set up such as economic
consideration, safety issues and environmental concern. The development of
industrial area has also caused a unique electrical distribution system with
unique electrical characteristic, power quality and system stability requirements.
Due to the strict requirements from consumer to utility, consumers are provided
with redundant incoming feeders and the distribution network is supplied by
several sources from transmission system. The network is also operated by
extensive network control system to provide stable and reliable supply to
consumers.
Utility monitors power supply quality of an industrial area at the
incoming feeder after the step down transformer from transmission system. For
harmonic monitoring, this point is the point of common coupling. The reason for
choosing the point is to ensure harmonic pollution from the industrial area is not
being transmitted into transmission system and vice versa, and to ensure
harmonic pollution from one branch does not affect another branches
connected on the feeder. Harmonic level on the feeder is the best indication of
harmonic quality in the network.
7
1.6 Factors Contributing to Harmonic Fluctuation
Analysis into factors contributing to harmonic voltage fluctuation at
industrial area shows that changes in non-linear loads, network configuration
and number of linear loads within the network are the main factors. However,
utility has no control over the number and operational of non-linear load within
industrial plant which caused changes in production of current harmonic. The
only factors within utility’s control are configuration of the network and number
of consumer plants in the network. These two factors affect the network
impedance. Looking in detail into network components, network total
impedance comprises of transmission system impedance, step down
transformer impedance, cable impedance and consumer’s plant network
impedance.
Transmission system network impedance looking from the low voltage
side of a step down transformer varies slightly over time because of the
impedance of a step down transformer dominates and does not vary much.
Cable’s impedance is also constant and can be assume steady. However,
number of consumer plant in the network and their load demand changes over
time depending on plant operation and unforeseen tripping. Overall network
configuration can also change due to switching process. These two factors,
consumer load variability and network configuration changes, are the main
factors which utility can use to mitigate harmonic voltage.
8
1.7 Evaluating Harmonic Characteristic
In order to determine the effect of the above factors on harmonic voltage,
network harmonic characteristic is important as a baseline for comparison. The
characteristic must be able to indicate the effect of time varying nature of
harmonic. Since major contribution of harmonic voltage is the fluctuation of load
impedance under normal operation, development of harmonic characteristic of a
network due to load variability is crucial. There is currently no specific method
been developed to determine or predicting harmonic characteristic of a certain
network, other than frequency scan for resonance analysis which only
applicable for steady state analysis. For this study, since utility is able to
determine the statistical loading pattern of a network, the probability of loading
can be used to develop and estimate the probabilistic aspect of harmonic.
1.8 Objectives and Scope of Research
The objectives of this study were to determine methods for utility to
reduce harmonic voltage in meeting standard’s steady state limit of 5% voltage
THD and time varying limit of 95th percentile voltage THD within steady state
limit at PCC. The second objective is to determine methods of reducing
harmonic voltage with little or no cost. The study focused on distribution network
for industrial area which has the capability of switching into other configuration
since the network normally has different possible sources, backup and
redundant feeders to ensure reliability of the supply system. Action plan for this
study were as follows:
1. To determine whether varying consumer load increases harmonic
voltage.
9
2. To determine amount of changes in harmonic voltage due to size
of varying consumer load.
3. To determine amount of change in harmonic voltage due to
location of varying consumer load.
4. To determine changes in harmonic voltage due to switching
network configuration.
5. To determine changes in harmonic voltage due to adding
consumer load into existing network.
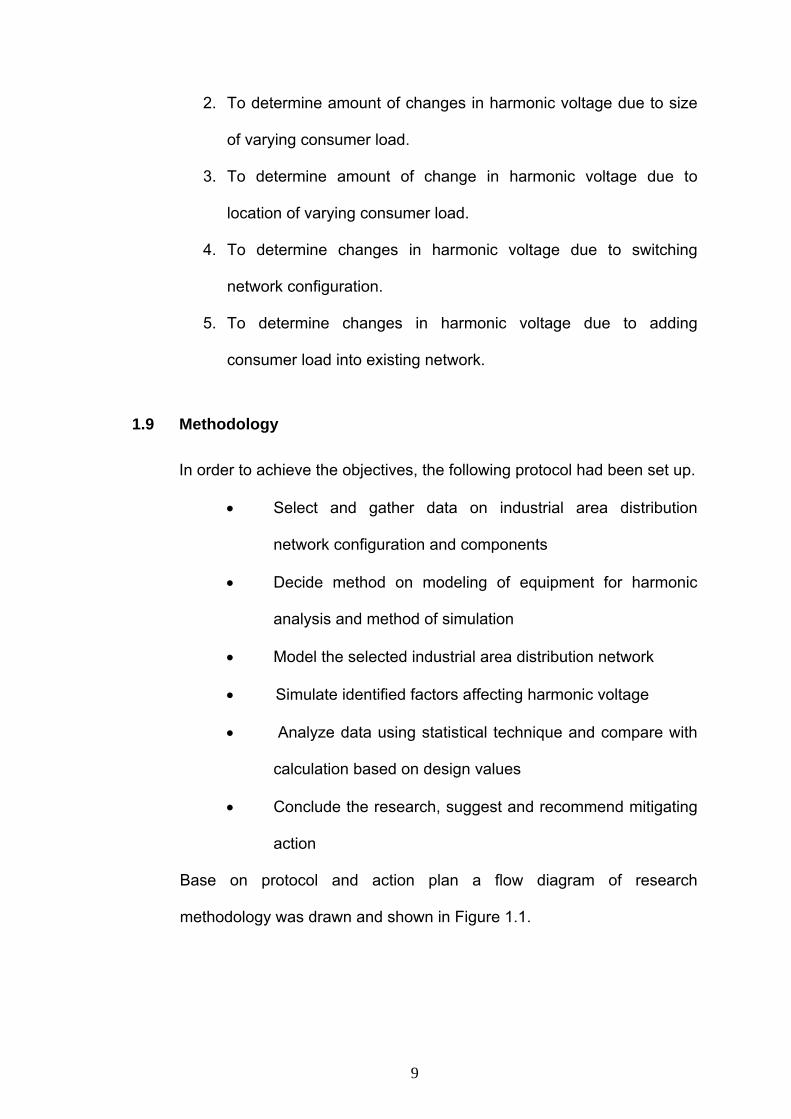
1.9 Methodology
In order to achieve the objectives, the following protocol had been set up.
• Select and gather data on industrial area distribution
network configuration and components
• Decide method on modeling of equipment for harmonic
analysis and method of simulation
• Model the selected industrial area distribution network
• Simulate identified factors affecting harmonic voltage
• Analyze data using statistical technique and compare with
calculation based on design values
• Conclude the research, suggest and recommend mitigating
action
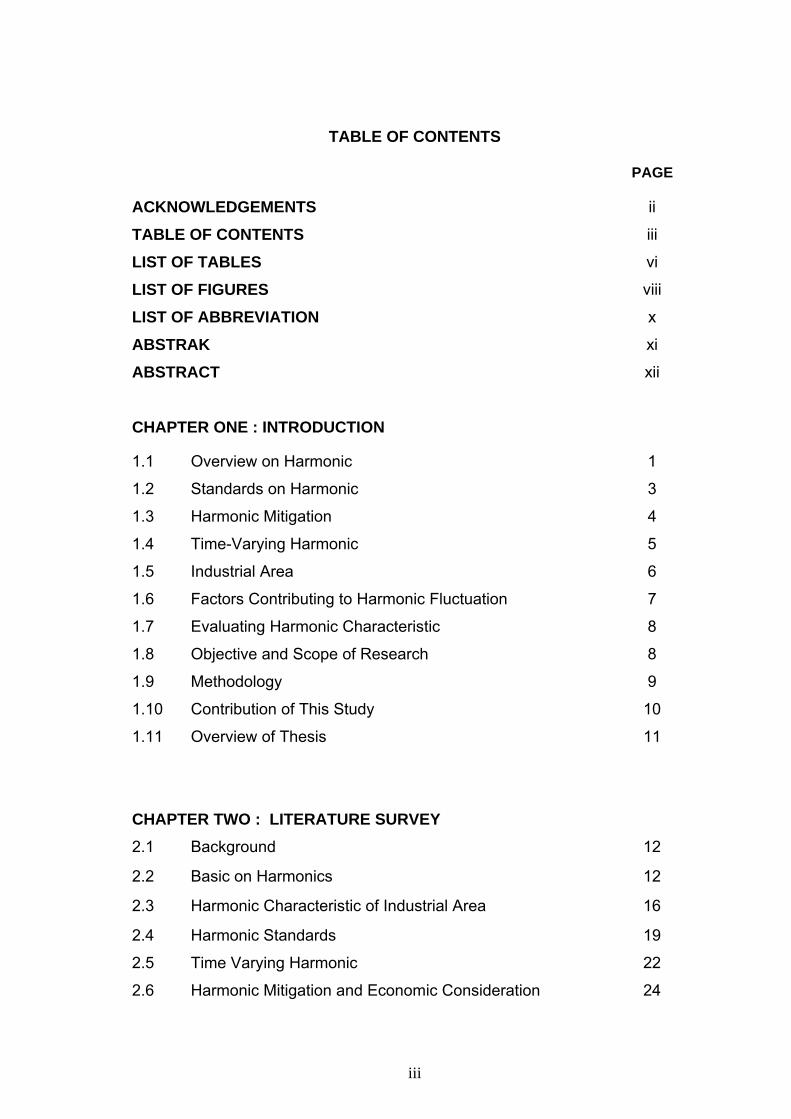
Base on protocol and action plan a flow diagram of research
methodology was drawn and shown in Figure 1.1.
10
START
END
Select and gather data on industrial area distribution network configuration and components
Decide method on modeling of equipment for harmonic analysis and method of simulation
Model the selected industrial area distribution network
Simulate identified factors affecting harmonic voltage
Analyze data using statistical technique and compare with calculation based on design values
Conclude the research, suggest and recommend mitigating action
Figure 1.1 Methodology flow chart
1.10 Contribution of This Study
The outcome of this study is important to utility in controlling harmonic
voltage and improving power quality without huge investment in mitigating
equipment. Components which are affected by harmonic voltage will have
longer life and cost of maintenance is reduced. Consumers will also benefit from
the method since utility is able to provide better power quality. System design
engineers can use the method in planning of electrical system and control
engineers will be able to use the method in controlling harmonic voltage.
11
1.11 Overview of Thesis
This thesis discusses and analyzes harmonic voltage distortion at a utility
distribution network supplying to industries due to changes in consumer load
and network configuration. The analysis determines the condition which can
reduce total harmonic voltage distortion THDv at point of common coupling.
Recommendation to reduce harmonic voltage distortion was proposed which
can be integrated into the network control system.
The content in Chapter 2 provides reader with the applicable standards
for harmonic, harmonic mitigation, probabilistic aspects of harmonic, economic
consideration and effect of network impedance on harmonic. Reviews from past
studies by researchers related to those issues were presented.
Chapter 3 discusses the method of simulation and the process flow of the
simulation. Each factors contributing to the changes to harmonic voltage at PCC
were taken into consideration for simulation. Method of calculations and
analysis were also presented in this chapter.
Chapter 4 contains information on test distribution network system
together with component data and test values that were used for analysis.
Methods for modeling and calculation of each component in the network were
described in details.
Chapter 5 exhibits the simulation results and analysis together with
discussion of the overall situation. A conclusion of the thesis was presented in
Chapter 6 which includes recommendation for future studies.
12
CHAPTER TWO
LITERATURE SURVEY 2.1 Background
The studies required broad knowledge of the issues regarding harmonic
in power system, the standard limit and requirements, modeling and simulation,
issues related to utility and consumers especially at an industrial area, and
result from studies by other researchers. All this information is necessary to
address the changes and dynamic of harmonic voltage at an industrial area.
The following sections include brief knowledge of harmonics and reviews
on papers related to relevant harmonic standards and requirements, mitigation,
probabilistic aspects, cost of mitigation and effect of harmonic impedance
variability. The review focus on studies related to harmonic in power system
with regards to relation between utility and consumers. The reviews also
pointed out the differences and similarities between previous studies and this
research.
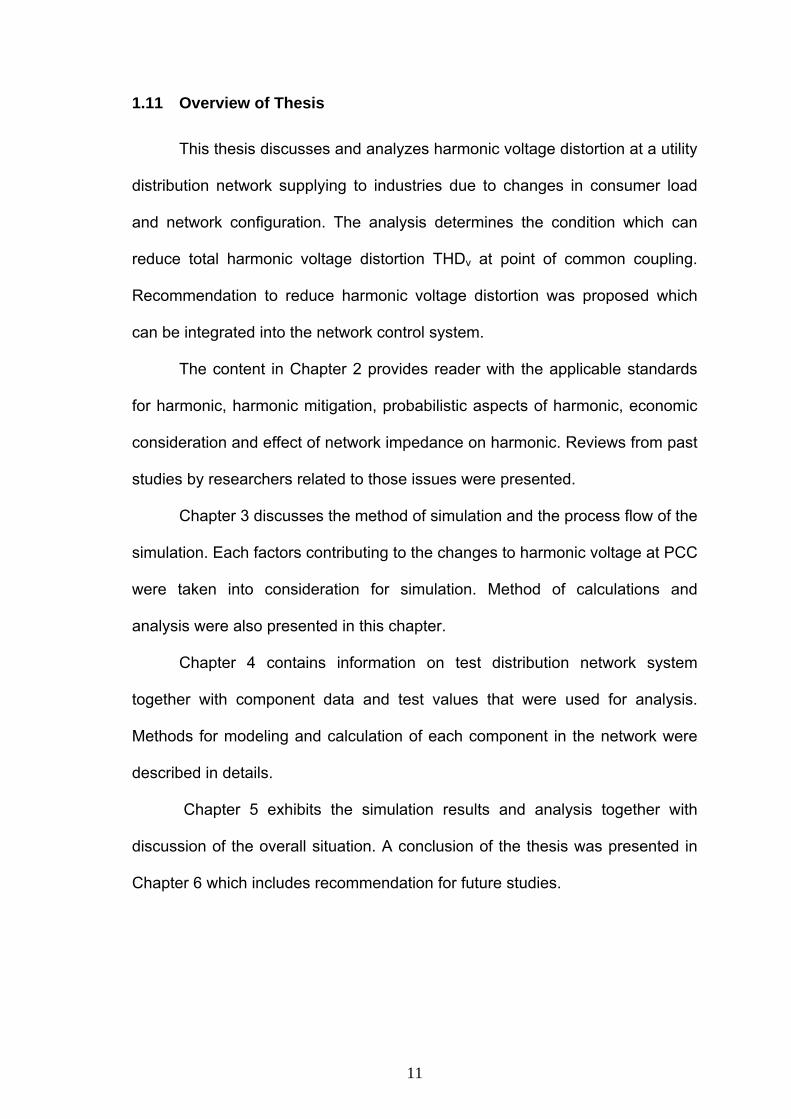
2.2 Basic on Harmonics IEEE PES Winter Meeting 1998 provides basic harmonic theory which
according to Fourier theorem, periodic non-sinusoidal or complex voltage
(Figure 2.1) or current waveforms can be represented by the sum of a series of
13
multiple frequency terms of varying magnitudes and phases as shown in
equation (2.1).
∑ ++= )]cos([)( 0 nn qtnaatf ω (2.1)
where: na is the magnitude of the nth harmonic frequency
oa is the d.c. component
nq is the phase angle of the nth harmonic frequency
ω is the fundamental frequency
n =1,2,3,…
Figure 2.1 Harmonic Current and Voltage Distortion a) Non-linear load draws non-sinusoidal current from the system. b) Resulting voltage distortion due to non-sinusoidal current
Non-linear current
Supply voltage
(a) (b)
V
time
Distorted Voltage waveform
time
14
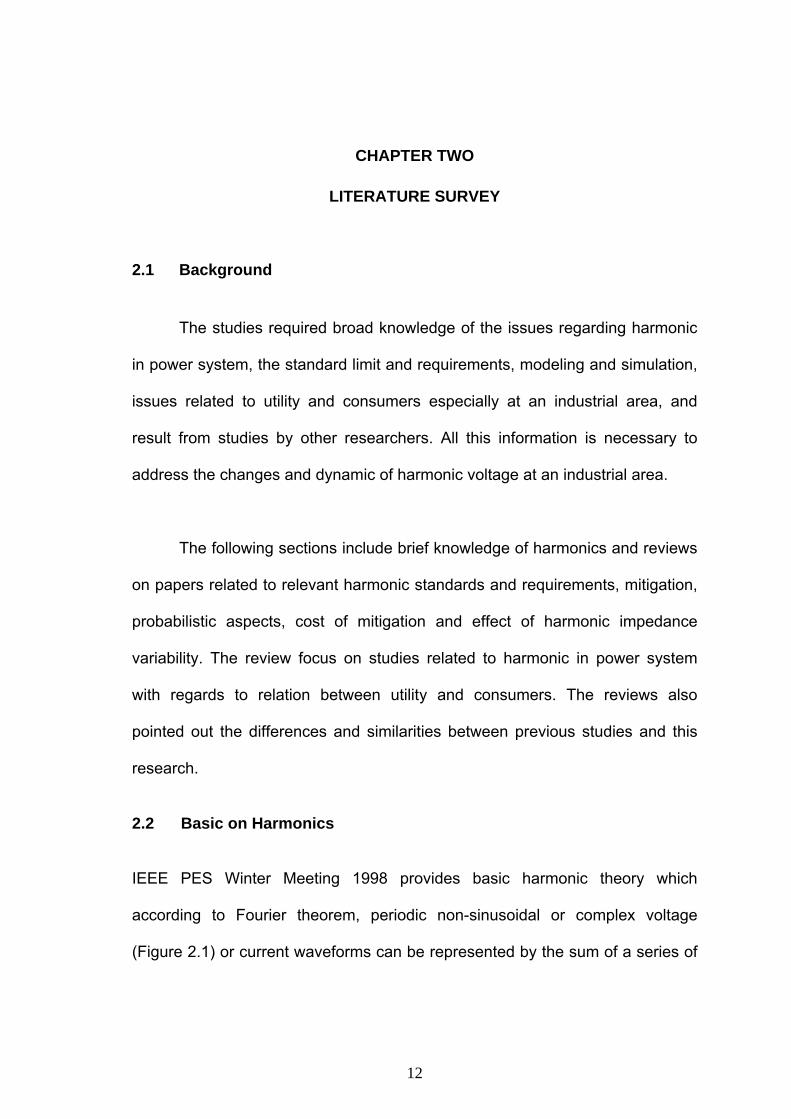
Harmonic is measured using total harmonic distortion (THD) which is
also known as distortion factor and can be applied to current and voltage. It is a
square-root of sum of all harmonic magnitudes over the fundamental. Equation
(2.2) shows the calculation for voltage total harmonic distortion (THDv).
1
2
2
V
VTHD n
n
V
∑∞
== (2.2)
where: 1V is the magnitude of fundamental frequency voltage
nV is the magnitude of nth harmonic frequency voltage
For a balanced three-phase network with three-phase non-linear loads,
harmonic current or voltage has phase sequences. Equations (2.3) until (2.7)
describe the equation for each phase for the first three harmonics.
)3sin()2sin()sin()( 332211 θωθωθω +++++= tItItIti oooa (2.3)
)3
63sin()3
42sin()3
2sin()( 332211πθωπθωπθω −++−++−+= tItItIti ooob (2.4)
)3
63sin()3
42sin()3
2sin()( 332211πθωπθωπθω ++++++++= tItItIti oooc (2.5)
where: nI is the nth current harmonic magnitude
oω is the fundamental frequency
nθ is the nth harmonic phase angle
n = 1,2,3
15
Equation (2.4) and (2.5) can also be described as follows:
)03sin()3
22sin()3
2sin()( 332211 −+++++−+= θωπθωπθω tItItIti ooob (2.6)
)03sin()3
22sin()3
2sin()( 332211 +++−++++= θωπθωπθω tItItIti oooc (2.7)
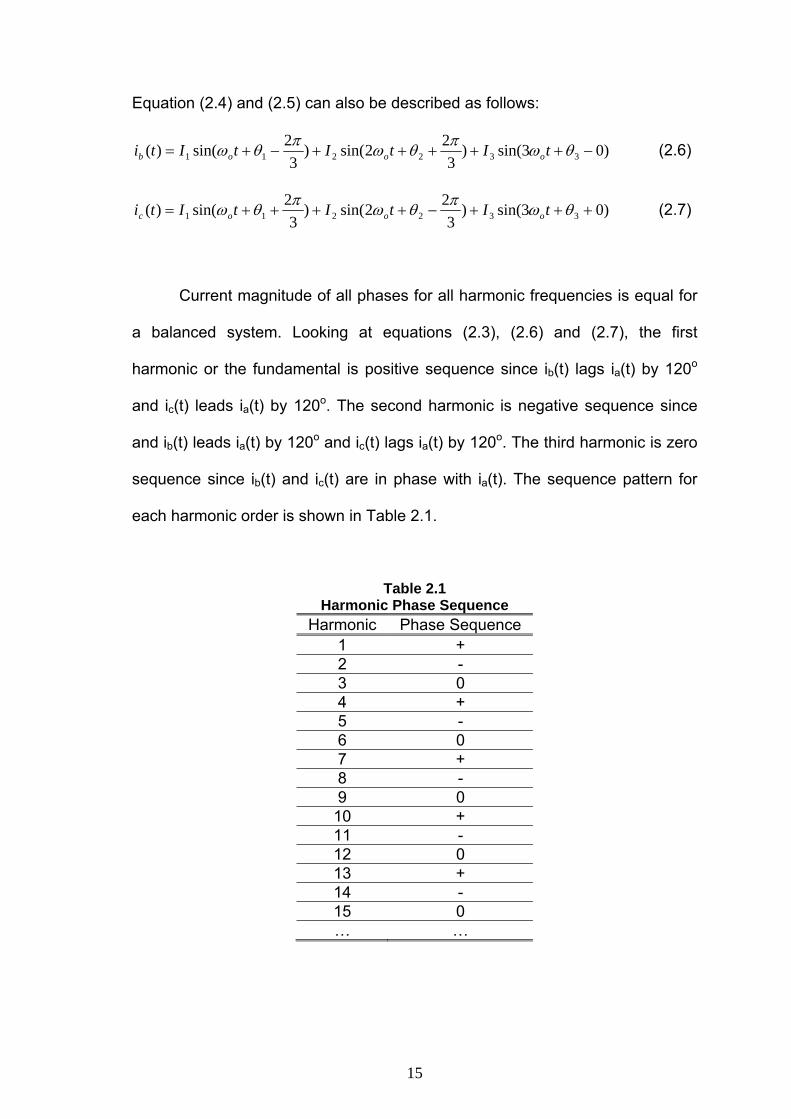
Current magnitude of all phases for all harmonic frequencies is equal for
a balanced system. Looking at equations (2.3), (2.6) and (2.7), the first
harmonic or the fundamental is positive sequence since ib(t) lags ia(t) by 120o
and ic(t) leads ia(t) by 120o. The second harmonic is negative sequence since
and ib(t) leads ia(t) by 120o and ic(t) lags ia(t) by 120o. The third harmonic is zero
sequence since ib(t) and ic(t) are in phase with ia(t). The sequence pattern for
each harmonic order is shown in Table 2.1.
Table 2.1 Harmonic Phase Sequence
Harmonic Phase Sequence 1 + 2 - 3 0 4 + 5 - 6 0 7 + 8 - 9 0 10 + 11 - 12 0 13 + 14 - 15 0 … …
16
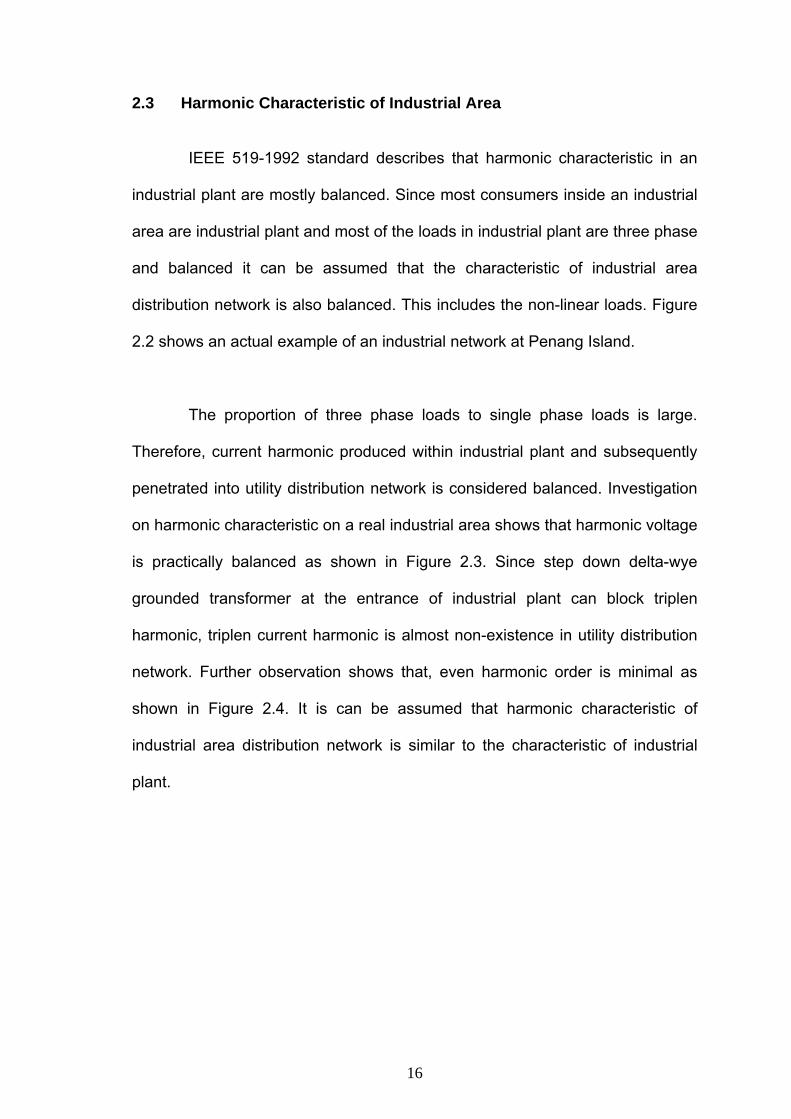
2.3 Harmonic Characteristic of Industrial Area
IEEE 519-1992 standard describes that harmonic characteristic in an
industrial plant are mostly balanced. Since most consumers inside an industrial
area are industrial plant and most of the loads in industrial plant are three phase
and balanced it can be assumed that the characteristic of industrial area
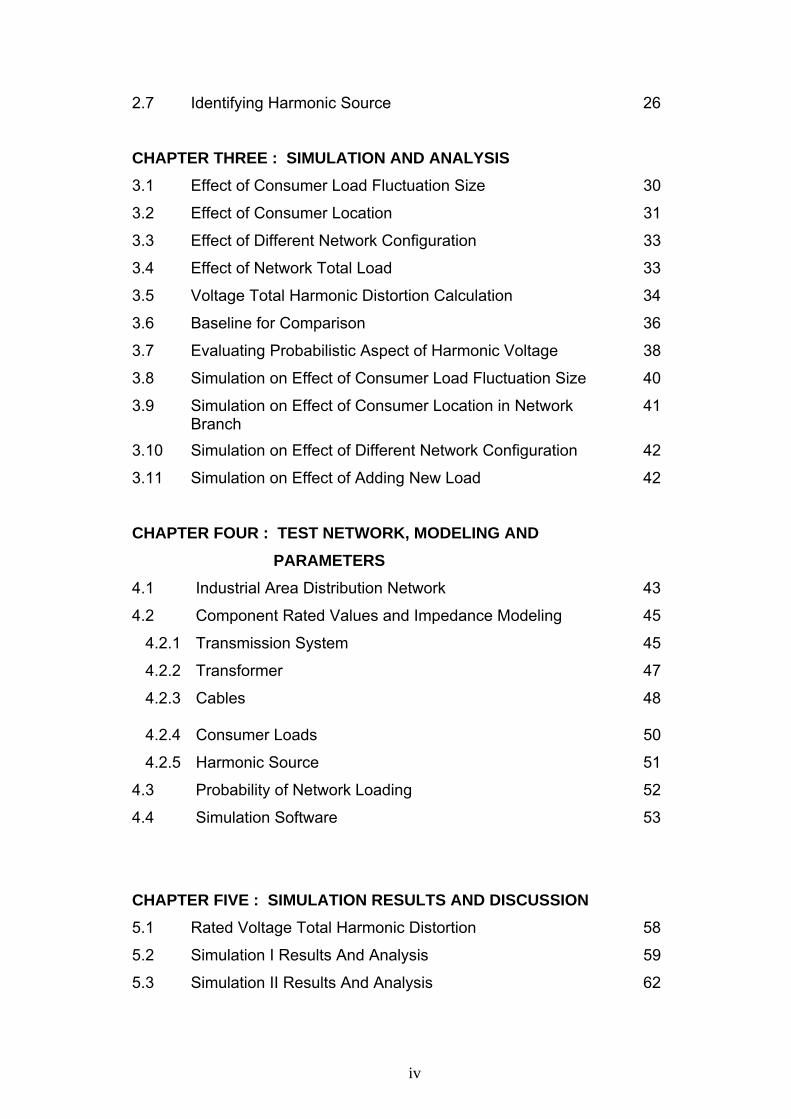
distribution network is also balanced. This includes the non-linear loads. Figure
2.2 shows an actual example of an industrial network at Penang Island.
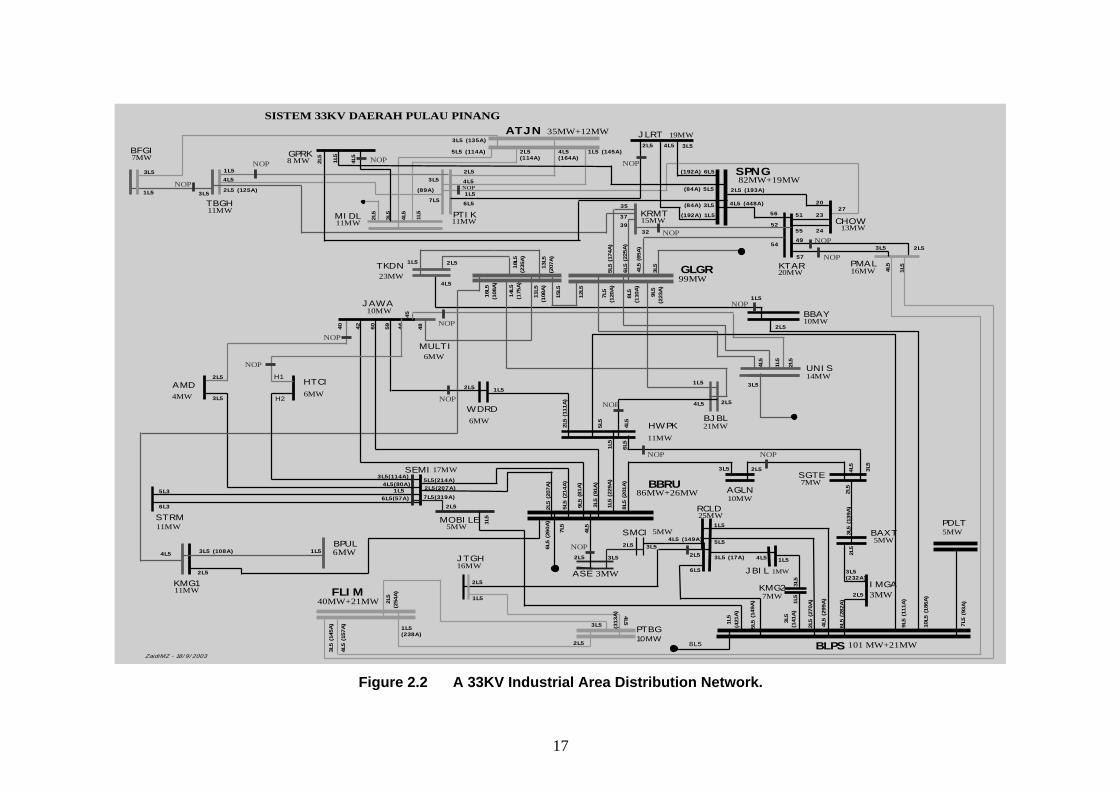
The proportion of three phase loads to single phase loads is large.
Therefore, current harmonic produced within industrial plant and subsequently
penetrated into utility distribution network is considered balanced. Investigation
on harmonic characteristic on a real industrial area shows that harmonic voltage
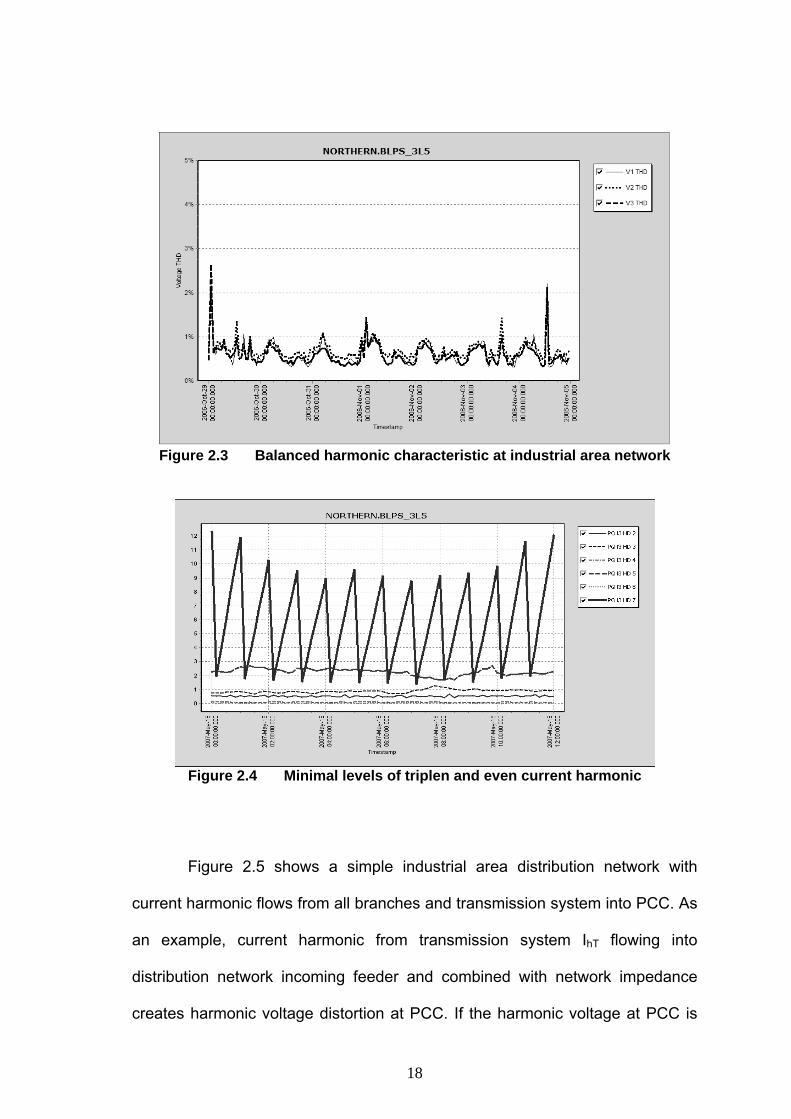
is practically balanced as shown in Figure 2.3. Since step down delta-wye
grounded transformer at the entrance of industrial plant can block triplen
harmonic, triplen current harmonic is almost non-existence in utility distribution
network. Further observation shows that, even harmonic order is minimal as
shown in Figure 2.4. It is can be assumed that harmonic characteristic of
industrial area distribution network is similar to the characteristic of industrial
plant.
17
MOBILE
GLGR
BBAY
TKDN23MW
JAWA
BBRUSGTE
BAXT
HWPK
BLPS
FLIM
BPUL
KMG1
SEMI
STRM
AMD HTCI
SPNG
KTAR
CHOWKRMT
BJBL
PTIK
RCLD
KMG2
BFGI
TBGHMIDL
WDRD
SISTEM 33KV DAERAH PULAU PINANG
SMCI
82MW+19MW
20MW
13MW15MW
99MW
10MW
11MW11MW
11MW
14MW
10MW
7MW
86MW+26MW
25MW
101 MW+21MW
40MW+21MW
6MW
11MW
17MW
11MW
7MW
5MW
7MW
6MW4MW
JTGH
5MW
16MW
6MW
3L5
1L5 3L5
1L5
2L5 (125A)
1L5
2L5
7L5
3L5
1L5
6L5
4L5
(84A) 3L5
(84A) 5L5
(192A) 6L5
35
39
2L5 (193A)
(192A) 1L5
4L5 (448A)
52
56
54
57
51
55
2327
24
6L5
(225
A)
5L5
(174
A)
7L5
(120
A)
8L5
(110
A)
13L5
(207
A)
9L5
(223
A)
16L5
(108
A)
4L5 3L5 (108A)
2L5
4L5
45
4L5
2L5
1L5
2L5
4L5
1L5
2L5 1L5
5L5
2L5
(111
A)
484459604240
H1
H2
2L5
3L5
6L5
1L5
5L3
6L3
4L5(80A)3L5(114A)
1L56L5(57A)
5L5(214A)2L5(207A)7L5(319A)
2L5
(207
A)
5L5
( 214
A)
9L5
(81A
)
3L5
(91A
)
1L5
(229
A)
8L5
(201
A)
6L5
(260
A)
4L5
2L5
3L52L5
1L5
5L5
3L5 (17A)
3L5
1L5
1L5
(421
A)
3L5
(141
A)
2L5
(270
A)
4L5
(299
A)
6L5 (282
A)
2L5
3L5
( 139
A )2L
54L
5
3L5
9L5
(111
A)
10L5
(18
6A)1L5
2L5
2L5
(254
A)
1L5
20
ZaidiMZ - 18/9/2003
IMGA 3MW11MW
4L5 (164A)
18L5
(23 5
A)
2L5
2L5
3L5 (232A)
1L5 (238A)
PTBG 10MW
JLRT 19MW3L5
3L5
4L5GPRK
PDLT 5MW
ASE 3MW
3L5
PMAL
492L5
1L5 (145A)5L5 (114A)
ATJN 35MW+12MW
4L5
2L5
1L5
AGLN
4L5
(65A
)
3L5 (135A)
2L5 (114A)
16MW
8 MW
JBIL 1MW
1L5
2L5
3L5
UNIS1L5
4L5
1L5
4L5
3L5
(145
A)
4L5
(157
A)
21MW
3L5
4L5 1L5
2L5
7L5
( 93A
)
2L5
4L52L5
1L5
2L53L5
37
32
4L5
11L5
(108
A)
2L5
15L5
12L5
3L5
7L5
5L5
(149
A)
8L5
4L5
14L5
(175
A)
MULTI6MW
5MW
NOP NOP NOP
NOP
NOP
NOP
NOP
NOPNOP
NOP NOP
NOP
NOP
NOP
NOP
NOP
6L5
10MW
3L5
2L5
4L5 (149A)
(313
A)
(89A)NOP
Figure 2.2 A 33KV Industrial Area Distribution Network.
18
Figure 2.3 Balanced harmonic characteristic at industrial area network
Figure 2.4 Minimal levels of triplen and even current harmonic
Figure 2.5 shows a simple industrial area distribution network with
current harmonic flows from all branches and transmission system into PCC. As
an example, current harmonic from transmission system IhT flowing into
distribution network incoming feeder and combined with network impedance
creates harmonic voltage distortion at PCC. If the harmonic voltage at PCC is
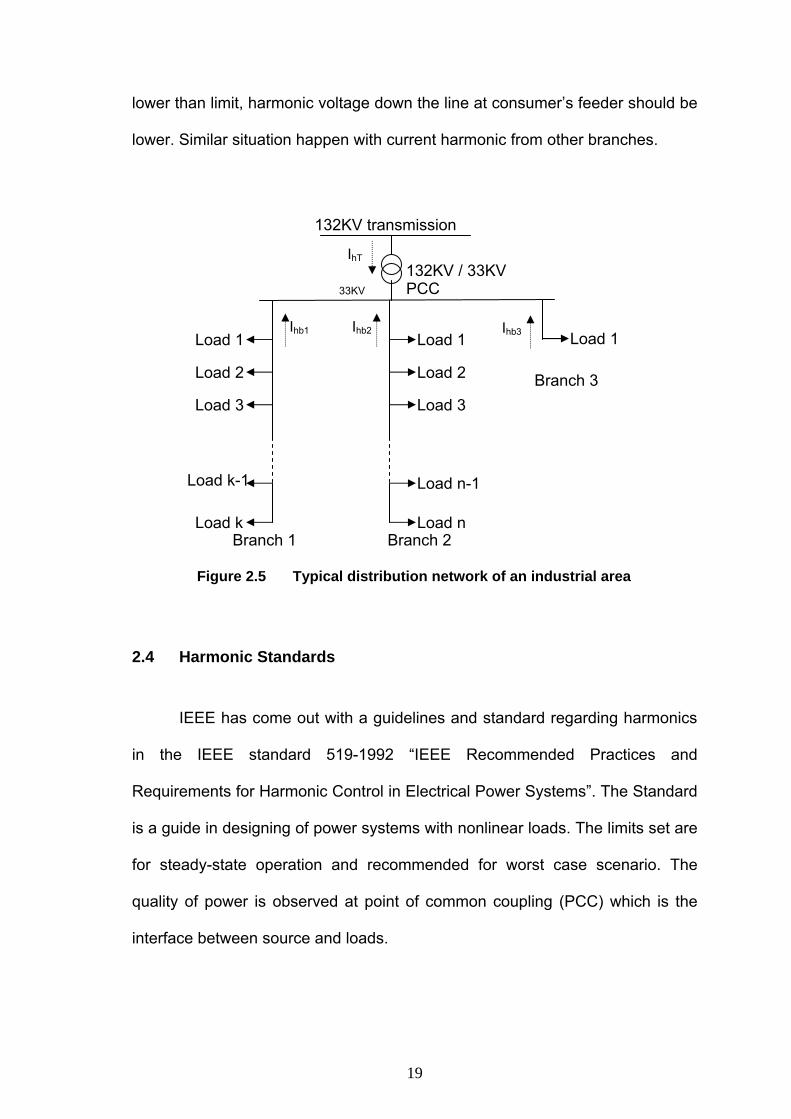
19
lower than limit, harmonic voltage down the line at consumer’s feeder should be
lower. Similar situation happen with current harmonic from other branches.
2.4 Harmonic Standards
IEEE has come out with a guidelines and standard regarding harmonics
in the IEEE standard 519-1992 “IEEE Recommended Practices and
Requirements for Harmonic Control in Electrical Power Systems”. The Standard
is a guide in designing of power systems with nonlinear loads. The limits set are
for steady-state operation and recommended for worst case scenario. The
quality of power is observed at point of common coupling (PCC) which is the
interface between source and loads.
132KV transmission
132KV / 33KV33KV
Branch 1 Branch 2
Load 1
Load 2
Load 3
Load k
Load 1
Load 2
Load 3
Load n
Load n-1
Ihb1 Ihb2
IhT
PCC
Branch 3
Load 1 Ihb3
Figure 2.5 Typical distribution network of an industrial area
Load k-1
20
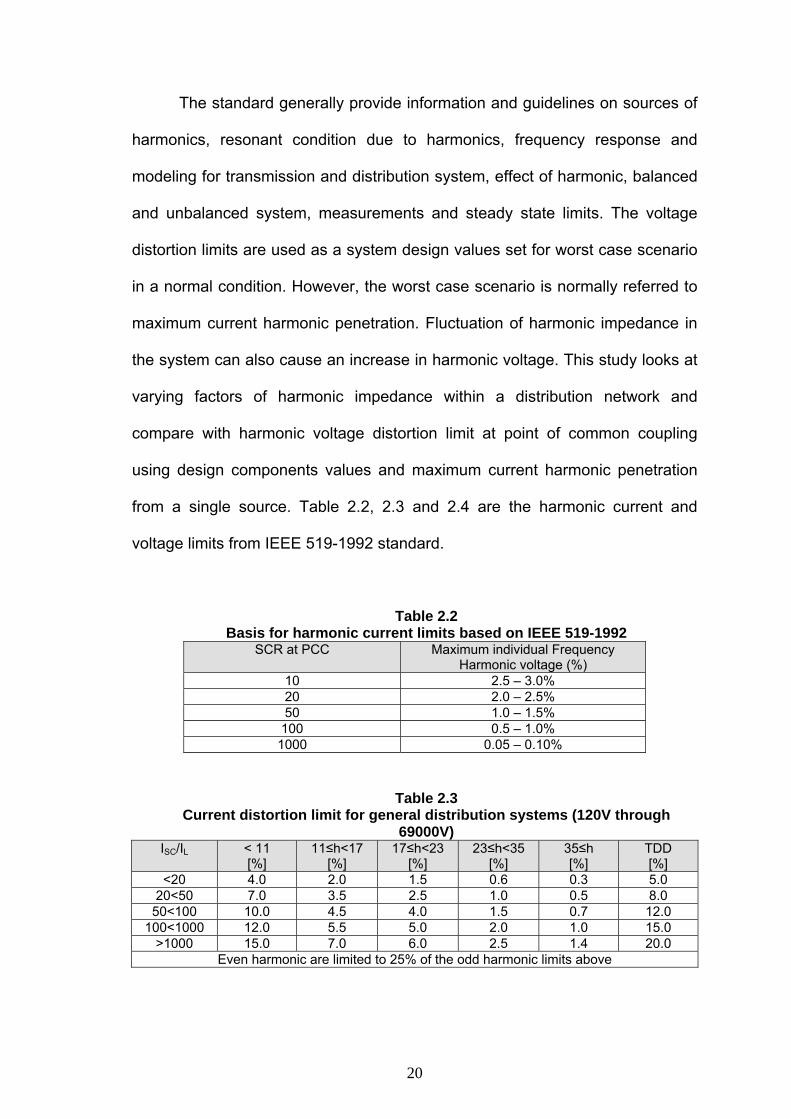
The standard generally provide information and guidelines on sources of
harmonics, resonant condition due to harmonics, frequency response and
modeling for transmission and distribution system, effect of harmonic, balanced
and unbalanced system, measurements and steady state limits. The voltage
distortion limits are used as a system design values set for worst case scenario
in a normal condition. However, the worst case scenario is normally referred to
maximum current harmonic penetration. Fluctuation of harmonic impedance in
the system can also cause an increase in harmonic voltage. This study looks at
varying factors of harmonic impedance within a distribution network and
compare with harmonic voltage distortion limit at point of common coupling
using design components values and maximum current harmonic penetration
from a single source. Table 2.2, 2.3 and 2.4 are the harmonic current and
voltage limits from IEEE 519-1992 standard.
Table 2.2 Basis for harmonic current limits based on IEEE 519-1992
SCR at PCC Maximum individual Frequency Harmonic voltage (%)
10 2.5 – 3.0% 20 2.0 – 2.5% 50 1.0 – 1.5%
100 0.5 – 1.0% 1000 0.05 – 0.10%
Table 2.3 Current distortion limit for general distribution systems (120V through
69000V) ISC/IL < 11
[%] 11≤h<17
[%] 17≤h<23
[%] 23≤h<35
[%] 35≤h [%]
TDD [%]
<20 4.0 2.0 1.5 0.6 0.3 5.0 20<50 7.0 3.5 2.5 1.0 0.5 8.0
50<100 10.0 4.5 4.0 1.5 0.7 12.0 100<1000 12.0 5.5 5.0 2.0 1.0 15.0
>1000 15.0 7.0 6.0 2.5 1.4 20.0 Even harmonic are limited to 25% of the odd harmonic limits above
21
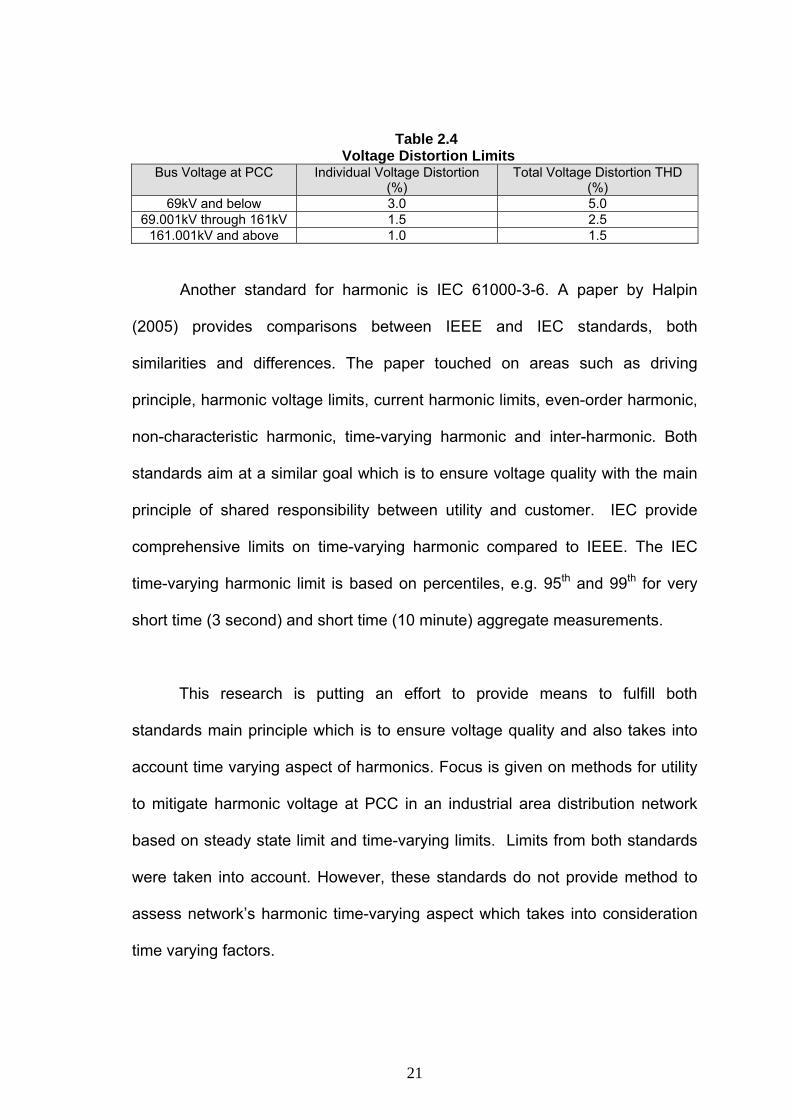
Table 2.4 Voltage Distortion Limits
Bus Voltage at PCC Individual Voltage Distortion (%)
Total Voltage Distortion THD (%)
69kV and below 3.0 5.0 69.001kV through 161kV 1.5 2.5
161.001kV and above 1.0 1.5
Another standard for harmonic is IEC 61000-3-6. A paper by Halpin
(2005) provides comparisons between IEEE and IEC standards, both
similarities and differences. The paper touched on areas such as driving
principle, harmonic voltage limits, current harmonic limits, even-order harmonic,
non-characteristic harmonic, time-varying harmonic and inter-harmonic. Both
standards aim at a similar goal which is to ensure voltage quality with the main
principle of shared responsibility between utility and customer. IEC provide
comprehensive limits on time-varying harmonic compared to IEEE. The IEC
time-varying harmonic limit is based on percentiles, e.g. 95th and 99th for very
short time (3 second) and short time (10 minute) aggregate measurements.
This research is putting an effort to provide means to fulfill both
standards main principle which is to ensure voltage quality and also takes into
account time varying aspect of harmonics. Focus is given on methods for utility
to mitigate harmonic voltage at PCC in an industrial area distribution network
based on steady state limit and time-varying limits. Limits from both standards
were taken into account. However, these standards do not provide method to
assess network’s harmonic time-varying aspect which takes into consideration
time varying factors.
22
2.5 Time Varying Harmonic
Since harmonic is time variant, it is important to understand the factors
affecting the change. Mitigating harmonic to meet with standard steady state
limit is essential to ensure system stability. However, since harmonic is time
variant, it is more practical to use time varying limit as an index to evaluate the
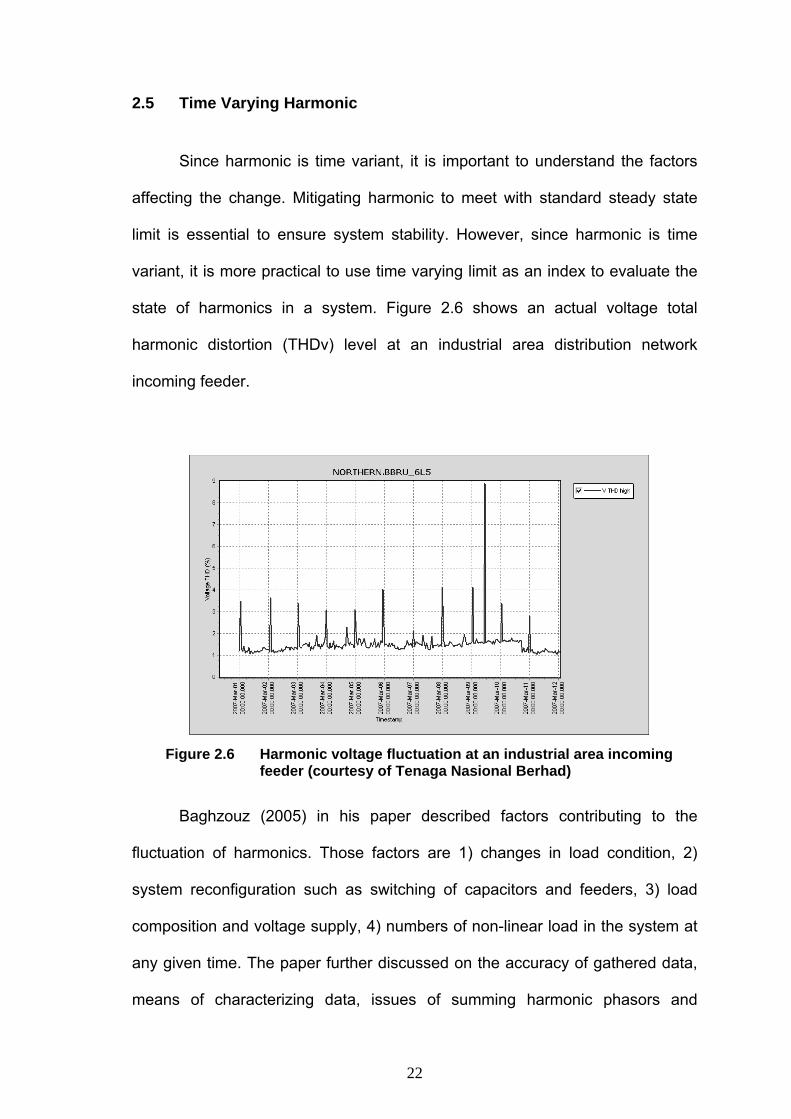
state of harmonics in a system. Figure 2.6 shows an actual voltage total
harmonic distortion (THDv) level at an industrial area distribution network
incoming feeder.
Baghzouz (2005) in his paper described factors contributing to the
fluctuation of harmonics. Those factors are 1) changes in load condition, 2)
system reconfiguration such as switching of capacitors and feeders, 3) load
composition and voltage supply, 4) numbers of non-linear load in the system at
any given time. The paper further discussed on the accuracy of gathered data,
means of characterizing data, issues of summing harmonic phasors and
Figure 2.6 Harmonic voltage fluctuation at an industrial area incoming feeder (courtesy of Tenaga Nasional Berhad)
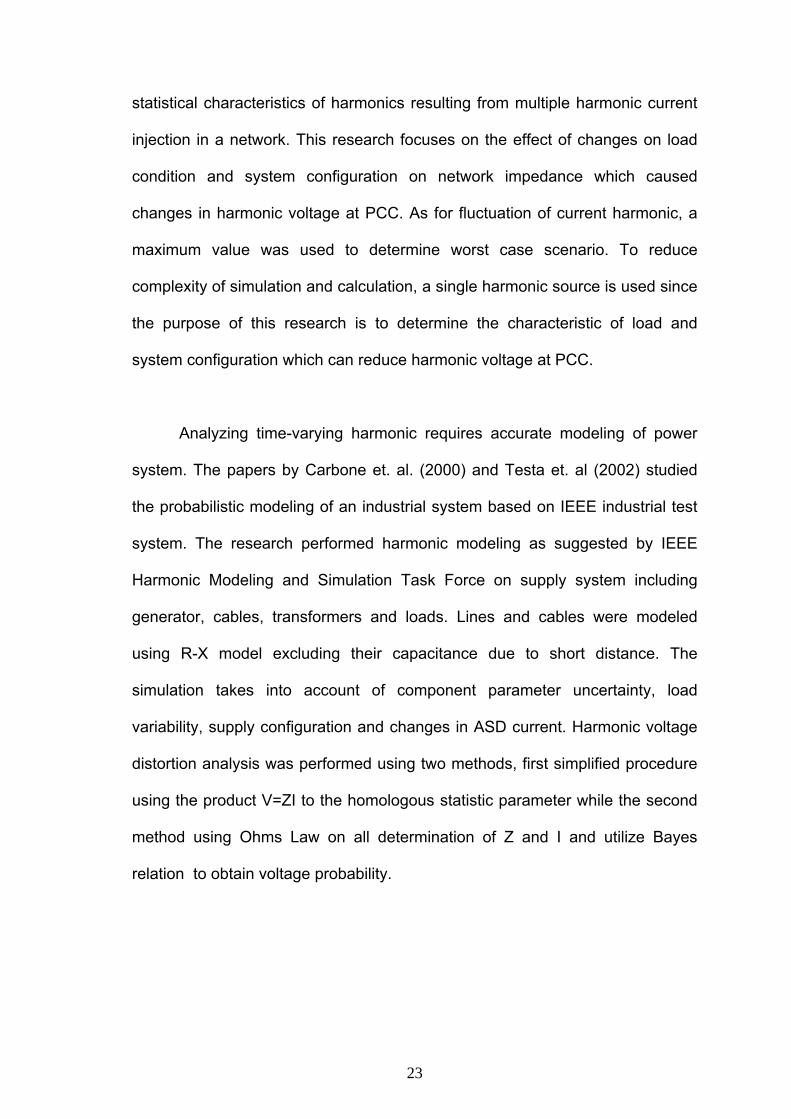
23
statistical characteristics of harmonics resulting from multiple harmonic current
injection in a network. This research focuses on the effect of changes on load
condition and system configuration on network impedance which caused
changes in harmonic voltage at PCC. As for fluctuation of current harmonic, a
maximum value was used to determine worst case scenario. To reduce
complexity of simulation and calculation, a single harmonic source is used since
the purpose of this research is to determine the characteristic of load and
system configuration which can reduce harmonic voltage at PCC.
Analyzing time-varying harmonic requires accurate modeling of power
system. The papers by Carbone et. al. (2000) and Testa et. al (2002) studied
the probabilistic modeling of an industrial system based on IEEE industrial test
system. The research performed harmonic modeling as suggested by IEEE
Harmonic Modeling and Simulation Task Force on supply system including
generator, cables, transformers and loads. Lines and cables were modeled
using R-X model excluding their capacitance due to short distance. The
simulation takes into account of component parameter uncertainty, load
variability, supply configuration and changes in ASD current. Harmonic voltage
distortion analysis was performed using two methods, first simplified procedure
using the product V=ZI to the homologous statistic parameter while the second
method using Ohms Law on all determination of Z and I and utilize Bayes
relation to obtain voltage probability.
24
Comparing this research and the paper above, both agrees on
accounting system impedance and current variability and their correlation to
obtain accurate harmonic voltage distortion. This research is similar in the
sense of taking into account impedance variability but concentrate on different
type network. The paper analyze on industrial plant distribution network which
help customer in analyzing harmonic distortion, while this research analyze on
industrial area distribution network which assist utility to mitigate harmonic
distortion. Factors needed for consideration in modeling distribution network
compare to industrial plant is the line and cable capacitance due to longer
distance. Another one is the load modeling. Load in industrial plant can be
easily identified as resistive, capacitive, inductive or combinations of those.
Modeling is easy following IEEE recommendation. Utility is unable to determine
the configuration within an industrial plant, hence, aggregate load model
recommended by IEEE is required in analysis.
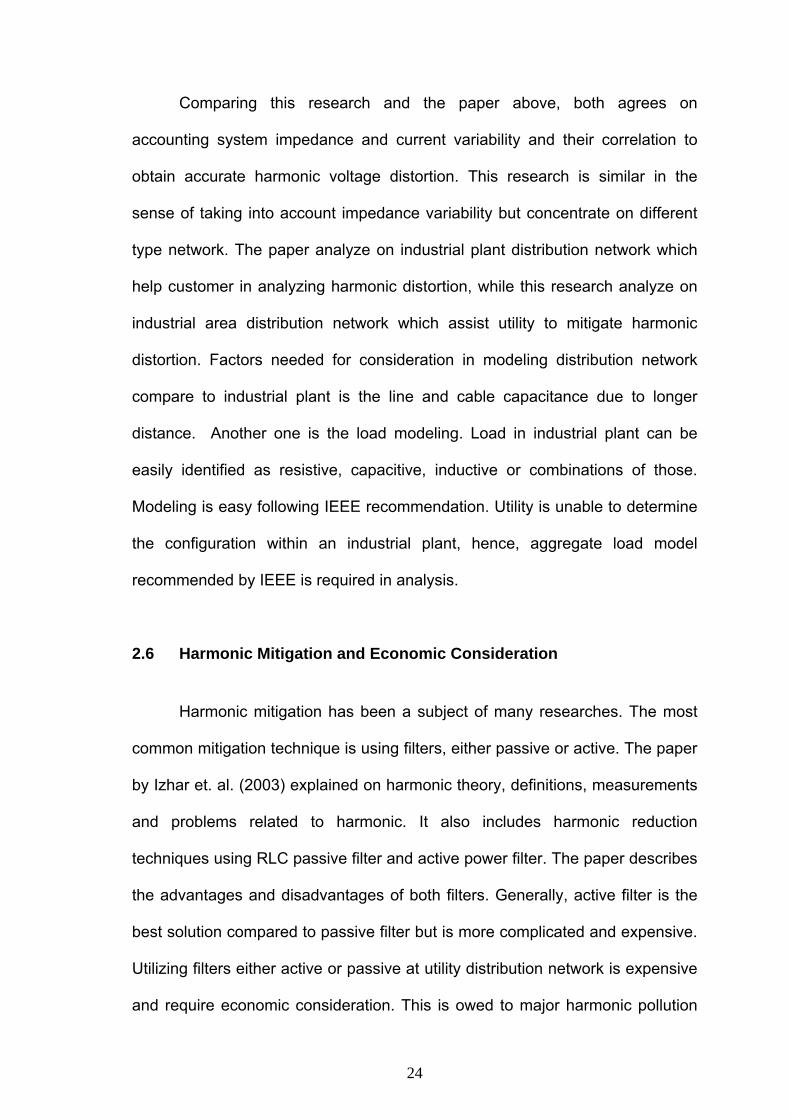
2.6 Harmonic Mitigation and Economic Consideration
Harmonic mitigation has been a subject of many researches. The most
common mitigation technique is using filters, either passive or active. The paper
by Izhar et. al. (2003) explained on harmonic theory, definitions, measurements
and problems related to harmonic. It also includes harmonic reduction
techniques using RLC passive filter and active power filter. The paper describes
the advantages and disadvantages of both filters. Generally, active filter is the
best solution compared to passive filter but is more complicated and expensive.
Utilizing filters either active or passive at utility distribution network is expensive
and require economic consideration. This is owed to major harmonic pollution

![repository.ar-raniry.ac.id...[et al.]. ISBN 978-967-10055-5-2 1. Islam—Borneo-Congresses. 2. Islam and state—Borneo-Congressesa. 1. Mohd Syahiran Abdul Latif, 1976-. 11. Judul](https://img.pdfslide.us/doc/110x75/5fe33df2c443b25a09096813/-et-al-isbn-978-967-10055-5-2-1-islamaborneo-congresses-2-islam-and.jpg)


![47_Presentation [Kashif Latif]](https://img.pdfslide.us/doc/110x75/577d23101a28ab4e1e98e195/47presentation-kashif-latif.jpg)