Embed Size (px)
Citation preview
This is an electronic reprint of the original article.This reprint may differ from the original in pagination and typographic detail.
Powered by TCPDF (www.tcpdf.org)
This material is protected by copyright and other intellectual property rights, and duplication or sale of all or part of any of the repository collections is not permitted, except that material may be duplicated by you for your research use or educational purposes in electronic or print form. You must obtain permission for any other use. Electronic or print copies may not be offered, whether for sale or otherwise to anyone who is not an authorised user.
Moghadam, Saeed Montazeri; Pinchefsky, Elana; Tse, Ilse; Marchi, Viviana; Kohonen, Jukka;Kauppila, Minna; Airaksinen, Manu; Tapani, Karoliina; Nevalainen, Päivi; Hahn, Cecil; Tam,Emily W.Y.; Stevenson, Nathan J.; Vanhatalo, SampsaBuilding an Open Source Classifier for the Neonatal EEG Background
Published in:FRONTIERS IN HUMAN NEUROSCIENCE
DOI:10.3389/fnhum.2021.675154
Published: 31/05/2021
Document VersionPublisher's PDF, also known as Version of record
Published under the following license:CC BY
Please cite the original version:Moghadam, S. M., Pinchefsky, E., Tse, I., Marchi, V., Kohonen, J., Kauppila, M., Airaksinen, M., Tapani, K.,Nevalainen, P., Hahn, C., Tam, E. W. Y., Stevenson, N. J., & Vanhatalo, S. (2021). Building an Open SourceClassifier for the Neonatal EEG Background: A Systematic Feature-Based Approach From Expert Scoring toClinical Visualization. FRONTIERS IN HUMAN NEUROSCIENCE, 15, [675154].https://doi.org/10.3389/fnhum.2021.675154
fnhum-15-675154 May 25, 2021 Time: 14:13 # 1
ORIGINAL RESEARCHpublished: 31 May 2021
doi: 10.3389/fnhum.2021.675154
Edited by:Ren Xu,
Guger Technologies, Austria
Reviewed by:Jiahua Xu,
Otto von Guericke UniversityMagdeburg, Germany
Sumit Raurale,University College Cork, Ireland
*Correspondence:Saeed Montazeri Moghadam
Specialty section:This article was submitted to
Brain-Computer Interfaces,a section of the journal
Frontiers in Human Neuroscience
Received: 03 March 2021Accepted: 30 April 2021Published: 31 May 2021
Citation:Moghadam SM, Pinchefsky E,
Tse I, Marchi V, Kohonen J,Kauppila M, Airaksinen M, Tapani K,
Nevalainen P, Hahn C, Tam EWY,Stevenson NJ and Vanhatalo S (2021)
Building an Open Source Classifierfor the Neonatal EEG Background:
A Systematic Feature-BasedApproach From Expert Scoring
to Clinical Visualization.Front. Hum. Neurosci. 15:675154.doi: 10.3389/fnhum.2021.675154
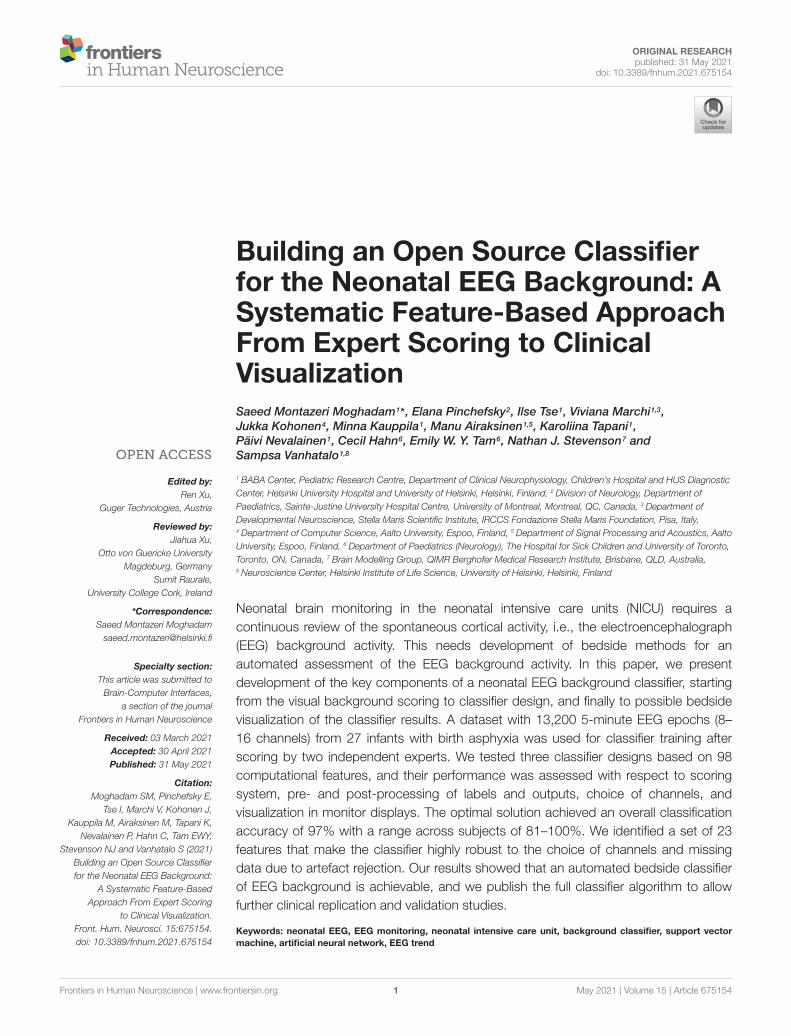
Building an Open Source Classifierfor the Neonatal EEG Background: ASystematic Feature-Based ApproachFrom Expert Scoring to ClinicalVisualizationSaeed Montazeri Moghadam1* , Elana Pinchefsky2, Ilse Tse1, Viviana Marchi1,3,Jukka Kohonen4, Minna Kauppila1, Manu Airaksinen1,5, Karoliina Tapani1,Päivi Nevalainen1, Cecil Hahn6, Emily W. Y. Tam6, Nathan J. Stevenson7 andSampsa Vanhatalo1,8
1 BABA Center, Pediatric Research Centre, Department of Clinical Neurophysiology, Children’s Hospital and HUS DiagnosticCenter, Helsinki University Hospital and University of Helsinki, Helsinki, Finland, 2 Division of Neurology, Department ofPaediatrics, Sainte-Justine University Hospital Centre, University of Montreal, Montreal, QC, Canada, 3 Department ofDevelopmental Neuroscience, Stella Maris Scientific Institute, IRCCS Fondazione Stella Maris Foundation, Pisa, Italy,4 Department of Computer Science, Aalto University, Espoo, Finland, 5 Department of Signal Processing and Acoustics, AaltoUniversity, Espoo, Finland, 6 Department of Paediatrics (Neurology), The Hospital for Sick Children and University of Toronto,Toronto, ON, Canada, 7 Brain Modelling Group, QIMR Berghofer Medical Research Institute, Brisbane, QLD, Australia,8 Neuroscience Center, Helsinki Institute of Life Science, University of Helsinki, Helsinki, Finland
Neonatal brain monitoring in the neonatal intensive care units (NICU) requires acontinuous review of the spontaneous cortical activity, i.e., the electroencephalograph(EEG) background activity. This needs development of bedside methods for anautomated assessment of the EEG background activity. In this paper, we presentdevelopment of the key components of a neonatal EEG background classifier, startingfrom the visual background scoring to classifier design, and finally to possible bedsidevisualization of the classifier results. A dataset with 13,200 5-minute EEG epochs (8–16 channels) from 27 infants with birth asphyxia was used for classifier training afterscoring by two independent experts. We tested three classifier designs based on 98computational features, and their performance was assessed with respect to scoringsystem, pre- and post-processing of labels and outputs, choice of channels, andvisualization in monitor displays. The optimal solution achieved an overall classificationaccuracy of 97% with a range across subjects of 81–100%. We identified a set of 23features that make the classifier highly robust to the choice of channels and missingdata due to artefact rejection. Our results showed that an automated bedside classifierof EEG background is achievable, and we publish the full classifier algorithm to allowfurther clinical replication and validation studies.
Keywords: neonatal EEG, EEG monitoring, neonatal intensive care unit, background classifier, support vectormachine, artificial neural network, EEG trend
Frontiers in Human Neuroscience | www.frontiersin.org 1 May 2021 | Volume 15 | Article 675154
fnhum-15-675154 May 25, 2021 Time: 14:13 # 2
Moghadam et al. Classifier for Neonatal EEG Background
INTRODUCTION
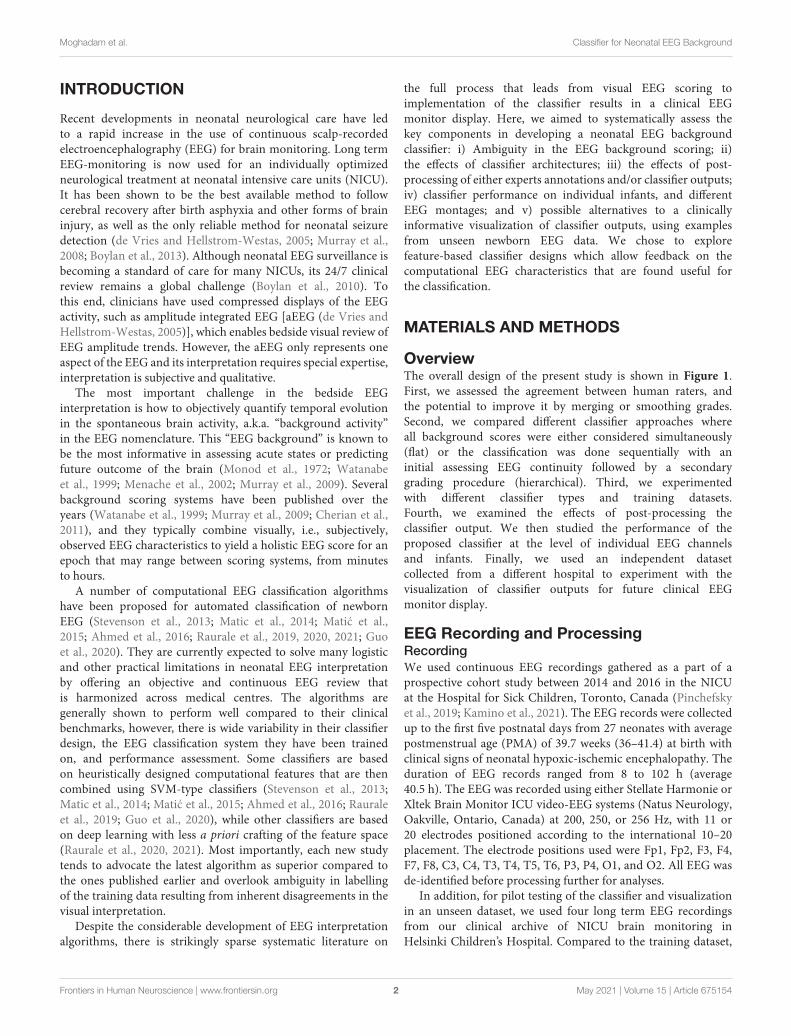
Recent developments in neonatal neurological care have ledto a rapid increase in the use of continuous scalp-recordedelectroencephalography (EEG) for brain monitoring. Long termEEG-monitoring is now used for an individually optimizedneurological treatment at neonatal intensive care units (NICU).It has been shown to be the best available method to followcerebral recovery after birth asphyxia and other forms of braininjury, as well as the only reliable method for neonatal seizuredetection (de Vries and Hellstrom-Westas, 2005; Murray et al.,2008; Boylan et al., 2013). Although neonatal EEG surveillance isbecoming a standard of care for many NICUs, its 24/7 clinicalreview remains a global challenge (Boylan et al., 2010). Tothis end, clinicians have used compressed displays of the EEGactivity, such as amplitude integrated EEG [aEEG (de Vries andHellstrom-Westas, 2005)], which enables bedside visual review ofEEG amplitude trends. However, the aEEG only represents oneaspect of the EEG and its interpretation requires special expertise,interpretation is subjective and qualitative.
The most important challenge in the bedside EEGinterpretation is how to objectively quantify temporal evolutionin the spontaneous brain activity, a.k.a. “background activity”in the EEG nomenclature. This “EEG background” is known tobe the most informative in assessing acute states or predictingfuture outcome of the brain (Monod et al., 1972; Watanabeet al., 1999; Menache et al., 2002; Murray et al., 2009). Severalbackground scoring systems have been published over theyears (Watanabe et al., 1999; Murray et al., 2009; Cherian et al.,2011), and they typically combine visually, i.e., subjectively,observed EEG characteristics to yield a holistic EEG score for anepoch that may range between scoring systems, from minutesto hours.
A number of computational EEG classification algorithmshave been proposed for automated classification of newbornEEG (Stevenson et al., 2013; Matic et al., 2014; Matic et al.,2015; Ahmed et al., 2016; Raurale et al., 2019, 2020, 2021; Guoet al., 2020). They are currently expected to solve many logisticand other practical limitations in neonatal EEG interpretationby offering an objective and continuous EEG review thatis harmonized across medical centres. The algorithms aregenerally shown to perform well compared to their clinicalbenchmarks, however, there is wide variability in their classifierdesign, the EEG classification system they have been trainedon, and performance assessment. Some classifiers are basedon heuristically designed computational features that are thencombined using SVM-type classifiers (Stevenson et al., 2013;Matic et al., 2014; Matic et al., 2015; Ahmed et al., 2016; Rauraleet al., 2019; Guo et al., 2020), while other classifiers are basedon deep learning with less a priori crafting of the feature space(Raurale et al., 2020, 2021). Most importantly, each new studytends to advocate the latest algorithm as superior compared tothe ones published earlier and overlook ambiguity in labellingof the training data resulting from inherent disagreements in thevisual interpretation.
Despite the considerable development of EEG interpretationalgorithms, there is strikingly sparse systematic literature on
the full process that leads from visual EEG scoring toimplementation of the classifier results in a clinical EEGmonitor display. Here, we aimed to systematically assess thekey components in developing a neonatal EEG backgroundclassifier: i) Ambiguity in the EEG background scoring; ii)the effects of classifier architectures; iii) the effects of post-processing of either experts annotations and/or classifier outputs;iv) classifier performance on individual infants, and differentEEG montages; and v) possible alternatives to a clinicallyinformative visualization of classifier outputs, using examplesfrom unseen newborn EEG data. We chose to explorefeature-based classifier designs which allow feedback on thecomputational EEG characteristics that are found useful forthe classification.
MATERIALS AND METHODS
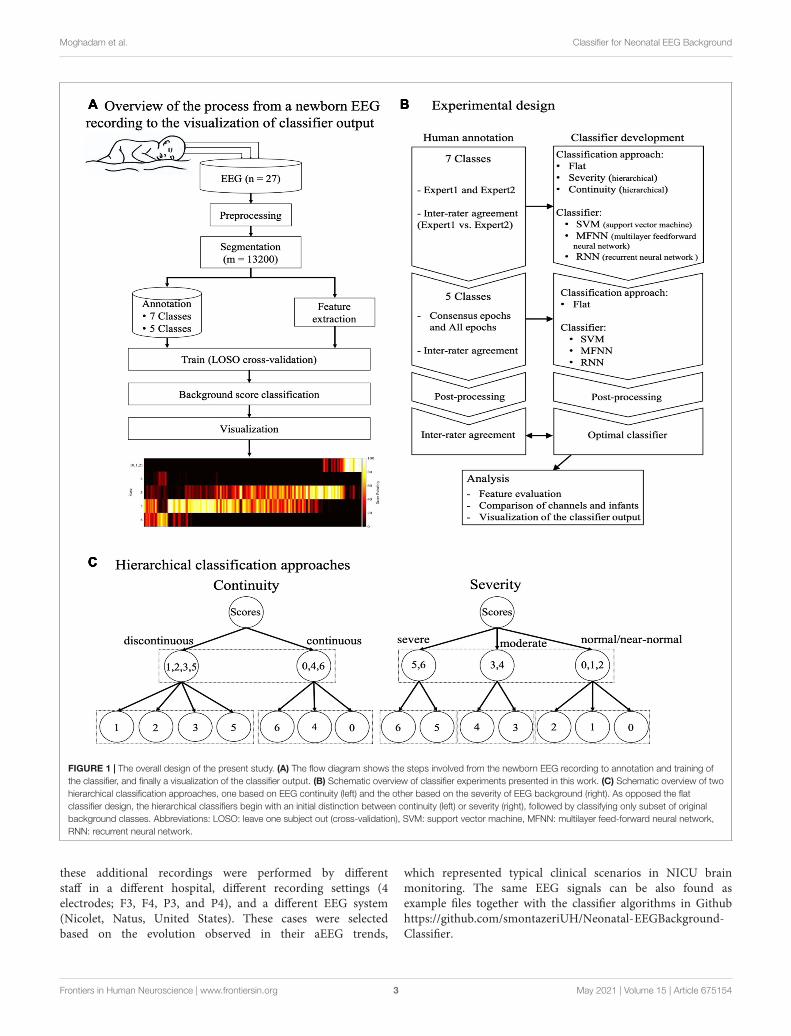
OverviewThe overall design of the present study is shown in Figure 1.First, we assessed the agreement between human raters, andthe potential to improve it by merging or smoothing grades.Second, we compared different classifier approaches whereall background scores were either considered simultaneously(flat) or the classification was done sequentially with aninitial assessing EEG continuity followed by a secondarygrading procedure (hierarchical). Third, we experimentedwith different classifier types and training datasets.Fourth, we examined the effects of post-processing theclassifier output. We then studied the performance of theproposed classifier at the level of individual EEG channelsand infants. Finally, we used an independent datasetcollected from a different hospital to experiment with thevisualization of classifier outputs for future clinical EEGmonitor display.
EEG Recording and ProcessingRecordingWe used continuous EEG recordings gathered as a part of aprospective cohort study between 2014 and 2016 in the NICUat the Hospital for Sick Children, Toronto, Canada (Pinchefskyet al., 2019; Kamino et al., 2021). The EEG records were collectedup to the first five postnatal days from 27 neonates with averagepostmenstrual age (PMA) of 39.7 weeks (36–41.4) at birth withclinical signs of neonatal hypoxic-ischemic encephalopathy. Theduration of EEG records ranged from 8 to 102 h (average40.5 h). The EEG was recorded using either Stellate Harmonie orXltek Brain Monitor ICU video-EEG systems (Natus Neurology,Oakville, Ontario, Canada) at 200, 250, or 256 Hz, with 11 or20 electrodes positioned according to the international 10–20placement. The electrode positions used were Fp1, Fp2, F3, F4,F7, F8, C3, C4, T3, T4, T5, T6, P3, P4, O1, and O2. All EEG wasde-identified before processing further for analyses.
In addition, for pilot testing of the classifier and visualizationin an unseen dataset, we used four long term EEG recordingsfrom our clinical archive of NICU brain monitoring inHelsinki Children’s Hospital. Compared to the training dataset,
Frontiers in Human Neuroscience | www.frontiersin.org 2 May 2021 | Volume 15 | Article 675154
fnhum-15-675154 May 25, 2021 Time: 14:13 # 3
Moghadam et al. Classifier for Neonatal EEG Background
FIGURE 1 | The overall design of the present study. (A) The flow diagram shows the steps involved from the newborn EEG recording to annotation and training ofthe classifier, and finally a visualization of the classifier output. (B) Schematic overview of classifier experiments presented in this work. (C) Schematic overview of twohierarchical classification approaches, one based on EEG continuity (left) and the other based on the severity of EEG background (right). As opposed the flatclassifier design, the hierarchical classifiers begin with an initial distinction between continuity (left) or severity (right), followed by classifying only subset of originalbackground classes. Abbreviations: LOSO: leave one subject out (cross-validation), SVM: support vector machine, MFNN: multilayer feed-forward neural network,RNN: recurrent neural network.
these additional recordings were performed by differentstaff in a different hospital, different recording settings (4electrodes; F3, F4, P3, and P4), and a different EEG system(Nicolet, Natus, United States). These cases were selectedbased on the evolution observed in their aEEG trends,
which represented typical clinical scenarios in NICU brainmonitoring. The same EEG signals can be also found asexample files together with the classifier algorithms in Githubhttps://github.com/smontazeriUH/Neonatal-EEGBackground-Classifier.
Frontiers in Human Neuroscience | www.frontiersin.org 3 May 2021 | Volume 15 | Article 675154
fnhum-15-675154 May 25, 2021 Time: 14:13 # 4
Moghadam et al. Classifier for Neonatal EEG Background
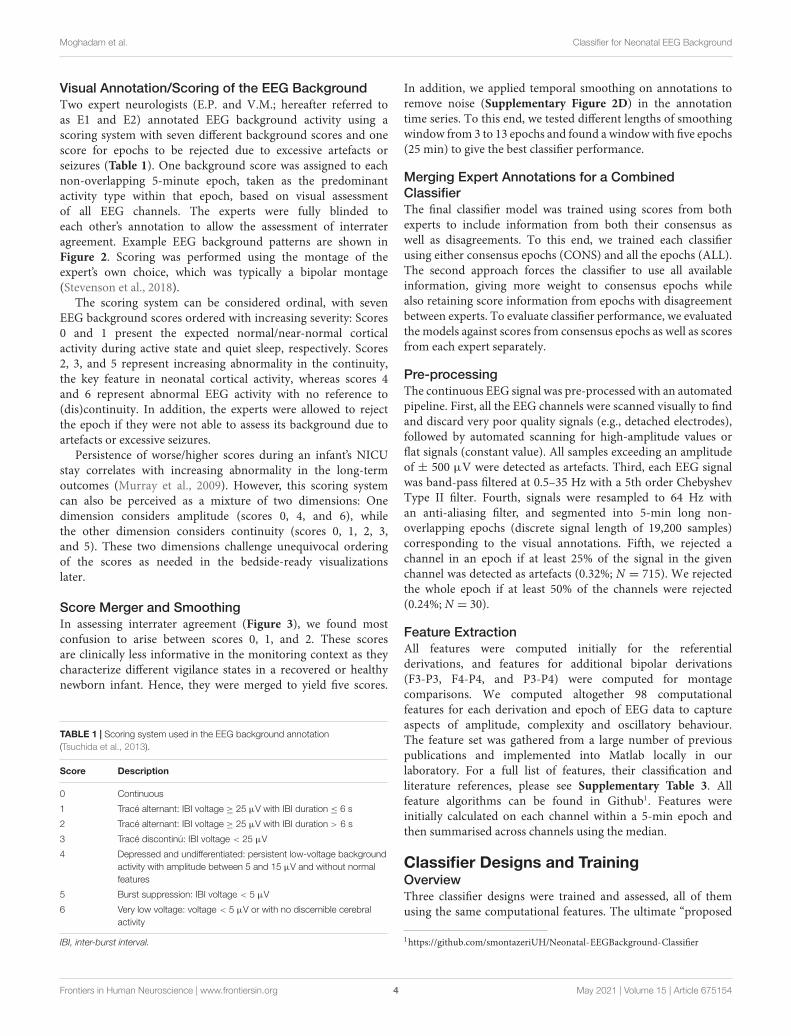
Visual Annotation/Scoring of the EEG BackgroundTwo expert neurologists (E.P. and V.M.; hereafter referred toas E1 and E2) annotated EEG background activity using ascoring system with seven different background scores and onescore for epochs to be rejected due to excessive artefacts orseizures (Table 1). One background score was assigned to eachnon-overlapping 5-minute epoch, taken as the predominantactivity type within that epoch, based on visual assessmentof all EEG channels. The experts were fully blinded toeach other’s annotation to allow the assessment of interrateragreement. Example EEG background patterns are shown inFigure 2. Scoring was performed using the montage of theexpert’s own choice, which was typically a bipolar montage(Stevenson et al., 2018).
The scoring system can be considered ordinal, with sevenEEG background scores ordered with increasing severity: Scores0 and 1 present the expected normal/near-normal corticalactivity during active state and quiet sleep, respectively. Scores2, 3, and 5 represent increasing abnormality in the continuity,the key feature in neonatal cortical activity, whereas scores 4and 6 represent abnormal EEG activity with no reference to(dis)continuity. In addition, the experts were allowed to rejectthe epoch if they were not able to assess its background due toartefacts or excessive seizures.
Persistence of worse/higher scores during an infant’s NICUstay correlates with increasing abnormality in the long-termoutcomes (Murray et al., 2009). However, this scoring systemcan also be perceived as a mixture of two dimensions: Onedimension considers amplitude (scores 0, 4, and 6), whilethe other dimension considers continuity (scores 0, 1, 2, 3,and 5). These two dimensions challenge unequivocal orderingof the scores as needed in the bedside-ready visualizationslater.
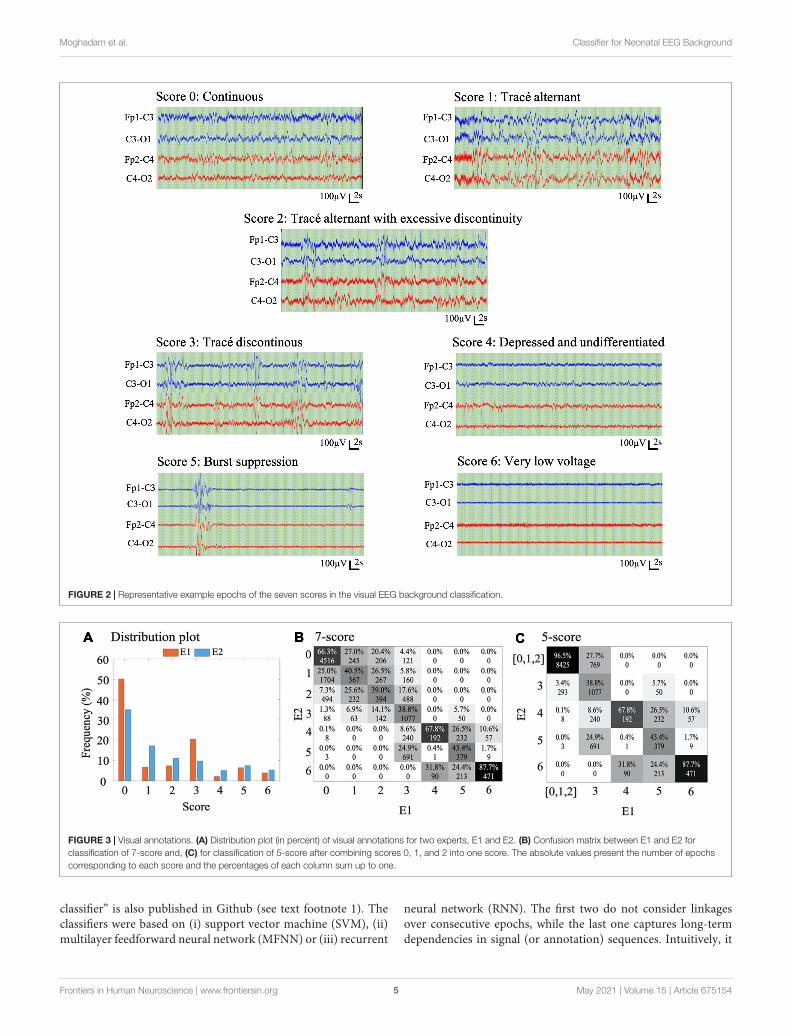
Score Merger and SmoothingIn assessing interrater agreement (Figure 3), we found mostconfusion to arise between scores 0, 1, and 2. These scoresare clinically less informative in the monitoring context as theycharacterize different vigilance states in a recovered or healthynewborn infant. Hence, they were merged to yield five scores.
TABLE 1 | Scoring system used in the EEG background annotation(Tsuchida et al., 2013).
Score Description
0 Continuous
1 Tracé alternant: IBI voltage ≥ 25 µV with IBI duration ≤ 6 s
2 Tracé alternant: IBI voltage ≥ 25 µV with IBI duration > 6 s
3 Tracé discontinú: IBI voltage < 25 µV
4 Depressed and undifferentiated: persistent low-voltage backgroundactivity with amplitude between 5 and 15 µV and without normalfeatures
5 Burst suppression: IBI voltage < 5 µV
6 Very low voltage: voltage < 5 µV or with no discernible cerebralactivity
IBI, inter-burst interval.
In addition, we applied temporal smoothing on annotations toremove noise (Supplementary Figure 2D) in the annotationtime series. To this end, we tested different lengths of smoothingwindow from 3 to 13 epochs and found a window with five epochs(25 min) to give the best classifier performance.
Merging Expert Annotations for a CombinedClassifierThe final classifier model was trained using scores from bothexperts to include information from both their consensus aswell as disagreements. To this end, we trained each classifierusing either consensus epochs (CONS) and all the epochs (ALL).The second approach forces the classifier to use all availableinformation, giving more weight to consensus epochs whilealso retaining score information from epochs with disagreementbetween experts. To evaluate classifier performance, we evaluatedthe models against scores from consensus epochs as well as scoresfrom each expert separately.
Pre-processingThe continuous EEG signal was pre-processed with an automatedpipeline. First, all the EEG channels were scanned visually to findand discard very poor quality signals (e.g., detached electrodes),followed by automated scanning for high-amplitude values orflat signals (constant value). All samples exceeding an amplitudeof ± 500 µV were detected as artefacts. Third, each EEG signalwas band-pass filtered at 0.5–35 Hz with a 5th order ChebyshevType II filter. Fourth, signals were resampled to 64 Hz withan anti-aliasing filter, and segmented into 5-min long non-overlapping epochs (discrete signal length of 19,200 samples)corresponding to the visual annotations. Fifth, we rejected achannel in an epoch if at least 25% of the signal in the givenchannel was detected as artefacts (0.32%; N = 715). We rejectedthe whole epoch if at least 50% of the channels were rejected(0.24%; N = 30).
Feature ExtractionAll features were computed initially for the referentialderivations, and features for additional bipolar derivations(F3-P3, F4-P4, and P3-P4) were computed for montagecomparisons. We computed altogether 98 computationalfeatures for each derivation and epoch of EEG data to captureaspects of amplitude, complexity and oscillatory behaviour.The feature set was gathered from a large number of previouspublications and implemented into Matlab locally in ourlaboratory. For a full list of features, their classification andliterature references, please see Supplementary Table 3. Allfeature algorithms can be found in Github1. Features wereinitially calculated on each channel within a 5-min epoch andthen summarised across channels using the median.
Classifier Designs and TrainingOverviewThree classifier designs were trained and assessed, all of themusing the same computational features. The ultimate “proposed
1https://github.com/smontazeriUH/Neonatal-EEGBackground-Classifier
Frontiers in Human Neuroscience | www.frontiersin.org 4 May 2021 | Volume 15 | Article 675154
fnhum-15-675154 May 25, 2021 Time: 14:13 # 5
Moghadam et al. Classifier for Neonatal EEG Background
FIGURE 2 | Representative example epochs of the seven scores in the visual EEG background classification.
FIGURE 3 | Visual annotations. (A) Distribution plot (in percent) of visual annotations for two experts, E1 and E2. (B) Confusion matrix between E1 and E2 forclassification of 7-score and, (C) for classification of 5-score after combining scores 0, 1, and 2 into one score. The absolute values present the number of epochscorresponding to each score and the percentages of each column sum up to one.
classifier” is also published in Github (see text footnote 1). Theclassifiers were based on (i) support vector machine (SVM), (ii)multilayer feedforward neural network (MFNN) or (iii) recurrent
neural network (RNN). The first two do not consider linkagesover consecutive epochs, while the last one captures long-termdependencies in signal (or annotation) sequences. Intuitively, it
Frontiers in Human Neuroscience | www.frontiersin.org 5 May 2021 | Volume 15 | Article 675154
fnhum-15-675154 May 25, 2021 Time: 14:13 # 6
Moghadam et al. Classifier for Neonatal EEG Background
is reasonable to expect that some level of temporal correlationexists in neonatal EEG that is characterized by gradual evolutionrather than abrupt changes of EEG states. The common clinicalpractice of EEG scoring is also trained to favour smooth changesin background scores, which implicitly introduces temporalcorrelation to the score sequences. In addition, we tested whethermerging annotations to a smaller number of scores wouldimprove classifier performance. In all classifier builds, the inputfeatures were normalized at each training iteration to z-scores.Classification performance was assessed using leave-one-subject-out (LOSO) cross-validation which splits the data into train andtest sets based on the subjects without any overlap betweentraining and testing data. In LOSO cross-validation each fold isone subject’s data.
SVM ClassifierThe SVM was implemented using the fitcecoc function inMatlab (version R2019a). This function trains the multiclasserror-correcting output codes (ECOC) model using K(K − 1)/2binary SVMs. These binary SVMs use the one-vs-one codingdesign, where K is the number of unique class labels. Weused linear kernel for SVMs since in initial testing we foundno significant improvement for other kernels over the linearkernel. Hyperparameters of the SVM were optimized by Bayesianoptimization within an internal fivefold cross-validation.
MFNN ClassifierA multilayer feed-forward neural network (MFNN) wasdeveloped with linear input layer and two hidden layers andoutput layer with hyperbolic tangent sigmoid transfer functions(Supplementary Figure 1). The neurons in adjacent layers arefully connected with weights and biases while the neurons inthe same layer are not interlinked. The optimum number ofhidden nodes is very difficult to determine and needs extensiveexperience. In this work, it was found that by choosing thenumber of hidden nodes as shown in Supplementary Figure 1,accurate results could be obtained. Classification output for eachinput sample corresponds to the maximum valued label afterusing the softmax function of the output of the MFNN.
Backpropagation learning (BP) with the stochastic gradientdescent algorithm was used for the supervised training processof the MFNN. In order to prevent the classifier from overfitting,we kept 10% of the data in the train folds of LOSO aside fromtraining to use as an inner validation set. Weights were updatedin batch mode with a dynamic set of learning rate (LR) and aconstant momentum factor (MF). Employing MF would help thetraining procedure escape local minima and reduce the likelihoodof instability (Basheer and Hajmeer, 2000). LR value at the firstiteration of the training was set to 0.1 and after a set of 6,000training iterations, it was scheduled to be reduced by 75%. MFvalue was set to a constant value of 0.8. The training processterminated after 120 000 iterations or if the Root Mean SquareError (RMSE) on the training pattern was less than 1× 10⁻³.
RNN ClassifierThe RNN model was developed based on the proposed MFNN.The second hidden layer of the proposed MFNN is connected
to one feed-backward layer characterized by one step time delayas demonstrated in Supplementary Figure 1. The idea of usingRNN was to consider information lying in the sequence of epochssuch that the previous epoch provides useful information for theclassification of the current epoch. Real-Time Recurrent Learning(RTRL) was used for supervised training of the RNN (Williamsand Zipser, 1989). In RTRL learning, the weights at iteration Kare modified by the errors back propagated from iteration K+1through the recurrent layer. Weights in the forward path of RNNinitialized to the weights from trained MFNN classifiers (usedas pre-trained weight initialization) and weights in the backwardpath initialized to small random numbers. During the training, allthe layers fine-tuned with a very small LR set for each unique classof output independently based on the distribution of that class.
Classification ApproachesWe tested both flat and hierarchical classification approaches. Ina flat classification approach, no inherent hierarchy between thescores is considered and the output relies on a single decisionof the classifier including all the scores. The flat classificationwas tested with all the three types of classifiers (SVM, MFNN,and RNN). In a hierarchical approach, in turn, the seven initialEEG scores are grouped into three new scores based on theirphenomenological properties or clinical inference. To this end,we used two strategies illustrated in Figure 1C. The first strategywas grouping the scores according to “continuity” of the signal,and the second strategy was grouping the scores according to theclinical inference of “severity” of the score (normal, moderate,and severe). Using hierarchical approaches disrupts the sequenceof epochs while the RNN requires ordered sequential inputs.Therefore, hierarchical approaches are only applied to SVMand MFNN classifiers and only a flat classification approach isimplemented for RNN. We also used the Synthetic MinorityOversampling Technique (SMOTE), with k = 10, to compensatefor the imbalanced distribution of scores (Chawla et al., 2002).
Post-processing and Feature EvaluationClassifier performance can be improved significantly bypostprocessing (Ansari et al., 2016). A random misclassification,seen as single epoch spikes in the score time series(Supplementary Figure 2D) could be tempered by applyinga temporal smoothing that aims to emulate the relativelysmooth (tens of minutes to hours) state transitions in thereal-world situations.
Features were evaluated using feature selection methods tofind out their relative impact of each feature for classificationaccuracy. We scanned through four different artefact thresholds(0, 10, 25, and 50%) to also find out whether features aredifferentially sensitive to increasing level of artefacts in theEEG data. The Genetic Algorithm was utilized in a wrapperapproach to search for the optimal feature subset (John et al.,1994). This algorithm is considered effective and powerful globalsearch tool for finding feature subsets from large-scale andpoorly understood feature spaces (Siedlecki and Sklansky, 1993;Emmanouilidis et al., 2000; Kudo and Sklansky, 2000; Oliveiraet al., 2003). The wrapper approach operates in the context ofthe learning model and involves the computational overhead
Frontiers in Human Neuroscience | www.frontiersin.org 6 May 2021 | Volume 15 | Article 675154
fnhum-15-675154 May 25, 2021 Time: 14:13 # 7
Moghadam et al. Classifier for Neonatal EEG Background
because of evaluating each candidate feature subsets by model.In our analysis, each feature selection searched between 5,000combinations of different feature subsets, where every subsethas different numbers of features. The following settings wereapplied for the feature selection: (1) population size is 100 setseach containing different numbers of features. Thus, each featurecan be selected a maximum of 100 times; (2) two-point crossoverrate is 0.6; (3) mutation rate is 0.1; (4) stopping conditionis 50 generations.
Performance Measures and Statistical AnalysisThe performance of the classification was assessed usingpercentage of accuracy and F1-score metrics for macro andweighted averages (M-Acc, M-F1 score, W-Acc, and W-F1 score),across all infants (LOSO-folds). The 95% confidence interval(CI95%) from bootstrap resampling (nresampling = 1,000) was usedto declare the statistical significance in accuracy and Cohen’s κ
between classifiers.The output of each trained classifier was compared to the
annotations of the human experts by measuring inter-rateragreement using Cohen’s κ. The classifiers trained on thesmoothed combined scores which outperform other strategieswere compared to the annotations of the human experts bymeasuring the pairwise κ. The overall agreement between humanannotation (E1 and E2) and a composite of a human expert and aclassifier was evaluated to determine whether the predicted scoresare non-inferior to the human expert considering the subjectivityof human annotation.
RESULTS
Visual Annotations and InterraterAgreementsThe final annotation dataset from both experts consisted of13,200 epochs (approximately 1,100 h) of EEG. As expected, thedistribution of scores was somewhat skewed toward the lowervalue scores that indicate better brain function (Figure 3A). Thenumber of epochs rejected as ungradable by E1 and E2 were 384and 1,313, respectively.
The inter-rater agreement using all seven background scoreswas moderate (κ = 0.41). A closer inspection of the confusionmatrix Figure 3B between E1 and E2 shows two clusters ofdisagreements: there was more overlap within the group of scoresreferring to normal or near normal EEG (scores 0–2) as wellas the group of scores referring to more severe EEG (scores3–6). On top of that, there was also an overall tendency ofone expert (E2) to assign lower background scores comparedto the other expert (p < 0.001, paired t-test). This suggestsambiguity among neighbouring scores, which could be handledby merging such scores for a better classification performance.To this end, we considered the clinical interpretation of eachsubscore: Since the normal/subnormal scores (0, 1, and 2) all havethe same overall clinical interpretation of favourable recovery(Murray et al., 2009), we decided to create an alternative 5-score system by merging them into one score. Indeed, the new5-score scoring gave a considerably higher interrater agreement
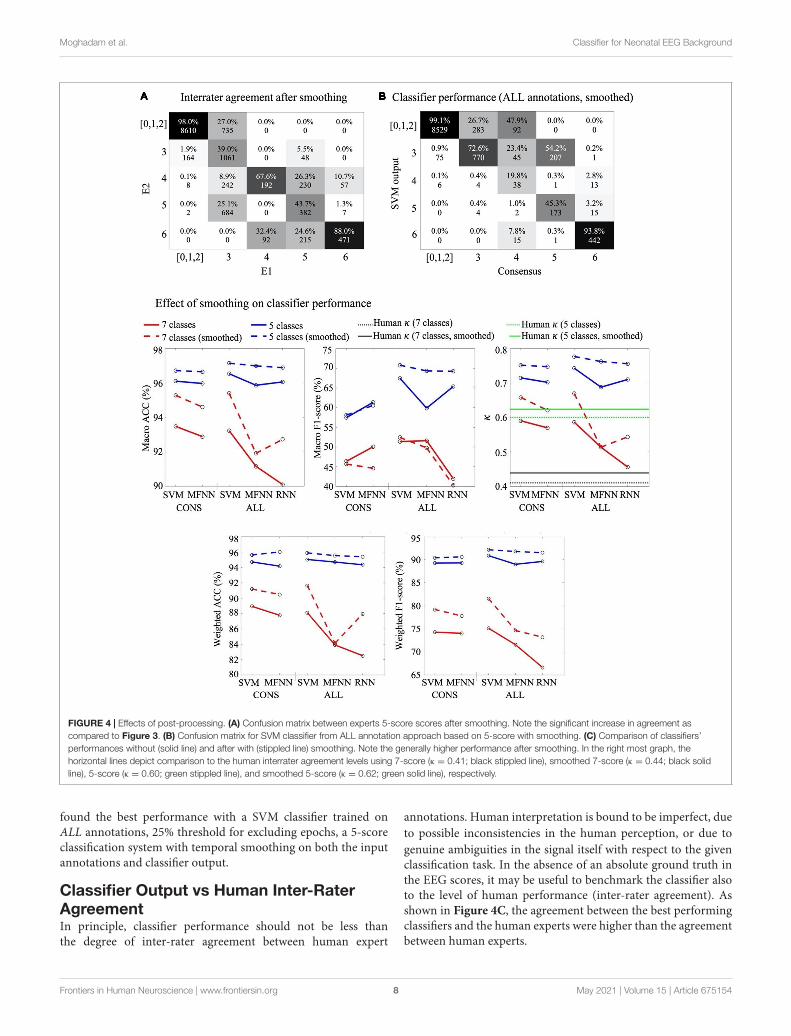
of κ = 0.60. In the following, we therefore decided to trainand test each classifier for both the original 7-score and therevised 5-score. In addition, the annotations were smoothed witha moving window of five epochs (Supplementary Figure 2D foran example) which increases the inter-rater agreement (κ = 0.60to 0.62) (Figure 4A).
Optimal ClassifierFlat vs Hierarchical Classification ApproachesThe results comparing different classifier approaches aredetailed in Supplementary Table 1. Results show no significantdifferences in performance between the flat approach andany of the hierarchical approaches (bootstrap average classaccuracy: SVM–Flat CI95%: 87.1–87.6; Continuity CI95%: 86.8–87.2; Severity CI95%: 86.4–87.1). We, therefore, decided toonly use the flat approach in further experiments as it is lesscomputationally intensive.
Merging Expert Annotations Into a Unified ClassifierWe trained and tested classifiers by using either consensus epochsalone (CONS), or by using all annotations (ALL). The latter wasaccomplished by training the classifier twice, using both sets ofannotations, hence considering disagreement labels as well, butgiving twice the weight to consensus labels. The first approachlimits the dataset to epochs with consensus only (total N = 7396;on average 7,122 in each training fold), and consequently disruptsthe sequence of epochs, precluding use of RNN classifiers.
In general, the classifier performance was higher againstconsensus annotations, irrespective of whether the classifier wasinitially trained using CONS annotations vs ALL annotations(Supplementary Figure 2). The performance of SVM and MFNNclassifiers was mostly comparable, however, MFNN performedbetter in terms of macro f1-score. The RNN classifier wasgenerally poorer, which is likely due to the sensitivity of ANNsto data conflicts (Versaggi, 1995; Raggad, 1996) in the multi-raterannotations (Supplementary Figure 2).
Post-processing With Score-Merger and SmoothingThe confusion matrices of both expert annotations (Figure 3)and classifier outputs (Supplementary Figure 2) suggest thatthe majority of ambiguity arises from neighbouring scores. Inparticular, there are also clinical reasons to combine at leastthe first three (0,1,2) scores with shared clinical informationvalue in the monitoring context. To this end, we measuredchanges in classification accuracy from adopting a 5-score scoringsystem (m = 13200 available epochs, Figure 3). Comparisonof a range of smoothing windows indicated the best classifierperformance when using median smoothing with a window ofseven consecutive epochs (Figure 4). The overall performance ofall classifiers improved considerably when reducing the numberof scores and applying temporal smoothing.
The Proposed Optimal ClassifierThe results from the SVM, MFNN and RNN classifiers trained onALL annotations were mostly comparable, and generally betterthan classifiers trained with CONS annotations (almost 10% interms of f1-score, Figure 4 and Supplementary Table 2). We
Frontiers in Human Neuroscience | www.frontiersin.org 7 May 2021 | Volume 15 | Article 675154
fnhum-15-675154 May 25, 2021 Time: 14:13 # 8
Moghadam et al. Classifier for Neonatal EEG Background
FIGURE 4 | Effects of post-processing. (A) Confusion matrix between experts 5-score scores after smoothing. Note the significant increase in agreement ascompared to Figure 3. (B) Confusion matrix for SVM classifier from ALL annotation approach based on 5-score with smoothing. (C) Comparison of classifiers’performances without (solid line) and after with (stippled line) smoothing. Note the generally higher performance after smoothing. In the right most graph, thehorizontal lines depict comparison to the human interrater agreement levels using 7-score (κ = 0.41; black stippled line), smoothed 7-score (κ = 0.44; black solidline), 5-score (κ = 0.60; green stippled line), and smoothed 5-score (κ = 0.62; green solid line), respectively.
found the best performance with a SVM classifier trained onALL annotations, 25% threshold for excluding epochs, a 5-scoreclassification system with temporal smoothing on both the inputannotations and classifier output.
Classifier Output vs Human Inter-RaterAgreementIn principle, classifier performance should not be less thanthe degree of inter-rater agreement between human expert
annotations. Human interpretation is bound to be imperfect, dueto possible inconsistencies in the human perception, or due togenuine ambiguities in the signal itself with respect to the givenclassification task. In the absence of an absolute ground truth inthe EEG scores, it may be useful to benchmark the classifier alsoto the level of human performance (inter-rater agreement). Asshown in Figure 4C, the agreement between the best performingclassifiers and the human experts were higher than the agreementbetween human experts.
Frontiers in Human Neuroscience | www.frontiersin.org 8 May 2021 | Volume 15 | Article 675154
fnhum-15-675154 May 25, 2021 Time: 14:13 # 9
Moghadam et al. Classifier for Neonatal EEG Background
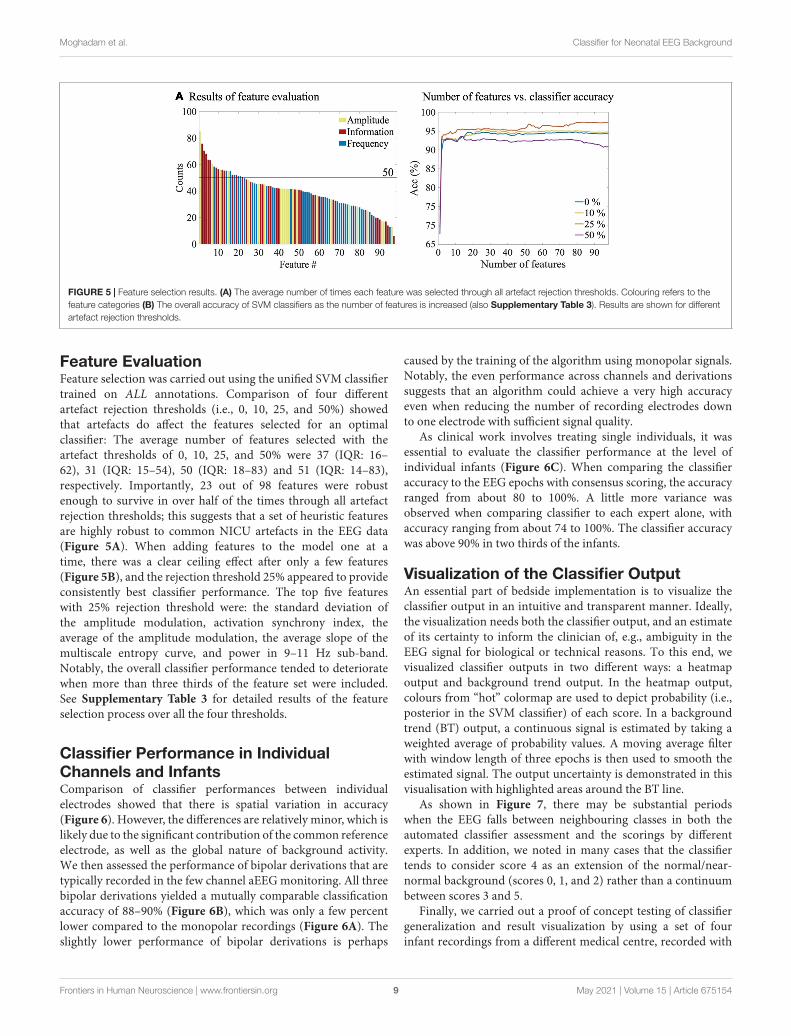
FIGURE 5 | Feature selection results. (A) The average number of times each feature was selected through all artefact rejection thresholds. Colouring refers to thefeature categories (B) The overall accuracy of SVM classifiers as the number of features is increased (also Supplementary Table 3). Results are shown for differentartefact rejection thresholds.
Feature EvaluationFeature selection was carried out using the unified SVM classifiertrained on ALL annotations. Comparison of four differentartefact rejection thresholds (i.e., 0, 10, 25, and 50%) showedthat artefacts do affect the features selected for an optimalclassifier: The average number of features selected with theartefact thresholds of 0, 10, 25, and 50% were 37 (IQR: 16–62), 31 (IQR: 15–54), 50 (IQR: 18–83) and 51 (IQR: 14–83),respectively. Importantly, 23 out of 98 features were robustenough to survive in over half of the times through all artefactrejection thresholds; this suggests that a set of heuristic featuresare highly robust to common NICU artefacts in the EEG data(Figure 5A). When adding features to the model one at atime, there was a clear ceiling effect after only a few features(Figure 5B), and the rejection threshold 25% appeared to provideconsistently best classifier performance. The top five featureswith 25% rejection threshold were: the standard deviation ofthe amplitude modulation, activation synchrony index, theaverage of the amplitude modulation, the average slope of themultiscale entropy curve, and power in 9–11 Hz sub-band.Notably, the overall classifier performance tended to deterioratewhen more than three thirds of the feature set were included.See Supplementary Table 3 for detailed results of the featureselection process over all the four thresholds.
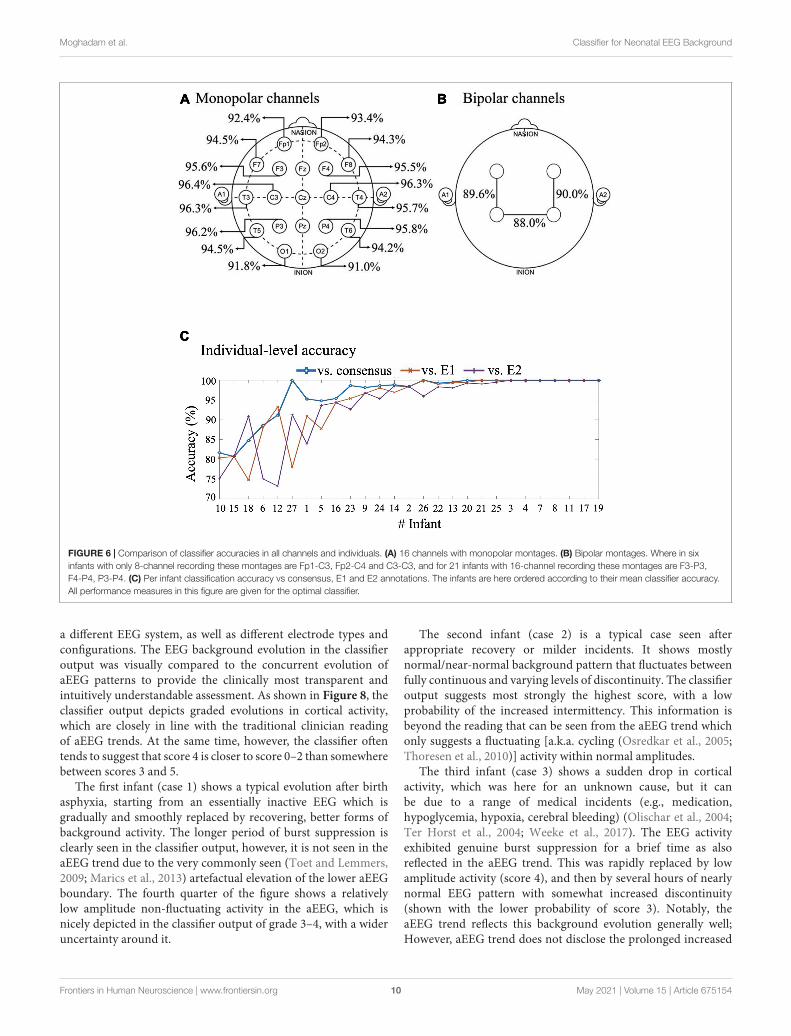
Classifier Performance in IndividualChannels and InfantsComparison of classifier performances between individualelectrodes showed that there is spatial variation in accuracy(Figure 6). However, the differences are relatively minor, which islikely due to the significant contribution of the common referenceelectrode, as well as the global nature of background activity.We then assessed the performance of bipolar derivations that aretypically recorded in the few channel aEEG monitoring. All threebipolar derivations yielded a mutually comparable classificationaccuracy of 88–90% (Figure 6B), which was only a few percentlower compared to the monopolar recordings (Figure 6A). Theslightly lower performance of bipolar derivations is perhaps
caused by the training of the algorithm using monopolar signals.Notably, the even performance across channels and derivationssuggests that an algorithm could achieve a very high accuracyeven when reducing the number of recording electrodes downto one electrode with sufficient signal quality.
As clinical work involves treating single individuals, it wasessential to evaluate the classifier performance at the level ofindividual infants (Figure 6C). When comparing the classifieraccuracy to the EEG epochs with consensus scoring, the accuracyranged from about 80 to 100%. A little more variance wasobserved when comparing classifier to each expert alone, withaccuracy ranging from about 74 to 100%. The classifier accuracywas above 90% in two thirds of the infants.
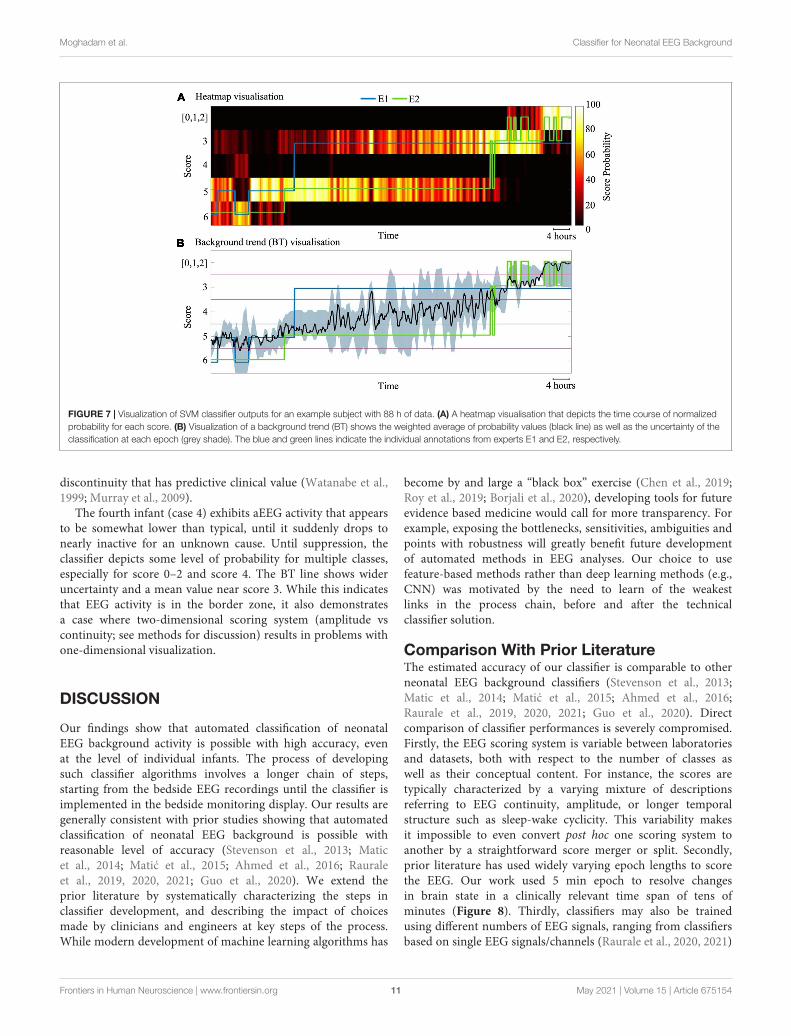
Visualization of the Classifier OutputAn essential part of bedside implementation is to visualize theclassifier output in an intuitive and transparent manner. Ideally,the visualization needs both the classifier output, and an estimateof its certainty to inform the clinician of, e.g., ambiguity in theEEG signal for biological or technical reasons. To this end, wevisualized classifier outputs in two different ways: a heatmapoutput and background trend output. In the heatmap output,colours from “hot” colormap are used to depict probability (i.e.,posterior in the SVM classifier) of each score. In a backgroundtrend (BT) output, a continuous signal is estimated by taking aweighted average of probability values. A moving average filterwith window length of three epochs is then used to smooth theestimated signal. The output uncertainty is demonstrated in thisvisualisation with highlighted areas around the BT line.
As shown in Figure 7, there may be substantial periodswhen the EEG falls between neighbouring classes in both theautomated classifier assessment and the scorings by differentexperts. In addition, we noted in many cases that the classifiertends to consider score 4 as an extension of the normal/near-normal background (scores 0, 1, and 2) rather than a continuumbetween scores 3 and 5.
Finally, we carried out a proof of concept testing of classifiergeneralization and result visualization by using a set of fourinfant recordings from a different medical centre, recorded with
Frontiers in Human Neuroscience | www.frontiersin.org 9 May 2021 | Volume 15 | Article 675154
fnhum-15-675154 May 25, 2021 Time: 14:13 # 10
Moghadam et al. Classifier for Neonatal EEG Background
FIGURE 6 | Comparison of classifier accuracies in all channels and individuals. (A) 16 channels with monopolar montages. (B) Bipolar montages. Where in sixinfants with only 8-channel recording these montages are Fp1-C3, Fp2-C4 and C3-C3, and for 21 infants with 16-channel recording these montages are F3-P3,F4-P4, P3-P4. (C) Per infant classification accuracy vs consensus, E1 and E2 annotations. The infants are here ordered according to their mean classifier accuracy.All performance measures in this figure are given for the optimal classifier.
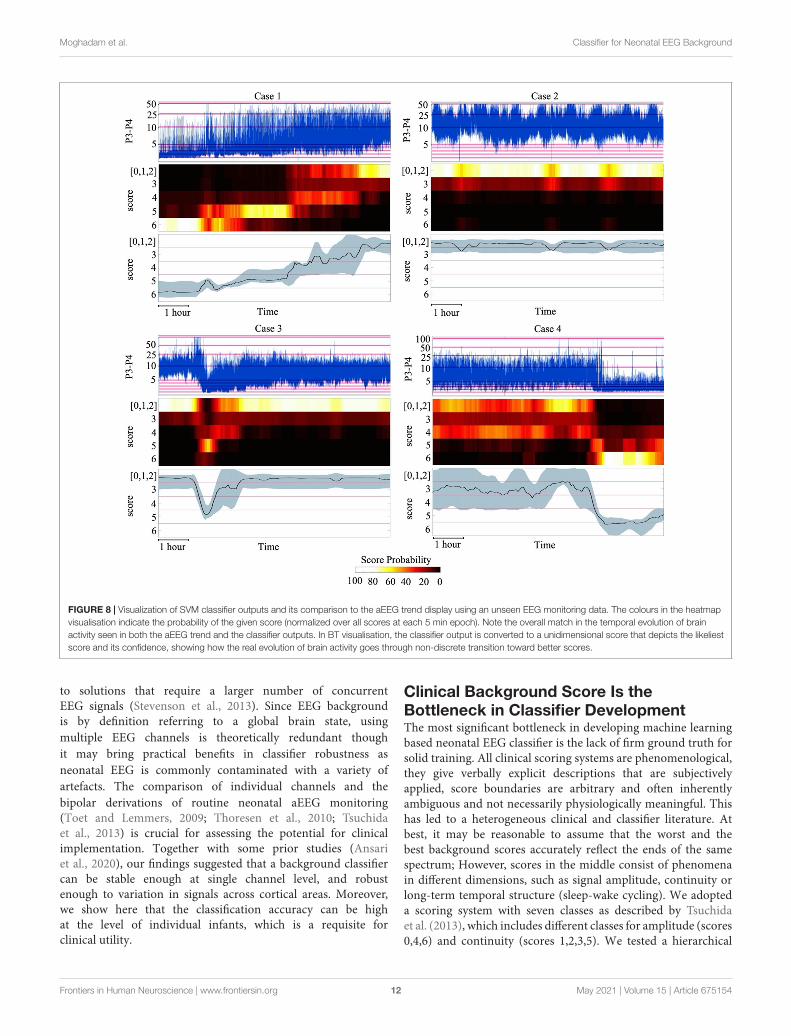
a different EEG system, as well as different electrode types andconfigurations. The EEG background evolution in the classifieroutput was visually compared to the concurrent evolution ofaEEG patterns to provide the clinically most transparent andintuitively understandable assessment. As shown in Figure 8, theclassifier output depicts graded evolutions in cortical activity,which are closely in line with the traditional clinician readingof aEEG trends. At the same time, however, the classifier oftentends to suggest that score 4 is closer to score 0–2 than somewherebetween scores 3 and 5.
The first infant (case 1) shows a typical evolution after birthasphyxia, starting from an essentially inactive EEG which isgradually and smoothly replaced by recovering, better forms ofbackground activity. The longer period of burst suppression isclearly seen in the classifier output, however, it is not seen in theaEEG trend due to the very commonly seen (Toet and Lemmers,2009; Marics et al., 2013) artefactual elevation of the lower aEEGboundary. The fourth quarter of the figure shows a relativelylow amplitude non-fluctuating activity in the aEEG, which isnicely depicted in the classifier output of grade 3–4, with a wideruncertainty around it.
The second infant (case 2) is a typical case seen afterappropriate recovery or milder incidents. It shows mostlynormal/near-normal background pattern that fluctuates betweenfully continuous and varying levels of discontinuity. The classifieroutput suggests most strongly the highest score, with a lowprobability of the increased intermittency. This information isbeyond the reading that can be seen from the aEEG trend whichonly suggests a fluctuating [a.k.a. cycling (Osredkar et al., 2005;Thoresen et al., 2010)] activity within normal amplitudes.
The third infant (case 3) shows a sudden drop in corticalactivity, which was here for an unknown cause, but it canbe due to a range of medical incidents (e.g., medication,hypoglycemia, hypoxia, cerebral bleeding) (Olischar et al., 2004;Ter Horst et al., 2004; Weeke et al., 2017). The EEG activityexhibited genuine burst suppression for a brief time as alsoreflected in the aEEG trend. This was rapidly replaced by lowamplitude activity (score 4), and then by several hours of nearlynormal EEG pattern with somewhat increased discontinuity(shown with the lower probability of score 3). Notably, theaEEG trend reflects this background evolution generally well;However, aEEG trend does not disclose the prolonged increased
Frontiers in Human Neuroscience | www.frontiersin.org 10 May 2021 | Volume 15 | Article 675154
fnhum-15-675154 May 25, 2021 Time: 14:13 # 11
Moghadam et al. Classifier for Neonatal EEG Background
FIGURE 7 | Visualization of SVM classifier outputs for an example subject with 88 h of data. (A) A heatmap visualisation that depicts the time course of normalizedprobability for each score. (B) Visualization of a background trend (BT) shows the weighted average of probability values (black line) as well as the uncertainty of theclassification at each epoch (grey shade). The blue and green lines indicate the individual annotations from experts E1 and E2, respectively.
discontinuity that has predictive clinical value (Watanabe et al.,1999; Murray et al., 2009).
The fourth infant (case 4) exhibits aEEG activity that appearsto be somewhat lower than typical, until it suddenly drops tonearly inactive for an unknown cause. Until suppression, theclassifier depicts some level of probability for multiple classes,especially for score 0–2 and score 4. The BT line shows wideruncertainty and a mean value near score 3. While this indicatesthat EEG activity is in the border zone, it also demonstratesa case where two-dimensional scoring system (amplitude vscontinuity; see methods for discussion) results in problems withone-dimensional visualization.
DISCUSSION
Our findings show that automated classification of neonatalEEG background activity is possible with high accuracy, evenat the level of individual infants. The process of developingsuch classifier algorithms involves a longer chain of steps,starting from the bedside EEG recordings until the classifier isimplemented in the bedside monitoring display. Our results aregenerally consistent with prior studies showing that automatedclassification of neonatal EEG background is possible withreasonable level of accuracy (Stevenson et al., 2013; Maticet al., 2014; Matic et al., 2015; Ahmed et al., 2016; Rauraleet al., 2019, 2020, 2021; Guo et al., 2020). We extend theprior literature by systematically characterizing the steps inclassifier development, and describing the impact of choicesmade by clinicians and engineers at key steps of the process.While modern development of machine learning algorithms has
become by and large a “black box” exercise (Chen et al., 2019;Roy et al., 2019; Borjali et al., 2020), developing tools for futureevidence based medicine would call for more transparency. Forexample, exposing the bottlenecks, sensitivities, ambiguities andpoints with robustness will greatly benefit future developmentof automated methods in EEG analyses. Our choice to usefeature-based methods rather than deep learning methods (e.g.,CNN) was motivated by the need to learn of the weakestlinks in the process chain, before and after the technicalclassifier solution.
Comparison With Prior LiteratureThe estimated accuracy of our classifier is comparable to otherneonatal EEG background classifiers (Stevenson et al., 2013;Matic et al., 2014; Matic et al., 2015; Ahmed et al., 2016;Raurale et al., 2019, 2020, 2021; Guo et al., 2020). Directcomparison of classifier performances is severely compromised.Firstly, the EEG scoring system is variable between laboratoriesand datasets, both with respect to the number of classes aswell as their conceptual content. For instance, the scores aretypically characterized by a varying mixture of descriptionsreferring to EEG continuity, amplitude, or longer temporalstructure such as sleep-wake cyclicity. This variability makesit impossible to even convert post hoc one scoring system toanother by a straightforward score merger or split. Secondly,prior literature has used widely varying epoch lengths to scorethe EEG. Our work used 5 min epoch to resolve changesin brain state in a clinically relevant time span of tens ofminutes (Figure 8). Thirdly, classifiers may also be trainedusing different numbers of EEG signals, ranging from classifiersbased on single EEG signals/channels (Raurale et al., 2020, 2021)
Frontiers in Human Neuroscience | www.frontiersin.org 11 May 2021 | Volume 15 | Article 675154
fnhum-15-675154 May 25, 2021 Time: 14:13 # 12
Moghadam et al. Classifier for Neonatal EEG Background
FIGURE 8 | Visualization of SVM classifier outputs and its comparison to the aEEG trend display using an unseen EEG monitoring data. The colours in the heatmapvisualisation indicate the probability of the given score (normalized over all scores at each 5 min epoch). Note the overall match in the temporal evolution of brainactivity seen in both the aEEG trend and the classifier outputs. In BT visualisation, the classifier output is converted to a unidimensional score that depicts the likeliestscore and its confidence, showing how the real evolution of brain activity goes through non-discrete transition toward better scores.
to solutions that require a larger number of concurrentEEG signals (Stevenson et al., 2013). Since EEG backgroundis by definition referring to a global brain state, usingmultiple EEG channels is theoretically redundant thoughit may bring practical benefits in classifier robustness asneonatal EEG is commonly contaminated with a variety ofartefacts. The comparison of individual channels and thebipolar derivations of routine neonatal aEEG monitoring(Toet and Lemmers, 2009; Thoresen et al., 2010; Tsuchidaet al., 2013) is crucial for assessing the potential for clinicalimplementation. Together with some prior studies (Ansariet al., 2020), our findings suggested that a background classifiercan be stable enough at single channel level, and robustenough to variation in signals across cortical areas. Moreover,we show here that the classification accuracy can be highat the level of individual infants, which is a requisite forclinical utility.
Clinical Background Score Is theBottleneck in Classifier DevelopmentThe most significant bottleneck in developing machine learningbased neonatal EEG classifier is the lack of firm ground truth forsolid training. All clinical scoring systems are phenomenological,they give verbally explicit descriptions that are subjectivelyapplied, score boundaries are arbitrary and often inherentlyambiguous and not necessarily physiologically meaningful. Thishas led to a heterogeneous clinical and classifier literature. Atbest, it may be reasonable to assume that the worst and thebest background scores accurately reflect the ends of the samespectrum; However, scores in the middle consist of phenomenain different dimensions, such as signal amplitude, continuity orlong-term temporal structure (sleep-wake cycling). We adopteda scoring system with seven classes as described by Tsuchidaet al. (2013), which includes different classes for amplitude (scores0,4,6) and continuity (scores 1,2,3,5). We tested a hierarchical
Frontiers in Human Neuroscience | www.frontiersin.org 12 May 2021 | Volume 15 | Article 675154
fnhum-15-675154 May 25, 2021 Time: 14:13 # 13
Moghadam et al. Classifier for Neonatal EEG Background
classifier to initially distinguish between continuities before afinal label is assigned, however, this did not improve the overallclassifier results.
The long held clinical neurophysiology tradition of treatingamplitude and continuity separately (Murray et al., 2009;Tsuchida et al., 2013) is challenged by the bedside practise wherechanges in brain state after e.g., recovery from birth asphyxia areobserved as unidimensional change in background activity frominactive to normal (Toet and Lemmers, 2009; Thoresen et al.,2010; Tsuchida et al., 2013). Some other background scores aremore designed for such one-dimensional assessment (Murrayet al., 2009; Korotchikova et al., 2011; Stevenson et al., 2013).However, they may include sleep-wake cycling which needs tensof minutes to hours per epoch which decreases the temporalresolution needed in practical bedside brain monitoring.
In addition, score boundaries are arbitrary as they arebased on consensus statements rather than generated fromdata or underlying physiology. Therefore, it comes perhaps asno surprise that multiple human experts have substantial levelof disagreement, especially between neighbouring categories.Assessing inter-rater agreement has become popular withexpansion of EEG monitoring practises (Dereymaeker et al.,2017; Wusthoff et al., 2017; Massey et al., 2019; Stevensonet al., 2020). However, most works on classifier design haveused consensus scores which by design eliminates ambiguityin individual annotations, data or scoring system. Here weexploited this latent human insight by training the classifierwith independent expert scores. It is surprising in this contexthow little attention has been given to how to disambiguatethe EEG scoring system in the first place? Or how to generateclinically appropriate, unidimensional score categories to alloweasier visualization of classifier outputs (for an example, seeFigure 8), akin to indices used in NIRS or vital signs monitoring.An ideal scoring system should be designed so that it strikesan optimal balance between maximizing inter-rater agreementand value of clinical information of each ordinal category.To this end, it is crucial to uncover the natural structure inthe neonatal EEG signal beyond visually identified grapho-elements. Recent advancements in self-supervised learningmethods (Banville et al., 2019, 2020) hold promise for a genuinebidirectional dialogue between machine learning and clinicalneurophysiology.
Feature-Based vs Deep LearningMethods in EEG ClassificationHere we used SVM, MFNN and RNN classifiers and threetraining approaches. While many recent studies have developedend-to-end deep learning approaches, we chose to explorethe feature-based approach which allows a more transparentassessment of the process. A feature-based system can also beeasier to train with limited and technically variable datasets.Here we show that a feature-based method can performat high enough accuracy for clinical implementation, andit is surprisingly robust to artefacts and missing data. Ourwork shows that optimal classifier design requires furtherdevelopment of the clinical background scoring system for
less ambiguity, after which it will be useful to examine theadded value of deep learning methods compared to feature-based method. An essential further factor with deep learningis the shortage of labelled data, which may be overcome byemploying modern data-driven methods for self-supervisedfeature extraction of natural EEG signal properties (Banville et al.,2019, 2020).
Visualization of Results for ClinicalImplementationA bedside implementation of classifier outputs needsvisualization that is transparent, accurate and clinicallyinformative. Some visualizations have been attempted inthe past based on a combination of binary and probabilistictrace of discrete score categories (Temko et al., 2015).Here, we developed this idea further by demonstratinghow the probability of discrete score categories could bevisualized using heatmaps, which often gives time-varyinglikelihood for multiple background scores. While this isperhaps the most comprehensive display, it may also beconfounding for a bedside clinician who would still need tointegrate multiple levels of information for conclusions. As analternative, we also probed the idea of using a unidimensionalbackground score which better corresponds to the displayused in vital signs or NIRS monitoring. This visualizationis far easier to interpret and it also allows the additionof a confidence measure which maybe essential for thebedside clinician.
Future DirectionsAll automated EEG assessment may benefit from improvingthe pre-processing stage before feature extraction/classification.Our analytic pipeline includes a crude, automated artefactrecognition, however, more sophisticated artefact recognitionmethods (Stevenson et al., 2014; Kauppila et al., 2017) couldimprove classifier performance. In addition, the incorporation ofautomated seizure detection could help recognize epochs whereexcessive seizure activity interferes with the EEG background.
Finally, future clinical studies will be needed afterimplementing the classifier into a functioning EEG monitor.In order facilitate further development, replication andvalidation, we have shared the full classifier algorithms(from the feature extraction to result visualization). Thefinal clinical validation of the system will consist of assessingits conformance to clinical assessment at individual level,as well as evaluating the clinician’s perceived added valueof the automated EEG background classifier for bedsidedecision making.
DATA AVAILABILITY STATEMENT
The datasets presented in this article are not readily availablebecause they were provided by a third party (Hospital for SickChildren, Toronto, ON, Canada). Requests to access the datasetsshould be directed to ([email protected]).
Frontiers in Human Neuroscience | www.frontiersin.org 13 May 2021 | Volume 15 | Article 675154
fnhum-15-675154 May 25, 2021 Time: 14:13 # 14
Moghadam et al. Classifier for Neonatal EEG Background
AUTHOR CONTRIBUTIONS
ET, EP, and CH performed the patient recruitment, EEGcollection, and the design of the visual scoring system. EP andVM performed the visual classification. SM, MK, KT, and NScarried out the computational EEG data analysis (incl. features).SM, NS, IT, JK, MA, and SV developed the incremental classifierdesigns. SM, NS, and SV developed the overall manuscriptcontent. SM, NS, and SV prepared the manuscript and figures,while all authors carefully reviewed, and commented and finallyapproved the article. ET, CH, NS, and SV arranged the fundingand each for a different aspect of the work.
FUNDING
This work was a part of a project that has receivedfunding from the European Union’s Horizon 2020 Research
and Innovation Programme under the Marie Skłodowska-Curie grant agreement (SM: No. 813483), the FinnishAcademy (SV: No.313242, No.288220, and No.3104450),Finnish Pediatric Foundation (Lastentautiensäätiö) (SV),Aivosäätiö (SV), Sigrid Juselius Foundation (SV), HUSChildren’s Hospital (SV), the National Health and MedicalResearch Council of Australia (SNJ: APP1144936 andAPP2002135), the Canadian Institutes of Health Research(ET: MOP-133710, PJT-166076), the National Institutes ofHealth (ET: R01 HD101419), and the SickKids Foundation(ET).
SUPPLEMENTARY MATERIAL
The Supplementary Material for this article can be foundonline at: https://www.frontiersin.org/articles/10.3389/fnhum.2021.675154/full#supplementary-material
REFERENCESAhmed, R., Temko, A., Marnane, W., Lightbody, G., and Boylan, G. (2016).
Grading hypoxic–ischemic encephalopathy severity in neonatal EEG usingGMM supervectors and the support vector machine. Clin. Neurophysiol. 127,297–309. doi: 10.1016/j.clinph.2015.05.024
Ansari, A. H., Cherian, P., Dereymaeker, A., Matic, V., Jansen, K., De Wispelaere,L., et al. (2016). Improved multi-stage neonatal seizure detection using aheuristic classifier and a data-driven post-processor. Clin. Neurophysiol. 127,3014–3024. doi: 10.1016/j.clinph.2016.06.018
Ansari, A. H., De Wel, O., Pillay, K., Dereymaeker, A., Jansen, K., Van Huffel,S., et al. (2020). A convolutional neural network outperforming state-of-the-art sleep staging algorithms for both preterm and term infants. J. Neural Eng.17:016028. doi: 10.1088/1741-2552/ab5469
Banville, H., Albuquerque, I., Hyvärinen, A., Moffat, G., Engemann, D.-A.,and Gramfort, A. (2019). “Self-supervised representation learning fromelectroencephalography signals,” in Proceedings of the 2019 IEEE 29thInternational Workshop on Machine Learning for Signal Processing (MLSP),(Pittsburgh, PA: IEEE), 1–6.
Banville, H., Chehab, O., Hyvarinen, A., Engemann, D., and Gramfort, A. (2020).Uncovering the structure of clinical EEG signals with self-supervised learning.J. Neural Eng. 18, 046020 doi: 10.1088/1741-2552/abca18
Basheer, I. A., and Hajmeer, M. (2000). Artificial neural networks: fundamentals,computing, design, and application. J. Microbiol. Methods 43, 3–31. doi: 10.1016/s0167-7012(00)00201-3
Borjali, A., Chen, A. F., Muratoglu, O. K., Morid, M. A., and Varadarajan, K. M.(2020). Deep learning in orthopedics: how do we build trust in the machine?Healthc. Transform Artif. Intell. Autom. Rob. 1–6. doi: 10.1089/heat.2019.0006
Boylan, G., Burgoyne, L., Moore, C., O’Flaherty, B., and Rennie, J. (2010). Aninternational survey of EEG use in the neonatal intensive care unit. ActaPaediatr. 99, 1150–1155. doi: 10.1111/j.1651-2227.2010.01809.x
Boylan, G. B., Stevenson, N. J., and Vanhatalo, S. (2013). Monitoring neonatalseizures. Semin. Fetal Neonatal Med. 18, 202–208.
Chawla, N. V., Bowyer, K. W., Hall, L. O., and Kegelmeyer, W. P. (2002). SMOTE:synthetic minority over-sampling technique. J. Artif. Intell. Res. 16, 321–357.doi: 10.1613/jair.953
Chen, H., Song, Y., and Li, X. (2019). A deep learning framework for identifyingchildren with ADHD using an EEG-based brain network. Neurocomputing 356,83–96. doi: 10.1016/j.neucom.2019.04.058
Cherian, P. J., Deburchgraeve, W., Swarte, R. M., De Vos, M., Govaert, P.,Van Huffel, S., et al. (2011). Validation of a new automated neonatal seizuredetection system: a clinician’s perspective. Clin. Neurophysiol. 122, 1490–1499.doi: 10.1016/j.clinph.2011.01.043
de Vries, L. S., and Hellstrom-Westas, L. (2005). Role of cerebral functionmonitoring in the newborn. Arch. Dis. Child. Fetal Neonatal Ed. 90, F201–F207.doi: 10.1136/adc.2004.062745
Dereymaeker, A., Ansari, A. H., Jansen, K., Cherian, P. J., Vervisch, J., Govaert, P.,et al. (2017). Interrater agreement in visual scoring of neonatal seizures basedon majority voting on a web-based system: the neoguard EEG database. Clin.Neurophysiol. 128, 1737–1745. doi: 10.1016/j.clinph.2017.06.250
Emmanouilidis, C., Hunter, A., and MacIntyre, J. (2000). “A multiobjectiveevolutionary setting for feature selection and a commonality-based crossoveroperator,” in Proceedings of the 2000 Congress on Evolutionary Computation.CEC00 (Cat. No. 00TH8512), (La Jolla, CA: IEEE), 309–316.
Guo, J., Cheng, X., and Wu, D. (2020). Grading Method for Hypoxic-IschemicEncephalopathy Based on Neonatal EEG. Comput. Model. Eng. Sci. 122, 721–742. doi: 10.32604/cmes.2020.07470
John, G. H., Kohavi, R., and Pfleger, K. (1994). “Irrelevant features and the subsetselection problem,” in Machine Learning Proceedings 1994, eds W. W. Cohenand H. Hirsh (New Brunswick, NJ: Elsevier), 121–129.
Kamino, D., Almazrooei, A., Pang, E. W., Widjaja, E., Moore, A. M.,Chau, V., et al. (2021). Abnormalities in evoked potentials associatedwith abnormal glycemia and brain injury in neonatal hypoxic-ischemicencephalopathy. Clin. Neurophysiol. 132, 307–313. doi: 10.1016/j.clinph.2020.09.024
Kauppila, M., Vanhatalo, S., and Stevenson, N. J. (2017). “Artifact detection inneonatal EEG using Gaussian mixture models,” in EMBEC & NBC 2017, edsH. Eskola, O. Väisänen, J. Viik, and J. Hyttinen (Singapore: Springer), 221–224.
Korotchikova, I., Stevenson, N. J., Walsh, B. H., Murray, D. M., and Boylan,G. B. (2011). Quantitative EEG analysis in neonatal hypoxic ischaemicencephalopathy. Clin. Neurophysiol. 122, 1671–1678. doi: 10.1016/j.clinph.2010.12.059
Kudo, M., and Sklansky, J. (2000). Comparison of algorithms that select featuresfor pattern classifiers. Pattern Recognit. 33, 25–41. doi: 10.1016/S0031-3203(99)00041-2
Marics, G., Cseko, A., Vasarhelyi, B., Zakarias, D., Schuster, G., and Szabo, M.(2013). Prevalence and etiology of false normal aEEG recordings in neonatalhypoxic-ischaemic encephalopathy. BMC Pediatr. 13:194. doi: 10.1186/1471-2431-13-194
Massey, S. L., Shou, H., Clancy, R., DiGiovine, M., Fitzgerald, M. P., Fung,F. W., et al. (2019). Interrater and intrarater agreement in neonatalelectroencephalogram background scoring. J. Clin. Neurophysiol. 36, 1–8. doi:10.1097/WNP.0000000000000534
Matic, V., Cherian, P. J., Jansen, K., Koolen, N., Naulaers, G., Swarte, R. M.,et al. (2015). Improving reliability of monitoring background EEG dynamics inasphyxiated infants. IEEE Trans. Biomed. Eng. 63, 973–983. doi: 10.1109/TBME.2015.2477946
Frontiers in Human Neuroscience | www.frontiersin.org 14 May 2021 | Volume 15 | Article 675154
fnhum-15-675154 May 25, 2021 Time: 14:13 # 15
Moghadam et al. Classifier for Neonatal EEG Background
Matic, V., Cherian, P. J., Koolen, N., Naulaers, G., Swarte, R. M., Govaert, P.,et al. (2014). Holistic approach for automated background EEG assessmentin asphyxiated full-term infants. J. Neural Eng. 11:066007. doi: 10.1088/1741-2560/11/6/066007
Menache, C. C., Bourgeois, B. F., and Volpe, J. J. (2002). Prognostic value ofneonatal discontinuous EEG. Pediatr. Neurol. 27, 93–101. doi: 10.1016/s0887-8994(02)00396-x
Monod, N., Pajot, N., and Guidasci, S. (1972). The neonatal EEG: statistical studiesand prognostic value in full-term and pre-term babies. Electroencephalogr. Clin.Neurophysiol. 32, 529–544. doi: 10.1016/0013-4694(72)90063-6
Murray, D. M., Boylan, G. B., Ali, I., Ryan, C. A., Murphy, B. P., and Connolly,S. (2008). Defining the gap between electrographic seizure burden, clinicalexpression and staff recognition of neonatal seizures. Arch. Dis. Child. FetalNeonatal Ed. 93, F187–F191. doi: 10.1136/adc.2005.086314
Murray, D. M., Boylan, G. B., Ryan, C. A., and Connolly, S. (2009). Early EEGfindings in hypoxic-ischemic encephalopathy predict outcomes at 2 years.Pediatrics 124, e459–e467. doi: 10.1542/peds.2008-2190
Olischar, M., Klebermass, K., Kuhle, S., Hulek, M., Messerschmidt, A., andWeninger, M. (2004). Progressive posthemorrhagic hydrocephalus leads tochanges of amplitude-integrated EEG activity in preterm infants. Childs Nerv.Syst. 20, 41–45. doi: 10.1007/s00381-003-0809-y
Oliveira, L. S., Sabourin, R., Bortolozzi, F., and Suen, C. Y. (2003). A methodologyfor feature selection using multiobjective genetic algorithms for handwrittendigit string recognition. Int. J. Pattern Recognit. Artif. Intell. 17, 903–929. doi:10.1142/S021800140300271X
Osredkar, D., Toet, M. C., van Rooij, L. G., van Huffelen, A. C., Groenendaal,F., and de Vries, L. S. (2005). Sleep-wake cycling on amplitude-integratedelectroencephalography in term newborns with hypoxic-ischemicencephalopathy. Pediatrics 115, 327–332. doi: 10.1542/peds.2004-0863
Pinchefsky, E. F., Hahn, C. D., Kamino, D., Chau, V., Brant, R., Moore, A. M., et al.(2019). Hyperglycemia and glucose variability are associated with worse brainfunction and seizures in neonatal encephalopathy: a prospective cohort study.J. Pediatr. 209, 23–32. doi: 10.1016/j.jpeds.2019.02.027
Raggad, B. G. (1996). Data conflict elimination in neural network training.J. Comput. Inf. Syst. 36, 92–98. doi: 10.1080/08874417.1996.11647233
Raurale, S. A., Boylan, G. B., Lightbody, G., and O’Toole, J. M. (2020). “Gradingthe severity of hypoxic-ischemic encephalopathy in newborn EEG usinga convolutional neural network,” in Proceedings of the 2020 42nd AnnualInternational Conference of the IEEE Engineering in Medicine & Biology Society(EMBC), (Montreal, QC: IEEE).
Raurale, S. A., Boylan, G. B., Mathieson, S. R., Marnane, W. P., Lightbody,G., and O’Toole, J. M. (2021). Grading hypoxic-ischemic encephalopathyin neonatal EEG with convolutional neural networks and quadratic time–frequency distributions. J. Neural Eng. 18:046007. doi: 10.1088/1741-2552/abe8ae
Raurale, S. A., Nalband, S., Boylan, G. B., Lightbody, G., and O’Toole, J. M.(2019). “Suitability of an inter-burst detection method for grading hypoxic-ischemic encephalopathy in newborn EEG,” in Proceedings of the 2019 41stAnnual International Conference of the IEEE Engineering in Medicine andBiology Society (EMBC), (Berlin: IEEE), 4125–4128.
Roy, Y., Banville, H., Albuquerque, I., Gramfort, A., Falk, T. H., and Faubert,J. (2019). Deep learning-based electroencephalography analysis: a systematicreview. J. Neural Eng. 16:051001. doi: 10.1088/1741-2552/ab260c
Siedlecki, W., and Sklansky, J. (1993). “A note on genetic algorithms for large-scale feature selection,” in Handbook of Pattern Recognition and ComputerVision, eds C. Chen, L. Pau, and P. Wang (Singapore: World Scientific),88–107.
Stevenson, N. J., Korotchikova, I., Temko, A., Lightbody, G., Marnane, W. P., andBoylan, G. B. (2013). An automated system for grading EEG abnormality in
term neonates with hypoxic-ischaemic encephalopathy. Ann. Biomed. Eng. 41,775–785. doi: 10.1007/s10439-012-0710-5
Stevenson, N. J., Lauronen, L., and Vanhatalo, S. (2018). The effect of reducing EEGelectrode number on the visual interpretation of the human expert for neonatalseizure detection. Clin. Neurophysiol. 129, 265–270. doi: 10.1016/j.clinph.2017.10.031
Stevenson, N. J., O’Toole, J. M., Korotchikova, I., and Boylan, G. B. (2014).“Artefact detection in neonatal EEG,” in Proceedings of the 2014 36th AnnualInternational Conference of the IEEE Engineering in Medicine and BiologySociety, (Chicago, IL: IEEE), 926–929.
Stevenson, N. J., Tataranno, M. L., Kaminska, A., Pavlidis, E., Clancy, R. R.,Griesmaier, E., et al. (2020). Reliability and accuracy of EEG interpretationfor estimating age in preterm infants. Ann. Clin. Transl. Neurol. 7, 1564–1573.doi: 10.1002/acn3.51132
Temko, A., Marnane, W., Boylan, G., and Lightbody, G. (2015). Clinicalimplementation of a neonatal seizure detection algorithm. Decis. Support Syst.70, 86–96. doi: 10.1016/j.dss.2014.12.006
Ter Horst, H., Brouwer, O., and Bos, A. (2004). Burst suppression onamplitude−integrated electroencephalogram may be induced by midazolam:a report on three cases. Acta Paediatr. 93, 559–563. doi: 10.1080/08035250410022882
Thoresen, M., Hellstrom-Westas, L., Liu, X., and de Vries, L. S. (2010). Effectof hypothermia on amplitude-integrated electroencephalogram in infants withasphyxia. Pediatrics 126, e131–e139. doi: 10.1542/peds.2009-2938
Toet, M. C., and Lemmers, P. M. (2009). Brain monitoring in neonates. Early Hum.Dev. 85, 77–84. doi: 10.1016/j.earlhumdev.2008.11.007
Tsuchida, T. N., Wusthoff, C. J., Shellhaas, R. A., Abend, N. S., Hahn, C. D., Sullivan,J. E., et al. (2013). American clinical neurophysiology society standardizedEEG terminology and categorization for the description of continuous EEGmonitoring in neonates: report of the American Clinical NeurophysiologySociety critical care monitoring committee. J. Clin. Neurophysiol. 30, 161–173.doi: 10.1097/WNP.0b013e3182872b24
Versaggi, M. R. (1995). Understanding conflicting data. AI Expert 10, 21–25.Watanabe, K., Hayakawa, F., and Okumura, A. (1999). Neonatal EEG: a powerful
tool in the assessment of brain damage in preterm infants. Brain Dev. 21,361–372. doi: 10.1016/s0387-7604(99)00034-0
Weeke, L. C., Dix, L. M. L., Groenendaal, F., Lemmers, P. M. A., Dijkman, K. P.,Andriessen, P., et al. (2017). Severe hypercapnia causes reversible depression ofaEEG background activity in neonates: an observational study. Arch. Dis. Child.Fetal Neonatal Ed. 102, F383–F388. doi: 10.1136/archdischild-2016-311770
Williams, R. J., and Zipser, D. (1989). A learning algorithm for continually runningfully recurrent neural networks. Neural Comput. 1, 270–280. doi: 10.1162/neco.1989.1.2.270
Wusthoff, C. J., Sullivan, J., Glass, H. C., Shellhaas, R. A., Abend, N. S., Chang,T., et al. (2017). Interrater agreement in the interpretation of neonatalelectroencephalography in hypoxic-ischemic encephalopathy. Epilepsia 58,429–435. doi: 10.1111/epi.13661
Conflict of Interest: The authors declare that the research was conducted in theabsence of any commercial or financial relationships that could be construed as apotential conflict of interest.
Copyright © 2021 Moghadam, Pinchefsky, Tse, Marchi, Kohonen, Kauppila,Airaksinen, Tapani, Nevalainen, Hahn, Tam, Stevenson and Vanhatalo. This is anopen-access article distributed under the terms of the Creative Commons AttributionLicense (CC BY). The use, distribution or reproduction in other forums is permitted,provided the original author(s) and the copyright owner(s) are credited and that theoriginal publication in this journal is cited, in accordance with accepted academicpractice. No use, distribution or reproduction is permitted which does not complywith these terms.
Frontiers in Human Neuroscience | www.frontiersin.org 15 May 2021 | Volume 15 | Article 675154