Embed Size (px)
Citation preview

Module 6 Inventory & Cost of Sales
Choosing an Inventory Cost Flow Assumption: Trade-‐Offs
• Income and Asset Measurement– How much does it cost? – Valuation: Cost-‐original or replacement, Lower of Cost or Market
• Economic Consequences– Income Taxes and Liquidity– Bookkeeping Costs– LIFO Liquidation and Inventory Purchasing Practices– Debt and Compensation Practices– The Capital Market-‐ Current ratio, Profit margin ratio
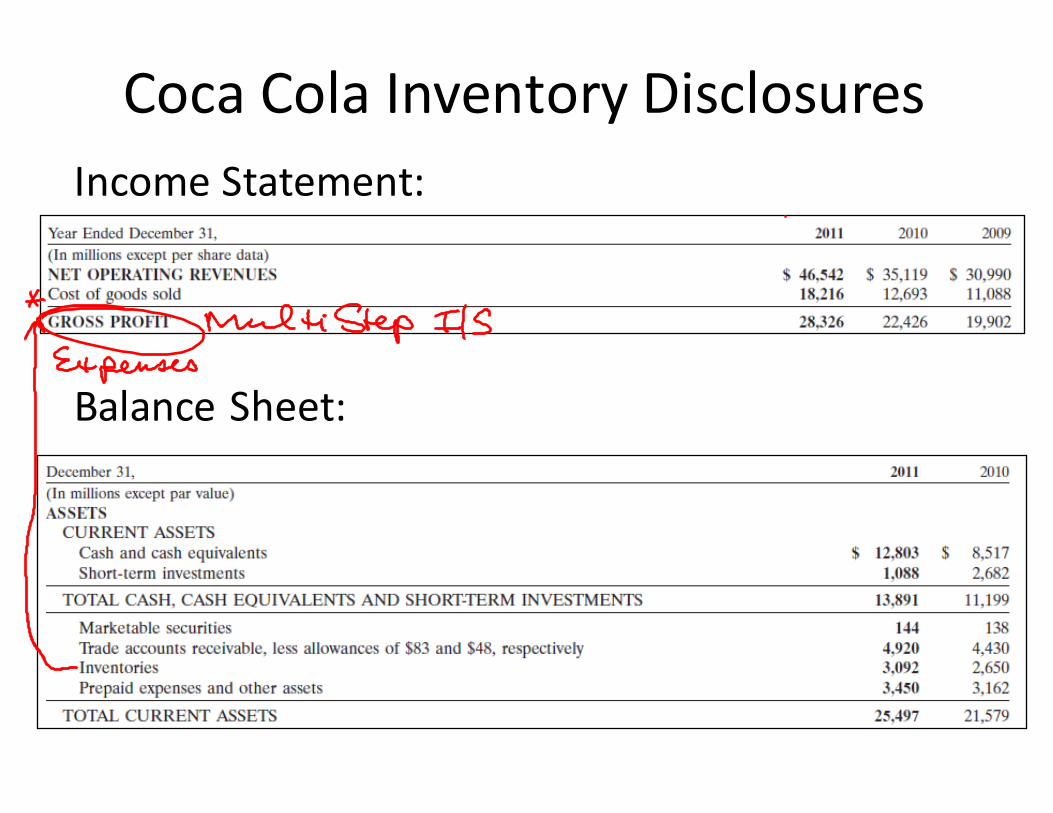
Coca Cola Inventory DisclosuresIncome Statement:
Balance Sheet:
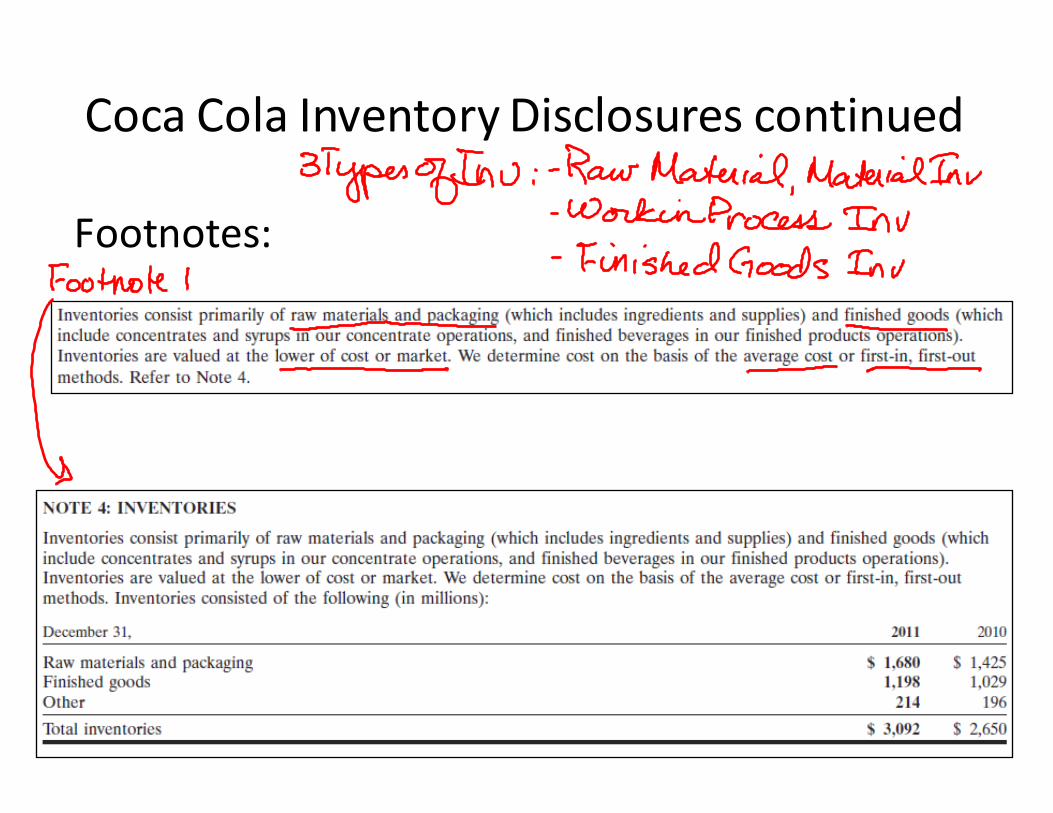
Coca Cola Inventory Disclosures continued
Footnotes:
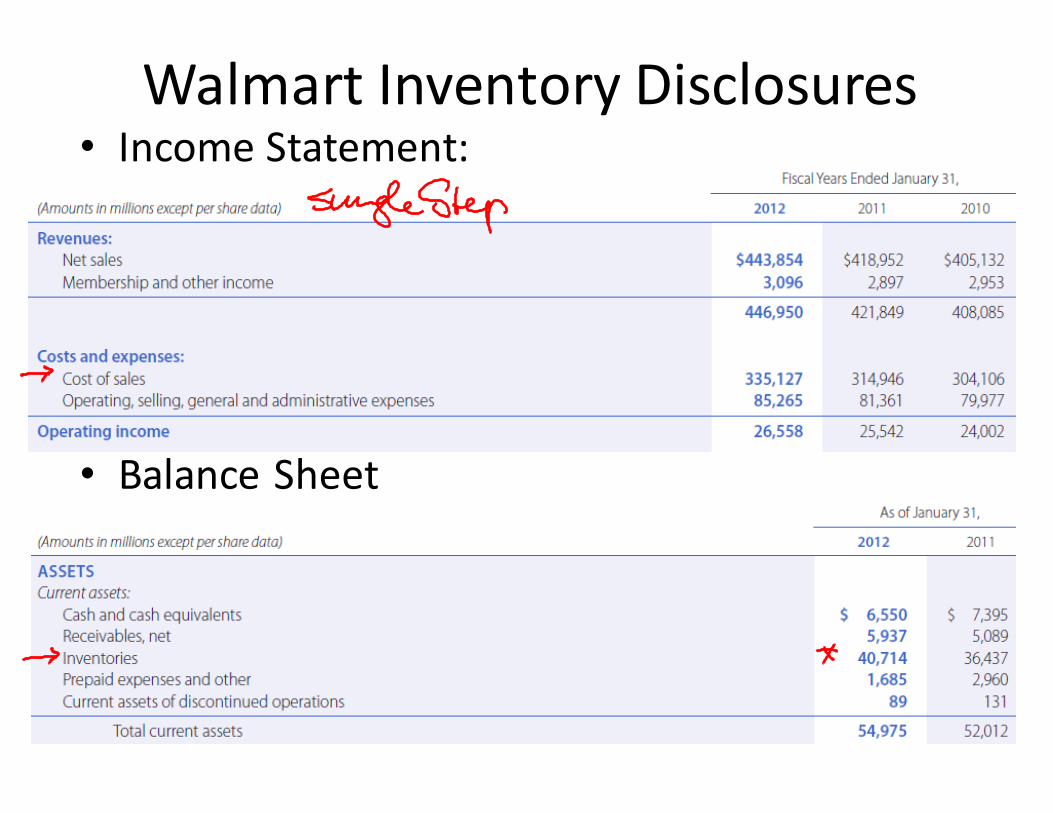
Walmart Inventory Disclosures • Income Statement:
• Balance Sheet
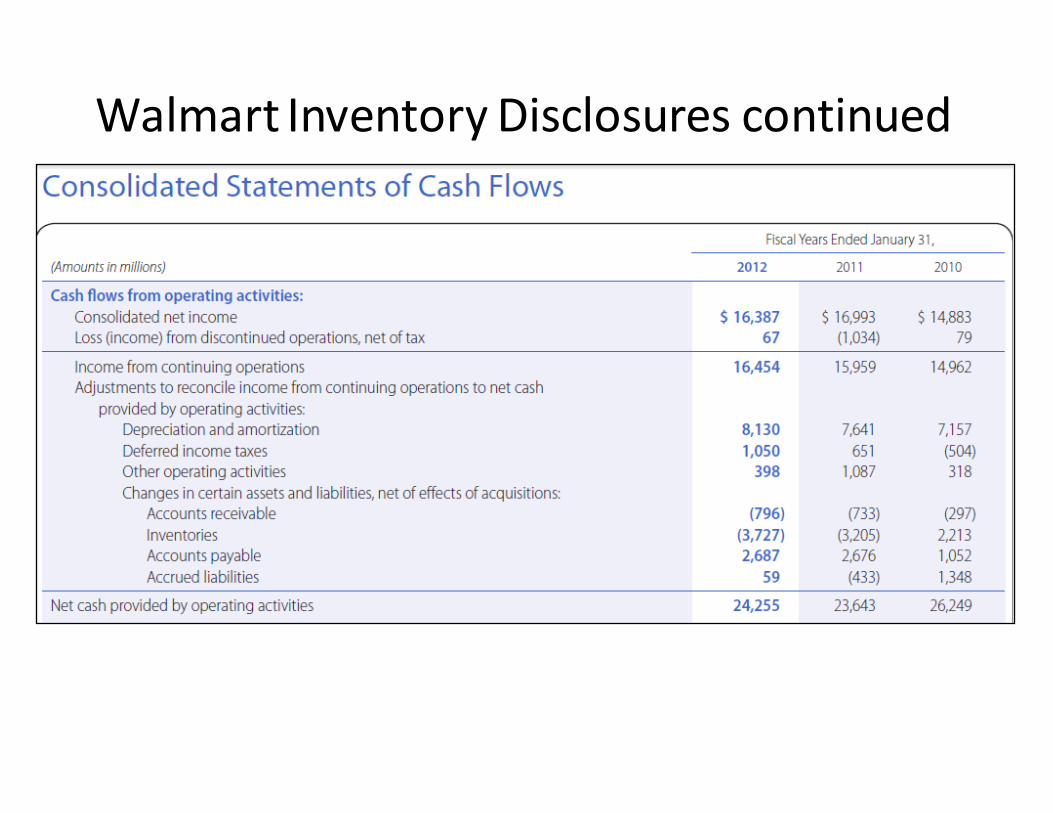
Walmart Inventory Disclosures continued
Footnotes:
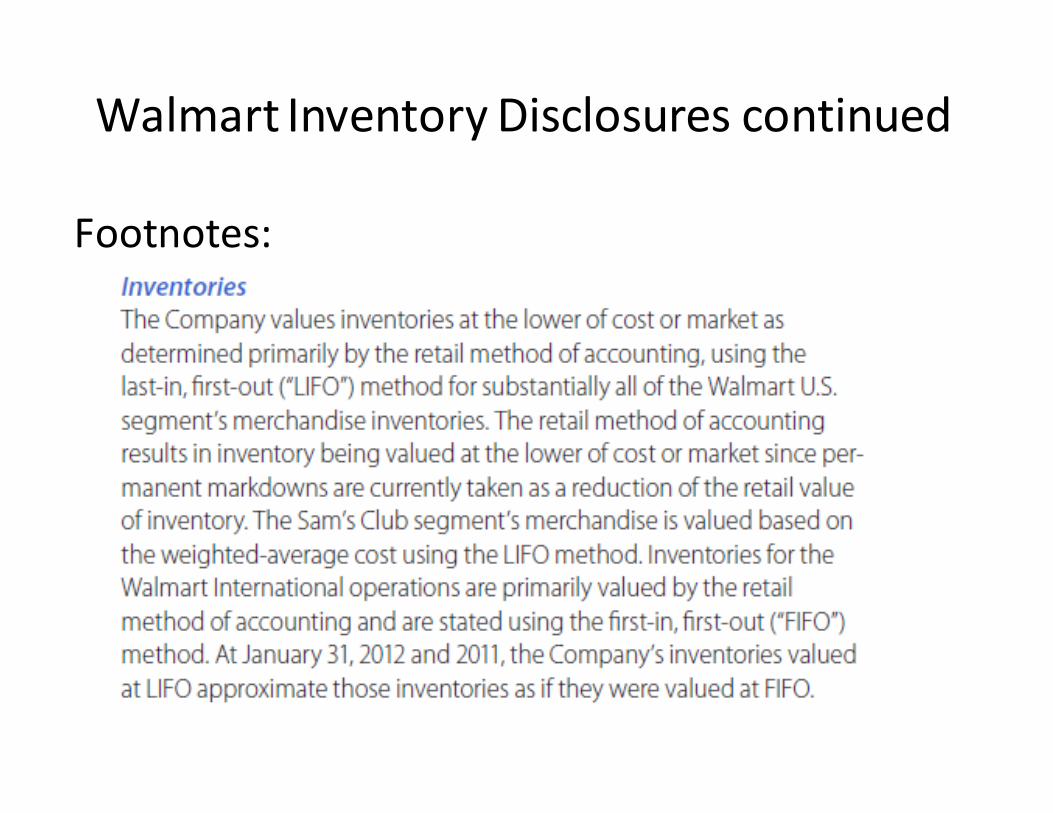
Walmart Inventory Disclosures continued
Footnotes:
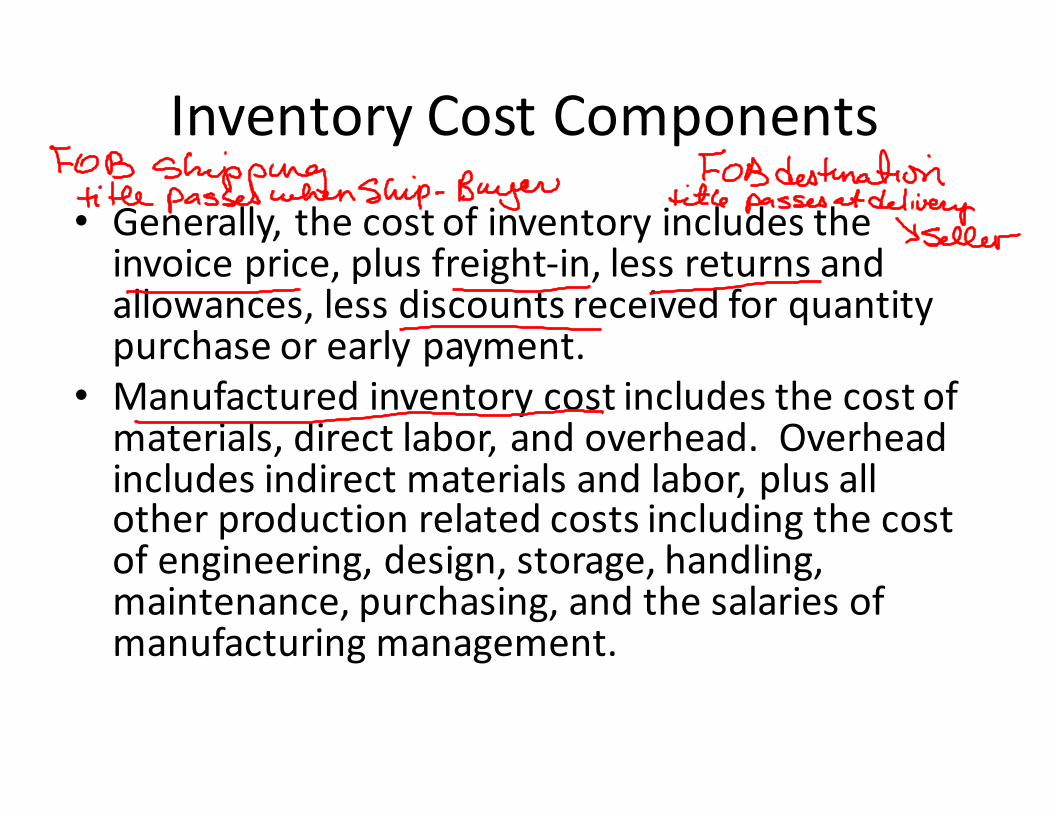
Inventory Cost Components• Generally, the cost of inventory includes the invoice price, plus freight-‐in, less returns and allowances, less discounts received for quantity purchase or early payment.
• Manufactured inventory cost includes the cost of materials, direct labor, and overhead. Overhead includes indirect materials and labor, plus all other production related costs including the cost of engineering, design, storage, handling, maintenance, purchasing, and the salaries of manufacturing management.
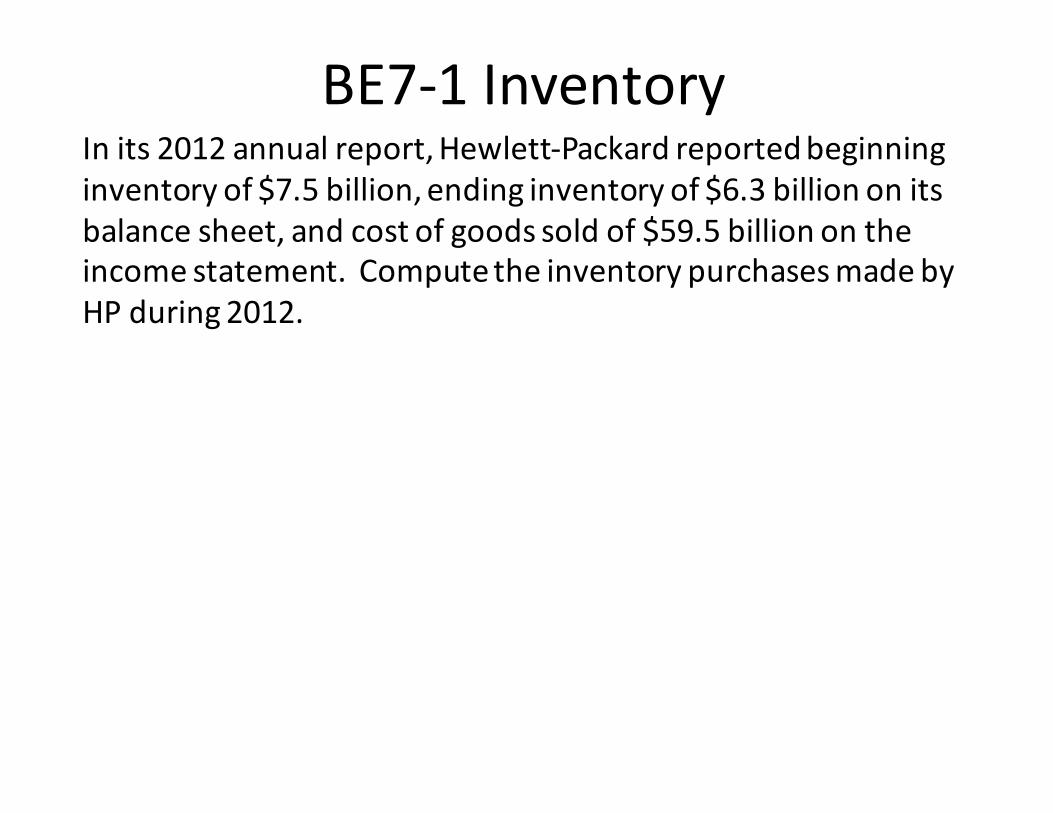
BE7-‐1 InventoryIn its 2012 annual report, Hewlett-‐Packard reported beginning inventory of $7.5 billion, ending inventory of $6.3 billion on its balance sheet, and cost of goods sold of $59.5 billion on the income statement. Compute the inventory purchases made by HP during 2012.
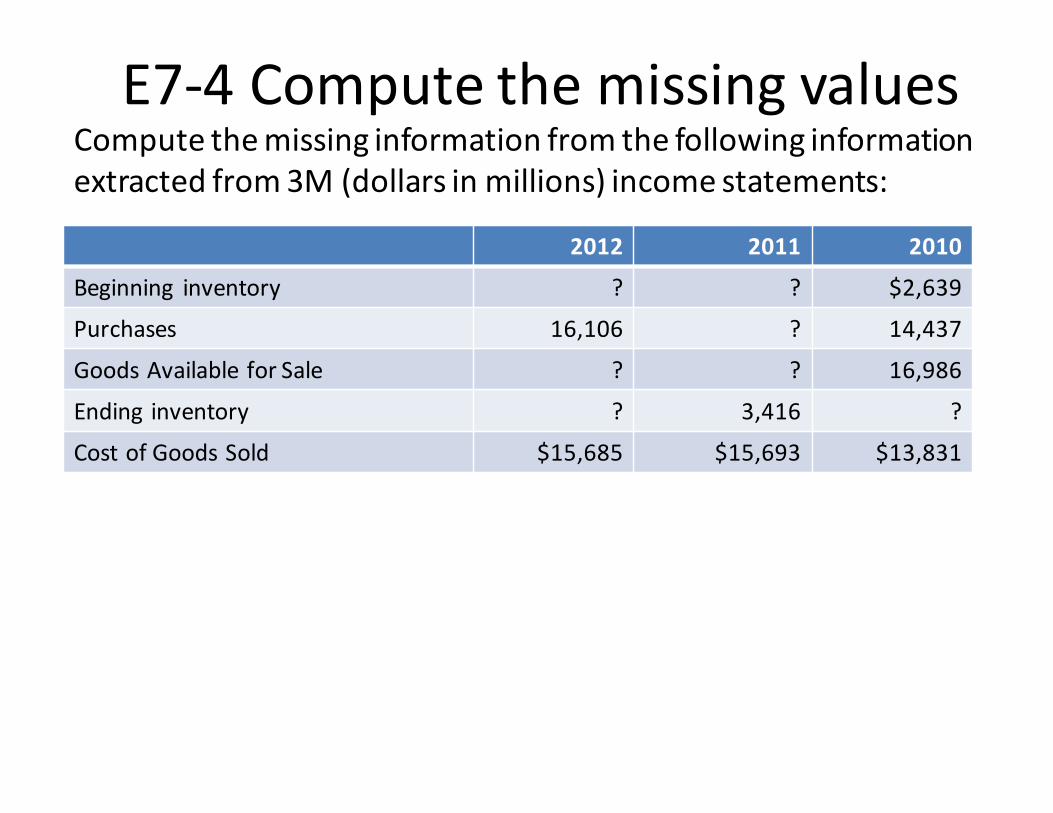
E7-‐4 Compute the missing valuesCompute the missing information from the following information extracted from 3M (dollars in millions) income statements:
2012 2011 2010
Beginning inventory ? ? $2,639
Purchases 16,106 ? 14,437
Goods Available for Sale ? ? 16,986
Ending inventory ? 3,416 ?
Cost of Goods Sold $15,685 $15,693 $13,831

Anatomy of Merchandise Inventory

Cost of Goods Sold: Account/Computation
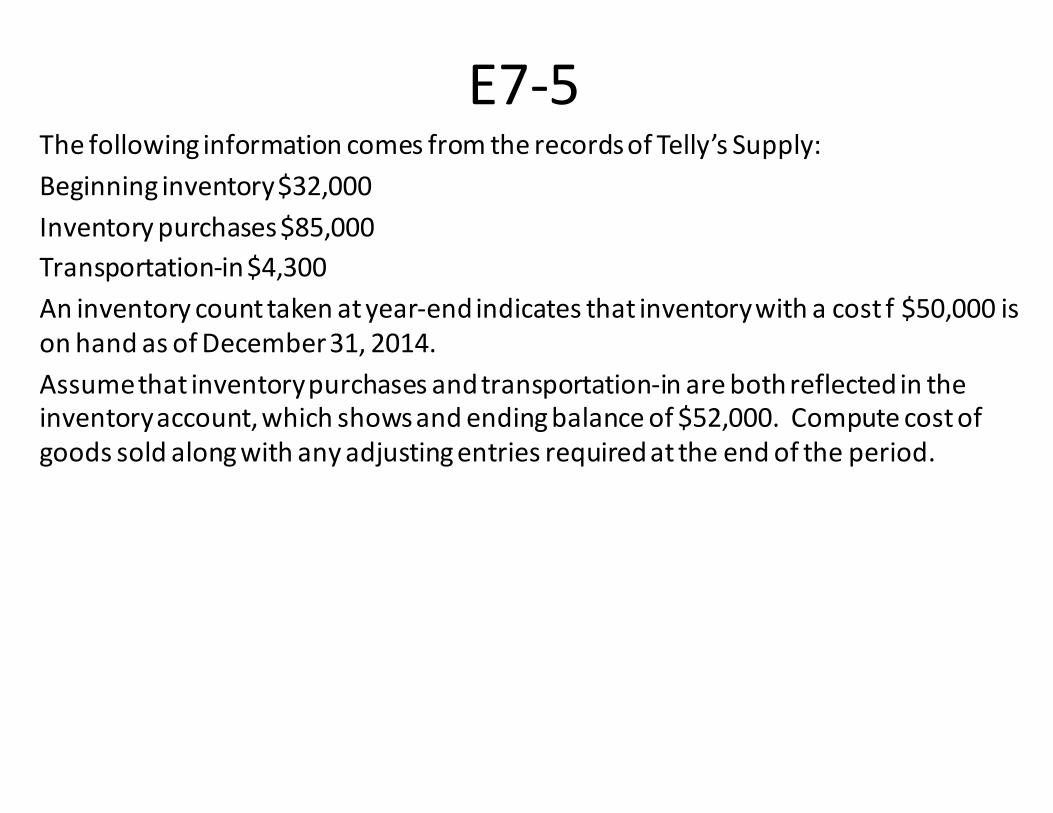
E7-‐5 The following information comes from the records of Telly’s Supply:Beginning inventory $32,000Inventory purchases $85,000Transportation-‐in $4,300An inventory count taken at year-‐end indicates that inventory with a cost f $50,000 is on hand as of December 31, 2014.Assume that inventory purchases and transportation-‐in are both reflected in the inventory account, which shows and ending balance of $52,000. Compute cost of goods sold along with any adjusting entries required at the end of the period.
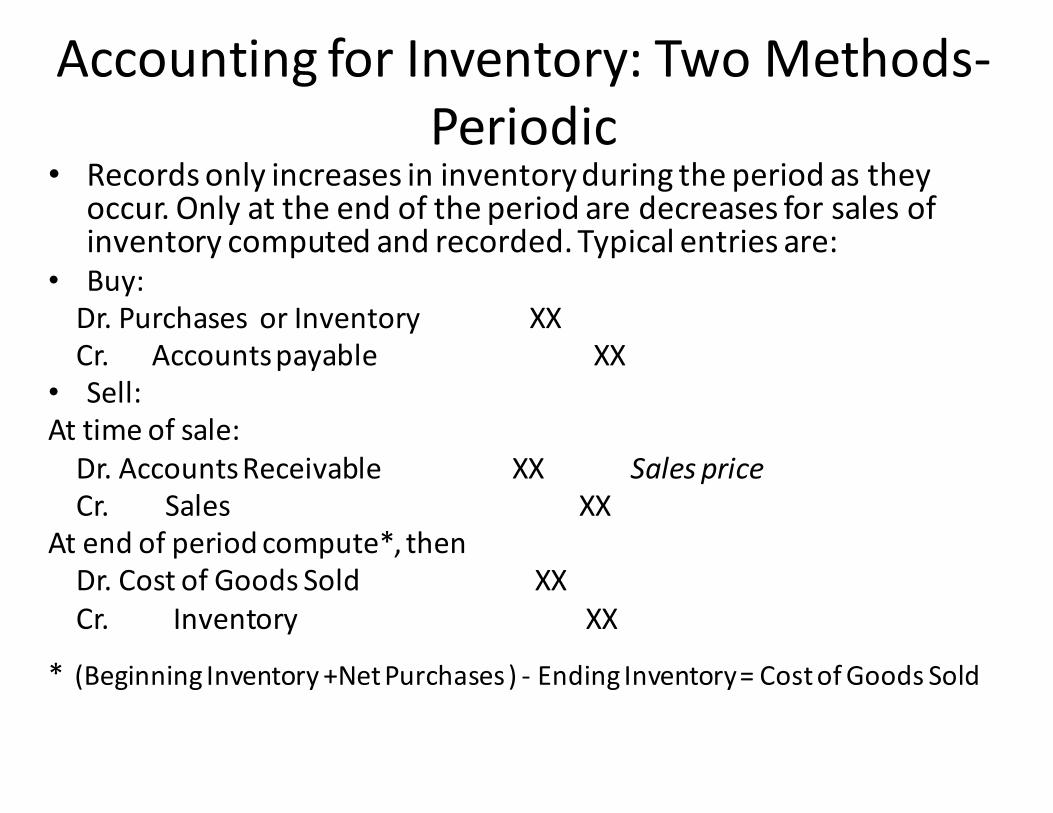
Accounting for Inventory: Two Methods-‐Periodic
• Records only increases in inventory during the period as they occur. Only at the end of the period are decreases for sales of inventory computed and recorded. Typical entries are:
• Buy:Dr. Purchases or Inventory XXCr. Accounts payable XX
• Sell: At time of sale:Dr. Accounts Receivable XX Sales priceCr. Sales XX
At end of period compute*, thenDr. Cost of Goods Sold XXCr. Inventory XX
* (Beginning Inventory +Net Purchases ) -‐ Ending Inventory = Cost of Goods Sold
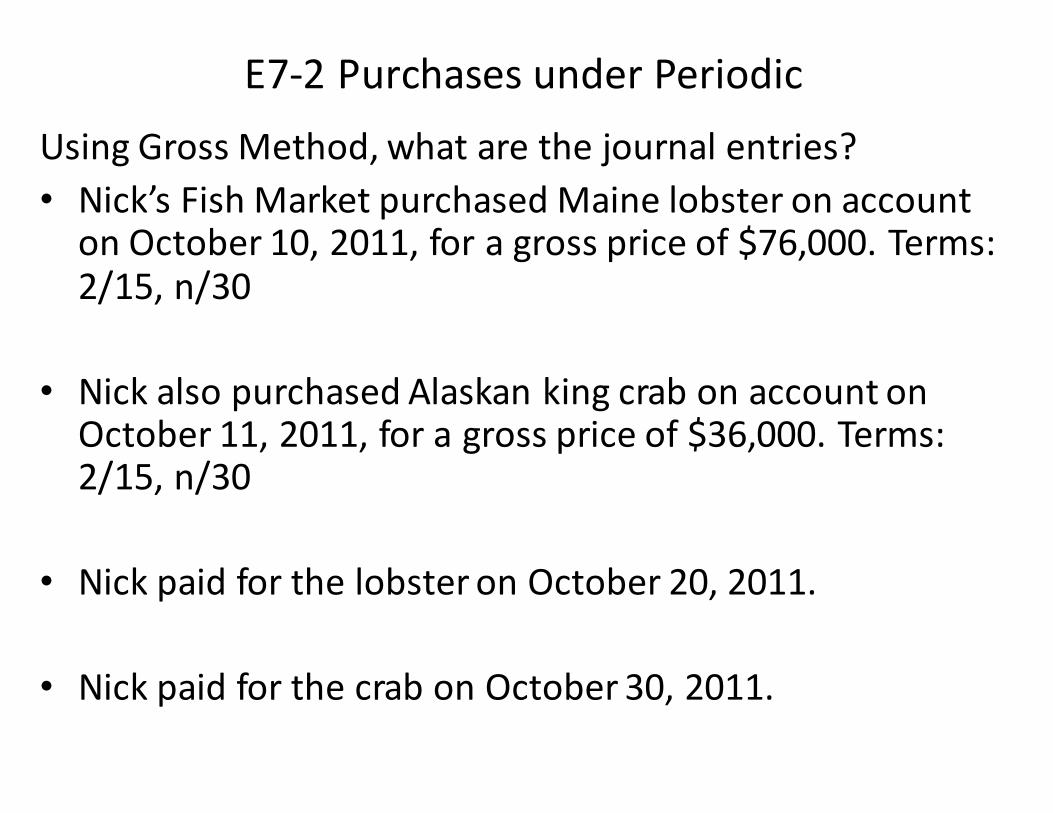
E7-‐2 Purchases under PeriodicUsing Gross Method, what are the journal entries?• Nick’s Fish Market purchased Maine lobster on account on October 10, 2011, for a gross price of $76,000. Terms: 2/15, n/30
• Nick also purchased Alaskan king crab on account on October 11, 2011, for a gross price of $36,000. Terms: 2/15, n/30
• Nick paid for the lobster on October 20, 2011.
• Nick paid for the crab on October 30, 2011.
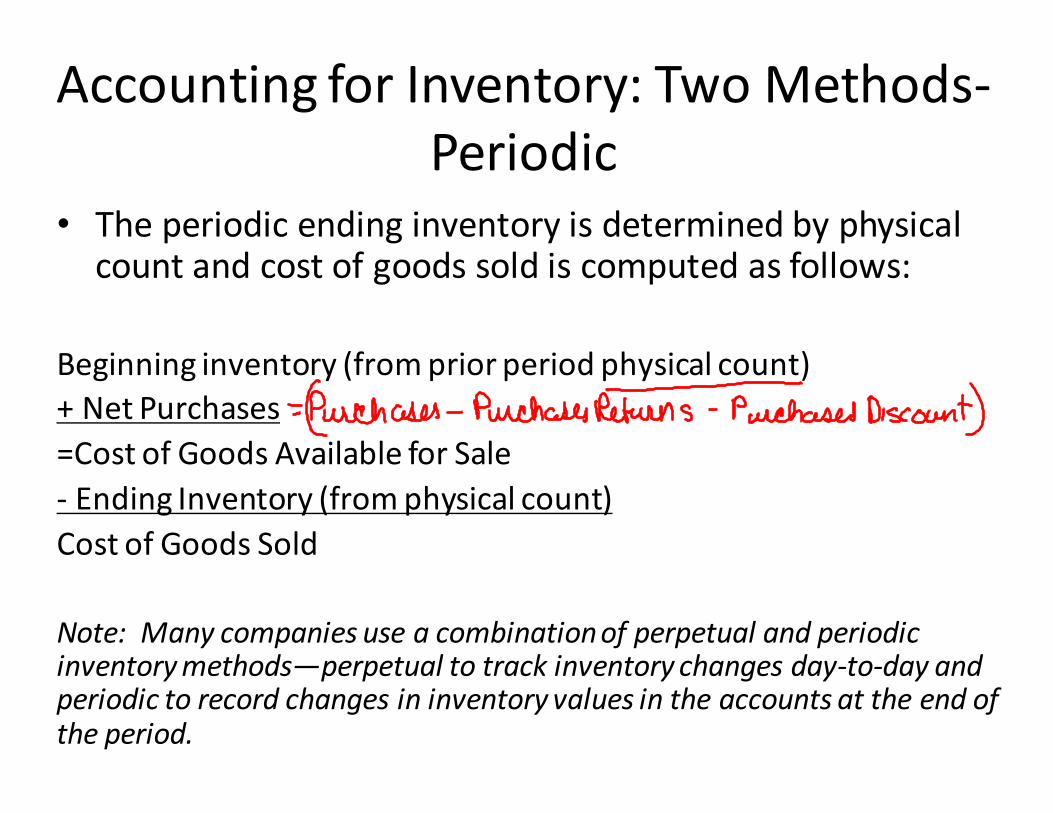
Accounting for Inventory: Two Methods-‐Periodic
• The periodic ending inventory is determined by physical count and cost of goods sold is computed as follows:
Beginning inventory (from prior period physical count)+ Net Purchases=Cost of Goods Available for Sale-‐ Ending Inventory (from physical count)Cost of Goods Sold
Note: Many companies use a combination of perpetual and periodic inventory methods—perpetual to track inventory changes day-‐to-‐day and periodic to record changes in inventory values in the accounts at the end of the period.
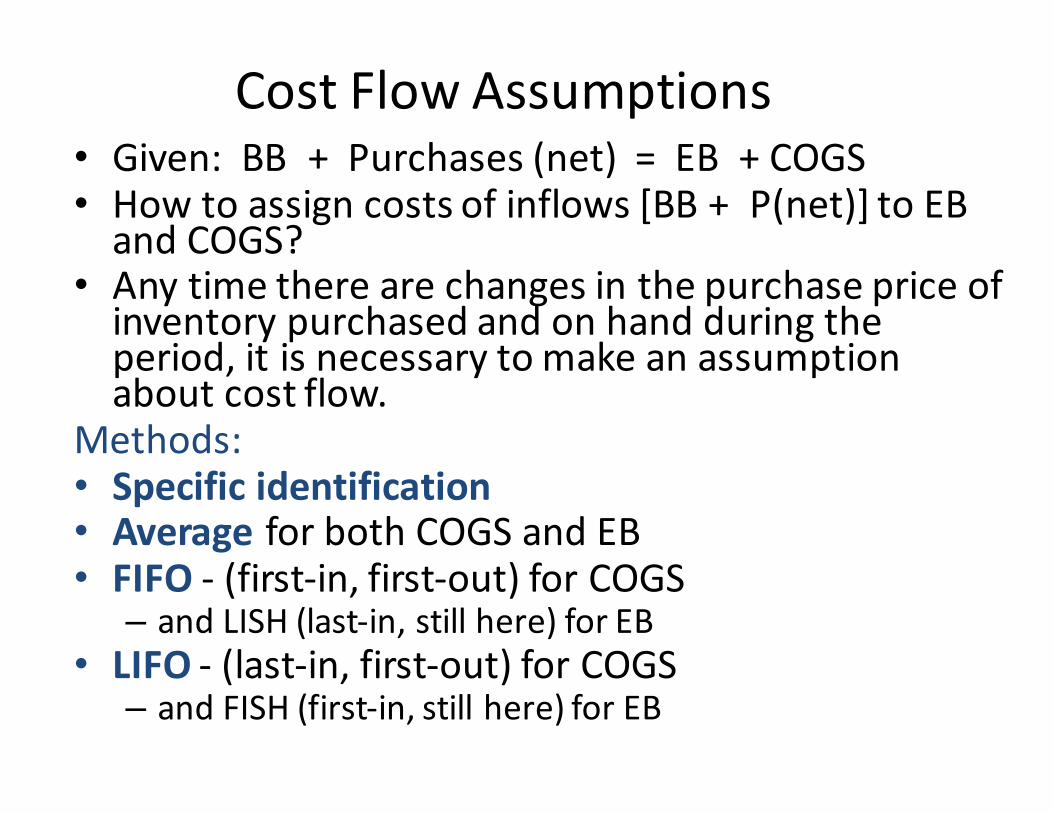
Cost Flow Assumptions• Given: BB + Purchases (net) = EB + COGS• How to assign costs of inflows [BB + P(net)] to EB and COGS?
• Any time there are changes in the purchase price of inventory purchased and on hand during the period, it is necessary to make an assumption about cost flow.
Methods:• Specific identification• Average for both COGS and EB• FIFO -‐ (first-‐in, first-‐out) for COGS– and LISH (last-‐in, still here) for EB
• LIFO -‐ (last-‐in, first-‐out) for COGS– and FISH (first-‐in, still here) for EB
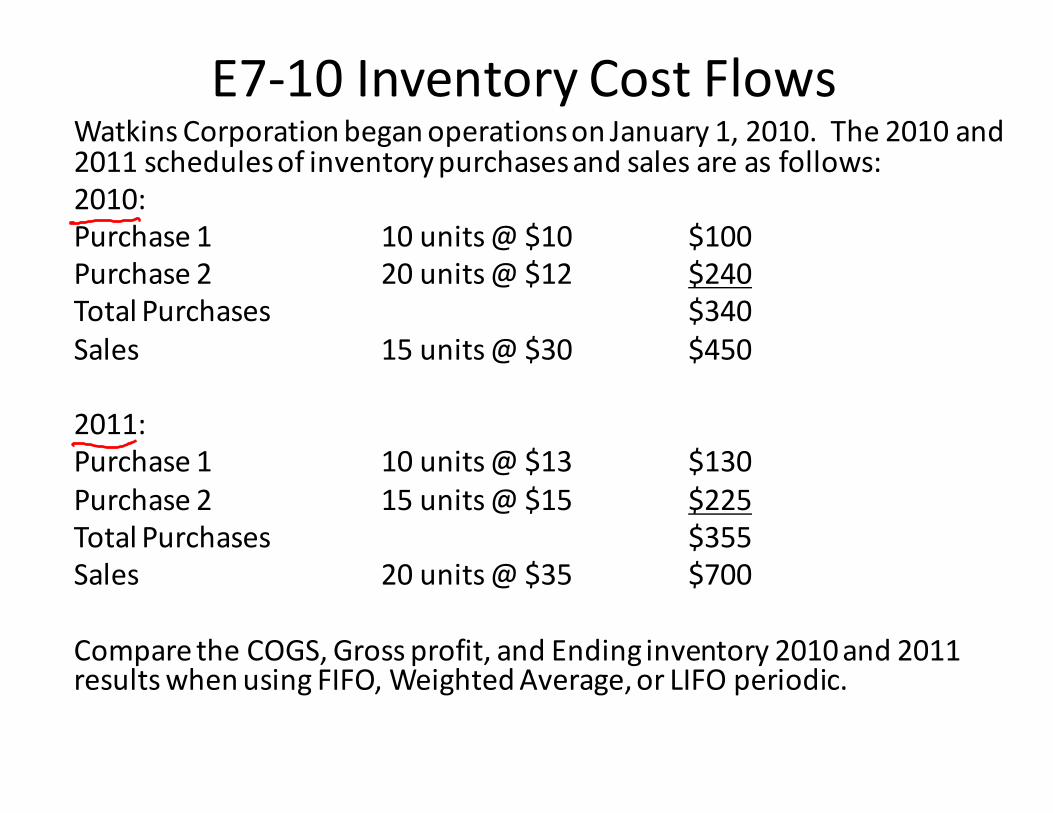
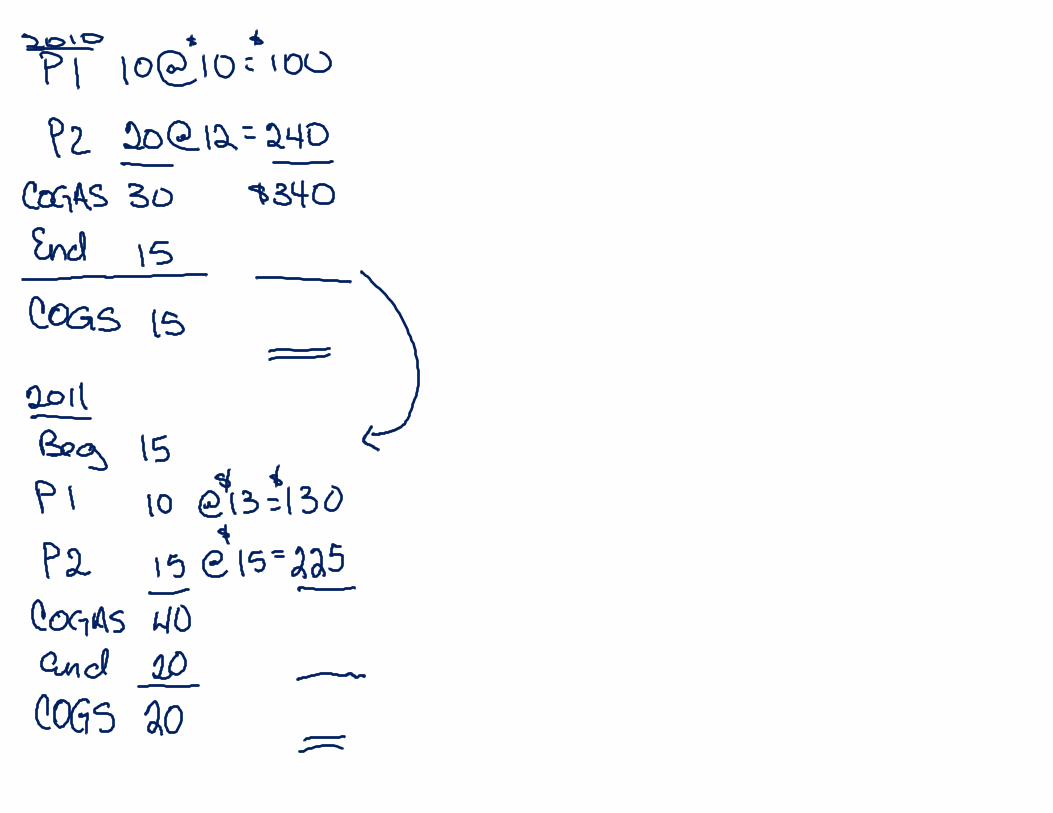
E7-‐10 Inventory Cost FlowsWatkins Corporation began operations on January 1, 2010. The 2010 and 2011 schedules of inventory purchases and sales are as follows:2010:Purchase 1 10 units @ $10 $100Purchase 2 20 units @ $12 $240Total Purchases $340Sales 15 units @ $30 $450
2011:Purchase 1 10 units @ $13 $130Purchase 2 15 units @ $15 $225Total Purchases $355Sales 20 units @ $35 $700
Compare the COGS, Gross profit, and Ending inventory 2010 and 2011 results when using FIFO, Weighted Average, or LIFO periodic.


Inventory Costing Method
Revenue Cost of Goods Sold Gross Margin Balance Sheet
Inventory
Weighted Average
FIFO
LIFO
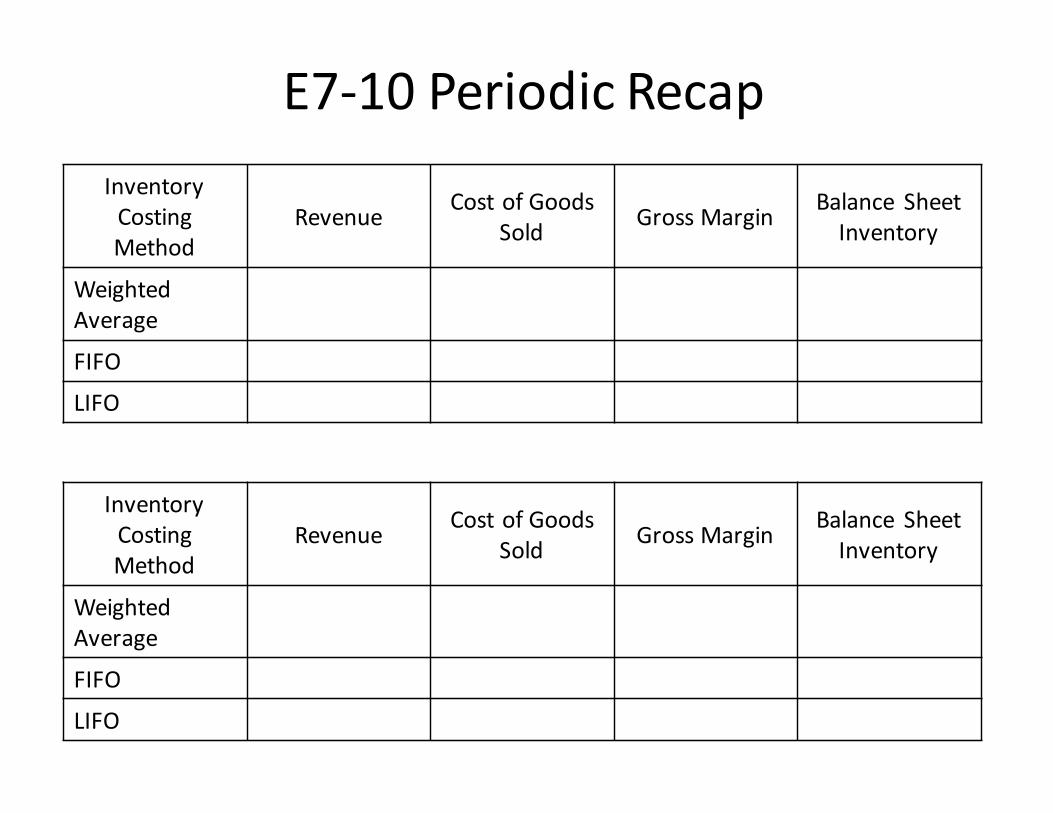
E7-‐10 Periodic RecapInventory Costing Method
Revenue Cost of Goods Sold Gross Margin Balance Sheet
Inventory
Weighted Average
FIFO
LIFO
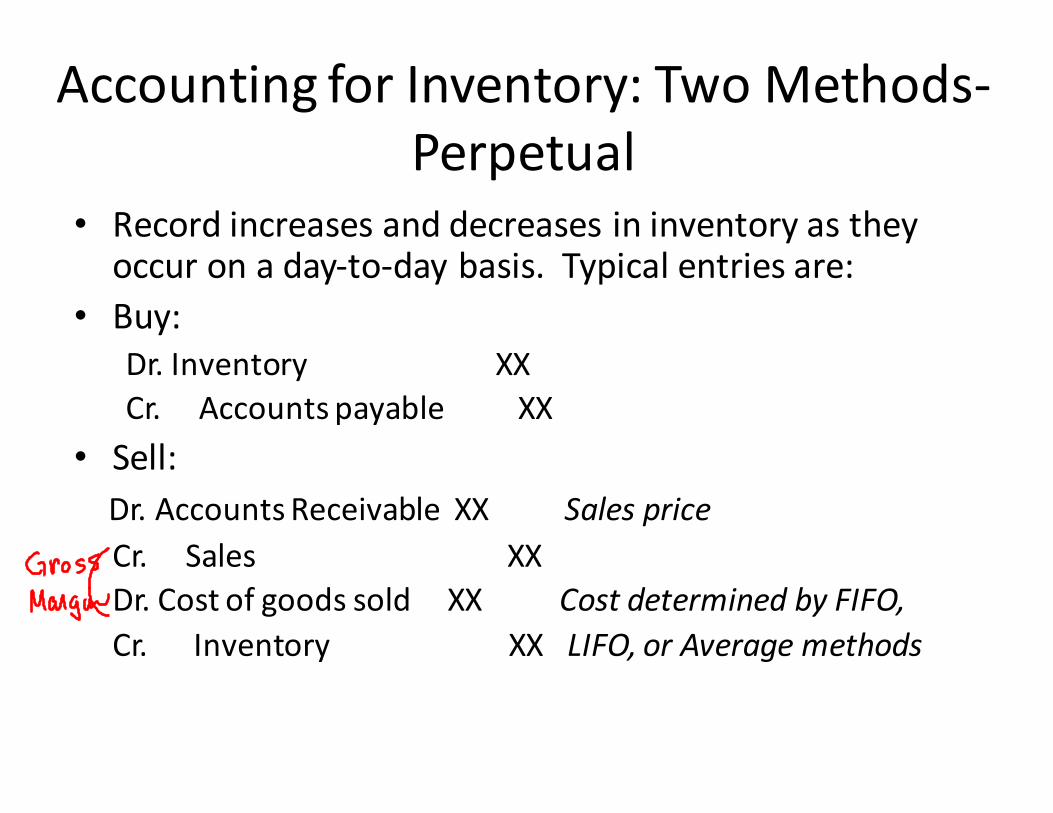
Accounting for Inventory: Two Methods-‐Perpetual
• Record increases and decreases in inventory as they occur on a day-‐to-‐day basis. Typical entries are:
• Buy: Dr. Inventory XXCr. Accounts payable XX
• Sell:Dr. Accounts Receivable XX Sales priceCr. Sales XXDr. Cost of goods sold XX Cost determined by FIFO, Cr. Inventory XX LIFO, or Average methods
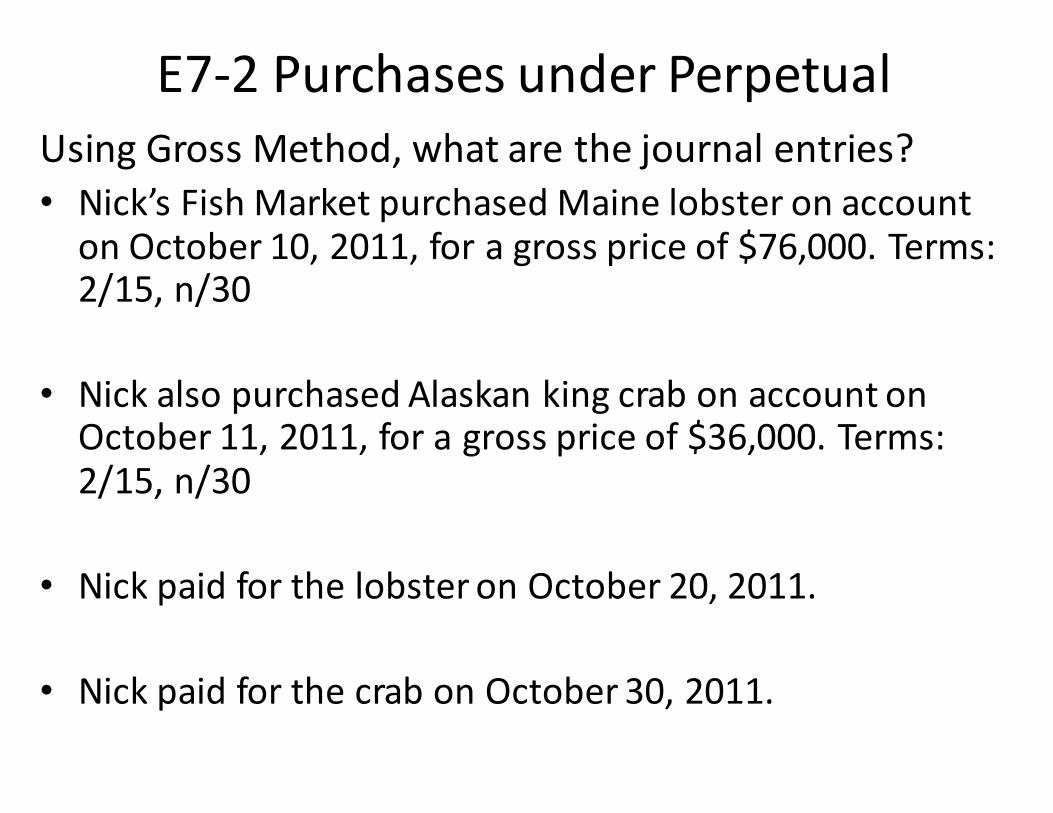
E7-‐2 Purchases under PerpetualUsing Gross Method, what are the journal entries?• Nick’s Fish Market purchased Maine lobster on account on October 10, 2011, for a gross price of $76,000. Terms: 2/15, n/30
• Nick also purchased Alaskan king crab on account on October 11, 2011, for a gross price of $36,000. Terms: 2/15, n/30
• Nick paid for the lobster on October 20, 2011.
• Nick paid for the crab on October 30, 2011.
Anatomy of Merchandise Inventory
Cost of Goods Sold: Account/Computation
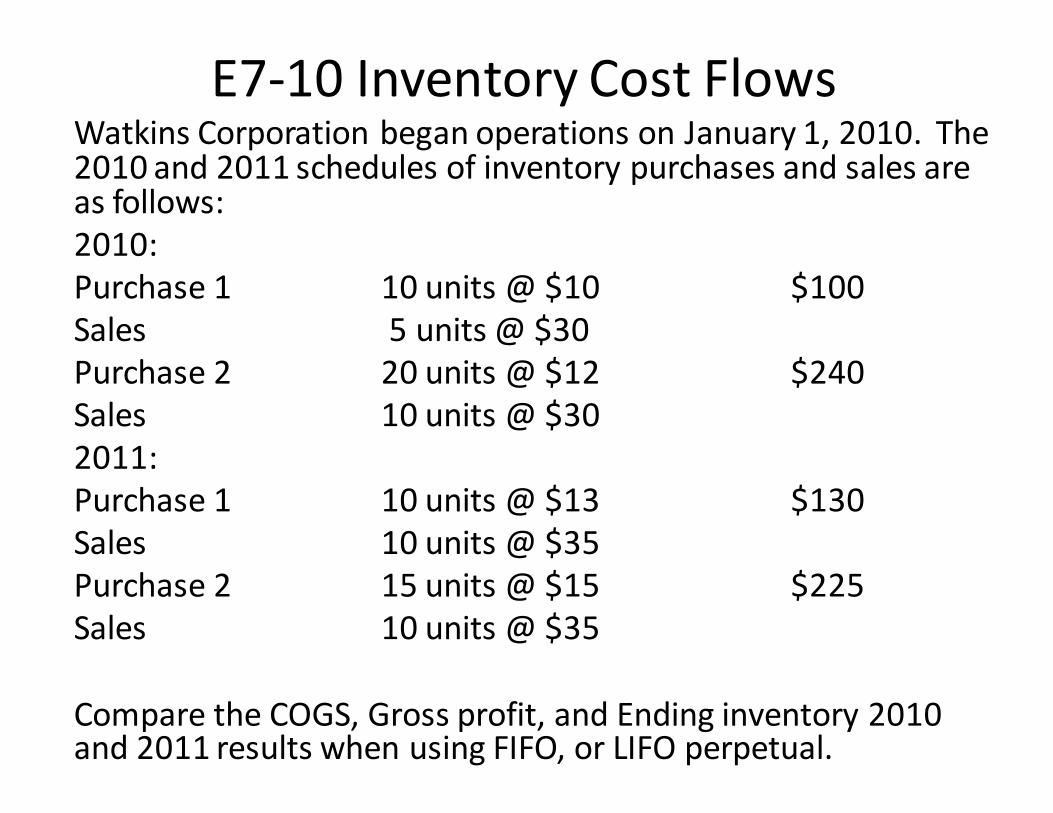
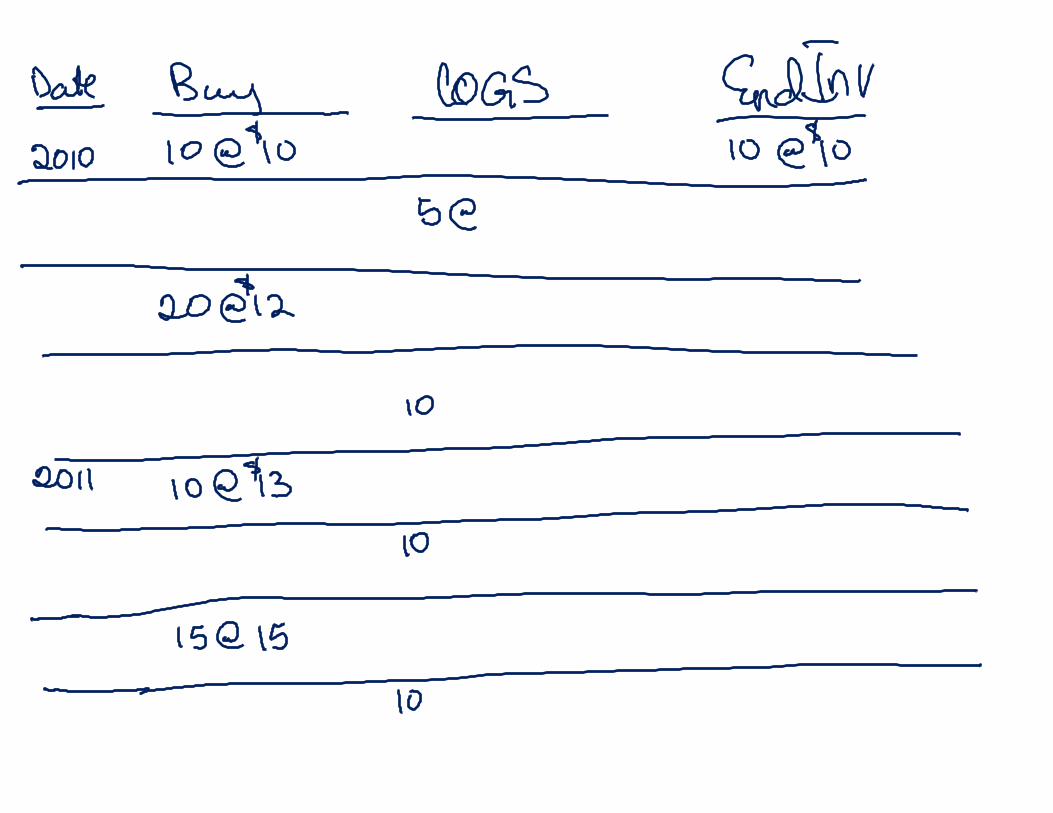
E7-‐10 Inventory Cost FlowsWatkins Corporation began operations on January 1, 2010. The 2010 and 2011 schedules of inventory purchases and sales are as follows:2010:Purchase 1 10 units @ $10 $100Sales 5 units @ $30Purchase 2 20 units @ $12 $240Sales 10 units @ $302011:Purchase 1 10 units @ $13 $130Sales 10 units @ $35Purchase 2 15 units @ $15 $225Sales 10 units @ $35
Compare the COGS, Gross profit, and Ending inventory 2010 and 2011 results when using FIFO, or LIFO perpetual.

Inventory Costing Method
Revenue Cost of Goods Sold Gross Margin Balance Sheet
Inventory
FIFO
LIFO
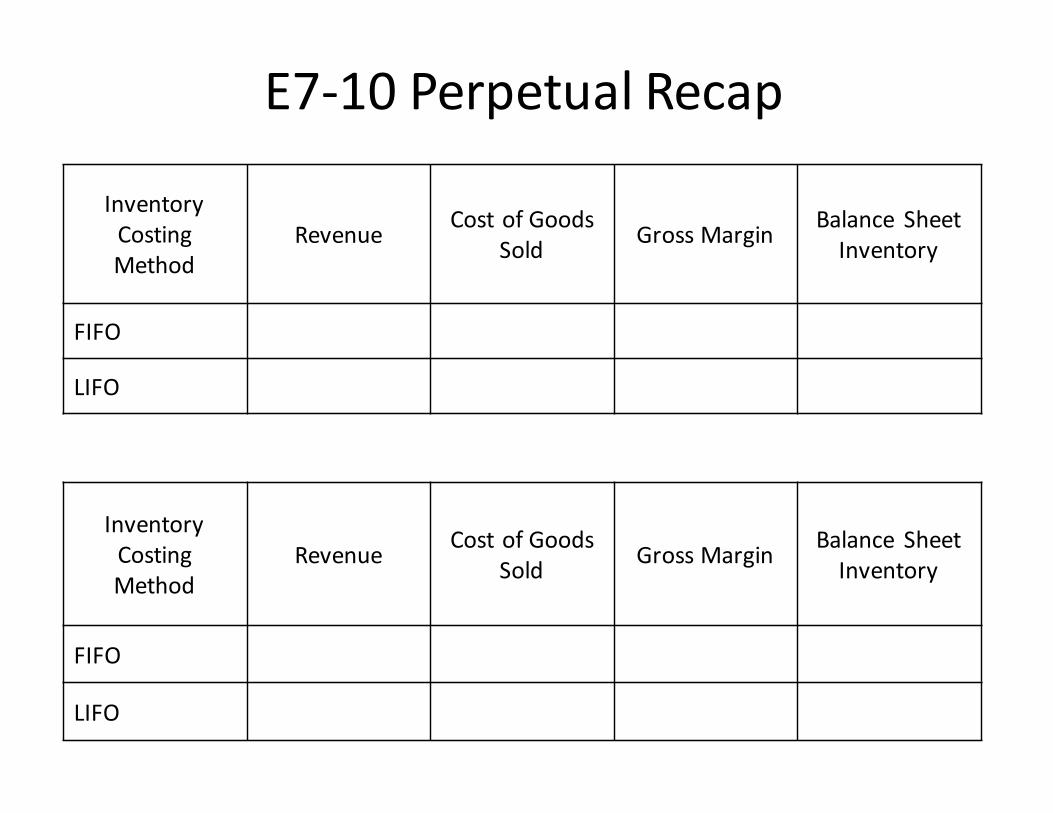
E7-‐10 Perpetual Recap
Inventory Costing Method
Revenue Cost of Goods Sold Gross Margin Balance Sheet
Inventory
FIFO
LIFO
Summary of LIFO, FIFO, Weighted Average• Managers have wide latitude in inventory cost flow decisions. Specific identification is generally considered appropriate where items of inventory are unique (low volume, high cost items) because of the potential for income manipulation.
• LIFO is generally used when prices are rising because of the tax advantages and the requirement that it be used in the financial statements if it is used for tax purposes.
• The only theoretical defense for LIFO is that in times of extreme inflation, it minimizes the inflationary distortions in the income statement by matching current dollars of revenues and expenses. However, the LIFO method, over time, misrepresents the balance sheet by understating inventory values.
Summary of FIFO, LIFO, Weighted Average• If a company adopts LIFO, it must disclose in its footnotes the “LIFO reserve” which is the difference between ending inventory ‘s FIFO value and LIFO value.
• FIFO’s advantage is that it provides a valuation for ending inventory that more closely approximates its current replacement cost. FIFO’s disadvantage is that it does not provide a good match of revenues and expenses in current dollars during periods of changing prices.
• Weighted average is a good compromise in that it generally provides a fairly good match of revenues and expenses as long as inventory is turning over fairly fast which keeps inventory levels fairly low. In such cases, it will tend to give an inventory value on the balance sheet that is closer to FIFO, since current purchases normally have more influence than beginning inventories on determining the average cost.
LIFO to FIFO Inventory Conversion• The difference between LIFO and FIFO inventory values is called the “LIFO Reserve.”
• Assuming prices rise over time, the effect on the balance sheet of using LIFO is that assets and shareholders’ equity (Retained Earnings) are lower than they would be under FIFO.
• The reduction is not equal to the LIFO reserve because of tax consequences. Inventory values may be lower but cash is higher by the amount of the LIFO reserve times the tax rate.
• Thus, total assets are lower by the LIFO reserve times (1-‐tax rate) and Retained Earnings is lower by the LIFO reserve times (1-‐tax rate).
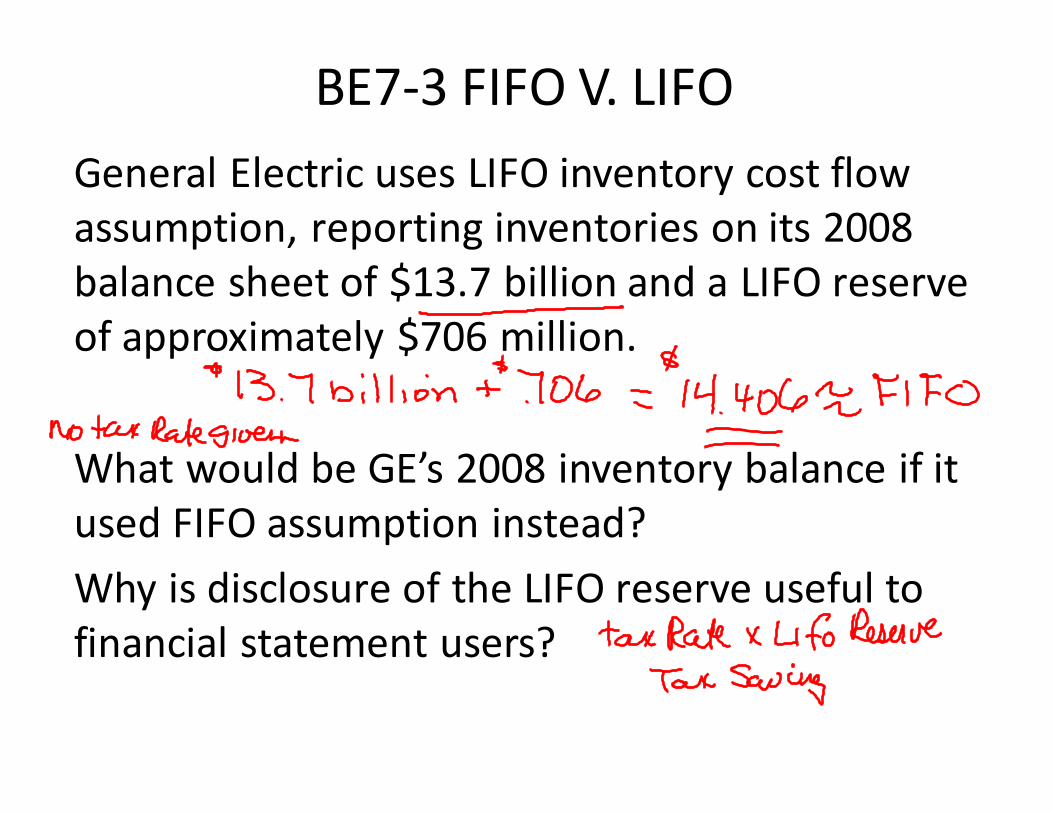
BE7-‐3 FIFO V. LIFOGeneral Electric uses LIFO inventory cost flow assumption, reporting inventories on its 2008 balance sheet of $13.7 billion and a LIFO reserve of approximately $706 million.
What would be GE’s 2008 inventory balance if it used FIFO assumption instead? Why is disclosure of the LIFO reserve useful to financial statement users?
Ending Inventory: Applying the Lower-‐of-‐Cost-‐or-‐Market Rule
• U.S. GAAP says that inventory, like most assets, should be carried at original cost (aka historical cost). For inventory, under the conservatism principle, a departure is appropriate if the replacement cost is less than the historical cost. So if inventory can be replaced for less than its original cost, then the difference between the original and replacement cost should be recognized as a loss.
• Applying the lower-‐of-‐cost-‐or-‐market rule to ending inventory is accomplished by comparing the cost allocated to ending inventory with the market (replacement) value of the inventory. If the market value exceeds the cost, no adjustment is made and the inventory remains at cost. If the market value is less than the cost, the inventories are written down to market value with an adjusting journal entry. The typical entry is:
Dr. Cost of goods sold (or Loss on inventory write down) XXCr. Inventory XX
ID7-‐4 LCOM and Recognition of Loss/IncomeTII Industries makes over-‐voltage protectors, power systems, and electronic products primarily for the communications industry. Several years ago, the company reported that it took “a substantial inventory write-‐down,” resulting in a loss for its third quarter ending June 24. The write-‐down was estimated to be $12 million and stems from customers’ changes in product specifications.a. Provide the journal entry to record the write-‐down.
b. Assume the original cost of the inventory was $52 million and that it was written down to its market value of $40 million. If TII sells it for $48 million cash in the following period, what journal entries would be recorded? Assume that TII uses the perpetual inventory method.
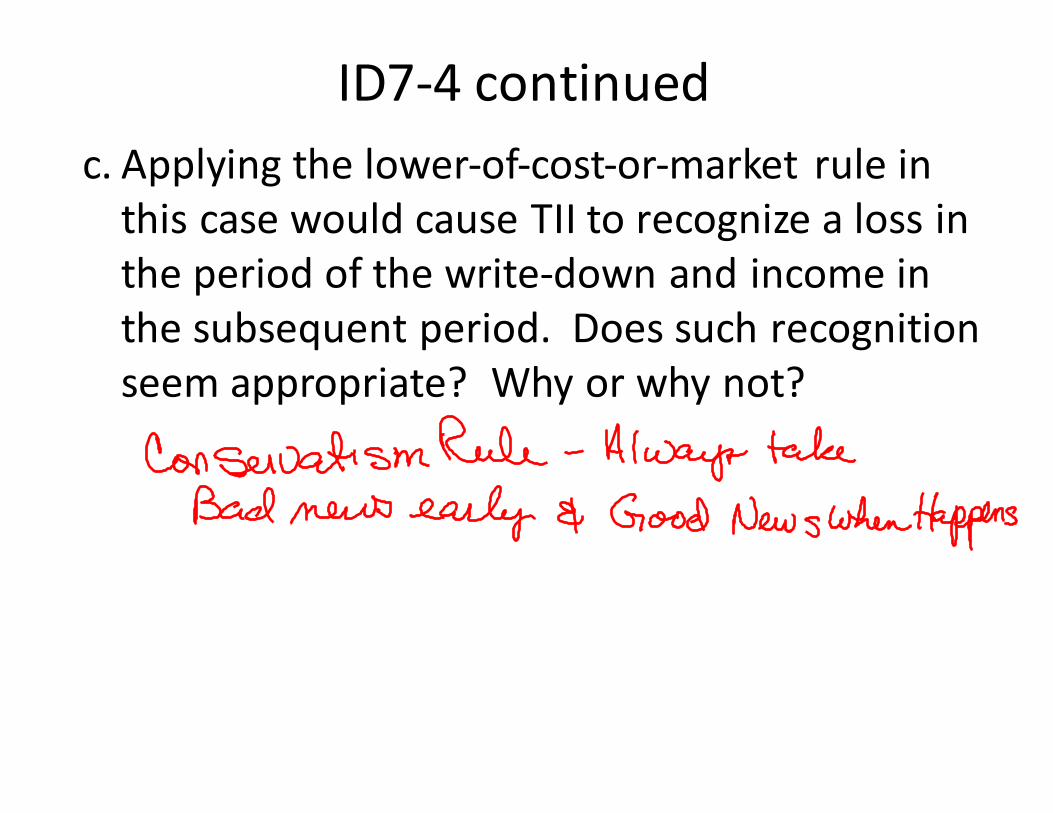
ID7-‐4 continuedc. Applying the lower-‐of-‐cost-‐or-‐market rule in this case would cause TII to recognize a loss in the period of the write-‐down and income in the subsequent period. Does such recognition seem appropriate? Why or why not?
International Perspective – Cost Flow Assumptions
• Under IFRS the LIFO method is prohibited. • This poses an important potential impediment to the adoption of IFRS in the US. Most LIFO users in the US have chosen LIFO because it results in an income tax savings.
• DuPont, for example, has saved over $150 million in income taxes because it uses LIFO.
• A shift to IFRS could impose a huge and immediate tax burden on LIFO users in the US.

The Lower-‐of-‐Cost-‐or-‐Market Rule and Hidden Reserves
• Based on conservatism, ending inventory is valued at cost or market value, whichever is lower.
• Problem: can create hidden reserves– Recognizes price decreases immediately– Defers price increase recognition until sold
• US GAAP and IFRS use different market values when applying the lower-‐of-‐cost-‐or-‐market rule. Under US GAAP the market value is usually the replacement cost. Under IFRS it is normally the realizable value.
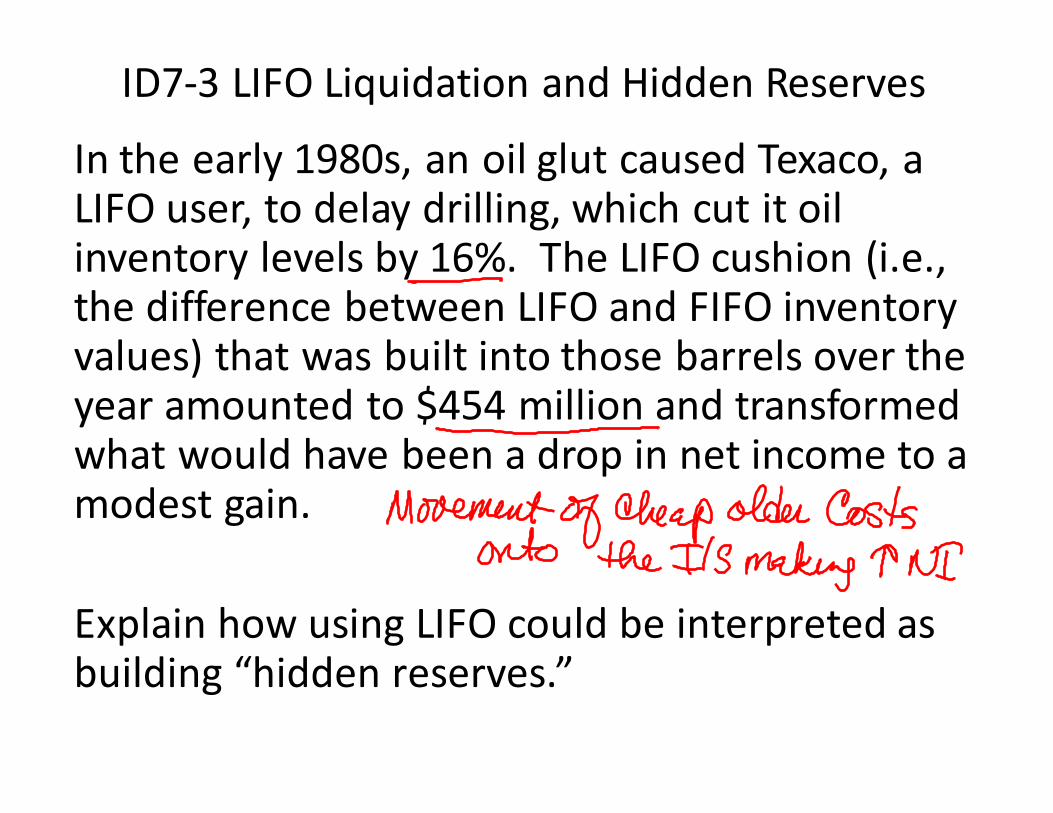
ID7-‐3 LIFO Liquidation and Hidden Reserves
In the early 1980s, an oil glut caused Texaco, a LIFO user, to delay drilling, which cut it oil inventory levels by 16%. The LIFO cushion (i.e., the difference between LIFO and FIFO inventory values) that was built into those barrels over the year amounted to $454 million and transformed what would have been a drop in net income to a modest gain.
Explain how using LIFO could be interpreted as building “hidden reserves.”
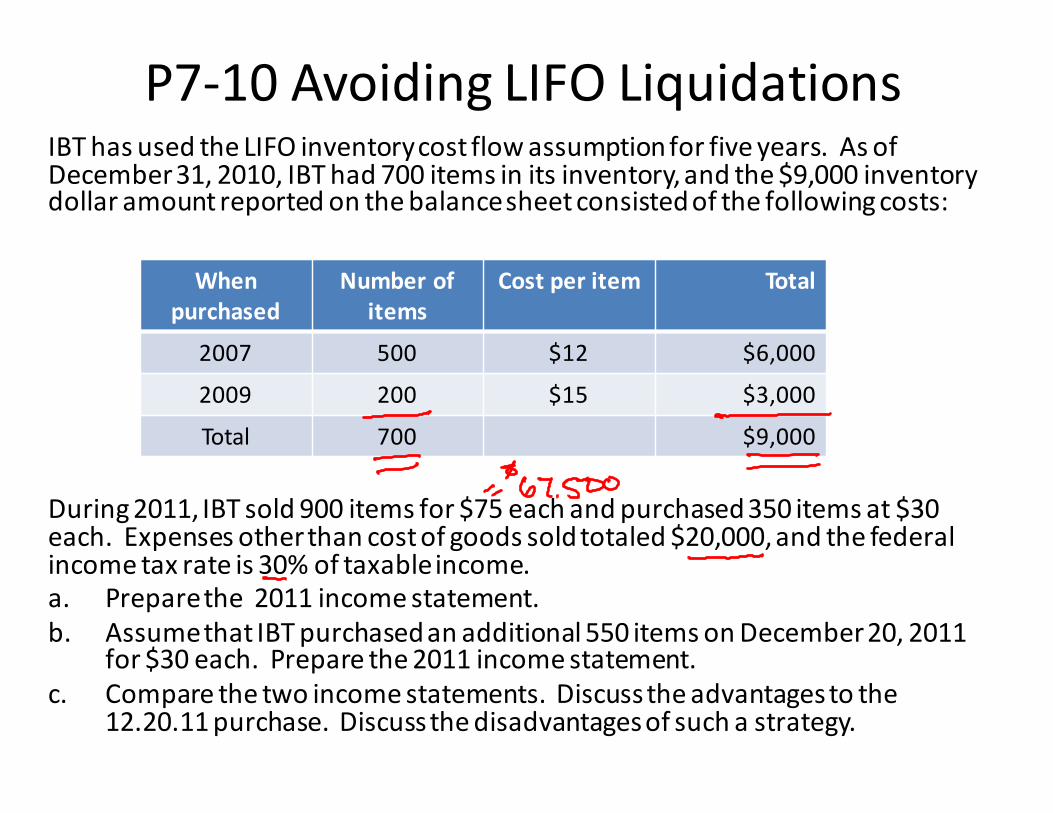
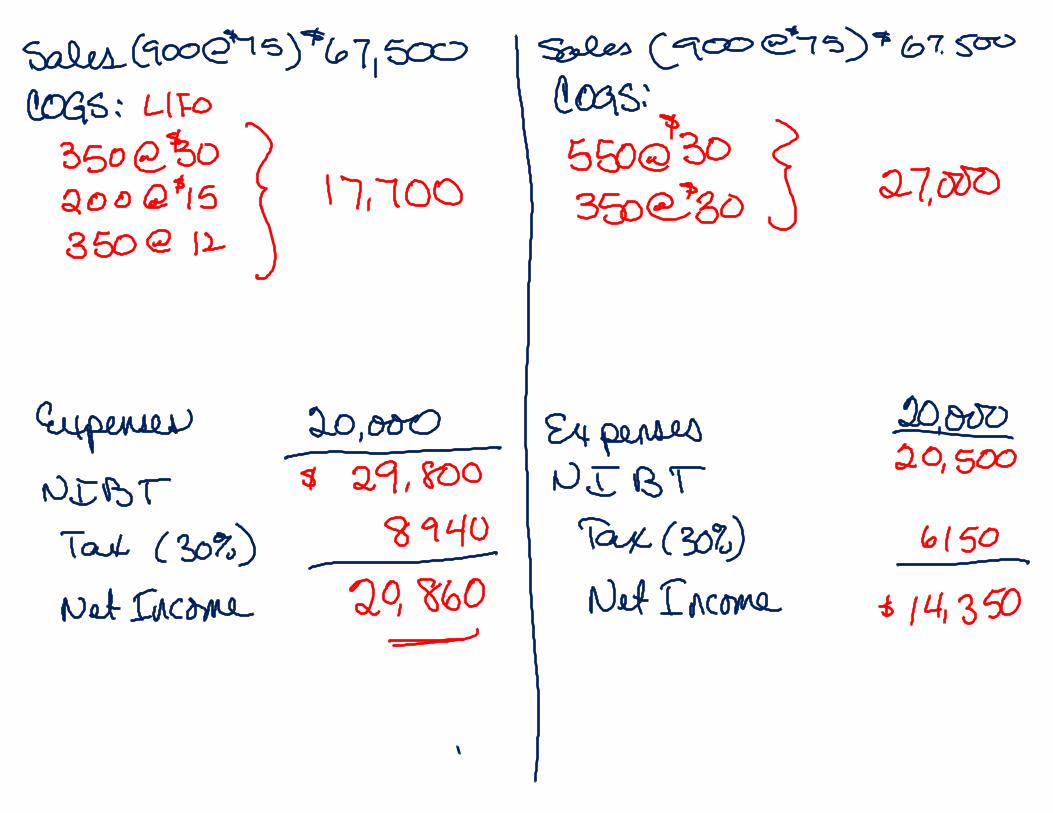
P7-‐10 Avoiding LIFO LiquidationsIBT has used the LIFO inventory cost flow assumption for five years. As of December 31, 2010, IBT had 700 items in its inventory, and the $9,000 inventory dollar amount reported on the balance sheet consisted of the following costs:
During 2011, IBT sold 900 items for $75 each and purchased 350 items at $30 each. Expenses other than cost of goods sold totaled $20,000, and the federal income tax rate is 30% of taxable income.a. Prepare the 2011 income statement.b. Assume that IBT purchased an additional 550 items on December 20, 2011
for $30 each. Prepare the 2011 income statement.c. Compare the two income statements. Discuss the advantages to the
12.20.11 purchase. Discuss the disadvantages of such a strategy.
When purchased
Number of items
Cost per item Total
2007 500 $12 $6,000
2009 200 $15 $3,000
Total 700 $9,000
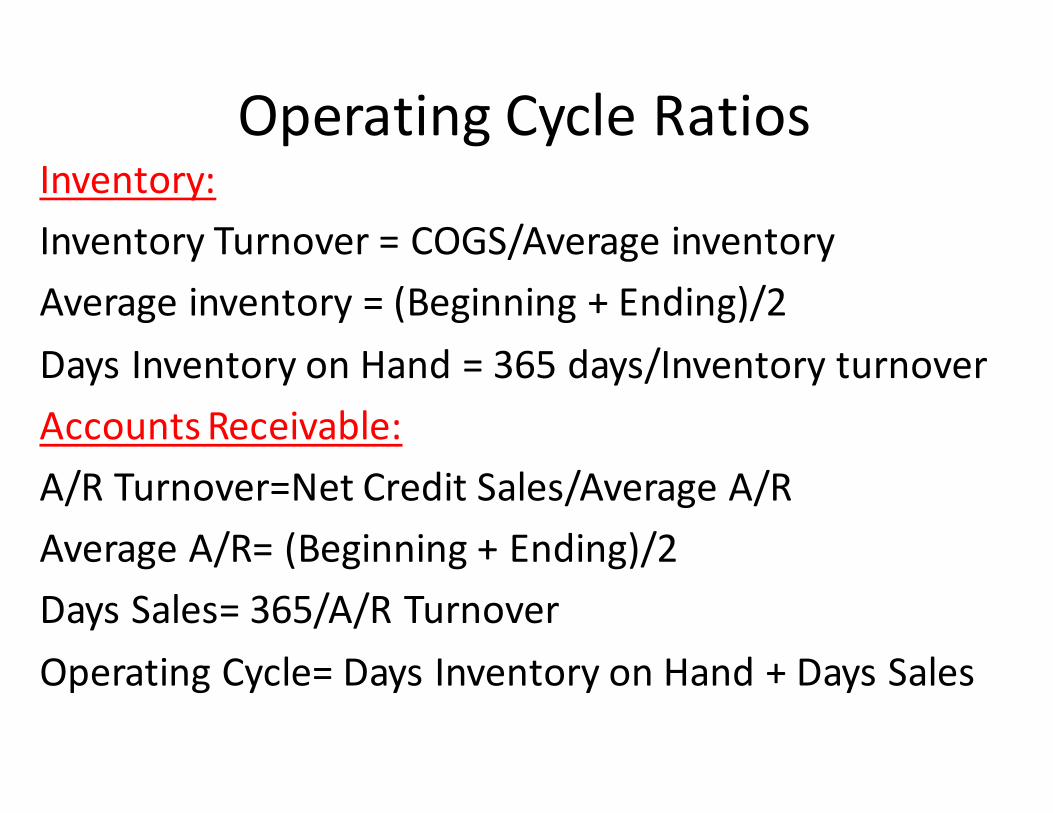
Operating Cycle RatiosInventory:Inventory Turnover = COGS/Average inventoryAverage inventory = (Beginning + Ending)/2Days Inventory on Hand = 365 days/Inventory turnoverAccounts Receivable:A/R Turnover=Net Credit Sales/Average A/RAverage A/R= (Beginning + Ending)/2Days Sales= 365/A/R TurnoverOperating Cycle= Days Inventory on Hand + Days Sales
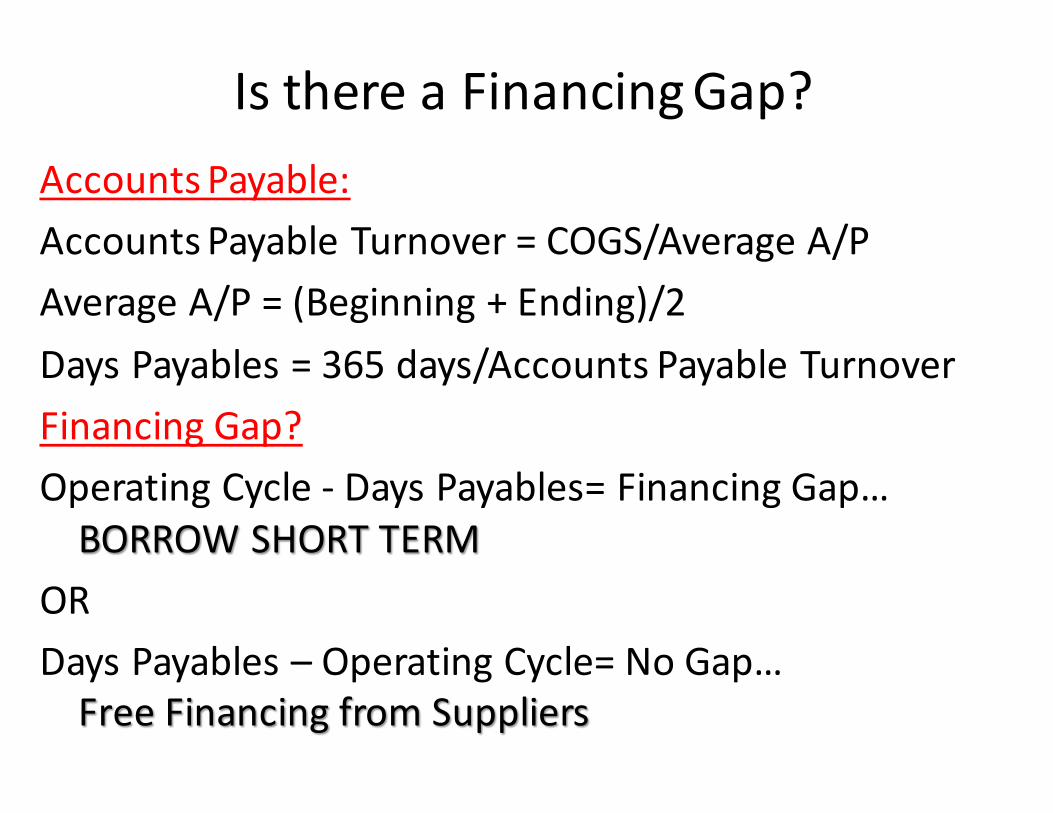
Is there a Financing Gap?Accounts Payable:Accounts Payable Turnover = COGS/Average A/PAverage A/P = (Beginning + Ending)/2Days Payables = 365 days/Accounts Payable TurnoverFinancing Gap?Operating Cycle -‐ Days Payables= Financing Gap… BORROW SHORT TERM
ORDays Payables – Operating Cycle= No Gap…Free Financing from Suppliers