Embed Size (px)
Citation preview
CDP Climate Change 2017 Information Request
AT&T Inc.
Module: Introduction
Page: Introduction
CC0.1
Introduction Please give a general description and introduction to your organization.
AT&T Inc. delivers advanced mobile services, next-generation TV, high-speed internet and smart solutions for people and businesses. We’re the largest provider of pay TV in the United States, where we offer TV and wireless nationwide, plus a large high-speed internet footprint. We offer a wide choice of internet speeds to meet customers’ needs. We also offer pay TV in 11 Latin American countries. We offer solutions that help businesses in every industry serve their customers better. We deliver advanced services to nearly 3.5 million businesses on 6 continents. That includes nearly all of the Fortune 1000 as well as neighborhood businesses across the United States. Our high-speed mobile internet network covers more than 400 million people and businesses across the U.S. and Mexico. We also wirelessly connect cars, machines, shipping containers and more. It's all part of our leadership in what’s called the Internet of Things. And we never stop innovating. The brightest minds in the business are in our AT&T Labs and Foundry centers developing new technologies, apps, products and services.
CC0.2
Reporting Year
Please state the start and end date of the year for which you are reporting data. The current reporting year is the latest/most recent 12-month period for which data is reported. Enter the dates of this year first. We request data for more than one reporting period for some emission accounting questions. Please provide data for the three years prior to the current reporting year if you have not provided this information before, or if this is the first time you have answered a CDP information request. (This does not apply if you have been

offered and selected the option of answering the shorter questionnaire). If you are going to provide additional years of data, please give the dates of those reporting periods here. Work backwards from the most recent reporting year. Please enter dates in following format: day(DD)/month(MM)/year(YYYY) (i.e. 31/01/2001).
Enter Periods that will be disclosed
Fri 01 Jan 2016 - Sat 31 Dec 2016
CC0.3
Country list configuration Please select the countries for which you will be supplying data. If you are responding to the Electric Utilities module, this selection will be carried forward to assist you in completing your response.
Select country
United States of America
Rest of world
CC0.4
Currency selection Please select the currency in which you would like to submit your response. All financial information contained in the response should be in this currency.
USD($)
CC0.6
Modules As part of the request for information on behalf of investors, companies in the electric utility sector, companies in the automobile and auto component manufacturing sector, companies in the oil and gas sector, companies in the information and communications technology sector (ICT) and companies in the food, beverage and tobacco sector (FBT) should complete supplementary questions in addition to the core questionnaire.
If you are in these sector groupings, the corresponding sector modules will not appear among the options of question CC0.6 but will automatically appear in the ORS navigation bar when you save this page. If you want to query your classification, please email [email protected]. If you have not been presented with a sector module that you consider would be appropriate for your company to answer, please select the module below in CC0.6.
Further Information
Module: Management
Page: CC1. Governance
CC1.1
Where is the highest level of direct responsibility for climate change within your organization?
Board or individual/sub-set of the Board or other committee appointed by the Board
CC1.1a
Please identify the position of the individual or name of the committee with this responsibility
The Public Policy and Corporate Reputation Committee of the AT&T Board of Directors has the highest level of responsibility for climate change within our organization and meets several times a year on sustainability matters. The Committee includes five members and more details can be found on our Corporate Governance website: https://www.att.com/gen/investor-relations?pid=5613
CC1.2
Do you provide incentives for the management of climate change issues, including the attainment of targets?
Yes
CC1.2a
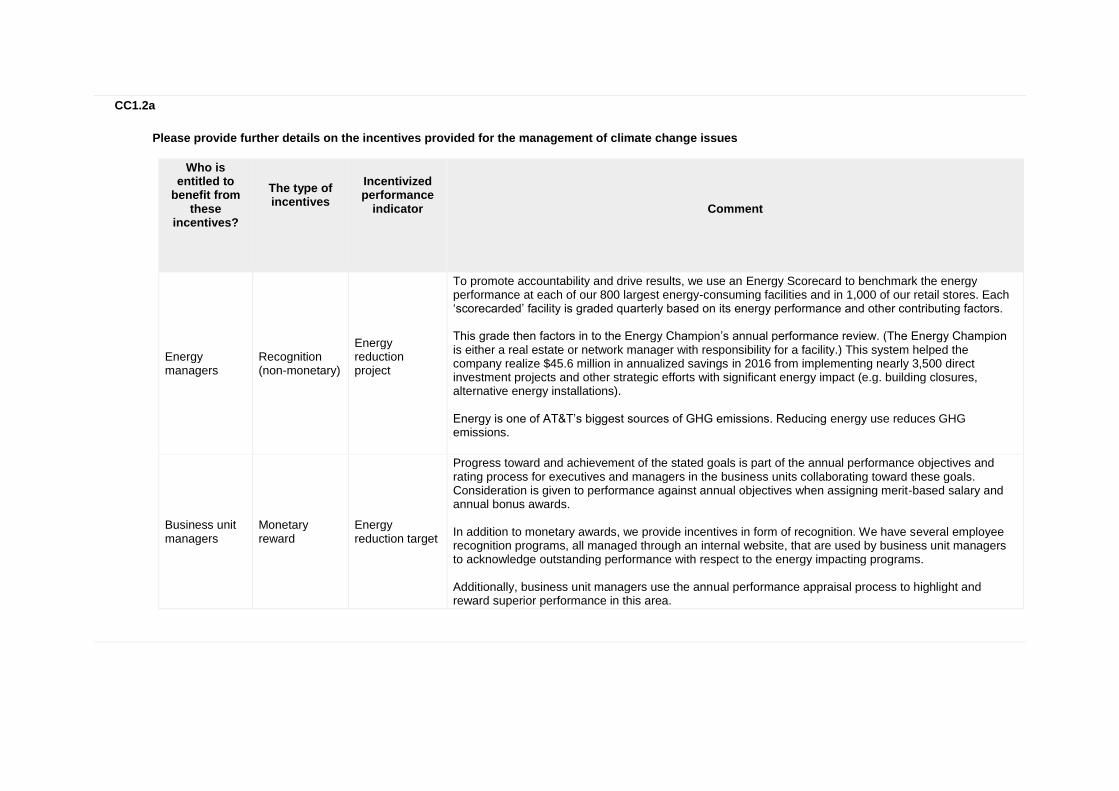
Please provide further details on the incentives provided for the management of climate change issues
Who is entitled to
benefit from these
incentives?
The type of incentives
Incentivized performance
indicator
Comment
Energy managers
Recognition (non-monetary)
Energy reduction project
To promote accountability and drive results, we use an Energy Scorecard to benchmark the energy performance at each of our 800 largest energy-consuming facilities and in 1,000 of our retail stores. Each ‘scorecarded’ facility is graded quarterly based on its energy performance and other contributing factors. This grade then factors in to the Energy Champion’s annual performance review. (The Energy Champion is either a real estate or network manager with responsibility for a facility.) This system helped the company realize $45.6 million in annualized savings in 2016 from implementing nearly 3,500 direct investment projects and other strategic efforts with significant energy impact (e.g. building closures, alternative energy installations). Energy is one of AT&T’s biggest sources of GHG emissions. Reducing energy use reduces GHG emissions.
Business unit managers
Monetary reward
Energy reduction target
Progress toward and achievement of the stated goals is part of the annual performance objectives and rating process for executives and managers in the business units collaborating toward these goals. Consideration is given to performance against annual objectives when assigning merit-based salary and annual bonus awards. In addition to monetary awards, we provide incentives in form of recognition. We have several employee recognition programs, all managed through an internal website, that are used by business unit managers to acknowledge outstanding performance with respect to the energy impacting programs. Additionally, business unit managers use the annual performance appraisal process to highlight and reward superior performance in this area.
Further Information
Page: CC2. Strategy
CC2.1
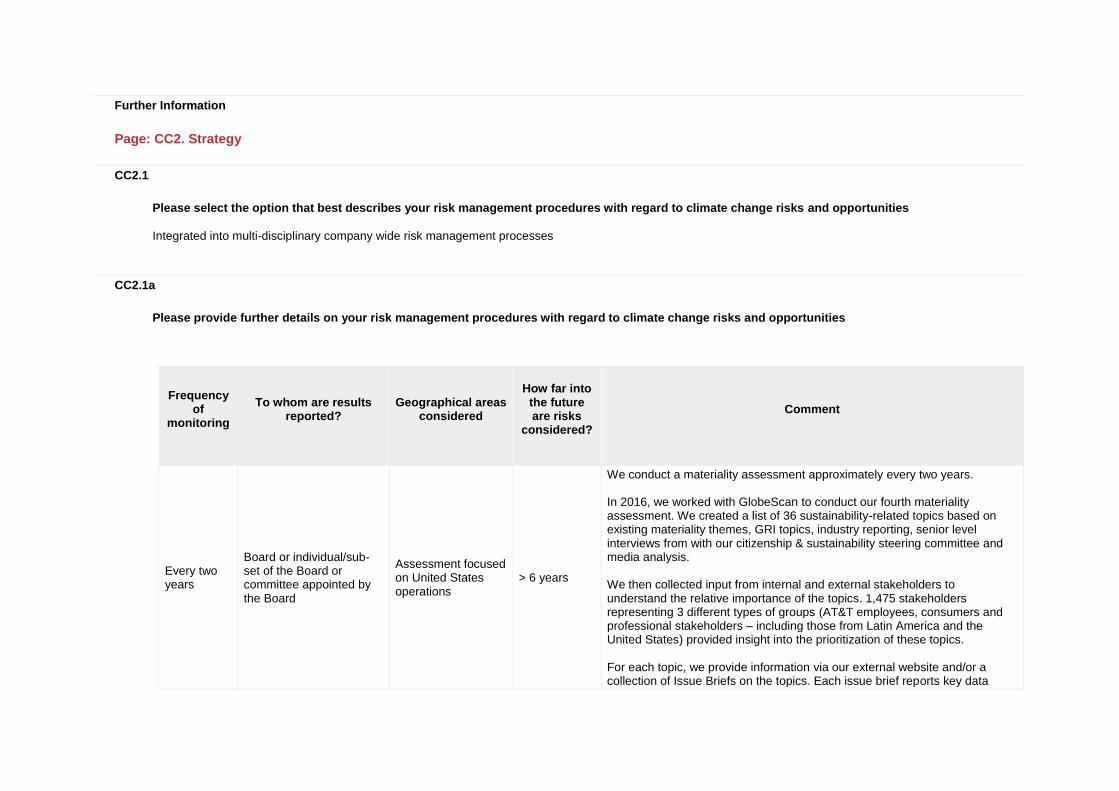
Please select the option that best describes your risk management procedures with regard to climate change risks and opportunities
Integrated into multi-disciplinary company wide risk management processes
CC2.1a
Please provide further details on your risk management procedures with regard to climate change risks and opportunities
Frequency
of monitoring
To whom are results
reported?
Geographical areas
considered
How far into
the future are risks
considered?
Comment
Every two years
Board or individual/sub-set of the Board or committee appointed by the Board
Assessment focused on United States operations
> 6 years
We conduct a materiality assessment approximately every two years. In 2016, we worked with GlobeScan to conduct our fourth materiality assessment. We created a list of 36 sustainability-related topics based on existing materiality themes, GRI topics, industry reporting, senior level interviews from with our citizenship & sustainability steering committee and media analysis. We then collected input from internal and external stakeholders to understand the relative importance of the topics. 1,475 stakeholders representing 3 different types of groups (AT&T employees, consumers and professional stakeholders – including those from Latin America and the United States) provided insight into the prioritization of these topics. For each topic, we provide information via our external website and/or a collection of Issue Briefs on the topics. Each issue brief reports key data
Frequency
of monitoring
To whom are results
reported?
Geographical areas
considered
How far into
the future are risks
considered?
Comment
information, GRI data, our management approach of the issue and details of company action. Annually, the Board reviews our published GHG and energy footprints via these issue briefs and our annual sustainability report.
CC2.1b
Please describe how your risk and opportunity identification processes are applied at both company and asset level
We rely on a formal sustainability strategic assessment to identify key risks and opportunities for our company. Identified risks and opportunities are shared across company operations and categorized by individual business units. At a company level, our Chief Sustainability Officer presents the results of the materiality assessment to the officer-level Citizenship and Sustainability Steering Committee and to the Public Policy and Corporate Reputation Committee of the AT&T Board of Directors. The assessment guides our programs, goals and reporting. At an asset level, our corporate real estate, risk management, external affairs and business continuity teams all play a role in assessing these risks. They monitor legislation that might impact energy prices, for example. They also track energy use in a centralized database in real time, which illuminates areas with potential risks and/or opportunity. Energy use and natural disasters are two of the most substantial risks and opportunities for us on an asset level. To further mitigate risk at an asset level, a cross-functional team from the corporate real estate, network, IT and other related organizations uses a proprietary site selection methodology that includes characteristics such as exposure to natural disasters (flood and drought zones) and expected electricity and water availability and costs to determine site locations.
CC2.1c
How do you prioritize the risks and opportunities identified?
In 2016, we worked with GlobeScan to conduct our fourth materiality assessment. With GlobeScan’s guidance, we created a list of 36 sustainability-related topics based on existing materiality themes, GRI topics, industry reporting, senior level interviews with our steering committee and media analysis. We then collected input from internal and external stakeholders to understand the relative importance of the topics. 1,475 stakeholders representing three different types of groups (AT&T employees, consumers and professional stakeholders – including those from Latin America and the United States) provided insight into the prioritization of these topics. We engaged most groups directly through surveys and interviews, or we relied on other resources (such as websites, sustainability reports and other
communications) as proxies to glean insight into their priorities. Internally, we interviewed 358 employees, including 45 executives and 291 managers to assess and rank the impacts of our topics on business success. This materiality assessment resulted in a table that prioritizes our top sustainability issues based on the assessment. The positioning of the issues illustrate the relative degree of importance for AT&T, with those in the top-right quadrant ranking highest for both our stakeholders and business success. We will monitor and assess all topics and report on them at least annually. Topics ranking higher with our stakeholders will promote more outside engagement and frequent communication. Top business priorities will necessitate engagement with our various business units. And the more highly ranked a topic is, the more our reporting will incorporate relevant goals, key performance indicators and other programmatic details. For each topic, we provide information through our external website and/or a collection of Issue Briefs. Each issue brief reports key information, GRI data, our management approach of the issue and details of company action.
CC2.1d
Please explain why you do not have a process in place for assessing and managing risks and opportunities from climate change, and whether you plan to introduce such a process in future
Main reason for not having a process
Do you plan to introduce a process?
Comment
CC2.2
Is climate change integrated into your business strategy?
Yes
CC2.2a
Please describe the process of how climate change is integrated into your business strategy and any outcomes of this process
a) Climate change has influenced our business strategy in many ways. Regarding the internal management of climate change issues, the Public Policy and Corporate Reputation Committee of the Board of Directors has oversight over all Citizenship & Sustainability (C&S) issues, including environmental sustainability and the management of company GHG emissions. The Chief Sustainability Officer (CSO) reports to the Public Policy Board committee several times a year to provide updates and receive input on the direction of the sustainability work within AT&T. The CSO’s report includes results of the bi-annual strategic assessment of sustainability-related risks and opportunities described below (in CC5.1 and 6.1). Specifically, progress with managing our carbon footprint is reviewed. Separately, our C&S Steering Committee is comprised of officers with responsibility for the business areas most linked to our sustainability priorities, including GHG
emissions management. The committee meets quarterly to identify priorities and align resources. It is headed by the CSO and the executive management team to further integrate sustainable business practices across the company and its supply chain. The Energy team, a sub-team of Corporate Real Estate, manages the calculations of AT&T’s GHG emissions, with the oversight of a member of the C&S team. The team is overseen by our Energy Director, who manages efforts across business units, drives programs to reduce energy use and directs AT&T’s energy purchasing strategies. b) Goal-setting is one example of how our business strategy has been influenced by climate change. We set a goal to reduce the electricity consumption of our company relative to data growth on our network by 60% by 2020 (compared to a 2013 baseline of 233 MWh/PB (Petabyte)). Our current target is 93 MWh/PB by EOY 2020. AT&T achieved a 40% reduction from our 2013 baseline with the resulting energy intensity for 2016 equal to 139 MWh/PB. To address Scope 1 emissions, including fleet related emissions, we set a goal to reduce our Scope 1 emissions 20% by 2020, (2008 Scope 1 baseline of 1,172,476 mtons CO2e). AT&T has updated its fleet goals. As a result of the improving the fuel efficiency of AT&T’s traditional fleet, AT&T is now focused on reducing emissions and deploying technology that will help achieve that goal regardless of the technology type – and which may include utilization of Alternative Fuel Vehicles. AT&T’s new fleet goal is to reduce AT&T’s U.S. fleet emissions by 30% by the end of 2020, from our 2008 baseline. Through 2016, AT&T has reduced its fleet emissions by 12%. c) Aspects of climate change that have influenced business strategy: Climate risks related to changes in regulations, physical climate parameters and volatility of energy and fuel prices, have influenced our strategy related to our energy use, GHG emissions and company fleet. Two other issues that have influenced our strategy are network reliability and disaster response. If disruptions occur to the network due to extreme weather or other reasons, our business is fundamentally disrupted. In 2016, we invested over $22.4B in our wired and wireless networks. Since its inception, AT&T has invested over $600 million in our Network Disaster Recovery program. d) Short-term strategy: We set an updated goal to reduce energy intensity by 60% relative to a 2013 baseline of 233 MWh/PB. Our current target is 93 MWh/PB by EOY 2020. AT&T’s electricity consumption (in Megawatt Hours) per Petabyte of data carried on its network (AT&T’s Energy Intensity Metric) for 2016 is 139 MWh/Petabyte. Relative to our 2020 target, AT&T has achieved a 40% reduction, as compared to the 2013 baseline of 233 MWh/Petabyte. Over the short term (next 5 years) we are working with several business units inside our Mobility and Business Solutions organization to position and promote the potential benefits of AT&T technology. We are also working with top suppliers to evaluate their sustainability practices. Through CDP, EcoDesk and our own survey, we engage with our suppliers on their emissions. We met our 2015 goal with suppliers representing more than 50% of spend reported that they were tracking greenhouse gas emissions and had greenhouse gas reduction goals. This is a part of our larger goal to lead our supply chain to improve its social and environmental impacts by integrating sustainability performance metrics into our sourcing decisions for 80% of our spend by 2020. e) Long- term strategy: In December 2015, we declared a new long-term goal that AT&T will enable carbon savings 10 times the carbon footprint of our operations by enhancing the efficiency of our network and delivering sustainable customer solutions. These types of efforts are integrated into our long-term strategy for 2025 and beyond. The technologies we innovate today will help us address the challenges that we experience in 20+ years. We work with several groups to publicly promote the use of technology to address climate and resource challenges, including QuEST Forum, Joint Audit Cooperation (JAC), GeSI, DESSC, Green Grid and the Alliance for Telecommunication Industry Solutions, BlueGreen Alliance, BRT, CDP, Carbon War Room and GreenBiz. In addition to our 2017 goals, we added the following new supply chain sustainability goals to our long-term strategy: 1) 2020 Goal: We will lead our supply chain to improve its social and environmental impacts by integrating sustainability performance metrics into our sourcing decisions for 80% of our spend. 2) 2025 Goal: We will work with our industry peers to develop and promote adoption of sustainability metrics that will transform the environmental and social impact of technology supply chains. These goals are posted on our att.com/csr website.
f) Strategic advantage: By reducing energy use –our primary source of emissions – we can reduce associated costs, which ultimately benefits our bottom line. Communicating with consumers about how our services enable them to operate more sustainably offers a competitive advantage. We found when 2 products are priced evenly, consumers can find environmental sustainability as a distinguishing feature. g) Making substantial business decisions: Business resources are being dedicated to address challenges and opportunities related to GHG emissions reduction and to take advantage of both opportunities and to mitigate risks – including those related to climate risks, such as regulatory, physical and energy and fuel price volatility risks. We set an absolute Scope 1 GHG emissions reduction goal and are investing in alternative fuel vehicles, and a strong energy management program. The most substantial business decision we made regarding climate change in 2016 was to implement approximately 25,000 energy efficiency projects that totaled an annualized savings of $101 million.
CC2.2b
Please explain why climate change is not integrated into your business strategy
CC2.2c
Does your company use an internal price on carbon?
No, and we currently don't anticipate doing so in the next 2 years
CC2.2d
Please provide details and examples of how your company uses an internal price on carbon
CC2.3
Do you engage in activities that could either directly or indirectly influence public policy on climate change through any of the following? (tick all that apply)

Direct engagement with policy makers Trade associations
CC2.3a
On what issues have you been engaging directly with policy makers?
Focus of legislation
Corporate Position
Details of engagement
Proposed legislative solution
Adaptation resiliency
Support with minor exceptions
The power sector is one of the largest end-use sectors, and their emissions are driven by the combustion of fossil fuels, which release CO2 and other GHG gases. Capturing the chemical energy trapped in fossil fuels and converting it to mechanical energy in a turbine and then electricity energy is inefficient and only 35-40% of the captured energy can be used for electricity (SMARTer2020, GeSI, 2012). Information and Communications Technology (ICT) can reduce the inefficiencies of the power sector and the dependence on fossil fuels. We estimate that the abatement potential by 2025 is 9.7 gigatons of CO2e (Smarter 2030, GESI, 2015).
ICT can be instrumental in integrating electricity into the grid, managing intermittent electricity production, monitoring and optimizing the performance of the generation, and helping to predict the impact of the weather on generation, as well as in many other applications (SMARTer2030, GeSI, 2015).
CC2.3b
Are you on the Board of any trade associations or provide funding beyond membership?
Yes
CC2.3c
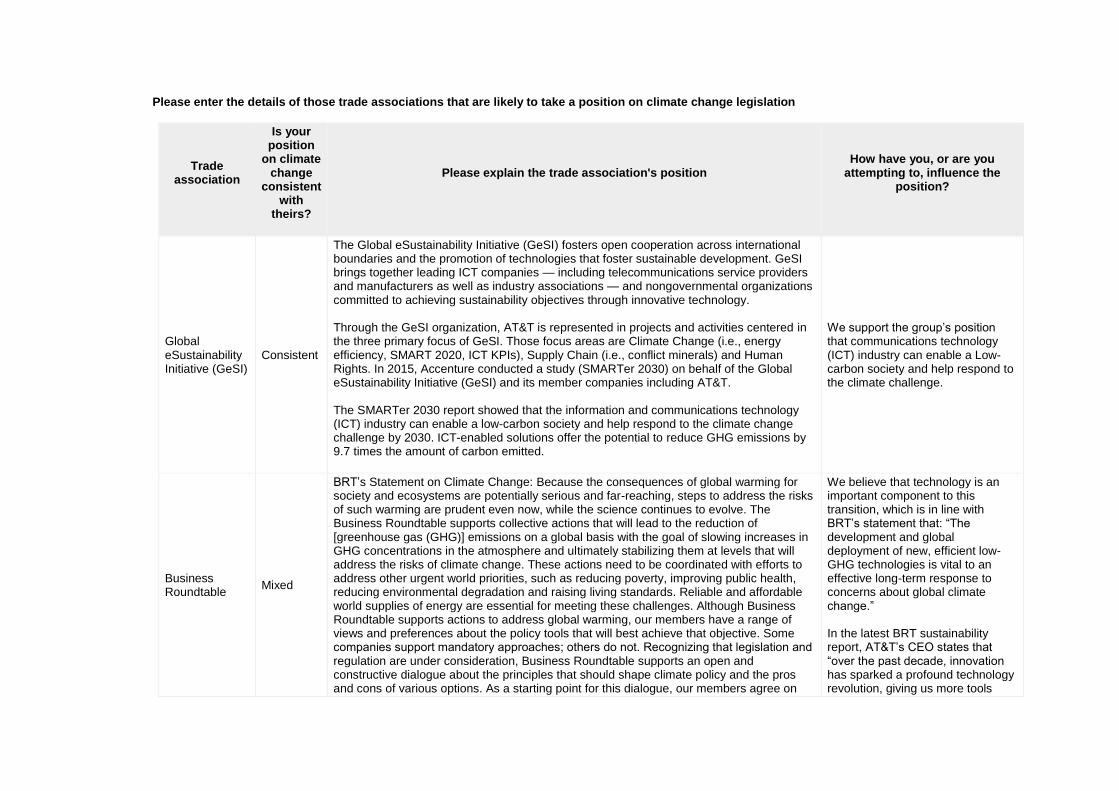
Please enter the details of those trade associations that are likely to take a position on climate change legislation
Trade association
Is your position
on climate change
consistent with
theirs?
Please explain the trade association's position
How have you, or are you attempting to, influence the
position?
Global eSustainability Initiative (GeSI)
Consistent
The Global eSustainability Initiative (GeSI) fosters open cooperation across international boundaries and the promotion of technologies that foster sustainable development. GeSI brings together leading ICT companies — including telecommunications service providers and manufacturers as well as industry associations — and nongovernmental organizations committed to achieving sustainability objectives through innovative technology. Through the GeSI organization, AT&T is represented in projects and activities centered in the three primary focus of GeSI. Those focus areas are Climate Change (i.e., energy efficiency, SMART 2020, ICT KPIs), Supply Chain (i.e., conflict minerals) and Human Rights. In 2015, Accenture conducted a study (SMARTer 2030) on behalf of the Global eSustainability Initiative (GeSI) and its member companies including AT&T. The SMARTer 2030 report showed that the information and communications technology (ICT) industry can enable a low-carbon society and help respond to the climate change challenge by 2030. ICT-enabled solutions offer the potential to reduce GHG emissions by 9.7 times the amount of carbon emitted.
We support the group’s position that communications technology (ICT) industry can enable a Low-carbon society and help respond to the climate challenge.
Business Roundtable
Mixed
BRT’s Statement on Climate Change: Because the consequences of global warming for society and ecosystems are potentially serious and far-reaching, steps to address the risks of such warming are prudent even now, while the science continues to evolve. The Business Roundtable supports collective actions that will lead to the reduction of [greenhouse gas (GHG)] emissions on a global basis with the goal of slowing increases in GHG concentrations in the atmosphere and ultimately stabilizing them at levels that will address the risks of climate change. These actions need to be coordinated with efforts to address other urgent world priorities, such as reducing poverty, improving public health, reducing environmental degradation and raising living standards. Reliable and affordable world supplies of energy are essential for meeting these challenges. Although Business Roundtable supports actions to address global warming, our members have a range of views and preferences about the policy tools that will best achieve that objective. Some companies support mandatory approaches; others do not. Recognizing that legislation and regulation are under consideration, Business Roundtable supports an open and constructive dialogue about the principles that should shape climate policy and the pros and cons of various options. As a starting point for this dialogue, our members agree on
We believe that technology is an important component to this transition, which is in line with BRT’s statement that: “The development and global deployment of new, efficient low-GHG technologies is vital to an effective long-term response to concerns about global climate change.” In the latest BRT sustainability report, AT&T’s CEO states that “over the past decade, innovation has sparked a profound technology revolution, giving us more tools
Trade association
Is your position
on climate change
consistent with
theirs?
Please explain the trade association's position
How have you, or are you attempting to, influence the
position?
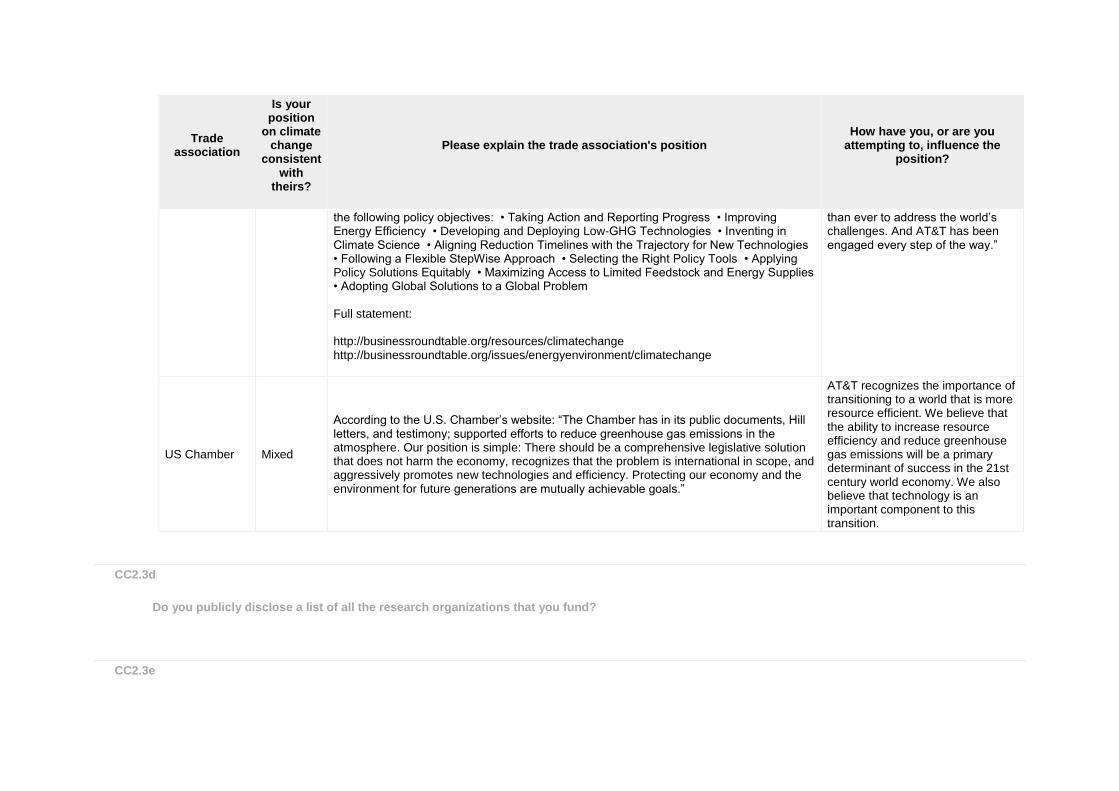
the following policy objectives: • Taking Action and Reporting Progress • Improving Energy Efficiency • Developing and Deploying Low-GHG Technologies • Inventing in Climate Science • Aligning Reduction Timelines with the Trajectory for New Technologies • Following a Flexible StepWise Approach • Selecting the Right Policy Tools • Applying Policy Solutions Equitably • Maximizing Access to Limited Feedstock and Energy Supplies • Adopting Global Solutions to a Global Problem Full statement: http://businessroundtable.org/resources/climatechange http://businessroundtable.org/issues/energyenvironment/climatechange
than ever to address the world’s challenges. And AT&T has been engaged every step of the way.”
US Chamber Mixed
According to the U.S. Chamber’s website: “The Chamber has in its public documents, Hill letters, and testimony; supported efforts to reduce greenhouse gas emissions in the atmosphere. Our position is simple: There should be a comprehensive legislative solution that does not harm the economy, recognizes that the problem is international in scope, and aggressively promotes new technologies and efficiency. Protecting our economy and the environment for future generations are mutually achievable goals.”
AT&T recognizes the importance of transitioning to a world that is more resource efficient. We believe that the ability to increase resource efficiency and reduce greenhouse gas emissions will be a primary determinant of success in the 21st century world economy. We also believe that technology is an important component to this transition.
CC2.3d
Do you publicly disclose a list of all the research organizations that you fund?
CC2.3e
Please provide details of the other engagement activities that you undertake
CC2.3f
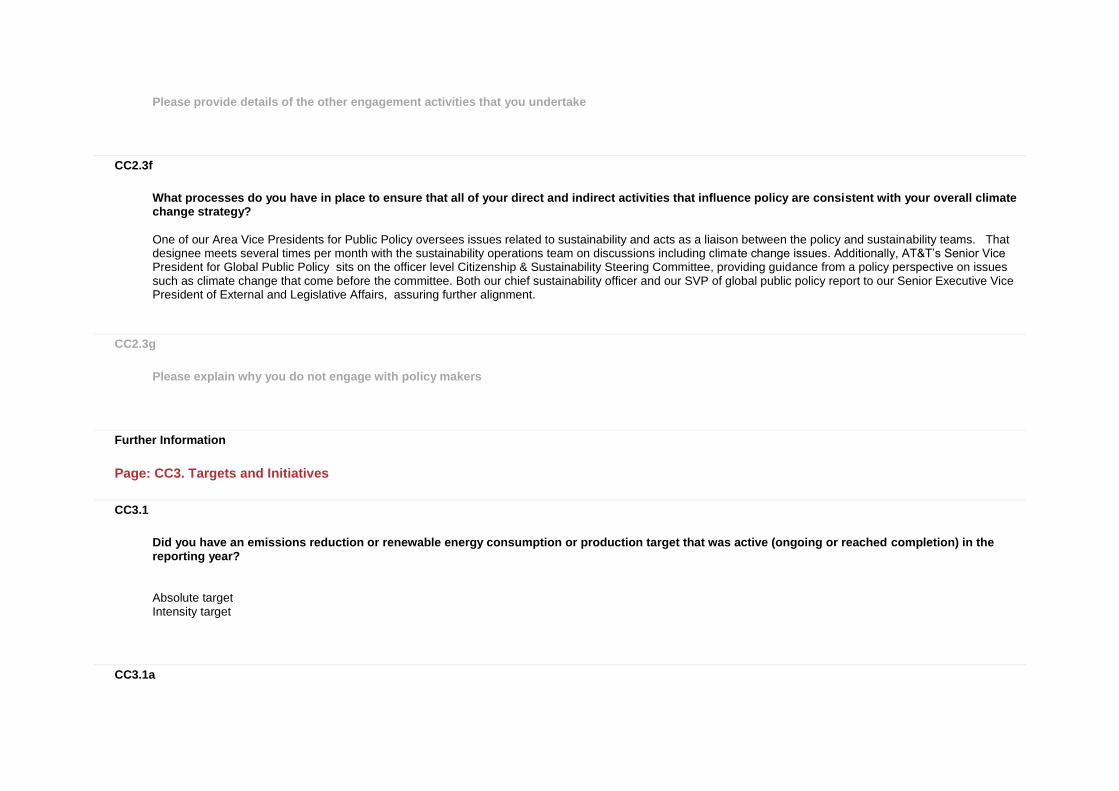
What processes do you have in place to ensure that all of your direct and indirect activities that influence policy are consistent with your overall climate change strategy?
One of our Area Vice Presidents for Public Policy oversees issues related to sustainability and acts as a liaison between the policy and sustainability teams. That designee meets several times per month with the sustainability operations team on discussions including climate change issues. Additionally, AT&T’s Senior Vice President for Global Public Policy sits on the officer level Citizenship & Sustainability Steering Committee, providing guidance from a policy perspective on issues such as climate change that come before the committee. Both our chief sustainability officer and our SVP of global public policy report to our Senior Executive Vice President of External and Legislative Affairs, assuring further alignment.
CC2.3g
Please explain why you do not engage with policy makers
Further Information
Page: CC3. Targets and Initiatives
CC3.1
Did you have an emissions reduction or renewable energy consumption or production target that was active (ongoing or reached completion) in the reporting year?
Absolute target Intensity target
CC3.1a
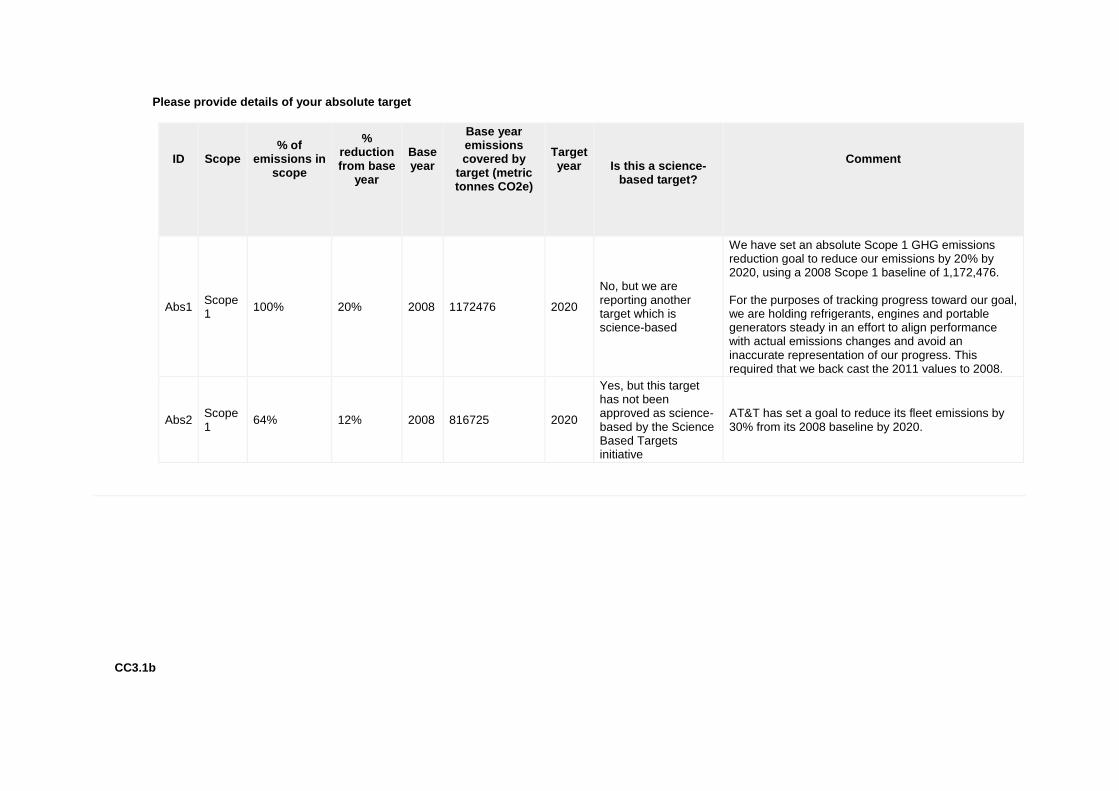
Please provide details of your absolute target
ID
Scope
% of emissions in
scope
% reduction from base
year
Base year
Base year emissions covered by
target (metric tonnes CO2e)
Target year
Is this a science-
based target?
Comment
Abs1 Scope 1
100% 20% 2008 1172476 2020
No, but we are reporting another target which is science-based
We have set an absolute Scope 1 GHG emissions reduction goal to reduce our emissions by 20% by 2020, using a 2008 Scope 1 baseline of 1,172,476. For the purposes of tracking progress toward our goal, we are holding refrigerants, engines and portable generators steady in an effort to align performance with actual emissions changes and avoid an inaccurate representation of our progress. This required that we back cast the 2011 values to 2008.
Abs2 Scope 1
64% 12% 2008 816725 2020
Yes, but this target has not been approved as science-based by the Science Based Targets initiative
AT&T has set a goal to reduce its fleet emissions by 30% from its 2008 baseline by 2020.
CC3.1b

Please provide details of your intensity target
ID
Scope
% of emissions in scope
% reduction from base
year
Metric
Base year
Normalized base year emissions covered by
target
Target year
Is this a science-based target?
Comment
Int2 Scope 2 (location-based)
87% 60% Other: MWh/Petabyte
2013 127.56 2020
No, but we are reporting another target which is science-based
Emissions value in metric tons CO2e/Petabyte. 2013 Scope 2 emissions component values: 8,103,246 metric tons CO2e / 63,527 PB. We plan to defer the setting of a science-based target until either the Target Year (2020) or until we have achieved the established Energy Intensity reduction. Note: Intensity metric excludes steam as a source. Electricity-based Scope 2 emissions are 87 percent of total Scope 2 emissions reported.
CC3.1c
Please also indicate what change in absolute emissions this intensity target reflects

ID
Direction of change
anticipated in absolute Scope 1+2 emissions
at target completion?
% change anticipated in
absolute Scope 1+2 emissions
Direction of change
anticipated in absolute Scope 3 emissions at
target completion?
% change anticipated in
absolute Scope 3 emissions
Comment
Int1 Increase 1.5 No change 0 Converting our energy intensity goal to a GHG intensity goal results in an expected modest increase in Scope 2 emissions but does not impact Scope 1 or Scope 3 emissions.
CC3.1d
Please provide details of your renewable energy consumption and/or production target
ID
Energy types
covered by target
Base year
Base year energy for energy type covered
(MWh)
% renewable
energy in base year
Target year
% renewable
energy in target year
Comment

CC3.1e
For all of your targets, please provide details on the progress made in the reporting year
ID
% complete
(time)
% complete (emissions or
renewable energy)
Comment
Abs1 58% 58%
In 2011, we set an absolute Scope 1 GHG emissions reduction goal to reduce our emissions by 20% by 2020, using a 2008 Scope 1 baseline of 1,172,476. Since setting our Scope 1 goal, we have greatly expanded our business operations to include DirecTV and Iusacell in Mexico, and DirecTV in Latin America. We’ve also more than doubled our fleet of natural gas fuel cells for on-site power generation. Together, these activities impose a great deal of upward pressure on our Scope 1 emissions, and challenge our ability to achieve the original Scope 1 goal.
Int1 43% 67%
Relative to our target for electricity consumption related to data growth of 93 MWh/PB (referred to as Energy Intensity) by the close of 2016, AT&T has thus far achieved a 40% reduction from its 2013 baseline of 233 MWh/PB. Though the 2016 Intensity results would appear to represent a modest increase, in actuality, AT&Ts methods of measurement and estimation of the many types and sources of data traffic continuously undergoes improvements in automation and accuracy. Such is the case with the 2016 data traffic, as our means of assessing video traffic volume from UVerse services have evolved and become vastly more accurate. Additionally, AT&T is now including in its electricity consumption total the alternative and renewable electricity it produces and consumes through solar and fuel cell installations and wind energy purchases. The resulting Energy Intensity for 2016 is 139 MWh/PB [15,447,090 MWh/111,118 PB].
CC3.1f
Please explain (i) why you do not have a target; and (ii) forecast how your emissions will change over the next five years

CC3.2
Do you classify any of your existing goods and/or services as low carbon products or do they enable a third party to avoid GHG emissions?
Yes
CC3.2a
Please provide details of your products and/or services that you classify as low carbon products or that enable a third party to avoid GHG emissions
Level of
aggregation
Description of product/Group of
products
Are you
reporting low carbon product/s or avoided emissions?
Taxonomy, project or
methodology used to classify
product/s as low carbon or to calculate
avoided emissions
%
revenue from low carbon
product/s in the
reporting year
% R&D in
low carbon
product/s in the
reporting year
Comment
Product
CLOUD COMPUTING: Cloud computing centralizes use of independent servers in an efficient environment, reducing electricity use and associated GHG emissions. AT&T worked on a CDP/Verdantix study that found by 2020, large U.S. companies that use cloud computing can achieve annual energy savings of $12.3B and annual carbon reductions equivalent to 200M barrels of oil, or enough to power 5.7M cars for one
Low carbon product
The equivalencies calculations are based on Bureau of Transportation Statistics average mpg, Federal Highway Administration average annual mileage and the Energy Information Agency gallons of gasoline per barrel of oil. The methodology was developed in line with GHG Protocol: Corporate Standard, utilizing emission factors from EPA guidance and GWPs published in the IPCC Second Assessment Report.

Level of
aggregation
Description of product/Group of
products
Are you
reporting low carbon product/s or avoided emissions?
Taxonomy, project or
methodology used to classify
product/s as low carbon or to calculate
avoided emissions
%
revenue from low carbon
product/s in the
reporting year
% R&D in
low carbon
product/s in the
reporting year
Comment
year. The estimates represent 2,653 U.S. firms generating revenues of > $1B.
Considering originating credits not included.
Product
Telecommuting can help businesses cut carbon emissions, and it offers a variety of benefits for both companies and employees. Related to telecommuting is teleworking, or the ability to work virtually from anywhere. Teleworking is a vital component in preparing our nation for responding to unexpected events that prevent workers from reaching their traditional office environment such as natural disasters, outbreaks of disease or terrorist incidents. We offer a variety of innovative solutions to facilitate flexible working, including remote access, and conferencing and collaboration services. These technologies can help reduce travel and increase productivity by enabling employees to communicate and collaborate from virtually anywhere.
Avoided emissions
We used detailed survey data from our telecommuters, including commute distance, type (single rider, carpool) and vehicle model. We accounted for "rebound effect," trips that would otherwise be in daily commute. Methodology was developed in accordance with The GHG Protocol: Corporate Standard, utilizing emission factors from EPA guidance and GWPs published in the IPCC Second Assessment Report.
Product
FLEET MANAGEMENT: AT&T is one of the largest U.S. wireless providers of fleet management solutions for commercial truck and van fleets. AT&T’s technician vehicles are equipped with similar solutions, and optimizing our fleet operations is a crucial component to making real changes. We use best practices to efficiently manage our fleet
Avoided emissions
Level of
aggregation
Description of product/Group of
products
Are you
reporting low carbon product/s or avoided emissions?
Taxonomy, project or
methodology used to classify
product/s as low carbon or to calculate
avoided emissions
%
revenue from low carbon
product/s in the
reporting year
% R&D in
low carbon
product/s in the
reporting year
Comment
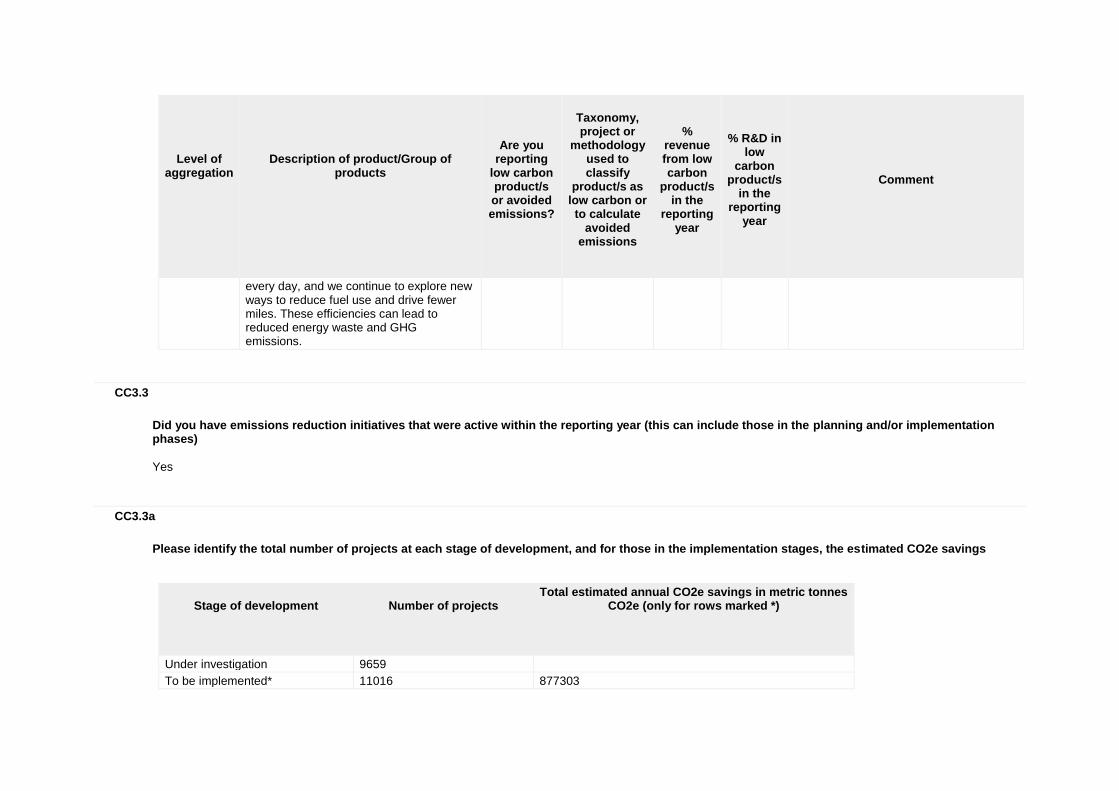
every day, and we continue to explore new ways to reduce fuel use and drive fewer miles. These efficiencies can lead to reduced energy waste and GHG emissions.
CC3.3
Did you have emissions reduction initiatives that were active within the reporting year (this can include those in the planning and/or implementation phases)
Yes
CC3.3a
Please identify the total number of projects at each stage of development, and for those in the implementation stages, the estimated CO2e savings
Stage of development
Number of projects
Total estimated annual CO2e savings in metric tonnes CO2e (only for rows marked *)
Under investigation 9659
To be implemented* 11016 877303
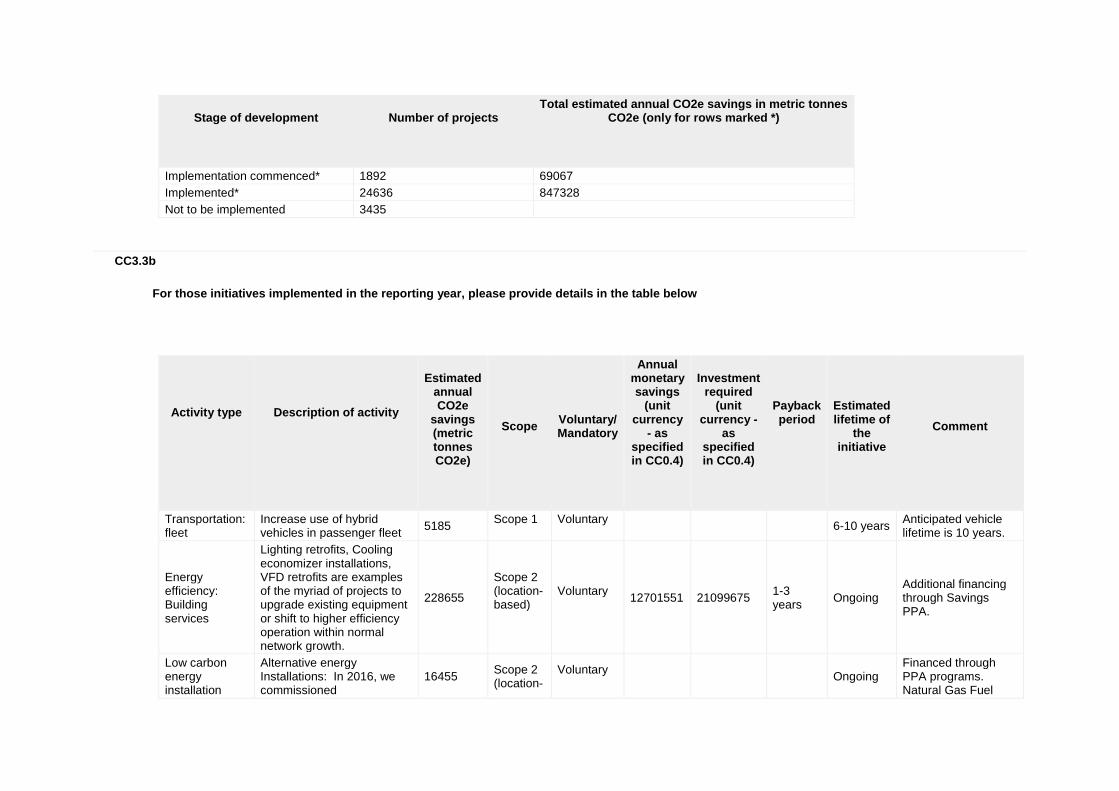
Stage of development
Number of projects
Total estimated annual CO2e savings in metric tonnes CO2e (only for rows marked *)
Implementation commenced* 1892 69067
Implemented* 24636 847328
Not to be implemented 3435
CC3.3b
For those initiatives implemented in the reporting year, please provide details in the table below
Activity type
Description of activity
Estimated annual CO2e
savings (metric tonnes CO2e)
Scope
Voluntary/ Mandatory
Annual monetary savings
(unit currency
- as specified in CC0.4)
Investment required
(unit currency -
as specified in CC0.4)
Payback period
Estimated lifetime of
the initiative
Comment
Transportation: fleet
Increase use of hybrid vehicles in passenger fleet
5185 Scope 1
Voluntary
6-10 years Anticipated vehicle lifetime is 10 years.
Energy efficiency: Building services
Lighting retrofits, Cooling economizer installations, VFD retrofits are examples of the myriad of projects to upgrade existing equipment or shift to higher efficiency operation within normal network growth.
228655
Scope 2 (location-based)
Voluntary
12701551 21099675 1-3 years
Ongoing Additional financing through Savings PPA.
Low carbon energy installation
Alternative energy Installations: In 2016, we commissioned
16455 Scope 2 (location-
Voluntary
Ongoing Financed through PPA programs. Natural Gas Fuel

Activity type
Description of activity
Estimated annual CO2e
savings (metric tonnes CO2e)
Scope
Voluntary/ Mandatory
Annual monetary savings
(unit currency
- as specified in CC0.4)
Investment required
(unit currency -
as specified in CC0.4)
Payback period
Estimated lifetime of
the initiative
Comment
operationalized 13,325 kW of clean, on site fuel cell power, helping to power 22 AT&T sites in California and 1 in New Jersey. Altogether, the estimated annual alternative energy production of these installations is 110,890,650 kWh.
based)
cells produce a net reduction in total CO2e marginal emissions. While the fuel cell electrical energy production reduces Scope II (& III) emissions, use of natural gas as a fuel source applies an upward pressure on Scope I emissions. The net emissions come from weighing total emission reductions against Scope 1 increases.
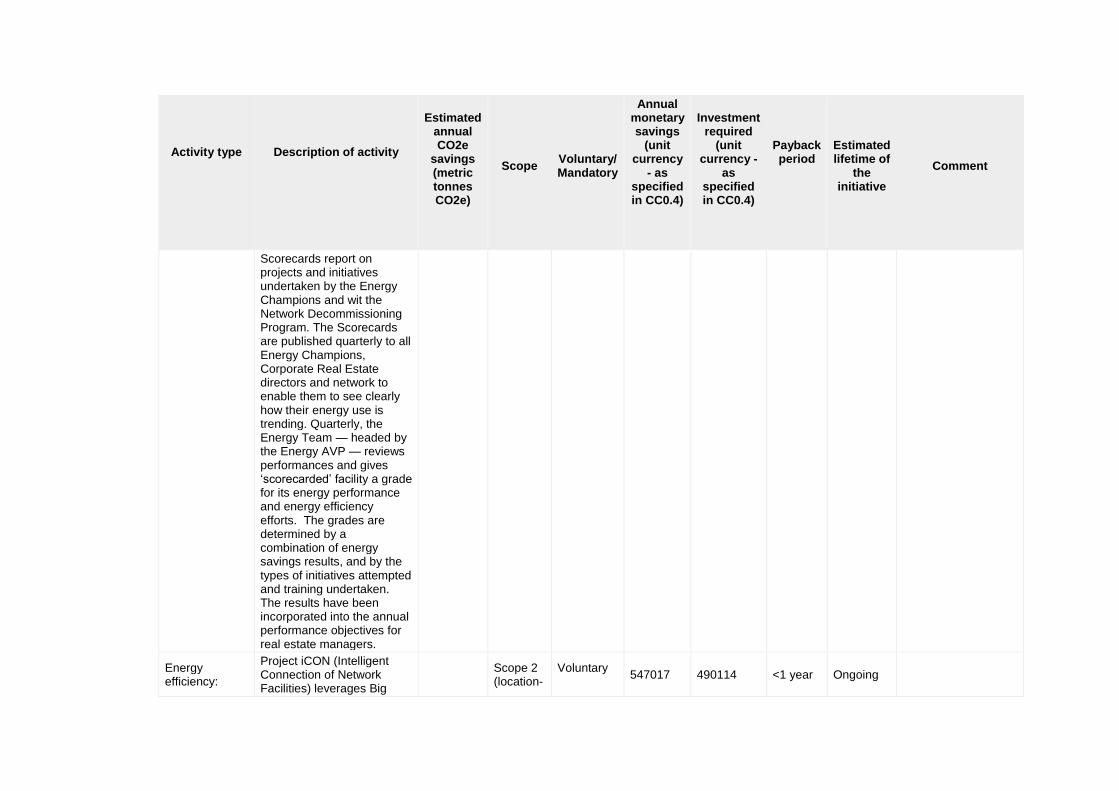
Behavioral change
Energy Scorecard - To promote accountability and drive results, we use an Energy Scorecard to benchmark the energy performance at each of our 800 largest energy-consuming facilities and 1,000 retail stores. The Scorecard reports energy management at each of these facilities, and we use this information to set benchmarks and goals for each facility. In addition,
4306
Scope 2 (location-based)
Voluntary
Ongoing
Activity type
Description of activity
Estimated annual CO2e
savings (metric tonnes CO2e)
Scope
Voluntary/ Mandatory
Annual monetary savings
(unit currency
- as specified in CC0.4)
Investment required
(unit currency -
as specified in CC0.4)
Payback period
Estimated lifetime of
the initiative
Comment
Scorecards report on projects and initiatives undertaken by the Energy Champions and wit the Network Decommissioning Program. The Scorecards are published quarterly to all Energy Champions, Corporate Real Estate directors and network to enable them to see clearly how their energy use is trending. Quarterly, the Energy Team — headed by the Energy AVP — reviews performances and gives ‘scorecarded’ facility a grade for its energy performance and energy efficiency efforts. The grades are determined by a combination of energy savings results, and by the types of initiatives attempted and training undertaken. The results have been incorporated into the annual performance objectives for real estate managers.
Energy efficiency:
Project iCON (Intelligent Connection of Network Facilities) leverages Big
Scope 2 (location-
Voluntary
547017 490114 <1 year Ongoing

Activity type
Description of activity
Estimated annual CO2e
savings (metric tonnes CO2e)
Scope
Voluntary/ Mandatory
Annual monetary savings
(unit currency
- as specified in CC0.4)
Investment required
(unit currency -
as specified in CC0.4)
Payback period
Estimated lifetime of
the initiative
Comment
Building services
Data to visualize and analyze disparate information sources providing insights on how to optimize facility equipment. In 2016, Project iCON work - which includes a mix of holistic facility evaluations and improvements and reprogramming of individual building management systems for more efficient operation - was completed at 418 facilities. This is a nearly threefold increase in the completed work volume from 2015, which was the year of iCON inception.
based)
Energy efficiency: Processes
In 2016, AT&T's Network organization continued its all-out effort to improve asset utilization through the systematic decommissioning and removal of excess network capacity and hardware. These efforts ae a key support pillar of the transformation of our Network to AT&T’s software defined network. Teams across the country
528670
Scope 2 (location-based)
Voluntary
75588035 Ongoing

Activity type
Description of activity
Estimated annual CO2e
savings (metric tonnes CO2e)
Scope
Voluntary/ Mandatory
Annual monetary savings
(unit currency
- as specified in CC0.4)
Investment required
(unit currency -
as specified in CC0.4)
Payback period
Estimated lifetime of
the initiative
Comment
completed more than 21,000 projects involving the elimination of equipment formerly support legacy networks across all network layers. These efforts have eliminated more than 746 million kWh on an annualized basis from our energy footprint.
Energy efficiency: Processes
Each year, AT&T works to right-size its real estate for the true needs of the business. In 2016, AT&T completed the sale, lease termination or reduction, and other transactions as required to reduce its occupied real estate holdings for 169 facilities and over 6 million square feet of space. Leading up to these transactions is the decommissioning or migration of people, equipment and services associated with the real estate.
85697
Scope 2 (location-based)
Voluntary
12167170 <1 year Ongoing
Activity type
Description of activity
Estimated annual CO2e
savings (metric tonnes CO2e)
Scope
Voluntary/ Mandatory
Annual monetary savings
(unit currency
- as specified in CC0.4)
Investment required
(unit currency -
as specified in CC0.4)
Payback period
Estimated lifetime of
the initiative
Comment
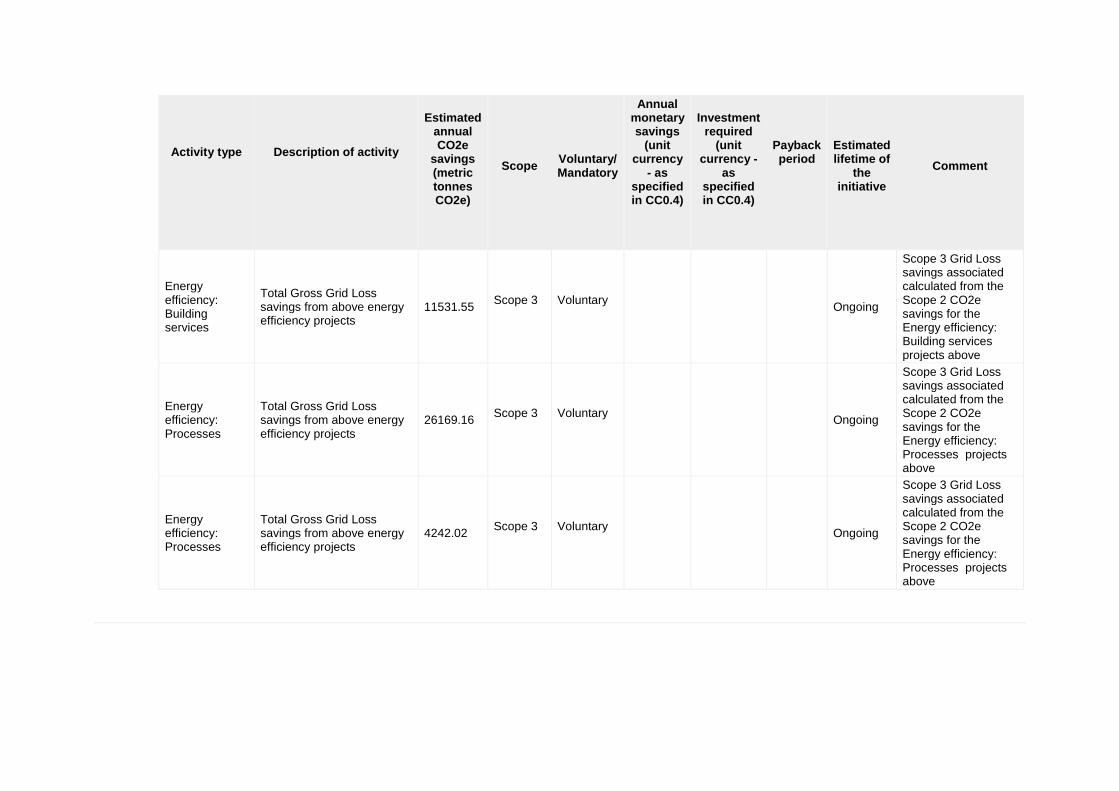
Energy efficiency: Building services
Total Gross Grid Loss savings from above energy efficiency projects
11531.55 Scope 3
Voluntary
Ongoing
Scope 3 Grid Loss savings associated calculated from the Scope 2 CO2e savings for the Energy efficiency: Building services projects above
Energy efficiency: Processes
Total Gross Grid Loss savings from above energy efficiency projects
26169.16 Scope 3
Voluntary
Ongoing
Scope 3 Grid Loss savings associated calculated from the Scope 2 CO2e savings for the Energy efficiency: Processes projects above
Energy efficiency: Processes
Total Gross Grid Loss savings from above energy efficiency projects
4242.02 Scope 3
Voluntary
Ongoing
Scope 3 Grid Loss savings associated calculated from the Scope 2 CO2e savings for the Energy efficiency: Processes projects above
CC3.3c
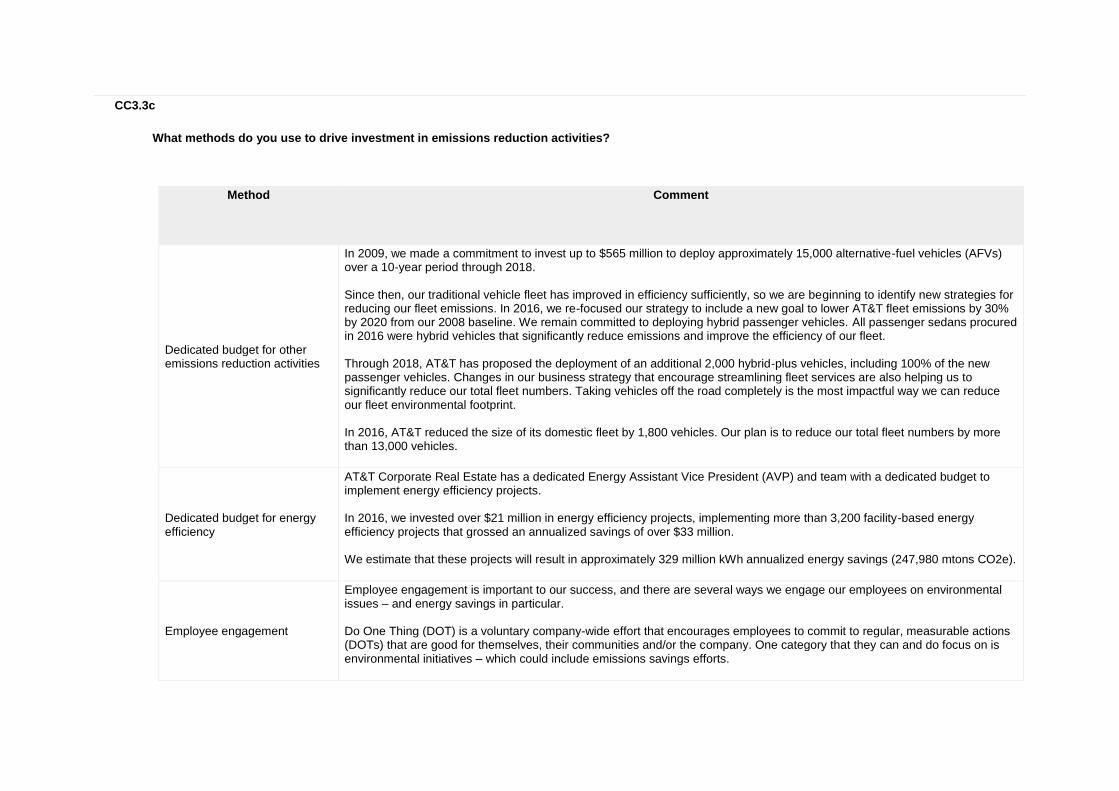
What methods do you use to drive investment in emissions reduction activities?
Method
Comment
Dedicated budget for other emissions reduction activities
In 2009, we made a commitment to invest up to $565 million to deploy approximately 15,000 alternative-fuel vehicles (AFVs) over a 10-year period through 2018. Since then, our traditional vehicle fleet has improved in efficiency sufficiently, so we are beginning to identify new strategies for reducing our fleet emissions. In 2016, we re-focused our strategy to include a new goal to lower AT&T fleet emissions by 30% by 2020 from our 2008 baseline. We remain committed to deploying hybrid passenger vehicles. All passenger sedans procured in 2016 were hybrid vehicles that significantly reduce emissions and improve the efficiency of our fleet. Through 2018, AT&T has proposed the deployment of an additional 2,000 hybrid-plus vehicles, including 100% of the new passenger vehicles. Changes in our business strategy that encourage streamlining fleet services are also helping us to significantly reduce our total fleet numbers. Taking vehicles off the road completely is the most impactful way we can reduce our fleet environmental footprint. In 2016, AT&T reduced the size of its domestic fleet by 1,800 vehicles. Our plan is to reduce our total fleet numbers by more than 13,000 vehicles.
Dedicated budget for energy efficiency
AT&T Corporate Real Estate has a dedicated Energy Assistant Vice President (AVP) and team with a dedicated budget to implement energy efficiency projects. In 2016, we invested over $21 million in energy efficiency projects, implementing more than 3,200 facility-based energy efficiency projects that grossed an annualized savings of over $33 million. We estimate that these projects will result in approximately 329 million kWh annualized energy savings (247,980 mtons CO2e).
Employee engagement
Employee engagement is important to our success, and there are several ways we engage our employees on environmental issues – and energy savings in particular. Do One Thing (DOT) is a voluntary company-wide effort that encourages employees to commit to regular, measurable actions (DOTs) that are good for themselves, their communities and/or the company. One category that they can and do focus on is environmental initiatives – which could include emissions savings efforts.

Method
Comment
We also communicate with employees about efforts underway at our company through our daily internal newsletter, AT&T Insider. We have seen this information inspire some employees to take further action in a wide range of areas, including, for example, by writing in to our Sustainability Inbox with recommendations and being more diligent about turning off their electronics at night.
Internal incentives/recognition programs
Progress toward and achievement of the stated goals is part of the annual performance objectives and rating process for executives and managers in the business units collaborating toward these goals. Consideration is given to performance against annual objectives when assigning merit-based salary and annual bonus awards. In addition to monetary awards, we provide incentives in form of recognition. To promote accountability and drive results, we use an Energy Scorecard to benchmark the energy performance at our top 800 energy-consuming facilities and 800 retail locations. The Scorecard reports energy management at each of these facilities, and we use this information to set benchmarks and goals for each facility. In addition, Scorecards report on projects and initiatives undertaken by the Energy Champions and wit the Network Decommissioning Program. The Scorecards are published quarterly to all Energy Champions, Corporate Real Estate directors and network to enable them to see clearly how their energy use is trending. Quarterly, the Energy Team — headed by the Energy AVP — reviews performances and gives each ’scorecarded’ facility a grade, determined by not only by savings results, but also by the types of initiatives attempted and training undertaken for the facility personnel. The results have been incorporated into the annual performance objectives for real estate managers.
Other
We collaborate with others in the industry to develop more efficient products and practices. AT&T was a founding member in The Green Grid, a global consortium dedicated to advancing energy efficiency in data centers and business computing ecosystems, and GreenTouch, an industry consortium whose mission is to deliver the architecture, specifications and roadmap to increase network energy efficiency by a factor of 1,000 compared to 2010 levels. We are also a member and Chairman of the Board of Directors of the Alliance for Telecommunication Industry Solutions (ATIS), the North American telecommunications standards development organization, and we also initiated and now vice-chair the Telecommunications Energy Efficiency (TEE) committee, which developed a methodology for measuring and reporting the energy efficiency of telecommunications equipment. AT&T is involved with the US Green Building Council (USGBC) and its Leadership in Energy and Environmental Design (LEED) program, a third-party verification program for green building. AT&T currently has several of its facilities with prestigious and coveted Platinum or Gold certifications, with several more projects underway to certify more facilities. AT&T participates in the ENERGY STAR program for set-top boxes, in connection with its DIRECTV product offerings. This voluntary program sets and periodically updates best-in-class efficiency standards, encouraging participants to continually increase the efficiency of equipment. In 2016, AT&T received the ENERGY STAR® Partner of the Year—Sustained Excellence award for investing in efficient designs for pay TV hardware and services, bringing this equipment into homes, and
Method
Comment
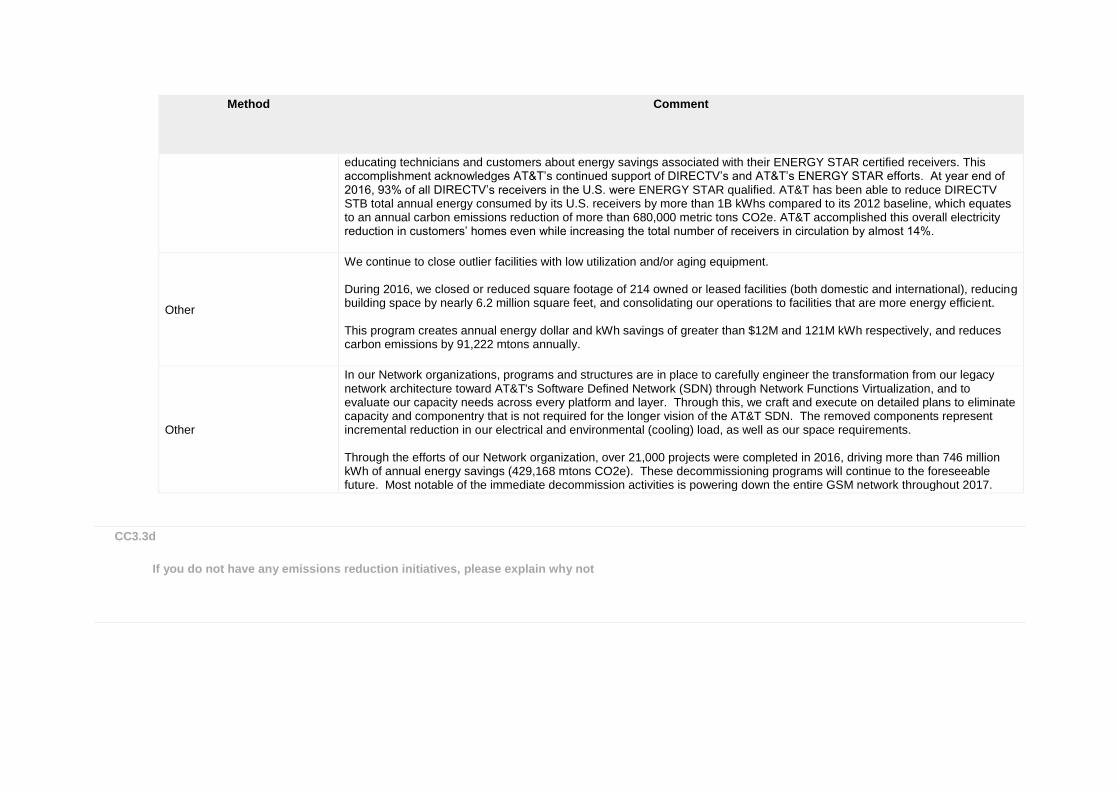
educating technicians and customers about energy savings associated with their ENERGY STAR certified receivers. This accomplishment acknowledges AT&T’s continued support of DIRECTV’s and AT&T’s ENERGY STAR efforts. At year end of 2016, 93% of all DIRECTV’s receivers in the U.S. were ENERGY STAR qualified. AT&T has been able to reduce DIRECTV STB total annual energy consumed by its U.S. receivers by more than 1B kWhs compared to its 2012 baseline, which equates to an annual carbon emissions reduction of more than 680,000 metric tons CO2e. AT&T accomplished this overall electricity reduction in customers’ homes even while increasing the total number of receivers in circulation by almost 14%.
Other
We continue to close outlier facilities with low utilization and/or aging equipment. During 2016, we closed or reduced square footage of 214 owned or leased facilities (both domestic and international), reducing building space by nearly 6.2 million square feet, and consolidating our operations to facilities that are more energy efficient. This program creates annual energy dollar and kWh savings of greater than $12M and 121M kWh respectively, and reduces carbon emissions by 91,222 mtons annually.
Other
In our Network organizations, programs and structures are in place to carefully engineer the transformation from our legacy network architecture toward AT&T's Software Defined Network (SDN) through Network Functions Virtualization, and to evaluate our capacity needs across every platform and layer. Through this, we craft and execute on detailed plans to eliminate capacity and componentry that is not required for the longer vision of the AT&T SDN. The removed components represent incremental reduction in our electrical and environmental (cooling) load, as well as our space requirements. Through the efforts of our Network organization, over 21,000 projects were completed in 2016, driving more than 746 million kWh of annual energy savings (429,168 mtons CO2e). These decommissioning programs will continue to the foreseeable future. Most notable of the immediate decommission activities is powering down the entire GSM network throughout 2017.
CC3.3d
If you do not have any emissions reduction initiatives, please explain why not
Further Information
Page: CC4. Communication
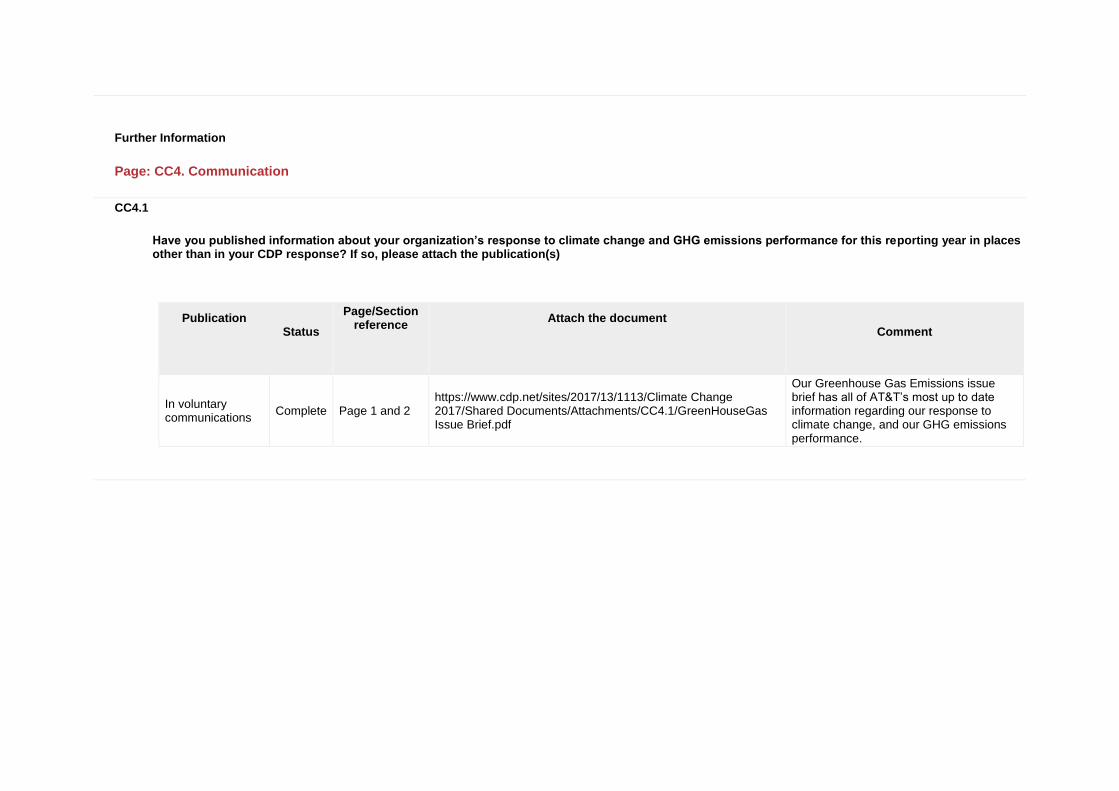
CC4.1
Have you published information about your organization’s response to climate change and GHG emissions performance for this reporting year in places other than in your CDP response? If so, please attach the publication(s)
Publication
Status
Page/Section reference
Attach the document
Comment
In voluntary communications
Complete Page 1 and 2 https://www.cdp.net/sites/2017/13/1113/Climate Change 2017/Shared Documents/Attachments/CC4.1/GreenHouseGas Issue Brief.pdf
Our Greenhouse Gas Emissions issue brief has all of AT&T’s most up to date information regarding our response to climate change, and our GHG emissions performance.

Further Information
Module: Risks and Opportunities
Page: CC5. Climate Change Risks
CC5.1
Have you identified any inherent climate change risks that have the potential to generate a substantive change in your business operations, revenue or expenditure? Tick all that apply
Risks driven by changes in regulation Risks driven by changes in physical climate parameters Risks driven by changes in other climate-related developments
CC5.1a
Please describe your inherent risks that are driven by changes in regulation
Risk driver
Description
Potential impact
Timeframe
Direct/ Indirect
Likelihood
Magnitude of impact
Estimated financial
implications
Management
method
Cost of
management
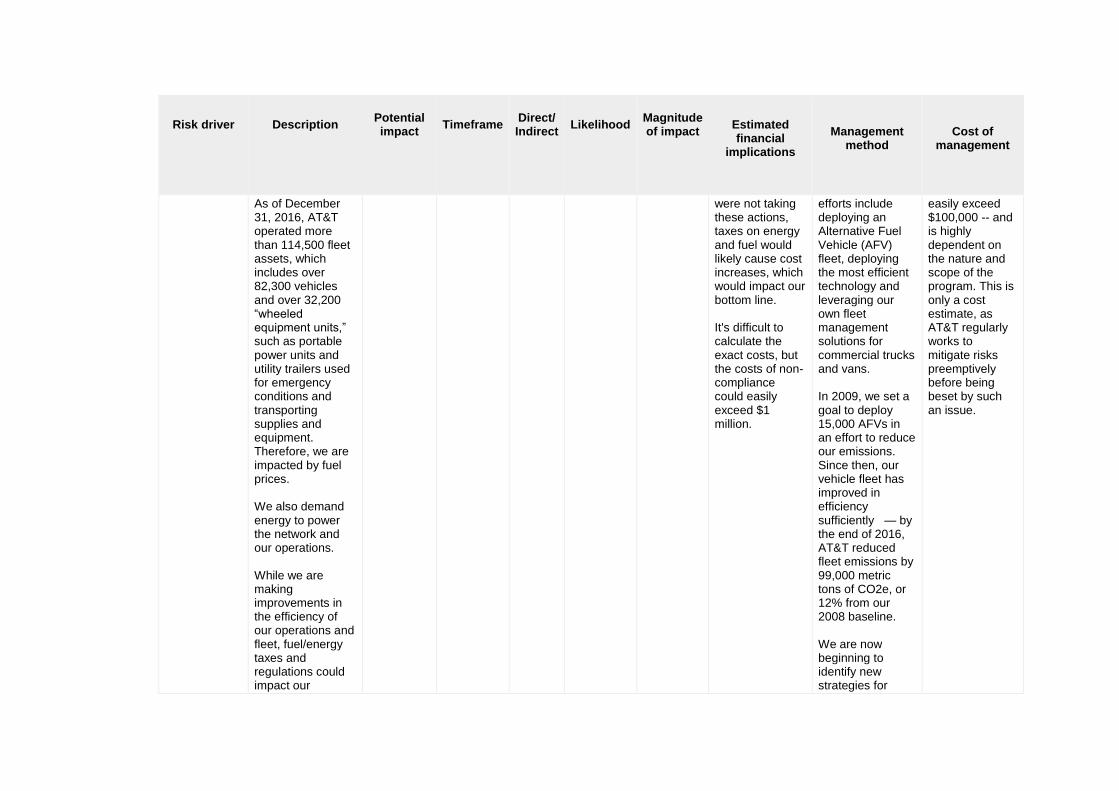
Fuel/energy taxes and regulations
AT&T operates one of the largest corporate fleets in the U.S.
Increased operational cost
1 to 3 years
Direct More likely than not
Unknown
We're working to insulate ourselves from increasing energy/fuel prices. If we
AT&T is always modifying its fleet strategy in an effort to reduce fleet-related emissions. These
The cost for an efficiency measure or mitigation or management program could
Risk driver
Description
Potential impact
Timeframe
Direct/ Indirect
Likelihood
Magnitude of impact
Estimated financial
implications
Management
method
Cost of
management
As of December 31, 2016, AT&T operated more than 114,500 fleet assets, which includes over 82,300 vehicles and over 32,200 “wheeled equipment units,” such as portable power units and utility trailers used for emergency conditions and transporting supplies and equipment. Therefore, we are impacted by fuel prices. We also demand energy to power the network and our operations. While we are making improvements in the efficiency of our operations and fleet, fuel/energy taxes and regulations could impact our
were not taking these actions, taxes on energy and fuel would likely cause cost increases, which would impact our bottom line. It's difficult to calculate the exact costs, but the costs of non-compliance could easily exceed $1 million.
efforts include deploying an Alternative Fuel Vehicle (AFV) fleet, deploying the most efficient technology and leveraging our own fleet management solutions for commercial trucks and vans. In 2009, we set a goal to deploy 15,000 AFVs in an effort to reduce our emissions. Since then, our vehicle fleet has improved in efficiency sufficiently — by the end of 2016, AT&T reduced fleet emissions by 99,000 metric tons of CO2e, or 12% from our 2008 baseline. We are now beginning to identify new strategies for
easily exceed $100,000 -- and is highly dependent on the nature and scope of the program. This is only a cost estimate, as AT&T regularly works to mitigate risks preemptively before being beset by such an issue.
Risk driver
Description
Potential impact
Timeframe
Direct/ Indirect
Likelihood
Magnitude of impact
Estimated financial
implications
Management
method
Cost of
management
company’s bottom line.
reducing our fleet emissions. In 2016, we re-focused our strategy to include a new goal to lower AT&T fleet emissions by 30% by 2020 from our 2008 baseline We remain committed to deploying hybrid passenger vehicles.
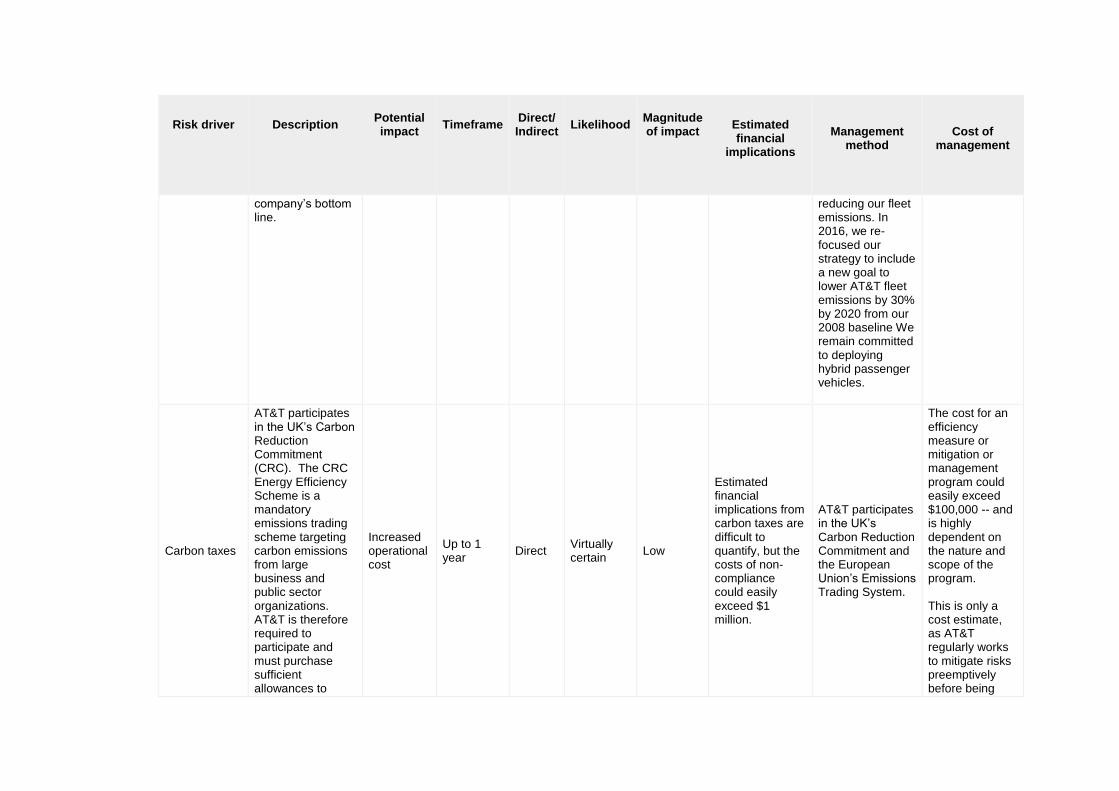
Carbon taxes
AT&T participates in the UK’s Carbon Reduction Commitment (CRC). The CRC Energy Efficiency Scheme is a mandatory emissions trading scheme targeting carbon emissions from large business and public sector organizations. AT&T is therefore required to participate and must purchase sufficient allowances to
Increased operational cost
Up to 1 year
Direct Virtually certain
Low
Estimated financial implications from carbon taxes are difficult to quantify, but the costs of non-compliance could easily exceed $1 million.
AT&T participates in the UK’s Carbon Reduction Commitment and the European Union’s Emissions Trading System.
The cost for an efficiency measure or mitigation or management program could easily exceed $100,000 -- and is highly dependent on the nature and scope of the program. This is only a cost estimate, as AT&T regularly works to mitigate risks preemptively before being
Risk driver
Description
Potential impact
Timeframe
Direct/ Indirect
Likelihood
Magnitude of impact
Estimated financial
implications
Management
method
Cost of
management
cover our emissions in the UK.
beset by such an issue.
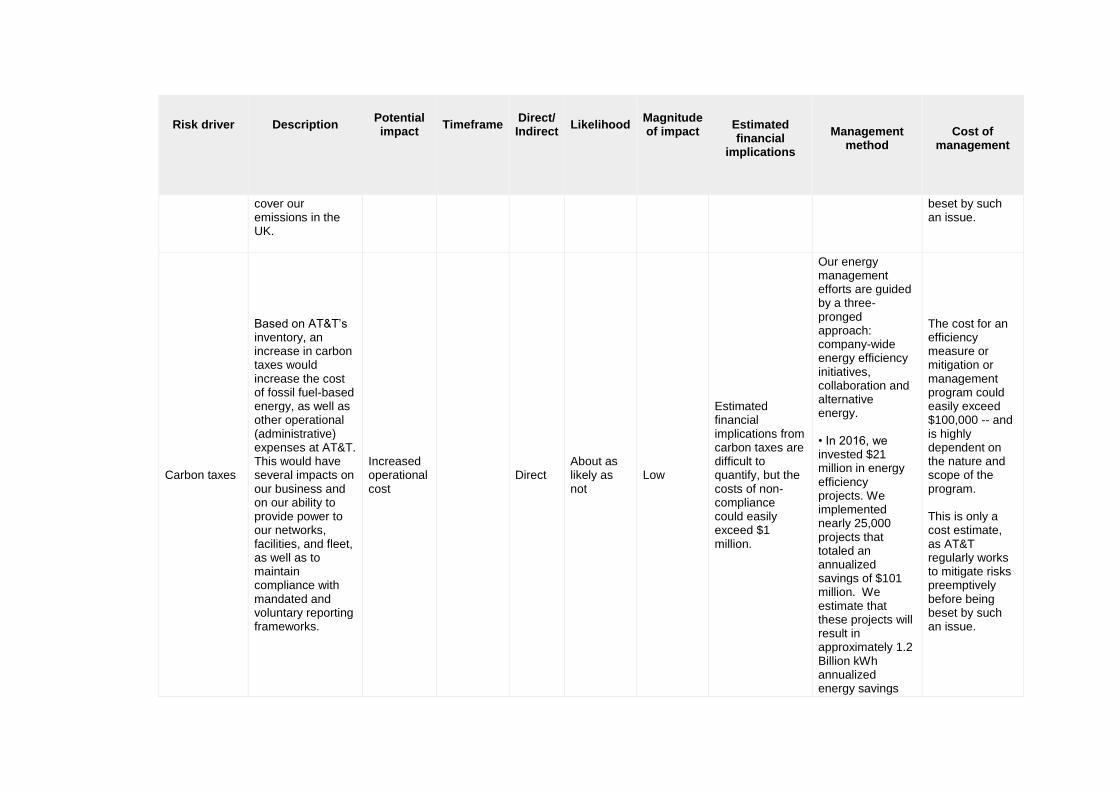
Carbon taxes
Based on AT&T’s inventory, an increase in carbon taxes would increase the cost of fossil fuel-based energy, as well as other operational (administrative) expenses at AT&T. This would have several impacts on our business and on our ability to provide power to our networks, facilities, and fleet, as well as to maintain compliance with mandated and voluntary reporting frameworks.
Increased operational cost
Direct About as likely as not
Low
Estimated financial implications from carbon taxes are difficult to quantify, but the costs of non-compliance could easily exceed $1 million.
Our energy management efforts are guided by a three-pronged approach: company-wide energy efficiency initiatives, collaboration and alternative energy. • In 2016, we invested $21 million in energy efficiency projects. We implemented nearly 25,000 projects that totaled an annualized savings of $101 million. We estimate that these projects will result in approximately 1.2 Billion kWh annualized energy savings
The cost for an efficiency measure or mitigation or management program could easily exceed $100,000 -- and is highly dependent on the nature and scope of the program. This is only a cost estimate, as AT&T regularly works to mitigate risks preemptively before being beset by such an issue.
Risk driver
Description
Potential impact
Timeframe
Direct/ Indirect
Likelihood
Magnitude of impact
Estimated financial
implications
Management
method
Cost of
management
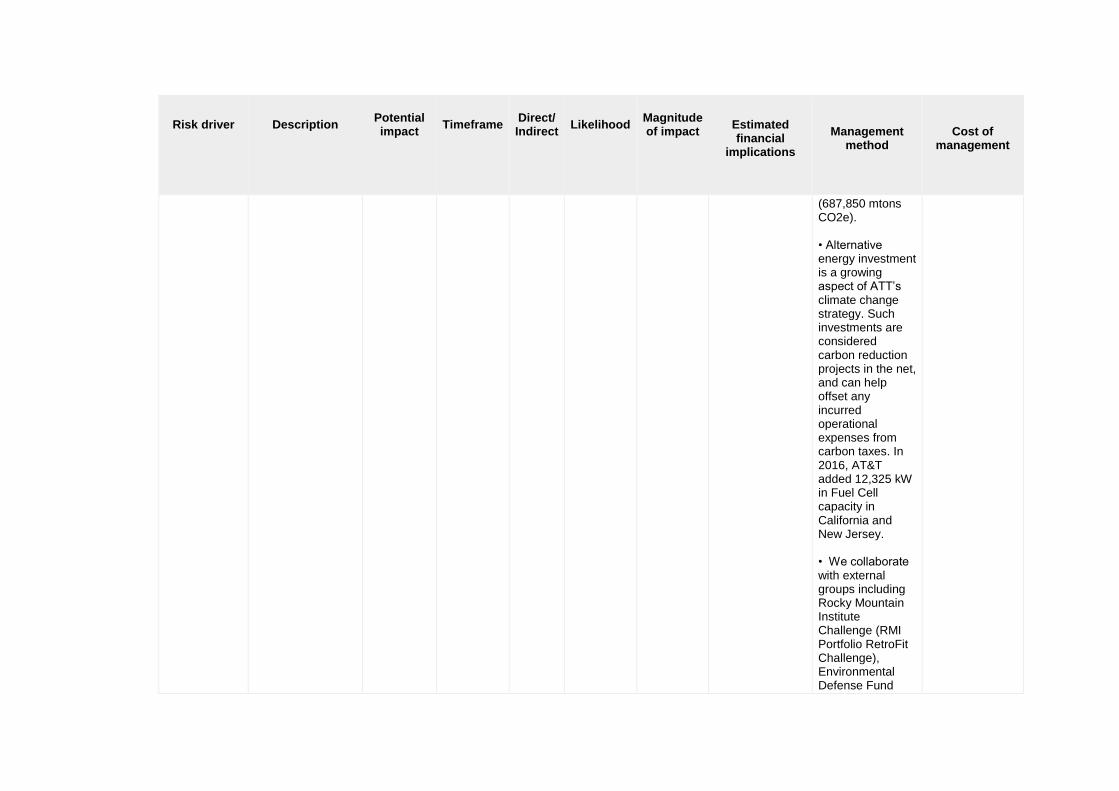
(687,850 mtons CO2e). • Alternative energy investment is a growing aspect of ATT’s climate change strategy. Such investments are considered carbon reduction projects in the net, and can help offset any incurred operational expenses from carbon taxes. In 2016, AT&T added 12,325 kW in Fuel Cell capacity in California and New Jersey. • We collaborate with external groups including Rocky Mountain Institute Challenge (RMI Portfolio RetroFit Challenge), Environmental Defense Fund
Risk driver
Description
Potential impact
Timeframe
Direct/ Indirect
Likelihood
Magnitude of impact
Estimated financial
implications
Management
method
Cost of
management
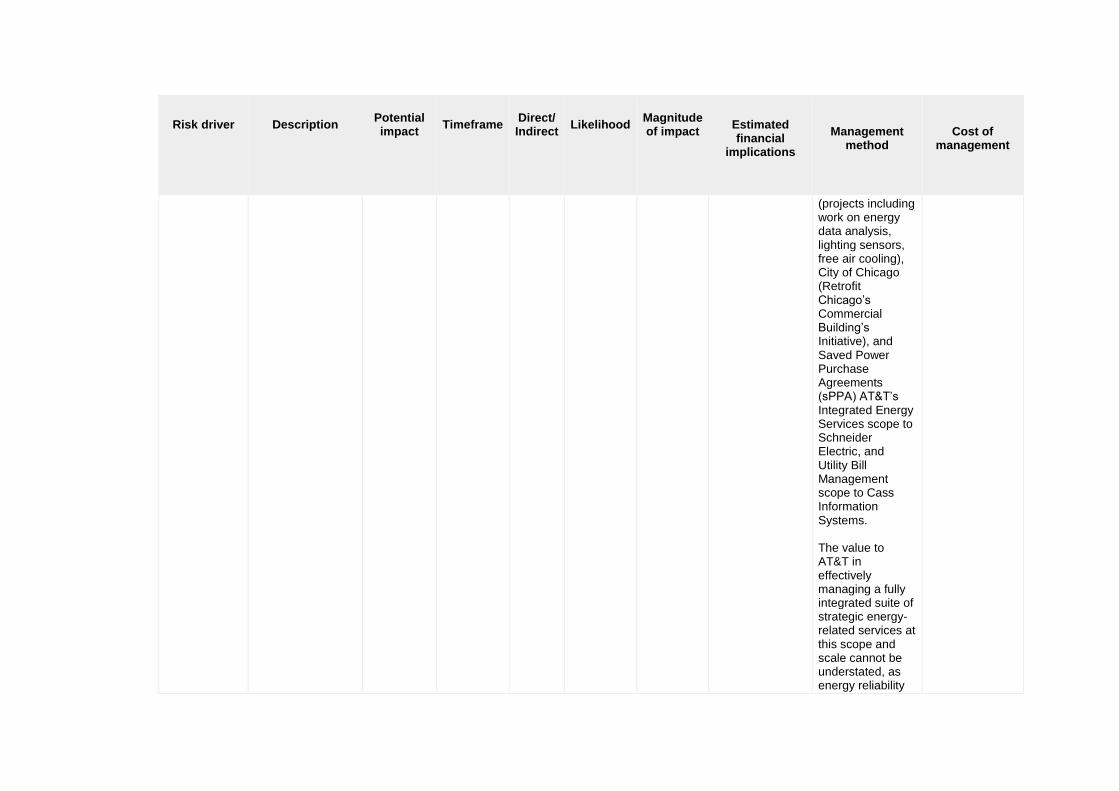
(projects including work on energy data analysis, lighting sensors, free air cooling), City of Chicago (Retrofit Chicago’s Commercial Building’s Initiative), and Saved Power Purchase Agreements (sPPA) AT&T’s Integrated Energy Services scope to Schneider Electric, and Utility Bill Management scope to Cass Information Systems. The value to AT&T in effectively managing a fully integrated suite of strategic energy-related services at this scope and scale cannot be understated, as energy reliability

Risk driver
Description
Potential impact
Timeframe
Direct/ Indirect
Likelihood
Magnitude of impact
Estimated financial
implications
Management
method
Cost of
management
and intelligence is at the heart of our network reliability and sustainability standards.
General environmental regulations, including planning
AT&T owns a substantial real estate portfolio in California. Projects to retrofit these buildings are significantly impacted in terms of cost and schedule by the energy efficiency standards set forth in the Title 24 California Building Code. Planned regulation in California will make these standards increasingly more stringent.
Other: Increased operational cost AND increased capital cost
3 to 6 years
Direct Very likely Unknown
It's difficult to calculate the exact opportunity costs, but the costs of non-compliant project implementation would easily exceed $1 million. Many prospective energy efficiency projects may prove unviable from a business case payback perspective, when factoring in increased cost of adherence to Title 24 regulations and constraints. In such cases, implementation of the project may be at risk,
We are working to comply with regulations, including obtaining the necessary personnel and collaboration with property groups, government organizations, and others.
The cost for an efficiency measure or mitigation or management program could easily exceed $100,000 -- and is highly dependent on the nature and scope of the program. This is only a cost estimate, as AT&T regularly works to mitigate risks preemptively before being beset by such an issue.
Risk driver
Description
Potential impact
Timeframe
Direct/ Indirect
Likelihood
Magnitude of impact
Estimated financial
implications
Management
method
Cost of
management
resulting in continued operational costs to AT&T.
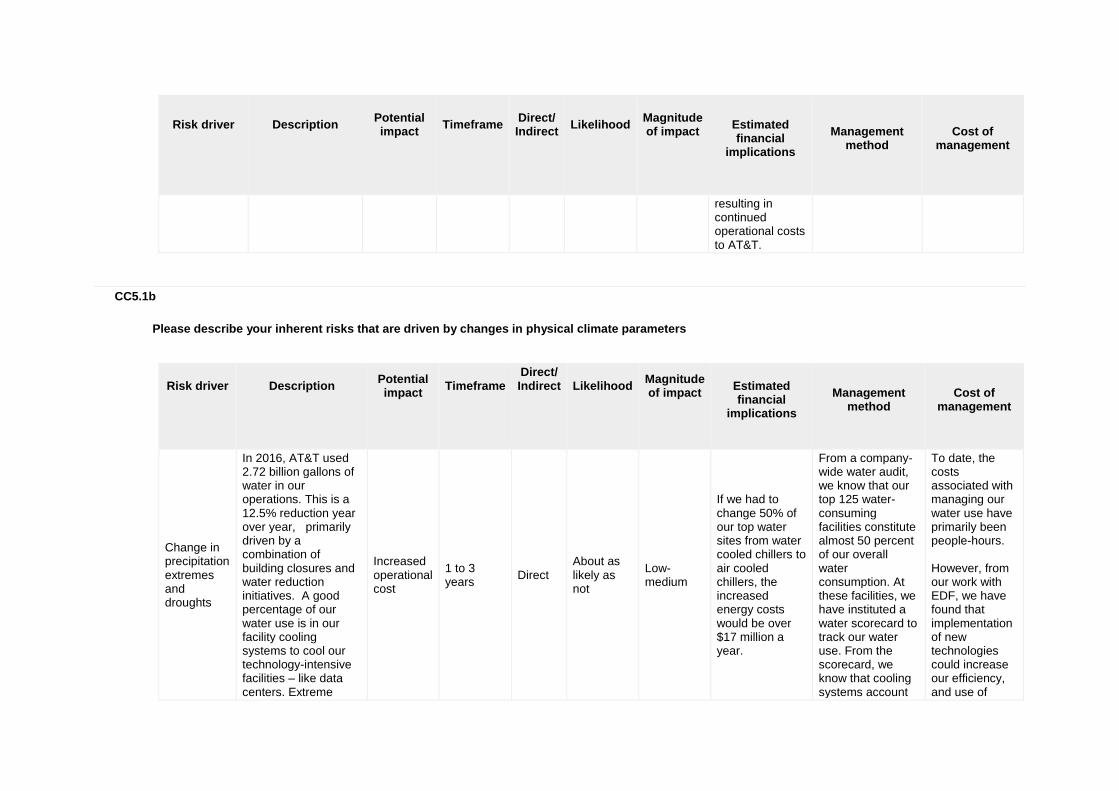
CC5.1b
Please describe your inherent risks that are driven by changes in physical climate parameters
Risk driver
Description
Potential impact
Timeframe
Direct/ Indirect
Likelihood
Magnitude of impact
Estimated financial
implications
Management
method
Cost of
management
Change in precipitation extremes and droughts
In 2016, AT&T used 2.72 billion gallons of water in our operations. This is a 12.5% reduction year over year, primarily driven by a combination of building closures and water reduction initiatives. A good percentage of our water use is in our facility cooling systems to cool our technology-intensive facilities – like data centers. Extreme
Increased operational cost
1 to 3 years
Direct About as likely as not
Low-medium
If we had to change 50% of our top water sites from water cooled chillers to air cooled chillers, the increased energy costs would be over $17 million a year.
From a company-wide water audit, we know that our top 125 water-consuming facilities constitute almost 50 percent of our overall water consumption. At these facilities, we have instituted a water scorecard to track our water use. From the scorecard, we know that cooling systems account
To date, the costs associated with managing our water use have primarily been people-hours. However, from our work with EDF, we have found that implementation of new technologies could increase our efficiency, and use of
Risk driver
Description
Potential impact
Timeframe
Direct/ Indirect
Likelihood
Magnitude of impact
Estimated financial
implications
Management
method
Cost of
management
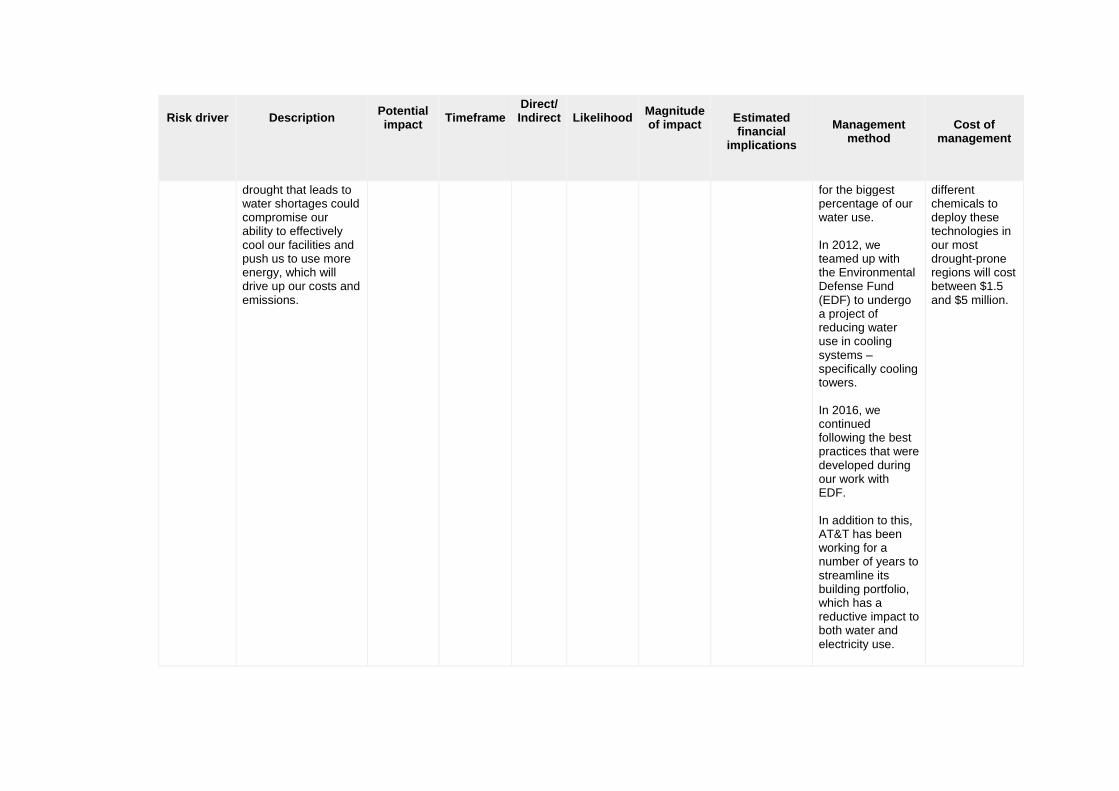
drought that leads to water shortages could compromise our ability to effectively cool our facilities and push us to use more energy, which will drive up our costs and emissions.
for the biggest percentage of our water use. In 2012, we teamed up with the Environmental Defense Fund (EDF) to undergo a project of reducing water use in cooling systems – specifically cooling towers. In 2016, we continued following the best practices that were developed during our work with EDF. In addition to this, AT&T has been working for a number of years to streamline its building portfolio, which has a reductive impact to both water and electricity use.
different chemicals to deploy these technologies in our most drought-prone regions will cost between $1.5 and $5 million.

Risk driver
Description
Potential impact
Timeframe
Direct/ Indirect
Likelihood
Magnitude of impact
Estimated financial
implications
Management
method
Cost of
management
In 2016, AT&T’s water conservation efforts included: • 44 projects yielding annualized water savings of 2,988,876 gallons. This includes 11 cooling tower/HVAC projects (1 in Pontiac, MI and 10 in CA in support of the water conservation efforts), and • A water dashboard that was developed to track and manage the water reduction and consumption efforts in the West, an effort that the AT&T President of CA initiated.
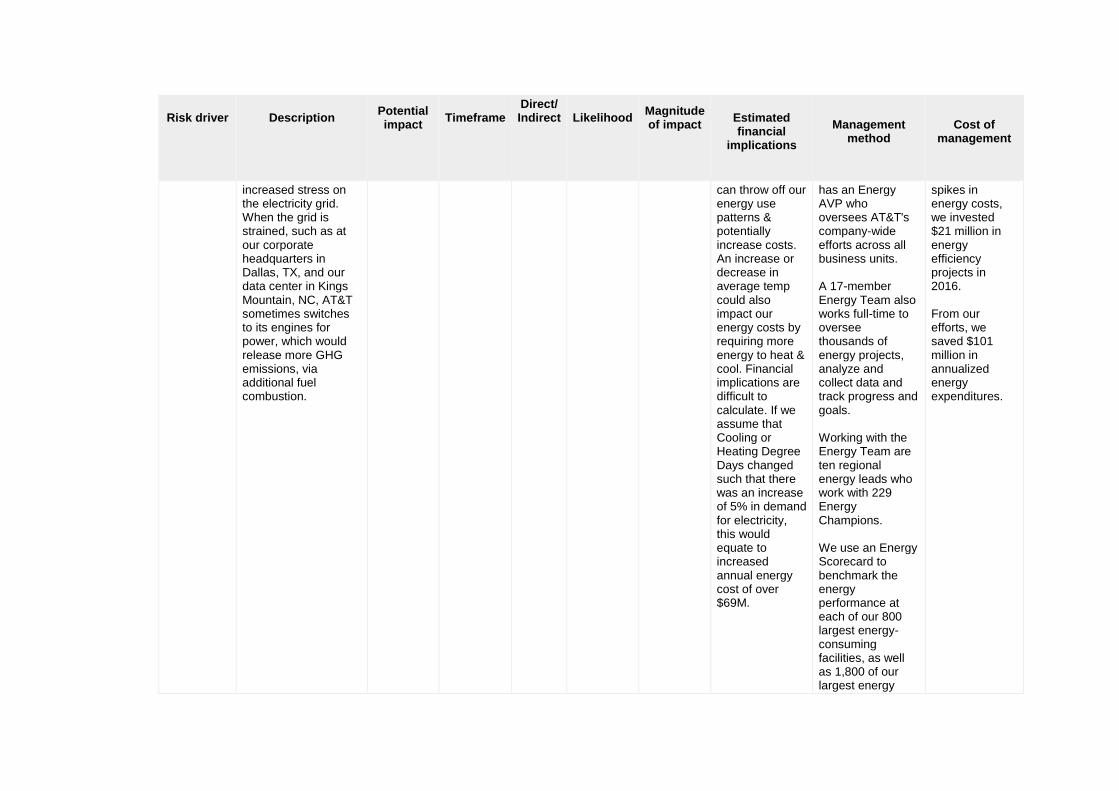
Change in mean (average) temperature
Fluctuations in temperatures make it difficult to predict energy needs for the year. In addition, this sometimes causes
Increased operational cost
Up to 1 year
Direct About as likely as not
Low-medium
Changes in average temps could make energy predictions more variable. This
To mitigate risks associated with energy, we have a strong energy management program. AT&T
To implement energy efficiency projects that help mitigate exposure to
Risk driver
Description
Potential impact
Timeframe
Direct/ Indirect
Likelihood
Magnitude of impact
Estimated financial
implications
Management
method
Cost of
management
increased stress on the electricity grid. When the grid is strained, such as at our corporate headquarters in Dallas, TX, and our data center in Kings Mountain, NC, AT&T sometimes switches to its engines for power, which would release more GHG emissions, via additional fuel combustion.
can throw off our energy use patterns & potentially increase costs. An increase or decrease in average temp could also impact our energy costs by requiring more energy to heat & cool. Financial implications are difficult to calculate. If we assume that Cooling or Heating Degree Days changed such that there was an increase of 5% in demand for electricity, this would equate to increased annual energy cost of over $69M.
has an Energy AVP who oversees AT&T's company-wide efforts across all business units. A 17-member Energy Team also works full-time to oversee thousands of energy projects, analyze and collect data and track progress and goals. Working with the Energy Team are ten regional energy leads who work with 229 Energy Champions. We use an Energy Scorecard to benchmark the energy performance at each of our 800 largest energy-consuming facilities, as well as 1,800 of our largest energy
spikes in energy costs, we invested $21 million in energy efficiency projects in 2016. From our efforts, we saved $101 million in annualized energy expenditures.

Risk driver
Description
Potential impact
Timeframe
Direct/ Indirect
Likelihood
Magnitude of impact
Estimated financial
implications
Management
method
Cost of
management
consuming retail locations. One example of an energy efficiency project implemented by AT&T is the company’s use of new and more energy-efficient models of air conditioning systems (HVAC) for its sheltered cell sites. These systems are factory-equipped with free-air cooling systems. When outside temperature and humidity are within acceptable ranges, the systems circulate outside air to cool the shelter equipment space instead of using the HVAC compressors. To date, we have outfitted more than 20% of our cell sites with these
Risk driver
Description
Potential impact
Timeframe
Direct/ Indirect
Likelihood
Magnitude of impact
Estimated financial
implications
Management
method
Cost of
management
new systems, resulting in cumulative savings of more than 220 million kWh.
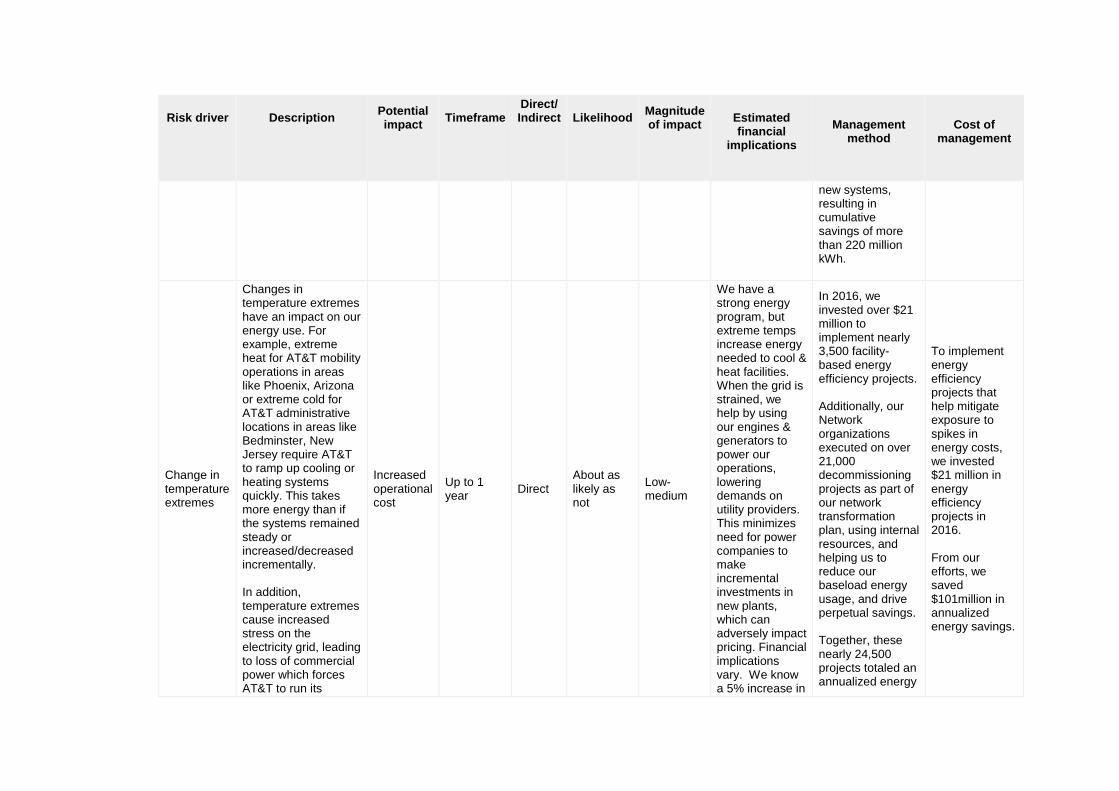
Change in temperature extremes
Changes in temperature extremes have an impact on our energy use. For example, extreme heat for AT&T mobility operations in areas like Phoenix, Arizona or extreme cold for AT&T administrative locations in areas like Bedminster, New Jersey require AT&T to ramp up cooling or heating systems quickly. This takes more energy than if the systems remained steady or increased/decreased incrementally. In addition, temperature extremes cause increased stress on the electricity grid, leading to loss of commercial power which forces AT&T to run its
Increased operational cost
Up to 1 year
Direct About as likely as not
Low-medium
We have a strong energy program, but extreme temps increase energy needed to cool & heat facilities. When the grid is strained, we help by using our engines & generators to power our operations, lowering demands on utility providers. This minimizes need for power companies to make incremental investments in new plants, which can adversely impact pricing. Financial implications vary. We know a 5% increase in
In 2016, we invested over $21 million to implement nearly 3,500 facility-based energy efficiency projects. Additionally, our Network organizations executed on over 21,000 decommissioning projects as part of our network transformation plan, using internal resources, and helping us to reduce our baseload energy usage, and drive perpetual savings. Together, these nearly 24,500 projects totaled an annualized energy
To implement energy efficiency projects that help mitigate exposure to spikes in energy costs, we invested $21 million in energy efficiency projects in 2016. From our efforts, we saved $101million in annualized energy savings.
Risk driver
Description
Potential impact
Timeframe
Direct/ Indirect
Likelihood
Magnitude of impact
Estimated financial
implications
Management
method
Cost of
management
generator engines more, resulting in additional fuel combustion which would release more GHG emissions.
electricity demand equates to increased annual energy cost of over $69M.
expense savings of $101 million.
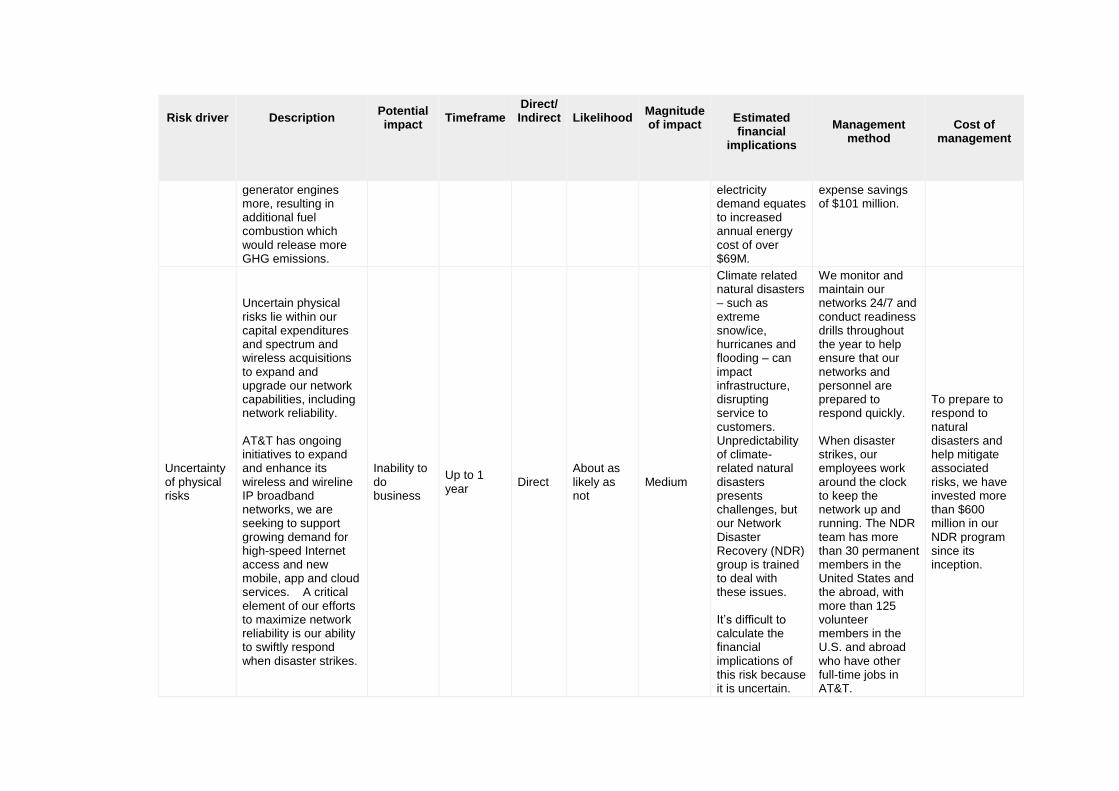
Uncertainty of physical risks
Uncertain physical risks lie within our capital expenditures and spectrum and wireless acquisitions to expand and upgrade our network capabilities, including network reliability. AT&T has ongoing initiatives to expand and enhance its wireless and wireline IP broadband networks, we are seeking to support growing demand for high-speed Internet access and new mobile, app and cloud services. A critical element of our efforts to maximize network reliability is our ability to swiftly respond when disaster strikes.
Inability to do business
Up to 1 year
Direct About as likely as not
Medium
Climate related natural disasters – such as extreme snow/ice, hurricanes and flooding – can impact infrastructure, disrupting service to customers. Unpredictability of climate-related natural disasters presents challenges, but our Network Disaster Recovery (NDR) group is trained to deal with these issues. It’s difficult to calculate the financial implications of this risk because it is uncertain.
We monitor and maintain our networks 24/7 and conduct readiness drills throughout the year to help ensure that our networks and personnel are prepared to respond quickly. When disaster strikes, our employees work around the clock to keep the network up and running. The NDR team has more than 30 permanent members in the United States and the abroad, with more than 125 volunteer members in the U.S. and abroad who have other full-time jobs in AT&T.
To prepare to respond to natural disasters and help mitigate associated risks, we have invested more than $600 million in our NDR program since its inception.

Risk driver
Description
Potential impact
Timeframe
Direct/ Indirect
Likelihood
Magnitude of impact
Estimated financial
implications
Management
method
Cost of
management
We believe the risk of financial impact is low, but this risk could impact our profitability in the long term.
In 2016, we deployed to California and New York State to provide wildfire support; to West Virginia, Louisiana, and Florida following severe flooding; and to Florida, Georgia, South Carolina, and North Carolina after Hurricane Matthew’s landfall. We conduct full-scale recovery exercises each year, which are vital to test our equipment and abilities. Additionally, AT&T is the first company nationwide to receive the U.S. Department of Homeland Security’s (U.S. DHS) “Private Sector Preparedness Program” (PS-
Risk driver
Description
Potential impact
Timeframe
Direct/ Indirect
Likelihood
Magnitude of impact
Estimated financial
implications
Management
method
Cost of
management
Prep™) certification.
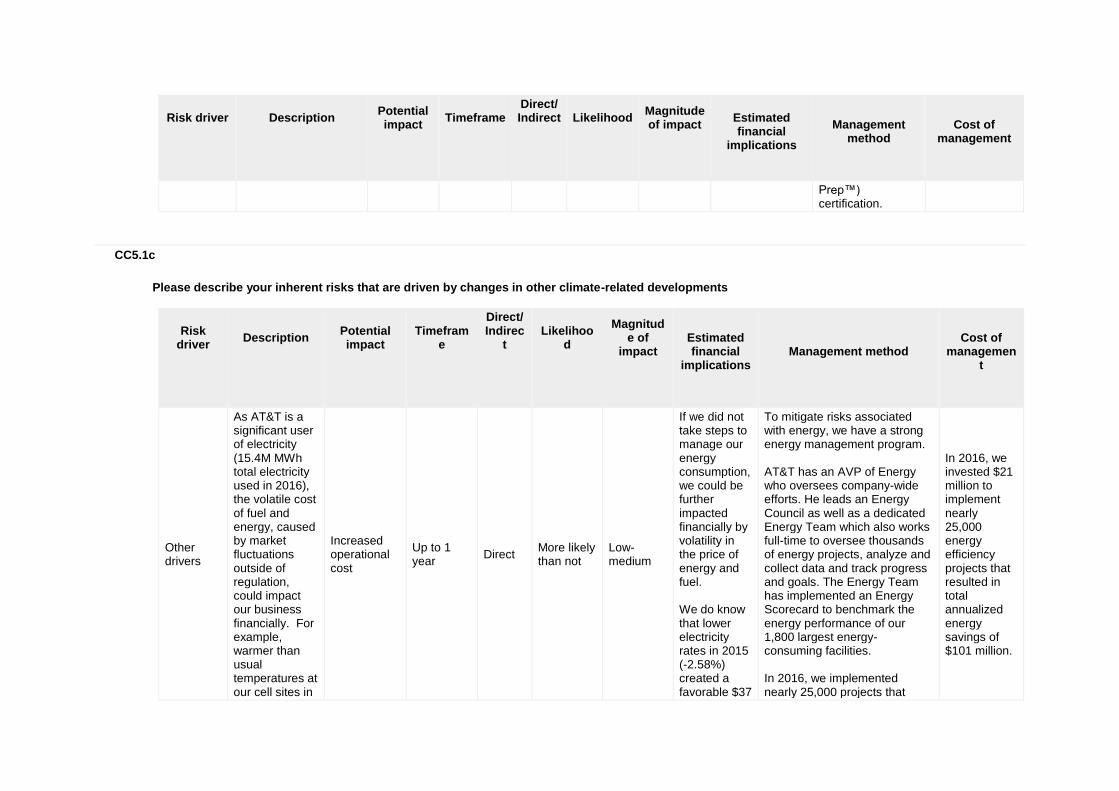
CC5.1c
Please describe your inherent risks that are driven by changes in other climate-related developments
Risk driver
Description
Potential impact
Timeframe
Direct/ Indirec
t
Likelihood
Magnitude of
impact
Estimated financial
implications
Management method
Cost of
management
Other drivers
As AT&T is a significant user of electricity (15.4M MWh total electricity used in 2016), the volatile cost of fuel and energy, caused by market fluctuations outside of regulation, could impact our business financially. For example, warmer than usual temperatures at our cell sites in
Increased operational cost
Up to 1 year
Direct More likely than not
Low-medium
If we did not take steps to manage our energy consumption, we could be further impacted financially by volatility in the price of energy and fuel. We do know that lower electricity rates in 2015 (-2.58%) created a favorable $37
To mitigate risks associated with energy, we have a strong energy management program. AT&T has an AVP of Energy who oversees company-wide efforts. He leads an Energy Council as well as a dedicated Energy Team which also works full-time to oversee thousands of energy projects, analyze and collect data and track progress and goals. The Energy Team has implemented an Energy Scorecard to benchmark the energy performance of our 1,800 largest energy-consuming facilities. In 2016, we implemented nearly 25,000 projects that
In 2016, we invested $21 million to implement nearly 25,000 energy efficiency projects that resulted in total annualized energy savings of $101 million.

Risk driver
Description
Potential impact
Timeframe
Direct/ Indirec
t
Likelihood
Magnitude of
impact
Estimated financial
implications
Management method
Cost of
management
Phoenix, Arizona could force AT&T to use higher levels of electricity to cool our cell site equipment.
million impact in energy expense. Further, our program efforts to manage our energy consumption have resulted in lower Enterprise-wide electricity consumption for the second consecutive year, even while AT&T's network and revenues continue to grow. This 1.5% reduction resulted in an additional favorable $123 million impact to our energy expense.
totaled an annualized savings of $101 million. Many of the projects were implemented by the Network organizations as part of their transformation strategy toward AT&T's Software Defined Network (SDN). Network equipment that is no longer part of this long-view strategy is eliminated after working circuits are consolidated into newer, more energy efficient equipment. Network projects completed in 2016 alone represent 62% of AT&T 2016 energy reduction effort, and resulted in annual electricity reduction of 746 million kWh. All 2016 energy projects taken together resulted in 1.195 Billion kWh, and emissions savings of 687,850 mton CO2-e. This is equivalent to the annual emissions of nearly 145,000 passenger vehicles, and the electricity used to power more than 101,000 houses annually according to the EPA GHG Equivalencies Calculator.
Reputation
Our stakeholders,
Other: Competitive
Up to 1 year
Direct More likely than not
Low-medium
If we did not take action to
We take sustainability and corporate responsibility very
Sustainability and
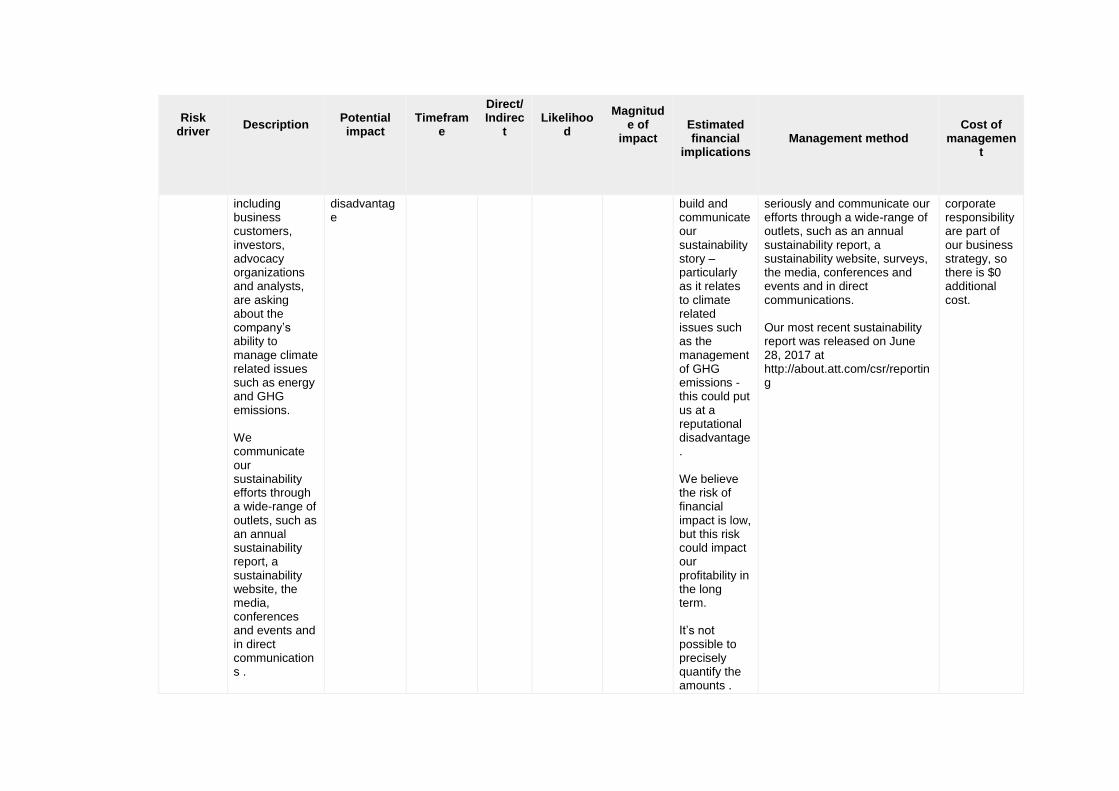
Risk driver
Description
Potential impact
Timeframe
Direct/ Indirec
t
Likelihood
Magnitude of
impact
Estimated financial
implications
Management method
Cost of
management
including business customers, investors, advocacy organizations and analysts, are asking about the company’s ability to manage climate related issues such as energy and GHG emissions. We communicate our sustainability efforts through a wide-range of outlets, such as an annual sustainability report, a sustainability website, the media, conferences and events and in direct communications .
disadvantage
build and communicate our sustainability story – particularly as it relates to climate related issues such as the management of GHG emissions - this could put us at a reputational disadvantage. We believe the risk of financial impact is low, but this risk could impact our profitability in the long term. It’s not possible to precisely quantify the amounts .
seriously and communicate our efforts through a wide-range of outlets, such as an annual sustainability report, a sustainability website, surveys, the media, conferences and events and in direct communications. Our most recent sustainability report was released on June 28, 2017 at http://about.att.com/csr/reporting
corporate responsibility are part of our business strategy, so there is $0 additional cost.

Risk driver
Description
Potential impact
Timeframe
Direct/ Indirec
t
Likelihood
Magnitude of
impact
Estimated financial
implications
Management method
Cost of
management
Our 2016 sustainability report is our 6th annual sustainability report. We also reply to several surveys from investors, analysts and our customers. If we did not take action to build and communicate our sustainability story – particularly as it relates to climate related issues such as the management of GHG emissions - this could put us at a reputational disadvantage to other leaders in the ICT sector.
CC5.1d

Please explain why you do not consider your company to be exposed to inherent risks driven by changes in regulation that have the potential to generate a substantive change in your business operations, revenue or expenditure
CC5.1e
Please explain why you do not consider your company to be exposed to inherent risks driven by changes in physical climate parameters that have the potential to generate a substantive change in your business operations, revenue or expenditure
CC5.1f
Please explain why you do not consider your company to be exposed to inherent risks driven by changes in other climate-related developments that have the potential to generate a substantive change in your business operations, revenue or expenditure

Further Information
Page: CC6. Climate Change Opportunities
CC6.1
Have you identified any inherent climate change opportunities that have the potential to generate a substantive change in your business operations, revenue or expenditure? Tick all that apply
Opportunities driven by changes in regulation Opportunities driven by changes in physical climate parameters Opportunities driven by changes in other climate-related developments
CC6.1a
Please describe your inherent opportunities that are driven by changes in regulation
Opportunity driver
Description
Potential impact
Timeframe
Direct/Indirect
Likelihood
Magnitude of impact
Estimated financial
implications
Management
method
Cost of
management
Fuel/energy taxes and regulations
Information and Communication Technology (ICT) solutions — comprising hardware, software and broadband technologies such as those provided by AT&T — have the ability to
Increased demand for existing products/services
1 to 3 years
Indirect (Client)
Likely Medium
If we capture opportunities related to increased demand for services that help others reduce emissions, it could mean increased revenue.
We offer solutions to facilitate flexible working. Technologies, such as VPN, Ethernet Hosting, IP conferencing, VoIP, Fleet Management, MIS over
The costs associated with pursing this opportunity are part of our business plan and have $0 additional cost.
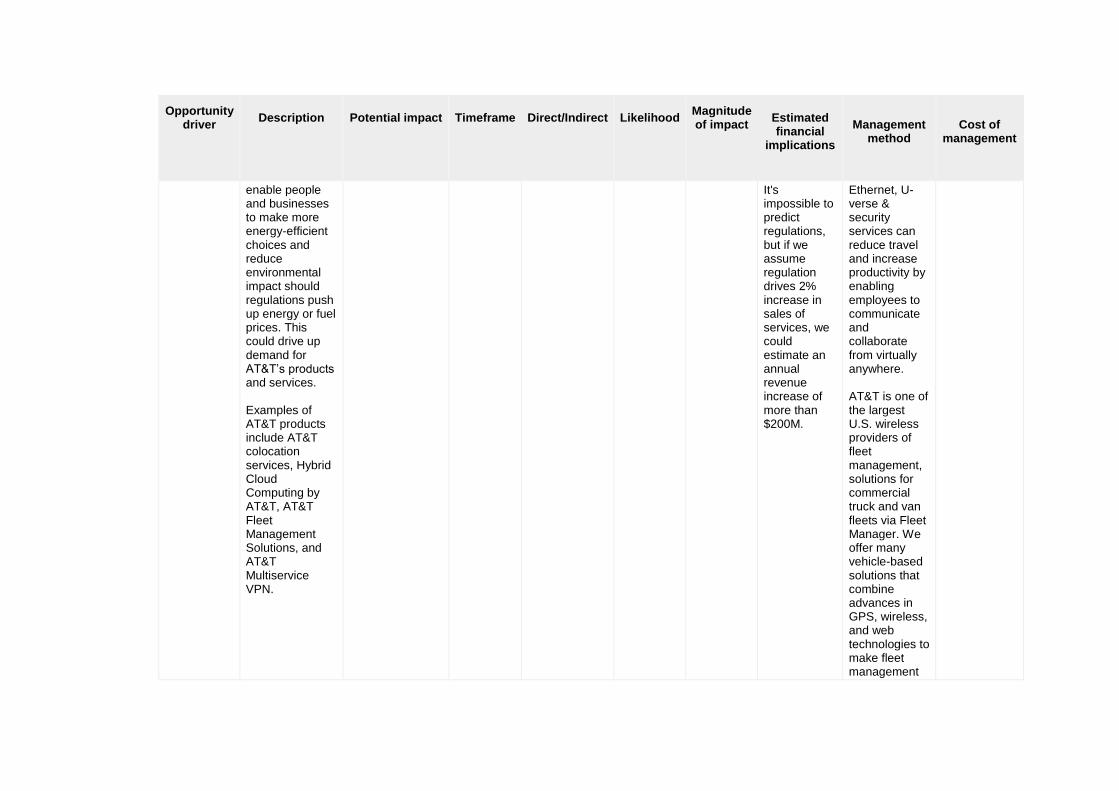
Opportunity driver
Description
Potential impact
Timeframe
Direct/Indirect
Likelihood
Magnitude of impact
Estimated financial
implications
Management
method
Cost of
management
enable people and businesses to make more energy-efficient choices and reduce environmental impact should regulations push up energy or fuel prices. This could drive up demand for AT&T’s products and services. Examples of AT&T products include AT&T colocation services, Hybrid Cloud Computing by AT&T, AT&T Fleet Management Solutions, and AT&T Multiservice VPN.
It's impossible to predict regulations, but if we assume regulation drives 2% increase in sales of services, we could estimate an annual revenue increase of more than $200M.
Ethernet, U-verse & security services can reduce travel and increase productivity by enabling employees to communicate and collaborate from virtually anywhere. AT&T is one of the largest U.S. wireless providers of fleet management, solutions for commercial truck and van fleets via Fleet Manager. We offer many vehicle-based solutions that combine advances in GPS, wireless, and web technologies to make fleet management

Opportunity driver
Description
Potential impact
Timeframe
Direct/Indirect
Likelihood
Magnitude of impact
Estimated financial
implications
Management
method
Cost of
management
an affordable reality. AT&T helps businesses build and operate their IT infrastructure efficiently — helping them to lower the cost of IT business, and enabling emissions reduction. We work with several business units inside our Mobility and Business Solutions (MBS) organization to position and promote the potential benefits of AT&T technology. To this goal, AT&T works with industry
Opportunity driver
Description
Potential impact
Timeframe
Direct/Indirect
Likelihood
Magnitude of impact
Estimated financial
implications
Management
method
Cost of
management
group, Global e-Sustainability Initiative (GeSi). We actively participate in GeSI by attending meetings, sitting on committees, and hosting dialogues to foster open cooperation across international boundaries and promote technologies that foster sustainable development. Through GeSI, AT&T participates in projects such as Project Portfolio, centered in the three primary focus areas of GeSI. Those focus areas are Climate
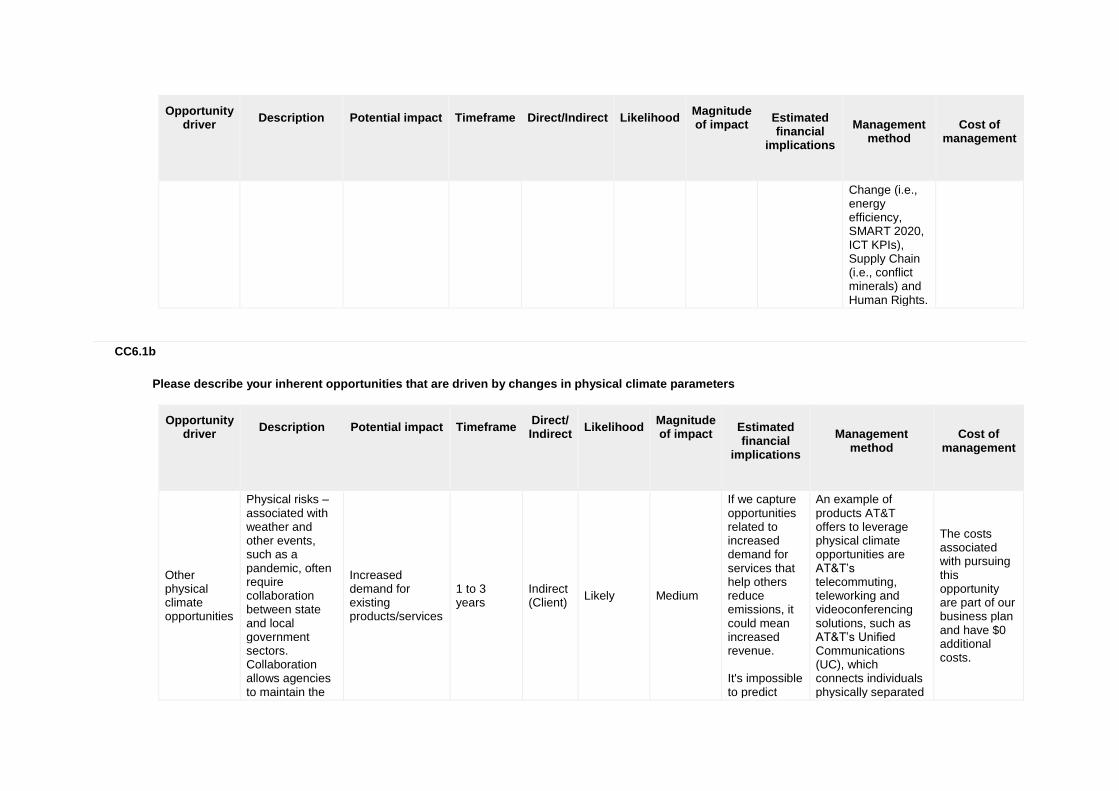
Opportunity driver
Description
Potential impact
Timeframe
Direct/Indirect
Likelihood
Magnitude of impact
Estimated financial
implications
Management
method
Cost of
management
Change (i.e., energy efficiency, SMART 2020, ICT KPIs), Supply Chain (i.e., conflict minerals) and Human Rights.
CC6.1b
Please describe your inherent opportunities that are driven by changes in physical climate parameters
Opportunity driver
Description
Potential impact
Timeframe
Direct/ Indirect
Likelihood
Magnitude of impact
Estimated financial
implications
Management
method
Cost of
management
Other physical climate opportunities
Physical risks – associated with weather and other events, such as a pandemic, often require collaboration between state and local government sectors. Collaboration allows agencies to maintain the
Increased demand for existing products/services
1 to 3 years
Indirect (Client)
Likely Medium
If we capture opportunities related to increased demand for services that help others reduce emissions, it could mean increased revenue. It's impossible to predict
An example of products AT&T offers to leverage physical climate opportunities are AT&T’s telecommuting, teleworking and videoconferencing solutions, such as AT&T’s Unified Communications (UC), which connects individuals physically separated
The costs associated with pursuing this opportunity are part of our business plan and have $0 additional costs.
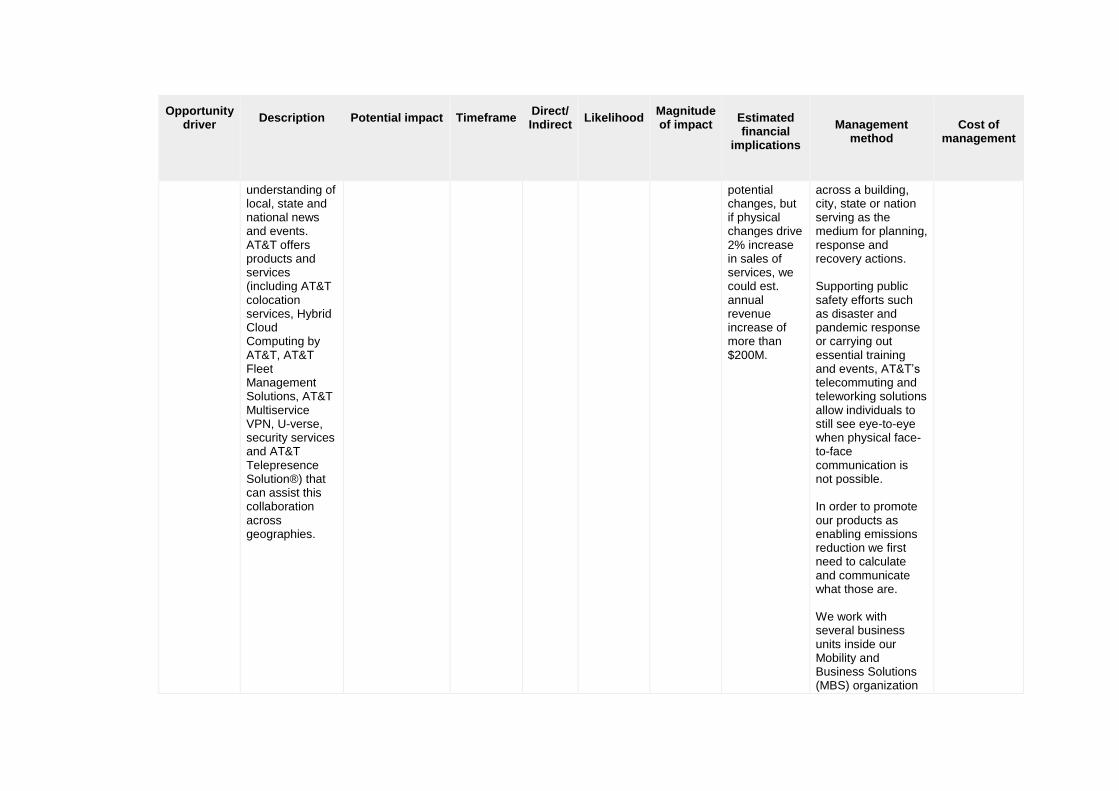
Opportunity driver
Description
Potential impact
Timeframe
Direct/ Indirect
Likelihood
Magnitude of impact
Estimated financial
implications
Management
method
Cost of
management
understanding of local, state and national news and events. AT&T offers products and services (including AT&T colocation services, Hybrid Cloud Computing by AT&T, AT&T Fleet Management Solutions, AT&T Multiservice VPN, U-verse, security services and AT&T Telepresence Solution®) that can assist this collaboration across geographies.
potential changes, but if physical changes drive 2% increase in sales of services, we could est. annual revenue increase of more than $200M.
across a building, city, state or nation serving as the medium for planning, response and recovery actions. Supporting public safety efforts such as disaster and pandemic response or carrying out essential training and events, AT&T’s telecommuting and teleworking solutions allow individuals to still see eye-to-eye when physical face-to-face communication is not possible. In order to promote our products as enabling emissions reduction we first need to calculate and communicate what those are. We work with several business units inside our Mobility and Business Solutions (MBS) organization
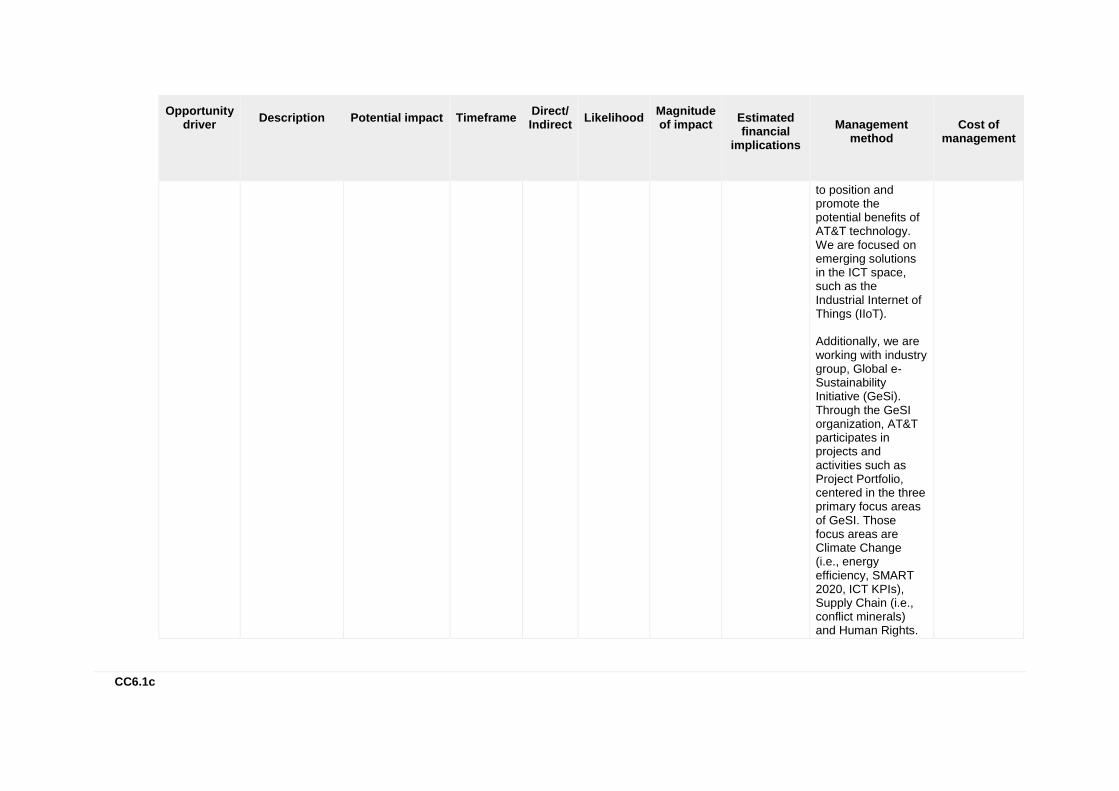
Opportunity driver
Description
Potential impact
Timeframe
Direct/ Indirect
Likelihood
Magnitude of impact
Estimated financial
implications
Management
method
Cost of
management
to position and promote the potential benefits of AT&T technology. We are focused on emerging solutions in the ICT space, such as the Industrial Internet of Things (IIoT). Additionally, we are working with industry group, Global e-Sustainability Initiative (GeSi). Through the GeSI organization, AT&T participates in projects and activities such as Project Portfolio, centered in the three primary focus areas of GeSI. Those focus areas are Climate Change (i.e., energy efficiency, SMART 2020, ICT KPIs), Supply Chain (i.e., conflict minerals) and Human Rights.
CC6.1c

Please describe your inherent opportunities that are driven by changes in other climate-related developments
Opportunity driver
Description
Potential impact
Timeframe
Direct/ Indirect
Likelihood
Magnitude of impact
Estimated financial
implications
Management
method
Cost of
management
Other drivers
As business customers’ expectations increase for companies to operate sustainably, they are also looking for companies to provide products and services that enable them to operate responsibly, such as products that can help them reduce their GHG emissions. AT&T offers products and services that can do this – such as technologies that enable people to work remotely like AT&T Connect, and AT&T
Increased demand for existing products/services
1 to 3 years
Direct About as likely as not
Low
If we capture opportunities related to increased demand for services that help others reduce emissions, it could mean increased revenue. It's impossible to predict potential revenue for unknown parameters, but if we assume these parameters drive 2% increase in sales of services, we could est. annual revenue increase of more than $200M.
We are working to quantify potential environmental benefits enabled by our technology. We have appointed people in the marketing team and mobility teams to focus on sustainability. We work with several business units inside our Mobility and Business Solutions organization to position and promote the potential benefits of AT&T technology, via a myriad of different ways ranging from our Issue Brief library on our CSR Sustainability Reporting site, to providing data to our Mobility and Business Solutions organization prior to client meetings to highlight our capabilities. We are focused on emerging solutions in
Addressing increased demands related to products and services that enable emissions reductions is part of our business model, so there is $0 additional cost.

Opportunity driver
Description
Potential impact
Timeframe
Direct/ Indirect
Likelihood
Magnitude of impact
Estimated financial
implications
Management
method
Cost of
management
Conferencing with Cisco WebEx. If we can take advantage of increased demand for these products and services, we believe this poses an opportunity for us to differentiate ourselves and establish a competitive advantage.
the ICT space, such as the Industrial Internet of Things (IIoT). We also work with industry groups to publicly promote the use of technology to address climate and resource challenges, including groups such as the Energy Efficiency Inter-Operator Collaboration Group, Alliance for Telecommunication Industry Solutions, and others).
CC6.1d
Please explain why you do not consider your company to be exposed to inherent opportunities driven by changes in regulation that have the potential to generate a substantive change in your business operations, revenue or expenditure
CC6.1e
Please explain why you do not consider your company to be exposed to inherent opportunities driven by changes in physical climate parameters that have the potential to generate a substantive change in your business operations, revenue or expenditure
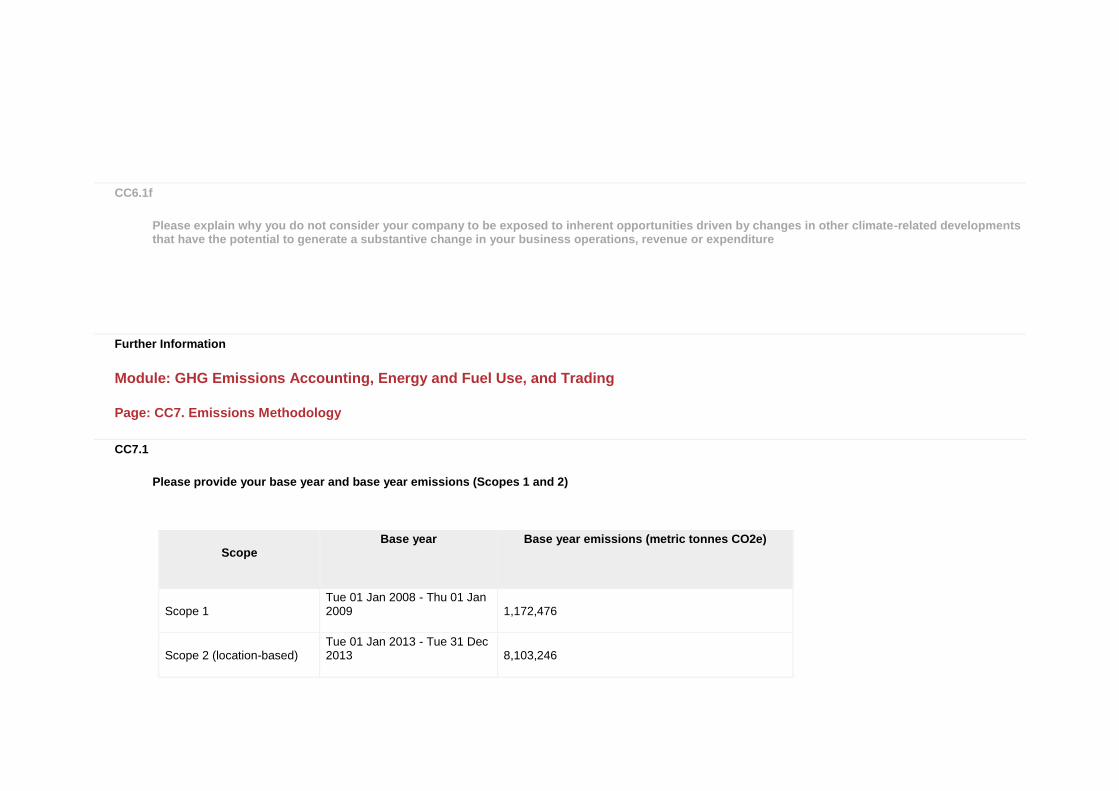
CC6.1f
Please explain why you do not consider your company to be exposed to inherent opportunities driven by changes in other climate-related developments that have the potential to generate a substantive change in your business operations, revenue or expenditure
Further Information
Module: GHG Emissions Accounting, Energy and Fuel Use, and Trading
Page: CC7. Emissions Methodology
CC7.1
Please provide your base year and base year emissions (Scopes 1 and 2)
Scope
Base year
Base year emissions (metric tonnes CO2e)
Scope 1 Tue 01 Jan 2008 - Thu 01 Jan 2009
1,172,476
Scope 2 (location-based) Tue 01 Jan 2013 - Tue 31 Dec 2013
8,103,246
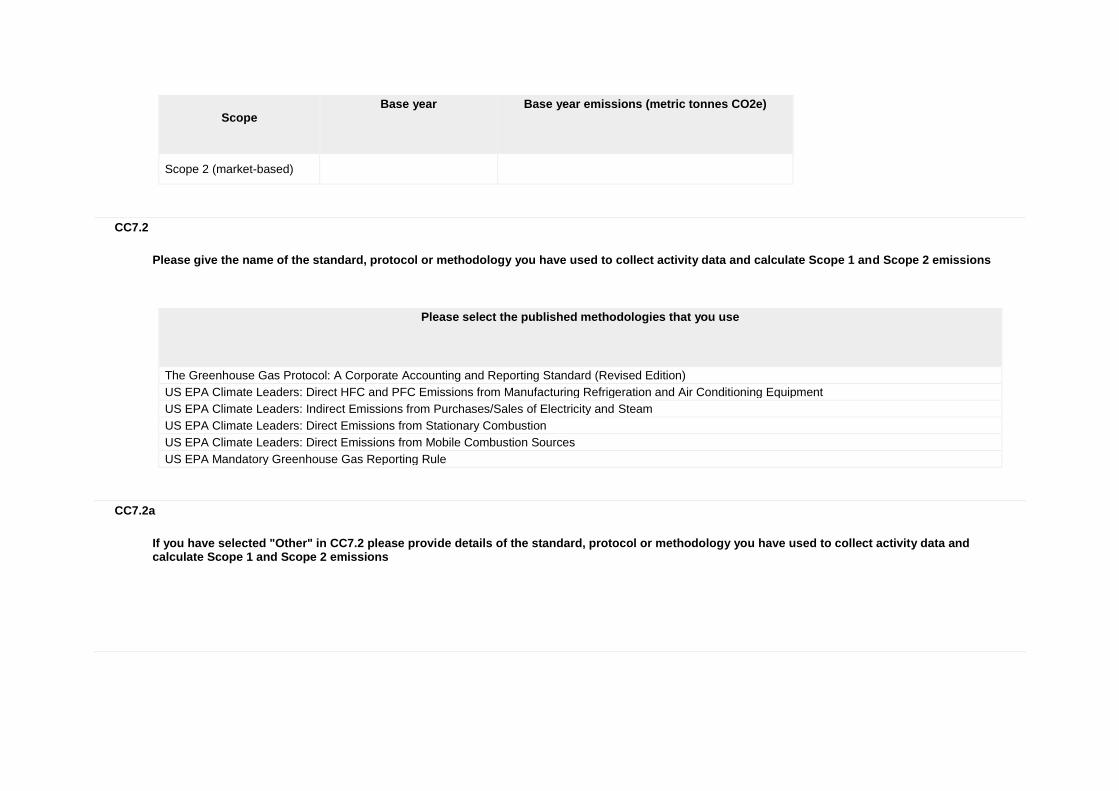
Scope
Base year
Base year emissions (metric tonnes CO2e)
Scope 2 (market-based)
CC7.2
Please give the name of the standard, protocol or methodology you have used to collect activity data and calculate Scope 1 and Scope 2 emissions
Please select the published methodologies that you use
The Greenhouse Gas Protocol: A Corporate Accounting and Reporting Standard (Revised Edition)
US EPA Climate Leaders: Direct HFC and PFC Emissions from Manufacturing Refrigeration and Air Conditioning Equipment
US EPA Climate Leaders: Indirect Emissions from Purchases/Sales of Electricity and Steam
US EPA Climate Leaders: Direct Emissions from Stationary Combustion
US EPA Climate Leaders: Direct Emissions from Mobile Combustion Sources
US EPA Mandatory Greenhouse Gas Reporting Rule
CC7.2a
If you have selected "Other" in CC7.2 please provide details of the standard, protocol or methodology you have used to collect activity data and calculate Scope 1 and Scope 2 emissions
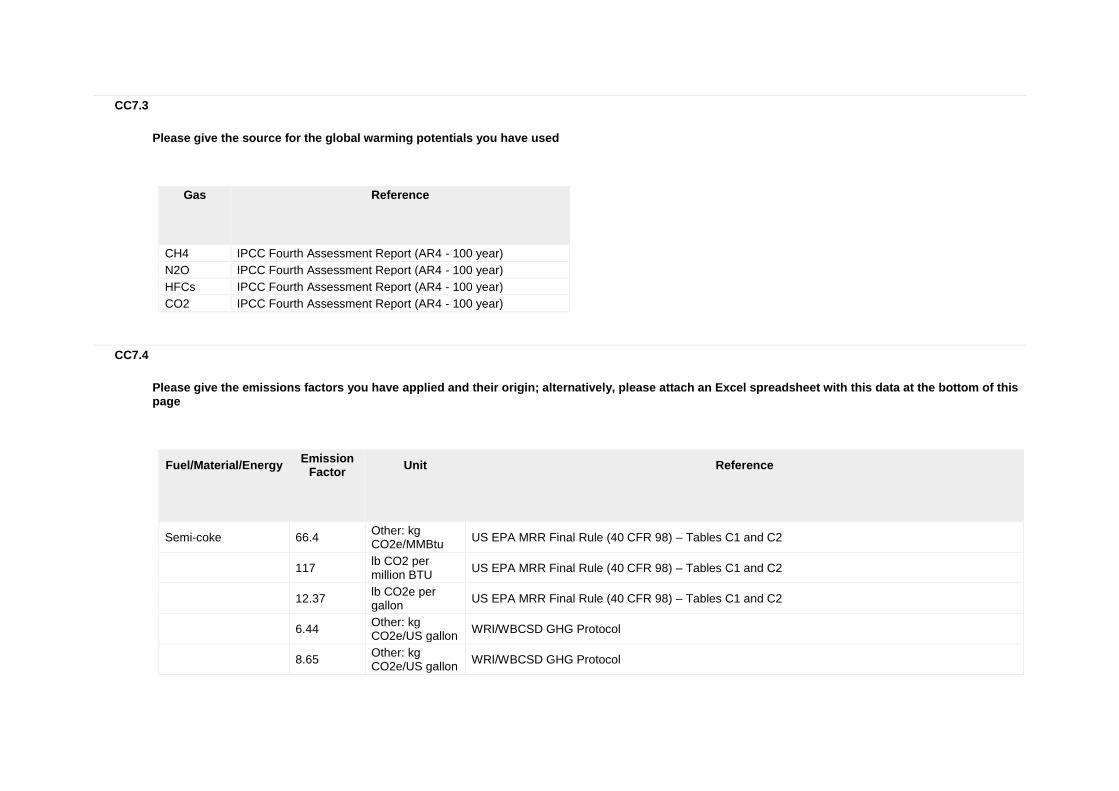
CC7.3
Please give the source for the global warming potentials you have used
Gas
Reference
CH4 IPCC Fourth Assessment Report (AR4 - 100 year)
N2O IPCC Fourth Assessment Report (AR4 - 100 year)
HFCs IPCC Fourth Assessment Report (AR4 - 100 year)
CO2 IPCC Fourth Assessment Report (AR4 - 100 year)
CC7.4
Please give the emissions factors you have applied and their origin; alternatively, please attach an Excel spreadsheet with this data at the bottom of this page
Fuel/Material/Energy
Emission Factor
Unit
Reference
Semi-coke 66.4 Other: kg CO2e/MMBtu
US EPA MRR Final Rule (40 CFR 98) – Tables C1 and C2
117 lb CO2 per million BTU
US EPA MRR Final Rule (40 CFR 98) – Tables C1 and C2
12.37 lb CO2e per gallon
US EPA MRR Final Rule (40 CFR 98) – Tables C1 and C2
6.44 Other: kg CO2e/US gallon
WRI/WBCSD GHG Protocol
8.65 Other: kg CO2e/US gallon
WRI/WBCSD GHG Protocol

Fuel/Material/Energy
Emission Factor
Unit
Reference
22.58 lb CO2e per gallon
US EPA MRR Final Rule (40 CFR 98) – Tables C1 and C2
21.57 lb CO2e per gallon
US EPA MRR Final Rule (40 CFR 98) – Tables C1 and C2
Electricity
US EPA eGRID2014 (year 2014 data version 1.0, released January 2017): emission factor values correspond to the eGRID sub region in which the facility operation resides; International emission factors: WRI/ WBCSD GHG Protocol. International Energy Agency Data Services. 2014 – Year 2012. "CO2 Emissions from Fuel Combustion” ; Emissions Factor: Intentionally blank, as emissions vary by region
Further Information
Page: CC8. Emissions Data - (1 Jan 2016 - 31 Dec 2016)
CC8.1
Please select the boundary you are using for your Scope 1 and 2 greenhouse gas inventory
Operational control
CC8.2
Please provide your gross global Scope 1 emissions figures in metric tonnes CO2e
1,140,631

CC8.3
Please describe your approach to reporting Scope 2 emissions
Scope 2, location-
based
Scope 2, market-
based
Comment
We are reporting a Scope 2, location-based figure
We are reporting a Scope 2, market-based figure
"Location-based Scope 2 emissions are calculated based on eGRID and IEA emission factors, as well as emissions related to steam purchases. Market-based Scope 2 emissions are calculated as Location-based value (C5 above) less any produced and consumed renewable energy from AT&T and DIRECTV operations."
CC8.3a
Please provide your gross global Scope 2 emissions figures in metric tonnes CO2e
Scope 2, location-based
Scope 2, market-based (if applicable)
Comment
7,737,255 7,527,591 Market-based totals factor in the solar, wind, and fuel cell that was generated and/or utilized by AT&T in 2016.
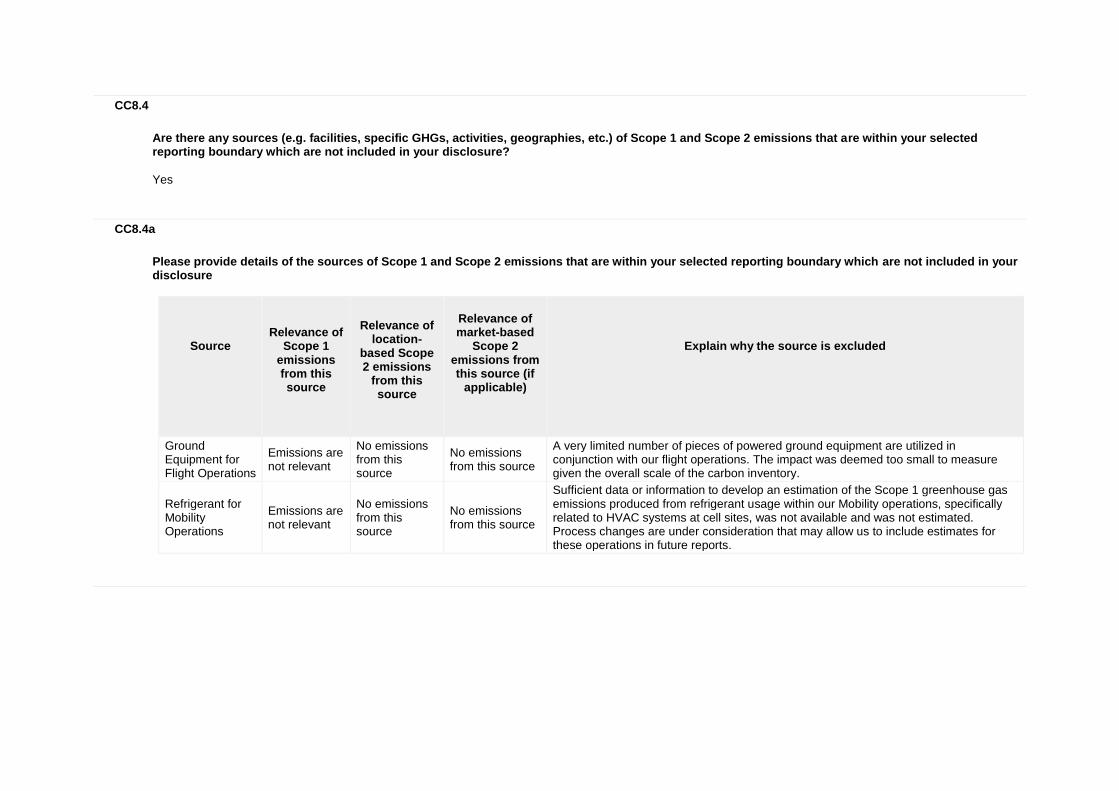
CC8.4
Are there any sources (e.g. facilities, specific GHGs, activities, geographies, etc.) of Scope 1 and Scope 2 emissions that are within your selected reporting boundary which are not included in your disclosure?
Yes
CC8.4a
Please provide details of the sources of Scope 1 and Scope 2 emissions that are within your selected reporting boundary which are not included in your disclosure
Source
Relevance of
Scope 1 emissions from this source
Relevance of
location-based Scope 2 emissions
from this source
Relevance of market-based
Scope 2 emissions from this source (if
applicable)
Explain why the source is excluded
Ground Equipment for Flight Operations
Emissions are not relevant
No emissions from this source
No emissions from this source
A very limited number of pieces of powered ground equipment are utilized in conjunction with our flight operations. The impact was deemed too small to measure given the overall scale of the carbon inventory.
Refrigerant for Mobility Operations
Emissions are not relevant
No emissions from this source
No emissions from this source
Sufficient data or information to develop an estimation of the Scope 1 greenhouse gas emissions produced from refrigerant usage within our Mobility operations, specifically related to HVAC systems at cell sites, was not available and was not estimated. Process changes are under consideration that may allow us to include estimates for these operations in future reports.

CC8.5
Please estimate the level of uncertainty of the total gross global Scope 1 and 2 emissions figures that you have supplied and specify the sources of uncertainty in your data gathering, handling and calculations
Scope
Uncertainty range
Main sources of uncertainty
Please expand on the uncertainty in your data
Scope 1 Less than or equal to 2%
Extrapolation Metering/ Measurement Constraints
Extrapolations from data samples were used for handheld propane, emergency generator runtimes, refrigerants, and portions of fleet. Unavailability of data at non-domestic/regional locations.
Scope 2 (location-based)
Less than or equal to 2%
Metering/ Measurement Constraints
Consumption at leased facilities for which no utility or metering data is available are calculated via kWh/sq. ft. intensity factors. Unavailability of data at non-domestic/regional locations.
Scope 2 (market-based)
More than 2% but less than or equal to 5%
Other: Uncertainty related to variable availability of the natural energy source (solar, wind, etc).
CC8.6
Please indicate the verification/assurance status that applies to your reported Scope 1 emissions
Third party verification or assurance process in place
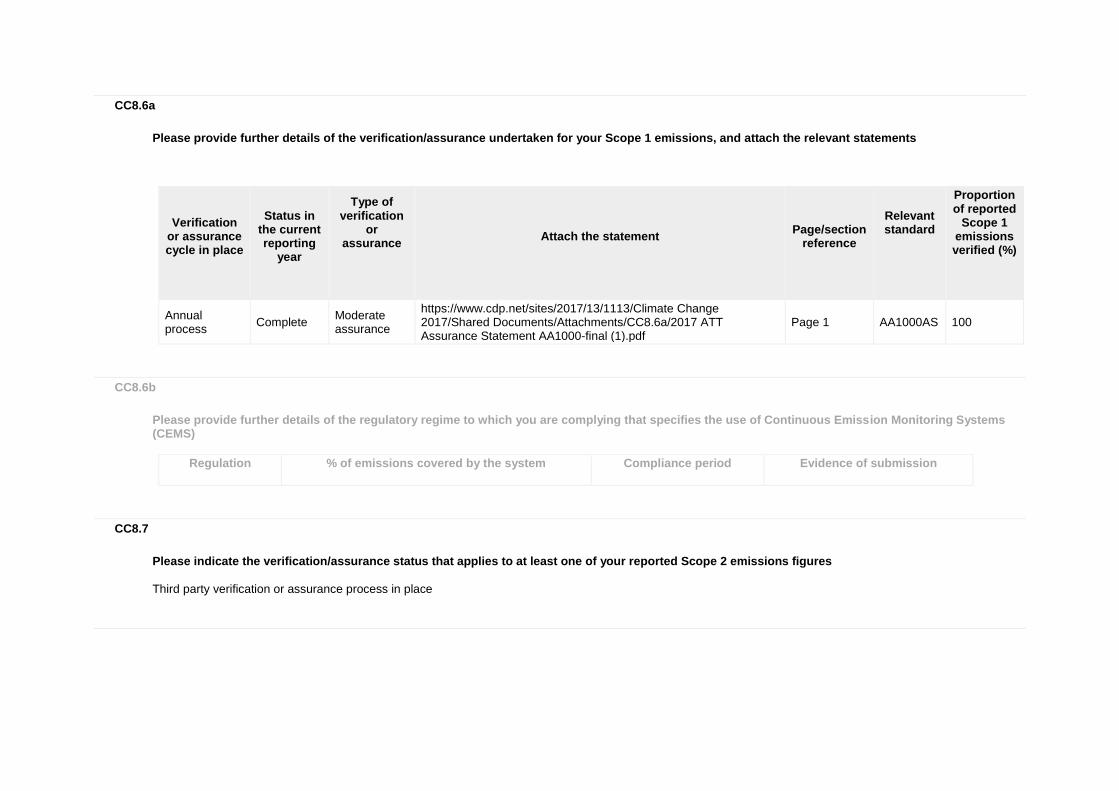
CC8.6a
Please provide further details of the verification/assurance undertaken for your Scope 1 emissions, and attach the relevant statements
Verification
or assurance cycle in place
Status in
the current reporting
year
Type of verification
or assurance
Attach the statement
Page/section
reference
Relevant standard
Proportion of reported
Scope 1 emissions verified (%)
Annual process
Complete Moderate assurance
https://www.cdp.net/sites/2017/13/1113/Climate Change 2017/Shared Documents/Attachments/CC8.6a/2017 ATT Assurance Statement AA1000-final (1).pdf
Page 1 AA1000AS 100
CC8.6b
Please provide further details of the regulatory regime to which you are complying that specifies the use of Continuous Emission Monitoring Systems (CEMS)
Regulation
% of emissions covered by the system
Compliance period
Evidence of submission
CC8.7
Please indicate the verification/assurance status that applies to at least one of your reported Scope 2 emissions figures
Third party verification or assurance process in place
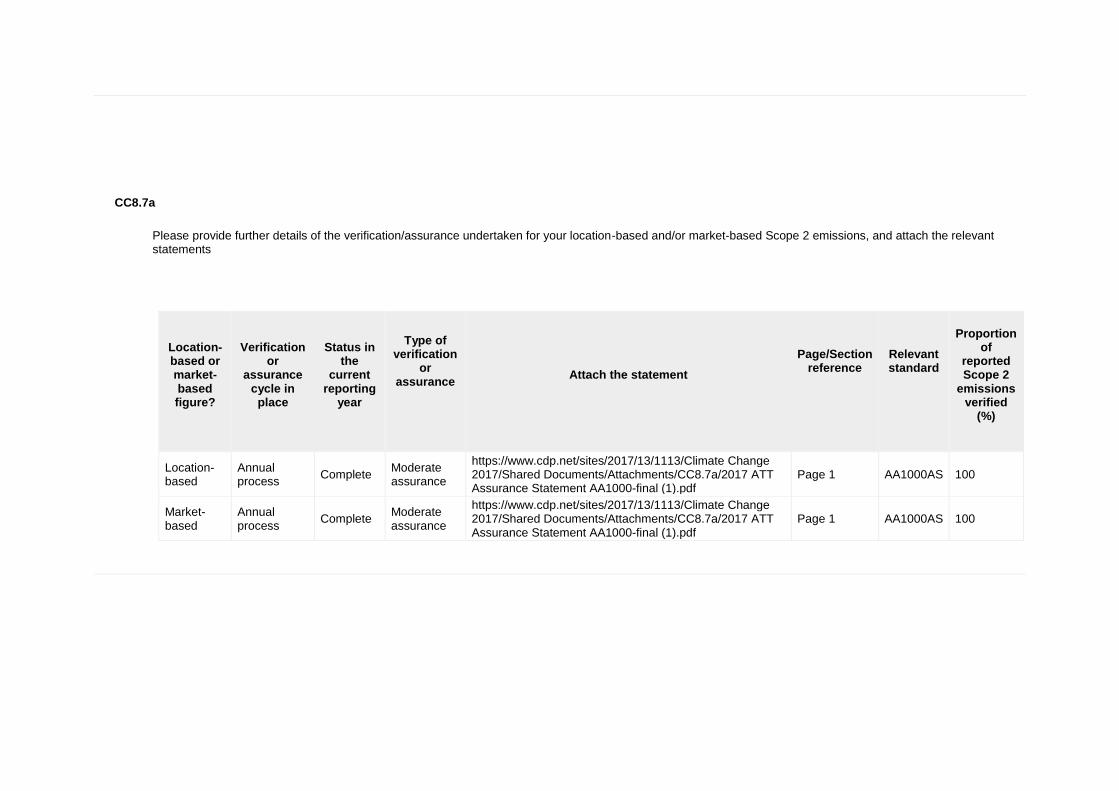
CC8.7a
Please provide further details of the verification/assurance undertaken for your location-based and/or market-based Scope 2 emissions, and attach the relevant statements
Location-based or market-based figure?
Verification
or assurance
cycle in place
Status in
the current
reporting year
Type of verification
or assurance
Attach the statement
Page/Section reference
Relevant standard
Proportion
of reported Scope 2
emissions verified
(%)
Location-based
Annual process
Complete Moderate assurance
https://www.cdp.net/sites/2017/13/1113/Climate Change 2017/Shared Documents/Attachments/CC8.7a/2017 ATT Assurance Statement AA1000-final (1).pdf
Page 1 AA1000AS 100
Market-based
Annual process
Complete Moderate assurance
https://www.cdp.net/sites/2017/13/1113/Climate Change 2017/Shared Documents/Attachments/CC8.7a/2017 ATT Assurance Statement AA1000-final (1).pdf
Page 1 AA1000AS 100
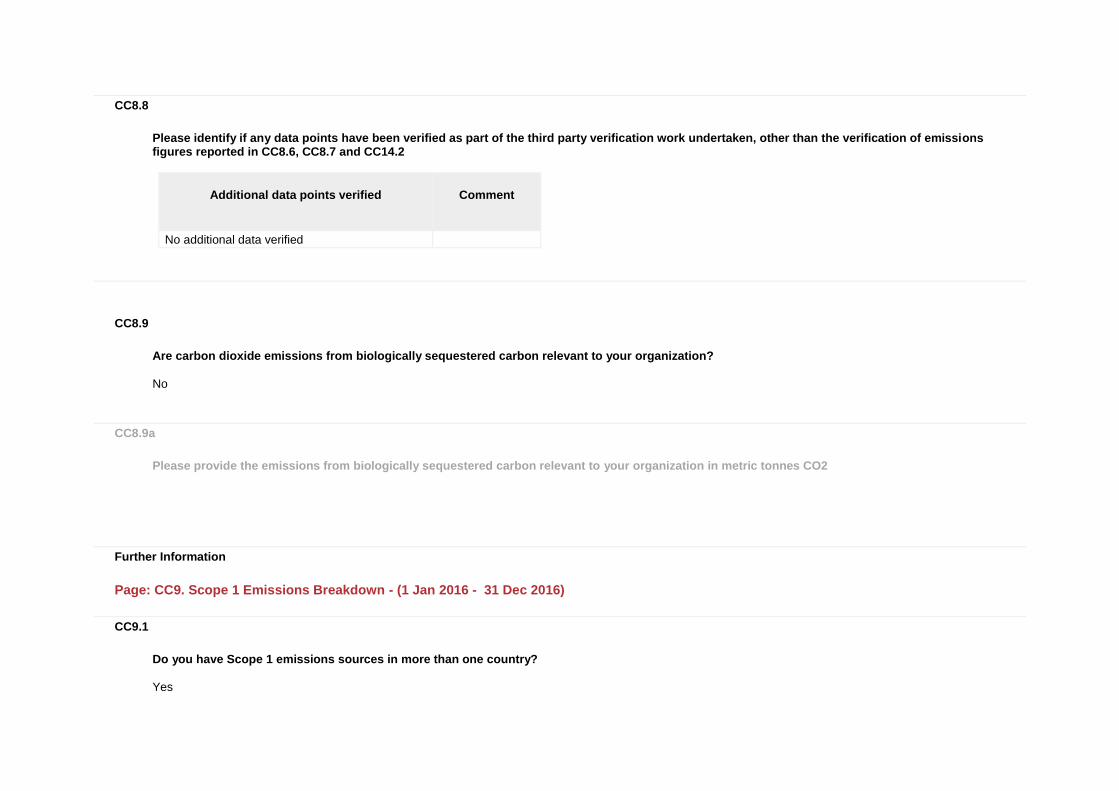
CC8.8
Please identify if any data points have been verified as part of the third party verification work undertaken, other than the verification of emissions figures reported in CC8.6, CC8.7 and CC14.2
Additional data points verified
Comment
No additional data verified
CC8.9
Are carbon dioxide emissions from biologically sequestered carbon relevant to your organization?
No
CC8.9a
Please provide the emissions from biologically sequestered carbon relevant to your organization in metric tonnes CO2
Further Information
Page: CC9. Scope 1 Emissions Breakdown - (1 Jan 2016 - 31 Dec 2016)
CC9.1
Do you have Scope 1 emissions sources in more than one country?
Yes

CC9.1a
Please break down your total gross global Scope 1 emissions by country/region
Country/Region
Scope 1 metric tonnes CO2e
United States of America 1,119,543
Rest of world 21,088
CC9.2
Please indicate which other Scope 1 emissions breakdowns you are able to provide (tick all that apply)
By GHG type By activity
CC9.2a
Please break down your total gross global Scope 1 emissions by business division
Business division
Scope 1 emissions (metric tonnes CO2e)
CC9.2b

Please break down your total gross global Scope 1 emissions by facility
Facility
Scope 1 emissions (metric tonnes CO2e)
Latitude
Longitude
CC9.2c
Please break down your total gross global Scope 1 emissions by GHG type
GHG type
Scope 1 emissions (metric tonnes CO2e)
CO2 988,226
CH4 3,866
N2O 9,800
HFCs 138,739
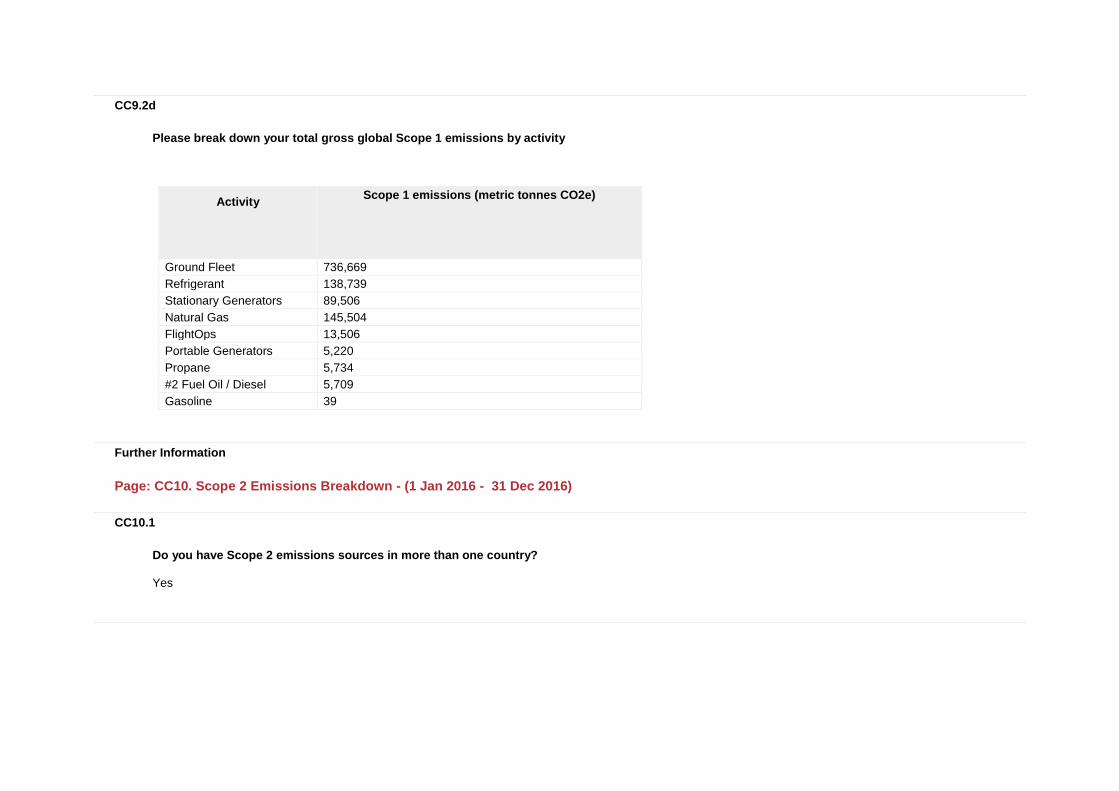
CC9.2d
Please break down your total gross global Scope 1 emissions by activity
Activity
Scope 1 emissions (metric tonnes CO2e)
Ground Fleet 736,669
Refrigerant 138,739
Stationary Generators 89,506
Natural Gas 145,504
FlightOps 13,506
Portable Generators 5,220
Propane 5,734
#2 Fuel Oil / Diesel 5,709
Gasoline 39
Further Information
Page: CC10. Scope 2 Emissions Breakdown - (1 Jan 2016 - 31 Dec 2016)
CC10.1
Do you have Scope 2 emissions sources in more than one country?
Yes
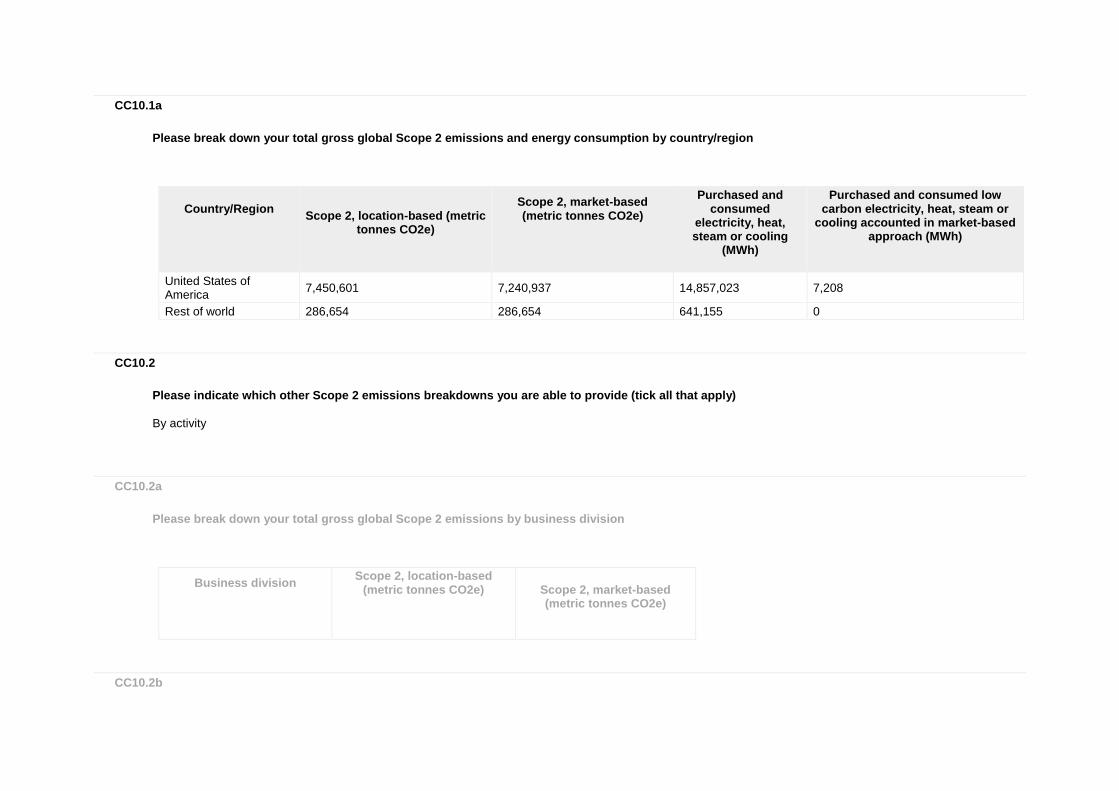
CC10.1a
Please break down your total gross global Scope 2 emissions and energy consumption by country/region
Country/Region
Scope 2, location-based (metric
tonnes CO2e)
Scope 2, market-based (metric tonnes CO2e)
Purchased and consumed
electricity, heat, steam or cooling
(MWh)
Purchased and consumed low carbon electricity, heat, steam or
cooling accounted in market-based approach (MWh)
United States of America
7,450,601 7,240,937 14,857,023 7,208
Rest of world 286,654 286,654 641,155 0
CC10.2
Please indicate which other Scope 2 emissions breakdowns you are able to provide (tick all that apply)
By activity
CC10.2a
Please break down your total gross global Scope 2 emissions by business division
Business division
Scope 2, location-based (metric tonnes CO2e)
Scope 2, market-based (metric tonnes CO2e)
CC10.2b

Please break down your total gross global Scope 2 emissions by facility
Facility
Scope 2, location-based (metric tonnes CO2e)
Scope 2, market-based (metric tonnes CO2e)
CC10.2c
Please break down your total gross global Scope 2 emissions by activity
Activity
Scope 2, location-based (metric tonnes CO2e)
Scope 2, market-based (metric tonnes CO2e)
Electric Power 7,725,686 7,516,022
Steam 11,569 0
Further Information
Page: CC11. Energy
CC11.1
What percentage of your total operational spend in the reporting year was on energy?
More than 0% but less than or equal to 5%

CC11.2
Please state how much heat, steam, and cooling in MWh your organization has purchased and consumed during the reporting year
Energy type
MWh
Heat 0
Steam 51,089
Cooling 0
CC11.3
Please state how much fuel in MWh your organization has consumed (for energy purposes) during the reporting year
41,80,736

CC11.3a
Please complete the table by breaking down the total "Fuel" figure entered above by fuel type
Fuels
MWh
Natural gas 808,011
Distillate fuel oil No 2 549,680
Distillate fuel oil No 6 0
Motor gasoline 2,594,068
Propane 45,407
Butane 6
Other: CNG from Fleet 122,375
Jet kerosene 54,602
Kerosene 3,165.09
Liquefied petroleum gas (LPG) 3,422
CC11.4
Please provide details of the electricity, heat, steam or cooling amounts that were accounted at a low carbon emission factor in the market-based Scope 2 figure reported in CC8.3a
Basis for applying a low carbon emission factor
MWh consumed associated with low
carbon electricity, heat, steam or cooling
Emissions factor (in units of metric
tonnes CO2e per MWh)
Comment
No purchases or generation of low carbon electricity, heat, steam or cooling accounted with a low carbon emissions factor
0 0

CC11.5
Please report how much electricity you produce in MWh, and how much electricity you consume in MWh
Total
electricity consumed
(MWh)
Consumed
electricity that is purchased (MWh)
Total
electricity produced
(MWh)
Total renewable
electricity produced (MWh)
Consumed renewable electricity
that is produced by
company (MWh)
Comment
15,447,090 15,156,056 291,034 6,630 6,630 298,242 MWh of Solar, Fuel Cell and Wind production. AT&T utilizes 100% of its alternative and renewable electricity.
Further Information
Page: CC12. Emissions Performance
CC12.1
How do your gross global emissions (Scope 1 and 2 combined) for the reporting year compare to the previous year?
No change
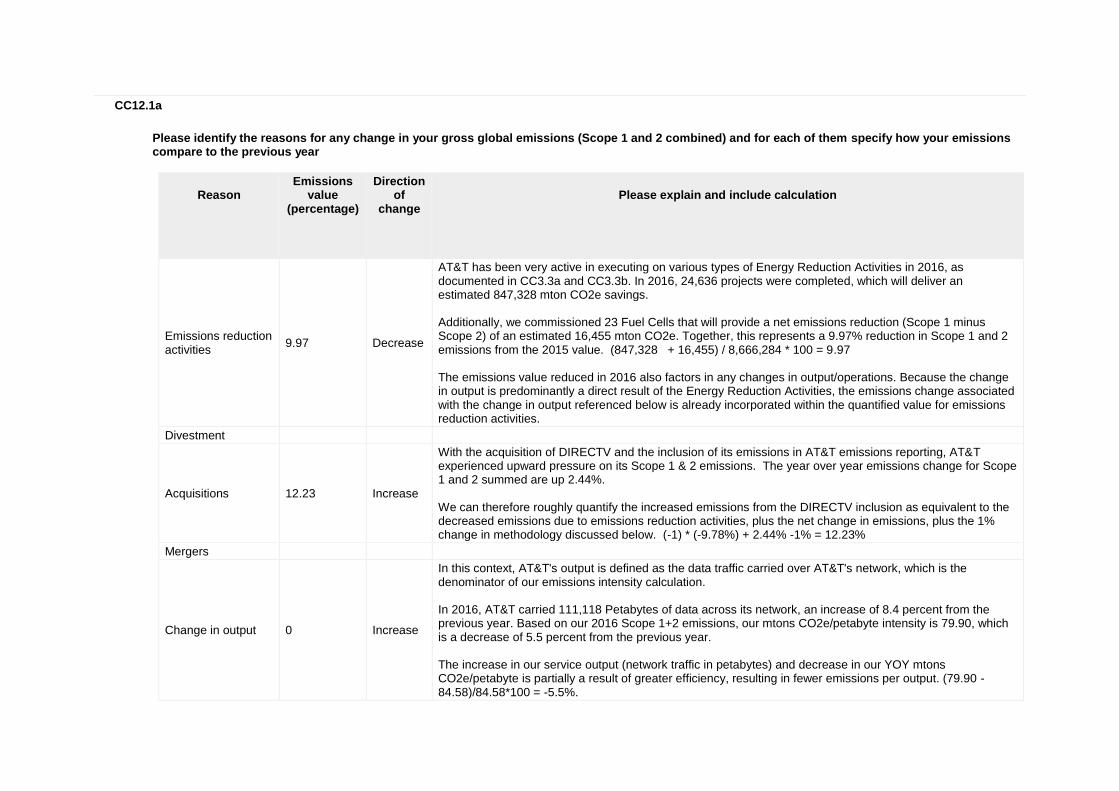
CC12.1a
Please identify the reasons for any change in your gross global emissions (Scope 1 and 2 combined) and for each of them specify how your emissions compare to the previous year
Reason
Emissions value
(percentage)
Direction of
change
Please explain and include calculation
Emissions reduction activities
9.97 Decrease
AT&T has been very active in executing on various types of Energy Reduction Activities in 2016, as documented in CC3.3a and CC3.3b. In 2016, 24,636 projects were completed, which will deliver an estimated 847,328 mton CO2e savings. Additionally, we commissioned 23 Fuel Cells that will provide a net emissions reduction (Scope 1 minus Scope 2) of an estimated 16,455 mton CO2e. Together, this represents a 9.97% reduction in Scope 1 and 2 emissions from the 2015 value. (847,328 + 16,455) / 8,666,284 * 100 = 9.97 The emissions value reduced in 2016 also factors in any changes in output/operations. Because the change in output is predominantly a direct result of the Energy Reduction Activities, the emissions change associated with the change in output referenced below is already incorporated within the quantified value for emissions reduction activities.
Divestment
Acquisitions 12.23 Increase
With the acquisition of DIRECTV and the inclusion of its emissions in AT&T emissions reporting, AT&T experienced upward pressure on its Scope 1 & 2 emissions. The year over year emissions change for Scope 1 and 2 summed are up 2.44%. We can therefore roughly quantify the increased emissions from the DIRECTV inclusion as equivalent to the decreased emissions due to emissions reduction activities, plus the net change in emissions, plus the 1% change in methodology discussed below. (-1) * (-9.78%) + 2.44% -1% = 12.23%
Mergers
Change in output 0 Increase
In this context, AT&T's output is defined as the data traffic carried over AT&T's network, which is the denominator of our emissions intensity calculation. In 2016, AT&T carried 111,118 Petabytes of data across its network, an increase of 8.4 percent from the previous year. Based on our 2016 Scope 1+2 emissions, our mtons CO2e/petabyte intensity is 79.90, which is a decrease of 5.5 percent from the previous year. The increase in our service output (network traffic in petabytes) and decrease in our YOY mtons CO2e/petabyte is partially a result of greater efficiency, resulting in fewer emissions per output. (79.90 - 84.58)/84.58*100 = -5.5%.
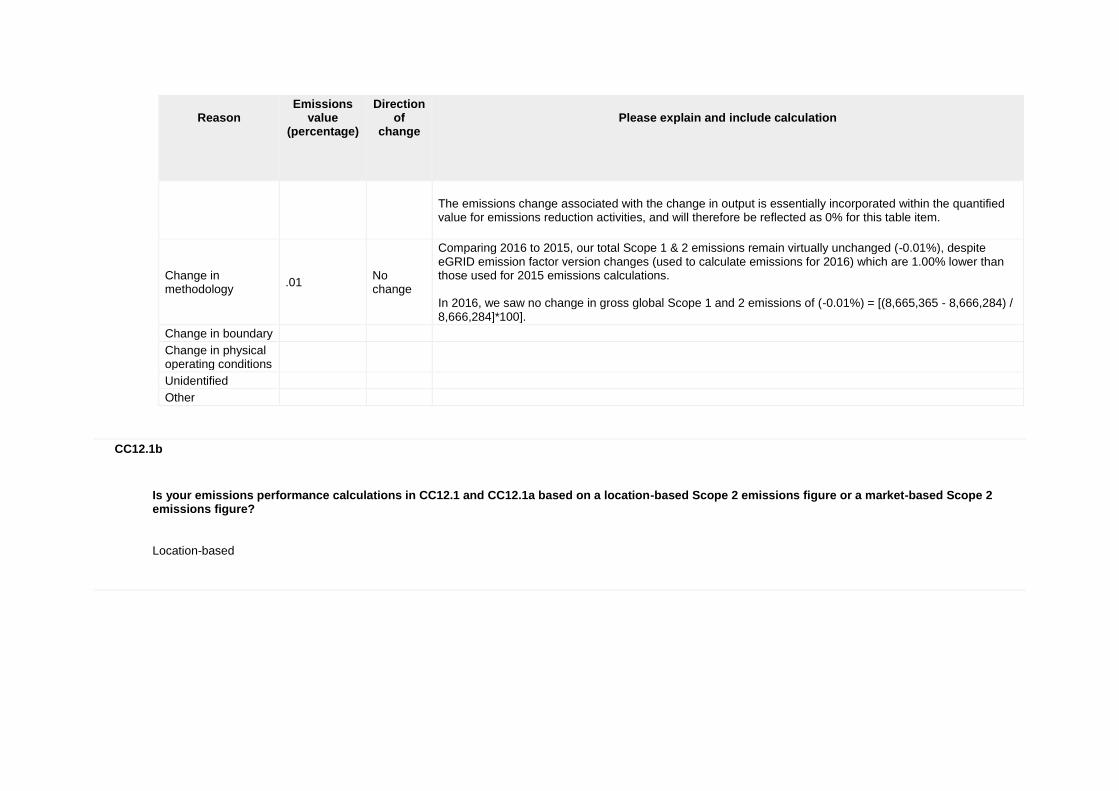
Reason
Emissions value
(percentage)
Direction of
change
Please explain and include calculation
The emissions change associated with the change in output is essentially incorporated within the quantified value for emissions reduction activities, and will therefore be reflected as 0% for this table item.
Change in methodology
.01 No change
Comparing 2016 to 2015, our total Scope 1 & 2 emissions remain virtually unchanged (-0.01%), despite eGRID emission factor version changes (used to calculate emissions for 2016) which are 1.00% lower than those used for 2015 emissions calculations. In 2016, we saw no change in gross global Scope 1 and 2 emissions of (-0.01%) = [(8,665,365 - 8,666,284) / 8,666,284]*100].
Change in boundary
Change in physical operating conditions
Unidentified
Other
CC12.1b
Is your emissions performance calculations in CC12.1 and CC12.1a based on a location-based Scope 2 emissions figure or a market-based Scope 2 emissions figure?
Location-based
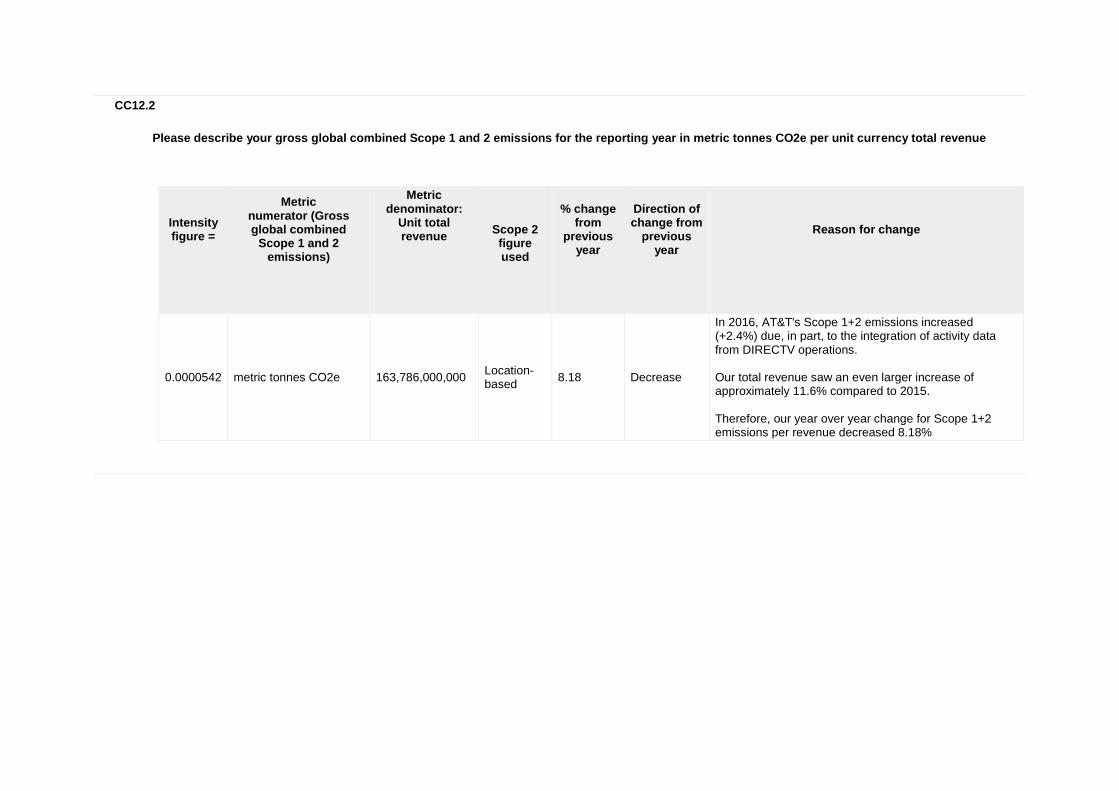
CC12.2
Please describe your gross global combined Scope 1 and 2 emissions for the reporting year in metric tonnes CO2e per unit currency total revenue
Intensity figure =
Metric numerator (Gross global combined
Scope 1 and 2 emissions)
Metric denominator:
Unit total revenue
Scope 2 figure used
% change from
previous year
Direction of change from
previous year
Reason for change
0.0000542 metric tonnes CO2e 163,786,000,000 Location-based
8.18 Decrease
In 2016, AT&T's Scope 1+2 emissions increased (+2.4%) due, in part, to the integration of activity data from DIRECTV operations. Our total revenue saw an even larger increase of approximately 11.6% compared to 2015. Therefore, our year over year change for Scope 1+2 emissions per revenue decreased 8.18%

CC12.3
Please provide any additional intensity (normalized) metrics that are appropriate to your business operations
Intensity figure =
Metric numerator (Gross global combined
Scope 1 and 2 emissions)
Metric denominator
Metric
denominator: Unit total
Scope
2 figure used
% change
from previous
year
Direction of
change from
previous year
Reason for change
79.9 metric tonnes CO2e Other: Petabyte
111,118 5.5 Decrease
In 2016, AT&T's Scope 1+2 increased (+2.4%) due, in part, to despite the integration of activity data from DIRECTV operations. Our network traffic (petabyte) output saw an increase of approximately 8.4% compared to our restated 2015 traffic value*. Therefore, our year over year change for Scope 1+2 emissions per petabyte decreased 5.5%. * AT&T is restating its 2014 and 2015 data traffic volume (Petabytes of data traffic carried over AT&T's network) as a result of accuracy improvements made in capturing and estimating volume from one of its largest traffic sources. The method was used to backcast data traffic volume to the beginning of 2014, and is regarded as a vastly more accurate representation of traffic volume than was previously available.
Further Information
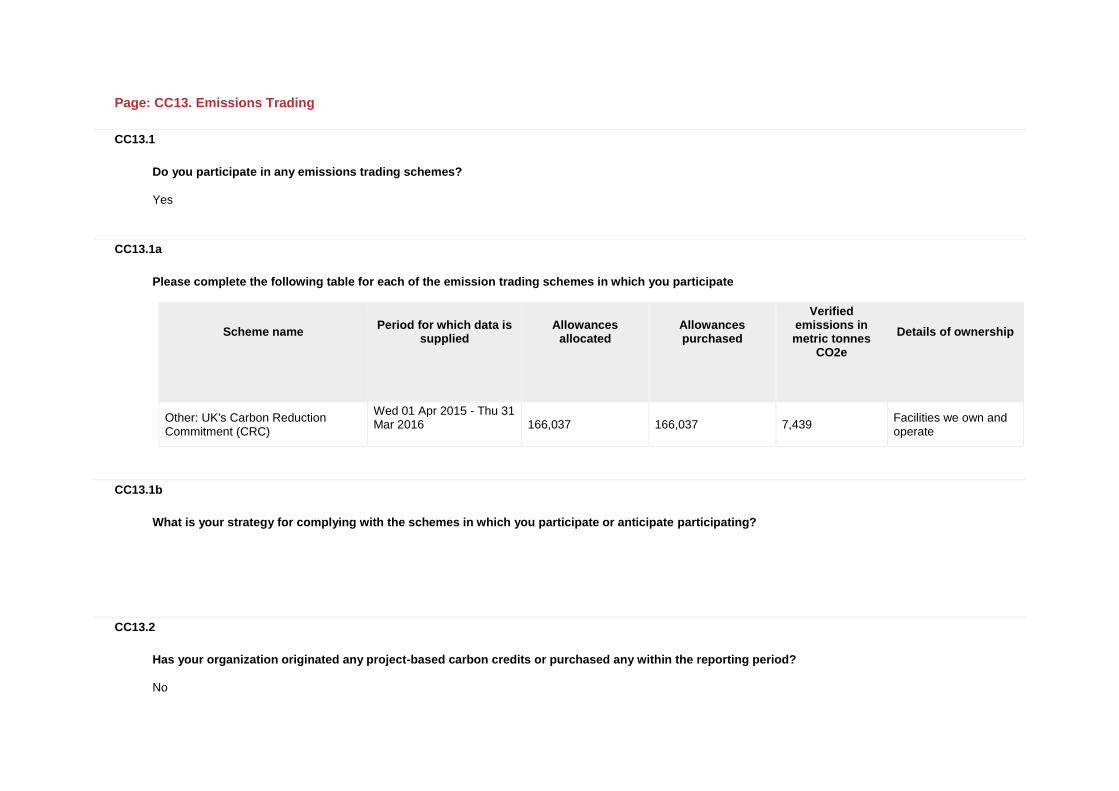
Page: CC13. Emissions Trading
CC13.1
Do you participate in any emissions trading schemes?
Yes
CC13.1a
Please complete the following table for each of the emission trading schemes in which you participate
Scheme name
Period for which data is supplied
Allowances allocated
Allowances purchased
Verified emissions in metric tonnes
CO2e
Details of ownership
Other: UK's Carbon Reduction Commitment (CRC)
Wed 01 Apr 2015 - Thu 31 Mar 2016
166,037 166,037 7,439 Facilities we own and operate
CC13.1b
What is your strategy for complying with the schemes in which you participate or anticipate participating?
CC13.2
Has your organization originated any project-based carbon credits or purchased any within the reporting period?
No
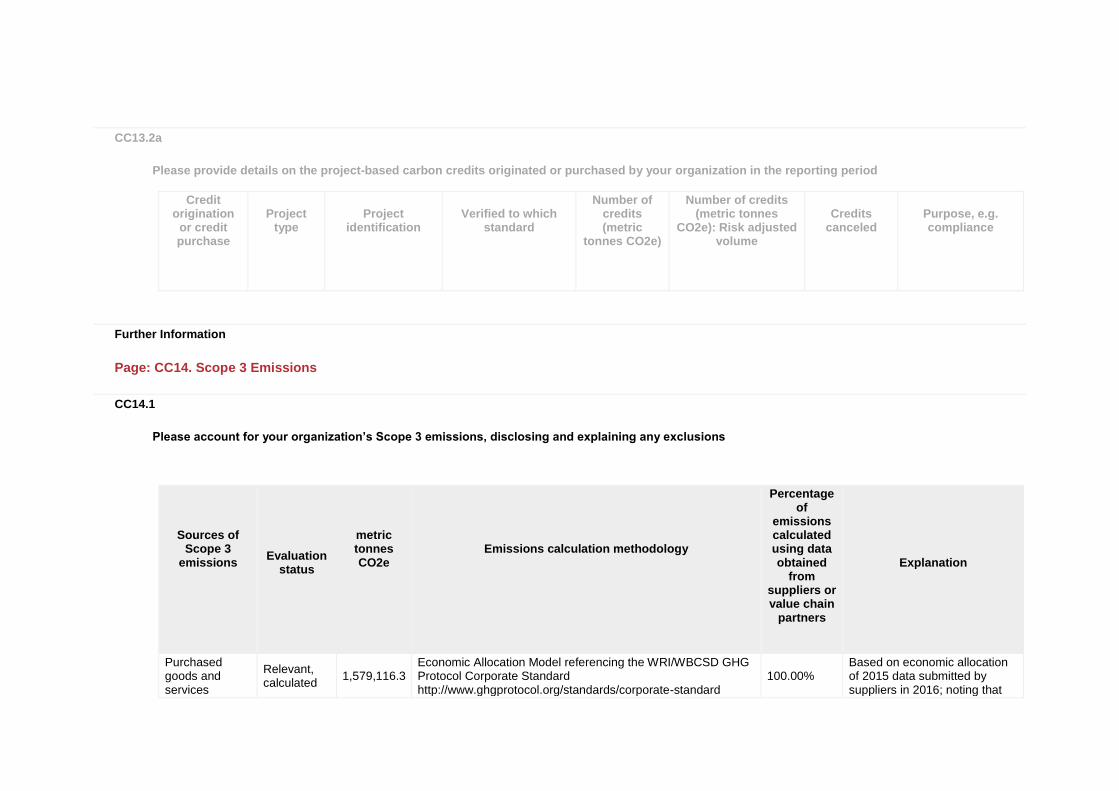
CC13.2a
Please provide details on the project-based carbon credits originated or purchased by your organization in the reporting period
Credit origination
or credit purchase
Project type
Project identification
Verified to which standard
Number of credits (metric
tonnes CO2e)
Number of credits (metric tonnes
CO2e): Risk adjusted volume
Credits canceled
Purpose, e.g. compliance
Further Information
Page: CC14. Scope 3 Emissions
CC14.1
Please account for your organization’s Scope 3 emissions, disclosing and explaining any exclusions
Sources of Scope 3
emissions
Evaluation status
metric tonnes CO2e
Emissions calculation methodology
Percentage of
emissions calculated using data obtained
from suppliers or value chain
partners
Explanation
Purchased goods and services
Relevant, calculated
1,579,116.3 Economic Allocation Model referencing the WRI/WBCSD GHG Protocol Corporate Standard http://www.ghgprotocol.org/standards/corporate-standard
100.00% Based on economic allocation of 2015 data submitted by suppliers in 2016; noting that
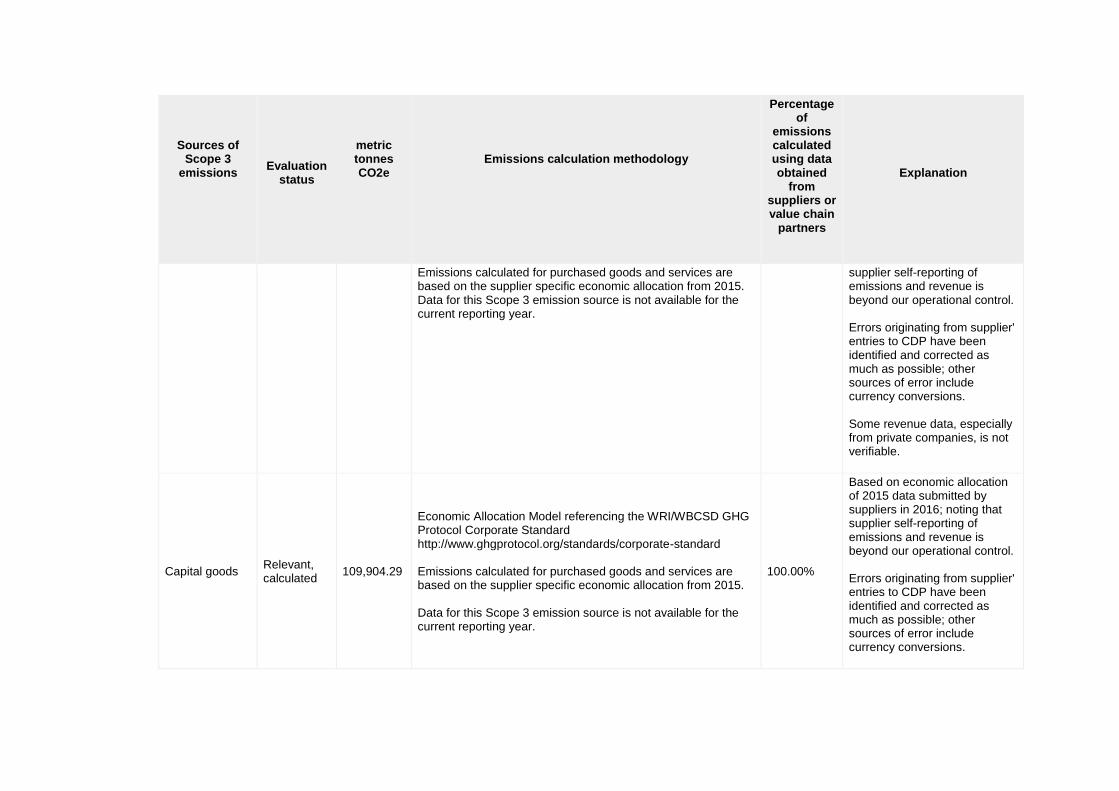
Sources of Scope 3
emissions
Evaluation status
metric tonnes CO2e
Emissions calculation methodology
Percentage of
emissions calculated using data obtained
from suppliers or value chain
partners
Explanation
Emissions calculated for purchased goods and services are based on the supplier specific economic allocation from 2015. Data for this Scope 3 emission source is not available for the current reporting year.
supplier self-reporting of emissions and revenue is beyond our operational control. Errors originating from supplier' entries to CDP have been identified and corrected as much as possible; other sources of error include currency conversions. Some revenue data, especially from private companies, is not verifiable.
Capital goods Relevant, calculated
109,904.29
Economic Allocation Model referencing the WRI/WBCSD GHG Protocol Corporate Standard http://www.ghgprotocol.org/standards/corporate-standard Emissions calculated for purchased goods and services are based on the supplier specific economic allocation from 2015. Data for this Scope 3 emission source is not available for the current reporting year.
100.00%
Based on economic allocation of 2015 data submitted by suppliers in 2016; noting that supplier self-reporting of emissions and revenue is beyond our operational control. Errors originating from supplier' entries to CDP have been identified and corrected as much as possible; other sources of error include currency conversions.

Sources of Scope 3
emissions
Evaluation status
metric tonnes CO2e
Emissions calculation methodology
Percentage of
emissions calculated using data obtained
from suppliers or value chain
partners
Explanation
Some revenue data, especially from private companies, is not verifiable.
Fuel-and-energy-related activities (not included in Scope 1 or 2)
Not relevant, explanation provided
All of our relevant fuel and energy related activities are captured in Scope 1 and Scope 2.
Upstream transportation and distribution
Relevant, calculated
126,109.64
Economic Allocation Model referencing the WRI/WBCSD GHG Protocol Corporate Standard http://www.ghgprotocol.org/standards/corporate-standard Emissions calculated for purchased goods and services are based on the supplier specific economic allocation from 2015. Data for this Scope 3 emission source is not available for the current reporting year.
100.00%
Based on economic allocation of 2015 data submitted by suppliers in 2016; noting that supplier self-reporting of emissions and revenue is beyond our operational control. Errors originating from supplier' entries to CDP have been identified and corrected as much as possible; other sources of error include currency conversions. Some revenue data, especially from private companies, is not verifiable.
Waste generated in operations
Relevant, not yet calculated
Business travel Relevant, calculated
101,526
EPA Climate Leaders: Optional Emissions from Commuting, Business Travel, and Product Transport methodology with more updated DEFRA emissions factors for air travel and EPA factors for car travel.
100.00%

Sources of Scope 3
emissions
Evaluation status
metric tonnes CO2e
Emissions calculation methodology
Percentage of
emissions calculated using data obtained
from suppliers or value chain
partners
Explanation
Employee commuting
Not evaluated
Upstream leased assets
Not relevant, explanation provided
All upstream leased assets are included in Scope 1 or Scope 2.
Downstream transportation and distribution
Relevant, not yet calculated
Processing of sold products
Not relevant, explanation provided
Not applicable to AT&T – we do not sell products that are processed by other companies.
Use of sold products
Relevant, not yet calculated
End of life treatment of sold products
Relevant, not yet calculated
Downstream leased assets
Relevant, calculated
2,939,785
The average estimated electricity usage per set-top box (STB) was multiplied by the number of STBs in circulation in 2016. Based on this kWh value, the eGRID 2014 emission factors (by state) were applied to calculate the estimated greenhouse gas emissions total for downstream leased assets.
100.00%
Franchises
Not relevant, explanation provided
Not applicable to AT&T – we don’t franchise.

Sources of Scope 3
emissions
Evaluation status
metric tonnes CO2e
Emissions calculation methodology
Percentage of
emissions calculated using data obtained
from suppliers or value chain
partners
Explanation
Investments
Not relevant, explanation provided
Not applicable to AT&T –we are not a financial institution
Other (upstream)
Other (downstream)
CC14.2
Please indicate the verification/assurance status that applies to your reported Scope 3 emissions
Third party verification or assurance process in place
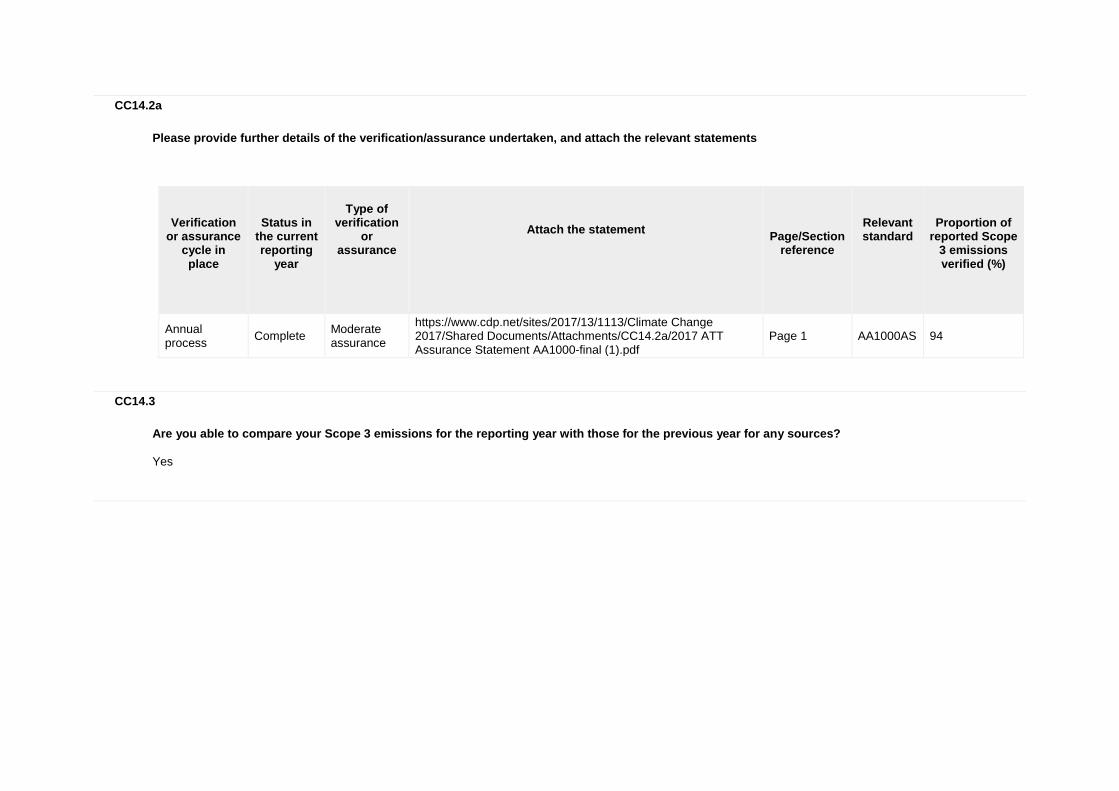
CC14.2a
Please provide further details of the verification/assurance undertaken, and attach the relevant statements
Verification
or assurance cycle in place
Status in
the current reporting
year
Type of
verification or
assurance
Attach the statement
Page/Section
reference
Relevant standard
Proportion of
reported Scope 3 emissions verified (%)
Annual process
Complete Moderate assurance
https://www.cdp.net/sites/2017/13/1113/Climate Change 2017/Shared Documents/Attachments/CC14.2a/2017 ATT Assurance Statement AA1000-final (1).pdf
Page 1 AA1000AS 94
CC14.3
Are you able to compare your Scope 3 emissions for the reporting year with those for the previous year for any sources?
Yes
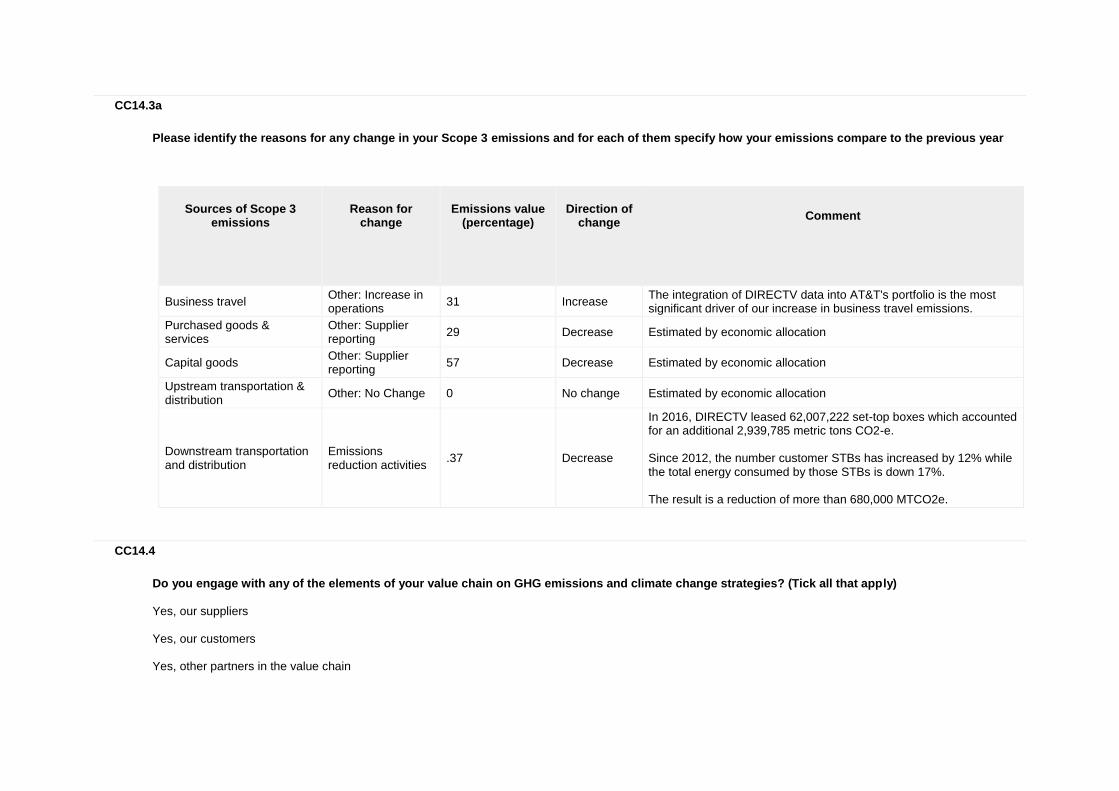
CC14.3a
Please identify the reasons for any change in your Scope 3 emissions and for each of them specify how your emissions compare to the previous year
Sources of Scope 3
emissions
Reason for
change
Emissions value
(percentage)
Direction of
change
Comment
Business travel Other: Increase in operations
31 Increase The integration of DIRECTV data into AT&T's portfolio is the most significant driver of our increase in business travel emissions.
Purchased goods & services
Other: Supplier reporting
29 Decrease Estimated by economic allocation
Capital goods Other: Supplier reporting
57 Decrease Estimated by economic allocation
Upstream transportation & distribution
Other: No Change 0 No change Estimated by economic allocation
Downstream transportation and distribution
Emissions reduction activities
.37 Decrease
In 2016, DIRECTV leased 62,007,222 set-top boxes which accounted for an additional 2,939,785 metric tons CO2-e. Since 2012, the number customer STBs has increased by 12% while the total energy consumed by those STBs is down 17%. The result is a reduction of more than 680,000 MTCO2e.
CC14.4
Do you engage with any of the elements of your value chain on GHG emissions and climate change strategies? (Tick all that apply)
Yes, our suppliers Yes, our customers Yes, other partners in the value chain

CC14.4a
Please give details of methods of engagement, your strategy for prioritizing engagements and measures of success
Supply Chain Methods of Engagement: The sustainability scorecard is based on key data from the annual supplier surveys that have been conducted since 2009. The assessment and scorecard represent about 80% of annual spend, and cover about 500 suppliers. AT&T engages suppliers on sustainability at multiple levels, including: • Officers: We introduced officer-level supplier sustainability scorecards in 2014 that elevate visibility and motivate suppliers to improve sustainability performance. Scores of 80 or higher are considered good. • Global Supply Chain: Our team of professional sourcing managers also engages suppliers directly to improve their sustainability performance. Our sourcing managers receive annual sustainability training. • Business Units: Our business units (including real estate, fleet operations, technology operations and labs) engage our suppliers on a daily basis. Through these engagements, we encourage our suppliers to provide increasingly efficient and sustainable services and products. Through use of the annual assessments, scorecards and our direct engagement with suppliers, our suppliers continue to improve and in many cases excel in their performance. In 2016, the average sustainability score for suppliers increased to 80.3, exceeding our “80 by 2017” goal. We incorporate results into the overall quality scorecards used in performance reviews with strategic suppliers. Sustainability is part of strategic supplier assessments alongside other governance metrics including quality, financial viability, supplier diversity and business continuity. AT&T continues to proactively work with our suppliers to advance sustainable business practices throughout our supply chain. An important part of this effort is our work with our top suppliers on tracking and setting goals for their greenhouse gas emissions. AT&T, working with CDP’s Supply Chain program, annually reaches out to about 500 of its suppliers to report on greenhouse gas emissions. Using industry-accepted methods, we gather and analyze data on these suppliers’ emissions, reduction goals and progress. As a result, in 2016 we were able to report our third annual estimate of our supplier emissions in our greenhouse gas emissions reporting. We incorporate results into the overall quality scorecards used in performance reviews with strategic suppliers. Sustainability is part of strategic supplier assessments alongside other governance metrics including quality, financial viability, supplier diversity, and business continuity. Strategy for prioritizing: Our method of prioritizing engagement is as follows: Our annual assessment represents about 80 percent of annual spend, which covers up to about 500 of our suppliers.
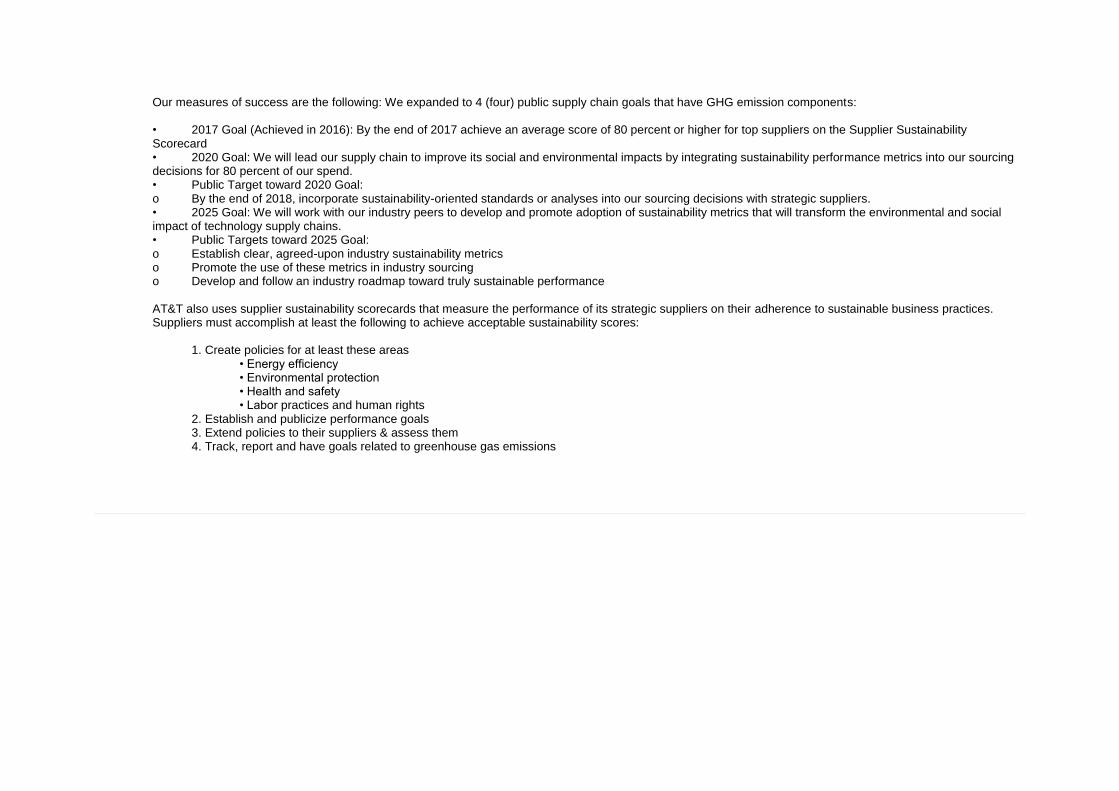
Our measures of success are the following: We expanded to 4 (four) public supply chain goals that have GHG emission components: • 2017 Goal (Achieved in 2016): By the end of 2017 achieve an average score of 80 percent or higher for top suppliers on the Supplier Sustainability Scorecard • 2020 Goal: We will lead our supply chain to improve its social and environmental impacts by integrating sustainability performance metrics into our sourcing decisions for 80 percent of our spend. • Public Target toward 2020 Goal: o By the end of 2018, incorporate sustainability-oriented standards or analyses into our sourcing decisions with strategic suppliers. • 2025 Goal: We will work with our industry peers to develop and promote adoption of sustainability metrics that will transform the environmental and social impact of technology supply chains. • Public Targets toward 2025 Goal: o Establish clear, agreed-upon industry sustainability metrics o Promote the use of these metrics in industry sourcing o Develop and follow an industry roadmap toward truly sustainable performance AT&T also uses supplier sustainability scorecards that measure the performance of its strategic suppliers on their adherence to sustainable business practices. Suppliers must accomplish at least the following to achieve acceptable sustainability scores: 1. Create policies for at least these areas • Energy efficiency • Environmental protection • Health and safety • Labor practices and human rights 2. Establish and publicize performance goals 3. Extend policies to their suppliers & assess them 4. Track, report and have goals related to greenhouse gas emissions

CC14.4b
To give a sense of scale of this engagement, please give the number of suppliers with whom you are engaging and the proportion of your total spend that they represent
Type of
engagement
Number of suppliers
% of total spend (direct and indirect)
Impact of engagement
Active engagement
500 80%
The AT&T annual CDP Supply Chain questionnaire is sent to about 500 suppliers representing about 80% of spend. Of these in 2016, 201 suppliers provided useful 2015 emissions information.
CC14.4c
Please explain why you do not engage with any elements of your value chain on GHG emissions and climate change strategies, and any plans you have to develop an engagement strategy in the future
Further Information
Module: Sign Off
Page: CC15. Sign Off
CC15.1
Please provide the following information for the person that has signed off (approved) your CDP climate change response
Name
Job title
Corresponding job category
Charles Herget AVP Sustainability Integration Business unit manager
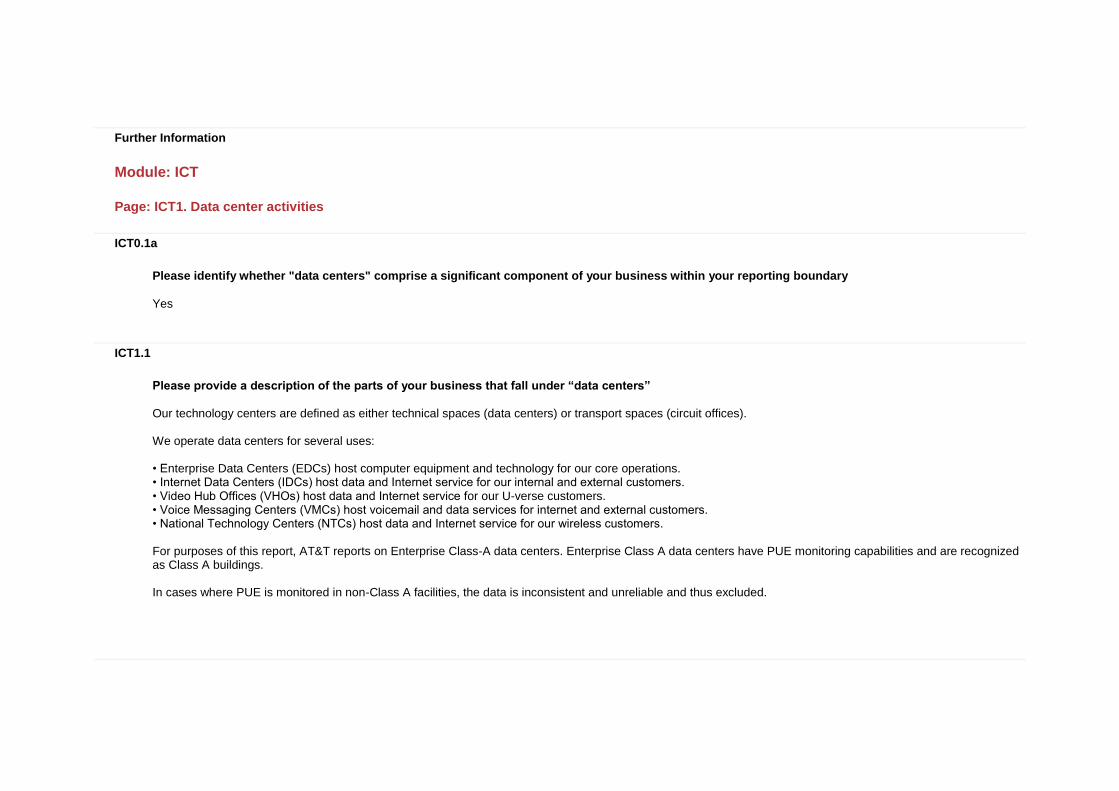
Further Information
Module: ICT
Page: ICT1. Data center activities
ICT0.1a
Please identify whether "data centers" comprise a significant component of your business within your reporting boundary
Yes
ICT1.1
Please provide a description of the parts of your business that fall under “data centers”
Our technology centers are defined as either technical spaces (data centers) or transport spaces (circuit offices). We operate data centers for several uses: • Enterprise Data Centers (EDCs) host computer equipment and technology for our core operations. • Internet Data Centers (IDCs) host data and Internet service for our internal and external customers. • Video Hub Offices (VHOs) host data and Internet service for our U-verse customers. • Voice Messaging Centers (VMCs) host voicemail and data services for internet and external customers. • National Technology Centers (NTCs) host data and Internet service for our wireless customers. For purposes of this report, AT&T reports on Enterprise Class-A data centers. Enterprise Class A data centers have PUE monitoring capabilities and are recognized as Class A buildings. In cases where PUE is monitored in non-Class A facilities, the data is inconsistent and unreliable and thus excluded.

ICT1.2
Please provide your absolute Scope 1 and 2 emissions and electricity consumption for the data centers component of your business
Business activity
Scope 1 emissions (metric tonnes CO2e)
Scope 2 emissions (metric tonnes CO2e)
Annual electricity consumption (MWh)
Electricity data collection method
Comment
Data centers 18,582 700,431 1,318,300 Meter or submeter reading
ICT1.3
What percentage of your ICT population sits in data centers where Power Usage Effectiveness (PUE) is measured on a regular basis?
Percentage
Comment
100% Specific to EDC Class-A data centers
ICT1.4
Please provide a Power Usage Effectiveness (PUE) value for your data center(s). You can provide this information as (a) an average, (b) a range or (c) by individual data center - please tick the data you wish to provide (tick all that apply)
Average

ICT1.4a
Please provide your average PUE across your data centers
Number of data
centers
Average PUE
% change from previous
year
Direction of change
Comment
17 1.633 .00 Decrease
Refers to Class A data centers only: The average PUE is affected by outlying centers where we have building load but low IT load, due to recent builds or continued service migration. As these newer and more efficient centers begin to fill up with additional customers through migration or acquisition, the PUE will continue to decrease and our average PUE will be a truer reflection of our Datacenter efficiency. These EDC Class-A PUE values also represent our average over all of 2016 and are not a snapshot within the reporting year.
ICT1.4b
Please provide the range of PUE values across your data centers
Number of data centers
PUE Minimum Value
% change of PUE Minimum Value from
previous year
PUE Maximum Value
% change of PUE Maximum Value from
previous year
Direction of change
Comment
ICT1.4c
Please provide your PUE values of all your data centers
Data center reference
PUE value
% change from previous year
Direction of change
Comment

ICT1.5
Please provide details of how you have calculated your PUE value
Other: PUE is calculated through facility power divided by IT equipment power and includes minor adjustments for excessive administrative space co-located with our centers, not required to run the facilities. This information is available for ad hoc reporting as necessary.
ICT1.6
Do you use any alternative intensity metrics to assess the energy or emissions performance of your data center(s)?
Yes
ICT1.6a
Please provide details on the alternative intensity metrics you use to assess the energy or the emissions performance of your data center(s)
DCIE; average 61.65%. This is calculated by IT load / buildings load x 100
ICT1.7
Please identify the measures you are planning or have undertaken in the reporting year to increase the energy efficiency of your data center(s)
Status in reporting
year
Energy efficiency measure
Comment
Implemented Server Virtualization
Transition from legacy computing models to server virtualization is at the core of our business model. We are conducting controlled business case studies on the architecture and deployment of a sustainable computing platform which uses a standardized virtualization practice to reduce emissions and cost.
Implemented Server Consolidation
Our 2016 TechOps Server and Asset decommissioning program powered down an estimated 5,000 servers/frames and brought the business over $3.19 million in energy savings. These and similar programs are designed to consolidate servers, decommission legacy and aging devices, and reduce our power usage across the Datacenter portfolio.

Status in reporting
year
Energy efficiency measure
Comment
From an IDC Decommission perspective, we powered down approximately 2,500 assets, which includes Servers, Storage and Network equipment, in the Internet Data Centers (30 locations, domestic and MoW). Power savings came to over $1.3 million in 2016. The IDCs house the infrastructure and internal/external customer equipment for hosting and colocation services.
Implemented Server Consolidation
The introduction of containerized computing platforms, high density computing solutions, and smarter IT practices has dramatically increased our server utilization while decreasing the number of servers needed to provide our internal and external customers the applications and services that they require. We are continuing with planning activities to expand our high-density computing platforms to other facilities in an effort to reduce energy consumption and improve efficiency throughout the coming years.
Implemented Other
Other - DC Consolidation; During 2016, we consolidated and closed 13 DCs in an effort to reduce our portfolio of aging centers and equipment and thus, reduce our environmental impact. These services were consolidated in more efficient centers where we can reduce costs and improve our IT efficiency.
Planned Other An additional 6 DC locations were identified for 2017 consolidation and closure. This program ensures that we continually develop and adapt our energy usage policies and continue to progress alongside ever-evolving industry best-practices.
Implemented Cooling Efficiencies
During the implementation phase of our newest DC, we elected to proceed with a Chilled Water loop system, which reduces energy consumption and environmental impact. This decision is a direct representation of our commitment to continually adjust our best practices to further reduce energy consumption across the business.
Implemented Cooling Efficiencies
Increased technical space ambient temperatures to offset emissions and decrease costs to operate centers within our portfolio.
Implemented Power Management Efficiencies
Power management solutions are installed in all Data Center facilities within AT&T. We continue to research, and plan to implement, more effective solutions as our portfolio continues to grow through acquisition and green build projects. This active monitoring allows us to determine hot and cold spots within the centers and to adjust ambient temperature and rack/device configuration as necessary. Overall energy consumption has decreased 2mw per year over the last 3 years.
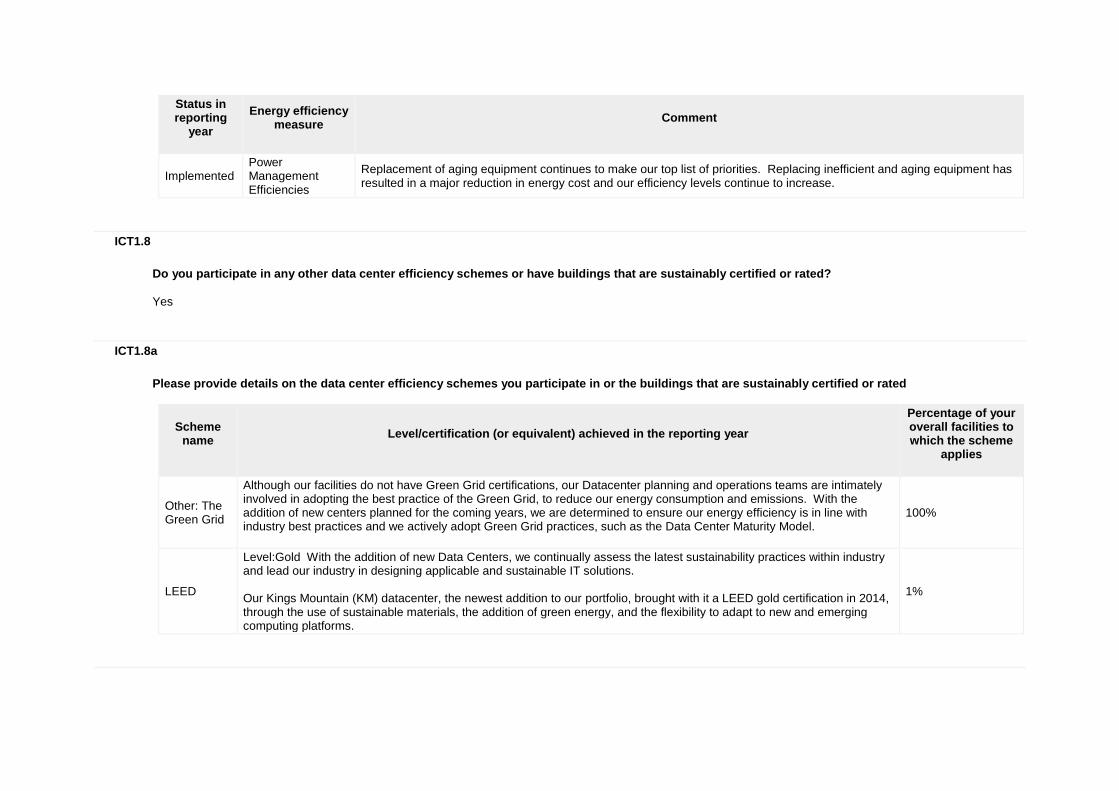
Status in reporting
year
Energy efficiency measure
Comment
Implemented Power Management Efficiencies
Replacement of aging equipment continues to make our top list of priorities. Replacing inefficient and aging equipment has resulted in a major reduction in energy cost and our efficiency levels continue to increase.
ICT1.8
Do you participate in any other data center efficiency schemes or have buildings that are sustainably certified or rated?
Yes
ICT1.8a
Please provide details on the data center efficiency schemes you participate in or the buildings that are sustainably certified or rated
Scheme name
Level/certification (or equivalent) achieved in the reporting year
Percentage of your overall facilities to which the scheme
applies
Other: The Green Grid
Although our facilities do not have Green Grid certifications, our Datacenter planning and operations teams are intimately involved in adopting the best practice of the Green Grid, to reduce our energy consumption and emissions. With the addition of new centers planned for the coming years, we are determined to ensure our energy efficiency is in line with industry best practices and we actively adopt Green Grid practices, such as the Data Center Maturity Model.
100%
LEED
Level:Gold With the addition of new Data Centers, we continually assess the latest sustainability practices within industry and lead our industry in designing applicable and sustainable IT solutions. Our Kings Mountain (KM) datacenter, the newest addition to our portfolio, brought with it a LEED gold certification in 2014, through the use of sustainable materials, the addition of green energy, and the flexibility to adapt to new and emerging computing platforms.
1%
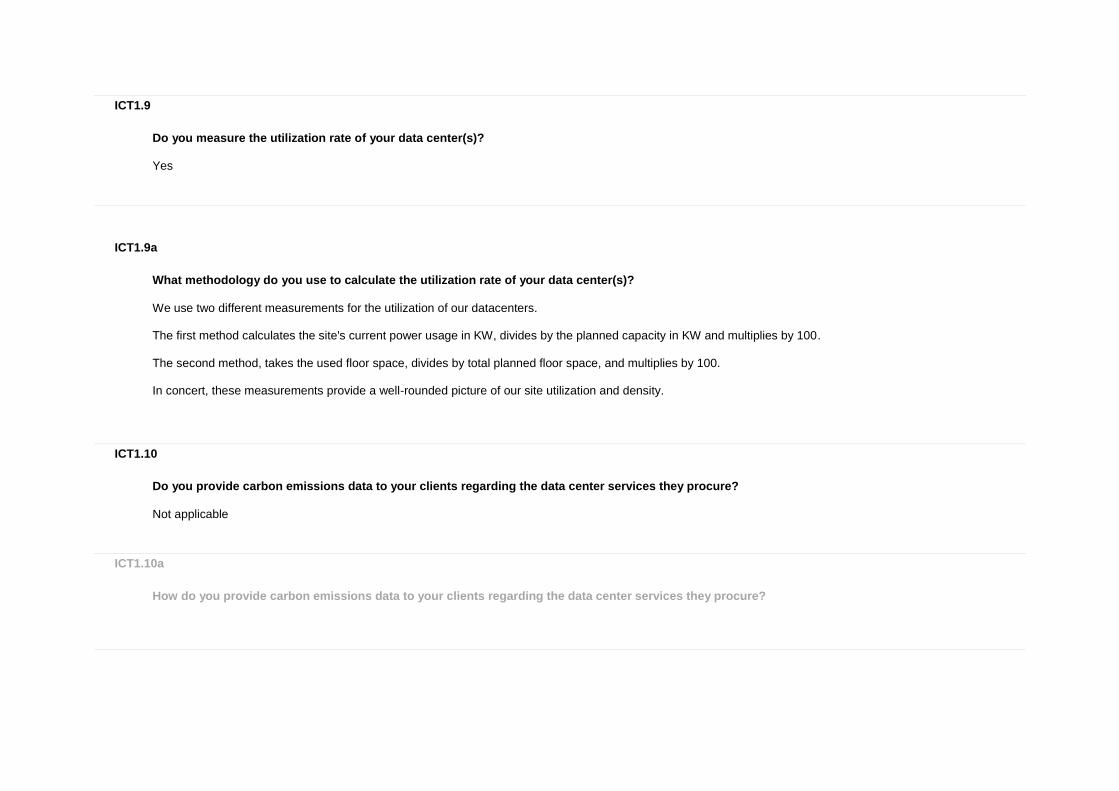
ICT1.9
Do you measure the utilization rate of your data center(s)?
Yes
ICT1.9a
What methodology do you use to calculate the utilization rate of your data center(s)?
We use two different measurements for the utilization of our datacenters. The first method calculates the site's current power usage in KW, divides by the planned capacity in KW and multiplies by 100. The second method, takes the used floor space, divides by total planned floor space, and multiplies by 100. In concert, these measurements provide a well-rounded picture of our site utilization and density.
ICT1.10
Do you provide carbon emissions data to your clients regarding the data center services they procure?
Not applicable
ICT1.10a
How do you provide carbon emissions data to your clients regarding the data center services they procure?

ICT1.11
Please describe any efforts you have made to incorporate renewable energy into the electricity supply to your data center(s) or to re-use waste heat
By the end of 2016, our alternative energy portfolio directly supporting data center operations included 2.1 MW of solar and 8.7 MW of onsite fuel cell power from Bloom Energy servers. In 2016, we continued to build out our alternative energy capacity, working with Bloom Energy Corporation to install Bloom Energy Servers at 21 installations. Four of these directly support data center operations in California. The fuel cell technology is nearly carbon neutral as compared to conventional grid power sources. Fuel cells virtually eliminate SOx, NOx (sulfur oxides and nitrogen oxides) and other harmful smog-forming particulate emissions, while helping AT&T to hedge against conventional power rate uncertainty.
Further Information
Page: ICT2. Provision of network/connectivity services
ICT0.1b
Please identify whether "provision of network/connectivity services" comprises a significant component of your business within your reporting boundary
Yes
ICT2.1
Please provide a description of the parts of your business that fall under "provision of network/connectivity services"
We include all Central Offices, remote network equipment such as Controlled Environment Vaults and Huts and wireless towers in our “provision of network/connectivity services” measurement.

ICT2.2
Please provide your absolute Scope 1 and 2 emissions and electricity consumption for the provision of network/connectivity services component of your business
Business activity
Scope 1 emissions (metric tonnes CO2e)
Scope 2 emissions (metric tonnes CO2e)
Annual electricity consumption (MWh)
Electricity data collection method
Comment
Provision of network/connectivity services
90,921 6,038,441 11,798,555 Meter or submeter reading
ICT2.3
Please describe your gross combined Scope 1 and 2 emissions or electricity use for the provision of network/connectivity services component of your business as an intensity metric
Intensity figure
Metric numerator
Metric denominator
% change from
previous year
Direction of change from
previous year
Reason for change
Comment
55.16 metric tonnes CO2e
Other: Petabyte of network traffic
9.5 Decrease
In addition to changes in calculation methodology from previous years, network traffic across AT&T’s data networks has experienced an increased 8% from 2015 to 2016, while the emissions for this portion of the portfolio has decreased by 2%. These year over year changes are reflective of business acquisitions and expanded operations.

ICT2.4
Please explain how you calculated the intensity figures given in response to Question ICT2.3
In 2016, AT&T's Scope 1+2 increased (+2.4%) due, in part, to integration of activity data from DIRECTV operations throughout the US, Mexico and Latin America. Our network traffic (petabyte) output saw an increase of approximately 8.4% compared to our restated 2015 traffic value*. Therefore, our year over year change for Scope 1+2 emissions per petabyte decreased 5.5%. * AT&T is restating its 2014 and 2015 data traffic volume (Petabytes of data traffic carried over AT&T's network) as a result of accuracy improvements made in capturing and estimating volume from one of its largest traffic sources. The method was used to backcast data traffic volume to the beginning of 2014, and is regarded as a vastly more accurate representation of traffic volume than was previously available.
ICT2.5
Do you provide carbon emissions data to your clients regarding the network/connectivity services they procure?
No
ICT2.5a
How do you provide carbon emissions data to your clients regarding the network/connectivity services they procure?

Further Information
Page: ICT3. Manufacture or assembly of hardware/components
ICT0.1c
Please identify whether "manufacture or assembly of hardware/components" comprises a significant part of your business within your reporting boundary
No
ICT3.1
Please provide a description of the parts of your business that fall under "manufacture or assembly of hardware/components"
ICT3.2
Please provide your absolute Scope 1 and 2 emissions and electricity consumption for the manufacture or assembly of hardware/components part of your business
Business activity
Scope 1 emissions (metric tonnes CO2e)
Scope 2 emissions (metric tonnes CO2e)
Annual electricity consumption (MWh)
Electricity data collection method
Comment
ICT3.3
Please identify the percentage of your products meeting recognized energy efficiency standards/specifications by sales weighted volume (full product range)

Product type
Standard (sleep mode)
Percentage of products meeting the
standard by sales volume (sleep mode)
Standard (standby mode)
Percentage of products meeting the
standard by sales volume (standby
mode)
Standard (in use mode)
Percentage of products meeting the
standard by sales volume (in use mode)
Comment
ICT3.4
Of the new products released in the reporting year, please identify the percentage (as a percentage of all new products in that product type category) that meet recognized energy efficiency standards/specifications
Product type
Standard (sleep mode)
Percentage of new products meeting
the standard (sleep mode)
Standard (standby mode)
Percentage of new products meeting
the standard (standby mode)
Standard (in use mode)
Percentage of new products meeting
the standard (in use mode)
Comment
ICT3.5
Please describe the efforts your organization has made to improve the energy efficiency of your products
ICT3.6
Please describe the GHG emissions abatement measures you have employed specifically in your ICT manufacturing operations
ICT3.7
Do you provide carbon emissions data to your clients regarding the hardware/component products they procure?

ICT3.7a
How do you provide carbon emissions data to your clients regarding the hardware/component products they procure?
Further Information
Page: ICT4. Manufacture of software
ICT0.1d
Please identify whether "manufacture of software" comprises a significant component of your business within your reporting boundary
No
ICT4.1
Please provide a description of the parts of your business that fall under "manufacture of software"
ICT4.2
Please provide your absolute Scope 1 and 2 emissions and electricity consumption for the software manufacture component of your business
Business activity
Scope 1 emissions (metric tonnes CO2e)
Scope 2 emissions (metric tonnes CO2e)
Annual electricity consumption (MWh)
Electricity data collection method
Comment
ICT4.3
Please describe your gross combined Scope 1 and 2 emissions for the software manufacture component of your business in metric tonnes CO2e per unit of production
Intensity figure
Metric numerator
Metric denominator
% change from previous year
Direction of change from previous year
Reason for change
Comment
ICT4.4
What percentage of your software sales (by volume) is in an electronic format?
ICT4.5
Do you provide carbon emissions data to your clients regarding the software products they procure?
ICT4.5a
How do you provide carbon emissions data to your clients regarding the software products they procure?
Further Information
Page: ICT5. Business services (office based activities)
ICT0.1e
Please identify whether "business services (office based activities)" comprise a significant component of your business within your reporting boundary
Yes
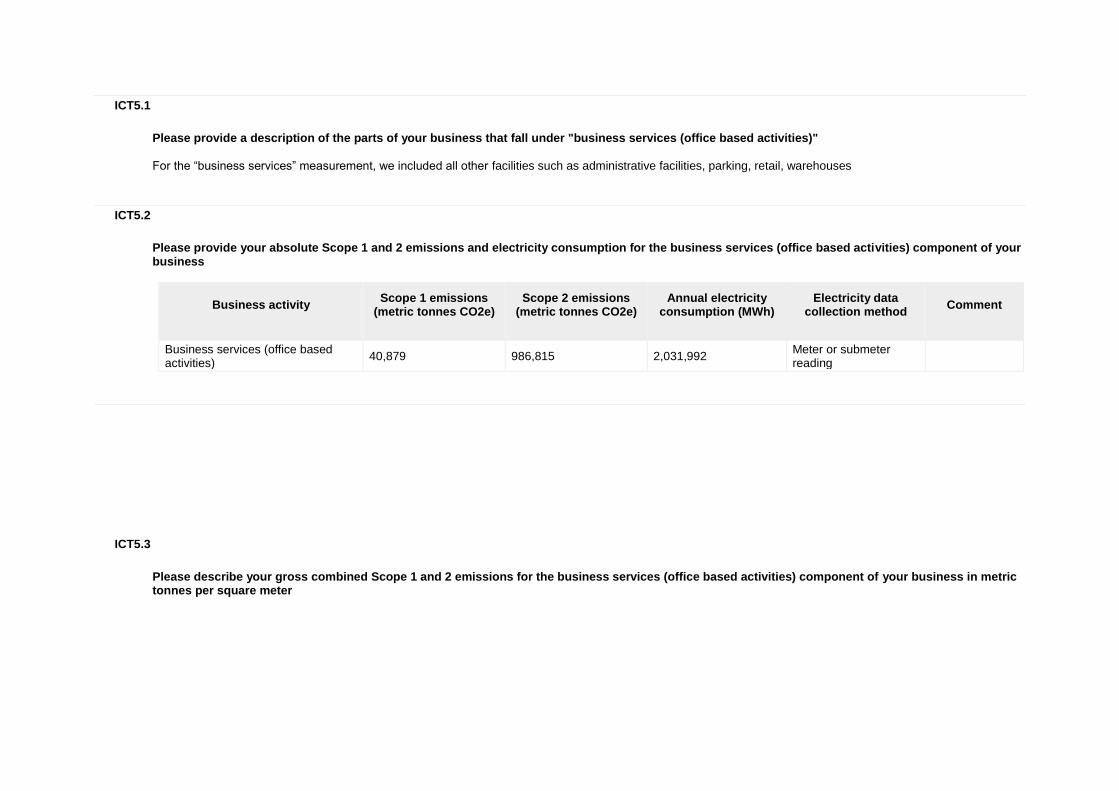
ICT5.1
Please provide a description of the parts of your business that fall under "business services (office based activities)"
For the “business services” measurement, we included all other facilities such as administrative facilities, parking, retail, warehouses
ICT5.2
Please provide your absolute Scope 1 and 2 emissions and electricity consumption for the business services (office based activities) component of your business
Business activity
Scope 1 emissions (metric tonnes CO2e)
Scope 2 emissions (metric tonnes CO2e)
Annual electricity consumption (MWh)
Electricity data collection method
Comment
Business services (office based activities)
40,879 986,815 2,031,992 Meter or submeter reading
ICT5.3
Please describe your gross combined Scope 1 and 2 emissions for the business services (office based activities) component of your business in metric tonnes per square meter
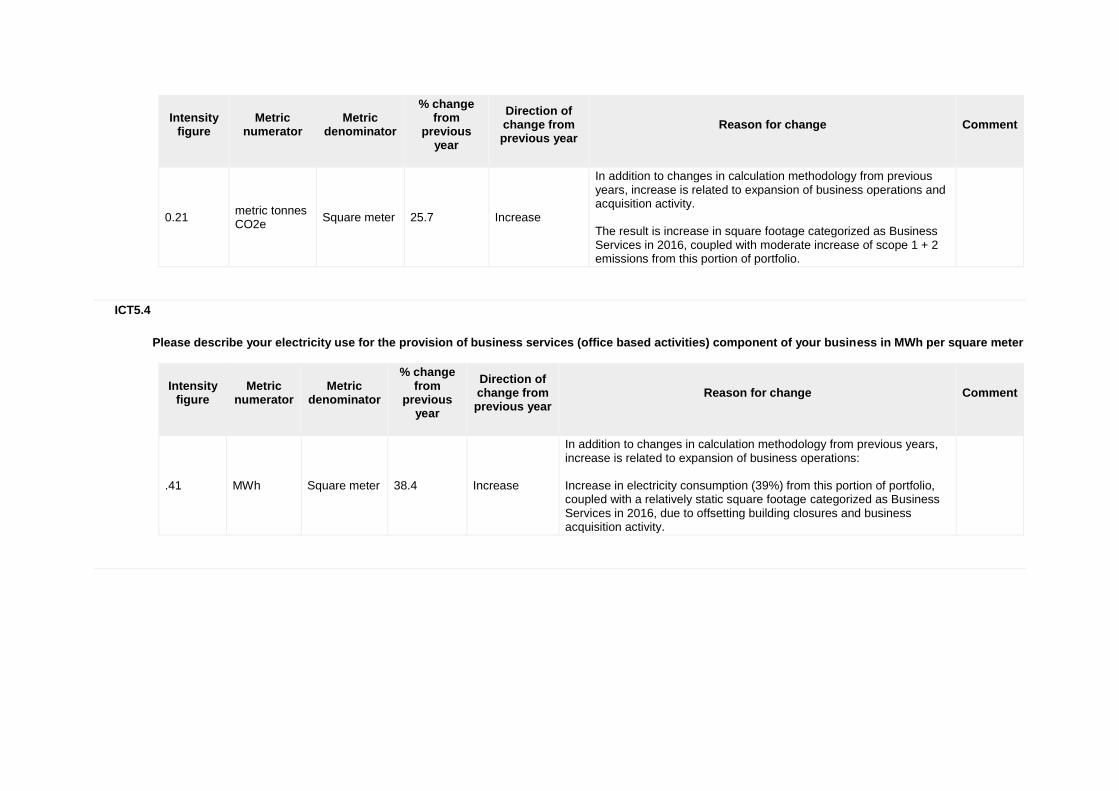
Intensity figure
Metric numerator
Metric denominator
% change from
previous year
Direction of change from previous year
Reason for change
Comment
0.21 metric tonnes CO2e
Square meter 25.7 Increase
In addition to changes in calculation methodology from previous years, increase is related to expansion of business operations and acquisition activity. The result is increase in square footage categorized as Business Services in 2016, coupled with moderate increase of scope 1 + 2 emissions from this portion of portfolio.
ICT5.4
Please describe your electricity use for the provision of business services (office based activities) component of your business in MWh per square meter
Intensity figure
Metric numerator
Metric denominator
% change from
previous year
Direction of change from previous year
Reason for change
Comment
.41 MWh Square meter 38.4 Increase
In addition to changes in calculation methodology from previous years, increase is related to expansion of business operations: Increase in electricity consumption (39%) from this portion of portfolio, coupled with a relatively static square footage categorized as Business Services in 2016, due to offsetting building closures and business acquisition activity.

Further Information
Page: ICT6. Other activities
ICT0.1f
Please identify whether "other activities" comprise a significant component of your business within your reporting boundary
Yes
ICT6.1
Please provide a description of the parts of your business that fall under "other"
ICT6.2
Please provide your absolute Scope 1 and 2 emissions and electricity consumption for the identified other activity component of your business
Activity
Scope 1 emissions (metric tonnes CO2e)
Scope 2 emissions (metric tonnes CO2e)
Annual electricity consumption (MWh)
Electricity data collection method
Comment
ICT6.3
Please describe your gross combined Scope 1 and 2 emissions for your defined additional activity using an appropriate activity based intensity metric
Activity
Intensity figure
Metric numerator
Metric denominator
% change from
previous year
Direction of change from previous year
Reason for change
Comment
metric tonnes CO2e

ICT6.4
If appropriate, please describe your electricity use for your defined additional activity using an appropriate activity based intensity metric
Activity
Intensity figure
Metric numerator
Metric denominator
% change from
previous year
Direction of change from previous year
Reason for change
Comment
MWh
A