Embed Size (px)
Citation preview

The KING’S Medium Term Plan – Mathematics
Year 10 senior programme – Learning cycle three
Module Developing Number
Overarching
Subject
Challenging
question
‘How can we analyse information that we have in the real world?’
Lines of
Enquiry
Week 1: Do graphs truly represent real life?
Week 2: Why is there a cycle we must follow when investigating a hypothesis?
Week 3: Why are certain graphs more suitable for continuous data?
Week 4: Is the use of averages enough to analyse and compare data?
Week 5: How can past/historical data impact on chance?
Week 6-7: Revision then assessment followed by gap teaching – from assessment analysis.
Progress
Objectives
By the end of LC3 in Mathematics SWBAT achieve these AQA objectives: Graphs development (AQA objectives G11, A9, A10, A14 and R14) Week 1 (total 4 lessons)
In this number unit pupils will master the following;
Plot and interpret graphs (including reciprocal graphs) and graphs of non-standard functions in real contexts, to find
approximate solutions to problems such as simple kinematic problems involving distance, speed and acceleration
Interpret the gradient of a straight-line graph as a rate of change
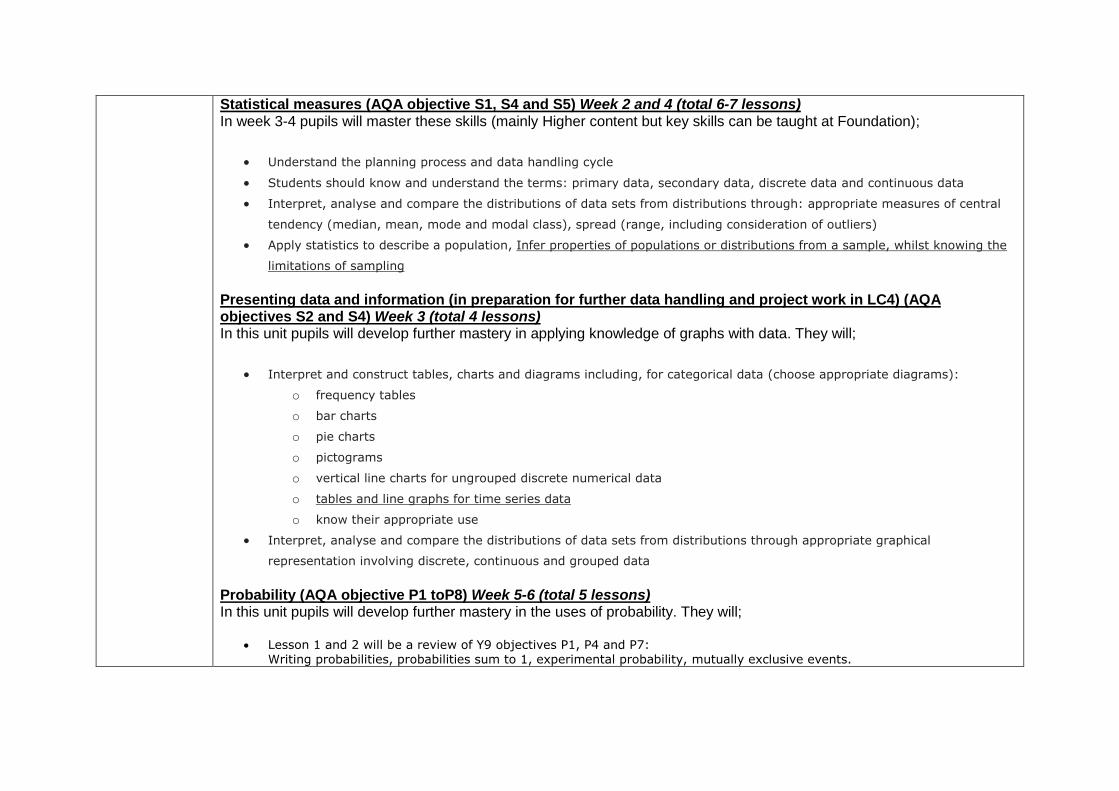
Statistical measures (AQA objective S1, S4 and S5) Week 2 and 4 (total 6-7 lessons) In week 3-4 pupils will master these skills (mainly Higher content but key skills can be taught at Foundation);
Understand the planning process and data handling cycle
Students should know and understand the terms: primary data, secondary data, discrete data and continuous data
Interpret, analyse and compare the distributions of data sets from distributions through: appropriate measures of central
tendency (median, mean, mode and modal class), spread (range, including consideration of outliers)
Apply statistics to describe a population, Infer properties of populations or distributions from a sample, whilst knowing the
limitations of sampling
Presenting data and information (in preparation for further data handling and project work in LC4) (AQA objectives S2 and S4) Week 3 (total 4 lessons) In this unit pupils will develop further mastery in applying knowledge of graphs with data. They will;
Interpret and construct tables, charts and diagrams including, for categorical data (choose appropriate diagrams):
o frequency tables
o bar charts
o pie charts
o pictograms
o vertical line charts for ungrouped discrete numerical data
o tables and line graphs for time series data
o know their appropriate use
Interpret, analyse and compare the distributions of data sets from distributions through appropriate graphical
representation involving discrete, continuous and grouped data
Probability (AQA objective P1 toP8) Week 5-6 (total 5 lessons) In this unit pupils will develop further mastery in the uses of probability. They will;
Lesson 1 and 2 will be a review of Y9 objectives P1, P4 and P7: Writing probabilities, probabilities sum to 1, experimental probability, mutually exclusive events.
Apply ideas of randomness, fairness and equally likely events to calculate expected outcomes or multiple future experiments
Relate relative expected frequencies to theoretical probability, using appropriate language and the 0 – 1 probability scale
Understand that empirical unbiased samples tend towards theoretical probability distributions with increasing sample size Enumerate sets and combinations of sets systematically using tables, grids, Venn diagrams and tree diagrams Calculate the probability of independent and dependent combined events, including using tree diagrams and other
representations, and know the underlying assumptions (know when to add and when to multiply two or more probabilities)
NOTE: In week 3 there will be a mid LC assessment to check current progress.
Assessment at the end of week 6 will be against the above AQA objectives following on from 2 lessons of REACH
and revision. Gap teaching from analysis of assessments will take place in week 7.
IMPORTANT INFORMATION AND WEEKLY NEEDS
Personalised
Learning and
Reach work
and Mastery
The AQA objectives above cover a wide range of mathematical skills and applications at varying levels of difficulty. Each practitioner has access to sets of exam based questions and activities that are aimed at these different levels of application and will ensure that all pupils are provided with work that will both challenge and support them at their targeted Grade Point as well as pushing them towards the next. All pupils will meet the progress objectives outlined above at a pace that suits them and will be delivered in a way that is personalised to how they learn. The use of iPads will be planned for carefully so that they can maximise learning.
Maths in real
life
Each week, there will be discussion and slides planned in so that pupils can value the relevance of what they are learning, which areas of life or careers that skill may be useful to and lessons will, as much as possible, contain resources where maths has to be applied to real world problems in order to find solutions. In this LC pupils will plot graphs for real life events such as distance and time in a journey, flow of running water, temperature over time etc. This will be followed by a data collection project/module where pupils create a hypothesis, collect data and analyse the findings. Probability in week 5 will be revision of key concepts as well as development of new real life probability applications and new skills at higher levels.
Planning for
Feedback
Pupils will receive written feedback each week in the form of teacher marking, peer/self-assessment and small quizzes to check key knowledge. Mark schemes will be provided where appropriate for pupil self-assessment and development. REACH lessons each week will allow time for acting on feedback and making improvements to their work in order to develop further and fill in GAPs.

REACH and
Support
Each week there will opportunities for support with in class intervention, group intervention and after school catch-up.
MEDIUM TERM PLAN
Week 1
4 hours plus 1
hour of
homework
each week
Additional
intervention
and reach is
provided
during
lessons and
where
possible
outside of
lessons within
morning
ASPIRE
sessions or
after school.
Line of Enquiry: Shared at the start of each week and reflected upon at the end. Here is how each week is broken down;
Hypotheses for the week’s lessons; These will act as the title for the lessons, in which the work done will be reflected upon to either prove or disprove each hypothesis. It may be that 1 hypothesis can last more than 1 lesson yet others are achieved quickly. This depends upon how far the pupils move on from the knowledge section and get through the different success criteria within the main body of the lesson. All hypotheses should be answered to some degree over the course of the week.
Learning Intentions: These are the key objectives laid out by the exam board (as seen above).
Weekly success criteria for completion across 4 lessons (or across 3 for weeks with REACH lessons or
tests);
This is where after teaching the knowledge necessary the pupils will work at their grade point on exam questions in order to achieve the learning intention. Line of Enquiry: Do graphs truly represent real life? Hypothesis 1 – Zero gradient means that water is flowing at a constant speed Learning intentions for the week:
Plot and interpret graphs and graphs of non-standard functions in real contexts

Find approximate solutions to problems such as simple kinematic problems involving distance, speed and
acceleration
Knowledge: ALL GP = All pupils need to be taught through work development time the meaning of gradient and what it means to each graph. GP 3 – 4 = Pupils will need to be taught how to interpret real life graphs and describe what is happening. GP 5 = Pupils will need to be taught how to explain with detail the different sections of a journey shown on a graph and how to complete the graph. Success criteria:
GP 3 – 4 = Pupils will be able to take readings of times, distance, depth and other variables from graphs showing real life situations such as a journey, running water, temperature changes and conversion graphs. Match up activities where pupils place the graph with the correct description will support learning. GP 5 = As above plus pupils will be able to calculate speeds of parts of journeys as well as explain in detail what is happening in each section of real life graphs. They will be able to complete the rest of a real life graph given some instructions and details and pupils at GP 6 will be able to draw a real life graph from scratch given a set of detailed situations. Hypothesis 2 – D = S x T is a useful formula when analysing real life graphs Knowledge:
ALL GP = Pupils need to be taught the best ways of plotting a DT graph and how to consider their scales.
GP 3 – 4 = Pupils need to be taught how to calculate the variables of speed, distance and time from the DST triangle. They
will need to be taught how to calculate the speed of a section of a graph.
GP 5 = Pupils need to be taught how to calculate the average speed of a journey to compare them.
GP 6 – 7 = Pupils will need to be taught how to interpret curved sections of DT graphs.
Success criteria:
ALL GP = Pupils should be able to use the gradient of sections of graphs to make comparisons ad predictions. GP 3 – 4 = Pupils will interpret and plot distance time graphs and calculate speeds of independent sections of multiple journeys. They will be able to explain why S = D/T by using an example. GP 5 = As above plus pupils will be able to calculate the average speed of a journey and use distance time graphs to

compare speeds and journeys. GP 6 – 7 = Pupils will be able to calculate acceleration and deceleration from curved distance time graphs. Hypothesis 3 – Real life graphs are made of straight lines This lesson all pupils will investigate real life graphs that are curved and match up and explain the situation. This will
deepen their understanding of what the graphs show and how they work before moving on to functions.
Home learning: Given Tuesday/Wednesday of each week and due in by same day the following week.
For the first home learning tasks, pupils will do work on Mathswatch.
Week 2
4 1hr lessons
plus 1hr
homework
Line of Enquiry: Why is there a cycle we must follow when investigating a hypothesis? Up to 30 minutes of one lesson in the week is to be given time for REACH development. Pupils will use this lesson to engage with and respond to work marked and done the previous week. They will read through teacher comments and respond by following a given set of criteria. This will allow them to make improvements on their work, carry out corrections, seek help and make further progress before moving to the next unit of work. There will not be a full REACH lesson due to the midterm test being completed, but students will be given the opportunity to respond to feedback and make quick improvements. Hypothesis 1 – There are 4 stages to solving a statistical problem Learning intention:
Understand the planning process and data handling cycle
Students should know and understand the terms: primary data, secondary data, discrete data and continuous data
Knowledge:
All GP – All pupils need to recall knowledge of the cycle and the types of data.
Success criteria:
ALL GP = Pupils will be able to write examples and definitions of each type of data including the difference between
qualitative and quantitative data. They should be able to describe the 4 sections of any project (data handling cycle) in
context. Pupils should be able to write a good hypothesis for given situations and break it down into the 4 DH stages.

Hypothesis 2 – A census is better than a sample Learning intention:
Understand the different methods for sampling data; describe the pros and cons of each method and their suitability
to a situation
Knowledge:
ALL GP = Pupils need to be taught the need for a sample when collecting data and a suitable sample size – particularly
how to do a random sample.
GP 6 – 7 = Pupils need the above but need to be taught how to carry out different sampling methods including stratified
samples.
Success criteria:
ALL GP = Pupils should be able to provide pros and cons for their sampling methods and describe them. GP 4 – 5 = Pupils will be able to choose a suitable sample size given certain scenarios. They will be able to take a random sample explaining how they did it. They will be able to recall other sampling methods and provide a brief description. GP 5 pupils will be able to take a systematic sample. GP 6 – 7 = Pupils will be able to carry out a variety of sampling methods and explain their methods fully, including the reasons for their choice and size of sample. They should explain in confidence the advantages and disadvantages of each method. At this GP 7 pupils must be able to calculate a stratified sample. Hypothesis 3 – You only need one hypothesis to solve a problem
Understand the need for a set of sub hypotheses in order to plan a project; write a plan to solve a statistical
problem
Knowledge: ALL GP = This lesson pupils will need to be taught the key parts of a plan. They will be equipped with the skills to write a brief plan given a set of hypotheses (a main hypothesis and 1 or 2 sub hypotheses). Success criteria: (pupils will be given 3 exemplar plans ranging from GP4 to GP 7 as SC)

All pupils will be able to explain why a sub hypothesis is necessary in some cases as well as identify a well written hypothesis using the golden rules. They will use the 4 stages of the data handling cycle to write a plan:
o What data they would collect, how they would sample it, the type of data it is. o Why they need this data, the reasons for the sampling method and sample size. o What they will do with the data – types of graph/chart they can use and why, which averages to calculate and why. o What problems they may foresee and what they will be hoping to find – including any predictions.
This will prepare them for a practice project over the next couple of weeks where pupils will learn about graphs, charts, averages and statistical analysis through a practical application.
Home learning: Given Tuesday of each week and due in by Tuesday the following week.
Pupils will be given GCSE based worksheets based on learning so far.
Week 3
4 1hr lessons
plus 1hr
homework
Line of Enquiry: Why are certain graphs more suitable for continuous data? Hypothesis 1 – Bar charts, pie charts and pictograms are suitable for discrete data Learning intention:
Interpret and construct tables, charts and diagrams including, for categorical discrete data (choose appropriate
diagrams) Knowledge:
ALL GP = Pupils will be taught how to draw accurate graphs and charts for discrete data.
Success criteria:
GP 4 – 5 = Pupils will be able to plot bar charts, pictograms, line graphs and pie charts from table of discrete data. REACH work for GP 5 pupils will be to group discrete and continuous data into tables, then choose the most appropriate graph and explain why this is the better choice. GP 6 = As above plus pupils will be able to plot frequency polygons/diagrams. Hypothesis 2 – Continuous data that is grouped cannot be plotted into a chart

Learning intention:
Interpret and construct tables, charts and diagrams including, for continuous data (choose appropriate
diagrams)
Interpret, analyse and compare the distributions of data sets from distributions through appropriate graphical
representation involving discrete, continuous and grouped data
Knowledge:
ALL GP = Pupils will be taught how to select the correct class intervals when grouping continuous data.
GP 4 – 5 = Pupils need to be taught how a bar chart changes when plotting it for continuous data.
GP 6 – 7 = Pupils will be taught how to plot frequency polygons for continuous data. Pupils will interpret and plot
histograms for continuous data.
Success criteria:
ALL GP = Pupils should be able to put both discrete and continuous data into grouped tables. HGP pupils must use inequality symbols when grouping data. All pupils should be able to interpret and analyse information from a variety of graphs and tables. GP 4 – 5 = Pupils will be able to plot charts from table of continuous data such as time series graphs and bar charts. GP 6 = As above plus pupils will be able to plot frequency polygons/diagrams. Pupils must be able to decide on their own scales for both the x and y axes.
Hypothesis 3 – I can analyse information from cumulative data
(May need 2 lessons so time is given at the start of week 6)
Learning intention:
Plot cumulative frequency diagrams using upper class boundaries; interpret information
Knowledge:
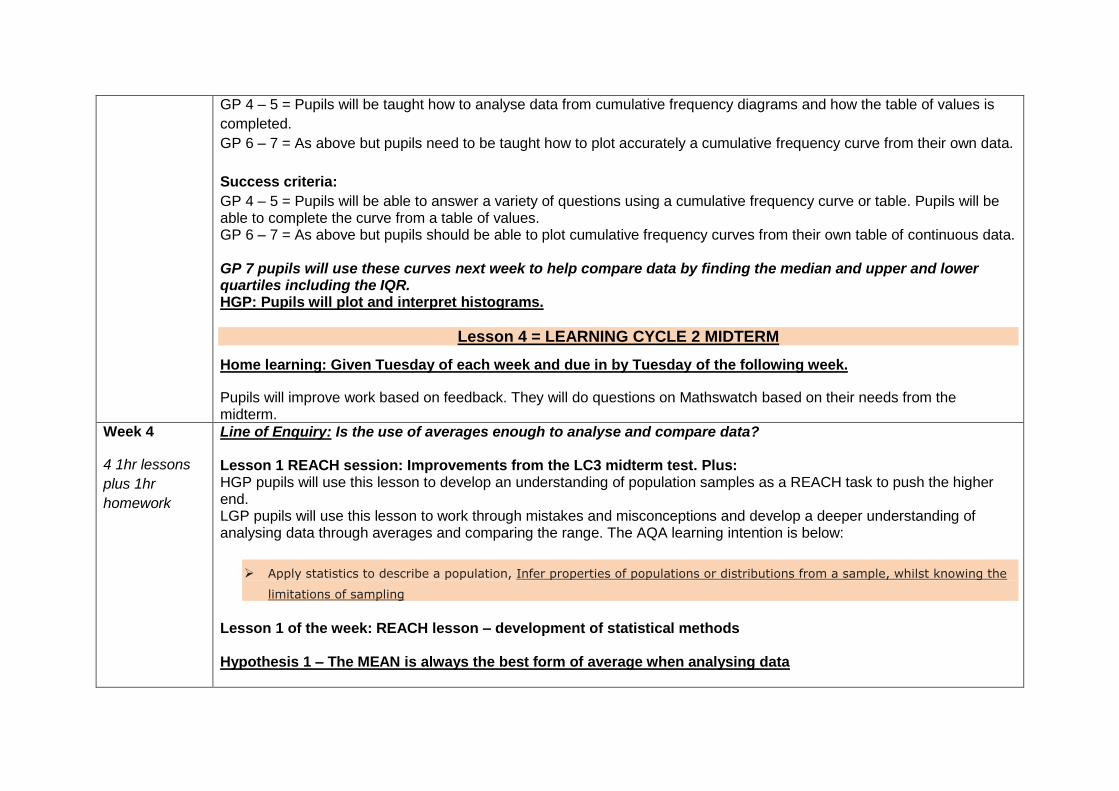
GP 4 – 5 = Pupils will be taught how to analyse data from cumulative frequency diagrams and how the table of values is
completed.
GP 6 – 7 = As above but pupils need to be taught how to plot accurately a cumulative frequency curve from their own data.
Success criteria:
GP 4 – 5 = Pupils will be able to answer a variety of questions using a cumulative frequency curve or table. Pupils will be able to complete the curve from a table of values. GP 6 – 7 = As above but pupils should be able to plot cumulative frequency curves from their own table of continuous data. GP 7 pupils will use these curves next week to help compare data by finding the median and upper and lower quartiles including the IQR. HGP: Pupils will plot and interpret histograms.
Lesson 4 = LEARNING CYCLE 2 MIDTERM
Home learning: Given Tuesday of each week and due in by Tuesday of the following week.
Pupils will improve work based on feedback. They will do questions on Mathswatch based on their needs from the midterm.
Week 4
4 1hr lessons
plus 1hr
homework
Line of Enquiry: Is the use of averages enough to analyse and compare data? Lesson 1 REACH session: Improvements from the LC3 midterm test. Plus: HGP pupils will use this lesson to develop an understanding of population samples as a REACH task to push the higher end. LGP pupils will use this lesson to work through mistakes and misconceptions and develop a deeper understanding of analysing data through averages and comparing the range. The AQA learning intention is below:
Apply statistics to describe a population, Infer properties of populations or distributions from a sample, whilst knowing the
limitations of sampling
Lesson 1 of the week: REACH lesson – development of statistical methods Hypothesis 1 – The MEAN is always the best form of average when analysing data
Learning intention:
Interpret, analyse and compare the distributions of data sets from distributions through: appropriate measures
of central tendency (median, mean, mode and modal class) and spread (range)
Knowledge:
ALL GP = Pupils will need to recall the methods for calculating the mean, median and mode for sets of discrete data and
define them.
GP 4 – 5 = Pupils will be taught how to find the averages and range of discrete data in tables and stem and leaf diagrams.
GP 6 – 7 = Pupils will calculate averages and range from grouped continuous data tables.
Success criteria:
ALL GP = Pupils will be able to quickly calculate mean, median, mode and range of lists of data to then compare sets of data. For instance, compare girl’s scores against boy’s scores in a test. GP 4 – 5 = Pupils will be able to calculate the average and range of data from lists and tables and explain why one method is more suitable than the other (GP5 pupils will be able to find averages from grouped data tables). GP 6 – 7 = Pupils will be able to calculate mean, median and mode from grouped data including continuous data. They will calculate the range. Pupils should be able to compare sets of data in detail to answer a simple hypothesis using averages and range. They should be able to provide reasons for using or not using certain methods and describe the reliability of their average. Hypothesis 2 – The range is enough to compare the spread of data Learning intention:
Understand how to calculate the interquartile range; draw box and whisker diagrams (box plot) (including from
cumulative frequency curves) to compare sets of data, explain differences in data by using the range/IQR and
understand why it is important.
Knowledge:
Only HGP pupils will carry out this intention. LGP pupils will use the time to continue work on averages and range and
using cumulative frequency curves to identify the medians to compare data. REACH for GP 5 pupils will be to calculate
upper and lower quartiles of lists of data and therefore the IQR. They will use this to compare spread.
GP 6 – 7 = Pupils will be taught how to find the IQR of data from sets and cumulative frequency curves/tables.
Success criteria:
GP 6 – 7 = Pupils should be able to find the IQR from lists of data and grouped data. They will plot cumulative frequency curves for 2 sets of data, then use them to find the median, UQ, LQ and IQR to make comparisons. Pupils will use cumulative frequency curves and lists of data sets to construct box and whisker diagrams to again compare sets of data linked to a hypothesis. Hypothesis 3 – Outliers have little or no effect on the average and range (Cognitive acceleration based activity)
In lesson 4 they will continue practice finding averages and range of different sets of discrete and continuous data
and investigate what happens to data when you include and remove any outliers.
Home learning: Given Tuesday of each week and due in Tuesday the following week.
This week pupils will complete a GCSE exam based booklet with a variety of questions involving statistics.
Week 5
4 1hr lessons
plus 1hr
homework
Line of Enquiry: How can past/historical data impact on chance? Hypothesis 1 – Probabilities always sum to 1 Learning intention:
Understand how to record probabilities in a range of contexts and methods
Knowledge:
ALL GP – Pupils will recall how to write probabilities of events as a fraction, decimal or a percentage and using a probability scale. Key terms need to be recalled. GP 3 – 4 = Pupils need to write the probability of events happening and NOT happening and apply the term mutually exclusive. GP 5 – 6 = Pupils will be taught how to use probability trees to record probabilities.

Success criteria: ALL GP – Pupils will write the probability of a variety of events as a fraction and where relevant as a decimal or percentage. They need to be able to define with examples events that are impossible, certain, even, equally likely, likely, unlikely, outcomes and mutually exclusive. GP 3 – 4 = Find the probability of events not happening by applying the knowledge that probabilities add up to 1. List events that are mutually exclusive and explain why. GP 5 – 6 = Pupils will simply complete probability tree diagrams for events with and without replacement (Lesson 5 – pupils will apply the AND/OR rules to probability trees and Venn diagrams). Pupils will learn how to construct tree diagrams to demonstrate and find the possible outcomes of a given event. Hypothesis 2 – Tables of results are more reliable than lists for calculating probabilities Learning intention:
Construct theoretical probability spaces for single and combined experiments with equally likely outcomes and use
these to calculate theoretical probabilities
Knowledge:
ALL GP – Pupils will be taught how to use and complete sample space diagrams for events and experiments. Success criteria: GP 3 – 4 = Pupils will calculate probabilities of single and combined events from a given completed sample space diagram. GP 5 – 6 = Pupils will draw a sample space diagram for given events/experiments and calculate the probability of single events and combined events. They will compare likeliness of events. Pupils will explain the advantages of creating sample space diagrams versus lists of outcomes. Hypothesis 3 – Theoretical probability relates to real life Learning intention:
Apply ideas of randomness, fairness and equally likely events to calculate expected outcomes or multiple future
experiments

Knowledge:
ALL GP – Pupils will discuss the differences between theoretical probability and experimental probability. Success criteria: (same for all pupils but depth of detail in plan and conclusion will need guidance and GP will be through outcome) All pupils will carry out a short experiment. They will make predictions about what they expect to happen against what they think might actually happen and use this to create their own hypothesis. Pupils will create a simple plan and design their data collection sheets. They will discuss the number of trials and write about this in their conclusion. All pupils will need to be able to explain the differences between theory and real life and identify where in real life this occurs and the possible uses for experimental probability. Hypothesis 4 – Everything is relative Learning intention:
Relate relative expected frequencies to theoretical probability, calculating the probability of events repeating
Knowledge:
ALL GP – Pupils will be taught how to calculate relative frequency from tables of experimental data Success criteria: (same for all pupils as a key skill needed for both higher and foundation courses) All pupils will answer a variety of questions calculating the relative frequency of events based on historical results/data. Pupils can carry out a small experiment the write the relative frequencies of each event occurring again. HGP pupils will discuss and explain what would happen if they repeated the same experiment. Home learning: Given Tuesday each week and due in by Tuesday the following week.
This week pupils will have a graded revision booklet on LC3 content which will be worked through and marked with peers at the start of week 6 to help with exams. Pupils will use the knowledge organiser to assist with revision for a quiz lesson 2 of week 6.
Week 6 Line of enquiry: Continued from week 5

2 1hr lessons
including end
of term exam (2
hours).
Hypothesis 5 – We always add probabilities to calculate the probability of multiple events Learning intention:
Calculate the probability of independent and dependent combined events, including using tree diagrams and Venn
diagrams, and know the underlying assumptions (know when to use ADD or MULTIPLY)
Knowledge:
GP 5 – 6 = Pupils will be taught how to calculate probabilities from tree diagrams using the AND/OR rule. Pupils will be taught how to apply Venn diagrams to solve problems with probability. Success criteria: GP 5 = Complete tree diagrams and find the probabilities of events using multiplication. GP 6 = Calculate probabilities and understand when to apply the AND rule as well as the OR rule. Complete and use Venn diagrams.
Lesson 2 will be for revision using the KNOWLEDGE ORGANISER and lessons 3 and 4 will be for the end of LC3 exam – one calculator and one non-calculator paper spanning 2 hours.
Gap Analysis Reinforcement
Gap
Reinforcement
in week 7
As seen in the lesson activities each week, gap teaching will not just be at the end of the semester after exam analysis has
taken place. Gap teaching is an integral part to each unit of work and will consist of summary sheets, mini-tests and tasks
where gaps can be filled and REACH activities can be delivered.
Extended Learning and links across the curriculum for numeracy.
(This is not part
of the ‘timed’
schedule but is
seen as
Extended learning will in a variety of forms. During home learning pupils may be asked to use the following sites where
they complete quick quizzes, CIMT tasks, GCSE style questions and more open ended problem solving tasks.
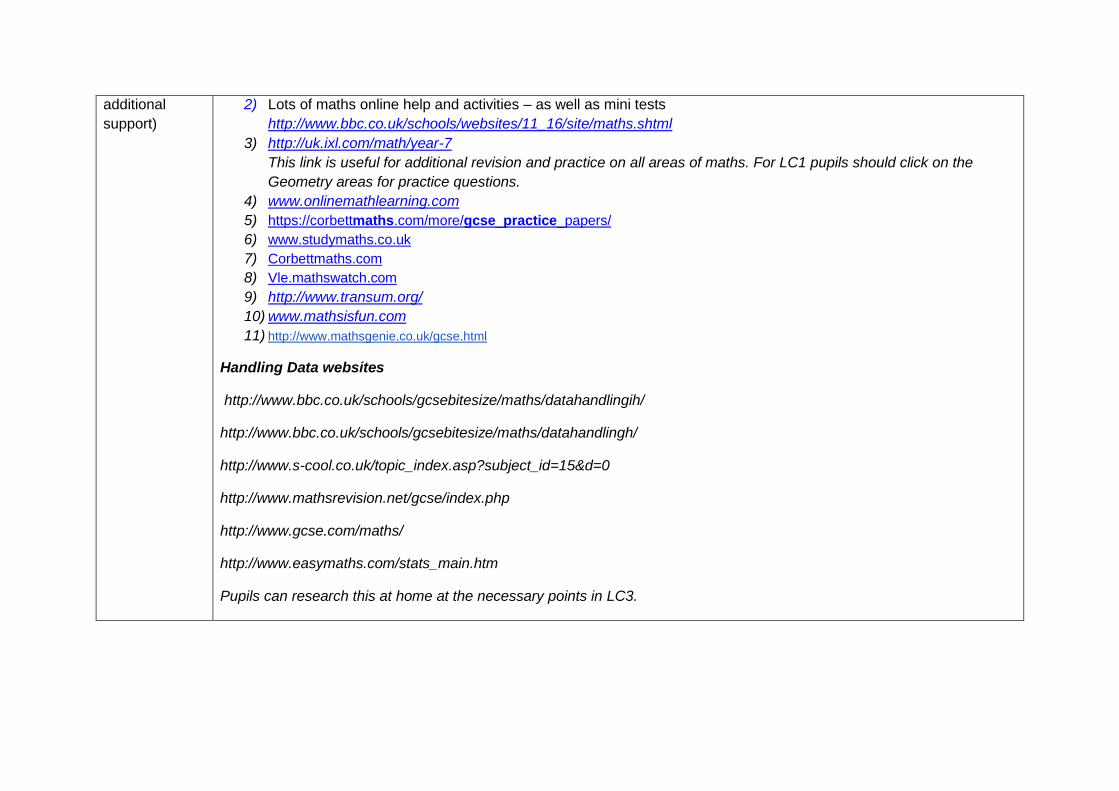
1) Levelled quizzes http://www.educationquizzes.com/ks3/maths/
additional
support)
2) Lots of maths online help and activities – as well as mini tests
http://www.bbc.co.uk/schools/websites/11_16/site/maths.shtml
3) http://uk.ixl.com/math/year-7
This link is useful for additional revision and practice on all areas of maths. For LC1 pupils should click on the
Geometry areas for practice questions.
4) www.onlinemathlearning.com
5) https://corbettmaths.com/more/gcse_practice_papers/
6) www.studymaths.co.uk
7) Corbettmaths.com
8) Vle.mathswatch.com
9) http://www.transum.org/
10) www.mathsisfun.com
11) http://www.mathsgenie.co.uk/gcse.html
Handling Data websites
http://www.bbc.co.uk/schools/gcsebitesize/maths/datahandlingih/
http://www.bbc.co.uk/schools/gcsebitesize/maths/datahandlingh/
http://www.s-cool.co.uk/topic_index.asp?subject_id=15&d=0
http://www.mathsrevision.net/gcse/index.php
http://www.gcse.com/maths/
http://www.easymaths.com/stats_main.htm
Pupils can research this at home at the necessary points in LC3.