Embed Size (px)
Citation preview
Module 3Module 3
Microsoft Office SuiteMicrosoft Excel
Microsoft Office SuiteMicrosoft Excel
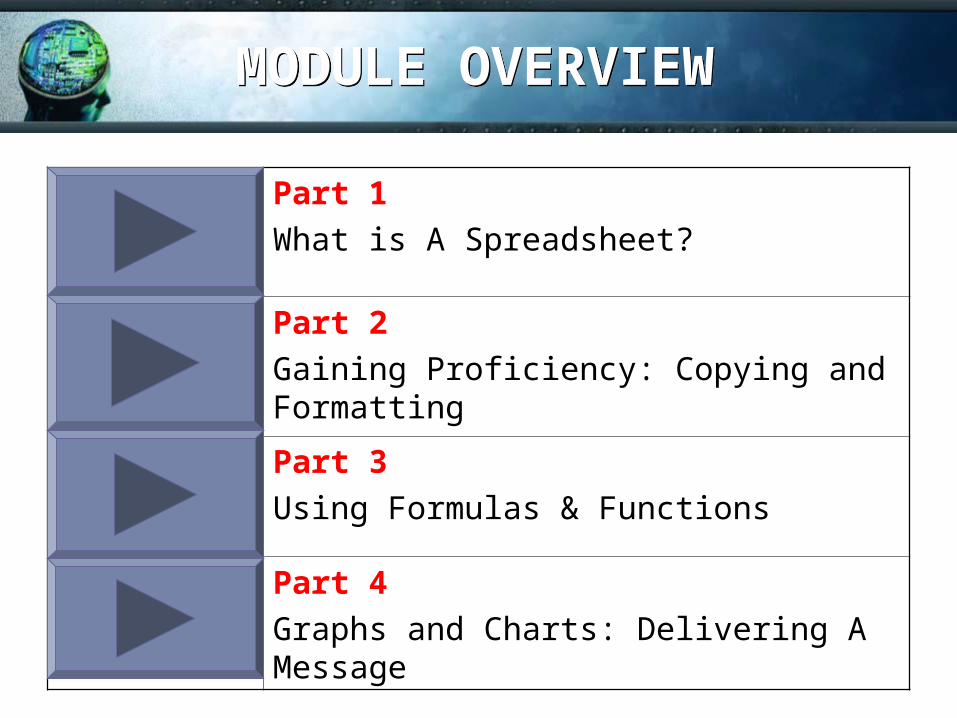
MODULE OVERVIEWMODULE OVERVIEW
Part 1
What is A Spreadsheet?
Part 2
Gaining Proficiency: Copying and Formatting
Part 3
Using Formulas & Functions
Part 4
Graphs and Charts: Delivering A Message
Part 1Part 1
What is A Spreadsheet?
What is A Spreadsheet?
ObjectivesObjectives
• Describe what a spreadsheet is and potential applications
• Distinguish between a formula and a constant
• Open, save, print a workbook; – insert and delete rows and columns
• Use Page Setup to print worksheet and preview before printing
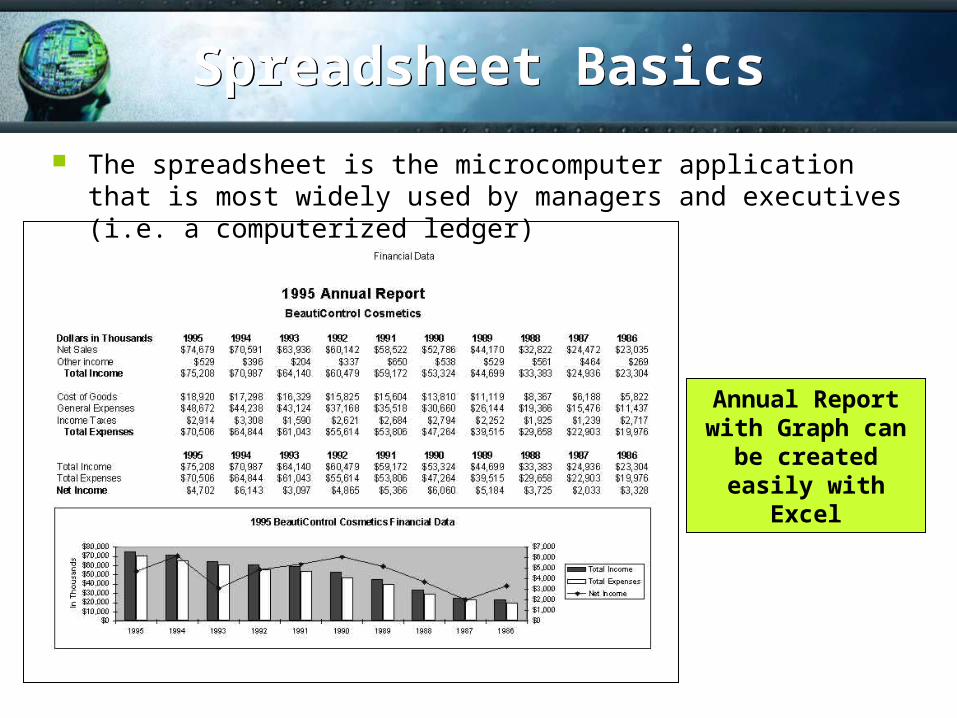
Spreadsheet BasicsSpreadsheet Basics
The spreadsheet is the microcomputer application that is most widely used by managers and executives (i.e. a computerized ledger)
Annual Report with Graph can be
created easily with Excel
Spreadsheet BasicsSpreadsheet Basics
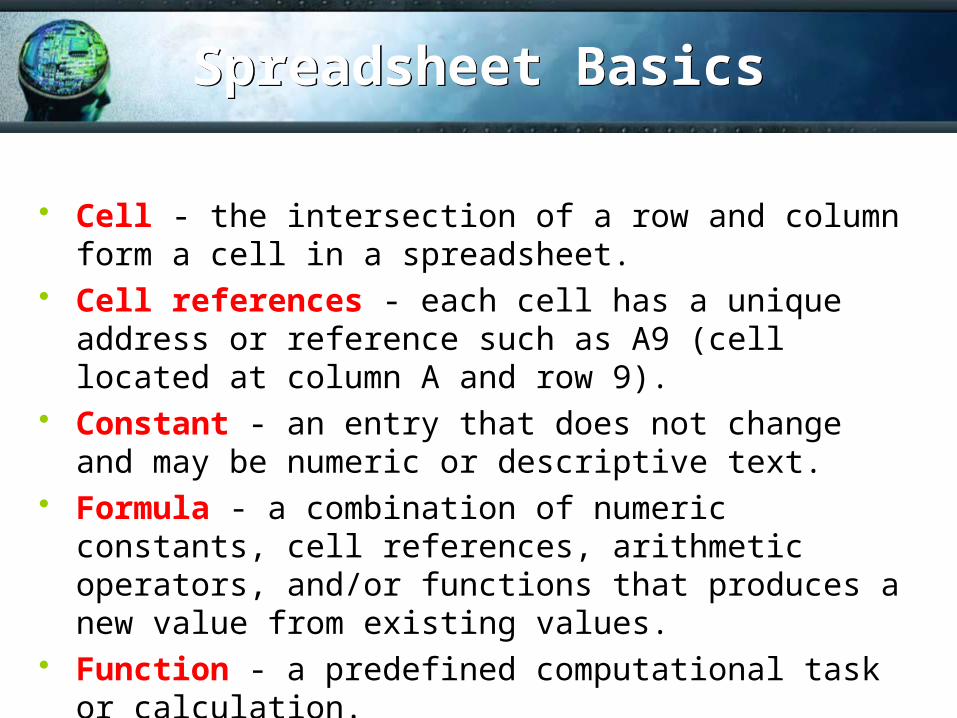
Cell - the intersection of a row and column form a cell in a spreadsheet.
Cell references - each cell has a unique address or reference such as A9 (cell located at column A and row 9).
Constant - an entry that does not change and may be numeric or descriptive text.
Formula - a combination of numeric constants, cell references, arithmetic operators, and/or functions that produces a new value from existing values.
Function - a predefined computational task or calculation.
Excel 2000 BasicsExcel 2000 Basics
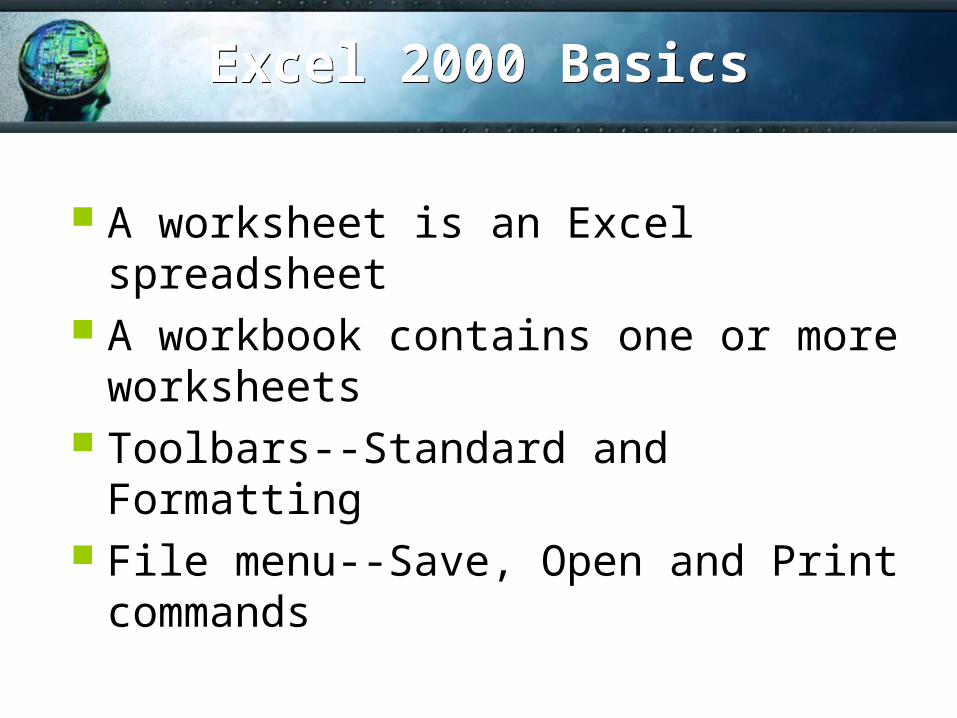
A worksheet is an Excel spreadsheet A workbook contains one or more
worksheets Toolbars--Standard and Formatting File menu--Save, Open and Print
commands
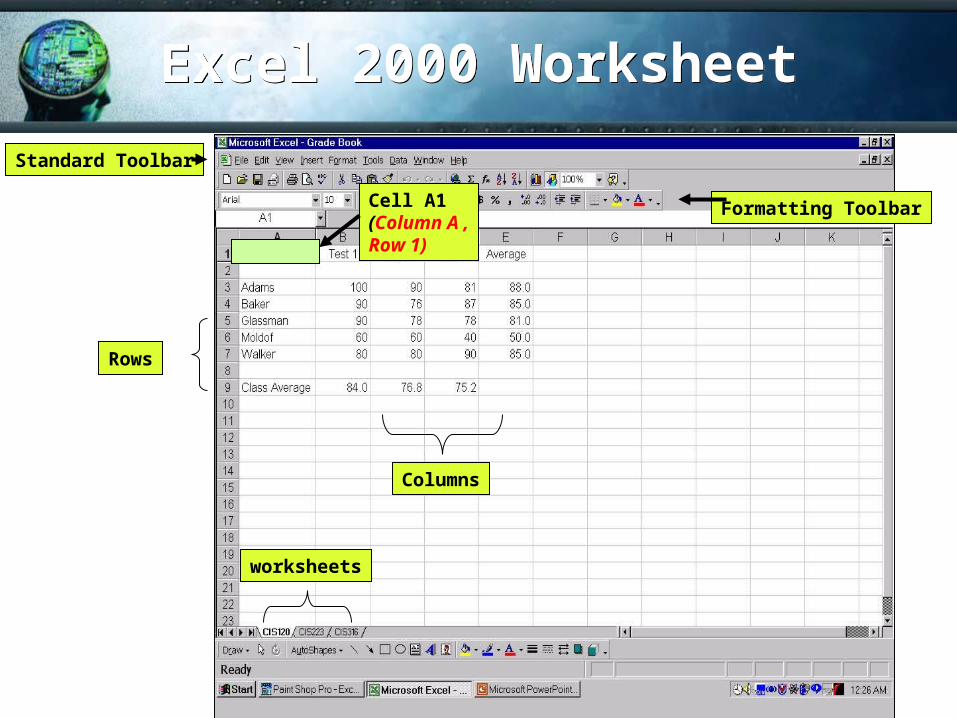
Excel 2000 WorksheetExcel 2000 Worksheet
Rows
Columns
Cell A1 (Column A , Row 1)
worksheets
Formatting Toolbar
Standard Toolbar
Modifying the WorksheetModifying the Worksheet
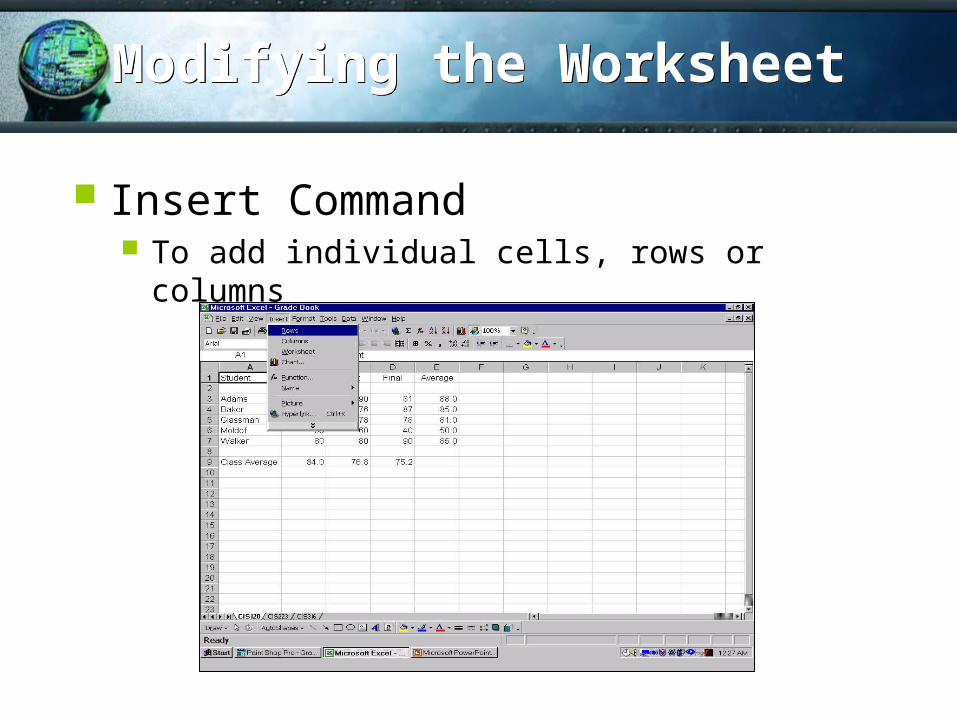
Insert Command To add individual cells, rows or columns
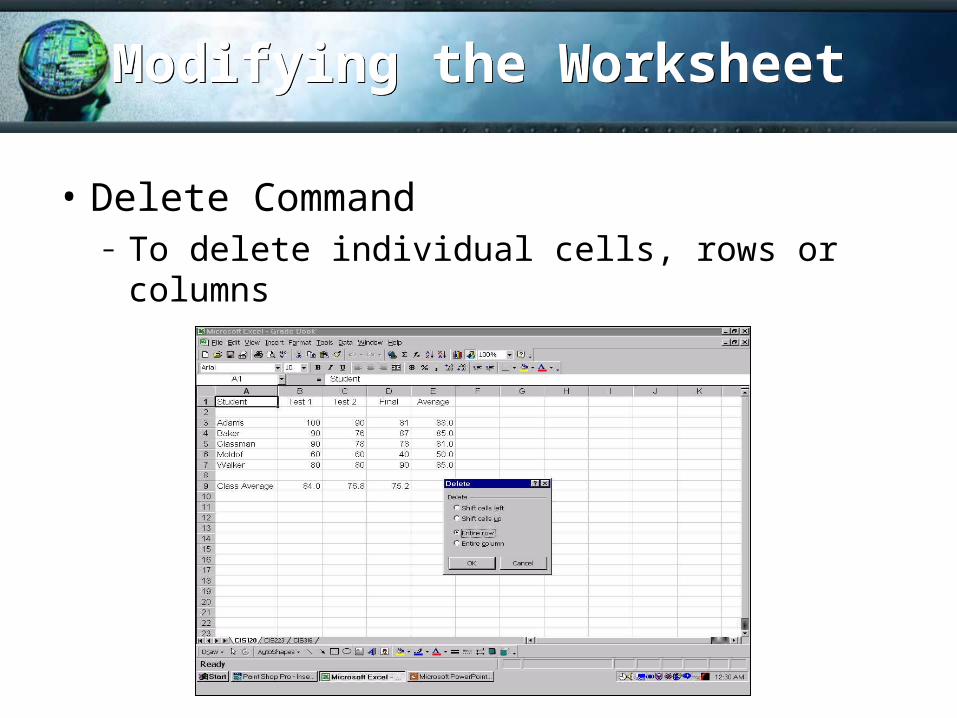
• Delete Command– To delete individual cells, rows or columns
Modifying the WorksheetModifying the Worksheet
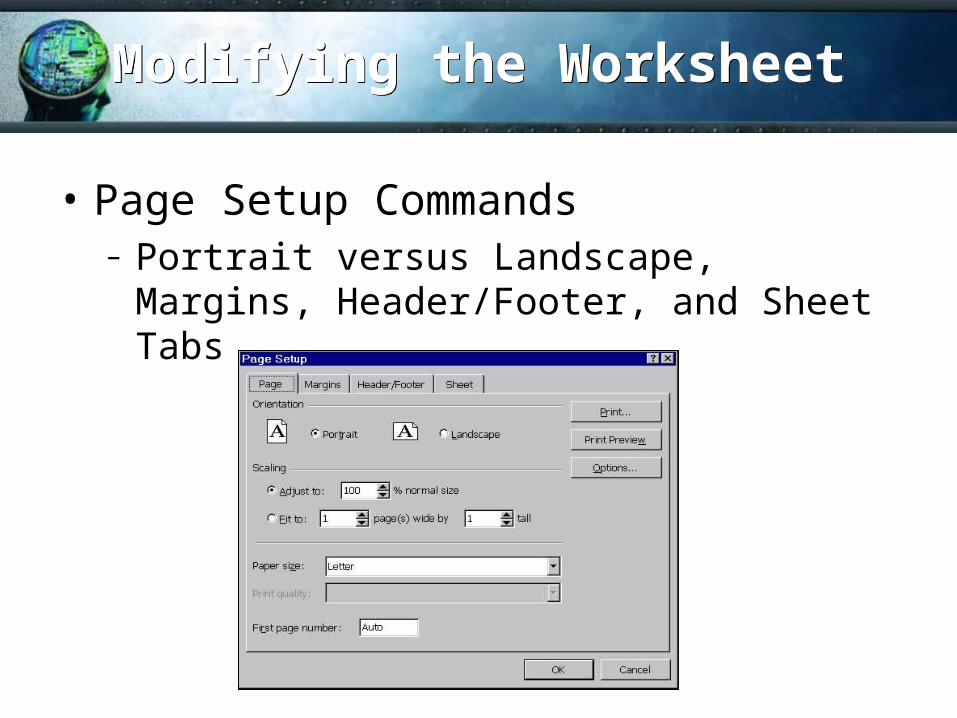
• Page Setup Commands– Portrait versus Landscape, Margins,
Header/Footer, and Sheet Tabs
Modifying the WorksheetModifying the Worksheet

Part 2Part 2
Gaining Proficiency: Copying and Formatting
Gaining Proficiency: Copying and Formatting
ObjectivesObjectives
• Define, select and deselect cell ranges
• Copy and move cells; differentiate between relative, absolute and mixed addresses
• Format a worksheet
• Change column widths
Getting around the WorksheetGetting around the Worksheet
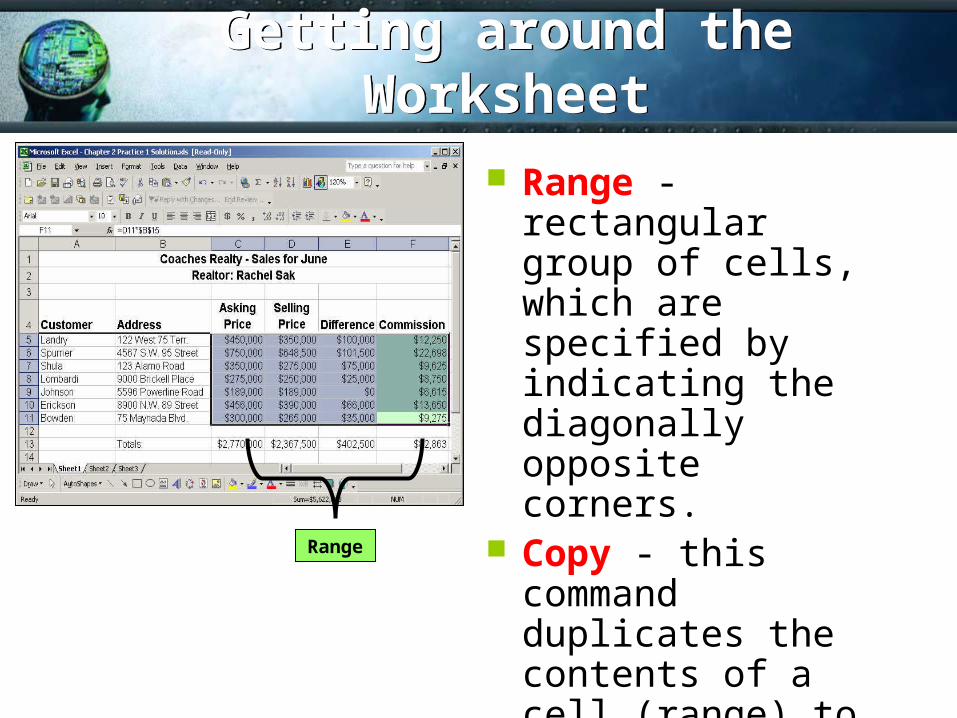
Range - rectangular group of cells, which are specified by indicating the diagonally opposite corners.
Copy - this command duplicates the contents of a cell (range) to another cell.
Move – transfers the contents of a cell to another cell.
Range
Getting around the WorksheetGetting around the Worksheet
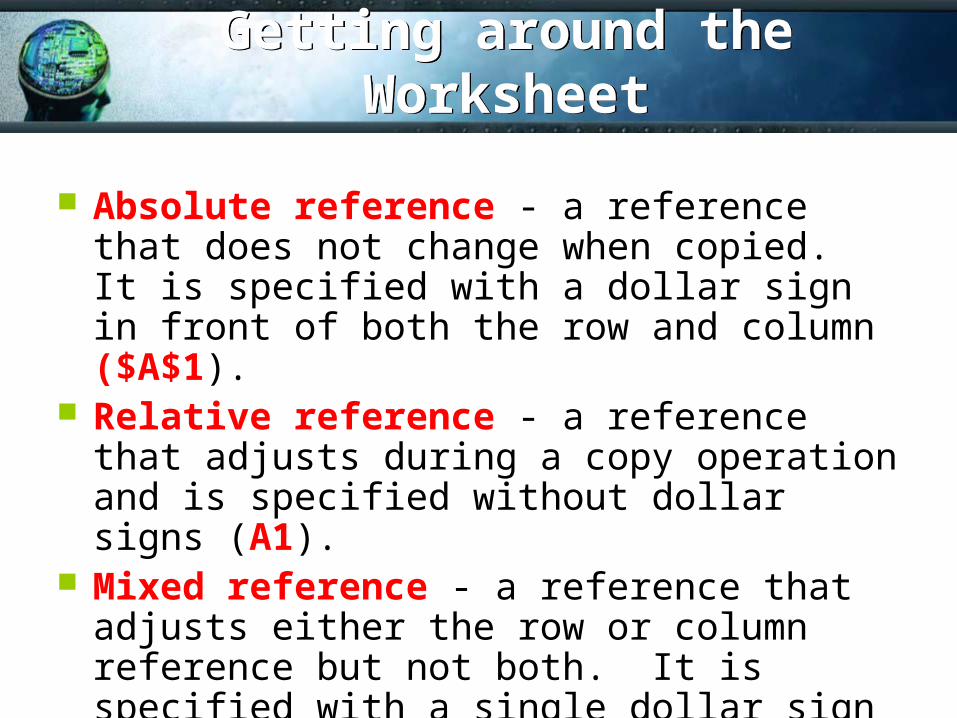
Absolute reference - a reference that does not change when copied. It is specified with a dollar sign in front of both the row and column ($A$1).
Relative reference - a reference that adjusts during a copy operation and is specified without dollar signs (A1).
Mixed reference - a reference that adjusts either the row or column reference but not both. It is specified with a single dollar sign ($A1 or A$1).
Getting around the WorksheetGetting around the Worksheet
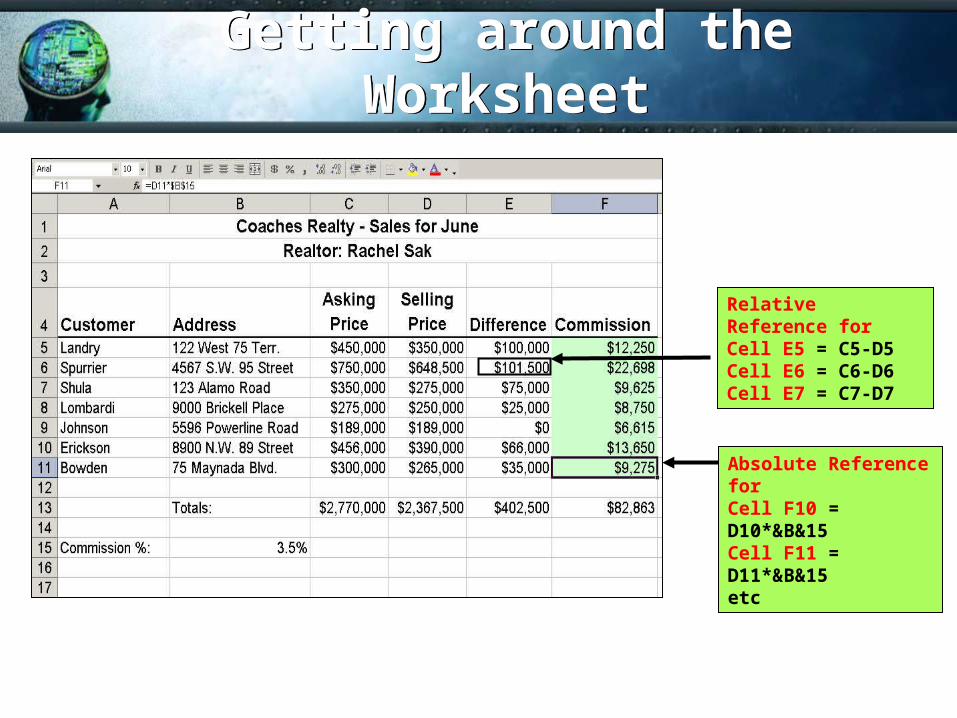
Absolute Reference forCell F10 = D10*&B&15Cell F11 = D11*&B&15etc
Relative Reference forCell E5 = C5-D5Cell E6 = C6-D6Cell E7 = C7-D7
Excel 2000 FormattingExcel 2000 Formatting
• Formatting toolbar - the most commonly used formatting commands are available as buttons on this toolbar.
• Column width - the width of a worksheet column, which can be changed with the Column command or by dragging the border.
• Row height - the height of a row in a worksheet. The row height changes automatically as the font size changes.
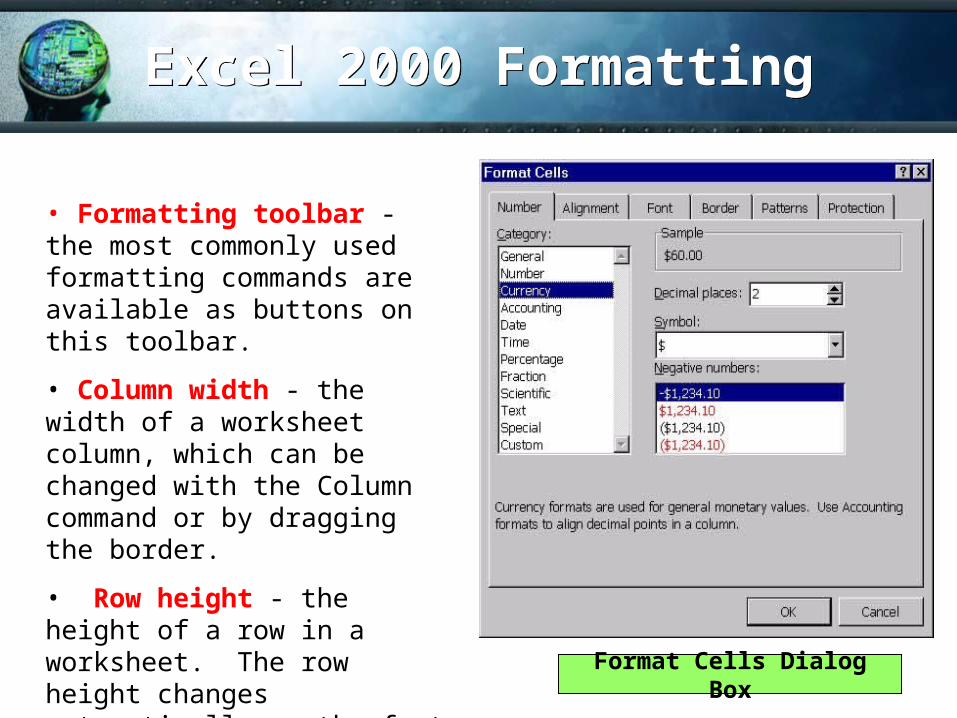
Format Cells Dialog Box
Excel 2000 FormattingExcel 2000 Formatting
• Alignment - you may align text within the cells either horizontally or vertically and then choose left, center, right, justify or centered.
• Fonts – refer to both the size and the different types available in Excel.
• Border tab - enables you to create a border around a cell or range.
• Patterns and Shading tabs - lets you choose a different color to shade the cell or range
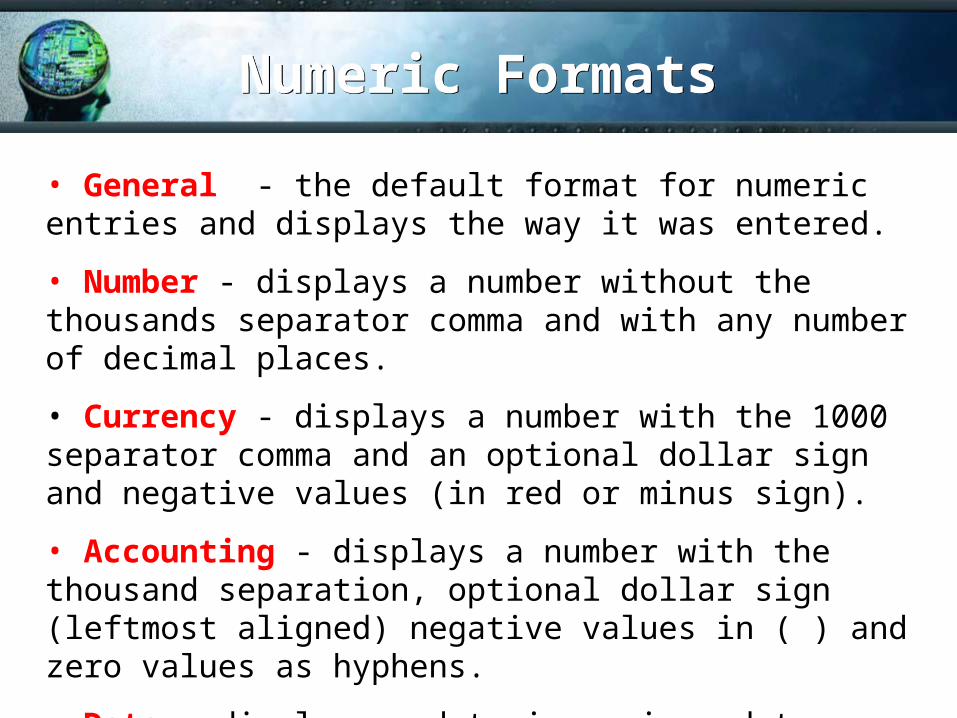
Numeric FormatsNumeric Formats
• General - the default format for numeric entries and displays the way it was entered.
• Number - displays a number without the thousands separator comma and with any number of decimal places.
• Currency - displays a number with the 1000 separator comma and an optional dollar sign and negative values (in red or minus sign).
• Accounting - displays a number with the thousand separation, optional dollar sign (leftmost aligned) negative values in ( ) and zero values as hyphens.
• Date - displays a date in various date formats.
Numeric FormatsNumeric Formats
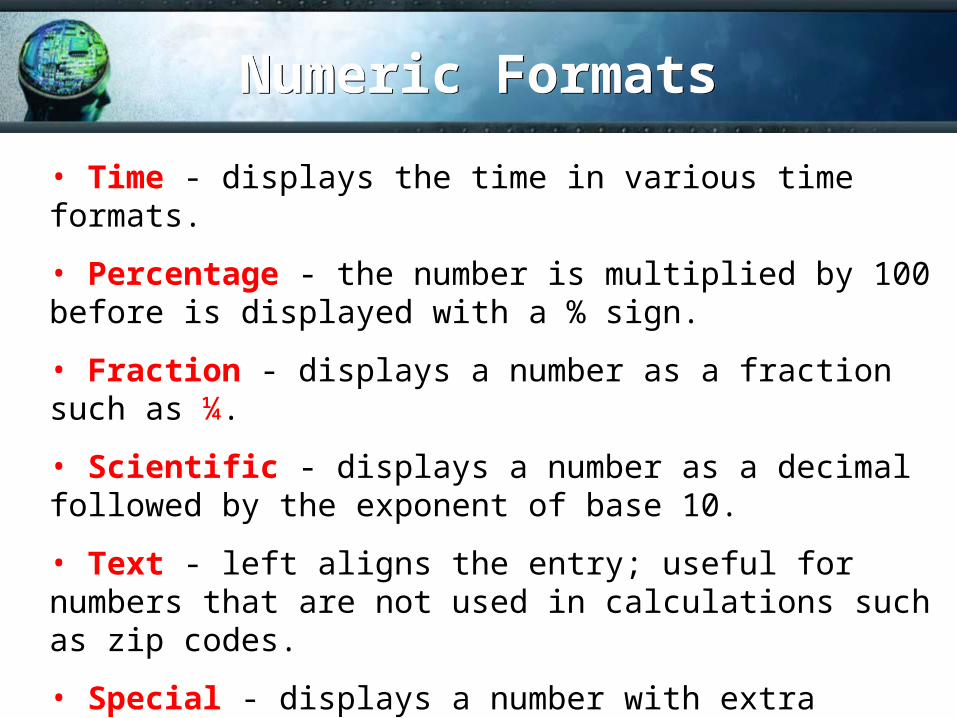
• Time - displays the time in various time formats.
• Percentage - the number is multiplied by 100 before is displayed with a % sign.
• Fraction - displays a number as a fraction such as ¼.
• Scientific - displays a number as a decimal followed by the exponent of base 10.
• Text - left aligns the entry; useful for numbers that are not used in calculations such as zip codes.
• Special - displays a number with extra characters such as ( ) around a phone number area code.
• Custom - allows you to develop your own formats.

Part 3Part 3
Using Formulas & Functions
Using Formulas & Functions
ObjectivesObjectives
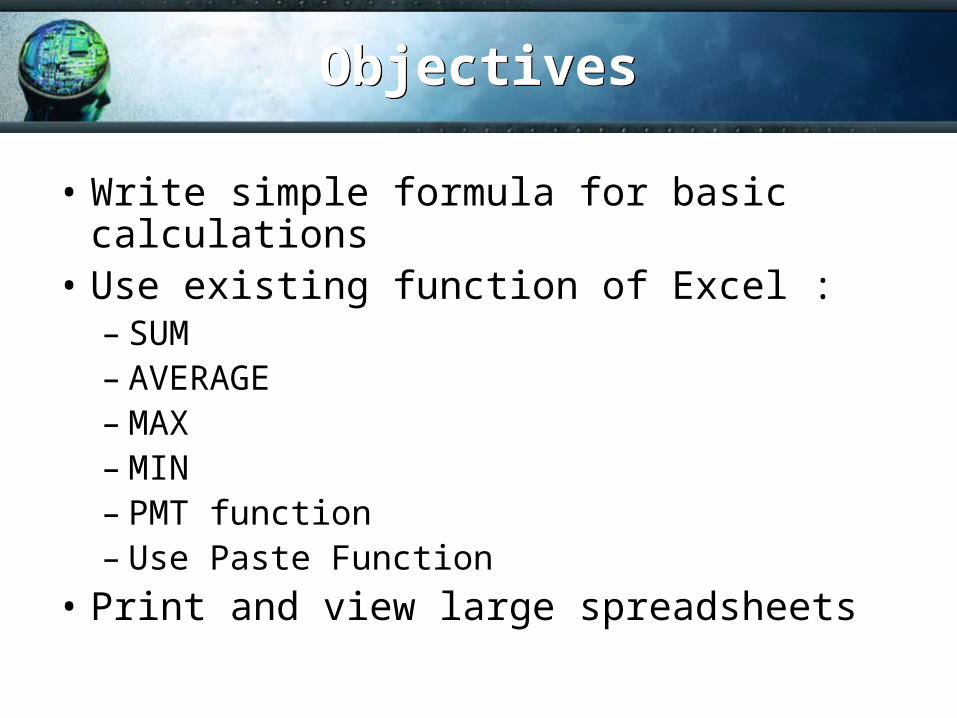
• Write simple formula for basic calculations • Use existing function of Excel :
– SUM– AVERAGE– MAX– MIN– PMT function– Use Paste Function
• Print and view large spreadsheets
FormulasFormulas
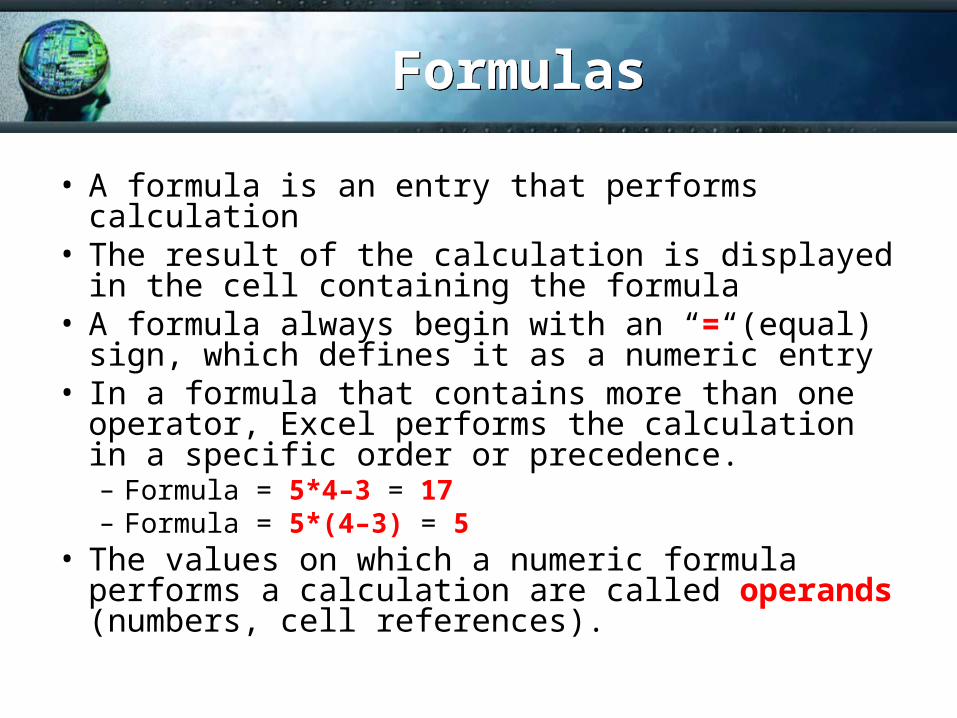
• A formula is an entry that performs calculation• The result of the calculation is displayed in the
cell containing the formula• A formula always begin with an “=“(equal) sign,
which defines it as a numeric entry• In a formula that contains more than one
operator, Excel performs the calculation in a specific order or precedence.– Formula = 5*4–3 = 17– Formula = 5*(4–3) = 5
• The values on which a numeric formula performs a calculation are called operands (numbers, cell references).
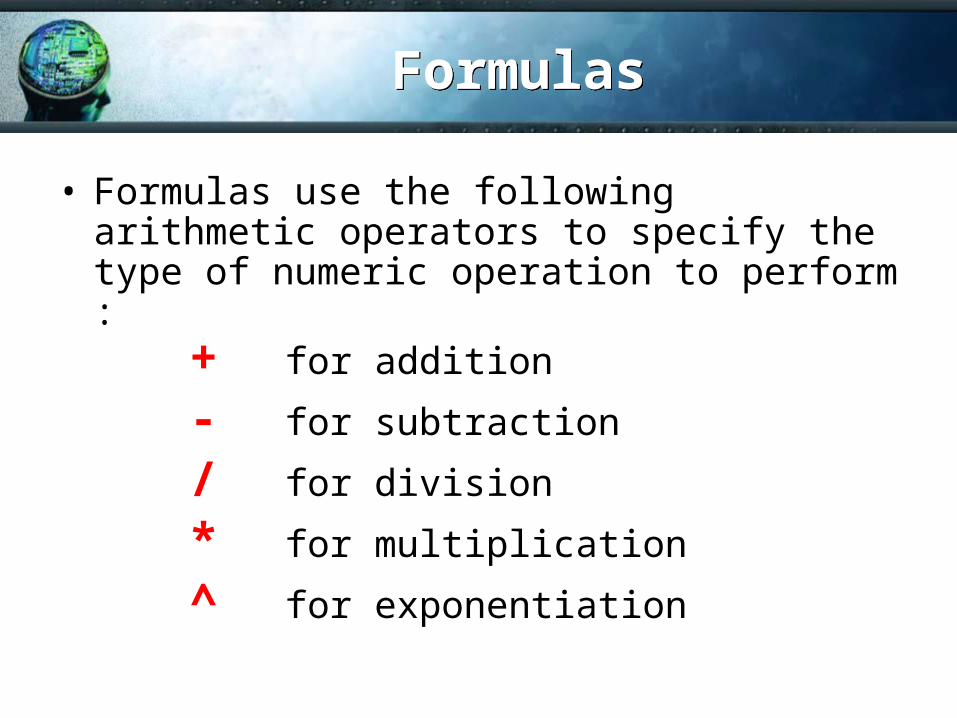
FormulasFormulas
• Formulas use the following arithmetic operators to specify the type of numeric operation to perform :
+ for addition
- for subtraction
/ for division
* for multiplication
^ for exponentiation
FormulasFormulas
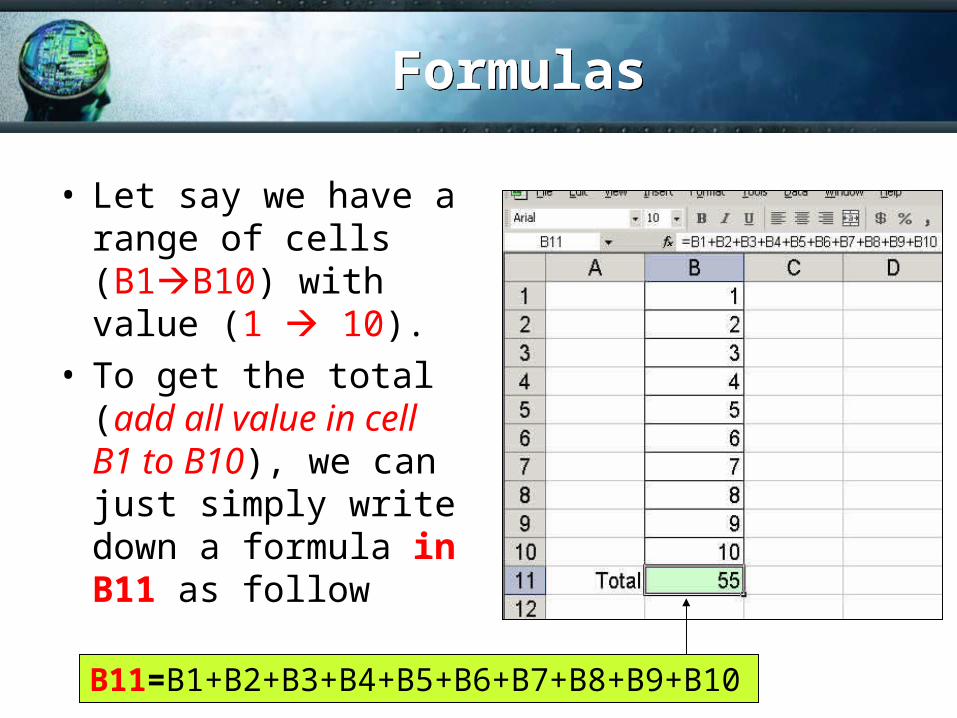
• Let say we have a range of cells (B1B10) with value (1 10).
• To get the total (add all value in cell B1 to B10), we can just simply write down a formula in B11 as follow
B11=B1+B2+B3+B4+B5+B6+B7+B8+B9+B10
FunctionsFunctions
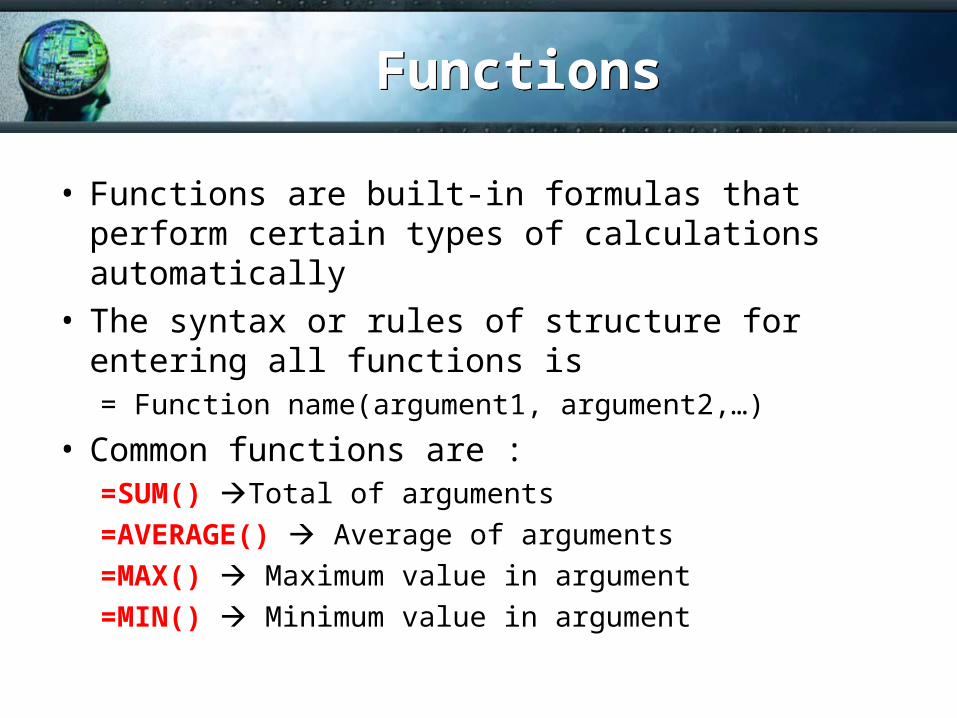
• Functions are built-in formulas that perform certain types of calculations automatically
• The syntax or rules of structure for entering all functions is= Function name(argument1, argument2,…)
• Common functions are :=SUM() Total of arguments
=AVERAGE() Average of arguments
=MAX() Maximum value in argument
=MIN() Minimum value in argument
Functions (SUM)Functions (SUM)
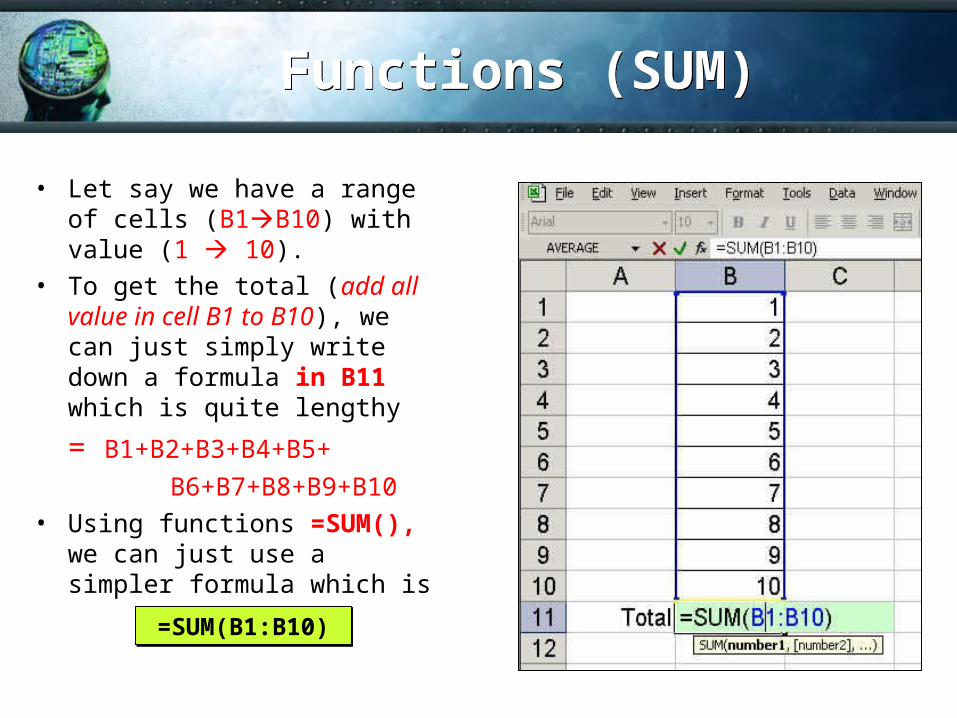
• Let say we have a range of cells (B1B10) with value (1 10).
• To get the total (add all value in cell B1 to B10), we can just simply write down a formula in B11 which is quite lengthy
= B1+B2+B3+B4+B5+
B6+B7+B8+B9+B10• Using functions =SUM(), we
can just use a simpler formula which is
=SUM(B1:B10)=SUM(B1:B10)
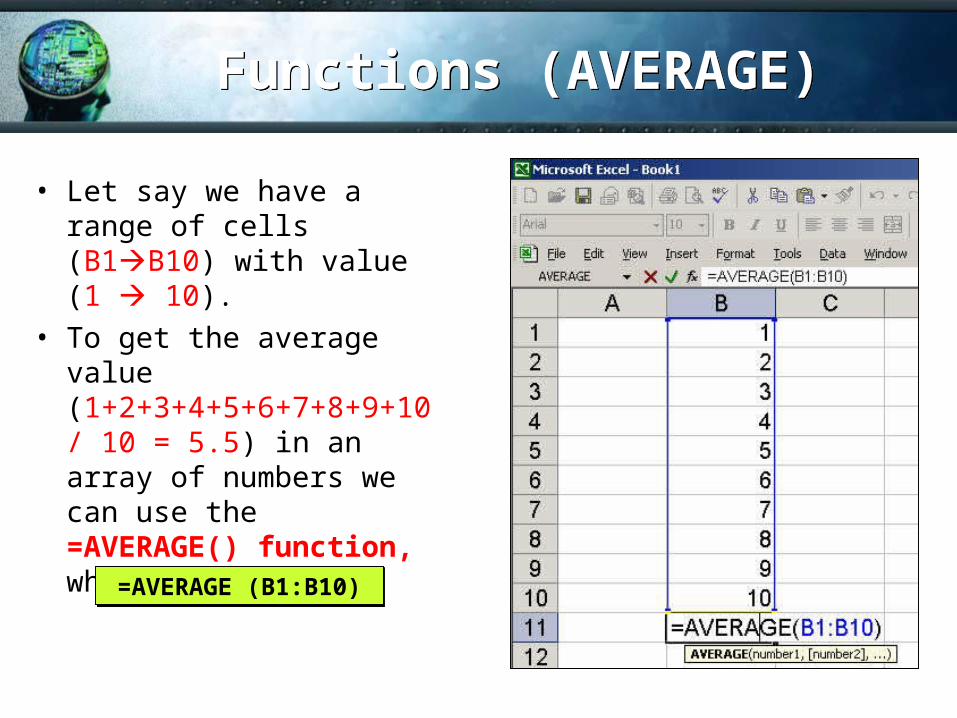
Functions (AVERAGE)Functions (AVERAGE)
• Let say we have a range of cells (B1B10) with value (1 10).
• To get the average value (1+2+3+4+5+6+7+8+9+10 / 10 = 5.5) in an array of numbers we can use the =AVERAGE() function, which is
=AVERAGE (B1:B10)=AVERAGE (B1:B10)
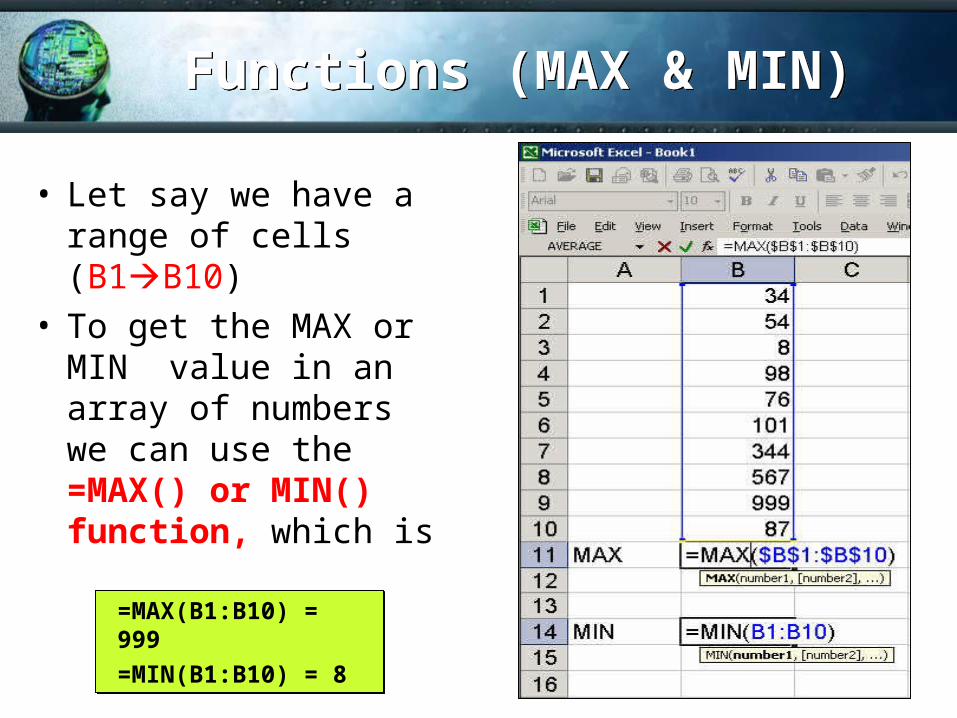
Functions (MAX & MIN)Functions (MAX & MIN)
• Let say we have a range of cells (B1B10)
• To get the MAX or MIN value in an array of numbers we can use the =MAX() or MIN() function, which is =MAX(B1:B10) = 999
=MIN(B1:B10) = 8
=MAX(B1:B10) = 999
=MIN(B1:B10) = 8
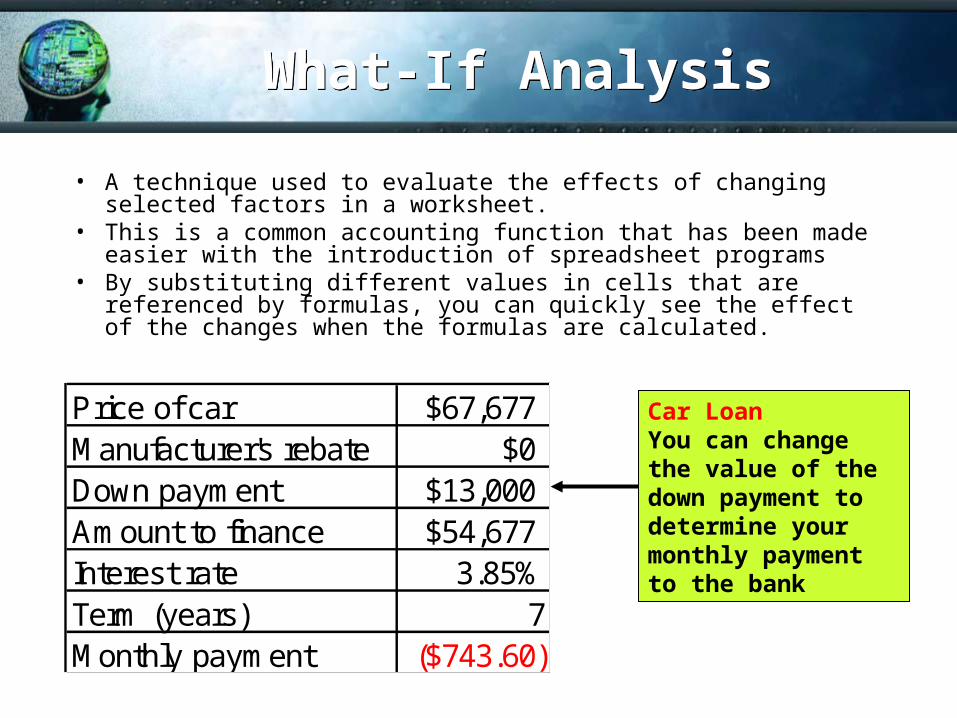
What-If AnalysisWhat-If Analysis
• A technique used to evaluate the effects of changing selected factors in a worksheet.
• This is a common accounting function that has been made easier with the introduction of spreadsheet programs
• By substituting different values in cells that are referenced by formulas, you can quickly see the effect of the changes when the formulas are calculated.
Price of car $67,677Manufacturer's rebate $0Down payment $13,000Amount to finance $54,677Interest rate 3.85%Term (years) 7Monthly payment ($743.60)
Car LoanYou can change the value of the down payment to determine your monthly payment to the bank
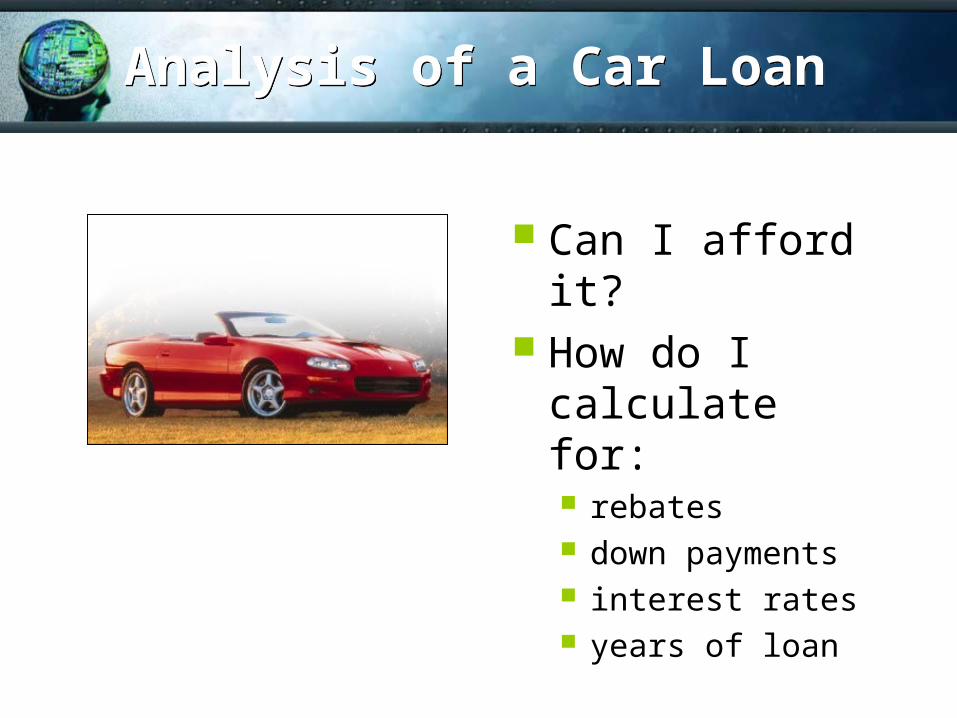
Analysis of a Car LoanAnalysis of a Car Loan
Can I afford it? How do I
calculate for: rebates down payments interest rates years of loan
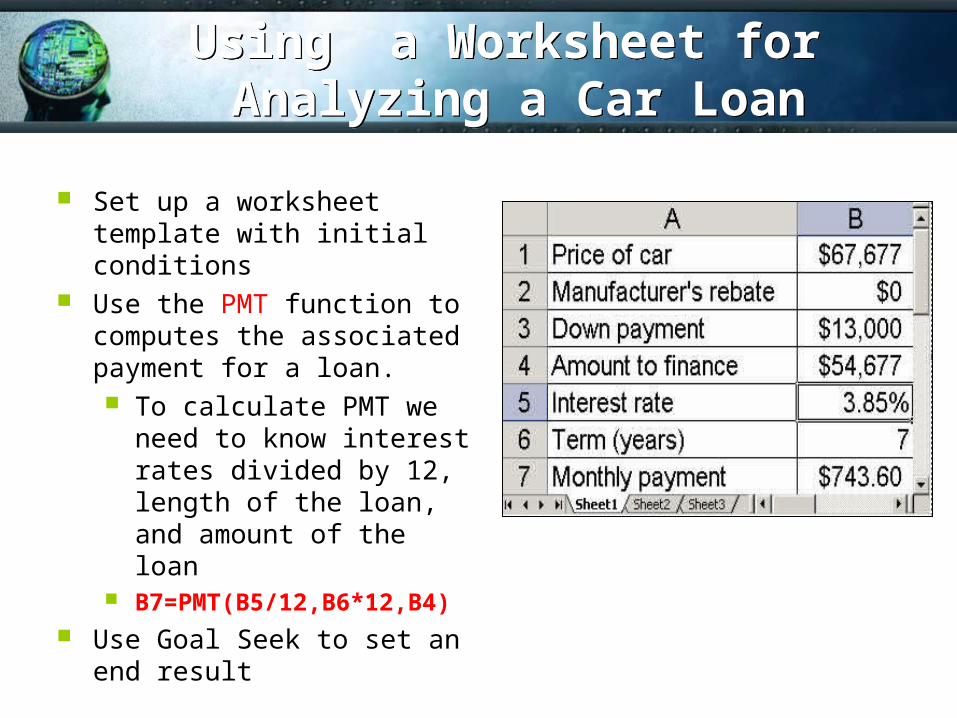
Using a Worksheet for Analyzing a Car Loan
Using a Worksheet for Analyzing a Car Loan
Set up a worksheet template with initial conditions
Use the PMT function to computes the associated payment for a loan. To calculate PMT we
need to know interest rates divided by 12, length of the loan, and amount of the loan
B7=PMT(B5/12,B6*12,B4) Use Goal Seek to set an end
result
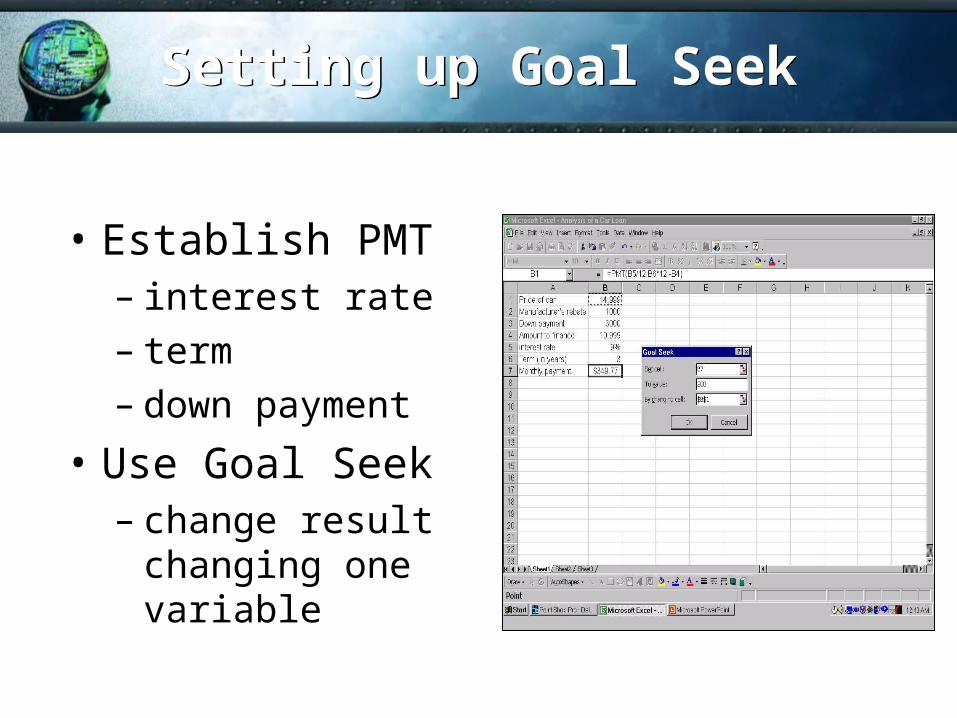
Setting up Goal SeekSetting up Goal Seek
• Establish PMT– interest rate– term– down payment
• Use Goal Seek– change result
changing one variable
• PMT Function– A predefined formula that accepts one or
more arguments as input, performs the indicated calculation and returns another value as output
• Goal Seek command– Enables us to set an end result in order to
determine the input to produce that result
Setting up Goal Seek (Cont…)Setting up Goal Seek (Cont…)
Excel FeaturesExcel Features
Relative versus Absolute addressing in a worksheet
Using the fill handle to copy Pointing to cell address for formulas
or functions is more accurate as we can change the value in the cell to predict result.
Using the Paste Function and the Formula Palette
Managing a Large WorksheetManaging a Large Worksheet
• Scrolling shows specific rows and columns
• Freezing Panes keeps headings in sight
• AutoFill capability enter series into adjacent cells

Part 4Part 4
Graphs and Charts: Delivering A MessageGraphs and Charts:
Delivering A Message
ObjectivesObjectives
• Intro to Excel Chart• How to create chart using Excel• How worksheet data is represented in a chart• The type of chart available in Excel• Know the advantages and disadvantages of
different chart types• What is Embedded Chart and Chart Sheet • Creating Chart through Chart Wizard• OLE and Combination Chart
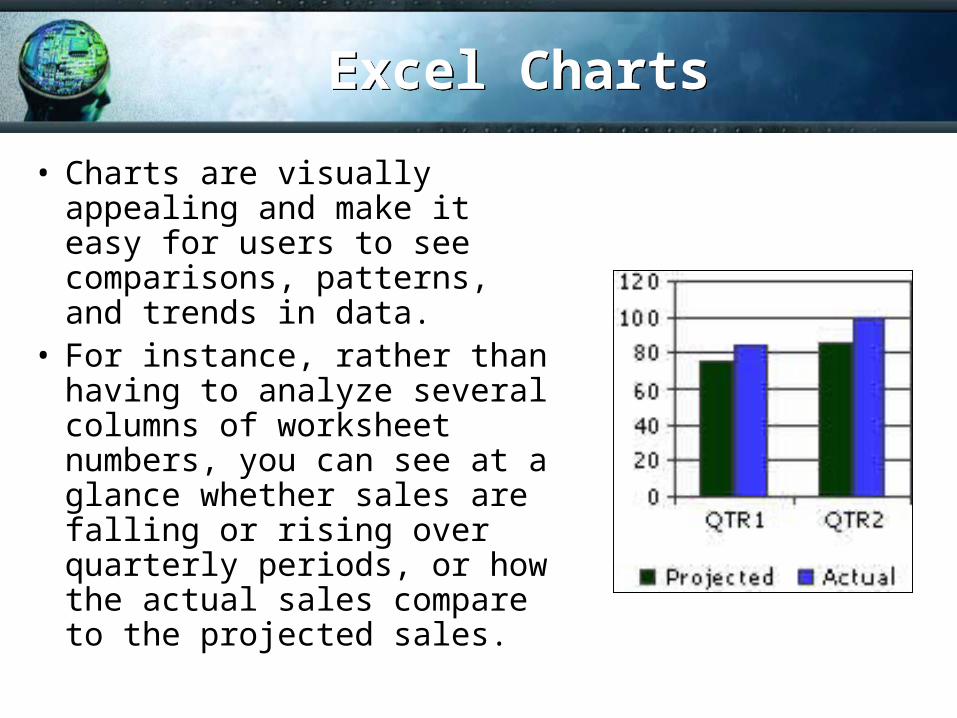
Excel ChartsExcel Charts
• Charts are visually appealing and make it easy for users to see comparisons, patterns, and trends in data.
• For instance, rather than having to analyze several columns of worksheet numbers, you can see at a glance whether sales are falling or rising over quarterly periods, or how the actual sales compare to the projected sales.
Creating ChartsCreating Charts
• You can create a chart on its own sheet or as an embedded object on a worksheet.
• You can also publish a chart on a Web page. • To create a chart, you must first enter the data
for the chart on the worksheet. • Then select that data and use the Chart Wizard
to step through the process of choosing the chart type and the various chart options, or use the Chart toolbar to create a basic chart that you can format later.
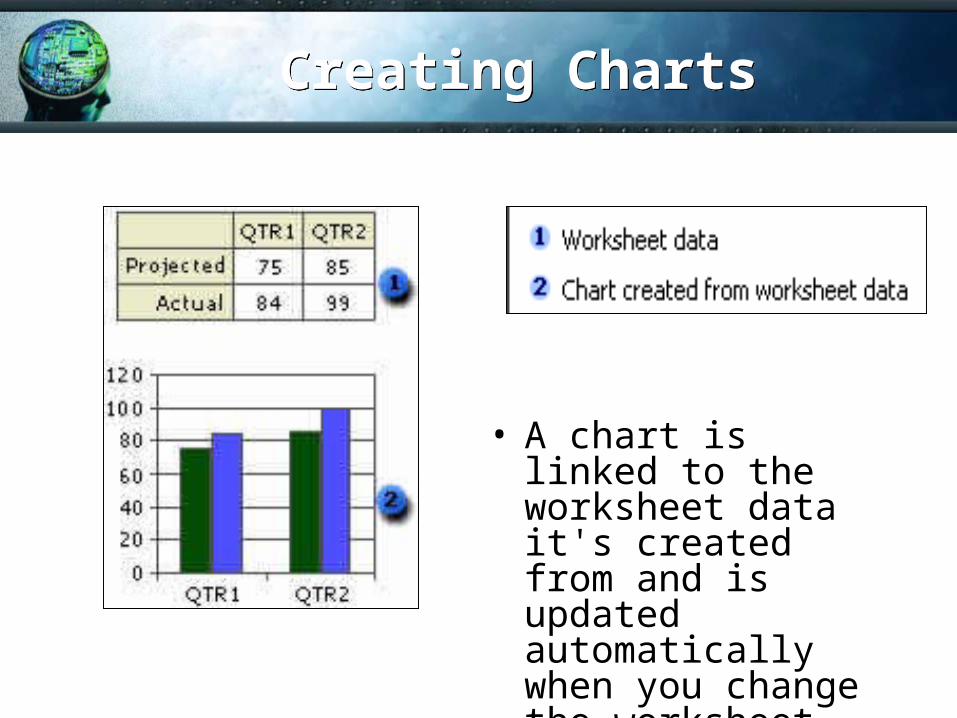
Creating ChartsCreating Charts
• A chart is linked to the worksheet data it's created from and is updated automatically when you change the worksheet data.
How worksheet data is represented in a chart
How worksheet data is represented in a chart
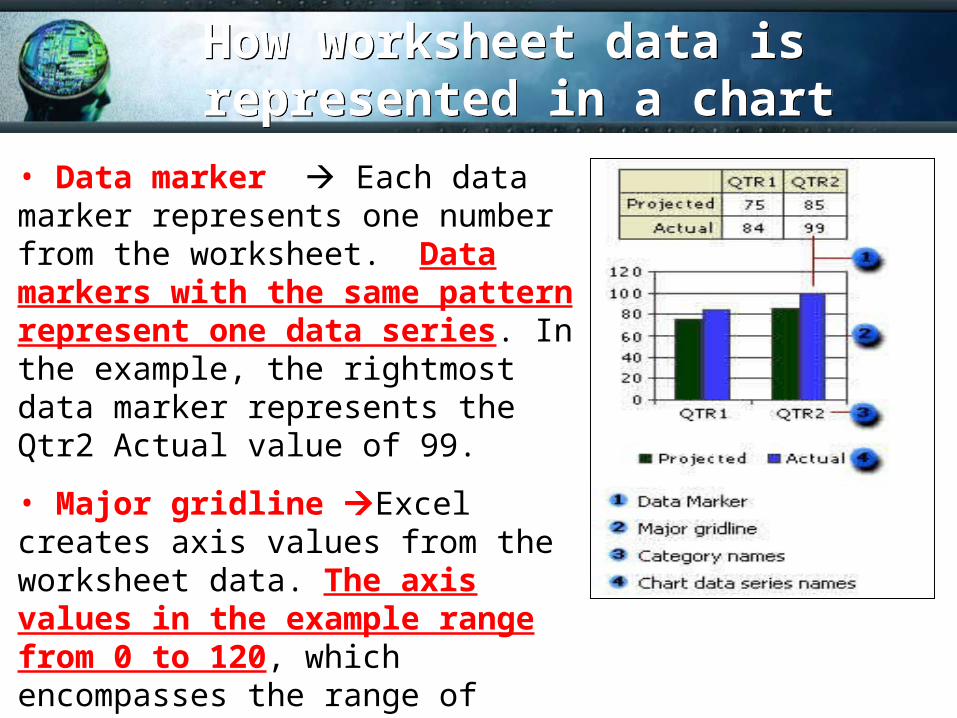
• Data marker Each data marker represents one number from the worksheet. Data markers with the same pattern represent one data series. In the example, the rightmost data marker represents the Qtr2 Actual value of 99.
• Major gridline Excel creates axis values from the worksheet data. The axis values in the example range from 0 to 120, which encompasses the range of values on the worksheet. Major gridlines mark the major intervals on the axis.
How worksheet data is represented in a chart
How worksheet data is represented in a chart
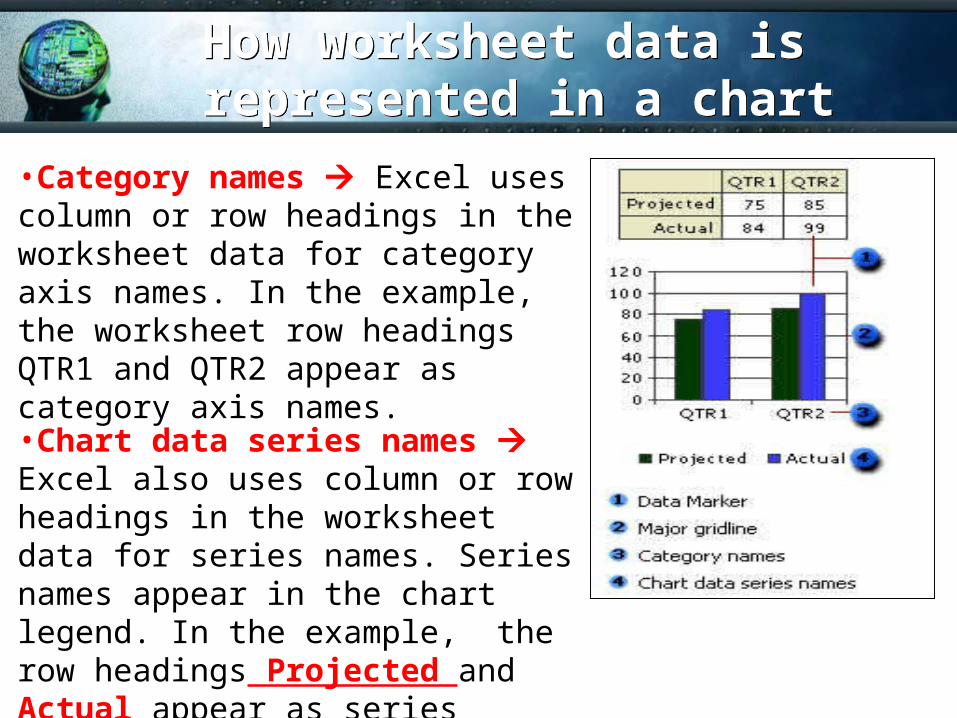
•Category names Excel uses column or row headings in the worksheet data for category axis names. In the example, the worksheet row headings QTR1 and QTR2 appear as category axis names.
•Chart data series names Excel also uses column or row headings in the worksheet data for series names. Series names appear in the chart legend. In the example, the row headings Projected and Actual appear as series names.
Chart Sheet & Embedded Chart Chart Sheet & Embedded Chart
• You can create a chart on its own chart sheet or as an embedded chart on a worksheet.
• Either way, the chart is linked to the source data on the worksheet, which means the chart is updated when you update the worksheet data.– Embedded charts An embedded chart is considered a
graphic object and is saved as part of the worksheet on which it is created.
• Use embedded charts when you want to display or print one or more charts with your worksheet data.
– Chart sheets A chart sheet is a separate sheet within your workbook that has its own sheet name.
• Use a chart sheet when you want to view or edit large or complex charts separately from the worksheet data or when you want to preserve screen space as you work on the worksheet.
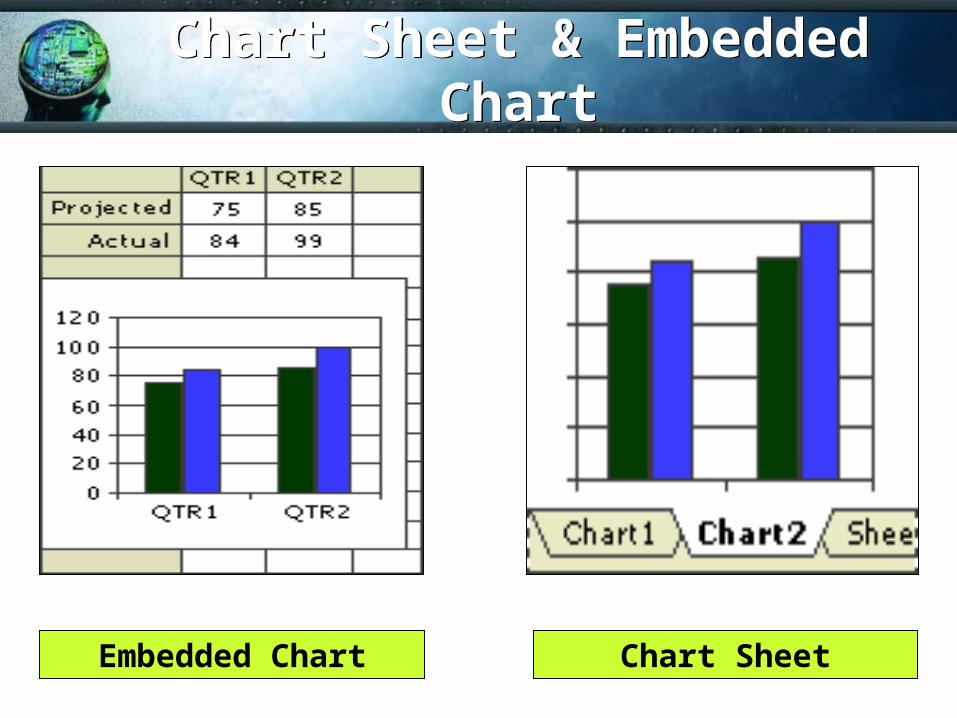
Chart Sheet & Embedded ChartChart Sheet & Embedded Chart
Embedded Chart Chart Sheet
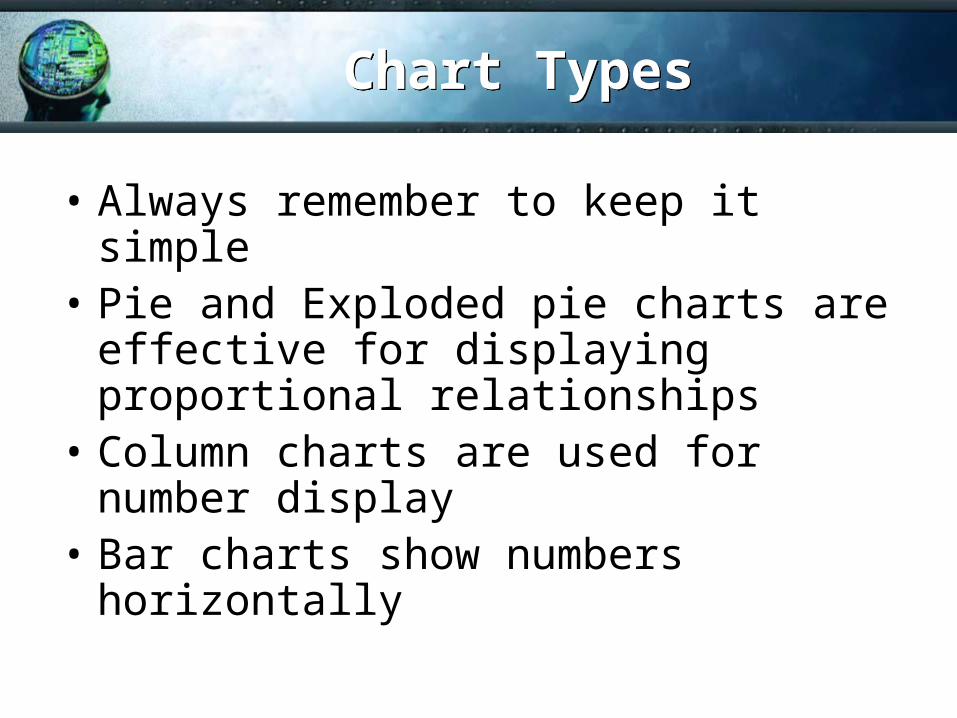
Chart TypesChart Types
• Always remember to keep it simple• Pie and Exploded pie charts are effective
for displaying proportional relationships• Column charts are used for number
display• Bar charts show numbers horizontally
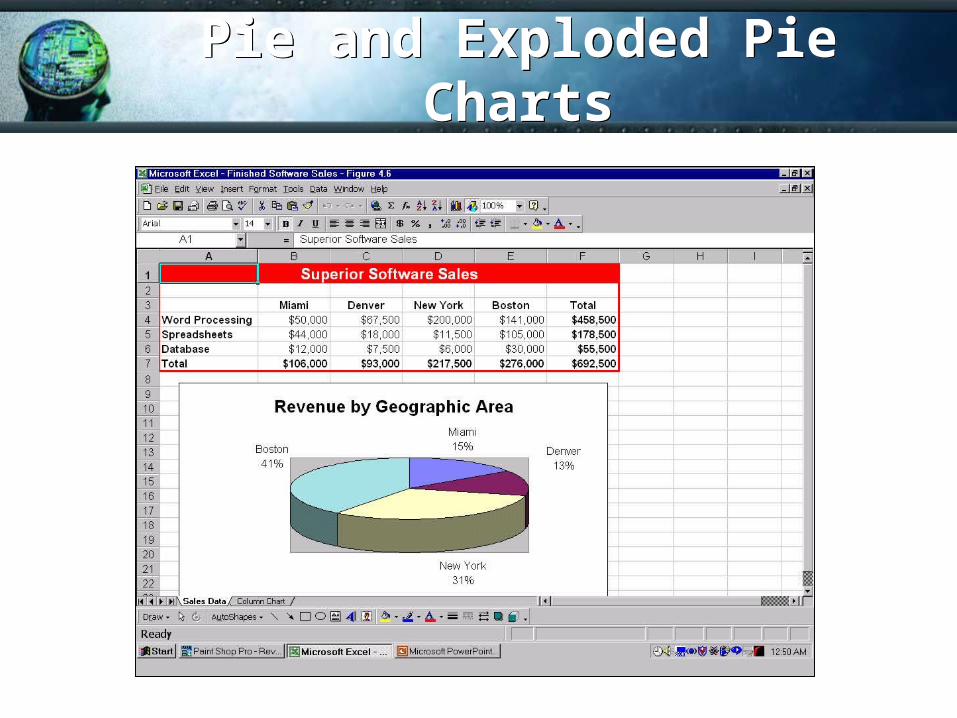
Pie and Exploded Pie ChartsPie and Exploded Pie Charts
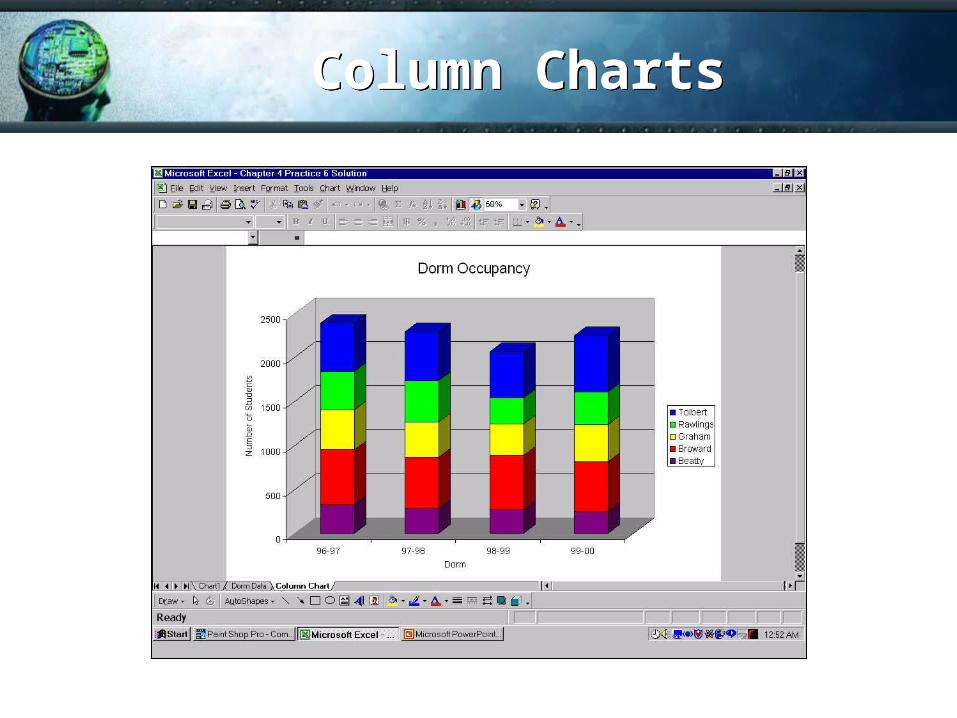
Column ChartsColumn Charts
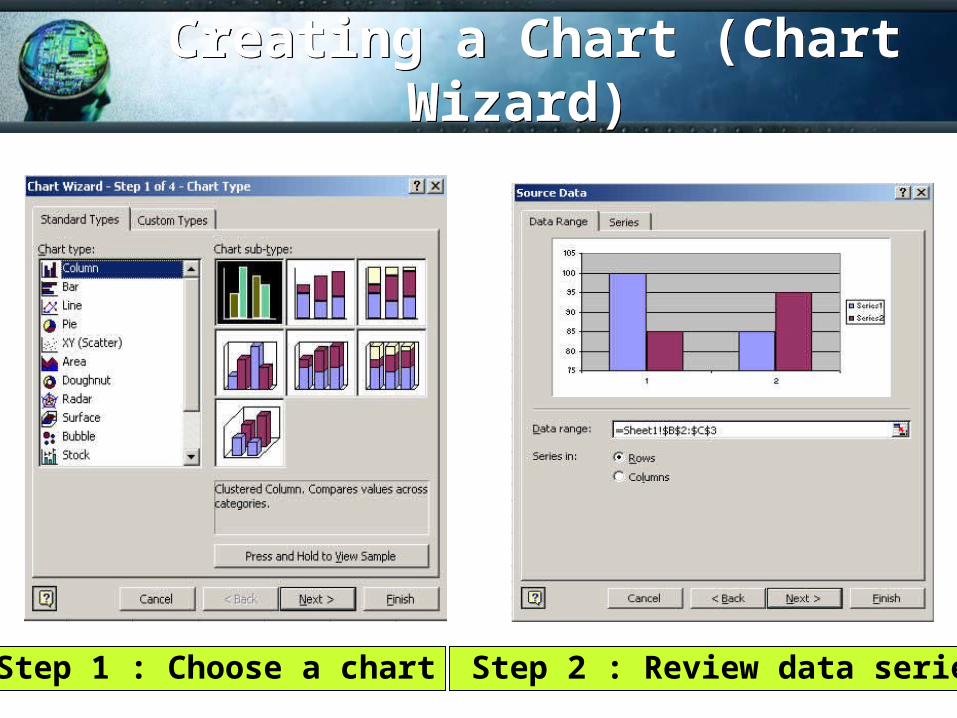
Step 1 : Choose a chart Step 2 : Review data series
Creating a Chart (Chart Wizard) Creating a Chart (Chart Wizard)
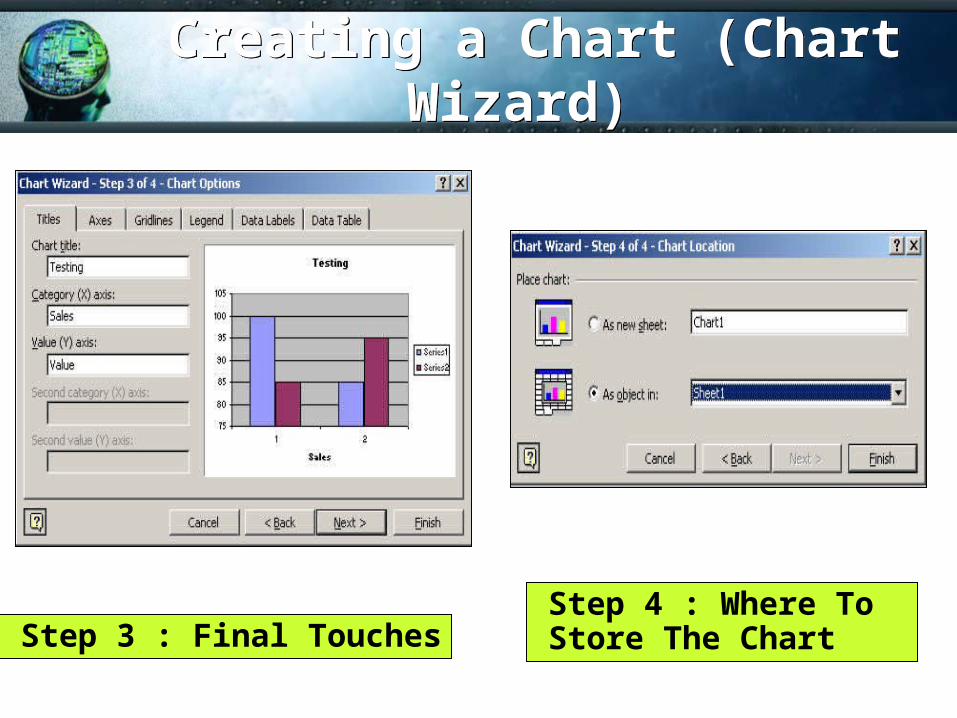
Step 3 : Final TouchesStep 4 : Where To Store The Chart
Creating a Chart (Chart Wizard) Creating a Chart (Chart Wizard)
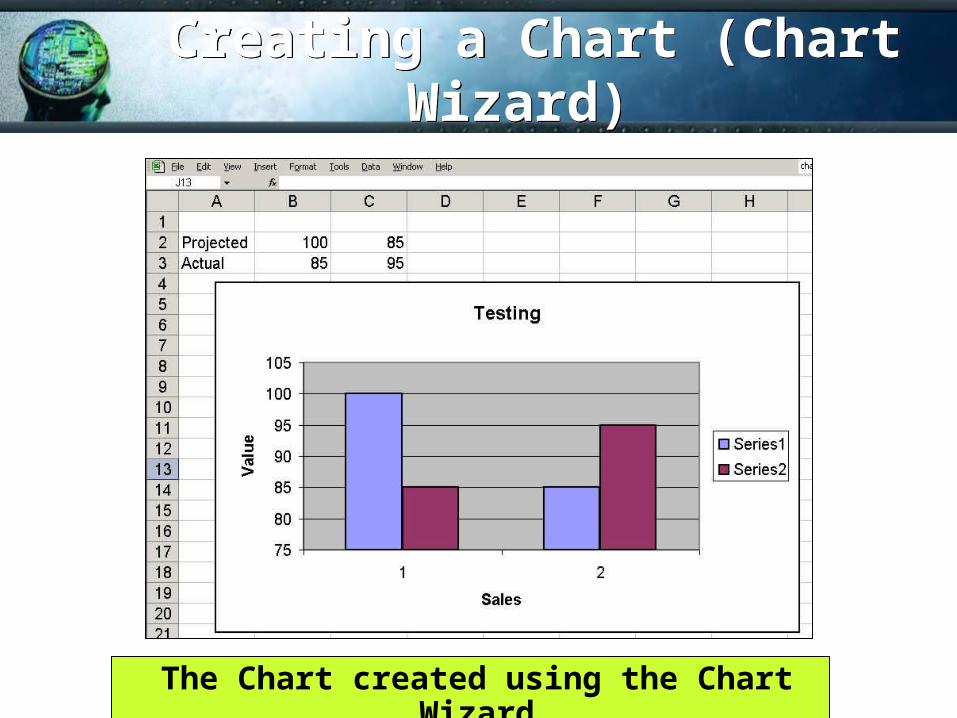
The Chart created using the Chart Wizard
Creating a Chart (Chart Wizard) Creating a Chart (Chart Wizard)
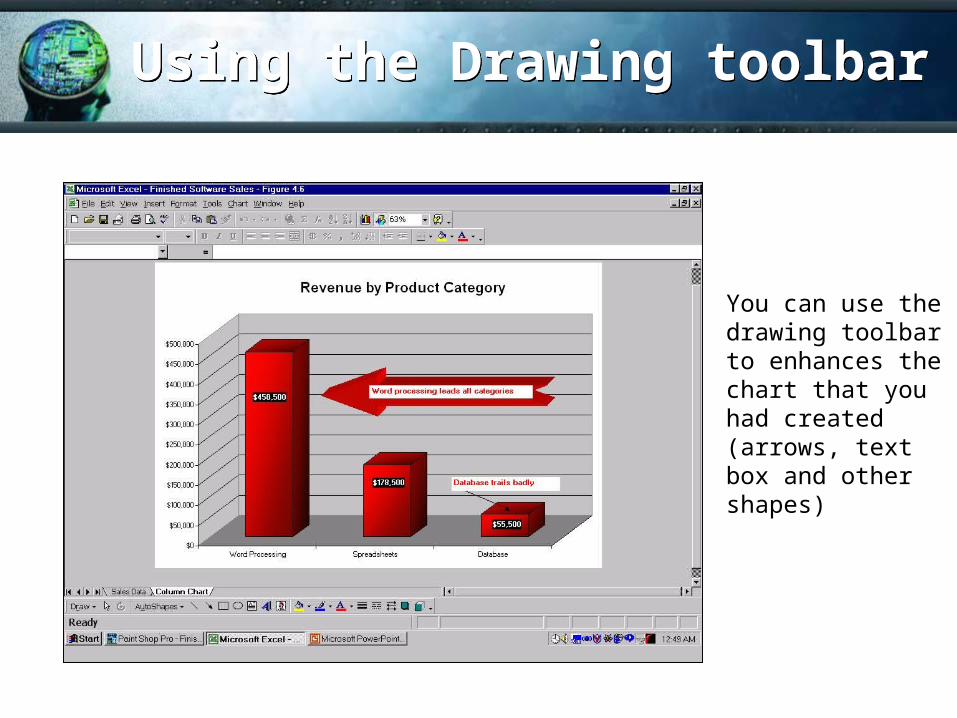
Using the Drawing toolbarUsing the Drawing toolbar
You can use the drawing toolbar to enhances the chart that you had created (arrows, text box and other shapes)
Multiple Data SeriesMultiple Data Series
• What message do you want chart to display ?
• Rows versus columns– If data series are in rows the Chart Wizard
will use first row for X axis and use first column for legend text
– If data series are in columns the Chart Wizard will use first column for X axis and use first row for legend text
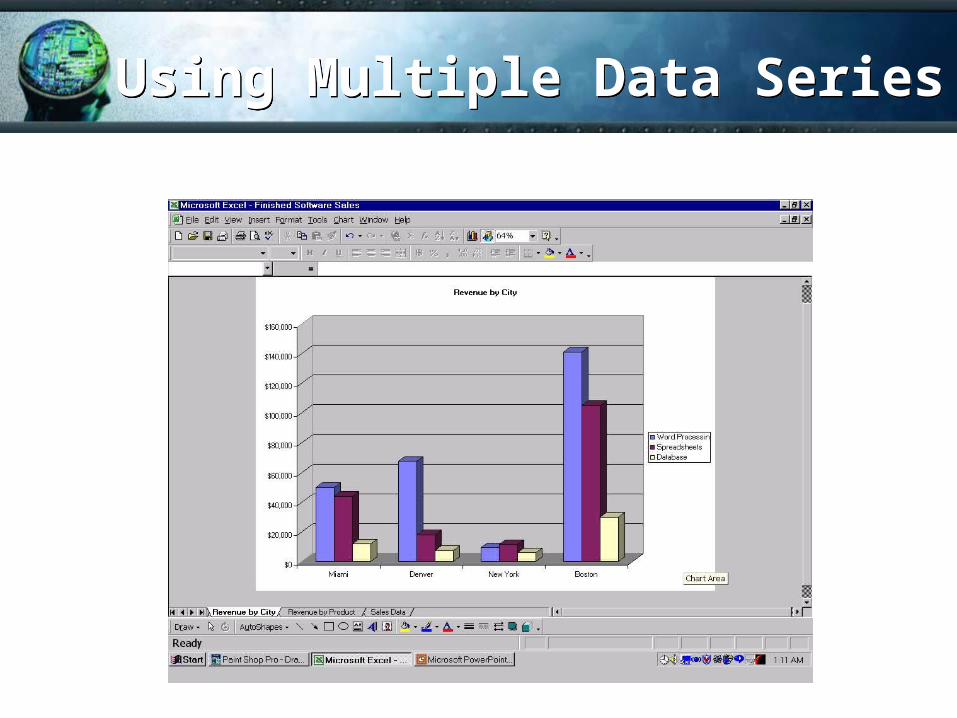
Using Multiple Data SeriesUsing Multiple Data Series
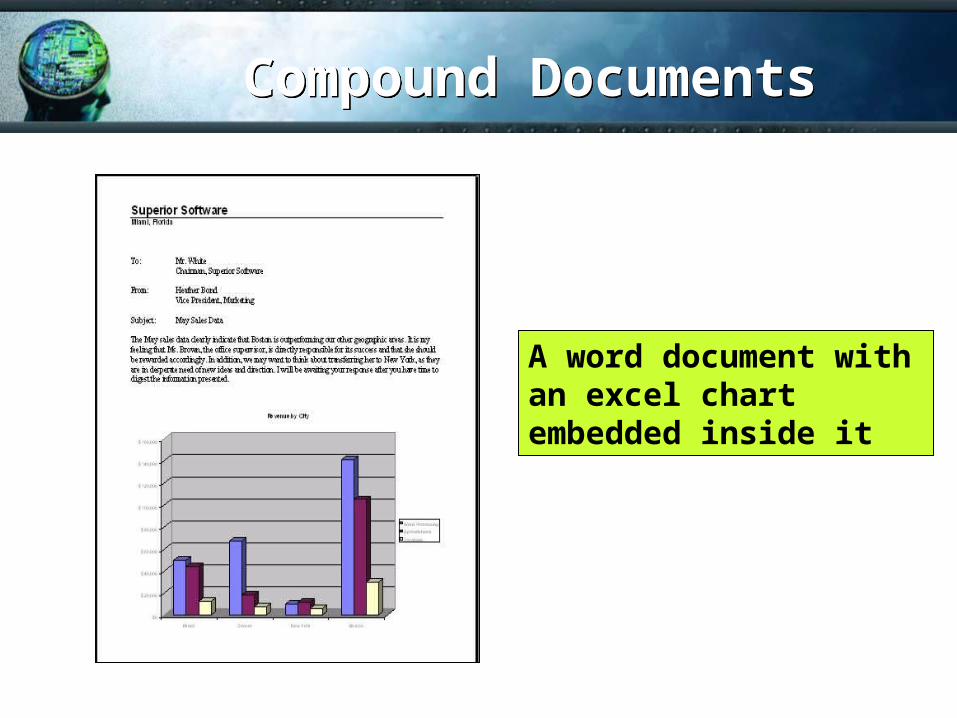
Compound DocumentsCompound Documents
A word document with an excel chart embedded inside it
Additional Chart InformationAdditional Chart Information
• Excel has 14 standard chart types on the Chart Wizard
• Line is used to display time-related information
• Combination uses two or more charts• Use Accurate Labels• Don’t add Dissimilar Quantities
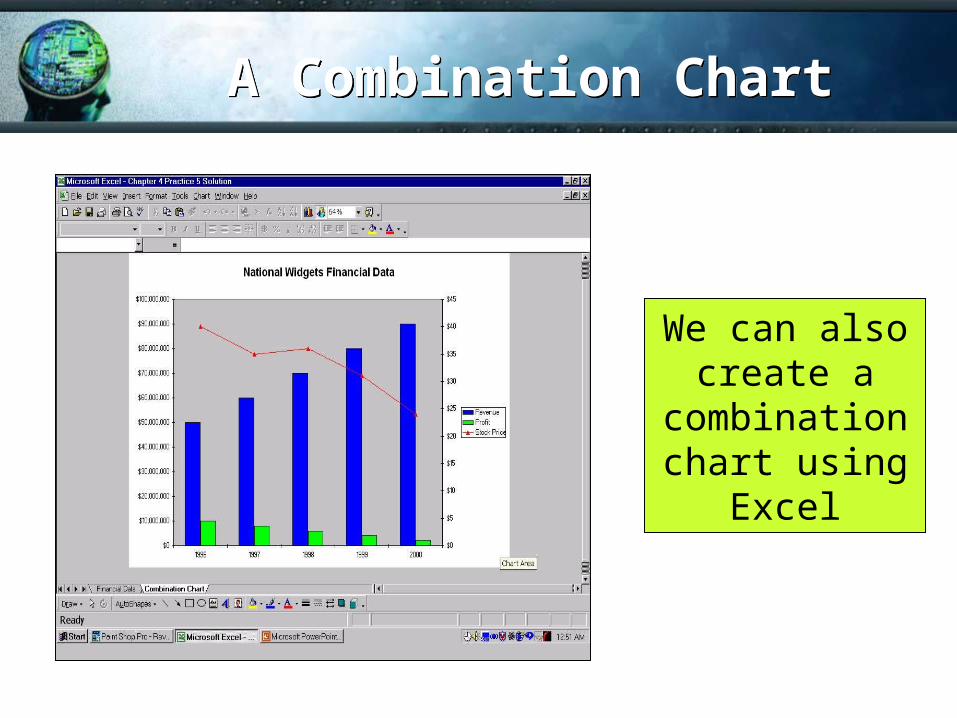
A Combination ChartA Combination Chart
We can also create a
combination chart using
Excel