Embed Size (px)
Citation preview

CONFIDENTIAL2.7.1 Summary of Biopharmaceutic Studies and Associated Analytical Methods
1
Module 2.7.1
Summary of Biopharmaceutic Studies and Associated Analytical Methods
Copyright 2012 ViiV Healthcare and the GlaxoSmithKline group of companies. All rights reserved. Unauthorized copying or use of this information is prohibited.

CONFIDENTIAL2.7.1 Summary of Biopharmaceutic Studies and Associated Analytical Methods
2
TABLE OF CONTENTS
PAGE
ABBREVIATIONS ...........................................................................................................3
1. BACKGROUND AND OVERVIEW ...........................................................................41.1. Conclusions ..................................................................................................41.2. Formulation Development.............................................................................51.3. In Vitro Dissolution Data .............................................................................10
1.3.1. Comparative of 2 x 25 mg Clinical Tablets and 1 x 50 mg Clinical Tablets, Phase III Formulation.........................................10
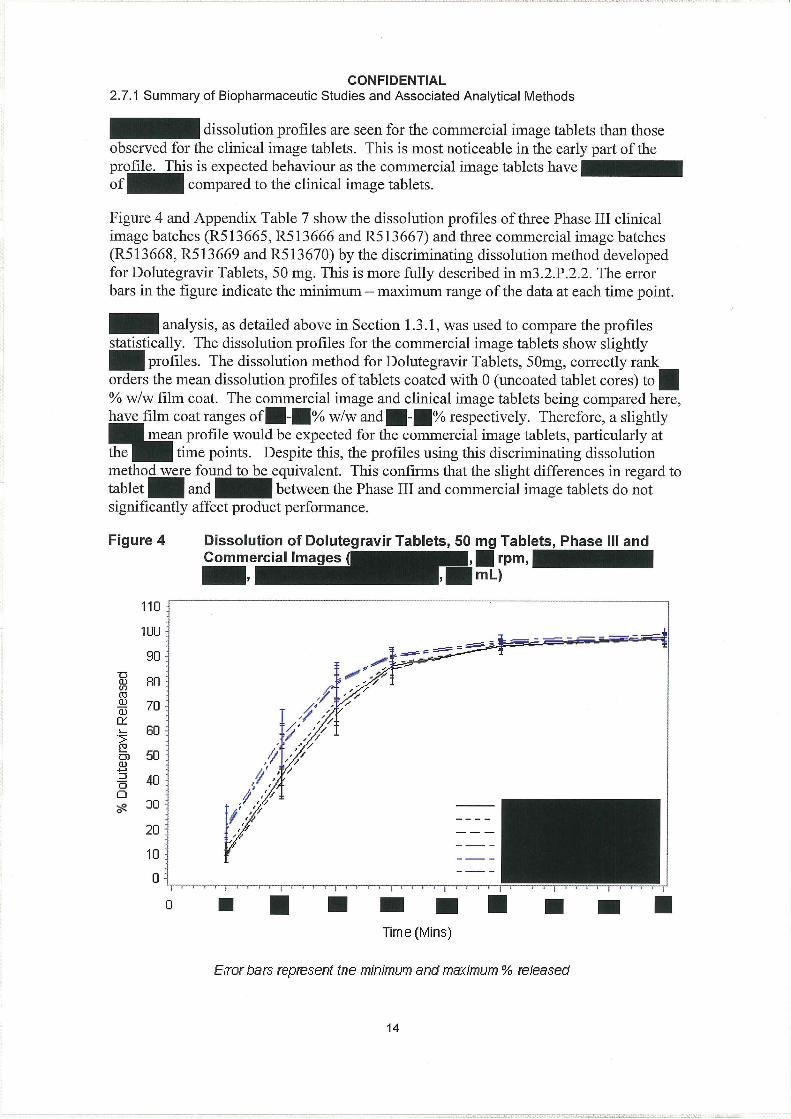
1.3.2. Comparison of Phase III Clinical Image and Commercial Image Tablets..............................................................................13
1.4. Analytical Methods......................................................................................171.4.1. Validation.....................................................................................171.4.2. Summary of Within Study Quality Control Sample Analysis .........18
2. SUMMARY OF RESULTS OF INDIVIDUAL STUDIES...........................................192.1. Relative Bioavailability ................................................................................19
2.1.1. ING111322 Relative bioavailability of DTG 10 mg oral tablet formulation vs oral suspension...........................................19
2.1.2. ING113068 Effect of particle size on bioavailability.....................202.2. Bioequivalence ...........................................................................................22
2.2.1. ING113674 Relative bioavailbility of three DTG tablet formulations and effect of food.....................................................22
2.3. Effect of Food on Bioavailability ..................................................................232.3.1. ING111322 Effect of food on the DTG 10 mg oral tablet
formulation...................................................................................232.3.2. ING112941 Effect of food on the DTG 25 mg tablet used
in Phase II studies .......................................................................242.3.3. ING113674 Effect of food on the 25 mg tablet formulation
selected for Phase III studies .......................................................252.4. Absolute Bioavailability ...............................................................................26
3. COMPARISON AND ANALYSES OF RESULTS ACROSS STUDIES ...................273.1. In vitro Dissolution and in vivo Bioavailability ..............................................273.2. Recommendation for Dosing Dolutegravir Relative to Food........................28
4. REFERENCES.......................................................................................................30

CONFIDENTIAL2.7.1 Summary of Biopharmaceutic Studies and Associated Analytical Methods
3
ABBREVIATIONS
API Active Pharmaceutical IngredientAUC Area under concentration-time curve
AUC(0-) Area under the concentration-time curve from time zero (pre-dose) extrapolated to infinite time
AUC(0-) Area under the concentration-time curve over the dosing interval
BCS Biopharmaceutics Classification SystemCI Confidence IntervalCmax Maximum observed concentration Cτ Pre-dose (trough) concentration at the end of the dosing intervalCV Coefficient of varianceDCS Developability Classification SystemDTG DolutegravirFaSSIF Fasted state simulated intestinal fluidGLS Geometric Least-Squaresh or hr Hour(s)IC50 50% inhibitory concentrationIV IntravenousHIV Human immunodeficiency virusLLQ Lower limit of quantificationMICRP Independent (multivariate) confidence region proceduremL milliliterPK Pharmacokinetict½ Terminal phase half-lifeτ Dosing intervaltmax Time of occurrence of Cmax
Trademark Information
Trademarks of ViiV Healthcare Trademarks not owned by ViiV Healthcare
NONE SASTurboIonSpray

CONFIDENTIAL2.7.1 Summary of Biopharmaceutic Studies and Associated Analytical Methods
4
1. BACKGROUND AND OVERVIEW
Dolutegravir (DTG) is an HIV integrase inhibitor (INI) which has been developed for treatment-naïve and treatment-experienced HIV-infected adults. Limited data on DTG in HIV-infected children ages 12 to < 18 are also included in the initial submission.
This document summarizes the pertinent biopharmaceutical characteristics of DTG immediate release formulations and supports the approval of Dolutegravir Tablets, 50mg, by describing:
Various formulations developed and used in clinical studies (Section 1.2);
In vitro dissolution profiles for various formulations (Section 1.3)
The relative bioavailability studies completed for the various DTG formulations used throughout the clinical development of the compound (Section 2)
The impact of food on the bioavailability of DTG tablet formulations (Section 2.3)
Bioanalytical methods used to determine DTG concentration in the biological samples collected in clinical studies are summarized in this module as well (Section 1.4).
Tablets manufactured at the commercial site were administered in the Phase III studies that demonstrated the safety and efficacy of DTG in HIV-infected subjects.
Data from clinical biopharmaceutics studies ING111322, ING112941, ING113068, and ING113674, along with chemistry, manufacturing and controls (CMC) and bioanalytical methods data, form the basis of the biopharmaceutical evaluation of DTG in this submission.
1.1. Conclusions
The conclusions from the biopharmaceutic evaluations are as follows:
All strengths and batches of DTG tablets (50 mg and 25 mg) used in clinical studies had consistent in vitro dissolution.
The bioanalytical methods used to measure concentrations of DTG in human plasma were sensitive, selective, accurate and reproducible. Stability of the analyte was demonstrated during sample processing and long-term storage.
The oral bioavailability of the tablet was less than that of a suspension with mean AUC(0-) decreased by 30% following administration of the tablet compared to the suspension formulation under the fasted condition. The rate of absorption of the drug from tablet was slower than suspension.
Changes in particle size did not have a significant impact on exposure. A formulation of un-micronized particles demonstrated similar exposure to the current tablet formulation (of micronized particles). These data support the particle size specification for the micronized API.

CONFIDENTIAL2.7.1 Summary of Biopharmaceutic Studies and Associated Analytical Methods
5
For DTG tablets, a 25 mg tablet with the Phase III formulation composition met the bioequivalence criteria with the 25 mg tablet used in the Phase II studies. A higher strength tablet of this formulation (50 mg tablet) was manufactured at the commercial site for use in Phase III clinical trials. This 50 mg tablet has the same % weight/weight composition but made at double the tablet weight of the 25 mg tablets used to establish bioequivalence to the Phase II product. The in-vitro dissolution profiles (3 media used) of the 50 mg tablets (Phase III formulation) compare closely to the profiles of two 25 mg tablets (Phase III composition) tested per dissolution vessel (i.e. total dose level = 50 mg).
Administration with food increases the exposure of DTG. Plasma DTG AUC(0-) increased by 33%, 41%, and 66% when DTG was administered with low fat, moderate fat and high fat food, respectively.
DTG can be taken with or without food based on the accumulated safety data in Phase IIb and III studies which permitted DTG dosing without restriction to food or food content.
DTG 50 mg tablets manufactured at the commercial site were administered in the Phase III studies that demonstrated the safety and efficacy of DTG in HIV-infected patients.
No pivotal bioequivalence study was required because the commercial formulation is identical to the Phase III clinical trial tablet formulation, differing only in the film coat color/level, and the degree of concavity of the tooling used to produce the tablets.
1.2. Formulation Development
DTG sodium, Form 1, is a non-hygroscopic, crystalline solid with suitable solid state stability and oral bioavailability. DTG sodium has a solubility of 3.2 mg/ml in water at 25C. In buffered solutions, across the physiological pH range 1-7, the solubility is significantly lower at, or below, 50 g/ml. The measured permeability is approximately 3 x 10⁻⁴ cm/sec. The combination of low solubility with high predicted permeability puts dolutegravir in BCS class II.
Particle size reduction of the DTG sodium (by micronisation) was selected at the start of its development based upon early data pharmacokinetic generated in dogs.
Dosage formulations and strengths administered in each of the clinical studies areprovided in Appendix Table 1. A summary of drug substance and drug product is provided in Appendix Table 2.
Initial Phase I studies for DTG sodium utilised a powder for reconstitution consisting of DTG sodium, hypromellose and sodium lauryl sulphate. Doses of up to 250 mg DTGwere administered in Phase I studies using this formulation. The composition is shown below in Table 1.

CONFIDENTIAL2.7.1 Summary of Biopharmaceutic Studies and Associated Analytical Methods
6
Table 1 Composition of Powder for Reconstitution
Ingredients Quantity Active
DTG sodium 2, 5, 10, 20, 25, 50, 100, 250 mg as free acidVehicle (mL) mL
Composition of Vehicle Quantity g
gg
Tablet formulations were then developed to provide 1 mg, 10 mg and 25 mg dose strengths for Phase II studies. These tablets contained: and
as , as a , as a , and as a . These tablets were used in Phase II studies
(ING111521, ING112276 and ING112961). Based on ING112276, a dose ranging study in treatment-naive HIV-infected subjects, a dose of 50 mg dolutegravir was selected for Phase III studies. The composition of these tablets is shown in Table 2.

CONFIDENTIAL2.7.1 Summary of Biopharmaceutic Studies and Associated Analytical Methods
7
Table 2 Composition of Dolutegravir Tablets, mg, mg and mg for Phase II Studies ING111521, ING112276/SPRING-1 and ING112961/VIKING-1
Component Quantity [mg] Function Reference to Standard
Tablet Strength(mg free acid/tablet)
mg mg mg
Dolutegravir sodium a b c Active
q.s. d
( )q.s. d
( )q.s. d
( )USP or Ph Eur
USNF or Ph Eur
USP or Ph EurUSNF or Ph Eur
Purified Water e q.s. q.s. q.s. Vehicle USP or Ph Eur
USNF or Ph Eur USNF or Ph Eur
Weight of Core Tablet – –
Film coatingSupplier
Purified Water e q.s. q.s. q.s. Vehicle USP or Ph Eur
Total Coated Tablet Weight
– –
Trace f Trace f Trace f USP or Ph Eura. Equivalent to mg dolutegravir free acid. Actual amount may vary based on the purity and water content factor
for each batch of drug substance.b. Equivalent to mg dolutegravir free acid. Actual amount may vary based on the purity and water content factor
for each batch of drug substance.c. Equivalent to mg dolutegravir free acid. Actual amount may vary based on the purity and water content factor
for each batch of drug substanced.
e. Purified water is removed during processing.f. The amount of is approximately mg/Tablet. Its use in the manufacturing process is optional.
During Phase II, was identified as a more optimal for long-term stability compared to the used in the Phase II tablet formulation. Consequently, a reformulated tablet was developed for Phase III studies. Two variations of the new formulation (both mg tablets) were assessed against the Phase II tablet formulation ( mg tablet) in a relative bio-availability study (ING113674). The composition of these new formulations is shown in Table 3.

CONFIDENTIAL2.7.1 Summary of Biopharmaceutic Studies and Associated Analytical Methods
8
Table 3 Composition of Dolutegravir Tablets, mg for Relative Bio-availability Study (ING113674)
Component Quantity [mg/tablet] Function Reference to Standard
Tablet Strength(mg free acid/tablet)
mgFormulation 1
(AW)
mgFormulation 2
(AX)
DTG sodiuma Active
b q.s.( )
q.s.( )
USP or Ph Eur
USNF or Ph Eur
USP or Ph Eur
USNF or Ph Eur
Purified Waterc q.s. q.s. Vehicle USP or Ph Eur
USNF or Ph Eur
USNF or Ph Eur
Weight of Core Tablet – –
Film coating
Supplier
Purified Waterc q.s. q.s. Vehicle USP or Ph Eur
Total Coated Tablet Weight – –
a. Equivalent to mg GSK1349572B (free acid). Actual amount may vary based on the purity and water content factor for each batch of drug substance.
b.
c. Purified water is removed during processing.
In this study, x mg tablets were dosed for each formulation i.e. assessing at a 50 mg total dose. Both new formulations were found to be bioequivalent to the earlier Phase II formulation. The variant with the lower overall tablet weight (Formulation 1) was selected to progress into Phase III with the tablet core compression weight set to deliver 50 mg of dolutegravir in a single tablet.
The composition of the final Phase III tablet is shown in Table 4. API is utilised in dolutegravir tablets, 50 mg. The for this API to be used in the

CONFIDENTIAL2.7.1 Summary of Biopharmaceutic Studies and Associated Analytical Methods
9
commercial formulation is supported by data obtained in study ING113068 Section 2.1.2).
The formulation used in pivotal Phase III studies is identical to the commercial formulation with the following exceptions, which would not be expected to significantly affect product performance:
The Phase III tablet is and the commercial tablet is
The Phase III tablet is film coated with a (target coat quantity is % w/w) and the commercial tablet is film coated with a
(target coat quantity is % w/w).
Table 4 Composition of Dolutegravir Tablets, 50 mg for Phase III Clinical Studies
Component Quantity mg/tablet
Strength (as free base) 50 mg
Dolutegravir sodiuma 52.6
d-Mannitol
Microcrystalline cellulose
Povidone
Sodium starch glycolate
Purified waterb qs
Sodium starch glycolate
Sodium stearyl fumarate
Aqueous Film Coatc
Purified waterb q.s.
Total (mg/tablet)d
a. The amount of dolutegravir sodium salt required to provide the label claim of dolutegravir (free base) is calculated based on the salt conversion factor 1.0524.
b. Purified water is removed during drying process.c. Film coat used for commercial tablets are d.
CONFIDENTIAL2.7.1 Summary of Biopharmaceutic Studies and Associated Analytical Methods
10
1.3. In Vitro Dissolution Data
In vitro dissolution data for dolutegravir mg, mg ( and GSK formulations) and mg tablets used in Phase III studies and for the statistical comparisons referred to below are presented in Appendix Table 3, Appendix Table 4, Appendix Table 5, Appendix Table 6, Appendix Table 7, Appendix Table 8, Appendix Table 9, Appendix Table 10, and Appendix Table 11. These data demonstrate comparable performance across batches and consistency of release from tablet batches used to support clinical trials.
A single-point dissolution specification of Q = % at minutes (for tablets used in Phase I/II) and Q = % at minutes (for tablets used in Phase III) has been applied to clinical trial batches.
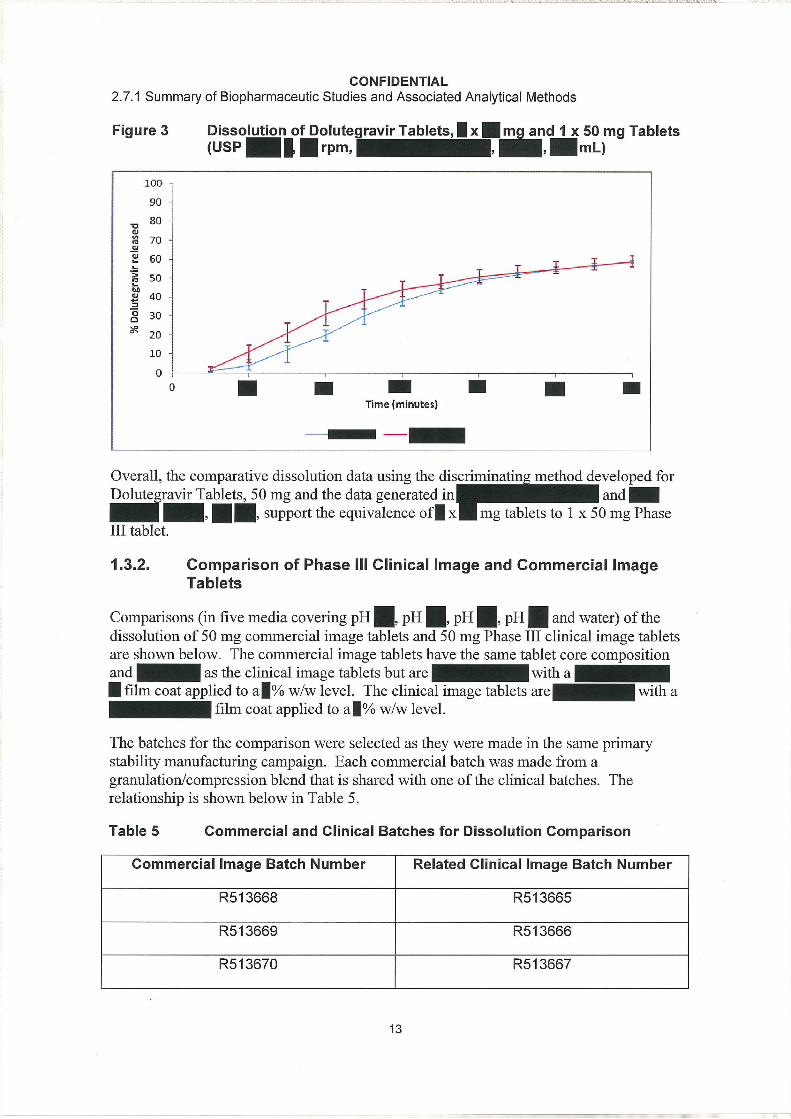
Comparative dissolution in three media, using appropriate statistical tests, were used to show the equivalence of the 50 mg Phase III tablet to the x mg tablets (same % w/w composition but half the compression weight) used in ING113674.
1.3.1. Comparative of x mg Clinical Tablets and 1 x 50 mg Clinical Tablets, Phase III Formulation
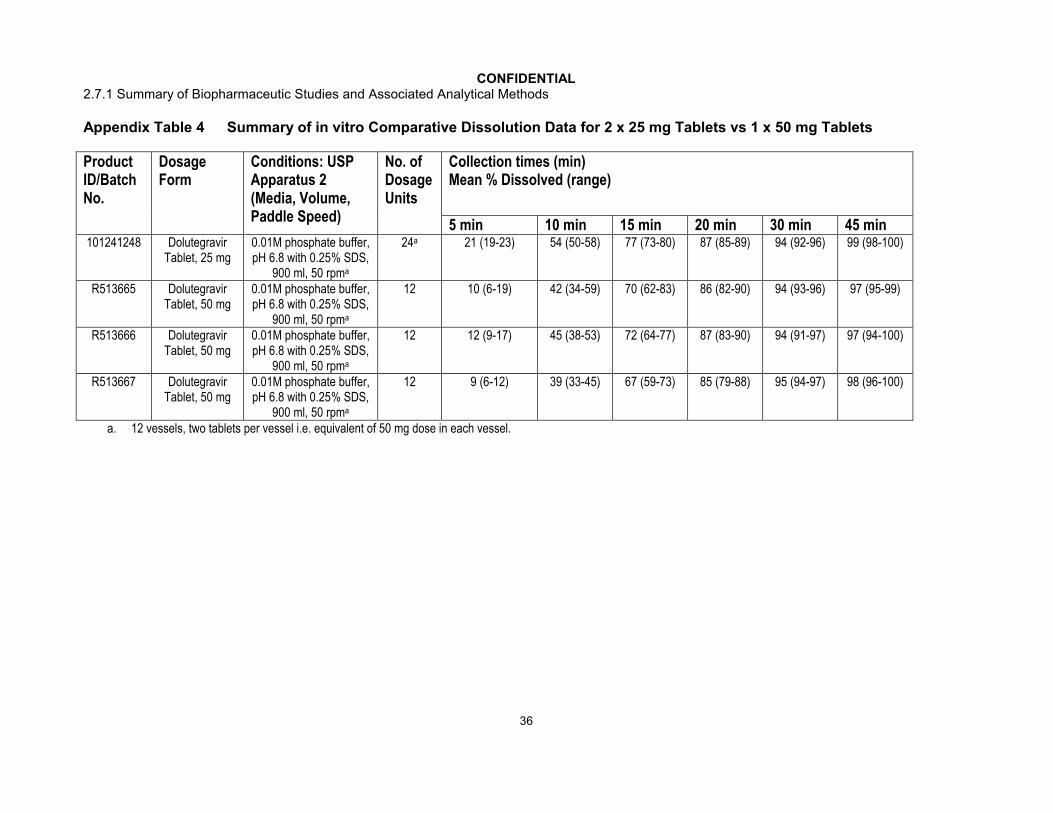
Comparative dissolution data for the Phase III and Commercial tablets using the discriminating method established for Dolutegravir Tablets, 50 mg are shown in Figure 1and Appendix Table 4. This shows the dissolution profiles of x mg (Batch 101241248) and 1 x 50 mg Phase III tablets (R513665, R513666 and R513667).
The equivalence of the batch dissolution profiles was determined using a ( ). A model independent
approach using a similarity factor (F2) was not employed because or dissolution time points were not available, having accounted for relevant criteria (Food and Drug Administration, 1997).


CONFIDENTIAL2.7.1 Summary of Biopharmaceutic Studies and Associated Analytical Methods
18
20 to 20,000 ng/mL by , , , , to provide continuing support during Phase III development.
The unbound dolutegravir concentrations were measured in phosphate buffered saline following equilibrium dialysis of plasma collected from hepatically impaired (ING113097) and renally impaired (ING113125) subjects and in plasma from patients who volunteered to participate in cerebrospinal fluid sampling (ING116070). The assay was validated with a calibration range in phosphate buffered saline from 1 to 1000 ng/mL by BST PTS DMPK at GSK, RTP, North Carolina.
The measurement of dolutegravir concentrations in cerebrospinal fluid followed the analytical method used for plasma matrix and was validated over a range of 1 to 1000 ng/mL by , , , .
The bioanalytical method for the measurement of GSK2832500 (the ether glucuronide metabolite of dolutegravir; M3) in plasma samples collected from renally impaired subjects (Study ING113125) was validated with reference standard material by BST PTS DMPK at GSK, RTP, North Carolina. The method was based on protein precipitation, followed by HPLC-MS/MS analysis over a calibration range of 1 to 1000 ng/mL.
In some studies, the concentrations of co-administered drugs were measured by using validated bioanalytical methods. The measurements of atazanavir, darunavir, efavirenz, etravirine, lopinavir, midazolam, ritonavir, and tenofovir were conducted by BST PTS DMPK (GSK). ( , ) conducted the measurement of amprenavir,
( , ) conducted the measurements of R-methadone, S-methadone, ethinyl estradiol, norelgestromin, and telaprevir, ( , UK) conducted the measurements of iohexol and p-aminohippurate, and
( , P.R. China) performed the measurement of rilpivirine.
A summary of the validation data that supported application of the bioanalytical methods to each pharmacokinetic study during the development of dolutegravir is summarized in Appendix Table 12. All of the methods were validated to perform to the same, predefined acceptance criteria for precision and accuracy.
1.4.2. Summary of Within Study Quality Control Sample Analysis
Quality Control samples were analyzed with each batch of study samples. Performance results of the bioanalytical methods used for each study were generated from bioanalytical runs meeting the same run acceptance criteria based upon the predefined requirements for QC performance that no more than one-third of the QC results and 50% from each QC concentration were to deviate from the nominal concentration by more than 15%. The overall precision and accuracy of the assays for each study are shown inAppendix Table 13. Across 34 GSK directed studies, the overall precision (combined within run and between run) for dolutegravir in plasma ranged from 1.5% to 13.9% with a bias that ranged from -8.7% to 12.5%.

CONFIDENTIAL2.7.1 Summary of Biopharmaceutic Studies and Associated Analytical Methods
19
2. SUMMARY OF RESULTS OF INDIVIDUAL STUDIES
A powder for oral suspension formulation of DTG was administered in the first time in human study and four other Phase I studies. DTG tablets of 1 mg, 10 mg, and 25 mg strengths were developed and administered in Phase I studies, as well as in the three Phase II studies ING111521, ING112276/SPRING 1 (10 mg and 25 mg strengths), and ING112961/VIKING 1 (25 mg strength). The bioavailability of the 10 mg tablet relative to the powder for oral suspension was assessed in Study ING111322.
Bioequivalence was established between a 25 mg tablet formulation [Formulation Code AW] and the 25 mg tablet formulation administered in Phase II studies [Formulation Code AP] in Study ING113674. Subsequently, a tablet of the same formulation but at a dose strength of 50 mg [Formulation Code BC] was administered in Phase III clinical studies.
The effect of food on the bioavailability of DTG was assessed with the 10 mg tablet (Study ING111322), the 25 mg tablet formulation administered in Phase II studies (Study ING112941), and the 25 mg tablet of the formulation administered in Phase III studies (Study ING113674). The impact of drug substance particle size on the bioavailability of DTG was assessed in Study ING113068.
A tabular summary of the study design, objectives, and treatment arms in each of the biopharmaceutical studies conducted with dolutegravir formulations is provided inAppendix Table 14 and a tabular summary of the pharmacokinetic data is provided inAppendix Table 15. In cases where studies had multiple objectives and study arms (ie, biopharmaceutics in Part A and drug interaction in Part B), only the data relating to the biopharmaceutics are provided in this module; the data from non-biopharmaceutics are provided in m2.7.2.
Narrative descriptions of the individual biopharmaceutical studies for DTG formulations are provided below. In all studies, DTG pharmacokinetic parameters were determined using standard non-compartmental methods. In the clinical study reports the summary statistics were presented in a variety of ways. For consistency within module 2.7.1, unless otherwise stated, the summary statistics for Cmax and AUC(0-) are presented as geometric mean and between subject coefficient of variation (CVb%), where CVb% was calculated as standard deviation / mean. Statistical comparisons are reported ratios of the geometric means and 90% confidence intervals (CI) and were calculated based on log transformed parameters.
2.1. Relative Bioavailability
2.1.1. ING111322 Relative bioavailability of DTG 10 mg oral tablet formulation vs oral suspension
Study title: A Double-Blind, Randomized, Placebo-Controlled, Repeat Dose Escalation Study to Investigate the Safety, Tolerability and Pharmacokinetics of DTG Followed by A Single Dose, Randomized, 3-Period, Balanced, Crossover Study to Assess the Relative
CONFIDENTIAL2.7.1 Summary of Biopharmaceutic Studies and Associated Analytical Methods
20
Bioavailability of Two Formulations and Food Effect on DTG in Healthy Male and Female Subjects
Location of report: m5.3.3.1
Methods: Part 1 of this study was a Phase I, double-blind, randomized, placebo-controlled, repeat dose escalation study of DTG in healthy subjects. One cohort of subjects received the cytochrome P450 3A substrate, midazolam, in addition to DTG. Data from Part 1 are summarized in m2.7.2.
Part 2 study ING111322 was an open-label, randomized, single dose, three-period, six sequence, balanced crossover study to assess the relative bioavailability of the DTG investigational tablet formulation (10 mg tablet x 2) compared to a DTG suspension formulation (20 mg) under fasted conditions and the effect of a moderate fat meal on the pharmacokinetics of the DTG investigational tablet in eligible healthy male or female subjects. There was a washout of at least 5 days between treatments. Serial PK samples were collected over 72 hours in each treatment period. The food effect results are summarized in Section 2.3.1.
Results from Part 2:
Following single dose administration under fasted conditions, the DTG 10 mg oral tablet formulation delivered 30% lower geometric mean plasma DTG AUC(0-) and 42% lower geometric mean Cmax (Table 6). Plasma DTG concentrations were quantifiable within 0.25 hours after oral tablet and suspension dosing, but median tmax was delayed from 0.75 hours with the oral suspension to 2.5 hours for the tablet, suggesting a prolonged absorption time for the tablet. Geometric mean plasma DTG half-life (t½ was similar between treatments, 13.3 hours for tablet and 13.5 hours for oral suspension.
Table 6 Summary of plasma dolutegravir PK parameters and treatment comparisons to assess relative bioavailability in study ING111322.
Plasma DTG PK Parameter
20 mg Oral Suspension Fasted
(Treatment A)N=12
20 mg Oral Tablet Fasted
(Treatment B)N=12
Tablet/Suspension(Treatment B/Treatment A)
N=12
AUC(0-)(g.h/mL)
33.5(28)
23.5(38)
0.700(0.642, 0.763)
Cmax(g/mL)
2.24(17)
1.30(30)
0.583(0.529, 0.643)
Source Data: Study ING111322, Table 11.19 and Table 11.20geometric mean (CVb%) for PK summary and GLS mean ratio (90% CI) for treatment comparisonTreatment A = 20mg DTG suspension administered under fasted conditionsTreatment B = 20mg as DTG 10mg tablet x 2 administered under fasted conditions
2.1.2. ING113068 Effect of particle size on bioavailability
Study title: Phase I, open label, two period, study to evaluate the effects of fosamprenavir/ritonavir (FPV/RTV) on DTG pharmacokinetics and a phase I, randomized, three-way crossover study to evaluate the relative bioavailability of three
CONFIDENTIAL2.7.1 Summary of Biopharmaceutic Studies and Associated Analytical Methods
21
tablet variants made using micronized, un-micronized and intermediate particle sizes of DTG in healthy adult subjects (ING113068).
Location of report: m5.3.3.4
Methods: This was a single-centre, two-part, open-label, study in healthy adult subjects. In Part A, 12 subjects received DTG 50 mg q24 h for 5 days followed by DTG 50 mg q24 h in combination with FPV/RTV 700/100 mg q12 h for 10 days. There was no washout between treatment periods.
Data from Part A are summarized in m2.7.2.
In Part B, 15 subjects received DTG 50 mg using 25 mg tablets with differing particle size drug substance under fasted conditions. Part B was a randomized, open label, 3-way cross over treatment design. Subjects were randomized to a single dose of the referencetablet formulation containing micronized drug substance and 2 new tablet variants, one containing un-micronized drug substance and one containing an intermediate particle size drug substance, in each of three periods. There were six treatment sequences (CDE, CED, DCE, DEC, ECD, EDC). There was a 5 day washout between doses in Part B. Serial PK samples were collected over 48 hours in each treatment period.
The three tablet variants in this study each had been produced to exactly the same formulation and used practically equivalent manufacturing processes. They differed only in the particle size of the DTG drug substance. The reference tablet was produced using micronized drug substance having a particle size X10 =0.73 m, X50 = 2.0 m and X90 = 5.7 m. The first test tablet was produced using non-micronized drug substance having a particle size X10 = 8.3 m, X50 = 25.6 m and X90 = 66.5 m. The second test tablet was produced using micronized drug substance which was processed using conditions specifically set so that the resulting drug substance had a larger particle size. For this material the particle size X10 = 1.1 m, X50 = 8.6 m and the X90 = 26.3 m, which meant that it was positioned approximately mid-way between the particle sizes of the two other drug substances used to produce tablets.
By determining the pharmacokinetic parameters achieved with the two test batches as compared to the reference tablet batch, the study would evaluate whether particle size changes would translate into a difference in bioavailability in humans. The data obtained from all three batches was used to help assign an appropriate particle size specification for the drug substance to be used for producing commercial product.
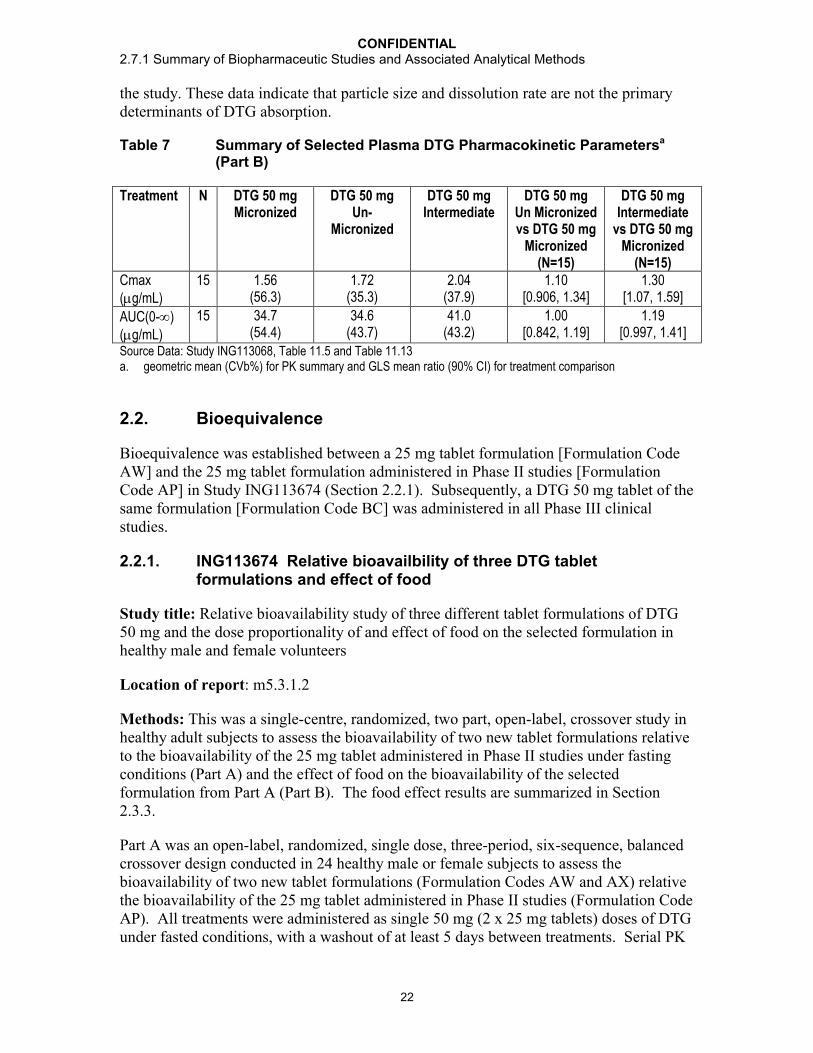
Results: The results of the statistical comparisons showed that plasma exposure of DTG were similar between un-micronized and the reference tablet (micronized) formulationexcept a higher Cmax using the un-micronized formulation. Plasma exposure following administration of intermediate particle size DTG formulation was slightly higher compared to those from current tablet formulation: AUC(0-) and Cmax, were 19% and30%, higher than those from the reference tablet formulation (Table 7).
This study was not powered to demonstrate bioequivalence. The 10% higher Cmax for the larger material is not believed to be attributed to anything other than PK variability in
CONFIDENTIAL2.7.1 Summary of Biopharmaceutic Studies and Associated Analytical Methods
22
the study. These data indicate that particle size and dissolution rate are not the primary determinants of DTG absorption.
Table 7 Summary of Selected Plasma DTG Pharmacokinetic Parametersa
(Part B)
Treatment N DTG 50 mg Micronized
DTG 50 mg Un-
Micronized
DTG 50 mg Intermediate
DTG 50 mg Un Micronized vs DTG 50 mg
Micronized(N=15)
DTG 50 mg Intermediate
vs DTG 50 mg Micronized
(N=15)Cmax (g/mL)
15 1.56(56.3)
1.72(35.3)
2.04(37.9)
1.10[0.906, 1.34]
1.30[1.07, 1.59]
AUC(0-) (g/mL)
15 34.7(54.4)
34.6(43.7)
41.0(43.2)
1.00[0.842, 1.19]
1.19[0.997, 1.41]
Source Data: Study ING113068, Table 11.5 and Table 11.13a. geometric mean (CVb%) for PK summary and GLS mean ratio (90% CI) for treatment comparison
2.2. Bioequivalence
Bioequivalence was established between a 25 mg tablet formulation [Formulation Code AW] and the 25 mg tablet formulation administered in Phase II studies [Formulation Code AP] in Study ING113674 (Section 2.2.1). Subsequently, a DTG 50 mg tablet of the same formulation [Formulation Code BC] was administered in all Phase III clinical studies.
2.2.1. ING113674 Relative bioavailbility of three DTG tablet formulations and effect of food
Study title: Relative bioavailability study of three different tablet formulations of DTG 50 mg and the dose proportionality of and effect of food on the selected formulation in healthy male and female volunteers
Location of report: m5.3.1.2
Methods: This was a single-centre, randomized, two part, open-label, crossover study in healthy adult subjects to assess the bioavailability of two new tablet formulations relative to the bioavailability of the 25 mg tablet administered in Phase II studies under fasting conditions (Part A) and the effect of food on the bioavailability of the selected formulation from Part A (Part B). The food effect results are summarized in Section 2.3.3.
Part A was an open-label, randomized, single dose, three-period, six-sequence, balanced crossover design conducted in 24 healthy male or female subjects to assess the bioavailability of two new tablet formulations (Formulation Codes AW and AX) relative the bioavailability of the 25 mg tablet administered in Phase II studies (Formulation Code AP). All treatments were administered as single 50 mg (2 x 25 mg tablets) doses of DTG under fasted conditions, with a washout of at least 5 days between treatments. Serial PK

CONFIDENTIAL2.7.1 Summary of Biopharmaceutic Studies and Associated Analytical Methods
23
samples were collected over 48 hours in each treatment period. DTG PK parameters were estimated using non-compartmental methods.
Results: The results of the analysis (Table 8) showed that the 2 test tablet formulations met the criteria for bioequivalence with the reference (Phase IIb) tablet formulation. New formulation 1 (AW) was taken into Part B of the study due to its smaller tablet size and lower inter-subject variability.
Table 8 Summary of Selected Plasma DTG Pharmacokinetic Parametersa
(Relative Bioavailability)
Plasma DTG PK Parameter
DTG tabletb
50 mg [AP]N=22
DTG tabletb
50 mg [AW]N=22
DTG tabletb
50 mg [AX]N=22
DTG AW vs DTG 50 mg AP
(n=22)
DTG AX vs DTG 50 mg AP
(n=22)
AUC(0-)(g.h/mL)
53.2(34)
50.6(27)
53.7(34)
0.958[0.871, 1.05]
1.02[0.923, 1.12]
Cmax(g/mL)
2.67(35)
2.64(30)
2.77(32)
0.995[0.905, 1.10]
1.05[0.953, 1.15]
Source Data: Study ING113674, Table 11.2 and Table 11.4a. geometric mean (CVb%) for PK summary and GLS mean ratio (90% CI) for treatment comparisonb. dose administered as 2 x 25 mg tablet
No bioequivalence studies have been conducted with DTG after the start of Phase III studies. There were no changes in formulation during the conduct of Phase III.
2.3. Effect of Food on Bioavailability
2.3.1. ING111322 Effect of food on the DTG 10 mg oral tablet formulation
Study title: A Double-Blind, Randomized, Placebo-Controlled, Repeat Dose Escalation Study to Investigate the Safety, Tolerability and Pharmacokinetics of DTG Followed by A Single Dose, Randomized, 3-Period, Balanced, Crossover Study to Assess the Relative Bioavailability of Two Formulations and Food Effect on DTG in Healthy Male and Female Subjects
Location of report: m5.3.3.1
Methods: Part 1 of this study was a Phase I, double-blind, randomized, placebo-controlled, repeat dose escalation study of DTG in healthy subjects. One cohort of subjects received the cytochrome P450 3A substrate, midazolam, in addition to DTG. Data from Part 1 are summarized in m2.7.2.
Part 2 of this study was an open-label, randomized, single dose, three-period, balanced crossover study to assess the relative bioavailability of the DTG investigational tablet (10 mg tablet x 2) compared to a suspension formulation (20 mg) and the effect of a moderate fat meal (30% fat / 669 calories) on pharmacokinetics of DTG investigational tablet in eligible healthy male or female subjects. Serial PK samples were collected over 72 hours in each treatment period. The relative bioavailability results of the tablet to the suspension formulation in the fasting state is summarized in Section 2.1.1.
CONFIDENTIAL2.7.1 Summary of Biopharmaceutic Studies and Associated Analytical Methods
24
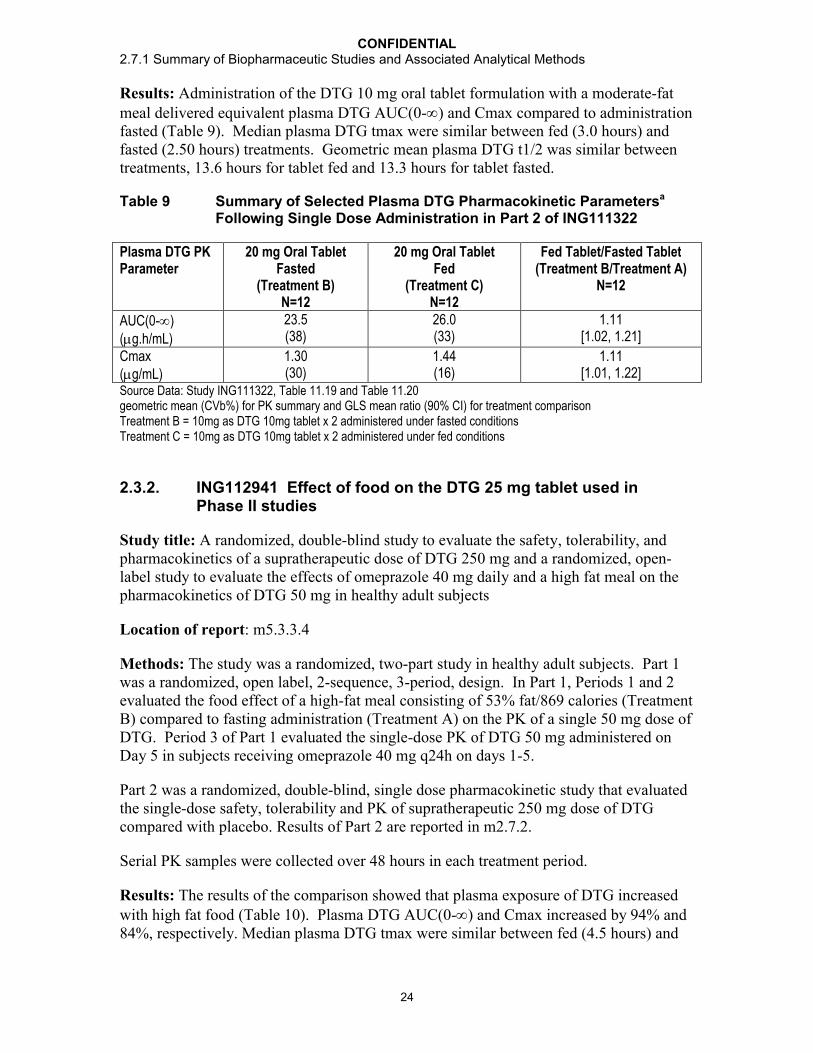
Results: Administration of the DTG 10 mg oral tablet formulation with a moderate-fat meal delivered equivalent plasma DTG AUC(0-) and Cmax compared to administration fasted (Table 9). Median plasma DTG tmax were similar between fed (3.0 hours) and fasted (2.50 hours) treatments. Geometric mean plasma DTG t1/2 was similar between treatments, 13.6 hours for tablet fed and 13.3 hours for tablet fasted.
Table 9 Summary of Selected Plasma DTG Pharmacokinetic Parametersa
Following Single Dose Administration in Part 2 of ING111322
Plasma DTG PK Parameter
20 mg Oral TabletFasted
(Treatment B)N=12
20 mg Oral Tablet Fed
(Treatment C)N=12
Fed Tablet/Fasted Tablet(Treatment B/Treatment A)
N=12
AUC(0-)(g.h/mL)
23.5(38)
26.0(33)
1.11[1.02, 1.21]
Cmax(g/mL)
1.30(30)
1.44(16)
1.11[1.01, 1.22]
Source Data: Study ING111322, Table 11.19 and Table 11.20geometric mean (CVb%) for PK summary and GLS mean ratio (90% CI) for treatment comparisonTreatment B = 10mg as DTG 10mg tablet x 2 administered under fasted conditionsTreatment C = 10mg as DTG 10mg tablet x 2 administered under fed conditions
2.3.2. ING112941 Effect of food on the DTG 25 mg tablet used in Phase II studies
Study title: A randomized, double-blind study to evaluate the safety, tolerability, and pharmacokinetics of a supratherapeutic dose of DTG 250 mg and a randomized, open-label study to evaluate the effects of omeprazole 40 mg daily and a high fat meal on the pharmacokinetics of DTG 50 mg in healthy adult subjects
Location of report: m5.3.3.4
Methods: The study was a randomized, two-part study in healthy adult subjects. Part 1 was a randomized, open label, 2-sequence, 3-period, design. In Part 1, Periods 1 and 2 evaluated the food effect of a high-fat meal consisting of 53% fat/869 calories (Treatment B) compared to fasting administration (Treatment A) on the PK of a single 50 mg dose of DTG. Period 3 of Part 1 evaluated the single-dose PK of DTG 50 mg administered on Day 5 in subjects receiving omeprazole 40 mg q24h on days 1-5.
Part 2 was a randomized, double-blind, single dose pharmacokinetic study that evaluated the single-dose safety, tolerability and PK of supratherapeutic 250 mg dose of DTGcompared with placebo. Results of Part 2 are reported in m2.7.2.
Serial PK samples were collected over 48 hours in each treatment period.
Results: The results of the comparison showed that plasma exposure of DTG increased with high fat food (Table 10). Plasma DTG AUC(0-) and Cmax increased by 94% and 84%, respectively. Median plasma DTG tmax were similar between fed (4.5 hours) and

CONFIDENTIAL2.7.1 Summary of Biopharmaceutic Studies and Associated Analytical Methods
25
fasted (4.0 hours) treatments. Geometric mean plasma DTG t1/2 was similar between treatments, 13.9 hours for tablet fed and 14.4 hours for tablet fasted.
Table 10 Summary of DTG Pharmacokinetic Parameters and Treatment Comparison for the Effect of Food in ING112941
Plasma DTG PK Parameter
50 mg (2x25 mg) Oral Tablet Fasted
(Treatment A)N=12
50 mg (2x25 mg) Oral Tablet Fed(Treatment B)
N=12
Fed Tablet/Fasted Tablet(Treatment B/Treatment A)
N=12
AUC(0-)(g.h/mL)
34.7(57)
67.2(24)
1.94 [1.63, 2.30]
Cmax(g/mL)
1.84(44)
3.39(17)
1.84 [1.55, 2.19]
Source Data: Study ING112941, Table 11.3 and 11.4geometric mean (CVb%) for PK summary and GLS mean ratio (90% CI) for treatment comparisonTreatment A = 10mg as DTG 10mg tablet x 2 administered under fasted conditionsTreatment B = 10mg as DTG 10mg tablet x 2 administered under fed conditions
2.3.3. ING113674 Effect of food on the 25 mg tablet formulation selected for Phase III studies
Study title: Relative bioavailability study of three different tablet formulations of DTG50 mg and the Dose Proportionality of and Effect of Food on the Selected Formulation in healthy male and female volunteers
Location of report: m5.3.1.2
Methods: This was a single-centre, randomized, two part, open-label, crossover study in healthy adult male and female subjects. In Part A, 24 subjects received DTG 50 mg as a single dose in three formulations under fasted conditions with a 5 day washout between formulations (see Section 2.2.1). In Part B, 18 subjects received the selected DTG 50 mg from Part A with either a low, moderate or high fat meal.
Part B was an open-label, randomized, single dose, three-period, six-sequence, balanced crossover design in 18 of the 24 healthy male or female subjects who completed Part A to evaluate the effect of food on the bioavailability of the selected formulation (Formulation Code AW). All treatments were administered as single 50 mg (2 x 25 mg tablets) doses of DTG under fed conditions, including low-fat, moderate-fat, and high-fat meals, with a washout of at least 5 days between treatments. The low-fat meal was comprised of approximately 300 kcal and 7% fat, the moderate fat meal was comprised of approximately 600 kcal and 30% fat, and the high-fat meal was comprised of approximately 870 kcal and 53% fat.
Serial PK samples were collected over 48 hours in each treatment period. The bioequivalence results are summarized in Section 2.3.3.
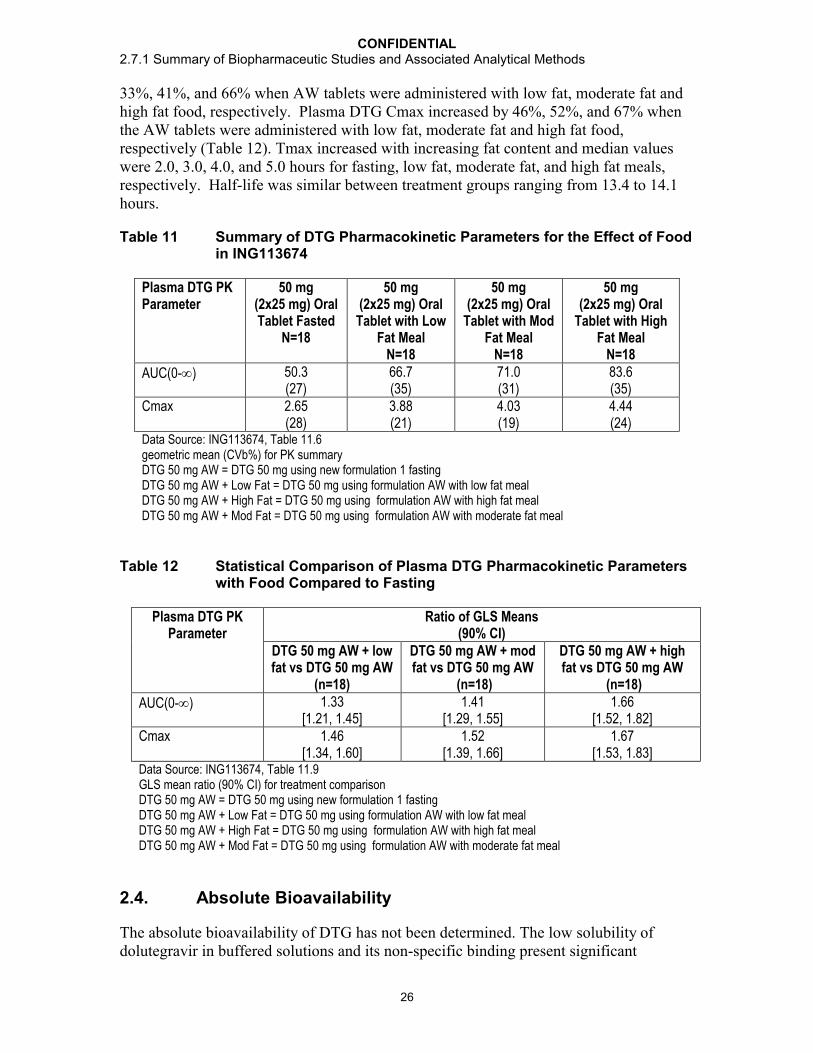
Results: The selected DTG formulation from Part A (AW) with food resulted in increases in plasma DTG exposures (Table 11). Plasma DTG AUC(0-) increased by
CONFIDENTIAL2.7.1 Summary of Biopharmaceutic Studies and Associated Analytical Methods
26
33%, 41%, and 66% when AW tablets were administered with low fat, moderate fat and high fat food, respectively. Plasma DTG Cmax increased by 46%, 52%, and 67% when the AW tablets were administered with low fat, moderate fat and high fat food, respectively (Table 12). Tmax increased with increasing fat content and median values were 2.0, 3.0, 4.0, and 5.0 hours for fasting, low fat, moderate fat, and high fat meals, respectively. Half-life was similar between treatment groups ranging from 13.4 to 14.1 hours.
Table 11 Summary of DTG Pharmacokinetic Parameters for the Effect of Food in ING113674
Plasma DTG PK Parameter
50 mg (2x25 mg) Oral Tablet Fasted
N=18
50 mg (2x25 mg) Oral
Tablet with Low Fat Meal
N=18
50 mg (2x25 mg) Oral
Tablet with Mod Fat Meal
N=18
50 mg (2x25 mg) Oral
Tablet with High Fat Meal
N=18
AUC(0-) 50.3(27)
66.7(35)
71.0(31)
83.6(35)
Cmax 2.65(28)
3.88(21)
4.03(19)
4.44(24)
Data Source: ING113674, Table 11.6geometric mean (CVb%) for PK summaryDTG 50 mg AW = DTG 50 mg using new formulation 1 fastingDTG 50 mg AW + Low Fat = DTG 50 mg using formulation AW with low fat mealDTG 50 mg AW + High Fat = DTG 50 mg using formulation AW with high fat mealDTG 50 mg AW + Mod Fat = DTG 50 mg using formulation AW with moderate fat meal
Table 12 Statistical Comparison of Plasma DTG Pharmacokinetic Parameters with Food Compared to Fasting
Plasma DTG PK Parameter
Ratio of GLS Means (90% CI)
DTG 50 mg AW + low fat vs DTG 50 mg AW
(n=18)
DTG 50 mg AW + mod fat vs DTG 50 mg AW
(n=18)
DTG 50 mg AW + high fat vs DTG 50 mg AW
(n=18)
AUC(0-) 1.33[1.21, 1.45]
1.41[1.29, 1.55]
1.66[1.52, 1.82]
Cmax 1.46[1.34, 1.60]
1.52[1.39, 1.66]
1.67[1.53, 1.83]
Data Source: ING113674, Table 11.9GLS mean ratio (90% CI) for treatment comparisonDTG 50 mg AW = DTG 50 mg using new formulation 1 fastingDTG 50 mg AW + Low Fat = DTG 50 mg using formulation AW with low fat mealDTG 50 mg AW + High Fat = DTG 50 mg using formulation AW with high fat mealDTG 50 mg AW + Mod Fat = DTG 50 mg using formulation AW with moderate fat meal
2.4. Absolute Bioavailability
The absolute bioavailability of DTG has not been determined. The low solubility of dolutegravir in buffered solutions and its non-specific binding present significant
CONFIDENTIAL2.7.1 Summary of Biopharmaceutic Studies and Associated Analytical Methods
27
challenges to an iv formulation for dolutegravir even at very low doses. However, the majority of the information for which absolute bioavailability is assessed is available through studies that demonstrate that the tablet formulation is well characterized through linear predictable pharmacokinetics and that the clinical trials can serve as a benchmark for product quality and performance. Studies have shown that dolutegravir exhibits high absorptive permeability, low systemic and pre-systemic clearance, unlikely pre-systemic drug interactions with efflux transporters, and linear pharmacokinetics over the clinical dose range with low to moderate variability.
The relative bioavailability of the dolutegravir 50 mg Phase III and commercial tablet product (BC formulation) is estimated to be 75% when compared to a dolutegravir solution/suspension formulation. In addition, in vitro comparative dissolution profiles (Phase II and Phase III 25 mg and 50 mg tablets) and a series of relative bioavailability studies characterizing pertinent biopharmaceutical parameters, such as effects of food and particle size on absorption, have shown that dolutegravir provides consistently predictable systemic exposure. When administered as a suspension, the pharmacokinetics of dolutegravir was linear from 2 to 100 mg. When administered as a tablet, the systemic exposure increased proportionately over the clinical dose range of 25 to 50 mg with low to moderate variability and a predictable dose-response relationship. Dolutegravir exhibits high absorptive permeability that is not affected by efflux transport inhibitors. This is demonstrated by the rapid absorption of dolutegravir from the tablet formulation and the lack of a significant effect on absorption when co-administered with lopinavir and ritonavir (ING111405), potent inhibitors of the efflux transporters P-glycoprotein (Pgp) and breast cancer resistance protein (BCRP). The metabolic and elimination profiles of dolutegravir are well characterized. Unchanged dolutegravir represented >97% of the circulating drug-related material and nearly 100% at Cmax. These data together with the long half-life of 13 to 15 hours indicate that metabolic clearance of dolutegravir is low, with a low first pass effect, and that pre-systemic metabolism does not contribute significantly to exposure or variability.
3. COMPARISON AND ANALYSES OF RESULTS ACROSS STUDIES
3.1. In vitro Dissolution and in vivo Bioavailability
As described in section m3.2. P.2.2, dolutegravir sodium is considered a poorly soluble compound, demonstrating low solubility over the physiological pH range (pH 1 to 7.4). Dolutegravir was determined to have high passive membrane permeability (333 nm/s at pH 7.4). The absorptive membrane permeabilities were also high in the presence of FaSSIF at pH 7.4 and pH 5.5 (P7.4[abs] value of 253 nm/s and a P5.5[abs] value of 265 nm/s respectively). Based on solubility and permeability determinations, dolutegravir sodium is classified as a Biopharmaceutics Classification System (BCS) Class 2. However, the Solubility Limited Absorbable Dose (SLAD) concept has been introduced recently (Butler, 2010), and represents the region between Class IIa and IIb for high permeability drugs. The Developability Classification System (DCS) proposed by Butler et al, assigns this drug (up to a dose of 50 mg) in DCS Class I, indicating that the absorption is not expected to be limited by dissolution and/or solubility at that dose level. The

CONFIDENTIAL2.7.1 Summary of Biopharmaceutic Studies and Associated Analytical Methods
28
discriminating dissolution test, discussed in m3.2.P.2.2, is therefore, expected to be more of a quality control test, than an indicator of biopharmaceutical performance.
Furthermore, in Study ING113068, (Section 2.1.2) plasma exposures of DTG were similar between tablets containing the standard micronized drug substance and those containing unmicronised drug substance. This is despite the markedly slower dissolution profile of the tablets containing the unmicronised material compared to that typically observed for the tablets made from the standard micronised material (Appendix Table 3).
Given the observations above, the development of an in-vitro/in-vivo correlation is not considered necessary and has not been progressed.
3.2. Recommendation for Dosing Dolutegravir Relative to Food
The effects of food are dependent upon the calorie and fat content. The dose may also be a factor as a larger food effect was observed with a moderate fat and the 50 mg dose compared to a moderate fat meal with the 20 mg dose (41% vs 11%).
Administration of DTG at a dose of 20mg (10 mg tablet x 2) with a moderate fat meal slightly increased the AUC by 11%. A larger magnitude of effect (33 to 67% increases in DTG AUC or Cmax) was observed when 50mg (25 mg tablet x 2) of the Phase IIIformulation was dosed with food. At this dose and formulation, increasing exposure was observed with increasing fat and calorie content. The presence of food with the associated increase in gastric residence time would be expected to aid the dispersion and dissolution of DTG from DTG tablets, leading to an overall increase in exposure. This is consistent with the observation that higher exposures were observed from a suspension formulation compared to a tablet formulation.
The increased exposure with food is not considered clinically significant based on the accumulated safety data in Phase IIb and III studies which permitted DTG dosing without restriction to food or food content (refer to m2.7.4). The PK variability for AUC(0-) in the SPRING-1 dose ranging trial was 40-48% across doses, suggesting that dosing without regard to food does not lead to unpredictable high exposures in clinical practice. It is unknown if the increased exposure is beneficial to efficacy in the INI-resistant population where higher C values may be required for subjects with a large fold change in IC50 compared to wild type virus. DTG can be given without regard to meals.

CONFIDENTIAL2.7.1 Summary of Biopharmaceutic Studies and Associated Analytical Methods
29
CONCLUSIONS
The conclusions from the biopharmaceutic evaluations are as follows:
All strengths and batches of DTG tablets (50 mg and 25 mg) used in clinical studies had consistent in vitro dissolution.
The bioanalytical methods used to measure concentrations of DTG in human plasma were sensitive, selective, accurate and reproducible. Stability of the analyte was demonstrated during sample processing and long-term storage.
The oral bioavailability of the tablet was less than that of a suspension with mean AUC(0-t) decreased by 30% following administration of the tablet compared to the suspension formulation under the fasted condition. The rate of absorption of the drug from tablet was slower than suspension.
Changes in particle size did not have a significant impact on exposure. A formulation of un-micronized particles demonstrated similar exposure to the current tablet formulation (of micronized particles). These data support the particle size specification for the micronized API.
For DTG tablets, a 25 mg tablet with the Phase III formulation composition met the bioequivalence criteria with the 25 mg tablet used in the Phase II studies. A higher strength tablet of this formulation (50 mg tablet) was manufactured at the commercial site for use in Phase III clinical trials. This 50 mg tablet has the same % weight/weight composition but made at double the tablet weight of the 25 mg tablets used to establish bioequivalence to the Phase II product. The in-vitro dissolution profiles of the 50 mg tablets (Phase III formulation) compare closely to the profiles of two 25 mg tablets (Phase III composition) tested per dissolution vessel (i.e. total dose level = 50 mg) in three dissolution media.
Administration with food increases the exposure of DTG. Plasma DTG AUC(0-) increased by 33%, 41%, and 66% when DTG was administered with low fat, moderate fat and high fat food, respectively.
DTG can be taken with or without food based on the accumulated safety data in Phase IIb and III studies which permitted DTG dosing without restriction to food or food content.
DTG 50 mg tablets manufactured at the commercial site were administered in the Phase III studies that demonstrated the safety and efficacy of DTG in HIV-infected patients.
No pivotal bioequivalence study was required because the commercial formulation is identical to the Phase III clinical trial tablet formulation, differing only in the film coat color, a slight difference in the film coat level, and the degree of concavity of the tooling used to produce the tablets.

CONFIDENTIAL2.7.1 Summary of Biopharmaceutic Studies and Associated Analytical Methods
30
4. REFERENCES
Food and Drug Administration. Guidance for Industry: Dissolution Testing of Immediate Release Solid Oral Dosage Forms. August 1997. http://www.fda.gov/downloads/Drugs/GuidanceComplianceRegulatoryInformation/Guidances/UCM070237.pdf
Butler JM, Dressman JB. The developability classification system: application of bipharmaceutics concepts to formulation development. J. Pharm. Sci. 2010; 99, 4940-4954.

CONFIDENTIAL2.7.1 Summary of Biopharmaceutic Studies and Associated Analytical Methods
31
APPENDIX TABLES
Appendix Table 1 Summary of Formulations Used in DTG Clinical Trials
Formulation Phase: Study (Description)Powder for Oral Suspension(micronized)(Table 1)
Phase I:ING111207 (FTIH)ING111853 (mass balance)ING111322 (repeat dose escalation, midazolam DDI, and RBA)ING111856 (TQTc)ING112941 (evaluation of high [250 mg] dose)
Tablet 1 mg(micronized)(Table 2)
Phase II:ING111521 (PoC)
Tablet 10 mg(micronized)(Table 2)
Phase I:ING111322 (RBA)ING111854 (ATV & ATV/RTV DDI)ING111405 (LPV/RTV & DRV/RTV DDI)ING111603 (ETV DDI)ING112934 (ETV + LPV/RTV & ETV + DRV/RTV DDI)ING111604 (TDF DDI)ING111602 (Maalox & MVI DDI)Phase II:ING111521 (PoC)ING112276/SPRING 1 (ART-naive)
Tablet 25 mg(micronized)(Table 2 [AP])
Phase I:ING113674 (RBA)ING112941 (FE and omeprazole DDI)ING114819 (Iohexol)ING113096 (TPV/RTV DDI)ING114005 (Efavirenz DDI)ING114819 (Renal Function)Phase II:ING112276/SPRING 1 (ART-naive)

CONFIDENTIAL2.7.1 Summary of Biopharmaceutic Studies and Associated Analytical Methods
32
Formulation Phase: Study (Description)ING112961/VIKING 1 (INI-experienced)
Tablet 25 mg(unmicronized)
Phase I:ING113068 (RBA)
Tablet 25 mg(intermediate particle size)
Phase I:ING113068 (RBA)
Tablet 25 mg(micronized)(Table 3, Formulation 1 [AW])
Phase I:ING113674 (RBA)
Tablet 25 mg(micronized)(Table 3, Formulation 2 [AX])
Phase I:ING113674 (RBA)
Tablet 50 mg(micronized)(Table 4 [BC])
Phase I:ING113097 (Hepatic impairment)ING115697 (HCV PI DDI)ING111855 (Drug Interaction OC)ING112934 (ETV/LPV/RTV & ETV/DRV/RTV DDI)ING113099(Rifampin DDI)ING113125 (Renal impairment)ING114556 (Pediatric Formulation RBA)ING114581 (FDC RBA)ING115381 (PK, Healthy Japanese Subjects)ING115465 (Female GT CRT)ING115696 (Steroid DDI)ING115697 (BCV & TVR, HCV PI DDI)ING115698 (Methadone DDI)ING116195(Male GT CRT)Phase III:ING113086/SPRING 2 (ART-naive)ING114467/SINGLE (ART-naive)ING111762/SAILING (ART-experienced/INI-naive)ING112574/VIKING 3 (INI-experienced)

CONFIDENTIAL2.7.1 Summary of Biopharmaceutic Studies and Associated Analytical Methods
33
Appendix Table 2 Summary of Drug Substance and Drug Product
Study Ref. No. FormulaCode
Drug Product Batch No. Dosage Form Input Drug Substance Batch Study Report Location
ING111322 AA, AB, AC R06001 Powder for Oral Suspension R06001 m5.3.3.1ING111322 AM 081157297a Dolutegravir Tablet, 10 mg A7Z002 m5.3.3.1ING112941 AQ 091225017b Powder for Oral Suspension 091225017 m5.3.3.4
ING112941 AP 091212108c Dolutegravir Tablet, 25 mg B87002 m5.3.3.4
ING113068 AW 101241248 Dolutegravir Tablet, 25 mg (standard micronised drug substance)
091227508 m5.3.3.4
ING113068 BM 101255454 Dolutegravir Tablet, 25 mg (micronised (intermediate size) drug substance)
091237760 m5.3.3.4
ING113068 BL 101255473 Dolutegravir Tablet, 25 mg (unmicronised drug substance)
091237761 m5.3.3.4
ING113674 AP 091212108c Dolutegravir Tablet, 25 mg B87002 m5.3.1.2ING113674 AW 101241248 Dolutegravir Tablet, 25 mg 091227508 m5.3.1.2
ING113674 AX 101243560 Dolutegravir Tablet, 25 mg 091227508 m5.3.1.2
a. GSK tablet batch number. batch number A8302b. GSK API batch number. batch number B87002c. GSK tablet batch number. batch number A9105.

CONFIDENTIAL2.7.1 Summary of Biopharmaceutic Studies and Associated Analytical Methods
34
Appendix Table 3 Summary of in vitro Dissolution Data Related to PK Study Batches
Study Ref. No.
Product ID/Batch No.
Dosage Form Conditions: USP Apparatus 2 (Media, Volume, Paddle Speed)
No. of Dosage Units
Collection times (min)Mean % Dissolved (range)
Study Report Location
10 min 15 min 20 min 30 min 45 min
ING111322 R06001 Powder for Oral Suspension
N/A N/A N/A N/A N/A N/A N/A m5.3.3.1
ING111322 081157297 Dolutegravir Tablet, 10 mg
0.01M phosphate buffer, pH 6.8,900 ml, 50 rpm
6 74 (73-74) N/A 87 (86-88) 92 (91-93) N/A m5.3.3.1
ING112941 091225017c Powder for OralSuspension
N/A N/A N/A N/A N/A N/A N/A m5.3.3.4
ING112941 091212108d
d
Dolutegravir Tablet, 25 mg
0.01M phosphate buffer, pH 6.8
with 0.30% SDS, 900 ml, 50 rpm
6 79 (72-82) N/A 95 (95-97) 99 (98-100)
100(100-101)
m5.3.3.4
ING113068 101241248 Dolutegravir Tablet, 25 mg (standard micronised drug
substance)
0.01M phosphate buffer, pH 6.8
with 0.25% SDS, 900 ml, 50 rpma
12b 53 (48-56) 76 (71-79) 85 (83-87) 91 (90-93) 96 (95-97) m5.3.3.4
ING113068 101255454 Dolutegravir Tablet, 25 mg (micronised (intermediate size) drug substance)
0.01M phosphate buffer, pH 6.8
with 0.25% SDS, 900 ml, 50 rpma
12b 59 (53-64) 72 (68-75) 80 (77-82) 89 (86-91) 95 (93-96) m5.3.3.4
ING113068 101255473 Dolutegravir Tablet, 25 mg (unmicronised
drug substance)
0.01M phosphate buffer, pH 6.8
with 0.25% SDS, 900 ml, 50 rpma
12b 48 (44-52) 57 (56-59) 64 (62-66) 73 (69-75) 82 (78-84) m5.3.3.4

CONFIDENTIAL2.7.1 Summary of Biopharmaceutic Studies and Associated Analytical Methods
35
Study Ref. No.
Product ID/Batch No.
Dosage Form Conditions: USP Apparatus 2 (Media, Volume, Paddle Speed)
No. of Dosage Units
Collection times (min)Mean % Dissolved (range)
Study Report Location
10 min 15 min 20 min 30 min 45 min
ING113674 091212108 Dolutegravir Tablet, 25 mg
0.01M phosphate buffer, pH 6.8
with 0.25% SDS, 900 ml, 50 rpma
12b 64 (55-70) 84 (80-86) 90 (88-91) 94 (92-95) 97 (96-98) m5.3.1.2
ING113674 101241248 Dolutegravir Tablet, 25 mg
0.01M phosphate buffer, pH 6.8
with 0.25% SDS, 900 ml, 50 rpma
12b 53 (48-56) 76 (71-79) 85 (83-87) 91 (90-93) 96 (95-97) m5.3.1.2
ING113674 101243560 Dolutegravir Tablet, 25 mg
0.01M phosphate buffer, pH 6.8
with 0.25% SDS, 900 ml, 50 rpma
12b 57 (52-60) 79 (74-82) 87 (85-89) 93 (92-94) 97 (96-98) m5.3.1.2
a. Dissolution conditions used for the Phase III 50 mg tablet and for the proposed commercial dissolution method. At time of release testing the method used was 0.01M phosphate buffer, pH 6.8 with 0.30% SDS, 900 ml, 50 rpm, one tablet per vessel.
b. Six vessels, two tablets per vessel i.e. equivalent of 50 mg dose in each vessel.c. GSK API batch number. batch number B87002.d. GSK tablet batch number. batch number A9105.
CONFIDENTIAL2.7.1 Summary of Biopharmaceutic Studies and Associated Analytical Methods
36
Appendix Table 4 Summary of in vitro Comparative Dissolution Data for 2 x 25 mg Tablets vs 1 x 50 mg Tablets
Product ID/Batch No.
Dosage Form
Conditions: USP Apparatus 2 (Media, Volume, Paddle Speed)
No. of Dosage Units
Collection times (min)Mean % Dissolved (range)
5 min 10 min 15 min 20 min 30 min 45 min101241248 Dolutegravir
Tablet, 25 mg0.01M phosphate buffer, pH 6.8 with 0.25% SDS,
900 ml, 50 rpma
24a 21 (19-23) 54 (50-58) 77 (73-80) 87 (85-89) 94 (92-96) 99 (98-100)
R513665 Dolutegravir Tablet, 50 mg
0.01M phosphate buffer, pH 6.8 with 0.25% SDS,
900 ml, 50 rpma
12 10 (6-19) 42 (34-59) 70 (62-83) 86 (82-90) 94 (93-96) 97 (95-99)
R513666 Dolutegravir Tablet, 50 mg
0.01M phosphate buffer, pH 6.8 with 0.25% SDS,
900 ml, 50 rpma
12 12 (9-17) 45 (38-53) 72 (64-77) 87 (83-90) 94 (91-97) 97 (94-100)
R513667 Dolutegravir Tablet, 50 mg
0.01M phosphate buffer, pH 6.8 with 0.25% SDS,
900 ml, 50 rpma
12 9 (6-12) 39 (33-45) 67 (59-73) 85 (79-88) 95 (94-97) 98 (96-100)
a. 12 vessels, two tablets per vessel i.e. equivalent of 50 mg dose in each vessel.

CONFIDENTIAL2.7.1 Summary of Biopharmaceutic Studies and Associated Analytical Methods
37
Appendix Table 5 Summary of in vitro Comparative Dissolution Data for 2 x 25 mg Tablets vs 1 x 50 mg Tablets in 0.1M HCl with 0.25% SDS, 100 rpm Paddle Speed
Product ID/Batch No.
No. of Dosage Units
Collection times (min)Mean % Dissolved (range)
5 10 15 20 25 30 35 40 45 50 55 60 75 90 105 120101241248 24 a 0
(0-0)1
(0-2)4
(1-11)11
(3-20)20
(7-29)27
(11-39)35
(18-44)41
(26-50)45
(32-54)49
(37-58)53
(41-61)56
(45-63)63
(54-70)69
(60-75)74
(65-80)78
(69-83)
R513665 12 0(0-0)
0(0-0)
1(0-2)
2(1-4)
4(2-6)
7(4-13)
15(9-23)
26(19-31)
34(26-37)
39(32-44)
44(36-49)
48 (40-53)
56(48-62)
62(53-68)
67(57-71)
70 (61-74)
a. 12 vessels, two tablets per vessel i.e. equivalent of 50 mg dose in each vessel.
Appendix Table 6 Summary of in vitro Comparative Dissolution Data for 2 x 25 mg Tablets vs 1 x 50 mg Tablets in USP Acetate Buffer, pH 4.5 50 rpm Paddle Speed
Product ID/Batch No.
No. of Dosage Units
Collection times (min)Mean % Dissolved (range)
5 10 15 20 25 30 35 40 45 50 55 60101241248 24 a 2
(1-3)11
(6-15)21
(16-26)31
(25-38)38
(34-44)44
(40-49)47
(45-52)51
(48-55)53
(51-57)55
(53-59)57
(55-61)59
(57-62)R513665 12 1
(1-1)4
(2-7)12
(6-14)20
(17-23)30
(26-34)38
(35-41)44
(42-46)49
(47-50)52
(51-53)55
(54-56)57
(57-58)59
(59-60)a. 12 vessels, two tablets per vessel i.e. equivalent of 50 mg dose in each vessel.
CONFIDENTIAL2.7.1 Summary of Biopharmaceutic Studies and Associated Analytical Methods
38
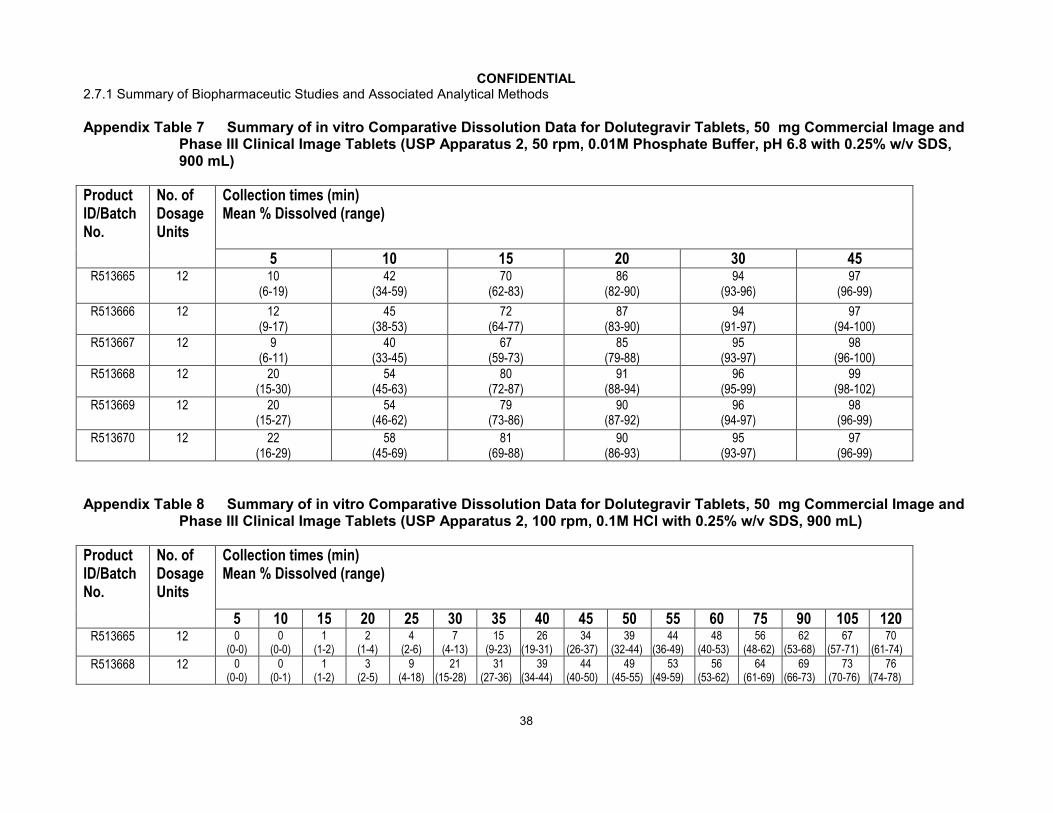
Appendix Table 7 Summary of in vitro Comparative Dissolution Data for Dolutegravir Tablets, 50 mg Commercial Image and Phase III Clinical Image Tablets (USP Apparatus 2, 50 rpm, 0.01M Phosphate Buffer, pH 6.8 with 0.25% w/v SDS, 900 mL)
Product ID/Batch No.
No. of Dosage Units
Collection times (min)Mean % Dissolved (range)
5 10 15 20 30 45R513665 12 10
(6-19)42
(34-59)70
(62-83)86
(82-90)94
(93-96)97
(96-99)
R513666 12 12(9-17)
45(38-53)
72(64-77)
87(83-90)
94(91-97)
97(94-100)
R513667 12 9(6-11)
40(33-45)
67(59-73)
85(79-88)
95(93-97)
98(96-100)
R513668 12 20(15-30)
54(45-63)
80(72-87)
91(88-94)
96(95-99)
99(98-102)
R513669 12 20(15-27)
54(46-62)
79(73-86)
90(87-92)
96(94-97)
98(96-99)
R513670 12 22(16-29)
58(45-69)
81(69-88)
90(86-93)
95(93-97)
97(96-99)
Appendix Table 8 Summary of in vitro Comparative Dissolution Data for Dolutegravir Tablets, 50 mg Commercial Image and Phase III Clinical Image Tablets (USP Apparatus 2, 100 rpm, 0.1M HCl with 0.25% w/v SDS, 900 mL)
Product ID/Batch No.
No. of Dosage Units
Collection times (min)Mean % Dissolved (range)
5 10 15 20 25 30 35 40 45 50 55 60 75 90 105 120R513665 12 0
(0-0)0
(0-0)1
(1-2)2
(1-4)4
(2-6)7
(4-13)15
(9-23)26
(19-31)34
(26-37)39
(32-44)44
(36-49)48
(40-53)56
(48-62)62
(53-68)67
(57-71)70
(61-74)
R513668 12 0(0-0)
0(0-1)
1(1-2)
3(2-5)
9(4-18)
21(15-28)
31(27-36)
39(34-44)
44(40-50)
49(45-55)
53(49-59)
56(53-62)
64(61-69)
69(66-73)
73 (70-76)
76(74-78)

CONFIDENTIAL2.7.1 Summary of Biopharmaceutic Studies and Associated Analytical Methods
39
Appendix Table 9 Summary of in vitro Comparative Dissolution Data for Dolutegravir Tablets, 50 mg Commercial Image and Phase III Clinical Image Tablets (USP Apparatus 2, 50 rpm, USP Acetate Buffer, pH 4.5, 900 mL)
Product ID/Batch No.
No. of Dosage Units
Collection times (min)Mean % Dissolved (range)
5 10 15 20 25 30 35 40 45 50 55 60R513665 12 1
(1-1)4
(2-7)12
(6-14)20
(17-23)30
(26-34)38
(35-41)44
(42-46)49
(47-50)52
(51-53)55
(54-56)57
(57-58)59
(59-60)R513668 12 1
(1-2)6
(2-10)15
(12-19)25
(22-31)36
(33-39)43
(41-46)48
(46-51)51
(50-54)54
(53-57)57
(55-59)59
(57-61)60
(59-62)
Appendix Table 10 Summary of in vitro Comparative Dissolution Data for Dolutegravir Tablets, 50 mg Commercial Image and Phase III Clinical Image Tablets (USP Apparatus 2, 50 rpm, 0.01M Phosphate Buffer, pH 7.5, 900 mL)
Product ID/Batch No.
No. of Dosage Units
Collection times (min)Mean % Dissolved (range)
5 10 15 20 25 30 35 40 45 50 55 60R513665 12 14
(9-19)39
(33-46)60
(54-65)68
(66-70)70
(68-72)72
(69-74)74
(70-75)75
(71-76)75
(71-77)76
(72-78)76
(72-78)77
(72-79)R513668 12 22
(16-25)53
(45-58)70
(66-72)74
(72-75)75
(74-77)77
(74-78)77
(75-79)78
(75-79)79
(76-80)79
(76-80)79
(76-80)79
(76-81)

CONFIDENTIAL2.7.1 Summary of Biopharmaceutic Studies and Associated Analytical Methods
40
Appendix Table 11 Summary of in vitro Comparative Dissolution Data for Dolutegravir Tablets, 50 mg Commercial Image and Phase III Clinical Image Tablets (USP Apparatus 2, 50 rpm, Water, 900 mL)
Product ID/Batch No.
No. of Dosage Units
Collection times (min)Mean % Dissolved (range)
5 10 15 20 25 30 35 40 45 50 55 60R513665 12 24
(18-28)59
(48-67)86
(73-93)100
(94-103)102
(101-105)
103(101-105)
103(101-105)
103(100-106)
103(101-106)
103(101-106)
103(101-106)
104(101-106)
R513668 12 31(25-37)
69(57-77)
94(85-100)
103(101-104)
103(103-105)
103(94-105)
103(94-105)
104(103-105)
105(103-105)
105(102-106)
105(103-106)
105(103-107)

CONFIDENTIAL2.7.1 Summary of Biopharmaceutic Studies and Associated Analytical Methods
41
Appendix Table 12 Bioanalytical Methods Summary
Validation Report Clinical Studies Supported
Method Description and Performance
DolutegravirHuman Plasma (EDTA)(Original method)
GlaxoSmithKlineFive Moore DriveResearch Triangle Park, NC, 27709
Title: The Validation of a Method for the Determination of GSK1349572 in Human Plasma (range 5-5000 ng/mL) using HPLC-MS/MS
Document Number: RD2007/01425
Supplemental Report (Incorporation of long term stability)
Title Supplemental Validation Data to “The Validation of a Method for the Determination of GSK1349572 in Human Plasma (range 5 to 5000 ng/mL) using HPLC-MS/MS”
Document Number: 2011N112541
ING111207 ING111322 ING111405 ING111521 ING111602 ING111603 ING111604 ING111853 ING111854 ING111856 ING112276 ING112934 ING112941 ING112961
Dolutegravir is extracted from 25 L human plasma by protein precipitation using acetonitrile containing [2H7
15N]-dolutegravir as an internal standard. Extracts are analyzed by HPLC-MS/MS using a Turbo IonSpray interface and multiple reaction monitoring.
Lower limit of quantification (LLQ): 5 ng/mLValidated Range: 5 to 5000 ng/mLQC levels: 5, 20, 400, 4000, and 5000 ng/mLWithin-run Precision (%CV): ≤ 14.4%Between-run Precision (%CV): ≤ 3.8%Within-run Accuracy (% Bias): -8.4≤ bias ≤ -0.7%Stability in Human Plasma: 3 freeze-thaw cycles from -30°Ca
at least 16 months at -30°Cat least 24 hours at ambient temperature
Processed Extract Stability: At least 3 days at ambient temperature
Stability in Human Blood: Cross Reference RD2010/00175
CONFIDENTIAL2.7.1 Summary of Biopharmaceutic Studies and Associated Analytical Methods
42
Validation Report Clinical Studies Supported
Method Description and Performance
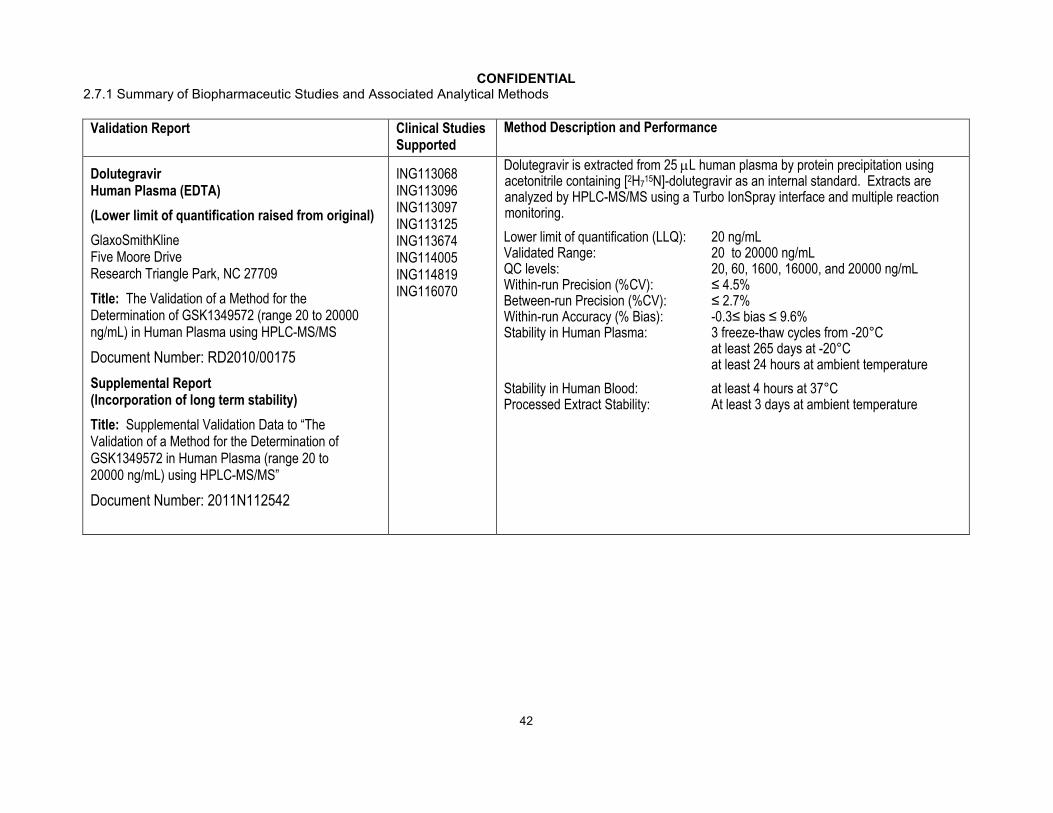
DolutegravirHuman Plasma (EDTA)
(Lower limit of quantification raised from original)
GlaxoSmithKlineFive Moore DriveResearch Triangle Park, NC 27709
Title: The Validation of a Method for the Determination of GSK1349572 (range 20 to 20000 ng/mL) in Human Plasma using HPLC-MS/MS
Document Number: RD2010/00175
Supplemental Report(Incorporation of long term stability)
Title: Supplemental Validation Data to “The Validation of a Method for the Determination of GSK1349572 in Human Plasma (range 20 to 20000 ng/mL) using HPLC-MS/MS”
Document Number: 2011N112542
ING113068 ING113096 ING113097 ING113125 ING113674 ING114005 ING114819 ING116070
Dolutegravir is extracted from 25 L human plasma by protein precipitation using acetonitrile containing [2H7
15N]-dolutegravir as an internal standard. Extracts are analyzed by HPLC-MS/MS using a Turbo IonSpray interface and multiple reaction monitoring.
Lower limit of quantification (LLQ): 20 ng/mLValidated Range: 20 to 20000 ng/mLQC levels: 20, 60, 1600, 16000, and 20000 ng/mLWithin-run Precision (%CV): ≤ 4.5%Between-run Precision (%CV): ≤ 2.7%Within-run Accuracy (% Bias): -0.3≤ bias ≤ 9.6%Stability in Human Plasma: 3 freeze-thaw cycles from -20°C
at least 265 days at -20°Cat least 24 hours at ambient temperature
Stability in Human Blood: at least 4 hours at 37°CProcessed Extract Stability: At least 3 days at ambient temperature
CONFIDENTIAL2.7.1 Summary of Biopharmaceutic Studies and Associated Analytical Methods
43
Validation Report Clinical Studies Supported
Method Description and Performance
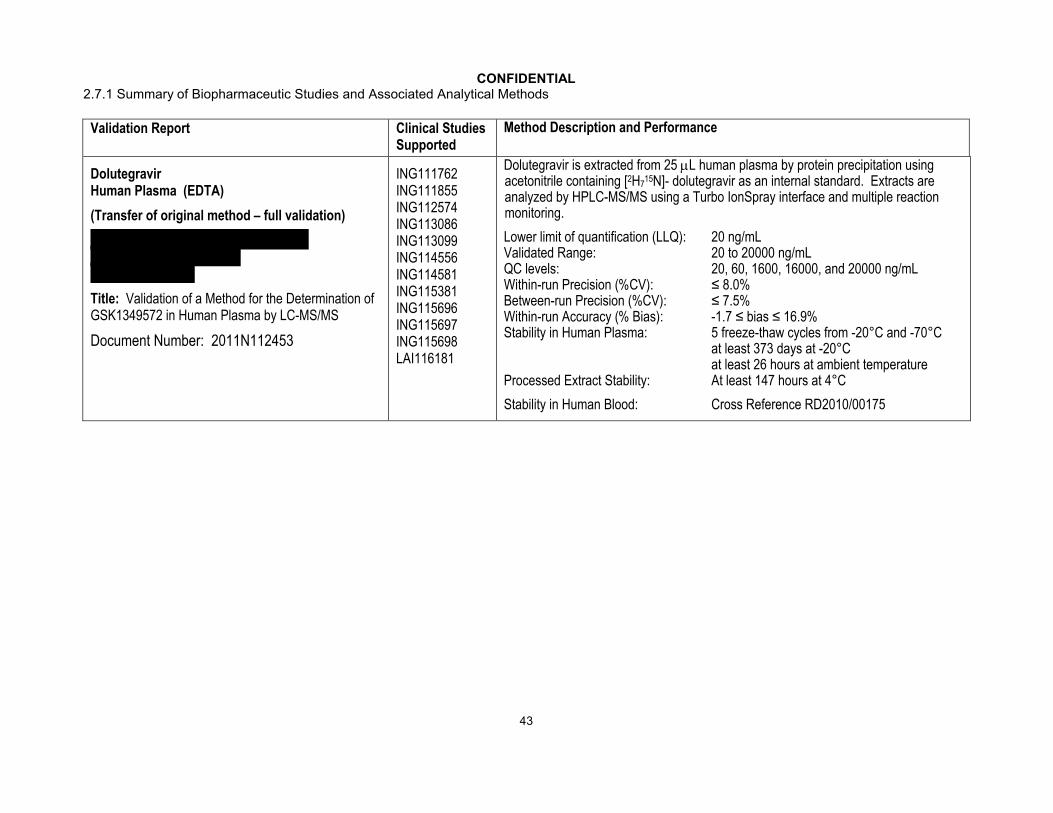
DolutegravirHuman Plasma (EDTA)
(Transfer of original method – full validation)
Title: Validation of a Method for the Determination of GSK1349572 in Human Plasma by LC-MS/MS
Document Number: 2011N112453
ING111762 ING111855 ING112574 ING113086 ING113099 ING114556ING114581 ING115381 ING115696 ING115697 ING115698 LAI116181
Dolutegravir is extracted from 25 L human plasma by protein precipitation using acetonitrile containing [2H7
15N]- dolutegravir as an internal standard. Extracts are analyzed by HPLC-MS/MS using a Turbo IonSpray interface and multiple reaction monitoring.
Lower limit of quantification (LLQ): 20 ng/mLValidated Range: 20 to 20000 ng/mLQC levels: 20, 60, 1600, 16000, and 20000 ng/mLWithin-run Precision (%CV): ≤ 8.0%Between-run Precision (%CV): ≤ 7.5%Within-run Accuracy (% Bias): -1.7 ≤ bias ≤ 16.9%Stability in Human Plasma: 5 freeze-thaw cycles from -20°C and -70°C
at least 373 days at -20°Cat least 26 hours at ambient temperature
Processed Extract Stability: At least 147 hours at 4°C
Stability in Human Blood: Cross Reference RD2010/00175

CONFIDENTIAL2.7.1 Summary of Biopharmaceutic Studies and Associated Analytical Methods
44
Validation Report Clinical Studies Supported
Method Description and Performance
DolutegravirPhosphate Buffered Saline
(Support Protein Binding Assessment against EDTA plasma)
(Original method validation)
GlaxoSmithKlineFive Moore DriveResearch Triangle Park, NC 27709
Title: The Validation of a Method for the Determination of GSK1349572 (range 1 to 1000 ng/mL) in Phosphate Buffered Saline using HPLC-MS/MS
Document Number: 2011N112679
ING113097 ING113125 ING116070
Dolutegravir is extracted from 50 L of phosphate buffered saline using acetonitrile containing [2H7
15N]- dolutegravir as an internal standard. Extracts are analyzed by HPLC-MS/MS using a Turbo IonSpray interface and multiple reaction monitoring.
Lower limit of quantification (LLQ): 1 ng/mLValidated Range: 1 to 1000 ng/mLQC levels: 1, 3, 80, 800, and 1000 ng/mLWithin-run Precision (%CV): ≤ 6.2%Between-run Precision (%CV): ≤ 2.2%Within-run Accuracy (% Bias): -4.4≤ bias ≤ 4.4%Stability in PBS: 3 cycles from 4°C to ambient
at least 17 days at 4°Cat least 24 hours at ambient temperature
Processed Extract Stability: At least 1 day at ambient temperature

CONFIDENTIAL2.7.1 Summary of Biopharmaceutic Studies and Associated Analytical Methods
45
Validation Report Clinical Studies Supported
Method Description and Performance
DolutegravirHuman Cerebrospinal Fluid
( original method validation)
Title: Validation of a Method for the Determination of GSK1349572 in Human Cerebrospinal Fluid (CSF) by LC-MS/MS
Document Number 2012N145767
ING116070Dolutegravir in CSF is mixed 1:1 with blank human plasma and extracted from a 50 L aliquot of the mixture by protein precipitation using acetonitrile containing [2H7
15N]-dolutegravir as an internal standard. Extracts are analyzed by HPLC-MS/MS using a Turbo IonSpray interface and multiple reaction monitoring.
Lower limit of quantification (LLQ): 1 ng/mLValidated Range: 1 to 1000 ng/mLQC levels: 1, 3, 30, 150, and 750 ng/mLWithin-run Precision (%CV): ≤ 9.0%Between-run Precision (%CV): ≤ 12.7%Within-run Accuracy (% Bias): -10.0 ≤ bias ≤ 17.8%Stability in Human CSF: 5 freeze-thaw cycles from -20°C and -70°C
at least 226 days at -20°C and -70°C inCSF:Plasma (1:1)
at least 6.5 hours at ambient temperatureProcessed Extract Stability: At least 109 hours at 4°C

CONFIDENTIAL2.7.1 Summary of Biopharmaceutic Studies and Associated Analytical Methods
46
Validation Report Clinical Studies Supported
Method Description and Performance
GSK2832500 (Glucuronide of Dolutegravir; M3)Human Plasma (EDTA)
(Original method full validation)
GlaxoSmithKlineFive Moore DriveResearch Triangle Park, NC 27709
Title: The Validation of a Method for the Determination of GSK2832500 (range 1 to 1000 ng/mL) in Human Plasma using HPLC-MS/MS
Document Number 2011N122389
ING113125GSK2832500 is extracted from 50 L human plasma by protein precipitation using acetonitrile containing [2H7
15N]-GSK2832500 as an internal standard. Extracts are analyzed by HPLC-MS/MS using a Turbo IonSpray interface and multiple reaction monitoring.
Lower limit of quantification (LLQ): 1 ng/mLValidated Range: 1 to 1000 ng/mLQC levels: 1, 3, 80, 800, and 1000 ng/mLWithin-run Precision (%CV): ≤ 12.6%Between-run Precision (%CV): ≤ 1.4%Within-run Accuracy (% Bias): -3.9≤ bias ≤ 12.8%Stability in Human Plasma: 3 freeze-thaw cycles from -20°C
at least 127 days at -20°Cat least 24 hours at ambient temperature
Processed Extract Stability: At least 48 hours at ambient temperature
Stability in Human Blood: At least 2 hours at 37°CAt least 2 hours at ambient temperature

CONFIDENTIAL2.7.1 Summary of Biopharmaceutic Studies and Associated Analytical Methods
47
Validation Report Clinical Studies Supported
Method Description and Performance
Midazolam (GI106769)Human Plasma (EDTA)
(original method validation)
GlaxoSmithKlineThe Frythe, Welwyn, Hertfordshire, AL6 9AR, UK
Title: Validation of a Method for the Determination of Midazolam (Range 0.35 to 72 ng/mL) and 1-Hydroxymidazolam (Range 0.5 to 100 ng/mL) in Human Plasma using HPLC-MS/MS
Document Number FD2006/00038
Supplemental Report(Incorporation of long term stability)
Title: Supplemental Validation Data to “The Validation of a Method for the Determination of Midazolam in Human Plasma (range 0.1 to 100 ng/mL) using HPLC-MS/MS”
Document Number: 2012N151540
ING111322Midazolam is extracted from 50 L human plasma by protein precipitation using acetonitrile containing [13C3
2H3]-Midazolam as an internal standard. Extracts are analyzed by HPLC-MS/MS using a Turbo IonSpray interface and multiple reaction monitoring.
Lower limit of quantification (LLQ): 0.35 ng/mLValidated Range: 0.35 to 72 ng/mLQC levels: 0.35, 1.4, 7, 58, and 72 ng/mLWithin-run Precision (%CV): ≤ 10.6%Between-run Precision (%CV): ≤ 8.7%Within-run Accuracy (% Bias): -6.7 ≤ bias ≤ 12.0%Stability in Human Plasma: 3 freeze-thaw cycles from -20°C
at least 24 hours at ambient temperature; at least 60 days at -20C
Processed Extract Stability: At least 6 days at ambient temperature
CONFIDENTIAL2.7.1 Summary of Biopharmaceutic Studies and Associated Analytical Methods
48
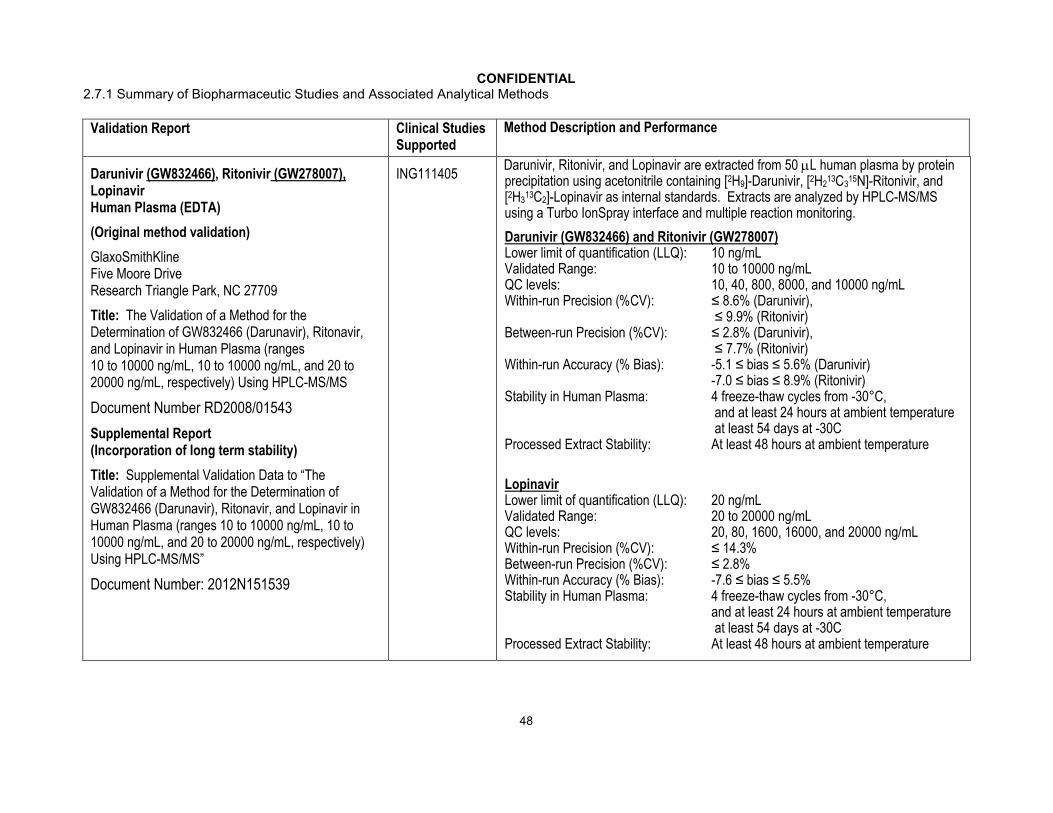
Validation Report Clinical Studies Supported
Method Description and Performance
Darunivir (GW832466), Ritonivir (GW278007),Lopinavir Human Plasma (EDTA)
(Original method validation)
GlaxoSmithKlineFive Moore DriveResearch Triangle Park, NC 27709
Title: The Validation of a Method for the Determination of GW832466 (Darunavir), Ritonavir, and Lopinavir in Human Plasma (ranges 10 to 10000 ng/mL, 10 to 10000 ng/mL, and 20 to 20000 ng/mL, respectively) Using HPLC-MS/MS
Document Number RD2008/01543
Supplemental Report(Incorporation of long term stability)
Title: Supplemental Validation Data to “The Validation of a Method for the Determination of GW832466 (Darunavir), Ritonavir, and Lopinavir in Human Plasma (ranges 10 to 10000 ng/mL, 10 to 10000 ng/mL, and 20 to 20000 ng/mL, respectively) Using HPLC-MS/MS”
Document Number: 2012N151539
ING111405Darunivir, Ritonivir, and Lopinavir are extracted from 50 L human plasma by protein precipitation using acetonitrile containing [2H9]-Darunivir, [2H2
13C315N]-Ritonivir, and
[2H313C2]-Lopinavir as internal standards. Extracts are analyzed by HPLC-MS/MS
using a Turbo IonSpray interface and multiple reaction monitoring.
Darunivir (GW832466) and Ritonivir (GW278007)Lower limit of quantification (LLQ): 10 ng/mLValidated Range: 10 to 10000 ng/mLQC levels: 10, 40, 800, 8000, and 10000 ng/mLWithin-run Precision (%CV): ≤ 8.6% (Darunivir),
≤ 9.9% (Ritonivir)Between-run Precision (%CV): ≤ 2.8% (Darunivir),
≤ 7.7% (Ritonivir) Within-run Accuracy (% Bias): -5.1 ≤ bias ≤ 5.6% (Darunivir)
-7.0 ≤ bias ≤ 8.9% (Ritonivir)Stability in Human Plasma: 4 freeze-thaw cycles from -30°C,
and at least 24 hours at ambient temperatureat least 54 days at -30C
Processed Extract Stability: At least 48 hours at ambient temperature
LopinavirLower limit of quantification (LLQ): 20 ng/mLValidated Range: 20 to 20000 ng/mLQC levels: 20, 80, 1600, 16000, and 20000 ng/mLWithin-run Precision (%CV): ≤ 14.3%Between-run Precision (%CV): ≤ 2.8%Within-run Accuracy (% Bias): -7.6 ≤ bias ≤ 5.5%Stability in Human Plasma: 4 freeze-thaw cycles from -30°C,
and at least 24 hours at ambient temperatureat least 54 days at -30C
Processed Extract Stability: At least 48 hours at ambient temperature
CONFIDENTIAL2.7.1 Summary of Biopharmaceutic Studies and Associated Analytical Methods
49
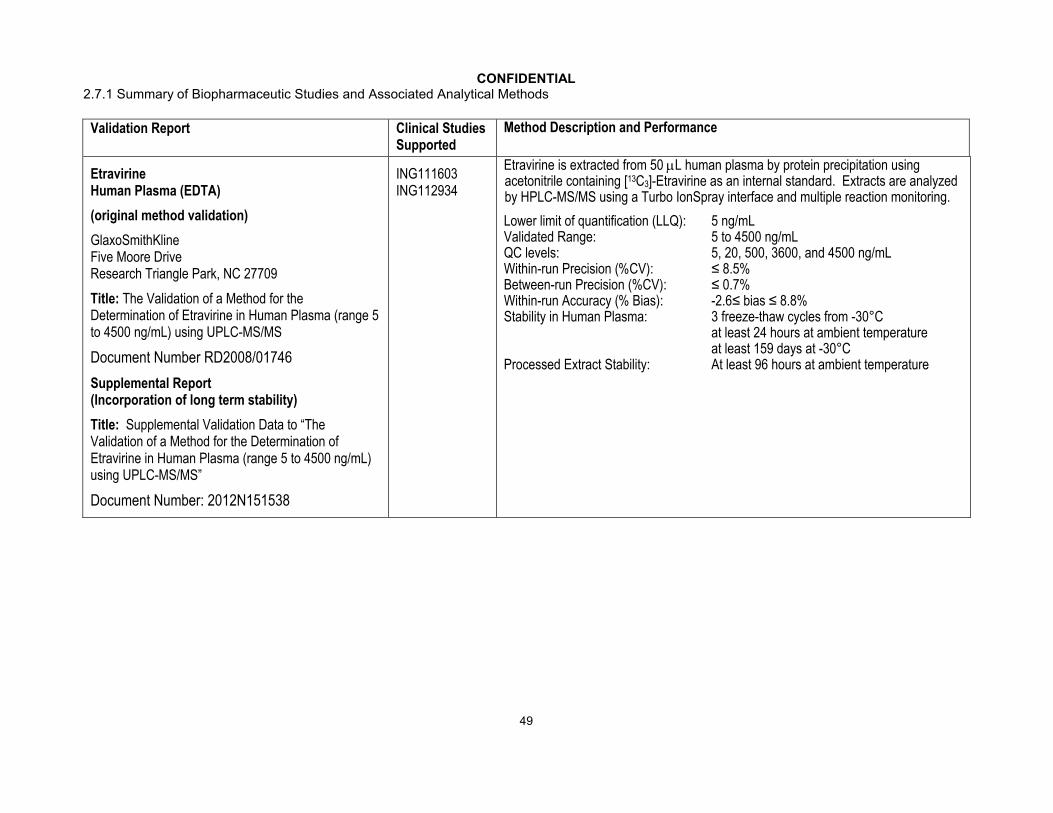
Validation Report Clinical Studies Supported
Method Description and Performance
Etravirine Human Plasma (EDTA)
(original method validation)
GlaxoSmithKlineFive Moore DriveResearch Triangle Park, NC 27709
Title: The Validation of a Method for the Determination of Etravirine in Human Plasma (range 5 to 4500 ng/mL) using UPLC-MS/MS
Document Number RD2008/01746
Supplemental Report(Incorporation of long term stability)
Title: Supplemental Validation Data to “The Validation of a Method for the Determination of Etravirine in Human Plasma (range 5 to 4500 ng/mL) using UPLC-MS/MS”
Document Number: 2012N151538
ING111603 ING112934
Etravirine is extracted from 50 L human plasma by protein precipitation using acetonitrile containing [13C3]-Etravirine as an internal standard. Extracts are analyzed by HPLC-MS/MS using a Turbo IonSpray interface and multiple reaction monitoring.
Lower limit of quantification (LLQ): 5 ng/mLValidated Range: 5 to 4500 ng/mLQC levels: 5, 20, 500, 3600, and 4500 ng/mLWithin-run Precision (%CV): ≤ 8.5%Between-run Precision (%CV): ≤ 0.7%Within-run Accuracy (% Bias): -2.6≤ bias ≤ 8.8%Stability in Human Plasma: 3 freeze-thaw cycles from -30°C
at least 24 hours at ambient temperatureat least 159 days at -30°C
Processed Extract Stability: At least 96 hours at ambient temperature
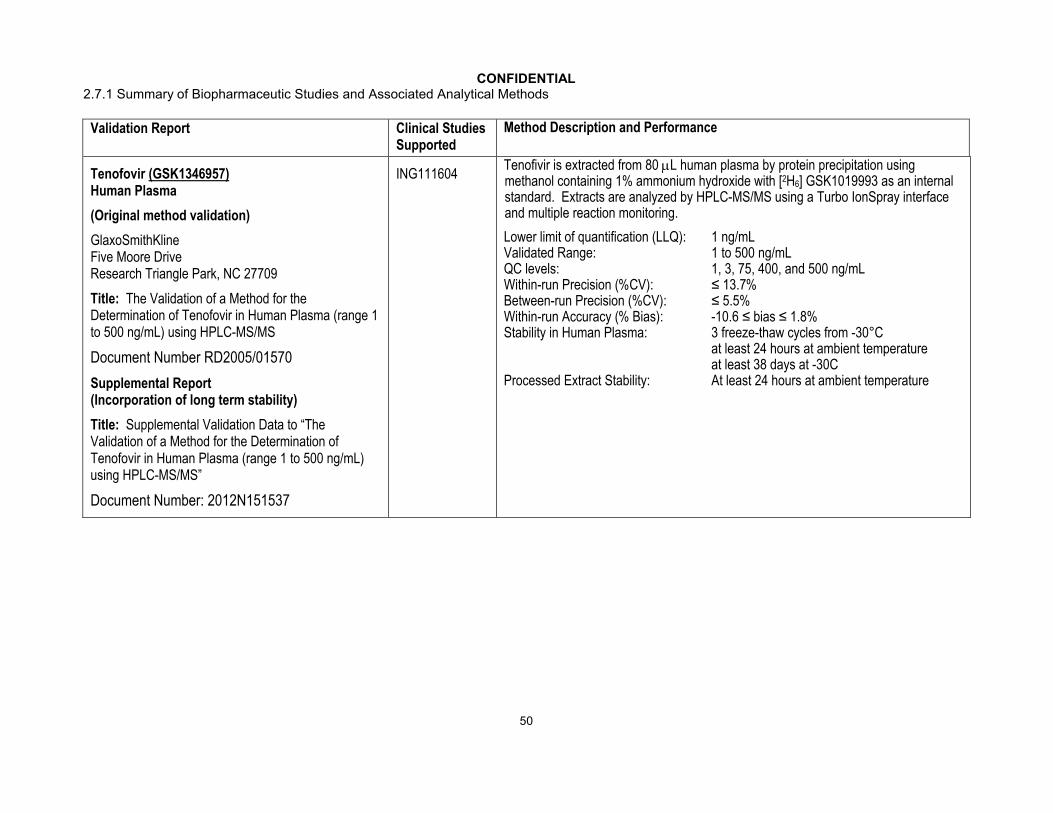
CONFIDENTIAL2.7.1 Summary of Biopharmaceutic Studies and Associated Analytical Methods
50
Validation Report Clinical Studies Supported
Method Description and Performance
Tenofovir (GSK1346957)Human Plasma
(Original method validation)
GlaxoSmithKlineFive Moore DriveResearch Triangle Park, NC 27709
Title: The Validation of a Method for the Determination of Tenofovir in Human Plasma (range 1 to 500 ng/mL) using HPLC-MS/MS
Document Number RD2005/01570
Supplemental Report(Incorporation of long term stability)
Title: Supplemental Validation Data to “The Validation of a Method for the Determination of Tenofovir in Human Plasma (range 1 to 500 ng/mL) using HPLC-MS/MS”
Document Number: 2012N151537
ING111604Tenofivir is extracted from 80 L human plasma by protein precipitation using methanol containing 1% ammonium hydroxide with [2H6] GSK1019993 as an internal standard. Extracts are analyzed by HPLC-MS/MS using a Turbo IonSpray interface and multiple reaction monitoring.
Lower limit of quantification (LLQ): 1 ng/mLValidated Range: 1 to 500 ng/mLQC levels: 1, 3, 75, 400, and 500 ng/mLWithin-run Precision (%CV): ≤ 13.7%Between-run Precision (%CV): ≤ 5.5%Within-run Accuracy (% Bias): -10.6 ≤ bias ≤ 1.8%Stability in Human Plasma: 3 freeze-thaw cycles from -30°C
at least 24 hours at ambient temperatureat least 38 days at -30C
Processed Extract Stability: At least 24 hours at ambient temperature

CONFIDENTIAL2.7.1 Summary of Biopharmaceutic Studies and Associated Analytical Methods
51
Validation Report Clinical Studies Supported
Method Description and Performance
Atazanavir (GW573140)Human Plasma (EDTA)
(Original method validation)
GlaxoSmithKlineFive Moore DriveResearch Triangle Park, NC 27709
Title: The Validation of a Method for the Determination of GW573140 (Atazanavir) and Ritonavir in Human Plasma (range 10 to 10000 ng/mL) Using HPLC-MS/MS
Document Number RD2009/00531
Supplemental Report(Incorporation of long term stability)
Title: Supplemental Validation Data to “The Validation of a Method for the Determination of GW573140 (Atazanavir) and Ritonavir in Human Plasma (range 10 to 10000 ng/mL) Using HPLC-MS/MS”
Document Number: 2012N152554
ING111854Atazanavir is extracted from 50 L human plasma by protein precipitation using acetonitrile containing [2H5]- atazanavir as an internal standard. Extracts are analyzed by HPLC-MS/MS using a Turbo IonSpray interface and multiple reaction monitoring.
Lower limit of quantification (LLQ): 10 ng/mLValidated Range: 10 to 10000 ng/mLQC levels: 10, 40, 400, 8000, and 10000 ng/mLWithin-run Precision (%CV): ≤ 12.5%Between-run Precision (%CV): ≤ 4.3%Within-run Accuracy (% Bias): -11.3 ≤ bias ≤ 6.9%Stability in Human Plasma: 3 freeze-thaw cycles from -30°C
at least 53 days at -30°Cat least 24 hours at ambient temperature
Processed Extract Stability: At least 72 hours at ambient temperature

CONFIDENTIAL2.7.1 Summary of Biopharmaceutic Studies and Associated Analytical Methods
52
Validation Report Clinical Studies Supported
Method Description and Performance
Amprenavir (GW141W94)Human Plasma (EDTA)
( original proprietary method validation)
USA
Title: Method Validation for the Quantitation of Amprenavir (GW141W94), Fosamprenavir (GW433908), and Ritonavir (GW278007A) in Tripotassium Ethylenediaminetetraacetic Acid Human Plasma (Range 10 to 10000 ng/mL Amprenavir and Ritonavir, and 5 to 100 ng/mL Fosamprenavir) by Turbo Ion Spray LC/MS/MS
Document Number CD2004/00524
Supplemental Report(Plasma long term stability)
Title: Addendum 1 to the Method Validation for the Quantitation of Amprenavir (GW141W94), Fosamprenavir (GW433908), and Ritonavir (GW278007A) in Tripotassium Ethylenediaminetetraacetic Acid Human Plasma (Range 10 to 10000 ng/mL Amprenavir and Ritonavir, and 5 to 100 ng/mL Fosamprenavir) by Turbo Ion Spray LC/MS/MS
Document Number: 2012N134430
ING113068Amprenavir is extracted from 50 L human plasma by solid phase extraction using [13C6]-Amprenavir as an internal standard. Extracts are analyzed by HPLC-MS/MS using a Turbo IonSpray interface and multiple reaction monitoring.
Lower limit of quantification (LLQ): 10 ng/mLValidated Range: 10 to 10000 ng/mLQC levels: 10, 30, 4000, 7500, and 10000 ng/mLWithin-run Precision (%CV): ≤ 5.4%Between-run Precision (%CV): ≤ 4.3%Within-run Accuracy (% Bias): -5.7≤ bias ≤ 5.5%Stability in Human Plasma: 3 freeze-thaw cycles from -20°C
at least 836 days at -20°Cat least 24 hours at ambient temperature
Processed Extract Stability: At least 58.5 hours at ambient temperature

CONFIDENTIAL2.7.1 Summary of Biopharmaceutic Studies and Associated Analytical Methods
53
Validation Report Clinical Studies Supported
Method Description and Performance
EfavirenzHuman Plasma (EDTA)(Original method validation)
GlaxoSmithKlineFive Moore DriveResearch Triangle Park, NC 27709
Title: The Validation of a Method for the Determination of Efavirenz (range 100 to 20000 ng/mL) in Human Plasma using HPLC-MS/MS
Document Number RD2010/00300
Supplemental Report(Incorporation of long term stability)
Title: Supplemental Validation Data to “The Validation of a Method for the Determination of Efavirenz in Human Plasma (range 100 to 20000 ng/mL) using HPLC-MS/MS”
Supplemental Report 2011N112543
ING114005Efavirenz is extracted from 50 L human plasma by protein precipitation using acetonitrile containing [2H4]-Efavirenz as an internal standard. Extracts are analyzed by HPLC-MS/MS using a Turbo IonSpray interface and multiple reaction monitoring.
Lower limit of quantification (LLQ): 100 ng/mLValidated Range: 100 to 20000 ng/mLQC levels: 100, 300, 4000, 16000, and 20000 ng/mLWithin-run Precision (%CV): ≤ 10.5%Between-run Precision (%CV): ≤ 4.0%Within-run Accuracy (% Bias): -8.9 ≤ bias ≤ 11.3%Stability in Human Plasma: 3 freeze-thaw cycles from -20°C
at least 96 days at -20°Cat least 24 hours at ambient temperature
Processed Extract Stability: At least 24 hours at ambient temperature
Stability in Human Blood: at least 4 hours at room temperature

CONFIDENTIAL2.7.1 Summary of Biopharmaceutic Studies and Associated Analytical Methods
54
Validation Report Clinical Studies Supported
Method Description and Performance
IohexolHuman Plasma (sodium heparin)
( original proprietary method validation)
, UK,
Title: Validation Report for the Determination of Iohexol in Human Plasma by LC-MS/MS
Document Number 2010N111226
Supplemental Report(Incorporation of long term stability)
Title: Supplemental Validation Data: Long-Term Stability of Iohexol in Human Plasma Sodium Heparin by LC/MS/MS.
Supplemental Report 2012N150761
ING114819Iohexol is extracted from 100 L human plasma by protein precipitation using zinc sulfate. Extracts are analyzed by HPLC-MS/MS using a Turbo IonSpray interface and multiple reaction monitoring.
Lower limit of quantification (LLQ): 1.02 g/mLValidated Range: 1.02 to 100.11 g/mLQC levels: 1.02, 2.89, 48.39, and 99.33 g/mLWithin-run Precision (%CV): ≤ 9.6%Between-run Precision (%CV): ≤ 7.0%Within-run Accuracy (% Bias): -6 ≤ bias ≤ 8%Stability in Human Plasma: 3 freeze-thaw cycles from -20°C
at least 65 days at -20°Cat least 4 hours at ambient temperature
Processed Extract Stability: At least 31 hours at ambient temperature
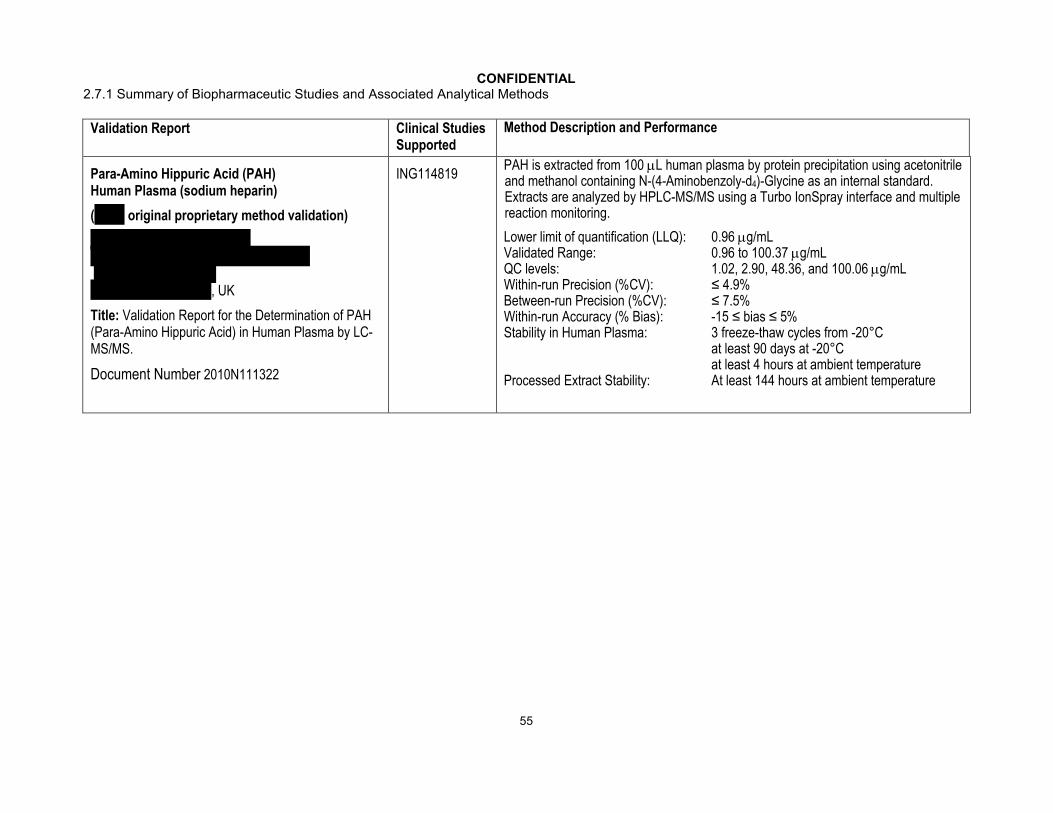
CONFIDENTIAL2.7.1 Summary of Biopharmaceutic Studies and Associated Analytical Methods
55
Validation Report Clinical Studies Supported
Method Description and Performance
Para-Amino Hippuric Acid (PAH) Human Plasma (sodium heparin)
( original proprietary method validation)
, UK
Title: Validation Report for the Determination of PAH (Para-Amino Hippuric Acid) in Human Plasma by LC-MS/MS.
Document Number 2010N111322
ING114819PAH is extracted from 100 L human plasma by protein precipitation using acetonitrile and methanol containing N-(4-Aminobenzoly-d4)-Glycine as an internal standard. Extracts are analyzed by HPLC-MS/MS using a Turbo IonSpray interface and multiple reaction monitoring.
Lower limit of quantification (LLQ): 0.96 g/mLValidated Range: 0.96 to 100.37 g/mLQC levels: 1.02, 2.90, 48.36, and 100.06 g/mLWithin-run Precision (%CV): ≤ 4.9%Between-run Precision (%CV): ≤ 7.5%Within-run Accuracy (% Bias): -15 ≤ bias ≤ 5%Stability in Human Plasma: 3 freeze-thaw cycles from -20°C
at least 90 days at -20°Cat least 4 hours at ambient temperature
Processed Extract Stability: At least 144 hours at ambient temperature
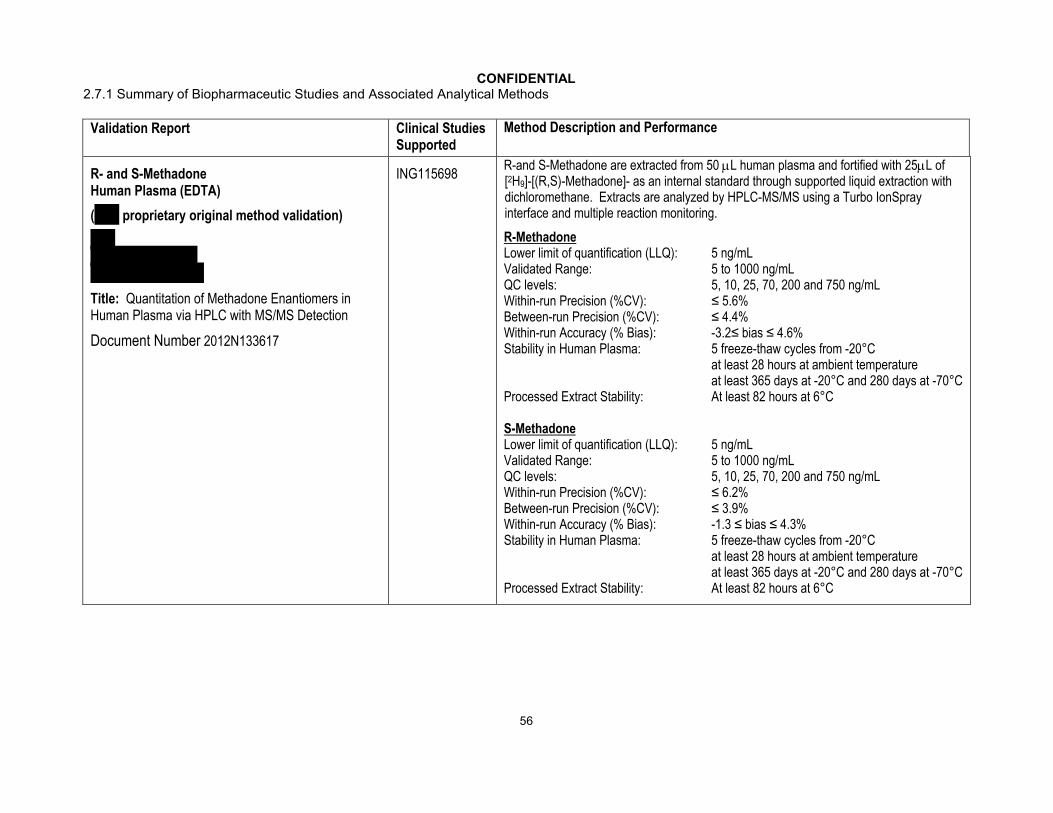
CONFIDENTIAL2.7.1 Summary of Biopharmaceutic Studies and Associated Analytical Methods
56
Validation Report Clinical Studies Supported
Method Description and Performance
R- and S-Methadone Human Plasma (EDTA)
( proprietary original method validation)
Title: Quantitation of Methadone Enantiomers in Human Plasma via HPLC with MS/MS Detection
Document Number 2012N133617
ING115698R-and S-Methadone are extracted from 50 L human plasma and fortified with 25L of [2H9]-[(R,S)-Methadone]- as an internal standard through supported liquid extraction with dichloromethane. Extracts are analyzed by HPLC-MS/MS using a Turbo IonSpray interface and multiple reaction monitoring.
R-MethadoneLower limit of quantification (LLQ): 5 ng/mLValidated Range: 5 to 1000 ng/mLQC levels: 5, 10, 25, 70, 200 and 750 ng/mLWithin-run Precision (%CV): ≤ 5.6%Between-run Precision (%CV): ≤ 4.4%Within-run Accuracy (% Bias): -3.2≤ bias ≤ 4.6%Stability in Human Plasma: 5 freeze-thaw cycles from -20°C
at least 28 hours at ambient temperatureat least 365 days at -20°C and 280 days at -70°C
Processed Extract Stability: At least 82 hours at 6°C
S-MethadoneLower limit of quantification (LLQ): 5 ng/mLValidated Range: 5 to 1000 ng/mLQC levels: 5, 10, 25, 70, 200 and 750 ng/mLWithin-run Precision (%CV): ≤ 6.2%Between-run Precision (%CV): ≤ 3.9%Within-run Accuracy (% Bias): -1.3 ≤ bias ≤ 4.3%Stability in Human Plasma: 5 freeze-thaw cycles from -20°C
at least 28 hours at ambient temperatureat least 365 days at -20°C and 280 days at -70°C
Processed Extract Stability: At least 82 hours at 6°C

CONFIDENTIAL2.7.1 Summary of Biopharmaceutic Studies and Associated Analytical Methods
57
Validation Report Clinical Studies Supported
Method Description and Performance
Rilpivirine (TMC278)Human Plasma (heparin)
(Proprietary method validation of )
, The Netherlands
Title: Validation of a method for the determination of JNJ-16150108 (TMC278) in human plasma samples
Document Number 2012N144315
LAI116181TMC278 is extracted from 100 L human plasma by protein precipitation using methanol containing isotopically labelled TMC278 as an internal standard. Extracts are analyzed by HPLC-MS/MS using a Turbo IonSpray interface and multiple reaction monitoring.
Lower limit of quantification (LLQ): 1 ng/mLValidated Range: 1 to 2000 ng/mLQC levels: 1, 3, 50, and 1600 ng/mLWithin-run Precision (%CV): ≤ 5.4%Between-run Precision (%CV): ≤ 4.7%Within-run Accuracy (% Bias): -3.3≤ bias ≤ 14.1%Stability in Human Plasma: 3 freeze-thaw cycles from -18°C
at least 1528 days at -18°CProcessed Extract Stability: At least 119 hours at 10°C
Telaprevir Human Plasma (EDTA with 5.0 % Phosphoric Acid)
( original proprietary method validation)
Title: Quantitation of (S)-Telaprevir in Human Plasma via HPLC with MS/MS Detection
Document Number 2012N150656
ING115697A 25µL sample aliquot is fortified with isotopically labelled telaprevir and telaprevir is isolated through supported liquid extraction using dichloromethane/MtBE (1:2). Extracts are analyzed by HPLC-MS/MS using a Turbo IonSpray interface and multiple reaction monitoring.
Lower limit of quantification (LLQ): 0.1 µg/mLValidated Range: 0.1 to 20 µg/mLQC levels: 0.10, 0.24, 0.50, 1.5, 4.0, and 16.0 µg/mLWithin-run Precision (%CV): ≤ 2.2%Between-run Precision (%CV): ≤ 1.7%Within-run Accuracy (% Bias): -5.6 ≤ bias ≤ 2.5%Stability in Human Plasma: 5 freeze-thaw cycles from -20°C or -70°C
at least 24 days at -20°C or -70°Cat least 24 hours at room temperature
Processed Extract Stability: At least 108 hours at 2 to 8°C

CONFIDENTIAL2.7.1 Summary of Biopharmaceutic Studies and Associated Analytical Methods
58
Validation Report Clinical Studies Supported
Method Description and Performance
AbacavirHuman Plasma (EDTA)( original proprietary method validation)
Title: Determination of Abacavir in Human Plasma by LC-MS/MS
Document Number: 2012N133184
ING114581Abacavir is extracted from 200 L human plasma by protein precipitation using methanol containing 2’,3’-Dideoxyinosine as an internal standard. Extracts are analyzed by HPLC-MS/MS using a Turbo IonSpray interface and multiple reaction monitoring.
Lower limit of quantification (LLQ): 5 ng/mLValidated Range: 5 to 5000 ng/mLQC levels: 5, 15, 250, 1000, and 4000 ng/mLWithin-run Precision (%CV): ≤ 9.6%Between-run Precision (%CV): ≤ 7.7%Within-run Accuracy (% Bias): -10.1 ≤ bias ≤ 6.7%Stability in Human Plasma: 3 freeze-thaw cycles from -70°C
at least 80 days at -70°Cat least 15 hours at room temperature
Processed Extract Stability: 110 hours at 4°C

CONFIDENTIAL2.7.1 Summary of Biopharmaceutic Studies and Associated Analytical Methods
59
Validation Report Clinical Studies Supported
Method Description and Performance
LamivudineHuman Plasma (EDTA)( original proprietary method validation)
Title: LC/MS/MS Assay Validation of Zidovudine, Lamivudine, and Stavudine in Human Plasma
Document Number: 2012N133186
Referenced Validation Report(Long Term, Room Temperature, and Freeze-Thaw Stability of Lamivudine in human plasma)
Title: LC/MS/MS Assay Validation of Zalcitabine (ddC) and Lamivudine (3TC) in K2 EDTA Human Plasma
Document Number: 2012N152558
ING114581Lamivudine is extracted from 100 L human plasma by protein precipitation using methanol containing 3’-Deoxythymidine as an internal standard. Extracts are analyzed by HPLC-MS/MS using a Turbo IonSpray interface and multiple reaction monitoring.
Lower limit of quantification (LLQ): 2 ng/mLValidated Range: 2 to 2000 ng/mLQC levels: 2, 5, 15.500, and 1800 ng/mLWithin-run Precision (%CV): ≤ 5.7%Between-run Precision (%CV): ≤ 4.5%Within-run Accuracy (% Bias): -13.6 ≤ bias ≤ 1.5%Stability in Human Plasma: 3 freeze-thaw cycles from -70°C
at least 310 days at -70°Cat least 6.5 hours at ambient temperature
Autosampler Stability: At least 278 hours at room temperature

CONFIDENTIAL2.7.1 Summary of Biopharmaceutic Studies and Associated Analytical Methods
60
Validation Report Clinical Studies Supported
Method Description and Performance
Ethinyl EstradiolHuman Plasma(Potassium Oxalate/ Sodium Fluoride)
( original proprietary method validation)
Title: Quantitation of 17α-Ethinyl Estradiol and Norgestrel in Human Plasma via HPLC with MS/MS Detection (LCMSC 256)
Document Number 2012N151915
ING111855Ethinyl Estradiol is extracted from 500 L human plasma by protein precipitation followed by a derivitization using (d4)- Ethinyl Estradiol as an internal standard. Extracts are analyzed by HPLC-MS/MS using a Turbo IonSpray interface and multiple reaction monitoring.
Lower limit of quantification (LLQ): 2 pg/mLValidated Range: 2 to 500 pg/mLQC levels: 2, 5, 50, and 500 pg/mLWithin-run Precision (%CV): ≤ 19.7%Between-run Precision (%CV): ≤ 15.3%Within-run Accuracy (% Bias): -16.5 ≤ bias ≤ 8.8%Stability in Human Plasma: 5 freeze-thaw cycles from -80°C
at least 811 days at -70°Cat least 28 hours at ambient temperature
Processed Extract Stability: At least 434 hours at 2 to 8°C
NorelgestrominHuman Plasma(Potassium Oxalate/ Sodium Fluoride)
( proprietary method validation)
Title: Quantitation of Norelgestromin in Human Plasma via HPLC with MS/MS Detection (LCMSC 372)
Document Number 2012N151913
ING111855Norelgestromin is extracted from 500 L human plasma by protein precipitation using (d5)-desacetylnorgestimate as an internal standard. Extracts are analyzed by HPLC-MS/MS using a Turbo IonSpray interface and multiple reaction monitoring.
Lower limit of quantification (LLQ): 0.02 ng/mLValidated Range: 0.02 to 10 ng/mLQC levels: 0.02, 0.05, 0.50, and 7.50 ng/mLWithin-run Precision (%CV): ≤ 3.7%Between-run Precision (%CV): ≤ 4.1%Within-run Accuracy (% Bias): -6.3≤ bias ≤ 2.1%Stability in Human Plasma: 4 freeze-thaw cycles from -70°C
at least 515 days at -70°Cat least 24 hours at ambient temperature
Processed Extract Stability: At least 20 days at 2 to 8°C
e. For the first freeze/thaw cycle, samples were frozen for a minimum of 12 hours before thawing at room temperature. For subsequent cycles, the samples were frozen for at least 12 hours then completely thawed at room temperature before re-freezing to start another cycle.
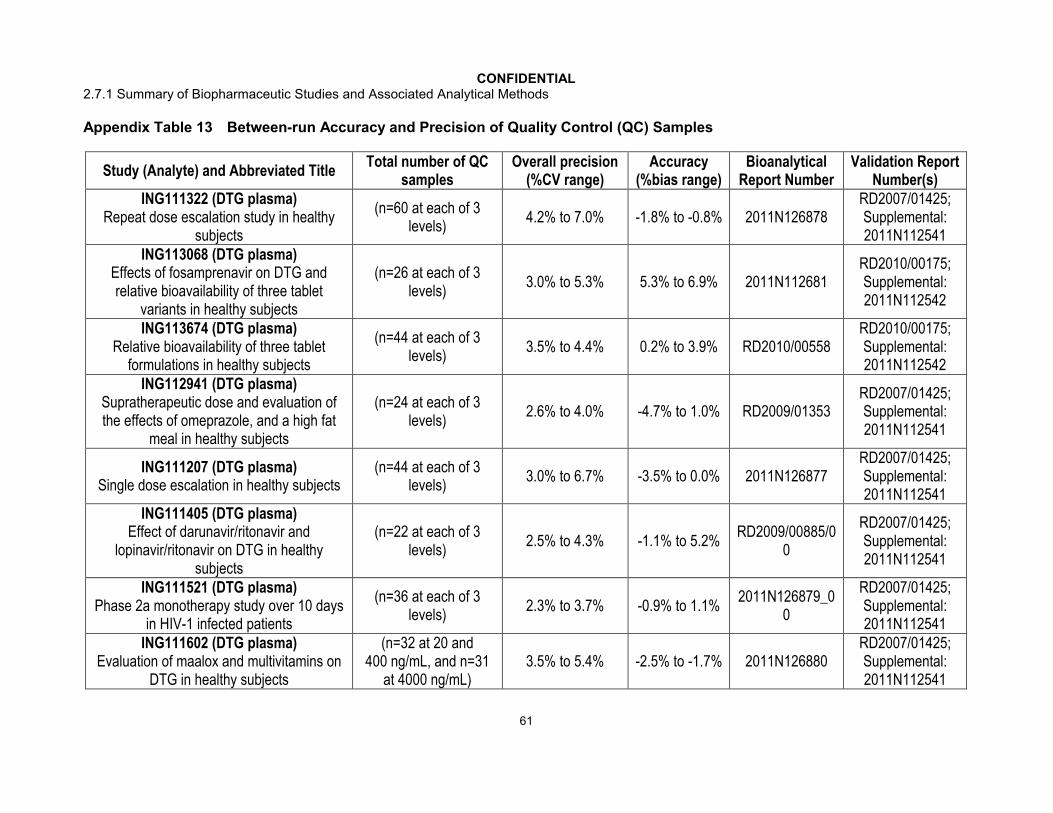
CONFIDENTIAL2.7.1 Summary of Biopharmaceutic Studies and Associated Analytical Methods
61
Appendix Table 13 Between-run Accuracy and Precision of Quality Control (QC) Samples
Study (Analyte) and Abbreviated TitleTotal number of QC
samplesOverall precision
(%CV range)Accuracy
(%bias range)Bioanalytical
Report NumberValidation Report
Number(s)ING111322 (DTG plasma)
Repeat dose escalation study in healthy subjects
(n=60 at each of 3 levels)
4.2% to 7.0% -1.8% to -0.8% 2011N126878RD2007/01425;Supplemental:2011N112541
ING113068 (DTG plasma)Effects of fosamprenavir on DTG and relative bioavailability of three tablet
variants in healthy subjects
(n=26 at each of 3 levels)
3.0% to 5.3% 5.3% to 6.9% 2011N112681RD2010/00175;Supplemental:2011N112542
ING113674 (DTG plasma)Relative bioavailability of three tablet
formulations in healthy subjects
(n=44 at each of 3 levels)
3.5% to 4.4% 0.2% to 3.9% RD2010/00558RD2010/00175;Supplemental:2011N112542
ING112941 (DTG plasma)Supratherapeutic dose and evaluation of the effects of omeprazole, and a high fat
meal in healthy subjects
(n=24 at each of 3 levels)
2.6% to 4.0% -4.7% to 1.0% RD2009/01353RD2007/01425;Supplemental:2011N112541
ING111207 (DTG plasma)Single dose escalation in healthy subjects
(n=44 at each of 3 levels)
3.0% to 6.7% -3.5% to 0.0% 2011N126877RD2007/01425;Supplemental:2011N112541
ING111405 (DTG plasma)Effect of darunavir/ritonavir and
lopinavir/ritonavir on DTG in healthy subjects
(n=22 at each of 3 levels)
2.5% to 4.3% -1.1% to 5.2%RD2009/00885/0
0
RD2007/01425;Supplemental:2011N112541
ING111521 (DTG plasma)Phase 2a monotherapy study over 10 days
in HIV-1 infected patients
(n=36 at each of 3 levels)
2.3% to 3.7% -0.9% to 1.1%2011N126879_0
0
RD2007/01425;Supplemental:2011N112541
ING111602 (DTG plasma)Evaluation of maalox and multivitamins on
DTG in healthy subjects
(n=32 at 20 and 400 ng/mL, and n=31
at 4000 ng/mL)3.5% to 5.4% -2.5% to -1.7% 2011N126880
RD2007/01425;Supplemental:2011N112541
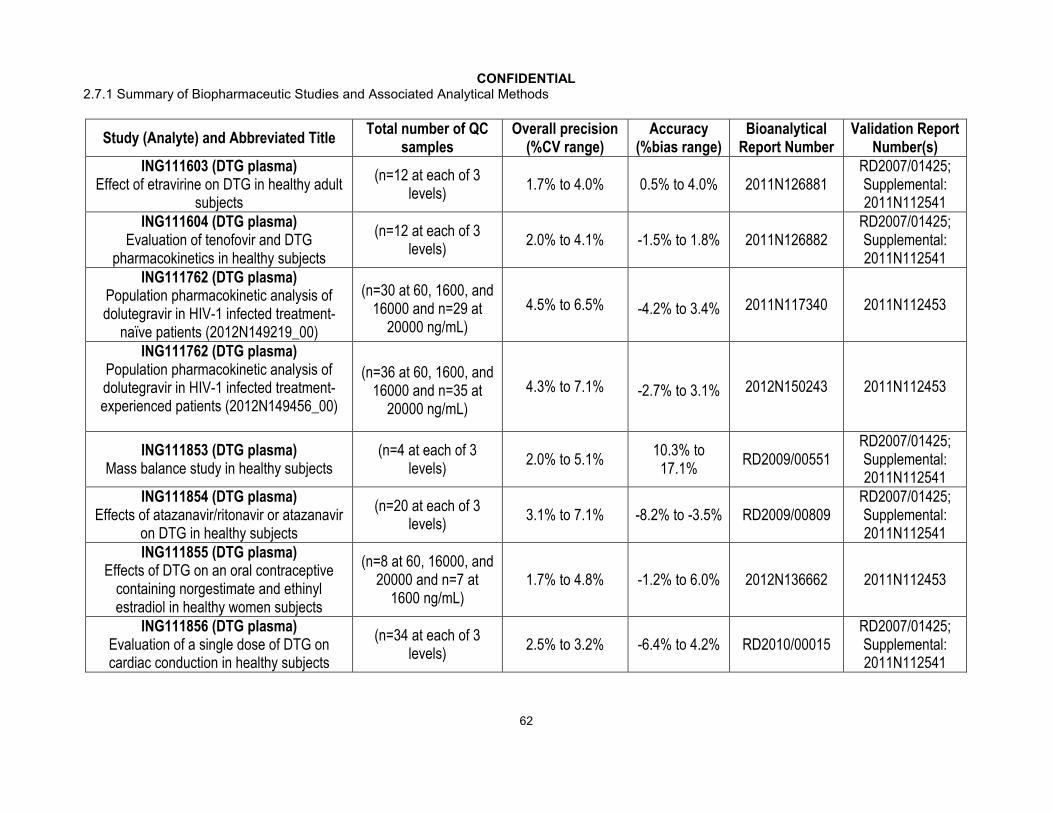
CONFIDENTIAL2.7.1 Summary of Biopharmaceutic Studies and Associated Analytical Methods
62
Study (Analyte) and Abbreviated TitleTotal number of QC
samplesOverall precision
(%CV range)Accuracy
(%bias range)Bioanalytical
Report NumberValidation Report
Number(s)ING111603 (DTG plasma)
Effect of etravirine on DTG in healthy adult subjects
(n=12 at each of 3 levels)
1.7% to 4.0% 0.5% to 4.0% 2011N126881RD2007/01425;Supplemental:2011N112541
ING111604 (DTG plasma)Evaluation of tenofovir and DTG
pharmacokinetics in healthy subjects
(n=12 at each of 3 levels)
2.0% to 4.1% -1.5% to 1.8% 2011N126882RD2007/01425;Supplemental:2011N112541
ING111762 (DTG plasma)Population pharmacokinetic analysis of dolutegravir in HIV-1 infected treatment-
naïve patients (2012N149219_00)
(n=30 at 60, 1600, and 16000 and n=29 at
20000 ng/mL)
4.5% to 6.5% -4.2% to 3.4% 2011N117340 2011N112453
ING111762 (DTG plasma)Population pharmacokinetic analysis of dolutegravir in HIV-1 infected treatment-experienced patients (2012N149456_00)
(n=36 at 60, 1600, and 16000 and n=35 at
20000 ng/mL)
4.3% to 7.1% -2.7% to 3.1% 2012N150243 2011N112453
ING111853 (DTG plasma)Mass balance study in healthy subjects
(n=4 at each of 3 levels)
2.0% to 5.1%10.3% to
17.1%RD2009/00551
RD2007/01425;Supplemental:2011N112541
ING111854 (DTG plasma)Effects of atazanavir/ritonavir or atazanavir
on DTG in healthy subjects
(n=20 at each of 3 levels)
3.1% to 7.1% -8.2% to -3.5% RD2009/00809RD2007/01425;Supplemental:2011N112541
ING111855 (DTG plasma)Effects of DTG on an oral contraceptive
containing norgestimate and ethinyl estradiol in healthy women subjects
(n=8 at 60, 16000, and 20000 and n=7 at
1600 ng/mL)1.7% to 4.8% -1.2% to 6.0% 2012N136662 2011N112453
ING111856 (DTG plasma)Evaluation of a single dose of DTG on cardiac conduction in healthy subjects
(n=34 at each of 3 levels)
2.5% to 3.2% -6.4% to 4.2% RD2010/00015RD2007/01425;Supplemental:2011N112541
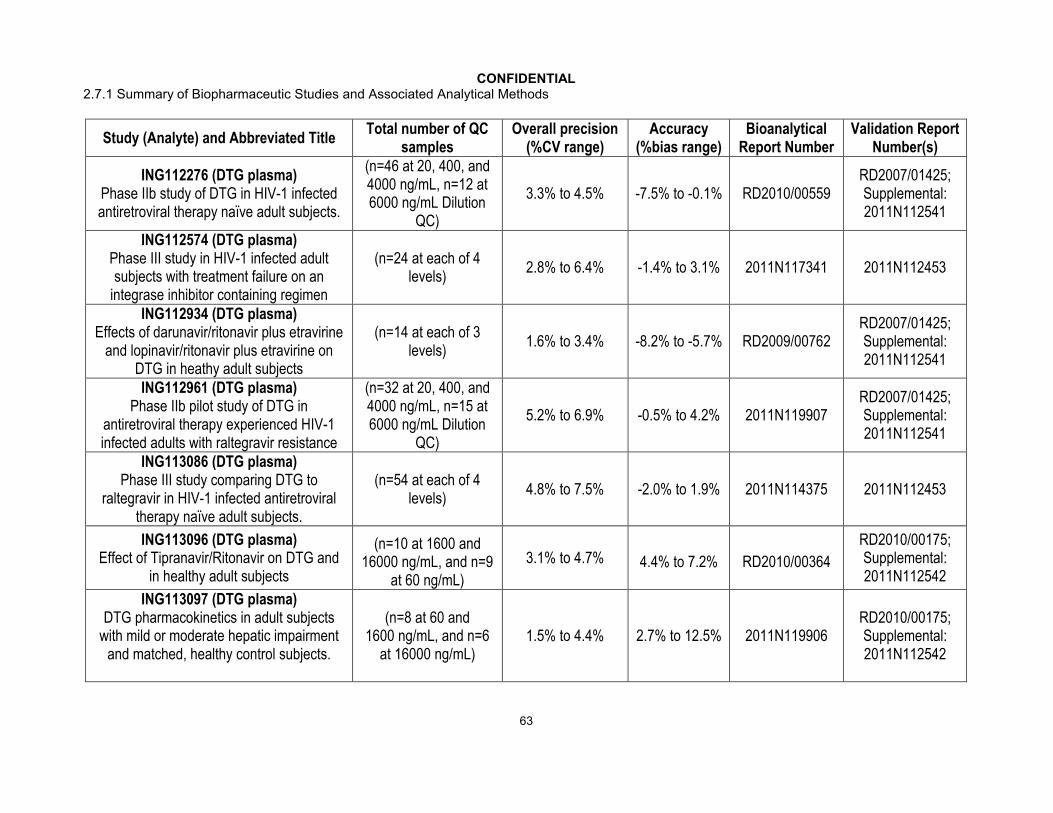
CONFIDENTIAL2.7.1 Summary of Biopharmaceutic Studies and Associated Analytical Methods
63
Study (Analyte) and Abbreviated TitleTotal number of QC
samplesOverall precision
(%CV range)Accuracy
(%bias range)Bioanalytical
Report NumberValidation Report
Number(s)
ING112276 (DTG plasma)Phase IIb study of DTG in HIV-1 infected antiretroviral therapy naïve adult subjects.
(n=46 at 20, 400, and 4000 ng/mL, n=12 at 6000 ng/mL Dilution
QC)
3.3% to 4.5% -7.5% to -0.1% RD2010/00559RD2007/01425;Supplemental:2011N112541
ING112574 (DTG plasma)Phase III study in HIV-1 infected adult subjects with treatment failure on an
integrase inhibitor containing regimen
(n=24 at each of 4 levels)
2.8% to 6.4% -1.4% to 3.1% 2011N117341 2011N112453
ING112934 (DTG plasma)Effects of darunavir/ritonavir plus etravirine
and lopinavir/ritonavir plus etravirine on DTG in heathy adult subjects
(n=14 at each of 3 levels)
1.6% to 3.4% -8.2% to -5.7% RD2009/00762RD2007/01425;Supplemental:2011N112541
ING112961 (DTG plasma)Phase IIb pilot study of DTG in
antiretroviral therapy experienced HIV-1 infected adults with raltegravir resistance
(n=32 at 20, 400, and 4000 ng/mL, n=15 at 6000 ng/mL Dilution
QC)
5.2% to 6.9% -0.5% to 4.2% 2011N119907RD2007/01425;Supplemental:2011N112541
ING113086 (DTG plasma)Phase III study comparing DTG to
raltegravir in HIV-1 infected antiretroviral therapy naïve adult subjects.
(n=54 at each of 4 levels)
4.8% to 7.5% -2.0% to 1.9% 2011N114375 2011N112453
ING113096 (DTG plasma)Effect of Tipranavir/Ritonavir on DTG and
in healthy adult subjects
(n=10 at 1600 and 16000 ng/mL, and n=9
at 60 ng/mL)
3.1% to 4.7% 4.4% to 7.2% RD2010/00364
RD2010/00175;Supplemental:2011N112542
ING113097 (DTG plasma)DTG pharmacokinetics in adult subjects
with mild or moderate hepatic impairment and matched, healthy control subjects.
(n=8 at 60 and 1600 ng/mL, and n=6
at 16000 ng/mL)1.5% to 4.4% 2.7% to 12.5% 2011N119906
RD2010/00175;Supplemental:2011N112542

CONFIDENTIAL2.7.1 Summary of Biopharmaceutic Studies and Associated Analytical Methods
64
Study (Analyte) and Abbreviated TitleTotal number of QC
samplesOverall precision
(%CV range)Accuracy
(%bias range)Bioanalytical
Report NumberValidation Report
Number(s)ING113099 (DTG plasma)
Effect of rifampin and rifabutin on DTG in healthy volunteers
(n=12 at each of 4 levels)
6.1% to 7.9% 1.3% to 6.1% 2011N117339 2011N112453
ING113125 (DTG plasma)DTG pharmacokinetics in subjects with severe renal impairment and matched
healthy controls.
(n=8 at each of 3 levels)
7.3% to 7.7% 0.2% to 3.1% 2012N135064RD2010/00175;Supplemental:2011N112542
ING114005 (DTG plasma)Effect of efavirenz on DTG in healthy adult
subjects.
(n=14 at 60 and 16000 ng/mL, and n=13 at
1600 ng/mL)3.0% to 5.3% 4.7% to 6.6% RD2010/00365
RD2010/00175;Supplemental:2011N112542
ING114556 (DTG plasma)Relative bioavailability study of a tablet vs. pediatric granule formulations and effect of water types and infant formula in healthy
volunteers
(n=26 at each of 4 levels)
3.7% to 8.4% 0.7% to 4.2% 2011N123807 2011N112453
ING114581 (DTG plasma)Relative bioavailability of two fixed-dose combination tablets vs single DTG plus
Epsicom in healthy adult subjects
(n=16 at each of 4 levels)
4.8% to 6.4% -3.2% to 0.2% 2011N120851 2011N112453
ING114819 (DTG plasma)Effect of DTG on Iohexol and PAH
Clearance in Healthy Subjects
(n=12 at each of 3 levels)
2.6% to 4.5% 9.0% to 10.9% 2011N112682RD2010/00175;Supplemental:2011N112542
ING115381 (DTG plasma)Pharmacokinetics of DTG in healthy
Japanese subjects
(n=4 at each of 4 levels)
4.0% to 7.7% -4.0% to 6.2% 2012N145039 2011N112453
ING115696 (DTG plasma)Effect of a high prednisone dose on DTG in
healthy adult subjects
(n=6 at each of 4 levels)
1.9% to 13.9% -8.7% to -0.3% 2011N124876 2011N112453

CONFIDENTIAL2.7.1 Summary of Biopharmaceutic Studies and Associated Analytical Methods
65
Study (Analyte) and Abbreviated TitleTotal number of QC
samplesOverall precision
(%CV range)Accuracy
(%bias range)Bioanalytical
Report NumberValidation Report
Number(s)ING115697 (DTG plasma)
Effect of boceprevir and telaprevir on DTGpharmacokinetics in healthy adult subjects
(n=16 at each of 4 levels)
1.8% to 4.1% -2.2% to 3.9% 2012N136665 2011N112453
ING115698 (DTG plasma)Effect of DTG on methadone in opiate-dependent, HIV seronegative subjects.
(n=4 at each of 4 levels)
1.5% to 3.3% -5.1% to 4.8% 2012N132253 2011N112453
ING116070 (DTG plasma)CNS and plasma exposure to DTG in HIV-1 infected antiretroviral naive adult subjects
given DTG and abacavir/lamivudine
(n=2 at each of 3 levels)
2.4% to 4.5% -2.8% to 1.8% 2012N150565
RD2010/00175;Supplemental:2011N112542
LAI116181 (DTG plasma)Evaluation of the pharmacokinetic of DTG
and RPV in healthy adult subjects.
(n=6 at each of 4 levels)
3.1% to 4.8% -5.7% to 3.6% 2012N132345 2011N112453
P1093 (GSK No.: ING112578)(DTG plasma)
Phase I/II DTG in HIV-1 Infected Infants, Children and Adolescents
(n=38 at 15 and 450 ng/mL, and n=39 at
9000 ng/mL)
5.0% to 5.8% -6.4% to -3.7% 2012N149534 2012N149534
IRB #11-1733 (GSK No.: ING116195)(DTG-Male Plasma)
DTG distribution to male seminal fluid and rectal tissue in healthy male subjects
(n=12 at each of 3 levels)
see report see report 2012N149423 2012N149423
IRB #11-1011 (GSK No.: ING115465)(DTG-Female Plasma)
DTG distribution to female genitourinary tract in healthy female subjects
(n=6 at each of 3 levels)
see report see report 2012N149420 2012N149420
IRB #11-1733 (GSK No.: ING116195)(DTG-Seminal Plasma)
DTG distribution to male seminal fluid and rectal tissue in healthy male subjects
(n=6 at each of 3 levels)
see report see report 2012N149428 2012N149428

CONFIDENTIAL2.7.1 Summary of Biopharmaceutic Studies and Associated Analytical Methods
66
Study (Analyte) and Abbreviated TitleTotal number of QC
samplesOverall precision
(%CV range)Accuracy
(%bias range)Bioanalytical
Report NumberValidation Report
Number(s)IRB #11-1733 (GSK No.: ING116195)
(DTG-Rectal Fluid)DTG distribution to male seminal fluid and
rectal tissue in healthy male subjects
(n=6 at each of 3 levels)
see report see report 2012N149425 2012N149425
IRB #11-1733 (GSK No.: ING116195)(DTG-Rectal Tissue)
DTG distribution to male seminal fluid and rectal tissue in healthy male subjects
(n=2 at each of 3 levels)
see report see report 2012N149427 2012N149427
IRB #11-1011 (GSK No.: ING115465)(DTG-Cervicovaginal Fluid)
DTG distribution to female genitourinary tract in healthy female subjects
(n=14 at each of 3 levels)
see report see report 2012N149418 2012N149418
IRB #11-1011 (GSK No.: ING115465)(DTG-Cervical and Vaginal Tissue)
DTG distribution to female genitourinary tract in healthy female subjects
(n=2 at each of 3 levels)
see report see report 2012N149416 2012N149416
ING113097 (DTG-PB)DTG pharmacokinetics in adult subjects
with mild or moderate hepatic impairment and matched, healthy control subjects.
(n=6 at each of 3 levels)
3.4% to 8.0% 3.7% to 8.6% 2011N124287 2011N112679
ING113125 (DTG-PB)DTG pharmacokinetics in subjects with severe renal impairment and matched
healthy controls.
(n=4 at each of 3 levels)
1.7% to 7.7% -6.2% to 2.7% 2012N135066 2011N112679
ING116070 (DTG-PB)CNS and plasma exposure to DTG in HIV-1 infected antiretroviral naive adult subjects
given DTG and abacavir/lamivudine
(n=2 at each of 3 levels)
1.7% to 2.4% -5.0% to 2.5% 2012N135067 2011N112679

CONFIDENTIAL2.7.1 Summary of Biopharmaceutic Studies and Associated Analytical Methods
67
Study (Analyte) and Abbreviated TitleTotal number of QC
samplesOverall precision
(%CV range)Accuracy
(%bias range)Bioanalytical
Report NumberValidation Report
Number(s)ING116070 (DTG-CSF)
CNS and plasma exposure to DTG in HIV-1 infected antiretroviral naive adult subjects
given DTG and abacavir/lamivudine
(n=4 at each of 4 levels)
1.6% to 6.0% -3.5% to 0.7% 2012N136666 2012N145767
ING113125 (GSK2832500 plasma)Pharmacokinetic study of DTG in subjects with severe renal impairment and matched
healthy controls.
(n=8 at each of 3 levels)
2.9% to 7.7% -2.7% to 2.3% 2012N143609 2011N122389
ING111322 (MDZ plasma)Repeat dose escalation study in healthy
subjects
(n=4 at each of 3 levels)
4.2% to 6.4% 2.8% to 9.4% 2012N135192FD2006/00038Supplemental:2012N151540
ING111405 (DRV plasma)Effect of darunavir/ritonavir and
lopinavir/ritonavir on DTG in healthy subjects
(n=8 at each of 3 levels)
1.8% to 7.8% -6.2% to 0.6% RD2010/00433RD2008/01543;Supplemental:2012N151539
ING111405 (RTV plasma)Effect of darunavir/ritonavir and
lopinavir/ritonavir on DTG in healthy subjects
(n=14 at each of 3 levels)
3.2% to 6.1% -8.9% to 0.8% RD2010/00433RD2008/01543;Supplemental:2012N151539
ING111405 (LPV plasma)Effect of darunavir/ritonavir and
lopinavir/ritonavir on DTG
(n=8 at each of 3 levels)
2.0% to 3.8% -5.9% to -3.4% RD2010/00433RD2008/01543;Supplemental:2012N151539
ING111603 (ETV plasma)Effect of etravirine on DTG in healthy
subjects
(n=6 at each of 3 levels)
2.3% to 6.3% -1.3% to 4.6% 2012N135193RD2008/01746;Supplemental:2012N151538
ING111604 (TFV plasma)Evaluation of tenofovir and DTG
pharmacokinetic in healthy subjects
(n=12 at each of 3 levels)
1.2% to 5.4% 2.2% to 9.3% 2012N135194RD2005/01570;Supplemental:2012N151537

CONFIDENTIAL2.7.1 Summary of Biopharmaceutic Studies and Associated Analytical Methods
68
Study (Analyte) and Abbreviated TitleTotal number of QC
samplesOverall precision
(%CV range)Accuracy
(%bias range)Bioanalytical
Report NumberValidation Report
Number(s)ING112934 (ETV plasma)
Effects of darunavir/ritonavir plus etravirine and lopinavir/ritonavir plus etravirine on
DTG in healthy adult subjects
(n=4 at each of 3 levels)
1.6% to 5.5% 2.8% to 5.4% RD2009/00734RD2008/01746;Supplemental:2012N151538
ING111854 (ATV plasma)Effects of atazanavir/ritonavir or atazanavir
on DTG in healthy subjects
(n=8 at each of 3 levels)
1.2% to 2.2% 0.5% to 3.9% RD2009/01304RD2009/00531;Supplemental:2012N152554
ING111855 (EE plasma)Effects of DTG on an oral contraceptive
containing norgestimate and ethinyl estradiol in healthy women subjects
(n=10 at each of 5 levels)
3.5% to 6.6% 0.7% to 4.3% 2012N135878 2012N151915
ING111855 (NGMN plasma)Effects of DTG on an oral contraceptive
containing norgestimate and ethinyl estradiol in healthy women subjects
(n=12 at each of 5 levels)
2.4% to 13.1% -5.8% to 4.2% 2012N135879 2012N151913
ING113068 (APV)Effects of fosamprenavir on DTG and relative bioavailability of three tablet
variants
(n=6 at each of 3 levels)
1.9% to 16.6% -7.0% to 3.0% 2011N117085CD2004/00524Supplemental:2012N134430
ING115698 (R-MTD plasma)Effect of DTG on methadone in opiate-dependent, HIV seronegative subjects.
(n=8 at each of 5 levels)
1.8% to 3.3% -3.3% to -0.9% 2012N132495 2012N133617
ING115698 (S-MTD plasma)Effect of DTG on methadone in opiate-dependent, HIV seronegative subjects.
(n=8 at each of 5 levels)
2.0% to 4.9% -4.6% to -1.9% 2012N132495 2012N133617
ING114005 (EFV plasma)Effect of efavirenz on DTG in healthy
subjects.
(n=6 at each of 3 levels)
2.4% to 5.8% 1.5% to 12.4% RD2010/00560RD2010/00300;Supplemental:2011N112543

CONFIDENTIAL2.7.1 Summary of Biopharmaceutic Studies and Associated Analytical Methods
69
Study (Analyte) and Abbreviated TitleTotal number of QC
samplesOverall precision
(%CV range)Accuracy
(%bias range)Bioanalytical
Report NumberValidation Report
Number(s)ING114581 (ABC plasma)
Relative bioavailability of two fixed-dose combination tablets vs single DTG plus
Epsicom in healthy adult subjects
(n=22 at each of 4 levels)
3.4% to 6.2% -3.2% to 3.5% 2011N120847 2012N133184
ING114581 (3-TC plasma)Relative bioavailability of two fixed-dose combination tablets vs single DTG plus
Epsicom in healthy adult subjects
n=20 at each of 4 levels)
2.1% to 4.7% -2.8% to 4.7% 2011N1208502012N133186;Supplemental:2012N152558
ING114819 (PAH plasma)Effect of DTG on Iohexol and PAH
Clearance in Healthy Subjects
(n=14 at each of 4 levels)
2.1% to 3.4%-3.2% to 10.9%
2011N115785 2010N111322
ING114819 (IHX plasma)Effect of DTG on Iohexol and PAH
Clearance in Healthy Subjects
(n=19 at each of 4 levels)
4.8% to 13.3% -8.4% to 5.3% 2011N1134372010N111226;Supplemental:2012N150761
ING115697 (TPV plasma)Effect of boceprevir and telaprevir on DTG pharmacokinetics in healthy adult subjects
(n=4 at each of 5 levels)
2.3% to 8.6% -2.3% to 8.8% 2012N140716 2012N150656
LAI116181 (RPV plasma)Evaluation of the pharmacokinetic of DTG
and RPV in healthy adult subjects.
(n=26 at each of 3 levels)
3.1% to 5.8% -5.9% to 2.6% 2012N143230 2012N144315
Overall Precision = combined within and between run variability.
All plasma samples were analyzed within the duration for which long term stability has been established for each analyte .
Following blood collection (with EDTA) for DTG, each site for each study was instructed to place the sample on wet ice and isolate plasma within 1 hour. Samples were to be stored at or below -20°C and shipped: i) directly to the bioanalytical laboratory for Phase 1 studies at the end of the study or as interim shipments, or ii) to a Central laboratory facility (Quest) for Phase 2 and Phase 3 studies in real time where they would be stored at or below -20°C then sent to the bioanalytical facility within a month where they were stored at -20C or below until analyzed.
DTG = Dolutegravir, DTG-PB = Dolutegravir Protein Binding, GSK2832500 = dolutegravir glucuronide; ABC=Abacavir; APV = Amprenavir; ATV = Atazanavir, DRV = Darunivir, EFV = Efavirenz, EE = Ethinyl Estradiol, ETV, Etravirine, IHX = Iohexol, 3TC=Lamivudine; LPV, Lopinivir, MDZ = Midazolam, R-MTD = R-Methadone, S-MTD = S-Methadone, NGMN = Norelgestromin, PAH = Para-Aminohippurate, RPV = Rilpivirine, RTV = Ritonavir, TPV = Telaprevir, TFV = Tenofivir,

CONFIDENTIAL2.7.1 Summary of Biopharmaceutic Studies and Associated Analytical Methods
70
Appendix Table 14 Tabular Listing of all Biopharmaceutic Studies
Protocol No.
Type of Study
Study Objective(s)
Study Design
Key Inclusion Criteria of Subjects
No. of Subjects: Gender M/F: Mean Age (Range)
Treatment Details (Drug/Dose/Form/Route/Frequency/Duration)
Study Status; Type of Report
Location of Study Report
ING111322 PK Part 1: To assess safety, tolerability and PK of repeat doses of DTG
Part 2: To assess safety, tolerability and PK of single doses of DTG suspension and single doses of DTG tablets with or without food
Part 1: DB, PLC, DR, PRL
Part 2: O, UC, XO
Healthy Subjects
Part 1:32: 27/531.7 (18-50)
Part 2: 12: 12/030.8 (18-50)
Part 1: DTG/ 10 to 50 mg/ suspension/ oral/ QD/ 10 days
Part 2: DTG / 20 mg/ suspension, tablet/ oral/ singe-dose
Complete;Full
m5.3.3.1
ING113068 Drug interaction; PK
To investigate the effects of fosamprenavir (FPV)/ RTV on the steady-state PK of DTG and to evaluaterelative bioavailability of tablets with varying particle
Part A O, UC, XO
Part B ), UC, XO
Healthy Subjects
Part A12: 10/233.4 (24-55)
Part B15: 4/1134.7 (20-60)
Part APeriod1: DTG/ 50 mg/ tablet/ oral/ QD/ 5 days
Period 2: DTG/ 50 mg/ tablet/ oral/ QD/ 10 days FPV 700 mg / RTV 100 mg/ tablet/ oral/ q12h/ 10 days
Part BDTG/ 50 mg/ tablet/ oral/ single dosemicronized drug substance, unmicronized drug substance, intermediate particle size drug substance
Complete;Full
m5.3.3.4

CONFIDENTIAL2.7.1 Summary of Biopharmaceutic Studies and Associated Analytical Methods
71
Protocol No.
Type of Study
Study Objective(s)
Study Design
Key Inclusion Criteria of Subjects
No. of Subjects: Gender M/F: Mean Age (Range)
Treatment Details (Drug/Dose/Form/Route/Frequency/Duration)
Study Status; Type of Report
Location of Study Report
sizeINGII3674 PK To evaluate
relative bioavailability study of three different tablet formulations of DTG 50 mg and and effect of food on the selected formulation
O, UC, XO r
Healthy Subjects
24: 10/1438.6 (20-61)
Part ADTG/ 50 mg/ tablet/ oral/ single dose
Part BDTG/ 50 mg/ tablet/ oral/ single dose low fat meal, moderate fat meal, high fat meal
Complete;Full
m5.3.1.2
ING112941 PK, Drug interaction
To evaluate the effect of a high fat meal and omeprazole on DTG PK and to evaluate the safety and PK of a 250 mg dose of DTG
Part 1: O,UC, R, XO
Part 2: DB, PLC, R
Healthy Subjects
Part 1: 14: 12/240.6 (23-55)
Part 2: 10: 9/138.4 (21-54)
Part 1: Period 1: DTG/ 50 mg/ tablet/ oral/ single-dose, fastedPeriod 2: DTG/ 50 mg/ tablet/ oral/ single-dose, high fat mealPeriod 3: DTG/ 50 mg/ tablet/ oral/ single-dose Omeprazole/ 40 mg/ capsule/ oral/ QD/ 5 days
Part 2: DTG/ 250 mg/ suspension/ oral/ single dose
Complete;Full
m5.3.3.4
Degree of Blinding Degree of Control Treatment Assignment Treatment Sequence M - MaleO = OpenSB = Single BlindDB = Double Blind
UC = UncontrolledPLC = PlaceboAC = Active control
R = RandomNR = Nonrandom
PRL = ParallelXO = CrossoverDR = Dose Rising
F - Female
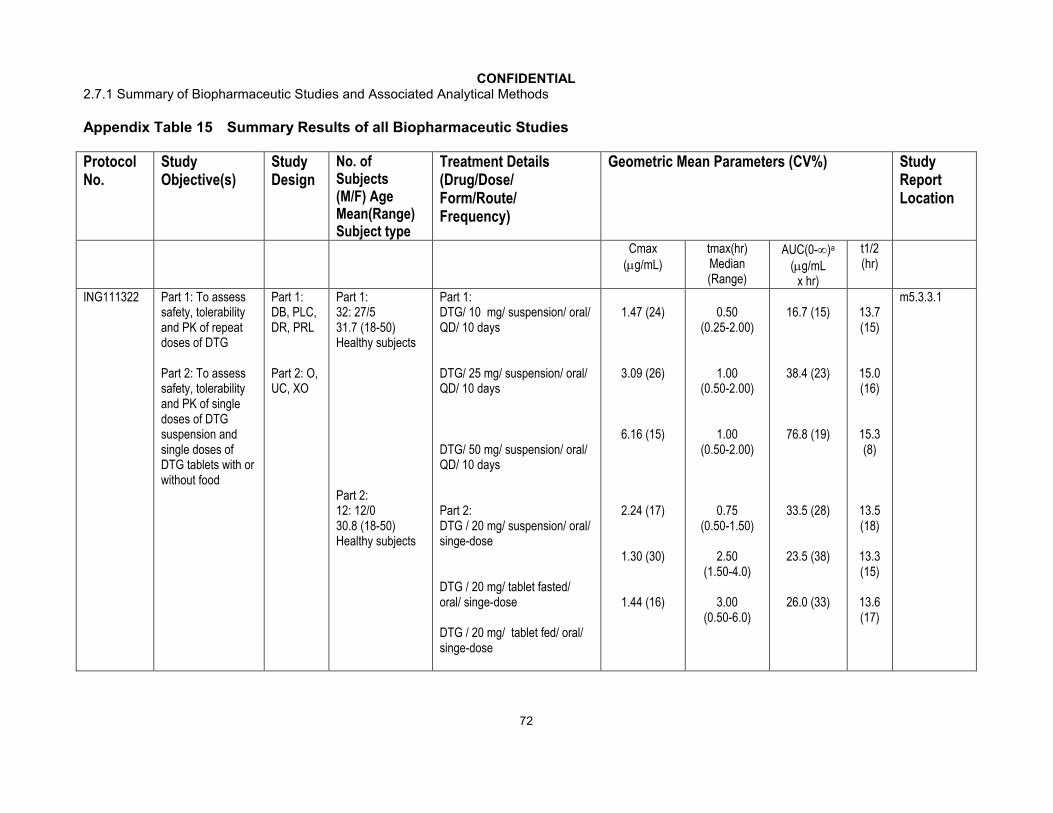
CONFIDENTIAL2.7.1 Summary of Biopharmaceutic Studies and Associated Analytical Methods
72
Appendix Table 15 Summary Results of all Biopharmaceutic Studies
Protocol No.
Study Objective(s)
Study Design
No. ofSubjects(M/F) Age Mean(Range)Subject type
Treatment Details (Drug/Dose/Form/Route/Frequency)
Geometric Mean Parameters (CV%) StudyReportLocation
Cmax(g/mL)
tmax(hr)Median (Range)
AUC(0-)a
(g/mLx hr)
t1/2(hr)
ING111322 Part 1: To assess safety, tolerability and PK of repeat doses of DTG
Part 2: To assess safety, tolerability and PK of single doses of DTG suspension and single doses of DTG tablets with or without food
Part 1: DB, PLC, DR, PRL
Part 2: O, UC, XO
Part 1:32: 27/531.7 (18-50)Healthy subjects
Part 2: 12: 12/030.8 (18-50)Healthy subjects
Part 1: DTG/ 10 mg/ suspension/ oral/ QD/ 10 days
DTG/ 25 mg/ suspension/ oral/ QD/ 10 days
DTG/ 50 mg/ suspension/ oral/ QD/ 10 days
Part 2: DTG / 20 mg/ suspension/ oral/ singe-dose
DTG / 20 mg/ tablet fasted/ oral/ singe-dose
DTG / 20 mg/ tablet fed/ oral/ singe-dose
1.47 (24)
3.09 (26)
6.16 (15)
2.24 (17)
1.30 (30)
1.44 (16)
0.50(0.25-2.00)
1.00(0.50-2.00)
1.00(0.50-2.00)
0.75 (0.50-1.50)
2.50(1.50-4.0)
3.00(0.50-6.0)
16.7 (15)
38.4 (23)
76.8 (19)
33.5 (28)
23.5 (38)
26.0 (33)
13.7(15)
15.0(16)
15.3(8)
13.5 (18)
13.3 (15)
13.6(17)
m5.3.3.1

CONFIDENTIAL2.7.1 Summary of Biopharmaceutic Studies and Associated Analytical Methods
73
Protocol No.
Study Objective(s)
Study Design
No. ofSubjects(M/F) Age Mean(Range)Subject type
Treatment Details (Drug/Dose/Form/Route/Frequency)
Geometric Mean Parameters (CV%) StudyReportLocation
Cmax(g/mL)
tmax(hr)Median (Range)
AUC(0-)a
(g/mLx hr)
t1/2(hr)
ING113068 To investigate the effects of fosamprenavir (FPV)/ RTV on the steady-state PK of DTG and to evaluate relative bioavailability of tablets with varying particle size
Part A O, UC, XO
Part B ), UC, XO
Part A12: 10/233.4 (24-55)Healthy subjects
Part B15: 11/434.7 (20-60)Healthy subjects
Part BDTG/ 50 mg/ tablet/ oral/ single dose/micronized
DTG/ 50 mg/ tablet/ oral/ single dose/unmicronized
DTG/ 50 mg/ tablet/ oral/ single dose/intermediate
1.56 (56)
1.72 (35)
2.04 (38)
3.0 (0.5-6.0)
3.0 (0.5-4.0)
2.0 (0.5-6.0)
34.7 (54)
34.6 (44)
41.0 (43)
15.9(18)
15.1(16)
15.3(15)
m5.3.3.4
ING113674 To evaluate relative bioavailability study of three different tablet formulations of DTG 50 mg and and effect of food on the selected formulation
O, UC, XO r
24: 10/1438.6 (20-61)Healthy subjects
Part ADTG/ 50 mg/ tablet/ oral/ single dose/ formulation AP
DTG/ 50 mg/ tablet/ oral/ single dose/ formulation AW
DTG/ 50 mg/ tablet/ oral/ single dose/ formulation AX
Part BDTG/ 50 mg/ tablet/ oral/ single dose, fasted
2.67 (35)
2.64 (30)
2.77 (32)
2.65 (28)
3.00(1.0-5.0)
2.56(1.0-6.0)
2.04(1.0-4.0)
2.06 (1.0-5.0)
53.2(34)
50.6(27)
53.7(34)
50.3(27)
14.2(19)
14.1(21)
14.4(19)
14.1(22)
m5.3.1.2

CONFIDENTIAL2.7.1 Summary of Biopharmaceutic Studies and Associated Analytical Methods
74
Protocol No.
Study Objective(s)
Study Design
No. ofSubjects(M/F) Age Mean(Range)Subject type
Treatment Details (Drug/Dose/Form/Route/Frequency)
Geometric Mean Parameters (CV%) StudyReportLocation
Cmax(g/mL)
tmax(hr)Median (Range)
AUC(0-)a
(g/mLx hr)
t1/2(hr)
DTG/ 50 mg/ tablet/ oral/ single dose, low fat
DTG/ 50 mg/ tablet/ oral/ single dose, high fat
DTG/ 50 mg/ tablet/ oral/ single dose, mod fat
3.88 21)
4.44 (24)
4.03 (19)
3.0(2.0-5.1)
5.0(1.0-8.0)
4.0(2.0-6.0)
66.7(35)
83.6(35)
71.0(31)
13.4(19)
13.4(21)
13.5(19)
ING112941 To evaluate the effect of a high fat meal and omeprazole on DTG PK and to evaluate the safety and PK of a 250 mg dose of DTG
Part 1: O,UC, R, XO
Part 2: DB, PLC, R
Part 1: 14: 12/240.6 (23-55)Healthy subjects
Part 2: 10: 9/138.4 (21-54)Healthy subjects
Part 1: Period 1: DTG/ 50 mg/ tablet/ oral/ single-dose, fastedPeriod 2: DTG/ 50 mg/ tablet/ oral/ single-dose, high fat mealPeriod 3: DTG/ 50 mg/ tablet/ oral/ single-dose fasted with omeprazole/ 40 mg/ capsule/ oral/ QD/ 5 days
1.84 (44)
3.39 (17)
1.69 (19)
4.0(1.0-5.0)
4.50(2.98-8.0)
3.0(1.0-5.03)
34.7(57)
67.2(24)
34.8(26)
14.4(21)
13.9(19)
16.3(20)
m5.3.3.4
CONFIDENTIAL2.7.1 Summary of Biopharmaceutic Studies and Associated Analytical Methods
75
a. AUC(0-) for ING111322 Part 1Cmax=maximum concentrationtmax=first occurrence of CmaxAUC(0-)=area under the plasma concentration versus time curve from time 0 and extrapolated to infinityt1/2=apparent plasma half-lifeR&D=research and development
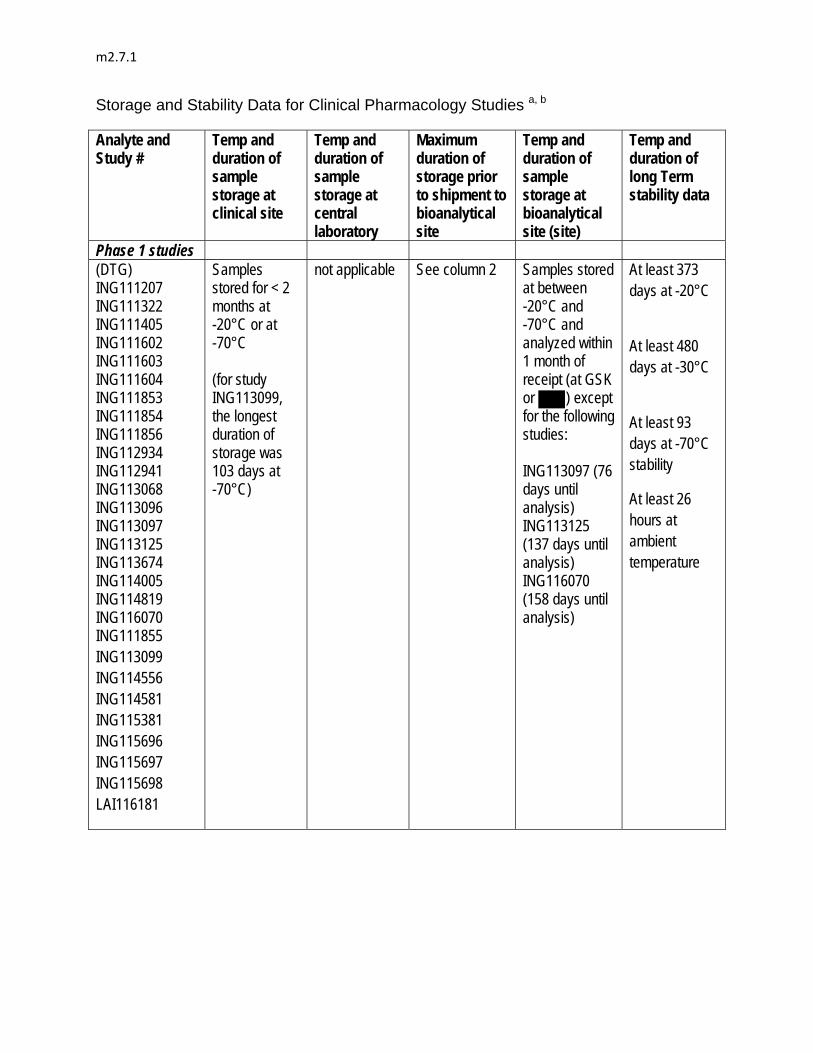
m2.7.1
Storage and Stability Data for Clinical Pharmacology Studies a, b
Analyte and Study #
Temp and duration of sample storage at clinical site
Temp and duration of sample storage at central laboratory
Maximum duration of storage prior to shipment to bioanalytical site
Temp and duration of sample storage at bioanalytical site (site)
Temp and duration of long Term stability data
Phase 1 studies (DTG) ING111207 ING111322 ING111405 ING111602 ING111603 ING111604 ING111853 ING111854 ING111856 ING112934 ING112941 ING113068 ING113096 ING113097 ING113125 ING113674 ING114005 ING114819 ING116070 ING111855 ING113099 ING114556 ING114581 ING115381 ING115696 ING115697 ING115698 LAI116181
Samples stored for < 2 months at -20°C or at -70°C (for study ING113099, the longest duration of storage was 103 days at -70°C)
not applicable
See column 2
Samples stored at between -20°C and -70°C and analyzed within 1 month of receipt (at GSK or ) except for the following studies: ING113097 (76 days until analysis) ING113125 (137 days until analysis) ING116070 (158 days until analysis)
At least 373 days at -20°C
At least 480 days at -30°C
At least 93 days at -70°C stability
At least 26 hours at ambient temperature

m2.7.1
Analyte and Study #
Temp and duration of sample storage at clinical site
Temp and duration of sample storage at central laboratory
Maximum duration of storage prior to shipment to bioanalytical site
Temp and duration of sample storage at bioanalytical site (site)
Temp and duration of long Term stability data
(DTG in CSF) ING116070
Samples not stored at clinical site. Shipped to bioanalytical site in real time - maximum storage < 48 hrs at -20°C
not applicable See column 2
Samples stored at -20°C and analyzed within 160 days of receipt ( )
At least 226 days at -20°C and -70°C in CSF: Plasma (1:1) At least 6.5 hours at ambient temperature
(DTG glucuronide) ING113125
Samples stored for ≤ 61 days at -20°C (shipped monthly)
not applicable See column 2
Samples stored at -20°C and analyzed within 85 days of receipt (GSK)
At least 127 days at -20°C At least 24 hours at ambient temperature
(darunavir) ING111405)
Samples stored for < 1 month at -70°C
not applicable See column 2
Samples stored at -30°C and analyzed within 1 month of receipt (GSK)
At least 54 days at -30°C At least 24 hours at ambient temperature
(midazolam) ING111322
Samples stored for < 1 month at -20°C or lower
not applicable See column 2
Samples stored at -20°C and analyzed within 1 month of receipt (GSK)
At least 60 days at -20°C At least 24 hours at ambient temperature
(lopinavir) ING111405)
Samples stored for < 1 month at -70°C
not applicable See column 2
Samples stored at -30°C and analyzed within 1 month of receipt (GSK)
At least 54 days at -30°C At least 24 hours at ambient temperature
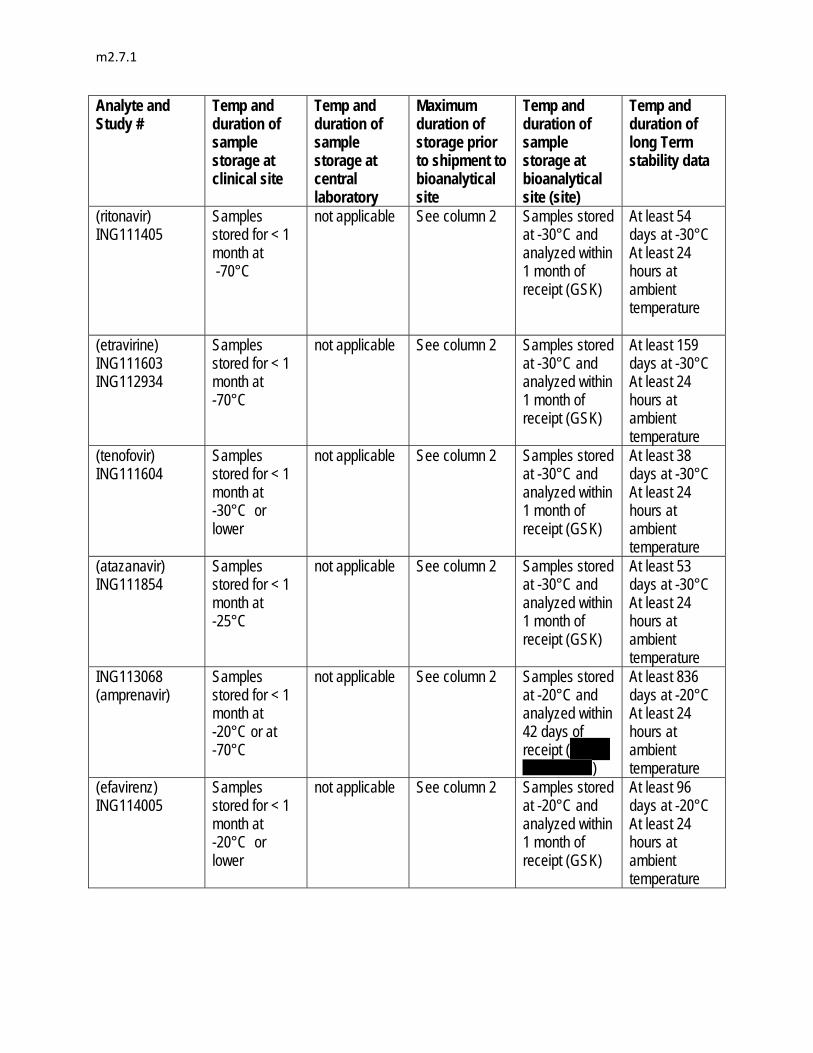
m2.7.1
Analyte and Study #
Temp and duration of sample storage at clinical site
Temp and duration of sample storage at central laboratory
Maximum duration of storage prior to shipment to bioanalytical site
Temp and duration of sample storage at bioanalytical site (site)
Temp and duration of long Term stability data
(ritonavir) ING111405
Samples stored for < 1 month at -70°C
not applicable See column 2
Samples stored at -30°C and analyzed within 1 month of receipt (GSK)
At least 54 days at -30°C At least 24 hours at ambient temperature
(etravirine) ING111603 ING112934
Samples stored for < 1 month at -70°C
not applicable See column 2
Samples stored at -30°C and analyzed within 1 month of receipt (GSK)
At least 159 days at -30°C At least 24 hours at ambient temperature
(tenofovir) ING111604
Samples stored for < 1 month at -30°C or lower
not applicable See column 2
Samples stored at -30°C and analyzed within 1 month of receipt (GSK)
At least 38 days at -30°C At least 24 hours at ambient temperature
(atazanavir) ING111854
Samples stored for < 1 month at -25°C
not applicable See column 2
Samples stored at -30°C and analyzed within 1 month of receipt (GSK)
At least 53 days at -30°C At least 24 hours at ambient temperature
ING113068 (amprenavir)
Samples stored for < 1 month at -20°C or at -70°C
not applicable See column 2
Samples stored at -20°C and analyzed within 42 days of receipt (
)
At least 836 days at -20°C At least 24 hours at ambient temperature
(efavirenz) ING114005
Samples stored for < 1 month at -20°C or lower
not applicable See column 2
Samples stored at -20°C and analyzed within 1 month of receipt (GSK)
At least 96 days at -20°C At least 24 hours at ambient temperature

m2.7.1
Analyte and Study #
Temp and duration of sample storage at clinical site
Temp and duration of sample storage at central laboratory
Maximum duration of storage prior to shipment to bioanalytical site
Temp and duration of sample storage at bioanalytical site (site)
Temp and duration of long Term stability data
(iohexol) ING114819
Samples stored for < 32 days at -20°C
not applicable See column 2
Samples stored at -20°C and analyzed within 1 month of receipt ( )
At least 65 days at -20°C At least 4 hours at ambient temperature
(PAH) ING114819
Samples stored for < 32 days at -20°C
not applicable See column 2
Samples stored at -20°C and analyzed within 1 month of receipt ( )
At least 90 days at -20°C At least 4 hours at ambient temperature
(telaprevir) ING115697
Samples stored for < 1 month at -70°C
not applicable See column 2
Samples stored at -20°C and analyzed within 117 days of receipt ( )
At least 24 days at -20°C or -70°C At least 24 hours at room temperature (long term stability data pending; to be submitted within 30 days of file)
(R and S methadone) ING115698
Samples stored for < 1 month at -20°C
not applicable See column 2
Samples stored at -20°C and analyzed within 1 month of receipt ( )
At least 365 days at -20°C and 280 days at -70°C At least 28 hours at ambient temperature
(rilpivirine) LAI116181
Samples stored for < 1 month at -20°C or lower
not applicable See column 2
Samples stored at -20°C and analyzed within 1 month of receipt ( )
At least 1528 days at -18°C
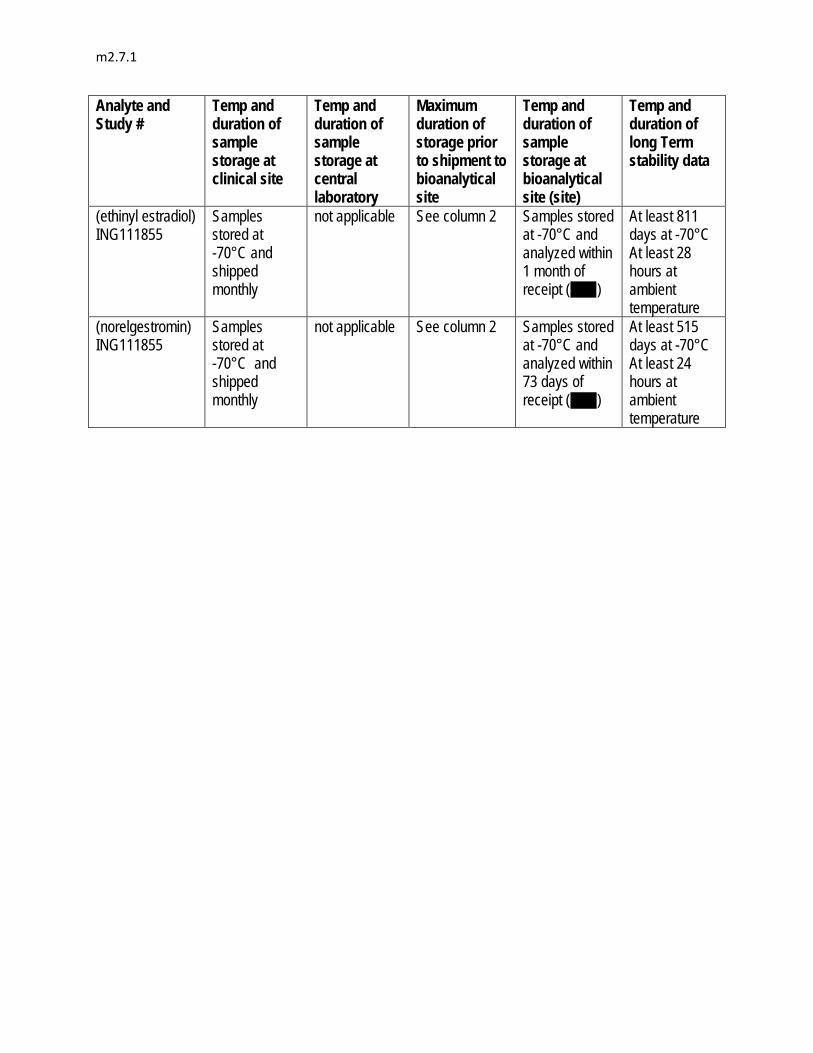
m2.7.1
Analyte and Study #
Temp and duration of sample storage at clinical site
Temp and duration of sample storage at central laboratory
Maximum duration of storage prior to shipment to bioanalytical site
Temp and duration of sample storage at bioanalytical site (site)
Temp and duration of long Term stability data
(ethinyl estradiol) ING111855
Samples stored at -70°C and shipped monthly
not applicable See column 2
Samples stored at -70°C and analyzed within 1 month of receipt ( )
At least 811 days at -70°C At least 28 hours at ambient temperature
(norelgestromin) ING111855
Samples stored at -70°C and shipped monthly
not applicable See column 2
Samples stored at -70°C and analyzed within 73 days of receipt ( )
At least 515 days at -70°C At least 24 hours at ambient temperature

m2.7.1
Analyte and Study #
Temp and duration of sample storage at clinical site
Temp and duration of sample storage at central laboratory
Maximum duration of storage prior to shipment to bioanalytical site
Temp and duration of sample storage at bioanalytical site (site)
Temp and duration of long Term stability data
Phase 2 and 3 Studies for Pop PK analyses
ING111521 (monotherapy; DTG)
Samples stored at -20°C or lower and shipped within 1 month of collection.
Samples stored at -20°C and shipped to bioanalytical lab bi-weekly, therefore sample storage < 14 days
< 6 weeks (42 days)
Samples stored at -30°C and analyzed within 41 days of receipt
At least 373 days at -20°C
At least 480 days at -30°C
At least 93 days at -70°C stability
At least 26 hours at ambient temperature
ING112276 (SPRING-1; DTG)
Samples not stored at clinical site. Shipped in real time - maximum storage < 48 hrs at -20°C
Samples stored at -20°C and shipped to bioanalytical lab bi-weekly therefore sample storage < 14 days
< 16 days Samples stored at -30°C and analyzed within 1 month of receipt
ING113086 (SPRING-2; DTG)
Samples stored at -20°C and shipped to bioanalytical lab monthly therefore sample storage < 30 days
< 32 days Samples stored at -20°C and analyzed within 52 days of receipt

m2.7.1
Analyte and Study #
Temp and duration of sample storage at clinical site
Temp and duration of sample storage at central laboratory
Maximum duration of storage prior to shipment to bioanalytical site
Temp and duration of sample storage at bioanalytical site (site)
Temp and duration of long Term stability data
ING112961 (VIKING; DTG)
Samples not stored at clinical site. Shipped in real time - maximum storage < 48 hrs at -20°C
Samples stored at -20°C and shipped to bioanalytical lab monthly therefore sample storage < 30 days
< 32 days Samples stored at -30°C and analyzed between 1 and 6 months of receipt
At least 373 days at -20°C
At least 480 days at -30°C
At least 93 days at -70°C stability
At least 26 hours at ambient temperature
ING112574 (VIKING-3; DTG)
Samples stored at -20°C and shipped to bioanalytical lab monthly with additional ad hoc shipments toward end of trial therefore sample storage < 30 days
< 32 days Samples stored at -20°C and analyzed between 1 and 6 months of receipt
ING111762 (SAILING; DTG)
Samples stored at -20°C and shipped to bioanalytical lab monthly with additional ad hoc shipments toward end of trial therefore sample storage < 30 days
< 32 days Samples stored at -20°C and analyzed between 1 and 9 months of receipt
a. All clinical sample and QC anticoagulants were the same as used during the validation procedure. b. For all analytes, samples were analyzed within the stability window.
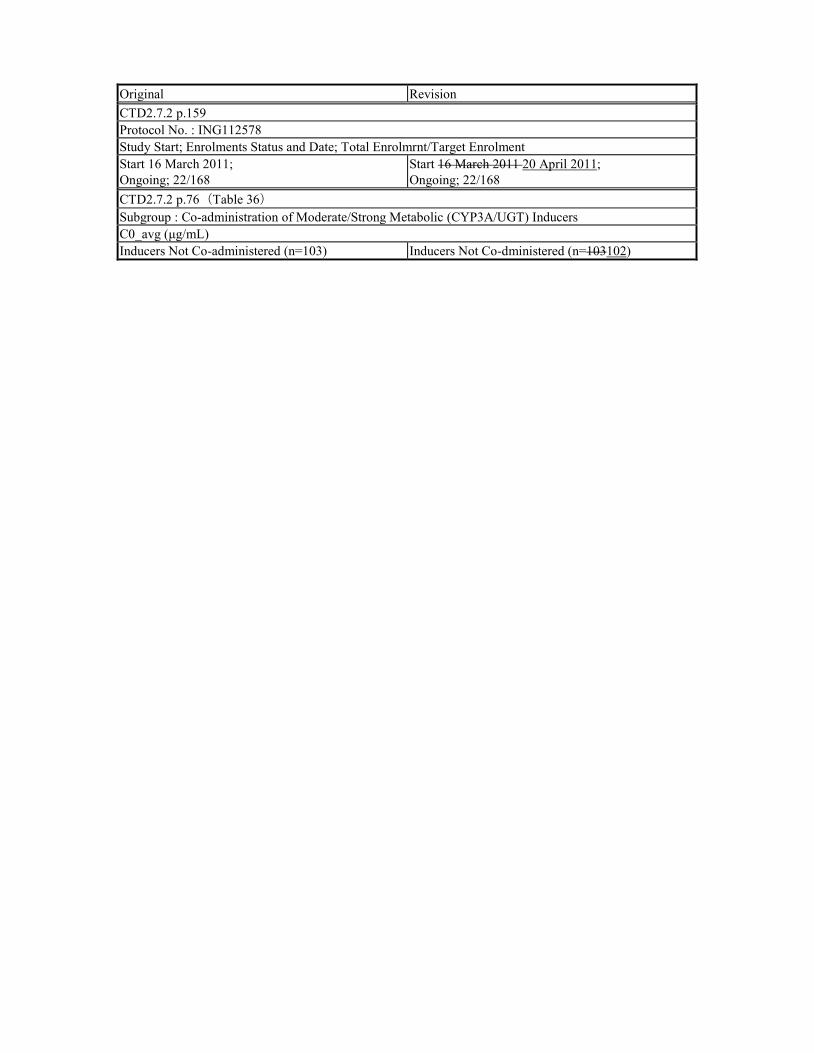
Original Revision CTD2.7.2 p.159 Protocol No. : ING112578 Study Start; Enrolments Status and Date; Total Enrolmrnt/Target Enrolment Start 16 March 2011; Ongoing; 22/168
Start 16 March 2011 20 April 2011; Ongoing; 22/168
CTD2.7.2 p.76(Table 36) Subgroup : Co-administration of Moderate/Strong Metabolic (CYP3A/UGT) Inducers C0_avg (μg/mL) Inducers Not Co-administered (n=103) Inducers Not Co-dministered (n=103102)

CONFIDENTIALModule 2.7.2 Summary of Clinical Pharmacology
1
Module 2.7.2
Summary of Clinical Pharmacology
Copyright 2012 the GlaxoSmithKline group of companies. All rights reserved. Unauthorised copying or use of this information is prohibited.

CONFIDENTIALModule 2.7.2 Summary of Clinical Pharmacology
2
TABLE OF CONTENTS
PAGE
ABBREVIATIONS ...........................................................................................................5
1. BACKGROUND AND OVERVIEW OF CLINICAL PHARMACOLOGY .....................91.1. Overview of Clinical Pharmacology Studies ..................................................91.2. Key Characteristics of Clinical Pharmacology of Dolutegravir .......................91.3. General Design and Analysis Features.......................................................13
1.3.1. Selection of Study Population ......................................................131.3.2. Selection of Dose and Dosing Regimen.......................................131.3.3. PK Sampling Approach................................................................141.3.4. Drug-Drug Interactions.................................................................15
1.3.4.1. Drug Interaction at the Level of Absorption.................151.3.4.2. Drug Interaction at the Level of Distribution ................161.3.4.3. Drug Interaction at the Level of Metabolism................171.3.4.4. Drug Interaction at the Level of Drug
Elimination through Transporters................................181.3.5. Special Populations .....................................................................18
1.3.5.1. Renal and Hepatic Impairment ...................................181.3.5.2. Pediatric Patients .......................................................191.3.5.3. Gender, Race, and Age (Elderly)................................191.3.5.4. HBV/HCV Co-infection ...............................................201.3.5.5. UGT1A1 Polymorphism..............................................20
1.3.6. Pharmacokinetic-Pharmacodynamic Analysis and Dose Selection......................................................................................20
2. SUMMARY OF RESULTS OF INDIVIDUAL STUDIES...........................................212.1. Pharmacokinetics .......................................................................................21
2.1.1. Pharmacokinetics in Healthy Subjects .........................................212.1.1.1. Study ING111207 (Single Dose,
Suspension/Solution, 2 to 100 mg) .............................212.1.1.2. Study ING112941 (Single Dose, Suspension,
250 mg) ......................................................................232.1.1.3. Study ING111322 (Repeat Dose,
Suspension/Solution, 10 to 50 mg Once Daily)...........242.1.1.4. Study ING114005 (Single Dose, Tablet, 50 mg
and 100 mg) ...............................................................262.1.1.5. Study ING111853 (Single Dose, Human Mass
Balance) .....................................................................272.1.1.6. Study ING115465 (Female Genital Tract)...................302.1.1.7. Study ING116195 (Male Genital Tract).......................32
2.1.2. Pharmacokinetics in Special Populations.....................................342.1.2.1. Study ING115381 (Japanese) ....................................342.1.2.2. Study ING113097 (Moderate Hepatic
Impairment) ................................................................352.1.2.3. Study ING113125 (Severe Renal Impairment)............372.1.2.4. Study ING112578 (Pediatric)......................................39
2.1.3. Pharmacokinetic Interactions .......................................................422.1.3.1. Study ING111322 (Midazolam)...................................42

CONFIDENTIALModule 2.7.2 Summary of Clinical Pharmacology
3
2.1.3.2. Study ING111405 (Lopinavir/ritonavir, Darunavir/ritonavir) .....................................................43
2.1.3.3. Study ING111602 (Antacid, Multivitamins) .................442.1.3.4. Study ING111603 (Etravirine).....................................452.1.3.5. Study ING111604 (Tenofovir) .....................................462.1.3.6. Study ING111854 (Atazanavir,
Atazanavir/ritonavir)....................................................472.1.3.7. Study ING111855 (Oral Contraceptives) ....................472.1.3.8. Study ING112934 (Etravirine/lopinavir/ritonavir,
Etravirine/darunavir/ritonavir)......................................482.1.3.9. Study ING112941 (Omeprazole) ................................492.1.3.10. Study ING113068 (Fosamprenavir/Ritonavir) .............502.1.3.11. Study ING113096 (Tipranavir/Ritonavir) .....................512.1.3.12. Study ING113099 (Rifampin, Rifabutin)......................512.1.3.13. Study ING114005 (Efavirenz).....................................522.1.3.14. Study ING115696 (Prednisone)..................................542.1.3.15. Study ING115697 (Telaprevir, Boceprevir) .................542.1.3.16. Study ING115698 (Methadone)..................................552.1.3.17. Study LAI116181 (Rilpivirine) .....................................56
2.2. Clinical Pharmacodynamics........................................................................572.2.1. Properties Related to Therapeutic Effect .....................................57
2.2.1.1. Mechanism of Action of Dolutegravir ..........................572.2.1.2. Therapeutic Endpoints Used in Clinical Trials
for HIV Treatment.......................................................572.2.2. Other Pharmacological Properties ...............................................58
2.2.2.1. Study ING111856 (Definitive QT) ...............................582.2.2.2. Study ING114819 (Effect of DTG on Renal
Functions) ..................................................................602.3. Pharmacokinetics and Pharmacokinetic-pharmacodynamic
Relationship in Target Patient Population ...................................................622.3.1. PK Sampling and Analysis Strategy.............................................622.3.2. Overall Strategy of PK/PD Analyses ............................................622.3.3. Study ING111521 (10-day Monotherapy, 2-50 mg Once
Daily) ...........................................................................................632.3.4. Study ING112276 (HIV-infected Treatment-Naïve, 10-
50 mg Once Daily) .......................................................................672.3.5. Study ING113086 (HIV-infected Treatment-naïve, 50 mg
Once Daily)..................................................................................702.3.6. Study ING112961 (HIV-infected Treatment-experienced
Integrase-inhibitor-resistant, 50 mg Once Daily and 50 mg Twice Daily) .................................................................................72
2.3.7. Study ING112574 (HIV-infected Treatment-experienced Integrase-inhibitor-resistant, 50 mg Twice Daily)..........................75
2.3.8. Study ING111762 (HIV-infected Treatment-experienced Integrase Inhibitor-naïve, 50 mg Once Daily) ...............................77
2.3.9. Study ING116070 (Cerebrospinal Fluid) ......................................83
3. COMPARISON AND ANALYSES OF RESULTS ACROSS STUDIES ...................853.1. Clinical Pharmacokinetics ...........................................................................85
3.1.1. Summary of Pharmacokinetic Parameters in Healthy Subjects and HIV-infected Subjects .............................................85
3.1.2. PK Variability ...............................................................................86

CONFIDENTIALModule 2.7.2 Summary of Clinical Pharmacology
4
3.1.3. Absorption ...................................................................................873.1.4. Plasma Protein Binding and Distribution ......................................883.1.5. Metabolism ..................................................................................893.1.6. Excretion......................................................................................91
3.2. PK/PD Relationships and Definition of No Effect Boundaries......................913.2.1. PK/PD Relationship for Efficacy Endpoints ..................................913.2.2. PK/PD Relationship for Safety Endpoints.....................................933.2.3. Definition of No Effect Boundaries of Alteration in DTG
Exposure .....................................................................................953.2.3.1. Lower Boundary Based on Efficacy ............................953.2.3.2. Upper Boundary Based on Safety ..............................96
3.3. Effect of Intrinsic and Extrinsic Factors on Pharmacokinetics......................973.3.1. Population Pharmacokinetic Analysis in Treatment-Naïve
Subjects.......................................................................................973.3.2. Population Pharmacokinetic Analysis in Treatment-
Experienced Subjects ................................................................1043.3.3. Study ING116265 (PGx Analysis) ..............................................1133.3.4. Summary ...................................................................................116
3.4. Drug-Drug Interactions..............................................................................1173.4.1. Supporting Non-clinical Data......................................................1183.4.2. Effect of DTG on the Pharmacokinetics of Co-
administered Drug .....................................................................1183.4.3. Effect of Co-administered Drug on Pharmacokinetics of
DTG...........................................................................................1213.4.3.1. UGT/CYP3A Inhibitors..............................................1253.4.3.2. UGT/CYP3A Inducers ..............................................1263.4.3.3. Metal Cation-Containing Products ............................127
3.4.4. Summary of Predicted Drug Interaction .....................................128
4. SPECIAL STUDIES..............................................................................................130
5. CONCLUSIONS...................................................................................................130
6. REFERENCES.....................................................................................................131
7. APPENDIX...........................................................................................................134
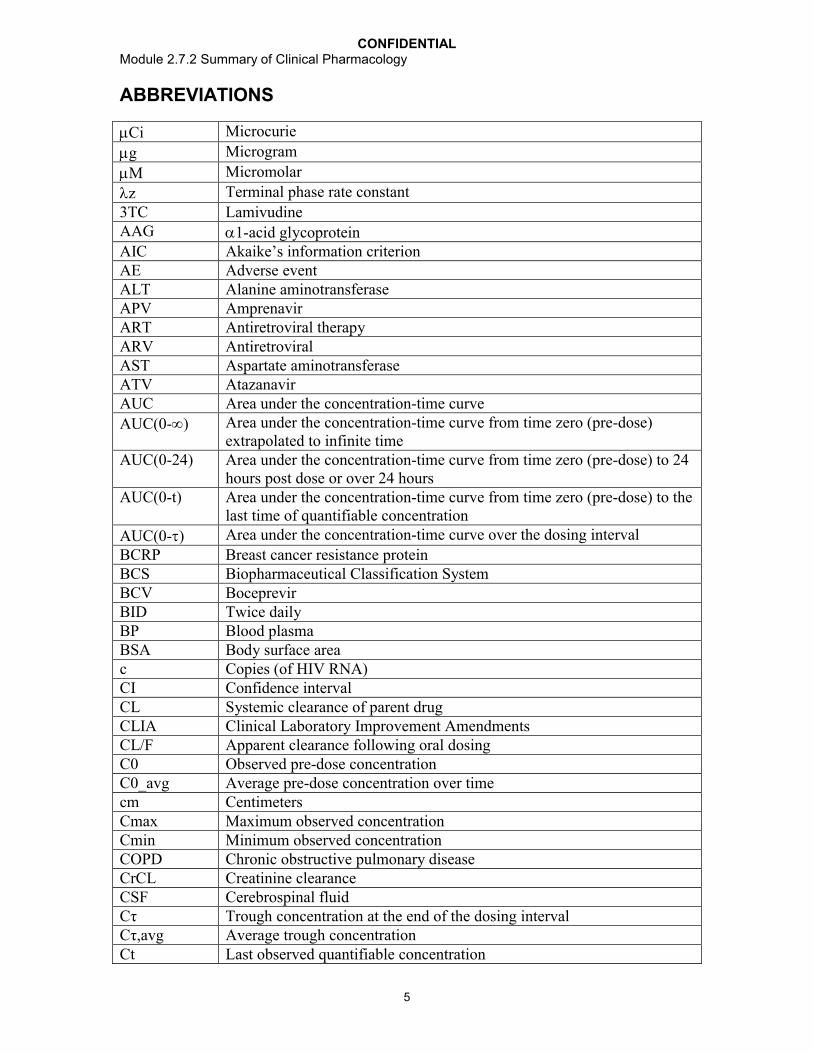
CONFIDENTIALModule 2.7.2 Summary of Clinical Pharmacology
5
ABBREVIATIONS
Ci Microcurie
g Microgram
M Micromolar
z Terminal phase rate constant
3TC LamivudineAAG 1-acid glycoproteinAIC Akaike’s information criterionAE Adverse eventALT Alanine aminotransferaseAPV AmprenavirART Antiretroviral therapyARV AntiretroviralAST Aspartate aminotransferaseATV AtazanavirAUC Area under the concentration-time curve
AUC(0-) Area under the concentration-time curve from time zero (pre-dose) extrapolated to infinite time
AUC(0-24) Area under the concentration-time curve from time zero (pre-dose) to 24 hours post dose or over 24 hours
AUC(0-t) Area under the concentration-time curve from time zero (pre-dose) to the last time of quantifiable concentration
AUC(0-) Area under the concentration-time curve over the dosing interval
BCRP Breast cancer resistance proteinBCS Biopharmaceutical Classification SystemBCV BoceprevirBID Twice dailyBP Blood plasmaBSA Body surface areac Copies (of HIV RNA)CI Confidence intervalCL Systemic clearance of parent drugCLIA Clinical Laboratory Improvement AmendmentsCL/F Apparent clearance following oral dosingC0 Observed pre-dose concentrationC0_avg Average pre-dose concentration over timecm CentimetersCmax Maximum observed concentration Cmin Minimum observed concentrationCOPD Chronic obstructive pulmonary diseaseCrCL Creatinine clearanceCSF Cerebrospinal fluidCτ Trough concentration at the end of the dosing intervalCτ,avg Average trough concentrationCt Last observed quantifiable concentration

CONFIDENTIALModule 2.7.2 Summary of Clinical Pharmacology
6
CT Cervical biopsy/tissueCV Coefficient of varianceCVb Between-subject variability (or coefficient of variation)CVF Cervicovaginal fluidCVw Within-subject variability(or coefficient of variation)CYP Cytochrome P450CYP3A4 Cytochrome P450 isozyme 3A4DNA Deoxyribonucleic acidDRV darunavirECG ElectrocardiogramEC90 Concentration at which 90% of the maximal effect is achievedEE Ethinyl estradiolEFV EfavirenzERDF Efficacy-related discontinuation = failureERPF Effective Renal Plasma FlowETR EtravirineEVG ElvitegravirF BioavailabilityFC Fold changeFPV FosamprenavirFTC EmtricitabineGFR Glomerular filtration rateGI GastrointestinalGLS Geometric least-squaresGMR Geometric mean ratioh or hr(s) Hour(s)HBV Hepatitis B virusHCV Hepatitis C virusHIV Human immunodeficiency virusHIV-1 Human immunodeficiency virus, type 1IC50 Concentration at which 50% of the maximum inhibitory effect is
achievedIC90 Concentration at which 90% of the maximum inhibitory effect is
achievedIIV Inter-individual variabilityIMPAACT International Maternal Pediatric Adolescent AIDS Clinical Trials GroupIN IntegraseINI Integrase inhibitorIOV Inter-occasion variabilityIQ Inhibitory quotientIQR Inter-quartile rangeKA Absorption rate constantkg KilogramL LiterLPV LopinavirMDZ Midazolam

CONFIDENTIALModule 2.7.2 Summary of Clinical Pharmacology
7
mg Milligrammin MinutemL Millilitermm3 Cubic millimetermRNA Messanger ribonucleic acidMRP2 Multidrug resistance-associated protein 2MSD=F Missing, switch, discontinuation = failuremsec MillisecondmSv MillisievertNAG N-acetyl-beta-D-glucosaminidaseNGMN NorelgestrominNRTI Nucleoside/nucleotide reverse transcriptase inhibitorNNRTI Non-nucleoside reverse transcriptase inhibitorOATP Organic anion-transporting polypeptideOBR Optimized background regimenOC Oral contraceptiveOCT2 Organic anion transporter 2OMP OmeprazolePA Protein-adjustedPAH Para-aminohippuratePBMC Peripheral blood mononuclear cellPD PharmacodynamicPDVF Protocol-defined virologic failurePgp P-glycoproteinPGx PharmacogeneticsPI Protease inhibitorPIQ Phenotypic inhibitory quotientPK PharmacokineticPoC Proof of conceptPSS Phenotypic susceptibility scorePSSf PSS with full sensitivity onlyPXR Pregnane X receptorQTcB QT duration corrected for heart rate by Bazett’s formulaQTcF QT duration corrected for heart rate by Fridericia’s formulaR Accumulation ratioRAL RaltegravirRF Rectal mucosal fluidRBT RifabutinRIF RifampinRNA Ribonucleic acidRPV RilpivirineRT Rectal mucosal tissueRTV Ritonavirs SecondSD Standard deviationSF Seminal fluid

CONFIDENTIALModule 2.7.2 Summary of Clinical Pharmacology
8
t Time of last observed quantifiable concentrationt½ Terminal phase half-lifeτ Dosing intervalTB TuberculosisTDF Tenofovir disoproxil fumaratetlag Lag time before observation of drug concentrations in sampled matrixTLOVR Time to Loss of Virologic Responsetmax Time of occurrence of CmaxTPV TipranivirTVR TelaprevirUGT Uridine diphosphate glucuronosyltransferaseUGT1A1 Uridine diphosphate glucuronosyltransferase isozyme 1A1VT Vaginal biopsy/tissueV/F Apparent volume of distribution Vz/F Apparent volume of distribution after extravascular (e.g., oral)
administration at terminal phase
Trademark Information
Trademarks of ViiV Healthcare Trademarks not owned by ViiV Healthcare
NONE AffymetrixGlucophageIncivekMaaloxOne A DaySustiva

CONFIDENTIALModule 2.7.2 Summary of Clinical Pharmacology
9
1. BACKGROUND AND OVERVIEW OF CLINICAL PHARMACOLOGY
Dolutegravir (DTG, S/GSK1349572) is a human immunodeficiency virus (HIV)integrase inhibitor (INI) developed for the treatment of HIV infections. This module provides a summary of human pharmacokinetics (PK), pharmacodynamics (PD), and PK/PD relationships of DTG to support the following recommended doses of DTG, in combination with other antiretroviral therapy (ART) agents, for the treatment of HIVinfection in adults and children 12 years of age (weighing at least 40 kg), based on prior treatment experience:
Treatment-naïve adults: DTG 50 milligrams (mg) once daily;
Treatment-experienced, integrase inhibitor-naïve adults: DTG 50 mg once daily;
Integrase inhibitor-resistant adults: DTG 50 mg twice daily;
Integrase inhibitor-naïve children of 12 - <18 years of age and weighing 40 kg: DTG 50 mg once daily.
Section 1 of this module gives an overview of clinical pharmacology evaluations and key clinical pharmacology characteristics of DTG, as well as provides a summary of the general design and analysis features of the clinical pharmacology studies. Section 2 of this module presents a summary of results from individual studies. Section 3 of this module provides cross-study comparisons and analyses. Section 4 of this module presentsa summary of special studies (Summary of Microbiology/Virology) which is provided as a stand-alone module 2.7.2.4. Clinical pharmacology conclusions are provided inSection 5. A summary of safety data from clinical pharmacology studies is included in m2.7.4 Clinical Summary of Safety.
1.1. Overview of Clinical Pharmacology Studies
The summary of PK, PD, and PK/PD relationships of DTG provided in this module is based on clinical pharmacology studies conducted in healthy subjects (26 studies) and HIV-negative subjects with hepatic or renal impairment (2 studies), as well as clinicalPhase II/III studies in HIV-infected subjects (8 studies).
A tabular list of all clinical pharmacology studies is provided in Appendix Table 1. Summaries of single- and repeat-dose DTG PK parameters from all clinical pharmacology studies and clinical studies in HIV-infected subjects are presented in Appendix Table 2 and Appendix Table 3, respectively. Summary of PK parameters of co-administerd drugs from clinical pharmacology studies are presented in Appendix Table 4.
1.2. Key Characteristics of Clinical Pharmacology of Dolutegravir
Based on comprehensive, clinical pharmacology evaluations, DTG can be described with the following characteristics:
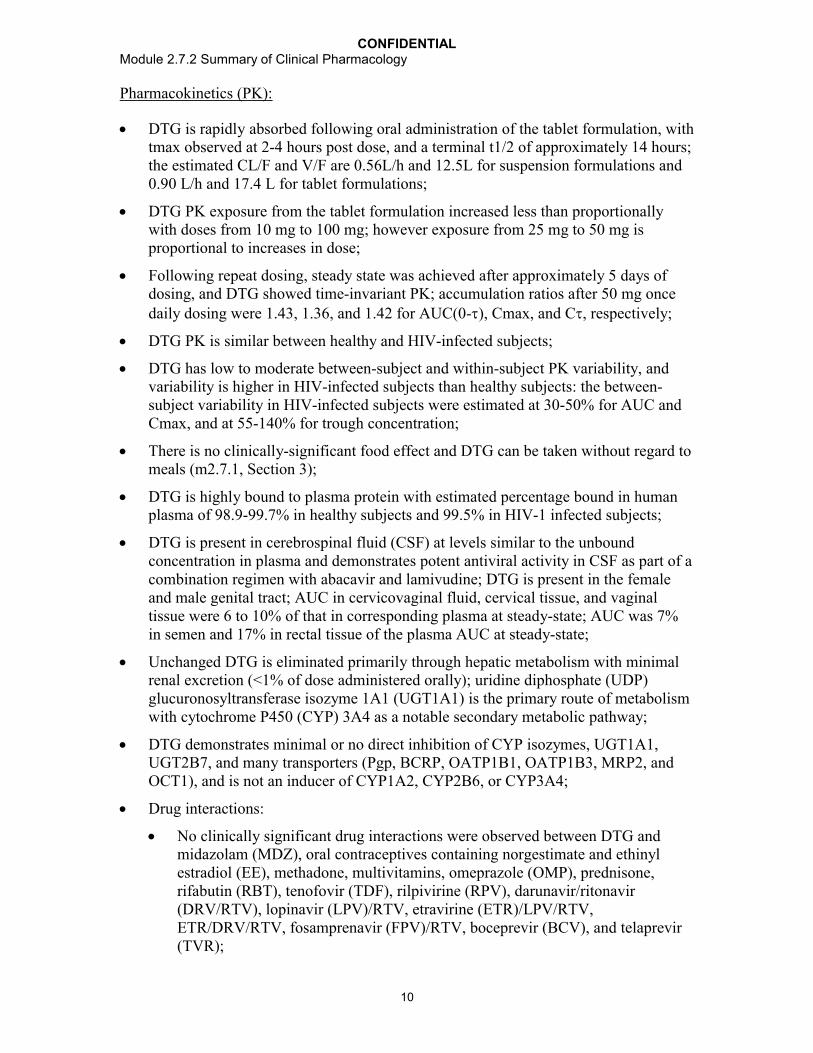
CONFIDENTIALModule 2.7.2 Summary of Clinical Pharmacology
10
Pharmacokinetics (PK):
DTG is rapidly absorbed following oral administration of the tablet formulation, with tmax observed at 2-4 hours post dose, and a terminal t1/2 of approximately 14 hours; the estimated CL/F and V/F are 0.56L/h and 12.5L for suspension formulations and 0.90 L/h and 17.4 L for tablet formulations;
DTG PK exposure from the tablet formulation increased less than proportionally with doses from 10 mg to 100 mg; however exposure from 25 mg to 50 mg is proportional to increases in dose;
Following repeat dosing, steady state was achieved after approximately 5 days of dosing, and DTG showed time-invariant PK; accumulation ratios after 50 mg once daily dosing were 1.43, 1.36, and 1.42 for AUC(0-), Cmax, and C, respectively;
DTG PK is similar between healthy and HIV-infected subjects;
DTG has low to moderate between-subject and within-subject PK variability, and variability is higher in HIV-infected subjects than healthy subjects: the between-subject variability in HIV-infected subjects were estimated at 30-50% for AUC and Cmax, and at 55-140% for trough concentration;
There is no clinically-significant food effect and DTG can be taken without regard to meals (m2.7.1, Section 3);
DTG is highly bound to plasma protein with estimated percentage bound in human plasma of 98.9-99.7% in healthy subjects and 99.5% in HIV-1 infected subjects;
DTG is present in cerebrospinal fluid (CSF) at levels similar to the unbound concentration in plasma and demonstrates potent antiviral activity in CSF as part of a combination regimen with abacavir and lamivudine; DTG is present in the female and male genital tract; AUC in cervicovaginal fluid, cervical tissue, and vaginal tissue were 6 to 10% of that in corresponding plasma at steady-state; AUC was 7% in semen and 17% in rectal tissue of the plasma AUC at steady-state;
Unchanged DTG is eliminated primarily through hepatic metabolism with minimal renal excretion (<1% of dose administered orally); uridine diphosphate (UDP)glucuronosyltransferase isozyme 1A1 (UGT1A1) is the primary route of metabolism with cytochrome P450 (CYP) 3A4 as a notable secondary metabolic pathway;
DTG demonstrates minimal or no direct inhibition of CYP isozymes, UGT1A1, UGT2B7, and many transporters (Pgp, BCRP, OATP1B1, OATP1B3, MRP2, and OCT1), and is not an inducer of CYP1A2, CYP2B6, or CYP3A4;
Drug interactions:
No clinically significant drug interactions were observed between DTG and midazolam (MDZ), oral contraceptives containing norgestimate and ethinyl estradiol (EE), methadone, multivitamins, omeprazole (OMP), prednisone, rifabutin (RBT), tenofovir (TDF), rilpivirine (RPV), darunavir/ritonavir (DRV/RTV), lopinavir (LPV)/RTV, etravirine (ETR)/LPV/RTV, ETR/DRV/RTV, fosamprenavir (FPV)/RTV, boceprevir (BCV), and telaprevir (TVR);

CONFIDENTIALModule 2.7.2 Summary of Clinical Pharmacology
11
DTG should be administered at least 2 hours before or 6 hours after polyvalent metal cation-containing antacids; plasma DTG exposure was reduced 74% when co-administered with the antacid Maalox (aluminium hydroxide/magnesium hydroxide/simethicone);
Due to more than 80% reduction in DTG C by ETR, DTG should not be dosedwith ETR alone; the co-administration of DTG with ETR is only permitted if the subject is also receiving concomitant RTV-boosted protease inhibitors (PIs) including LPV/RTV, DRV/RTV, and atazanavir (ATV)/RTV;
Plasma DTG C was reduced by about 75% when co-administered with the moderate/strong UGT1A1/CYP3A4 inducers rifampin (RIF), efavirenz (EFV), and tipranivir (TPV)/RTV; a DTG 50 mg twice daily dose should be given when co-administered with these inducers; caution should be given in INI-resistant patients;
Plasma DTG AUC(0-) was increased by 62% and 91% when co-administered with the potent UGT1A1 inhibitor ATV/RTV and ATV, respectively; no DTG dose adjustment is required based on accumulated safety data;
DTG inhibits the renal organic anion transporter 2 (OCT2); DTG should not be administered with OCT2 substrates having narrow therapeutic indices; DTG is contraindicated in combination with dofetilide; metformin concentrations may be increased by DTG; subjects should be monitored during therapy and a dose adjustment of metformin may be required;
No dose adjustment for DTG is needed in subjects with mild to moderate hepatic impairment (Child-Pugh grade A or B); Data in severe hepatic impairment has not been generated;
No dose adjustment for DTG is needed in subjects with mild, moderate, or severe(CrCL <30 mL/min, not on dialysis) renal impairment;
No dose adjustment for DTG is needed in subjects with genotypes conferring poor metabolizer status of UGT1A1 (*28/*28; *28/*37; *37/*37);
PK in adolescents of 12 - <18 years of age and at least 40 kg of body weight is similar to adults, and therefore, INI-naïve paediatric subjects can take the adult dose of 50 mg once daily;
DTG can be used in hepatitis B virus (HBV) or hepatitis C virus (HCV) co-infected subjects:
HCV co-infection has no effect on DTG PK based on population PK modelling;PK data on HBV co-infected subjects are limited;
There was no drug interaction or no drug interaction is anticipated between DTG and commonly used drugs for the treatment of HBV and HCV infections;
There is no clinically significant effect of age, weight, gender, race, ethnicity, smoking, and disease status (CDC classification of HIV infection) on DTG PK, and therefore, no dose adjustment of DTG is needed in subjects based on these characteristics; PK data on subjects of 65 years of age are limited.

CONFIDENTIALModule 2.7.2 Summary of Clinical Pharmacology
12
Pharmacodynamics:
DTG has no effect on cardiac repolarization at a supratherapeutic dose of 250 mg(suspension);
DTG demonstrated a nonpathological effect of increasing creatinine levels due to inhibition of secretion by OCT2 transporter with no effect on glomerular filtrationrate (GFR) and effective renal plasma flow (ERPF).
Pharmacokinetic-Pharmacodynamic Relationship:
In a 10-day monotherapy study in HIV-infected, INI-naïve subjects, a significant correlation between DTG plasma exposure and plasma HIV ribonucleic acid (RNA)measures (log10 reduction in plasma HIV-1 RNA to Day 11 from Baseline) was observed. Greater antiviral activity was associated with higher DTG plasma exposure. Such relationship was best described by an Emax model and DTG trough concentration, C, was identified as the best predictor for antiviral activity; DTG exposure from 10 mg once daily dose is around EC90 of this model and DTG exposure from 50 mg once daily is at the plateau of curve;
In HIV-infected, ART-naïve subjects where DTG was given in combination with dual nucleos(t)ide reverse transcriptase inhibitors (NRTIs), no relationship between DTG dose/exposure and virological response was observed at doses ranging from 10 to 50 mg once daily. The lack of PK-PD relationship is due to the potency of combination therapy resulting in more than 78% of subjects on DTG treatments achieving HIV-1 RNA values <50 copies (c)/mL at Week 96 in the Phase IIb study ING112276 and an 88% response rate at Week 48 in the Phase III study ING113086;
In HIV-infected, ART-experienced, INI-naïve subjects taking DTG in combination with at least 1 active agent in their background regimen, DTG trough concentration (i.e., the observed pre-dose concentration [C0]) was a statistically significant predictor of virological response at Week 24 when using all available data, but was not a predictor of virological response when subjects with moderate/strong inducers in their background therapy (e.g., TPV/RTV, EFV, and ETR without RTV-boosted PIs) and noncompliant subjects were excluded;
In HIV-infected, INI-resistant subjects in the Phase III study, DTG exposure, (i.e., C0), was not statistically significantly correlated with virological response observed (Day 8 and Week24);
Plasma DTG exposure was not correlated with the presence of the most frequentadverse events (AEs), including diarrhea, nausea, and headache, or with most clinical laboratory tests of interest. There was a statistically significant correlation between DTG exposure and increase from Baseline in total bilirubin (likely due to competition with UGT1A1) and serum creatinine (due to known OCT2 inhibition);however, such relationships are not considered clinically significant as the changes in total bilirubin and creatinine were small and non-progressive.

CONFIDENTIALModule 2.7.2 Summary of Clinical Pharmacology
13
1.3. General Design and Analysis Features
This section discusses the overall design features of the DTG clinical pharmacology program, including selection of study populations, selection of dose, the PK sampling and analysis strategy, evaluations of drug interactions, assessments in special populations, and PK/PD analyses.
1.3.1. Selection of Study Population
Evaluation of DTG PK was conducted in both HIV-negative subjects (healthy subjects and subjects with hepatic or renal impairment) as well as HIV-positive subjects. Evaluation of food effects, formulations, drug-drug interactions, and enzyme polymorphisms were primarily performed in HIV-negative, healthy subjects. Evaluationsof the effects of hepatic and renal impairment were conducted in HIV-negative subjects. Effects of intrinsic factors, including age, gender, body size, and race/ethnicity, and extrinsic factors, including HBV/HCV co-infection, were primarily evaluated in HIV-positive subjects using a population PK modelling approach. As DTG PK is similar between HIV-negative and HIV-positive subjects (see Section 3.1.1 for details), findingsfrom HIV-negative subjects can be applied to HIV-positive subjects.
1.3.2. Selection of Dose and Dosing Regimen
Since DTG 50 mg is the clinical dose evaluated in Phase III, this dose was used in most Phase I studies. For studies requiring repeat doses of DTG, DTG 50 mg once daily was typically used as it is the recommended dose for INI-naïve patients, which represent the majority of the HIV-infected population to be treated by this compound. Studies that used DTG 50 mg once daily include drug interaction studies that focus on evaluating the effect of co-administered drugs on DTG PK, as well as tissue compartment studies that evaluate tissue penetration of DTG (e.g., cerebrospinal fluid, male genital tract, and female genital tract). DTG 50 mg twice daily (BID) is only recommended for INI-resistant patients,which represent a very small portion of the HIV-infected patient population to be treatedby this compound. For drug interaction studies that focus on evaluating the effect of DTG on co-administered drugs (e.g., oral contraceptives, methadone), DTG 50 mg twice dailydose was selected. As DTG PK is dose proportional from 50 mg once daily to 50 mgtwice daily (Section 3.3.2; Table 45), the effects of interacting drugs on DTG PK observed at DTG 50 mg once daily dosing can be applied to DTG 50 mg twice dailydosing. The effects of metabolic inducers/inhibitors on DTG PK parameters from DTG 50mg twice daily were estimated using the population PK model developed based on pooled PK data from treatment-experienced subjects in Phase IIb/III studies (m5.3.3.5, Population PK in ART-experienced, Section 4).
Exceptions to dosing with 50 mg occurred within the following studies, with reasons for selection of a DTG dose other than 50 mg listed below:
A single supratherapeutic dose of DTG 250 mg, using a suspension formulation, was selected for the definitive QT study in order to achieve supratherapeutic exposure(Study ING111856; Section 2.2.2.1).
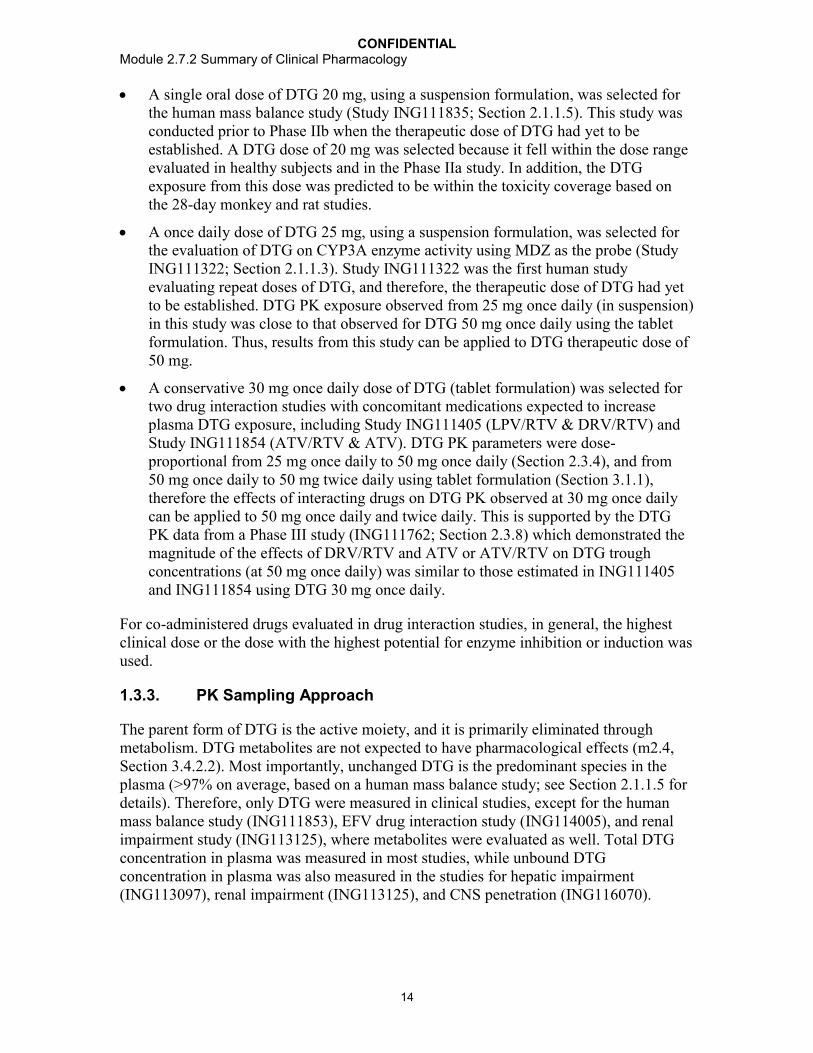
CONFIDENTIALModule 2.7.2 Summary of Clinical Pharmacology
14
A single oral dose of DTG 20 mg, using a suspension formulation, was selected for the human mass balance study (Study ING111835; Section 2.1.1.5). This study was conducted prior to Phase IIb when the therapeutic dose of DTG had yet to be established. A DTG dose of 20 mg was selected because it fell within the dose range evaluated in healthy subjects and in the Phase IIa study. In addition, the DTG exposure from this dose was predicted to be within the toxicity coverage based on the 28-day monkey and rat studies.
A once daily dose of DTG 25 mg, using a suspension formulation, was selected for the evaluation of DTG on CYP3A enzyme activity using MDZ as the probe (Study ING111322; Section 2.1.1.3). Study ING111322 was the first human study evaluating repeat doses of DTG, and therefore, the therapeutic dose of DTG had yet to be established. DTG PK exposure observed from 25 mg once daily (in suspension)in this study was close to that observed for DTG 50 mg once daily using the tablet formulation. Thus, results from this study can be applied to DTG therapeutic dose of 50 mg.
A conservative 30 mg once daily dose of DTG (tablet formulation) was selected for two drug interaction studies with concomitant medications expected to increase plasma DTG exposure, including Study ING111405 (LPV/RTV & DRV/RTV) and Study ING111854 (ATV/RTV & ATV). DTG PK parameters were dose-proportional from 25 mg once daily to 50 mg once daily (Section 2.3.4), and from 50 mg once daily to 50 mg twice daily using tablet formulation (Section 3.1.1), therefore the effects of interacting drugs on DTG PK observed at 30 mg once dailycan be applied to 50 mg once daily and twice daily. This is supported by the DTG PK data from a Phase III study (ING111762; Section 2.3.8) which demonstrated the magnitude of the effects of DRV/RTV and ATV or ATV/RTV on DTG trough concentrations (at 50 mg once daily) was similar to those estimated in ING111405 and ING111854 using DTG 30 mg once daily.
For co-administered drugs evaluated in drug interaction studies, in general, the highest clinical dose or the dose with the highest potential for enzyme inhibition or induction was used.
1.3.3. PK Sampling Approach
The parent form of DTG is the active moiety, and it is primarily eliminated through metabolism. DTG metabolites are not expected to have pharmacological effects (m2.4, Section 3.4.2.2). Most importantly, unchanged DTG is the predominant species in the plasma (>97% on average, based on a human mass balance study; see Section 2.1.1.5 for details). Therefore, only DTG were measured in clinical studies, except for the human mass balance study (ING111853), EFV drug interaction study (ING114005), and renal impairment study (ING113125), where metabolites were evaluated as well. Total DTG concentration in plasma was measured in most studies, while unbound DTG concentration in plasma was also measured in the studies for hepatic impairment (ING113097), renal impairment (ING113125), and CNS penetration (ING116070).

CONFIDENTIALModule 2.7.2 Summary of Clinical Pharmacology
15
In tissue compartment studies, including male genital tract (ING116915), female genital tract (ING115465), and CNS penetration (ING116070), total DTG concentration in the body fluids or tissues of interest was measured in addition to total DTG plasma concentration.
DTG concentration in various sample matrixes (total DTG in plasma, body fluids, or tissues, and unbound DTG in plasma) was quantified by validated assays (see m2.7.1 fordetails).
1.3.4. Drug-Drug Interactions
A total of 17 Phase I studies in healthy subjects have been performed to assess the interaction between DTG and various drugs, including antiretrovirals for HIV treatmentand non-ART medications expected to be used concomitantly with DTG. Consistent with regulatory guidance document [EMA, 2008], priority was given to ART drugs, drugs for the treatment of concomitant infections (e.g., HCV, HBV, tuberculosis), hormonal contraceptives, drugs for the treatment of metabolic abnormalities, such as hyperlipidemia and gastroesophageal reflux, and therapies used in the management of substance abuse. In general, the development strategy and study design of drug interaction evaluations followed regulatory authority guidance [EMA, 2012; FDA, 2012].
Drug interactions were only evaluated on a pharmacokinetic basis as there is no known mechanistic basis for any pharmacodynamic drug-drug interactions for DTG. Results of drug interaction studies were reported as the geometric least squared mean ratio (GMR) of the PK parameters of the drug of interest, with and without the interacting drug, and its 90% confidence interval (CI). The clinical significance of any alteration in DTG exposure caused by co-administered drugs was judged against the “no effect boundaries” (Section 3.2.3) and dosing recommendations are provided in Section 3.4.
Results from in vitro metabolism and transporter experiments (Section 3.4.1), the finding that DTG has no effect on CYP3A enzyme activity using MDZ as a probe (ING111322),and results from the human mass balance study (ING111853) guided the overall strategy and study design of drug interaction evaluations.
Most drug interaction studies were designed to evaluate the one-way interaction-theeffect of the co-administered drug on DTG PK, not vice versa--as data had suggested that DTG is unlikely to be a perpetrator of drug interaction, but possibly a victim (Section 3.4.1).
Consideration was given for drug interaction potential at the levels of absorption, distribution, metabolism, and elimination via transporters.
1.3.4.1. Drug Interaction at the Level of Absorption
DTG is considered a Biopharmaceutical Classification System (BCS) Class II compound (i.e., low water solubility and high permeability, see m2.7.1 for details). Such classification of DTG is consistent with the observations of solubility-limited absorption,less than dose-proportional increases in DTG exposure following tablet dosing (Section 3.1.3), and positive food effect (i.e., food increased DTG exposure; m2.7.1 for

CONFIDENTIALModule 2.7.2 Summary of Clinical Pharmacology
16
details). DTG is a substrate of efflux transporters Pgp and BCRP. Currently there is no data on DTG as substrate of other active uptake transporters and efflux transporters such as OATP and MRP2.
Drugs affecting solubility of DTG may affect DTG absorption and overall drug exposure. DTG is a 2-metal-binding integrase inhibitor. The mechanism of action involves binding to magnesium in the active site of the integrase enzyme, preventing insertion of HIV viral DNA into the host cell DNA. As such, DTG is susceptible to chelation-type drug interactions with divalent and trivalent metal cations that lead to reduced water solubility. Therefore a clinical study was conducted to evaluate the effect of widely used antacid and multivitamins products on DTG PK, and to provide guidance for concomitant use. A study evaluating the effect of the proton pump inhibitor OMP was also performed as OMP has been showed to alter exposure of drugs with pH-dependent solubility, including the integrase inhibitor raltegravir (RAL) [Iwamoto, 2009].
Drugs that modulate (inhibit or induce) efflux transporters are unlikely to affect the absorption of DTG due to its high passive and absorptive permeability (estimated at 3x10⁻⁴ cm/s across the absorptive pH range of 5.5 to 7.4, m2.4, Section 3.3.2). The EMA guidance document on drug interaction [EMA, 2012] suggests that PK indications of clinically relevant transporter involvement in drug absorption include low bioavailability, erratic or dose-dependent absorption, or CYP3A catalysed intestinal drug metabolism, as well as unexpected in vivo interactions, with effects on intestinal absorption as a possible mechanism. DTG in general does not fit this profile: DTG has a moderate oral bioavailability (at least 47% based on the mass balance study, see Section 2.1.1.5 for details), low to moderate PK variability (Section 3.1.2), no observation of erratic absorption, and low first-pass metabolism (Section 3.1.5). Phase I studies with Pgp/BCRP inhibitors, LPV/RTV (Section 2.1.3.2) and TVR (Section 2.1.3.15), showed no change in DTG PK exposure by these agents. Therefore, drug interactions with otherPgp/BCRP modulators are not expected and additional studies are not needed.
1.3.4.2. Drug Interaction at the Level of Distribution
Interactions affecting distribution include displacement interactions and interactions through modulation of active uptake or efflux transport of the drug [EMA, 2012].
DTG has a relative low volume of distribution. Vd/F is estimated at ~12 L(Section 2.1.1.5) or 0.17 L/kg, which is close to the volume of total water in the extracellular space, and intracellular tissue distribution is expected to be low. Therefore,the involvement of transporters and the effect of transporter modulators on DTG distribution are unlikely to be significant. Although DTG is highly bound to plasma proteins (>99% bound in plasma), the risk of clinically relevant interactions via displacement from plasma protein binding sites is expected to be low. EMA guidance [EMA, 2012] suggests that possible displacement interactions be evaluated for highly bound drugs that have narrow therapeutic windows, high hepatic extraction ratios, high renal extraction ratios, and are administered intravenously. DTG does not meet any of these criteria. Therefore, the potential for drug interactions at the level of distribution is considered low, and thus, studies to evaluate this were not performed.

CONFIDENTIALModule 2.7.2 Summary of Clinical Pharmacology
17
1.3.4.3. Drug Interaction at the Level of Metabolism
Interaction at the level of metabolism is the primary focus of drug-drug interaction evaluations for DTG, with studies targeted mainly to drugs that are inhibitors or inducers of UGT1A1 and/or CYP3A4, given that unchanged DTG was primarily eliminated through metabolism (see Section 2.1.1.5), and that DTG is primarily metabolized by UGT1A1 with a notable contribution from CYP3A4 (Section 3.1.5).
For antiretroviral (ARV) drugs, consideration was primarily given to the drugs in the non-nucleoside reverse transcriptase inhibitor (NNRTI) or protease inhibitor (PI) class, as most NNRTIs induce CYP3A (and possibly UGT1A1), most PIs are moderate or strong inhibitors or inducers of CYP3A4, and the RTV component of boosted PI regimens is an inducer of CYP3A and UGT1A1 and an inhibitor of Pgp. The following ARV drugs were evalutated for drug-interaction potential with DTG: NNRTIs including ETR and EFV; PIs including LPV/RTV, DRV/RTV, LPV/RTV/ETR, DRV/RTV/ETR, FPV/RTV, TPV/RTV. A drug interaction study to evaluate the effect of ATV and ATV/RTV was performed as ATV is a potent inhibitor of UGT1A1. Drugs in other ART classes (e.g.,NRTIs and entry inhibitors) were not evaluated as they do not affect UGT and CYP3A4 except for TDF, which was studied because it has demonstrated unpredictable interactions.
For non-ART drugs, the following were evaluated in clinical pharmacology studies:
RIF: a strong inducer of CYP3A, Pgp, and likely UGT1A1; most commonly used anti-tuberculosis (TB) agent; co-administration may be needed in TB co-infected subjects;
RBT: a weaker inducer of CYP3A than RIF; first-line therapy for TB; co-administration may be needed in TB co-infected subjects;
Prednisone: a weak inducer of CYP3A and likely UGT1A1; a corticosteroid frequently used in HIV-infected subjects for various indications including asthma, chronic obstructive pulmonary disease (COPD), immune reconstitution inflammatory syndrome, and severe Pneumocystis pneumonia, etc;
BCV: a strong inhibitor of CYP3A; recently approved HCV therapy; co-administration may be needed in HCV co-infected subjects;
TVR: strong inhibitor of CYP3A and Pgp; recently approved HCV therapy; co-administration may be needed in HCV co-infected subjects;
Methadone: no drug interaction was expected, however, a confirmatory study was conducted as methadone is commonly used in HIV-infected subjects with substance abuse;
Oral contraceptives (OC): no drug interaction was expected, however a confirmatory study was conducted given the widespread use of oral contraceptives in HIV-infected women.
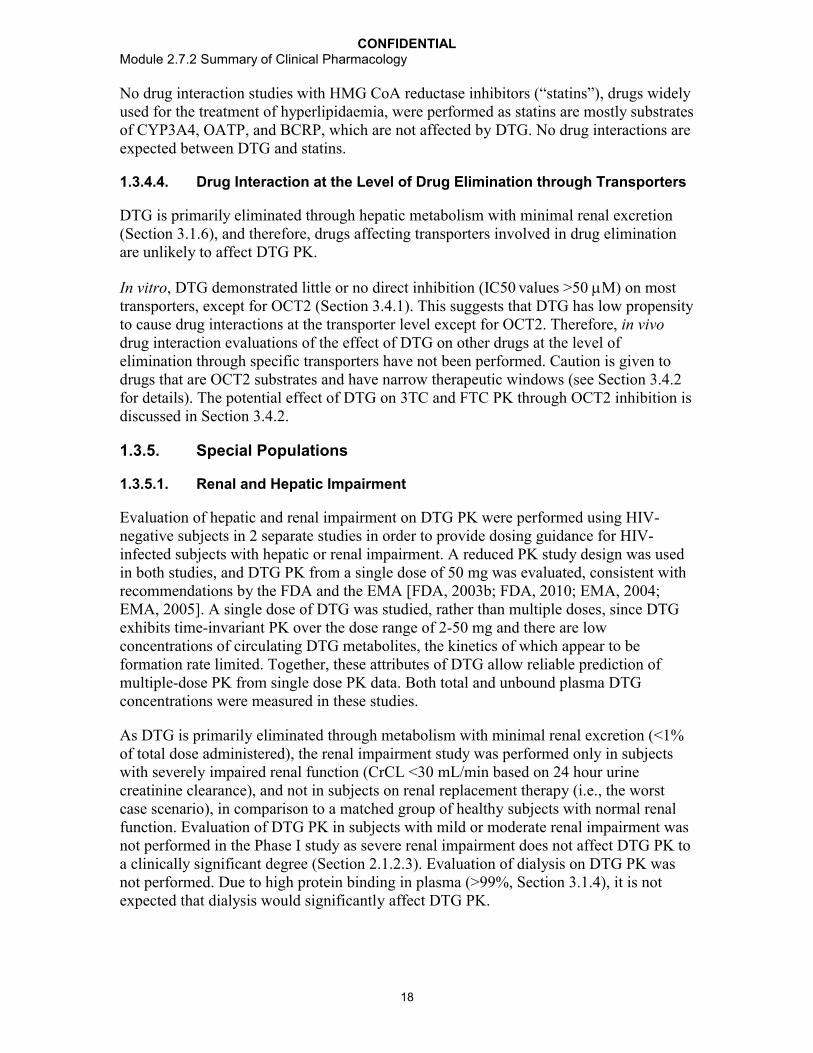
CONFIDENTIALModule 2.7.2 Summary of Clinical Pharmacology
18
No drug interaction studies with HMG CoA reductase inhibitors (“statins”), drugs widely used for the treatment of hyperlipidaemia, were performed as statins are mostly substrates of CYP3A4, OATP, and BCRP, which are not affected by DTG. No drug interactions are expected between DTG and statins.
1.3.4.4. Drug Interaction at the Level of Drug Elimination through Transporters
DTG is primarily eliminated through hepatic metabolism with minimal renal excretion(Section 3.1.6), and therefore, drugs affecting transporters involved in drug elimination are unlikely to affect DTG PK.
In vitro, DTG demonstrated little or no direct inhibition (IC50 values >50 M) on most transporters, except for OCT2 (Section 3.4.1). This suggests that DTG has low propensity to cause drug interactions at the transporter level except for OCT2. Therefore, in vivodrug interaction evaluations of the effect of DTG on other drugs at the level ofelimination through specific transporters have not been performed. Caution is given to drugs that are OCT2 substrates and have narrow therapeutic windows (see Section 3.4.2for details). The potential effect of DTG on 3TC and FTC PK through OCT2 inhibition is discussed in Section 3.4.2.
1.3.5. Special Populations
1.3.5.1. Renal and Hepatic Impairment
Evaluation of hepatic and renal impairment on DTG PK were performed using HIV-negative subjects in 2 separate studies in order to provide dosing guidance for HIV-infected subjects with hepatic or renal impairment. A reduced PK study design was used in both studies, and DTG PK from a single dose of 50 mg was evaluated, consistent with recommendations by the FDA and the EMA [FDA, 2003b; FDA, 2010; EMA, 2004; EMA, 2005]. A single dose of DTG was studied, rather than multiple doses, since DTG exhibits time-invariant PK over the dose range of 2-50 mg and there are low concentrations of circulating DTG metabolites, the kinetics of which appear to be formation rate limited. Together, these attributes of DTG allow reliable prediction of multiple-dose PK from single dose PK data. Both total and unbound plasma DTG concentrations were measured in these studies.
As DTG is primarily eliminated through metabolism with minimal renal excretion (<1%of total dose administered), the renal impairment study was performed only in subjects with severely impaired renal function (CrCL <30 mL/min based on 24 hour urine creatinine clearance), and not in subjects on renal replacement therapy (i.e., the worst case scenario), in comparison to a matched group of healthy subjects with normal renal function. Evaluation of DTG PK in subjects with mild or moderate renal impairment was not performed in the Phase I study as severe renal impairment does not affect DTG PK to a clinically significant degree (Section 2.1.2.3). Evaluation of dialysis on DTG PK was not performed. Due to high protein binding in plasma (>99%, Section 3.1.4), it is not expected that dialysis would significantly affect DTG PK.
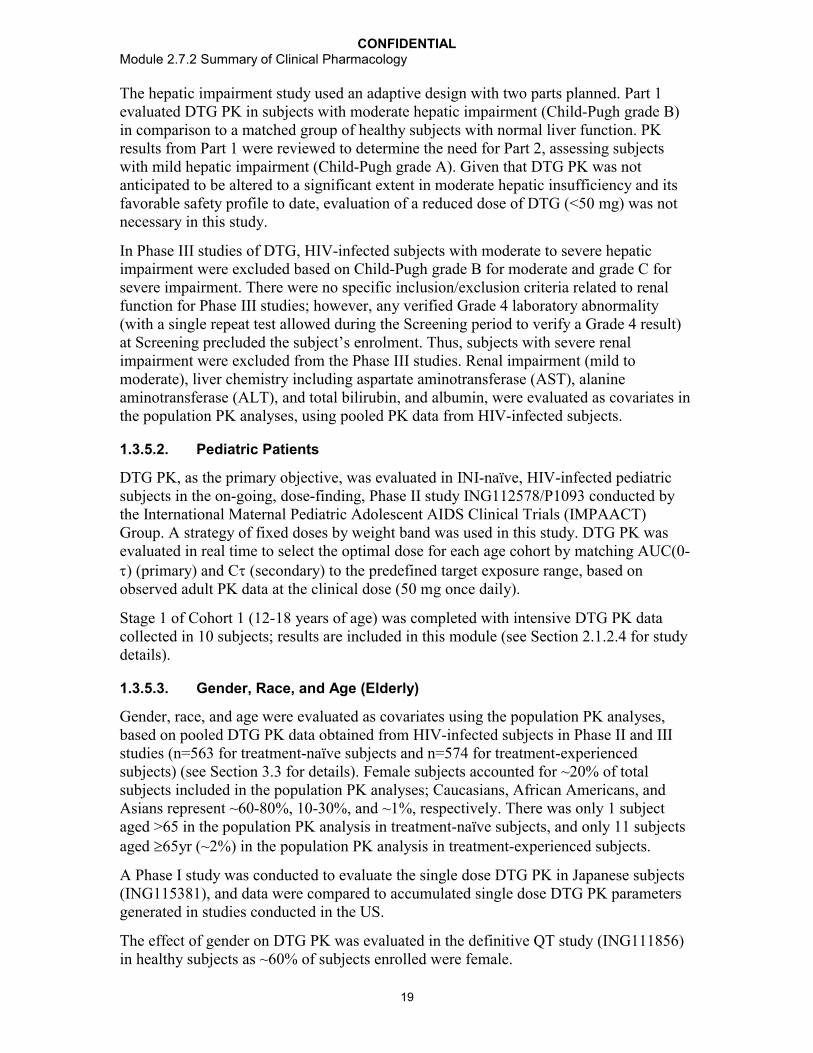
CONFIDENTIALModule 2.7.2 Summary of Clinical Pharmacology
19
The hepatic impairment study used an adaptive design with two parts planned. Part 1 evaluated DTG PK in subjects with moderate hepatic impairment (Child-Pugh grade B) in comparison to a matched group of healthy subjects with normal liver function. PK results from Part 1 were reviewed to determine the need for Part 2, assessing subjectswith mild hepatic impairment (Child-Pugh grade A). Given that DTG PK was not anticipated to be altered to a significant extent in moderate hepatic insufficiency and itsfavorable safety profile to date, evaluation of a reduced dose of DTG (<50 mg) was not necessary in this study.
In Phase III studies of DTG, HIV-infected subjects with moderate to severe hepatic impairment were excluded based on Child-Pugh grade B for moderate and grade C for severe impairment. There were no specific inclusion/exclusion criteria related to renal function for Phase III studies; however, any verified Grade 4 laboratory abnormality (with a single repeat test allowed during the Screening period to verify a Grade 4 result)at Screening precluded the subject’s enrolment. Thus, subjects with severe renal impairment were excluded from the Phase III studies. Renal impairment (mild to moderate), liver chemistry including aspartate aminotransferase (AST), alanine aminotransferase (ALT), and total bilirubin, and albumin, were evaluated as covariates in the population PK analyses, using pooled PK data from HIV-infected subjects.
1.3.5.2. Pediatric Patients
DTG PK, as the primary objective, was evaluated in INI-naïve, HIV-infected pediatricsubjects in the on-going, dose-finding, Phase II study ING112578/P1093 conducted by the International Maternal Pediatric Adolescent AIDS Clinical Trials (IMPAACT) Group. A strategy of fixed doses by weight band was used in this study. DTG PK was evaluated in real time to select the optimal dose for each age cohort by matching AUC(0-) (primary) and C (secondary) to the predefined target exposure range, based on observed adult PK data at the clinical dose (50 mg once daily).
Stage 1 of Cohort 1 (12-18 years of age) was completed with intensive DTG PK data collected in 10 subjects; results are included in this module (see Section 2.1.2.4 for study details).
1.3.5.3. Gender, Race, and Age (Elderly)
Gender, race, and age were evaluated as covariates using the population PK analyses,based on pooled DTG PK data obtained from HIV-infected subjects in Phase II and III studies (n=563 for treatment-naïve subjects and n=574 for treatment-experienced subjects) (see Section 3.3 for details). Female subjects accounted for ~20% of total subjects included in the population PK analyses; Caucasians, African Americans, and Asians represent ~60-80%, 10-30%, and ~1%, respectively. There was only 1 subject aged >65 in the population PK analysis in treatment-naïve subjects, and only 11 subjects aged 65yr (~2%) in the population PK analysis in treatment-experienced subjects.
A Phase I study was conducted to evaluate the single dose DTG PK in Japanese subjects(ING115381), and data were compared to accumulated single dose DTG PK parameters generated in studies conducted in the US.
The effect of gender on DTG PK was evaluated in the definitive QT study (ING111856) in healthy subjects as ~60% of subjects enrolled were female.

CONFIDENTIALModule 2.7.2 Summary of Clinical Pharmacology
20
1.3.5.4. HBV/HCV Co-infection
Patients who are HIV-positive are commonly co-infected with HBV or HCV due to shared routes of transmission. HCV co-infection represents about 15-30% of the HIV-infected population. Pegylated interferon alpha and the antiviral drug ribavirin are components of the first-line therapy for HCV. No drug interactions with DTG are expected for either drug due to the lack of overlap in their elimination pathways, and because neither are enzyme inducers or inhibitors. While there are some reports of interferon therapy inhibiting metabolism of CYP3A4, this is not a major pathway for DTG and more potent CYP3A4 inhibitors (i.e., LPV/RTV) have not shown a significant interaction (Section 2.1.3.2). BCV and TVR are recently approved protease inhibitors for HCV treatment. A drug interaction study between these drugs and DTG was conducted (Study ING115697; Section 2.1.3.15).
There is low propensity for drug interactions between DTG and drugs for HBV treatment.HBV drugs, including NRTIs (TDF, lamivudine [3TC], emtricitabine [FTC], adefovir, telbivudine, and entecavir), do not inhibit or induce CYP or UGT enzymes, and therefore,DTG PK is not expected to be affected by HBV drugs. A drug interaction study with tenofovir disproxil fumarate (TDF) was conducted (Study ING111604; Section 2.1.3.5). The potential effect of DTG on 3TC and FTC PK due to OCT2 inhibition by DTG is discussed in Section 3.4.2. 3TC, FTC, and TDF have been used with DTG in Phase IIItrials. PK data from treatment-naïve trials (where DTG was given together with TDF/FTC or 3TC/abacavir [ABC]) did not demonstrate differences in DTG PK in HIV-1 infected subjects compared to PK data from healthy subject studies (where DTG was given alone) (Table 45), which suggests these antiretroviral drugs did not affect DTG PK. While 3TC and TDF/FTC concentrations were not determined, efficacy/safety data suggests no clinically significant alteration in exposure of either of these NRTIs.
Population PK analyses also evaluated HBV/HCV co-infection as a covariate for DTG PK (see Section 3.3.1 and Section 3.3.2 for details). Effect of HBV and HCV co-infection on safety based on data from Phase IIb/III is summarized in m2.7.4 Section 3.1.1.
1.3.5.5. UGT1A1 Polymorphism
A pharmacogenetics (PGx) meta-analysis was performed to evaluate the effect of UGT1A1 polymorphisms on DTG PK, using pooled DTG PK data from 7 Phase I studies (see Section 3.3.3 for details). Based on this meta-analysis, a prospective clinical study enrolling subjects with UGT1A1 polymorphisms is not needed.
1.3.6. Pharmacokinetic-Pharmacodynamic Analysis and Dose Selection
Evaluations of the relationship between DTG dose, exposure and efficacy, and safety were performed throughout the clinical development program.
Phase I studies performed in healthy subjects evaluated safety/tolerability with DTGdoses ranging from 2 to 100 mg single doses, and repeat doses of 10 mg once dailyup to 50 mg twice daily. Safety/tolerability by DTG dose was evaluated, however no DTG exposure (PK parameters)-response analyses were performed for Phase I data.

CONFIDENTIALModule 2.7.2 Summary of Clinical Pharmacology
21
A dose-ranging, Phase IIa study in HIV-infected subjects evaluated DTG monotherapy at 2 to 50 mg once daily (Study ING111521); PK/PD analyses for efficacy endpoints were performed, and the results were used to define the optimal and suboptimal DTG exposures for antiviral activity as well as to support thePhase IIb dose selection.
Two dose-ranging, Phase IIb studies were performed to evaluate DTG in combination with other drugs at 10 to 50 mg once daily in treatment-naïve subjects (Study ING112276), and at 50 mg once daily and twice daily in INI-resistant subjects (Study ING112961). PK/PD analysis for both efficacy and safety were performed in these studies. Results from these Phase IIb studies supported the dose selection of DTG 50 mg once daily in Phase III studies in INI-naïve subjects (ING113086, ING114467, and ING111762) and 50 mg twice daily in the Phase III study in INI-resistant subjects (ING112574).
PK/PD analyses for both efficacy and safety were performed at the study level for each of the Phase III studies (except for ING114467 which did not collect PK data).
PK and PK/PD results from Phase II and III studies were used for the following purposes:
To define the “no effect boundaries” (see Section 3.2.3) of changes in DTG PK parameters. The PK/PD relationship for safety defines the upper bound and the PK/PD relationship for efficacy defines the lower bound; these “no effect boundaries” were used as the justification for dose adjustment (or no dose adjustment) recommendations due to drug interactions, or the impact of other intrinsic or extrinsic factors on DTG PK;
To support or provide primary evidence for the recommended optimal DTG doses for the treatment of HIV infection in various populations and subpopulations (see m2.7.3 Section 4 for details).
2. SUMMARY OF RESULTS OF INDIVIDUAL STUDIES
2.1. Pharmacokinetics
2.1.1. Pharmacokinetics in Healthy Subjects
2.1.1.1. Study ING111207 (Single Dose, Suspension/Solution, 2 to 100 mg)
Study Title: A Double-Blind, Randomized, Placebo-Controlled, Single Dose Escalation Study to Investigate the Safety, Tolerability and Pharmacokinetics of GSK1349572 in Healthy Subjects
Location of Report: m5.3.3.1, Study ING111207
Study Design: This was the first administration of DTG to investigate the safety, tolerability, and pharmacokinetics of DTG after single doses in healthy subjects. Twocohorts of 10 subjects (8 active, 2 placebo) received doses of 2, 5, 10, 25, 50 and 100 mg as suspension in an alternating panel design. Subjects randomized to placebo received placebo on all dosing occasions. Subjects were fasted overnight for 10 hours before until

CONFIDENTIALModule 2.7.2 Summary of Clinical Pharmacology
22
4 hours after receiving investigational product. Plasma PK samples were collected over 72 hours after single dose administration.
Results: Following a single oral dose administration of suspension, DTG was readily absorbed (tlag=0) with the maximum concentration achieved between 0.50 to 1.25 hours post dose across the 2 to 100 mg dose levels. Plasma exposures [AUC(0-24), AUC(0-), AUC(0-t), Cmax, and C24) of DTG increased proportionally as doses increased from 2 mg to 100 mg. The terminal half-life (t1/2) for all subjects was estimated to be approximately 13 to 15 hours. Plasma DTG C24 exceeded the in vitro protein-adjusted(PA) concentration at which 90% of the maximal inhibitory effect is achieved (IC90)(0.064 g/mL) at doses higher than 5 mg. Low to moderate between-subject variability was observed in single dose DTG PK parameters with between-subject %CVb ranging from 9% to 41%. A summary of selected plasma DTG PK parameters following a single dose is presented in Table 1. A summary of dose proportionality assessments is presented in presented inTable 2.
Table 1 Summary of Selected Plasma DTG Pharmacokinetic ParametersFollowing Single Dose in Suspensiona
Treatment N Cmax(g/mL)
tmaxb
(h)AUC(0-∞)(g.h/mL)
t1/2(h)
C24(g/mL)
2 mg 8 0.231(20)
0.63(0.25-1.00)
2.78(26)
12.7(20)
0.0382(41)
5 mg 7 0.661(20)
0.50(0.50-1.50)
8.87(27)
14.3(25)
0.126(28)
10 mg 8 1.23(9)
0.63(0.25-1.50)
14.6(21)
12.7(9)
0.196(34)
25 mg 8 2.76(12)
0.75(0.50-1.50)
35.2(30)
12.7(21)
0.469(41)
50 mg 6 4.56(21)
1.25(0.50-3.00)
73.2(19)
14.2(19)
1.06(27)
100 mg 5 8.14(12)
1.00(0.75-3.00)
136(24)
14.7(23)
1.80(33)
Source Data: m5.3.3.1, Study ING111207. Table 11.4.a. PK parameters are presented as geometric mean (%CVb) unless noted otherwise
b. Presented as median (range)
Table 2 Summary of Dose Proportionality of Single Dose DTG PK Parameters Using Power Model
Parameter Slope 90% Confidence IntervalAUC(0-∞) 0.996 [0.941, 1.05]
C24 0.970 [0.861, 1.08]Cmax 0.948 [0.864, 1.03]
Source Data: Study ING111207,Table 11.5

CONFIDENTIALModule 2.7.2 Summary of Clinical Pharmacology
23
Conclusions:
DTG was absorbed rapidly following oral administration and its exposure increased proportionally with dose up to 100 mg when DTG was given as a suspension formulation.
DTG demonstrated low to moderate PK variability.
Observed DTG PK following single dose administration supports once daily dosing.
2.1.1.2. Study ING112941 (Single Dose, Suspension, 250 mg)
Study Title: A randomized, double-blind study to evaluate the safety, tolerability, and pharmacokinetics of a supratherapeutic dose of GSK1349572 250 mg and a randomized, open-label study to evaluate the effects of omeprazole 40 mg daily and a high fat meal on the pharmacokinetics of GSK1349572 50 mg in healthy adult subjects (ING112941)
Location of Report: m5.3.3.4, Study ING112941
Study Design: Part 2 of ING112941 was a randomized, double-blind, single dose pharmacokinetic study that evaluated the safety, tolerability, and PK of a single supratherapeutic dose of DTG (250 mg) compared with placebo. The planned enrollment was ten subjects (8 on DTG and 2 on placebo). Plasma PK samples for DTG were collected pre-dose and over 48 hours post dose on Day 5.
Results: Summary of selected DTG PK parameters following a single dose of 250 mg DTG in suspension is presented in Table 3.
Table 3 Summary of Selected Plasma DTG Pharmacokinetic Parameters Following Single Dose Administration
TreatmentRegimen
N Cmax(g/mL)
tmax(h)
AUC(0-∞)(g.h/mL)
C24(g/mL)
CL/F (L/hr) Vz/F(L)
t½ (hr)
Part 2DTG 250 mg 8 14.1
(10)2.50
(1.50-4.00)278(15)
4.08(17)
0.90(15)
18.8(11)
14.5(10)
Data Source: m5.3.3.4, Study ING112941, Table 11.3.Data presented are geometric mean (%CVb) except for tmax where median (range) is presented.
The single 250 mg dose as suspension achieved supratherapeutic exposure, which is at least 4-fold of that observed at 50 mg once daily, therefore supporting the use of a 250 mg dose in suspension in the QTc study (Study ING111856). The higher CL/F estimates, but similar t1/2, in the current study compared to single dose PK data in ING111207 up to 100 mg, indicates solubility-limited absorption at doses higher than 100 mg using suspension.
Conclusions: The observed DTG PK of a single 250 mg dose as suspension demonstrated supratherapeutic exposure and supports this dose/formulation in the thorough QTc study (Study ING111856) to be conducted separately.
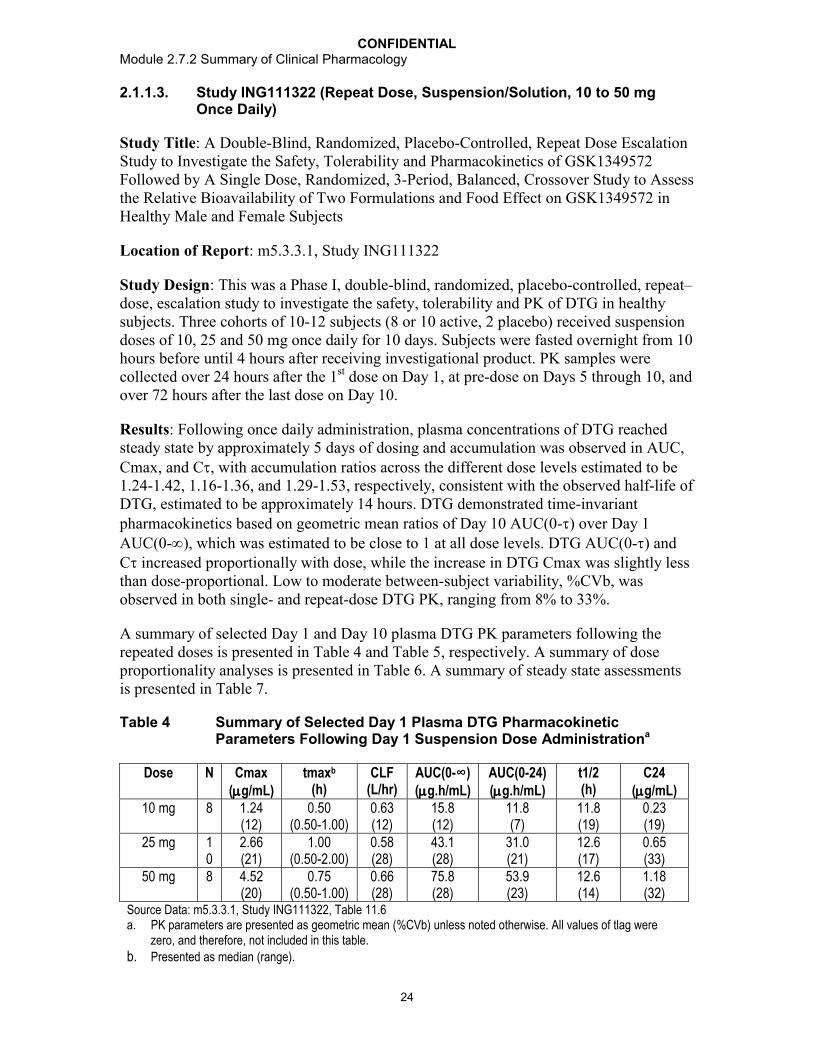
CONFIDENTIALModule 2.7.2 Summary of Clinical Pharmacology
24
2.1.1.3. Study ING111322 (Repeat Dose, Suspension/Solution, 10 to 50 mg Once Daily)
Study Title: A Double-Blind, Randomized, Placebo-Controlled, Repeat Dose Escalation Study to Investigate the Safety, Tolerability and Pharmacokinetics of GSK1349572 Followed by A Single Dose, Randomized, 3-Period, Balanced, Crossover Study to Assess the Relative Bioavailability of Two Formulations and Food Effect on GSK1349572 in Healthy Male and Female Subjects
Location of Report: m5.3.3.1, Study ING111322
Study Design: This was a Phase I, double-blind, randomized, placebo-controlled, repeat–dose, escalation study to investigate the safety, tolerability and PK of DTG in healthy subjects. Three cohorts of 10-12 subjects (8 or 10 active, 2 placebo) received suspension doses of 10, 25 and 50 mg once daily for 10 days. Subjects were fasted overnight from 10 hours before until 4 hours after receiving investigational product. PK samples were collected over 24 hours after the 1st dose on Day 1, at pre-dose on Days 5 through 10, and over 72 hours after the last dose on Day 10.
Results: Following once daily administration, plasma concentrations of DTG reached steady state by approximately 5 days of dosing and accumulation was observed in AUC, Cmax, and C, with accumulation ratios across the different dose levels estimated to be 1.24-1.42, 1.16-1.36, and 1.29-1.53, respectively, consistent with the observed half-life of DTG, estimated to be approximately 14 hours. DTG demonstrated time-invariant pharmacokinetics based on geometric mean ratios of Day 10 AUC(0-) over Day 1 AUC(0-), which was estimated to be close to 1 at all dose levels. DTG AUC(0-) and C increased proportionally with dose, while the increase in DTG Cmax was slightly less than dose-proportional. Low to moderate between-subject variability, %CVb, was observed in both single- and repeat-dose DTG PK, ranging from 8% to 33%.
A summary of selected Day 1 and Day 10 plasma DTG PK parameters following the repeated doses is presented in Table 4 and Table 5, respectively. A summary of dose proportionality analyses is presented in Table 6. A summary of steady state assessmentsis presented in Table 7.
Table 4 Summary of Selected Day 1 Plasma DTG Pharmacokinetic Parameters Following Day 1 Suspension Dose Administrationa
Dose N Cmax(g/mL)
tmaxb
(h)CLF
(L/hr)AUC(0-∞)(g.h/mL)
AUC(0-24)(g.h/mL)
t1/2(h)
C24(g/mL)
10 mg 8 1.24(12)
0.50(0.50-1.00)
0.63(12)
15.8(12)
11.8(7)
11.8(19)
0.23(19)
25 mg 10
2.66(21)
1.00(0.50-2.00)
0.58(28)
43.1(28)
31.0(21)
12.6(17)
0.65(33)
50 mg 8 4.52(20)
0.75(0.50-1.00)
0.66(28)
75.8(28)
53.9(23)
12.6(14)
1.18(32)
Source Data: m5.3.3.1, Study ING111322, Table 11.6a. PK parameters are presented as geometric mean (%CVb) unless noted otherwise. All values of tlag were
zero, and therefore, not included in this table.
b. Presented as median (range).

CONFIDENTIALModule 2.7.2 Summary of Clinical Pharmacology
25
Table 5 Summary of Selected Day 10 Plasma DTG Pharmacokinetic Parameters Following Once Daily Repeat Doses in Suspension
Dose N Cmax(g/mL)
tmax(h)
AUC(0-)(g.h/mL)
C(g/mL)
Rc(Cmax)
Rc(AUC)
Rc(C)
Time-invariance
10 mg 8 1.47(24)
0.50(0.25-2.00)
16.7(15)
0.35(20)
1.18(20)
1.41(10)
1.53(14)
1.06[0.961, 1.16]
25 mg 10 3.09(26)
1.00(0.50-2.00)
38.4(23)
0.84(33)
1.16(17)
1.24(9)
1.29(8)
0.892[0.841, 0.946]
50 mg 8 6.16(15)
1.00(0.50-2.00)
76.8(19)
1.64(25)
1.36(15)
1.42(12)
1.38(14)
1.01[0.920, 1.12]
Data Source: Study ING111322, Table 11.8.Data presented are geometric mean (%CVb) except for tmax where median (range) is presented and for time-invariance where GLS mean ratio and (90%CI) of Day 10 AUC(0-) vs Day 1 AUC(0-) is presented.
Table 6 Summary of Dose Proportionality of Single and Repeat Suspension Dose DTG PK Parameters Using the Power Model
Plasma DTG PK Parameter
Slope in dose range of 10 mg-50 mg [90% CI]Day 1 Day 10
Slope 90 %CI Slope 90 %CI
AUC (g.hr/mL) 0.98 (0.85-1.11) NA NA
AUC (µg.hr/mL)a 0.95 (0.85-1.05) 0.95 (0.86-1.04)
C0 (µg/mL) NA NA 1.07 (0.93-1.20)Cmax (µg/mL) 0.80 (0.71-0.90) 0.89 (0.79-0.999)Cmin (µg/mL) NA NA 1.06 (0.92-1.19)
C (µg/mL) NA NA 0.97 (0.84-1.09)Source Data: Study ING111322. Table 11.11NA = Not applicable. A slope estimate of close to 1 with 90% CI including 1 represents dose proportionality.a. AUC(0-t) for Day 1 and AUC(0-) for Day 10
Table 7 Summary of DTG Steady State Assessment
Days Treatment Slope 90% CI5, 6, 7, 8, 9, and 10 10 mg 0.000 [-0.013, 0.014]
25 mg -0.014 [-0.029, 0.001]50 mg 0.025 [0.010, 0.040]
6, 7, 8, 9, and 10 10 mg 0.011 [-0.006, 0.028]25 mg -0.012 [-0.036, 0.012]50 mg 0.003 [-0.015, 0.021]
Source Data: Study ING111322. Table 11.10A slope estimate of close to 0 with 90% CI including 0 represents achievement of steady state.
Conclusions:
Following repeat-dose administration, plasma concentrations of DTG reached steady state by approximately 5 days of dosing.
DTG AUC and C increased proportionally between 10 and 50 mg once daily. The increase in DTG Cmax was slightly less than dose-proportional.

CONFIDENTIALModule 2.7.2 Summary of Clinical Pharmacology
26
Accumulation was observed in AUC, Cmax and C following repeat-dose administration of DTG once daily, with accumulation ratios estimated to be 1.24-1.42, 1.16-1.36, and 1.29-1.53, respectively, across 10 to 50 mg once daily dose levels.
DTG showed time-invariant pharmacokinetics.
2.1.1.4. Study ING114005 (Single Dose, Tablet, 50 mg and 100 mg)
Study Title: A Phase I, Open Label, Single Sequence, Three Period Study to Evaluate the Single Dose Pharmacokinetics of GSK1349572 100 mg versus 50 mg and the Effect of Efavirenz 600 mg Once Daily on the Pharmacokinetics, Safety and Tolerability of GSK1349572 50 mg Once Daily in Healthy Adult Subjects (ING114005)
Location of Report: m5.3.3.4, Study ING114005
Study Design: Period 1 and Period 2 of this study compared DTG PK parameters from a single 100 mg dose (tablet) to a single 50 mg dose (tablet) to evaluate the dose proportionality. A total of approximately 12 subjects were enrolled, in order to obtain approximately 10 evaluable subjects. In Period 1, all subjects received a single dose of DTG 100 mg in the fasted state on the morning of Day 1 followed by a washout of 6 days. In Period 2, subjects received DTG 50 mg once daily in the morning for 5 days. All doses were administered in the fasted state in the morning. Plasma PK samples for DTG were collected pre-dose and over 24 hours post morning dose on Day 1 of Period 1, as well as Day 1 of Period 2.
Results:
Table 8 Summary of Selected Plasma DTG Pharmacokinetic Parameters Following Single Dose Administrationa
Treatment N Cmax(g/mL)
AUC(0-24)(g.h/mL)
C24(g/mL)
tlagb
(h)tmaxb
(h)
100 mg 12 2.77(35)
34.3(41)
0.80(53)
0.00(0.00-0.00)
2.00(1.0-4.0)
50 mg 12 1.83(35)
24.3(44)
0.53(59)
0.00(0.00-0.00)
2.00(1.0-4.0)
Data Source: m5.3.3.4, Study ING114005, Table 11.6a. Parameters presented as geometric mean (%CVb) unless noted otherwise.b. Presented as median (range).

CONFIDENTIALModule 2.7.2 Summary of Clinical Pharmacology
27
Table 9 Summary of DTG Dose Proportionality Analysis Using ANOVA
Plasma DTG PK Parameter
GLS Mean Ratio [90% CI]
DTG 100 mg SD vs DTG 50 mg SD
Dose-normalized AUC(0-24) 0.705[0.597, 0.833]
Dose-normalized Cmax 0.756[0.648, 0.883]
Dose-normalized C24 0.750[0.639, 0.881]
Source Data: Study ING114005, Table 11.12GLS = geometric least-squares
Conclusions: Plasma exposures of DTG increased less than dose proportionally as dose increased from 50 mg to 100 mg with relative oral bioavailability of 100 mg is 70.5% to that of 50 mg.
2.1.1.5. Study ING111853 (Single Dose, Human Mass Balance)
Study Title: An Open Label, Non-Randomized, Single Dose, Mass Balance Study to Investigate the Recovery, Excretion, and Pharmacokinetics of 14C-GSK1349572 20 mg, Administered as a Single Oral Suspension Dose to Healthy Adult Subjects (ING111853)
Location of Report: m5.3.3.1, Study ING 111853; m5.3.2.2, Study 09DMR014 [GlaxoSmithKline Document Number RD2009/00356/00]
Study Design: Six subjects received a single oral suspension dose of DTG 20 mg containing [14C]-GSK1349572 of approximately 80 Ci (0.96 mSv) of radioactivity after an overnight fast of at least 10 hours. Serial whole blood and plasma samples were collected for a minimum of 72 hours post dose. Urine and fecal samples were collected for a minimum of 120 hours post dose. Total radiocarbon in individual samples (whole blood, plasma, urine, and feces), as well as DTG concentration in plasma, were determined. Plasma, urine, and fecal samples were also analyzed for metabolite profiles.
Results:
The mean total recovery of the administered dose was 95.6%, with a mean recovery of 64% in feces and 31.6% in urine; most of the dose (94.5%) was recovered in the feces and urine by 144 hours post dose. A summary of the percent of the administered dose recovered in feces, in urine, and in total is presented in Table 10.
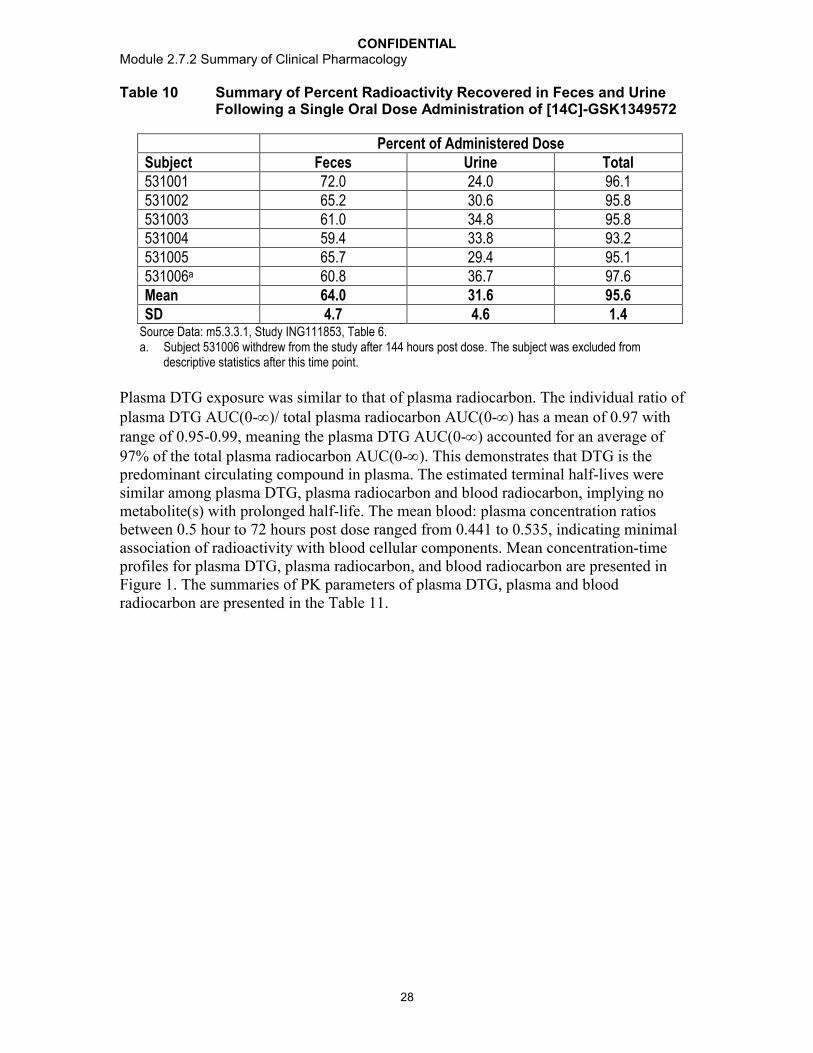
CONFIDENTIALModule 2.7.2 Summary of Clinical Pharmacology
28
Table 10 Summary of Percent Radioactivity Recovered in Feces and Urine Following a Single Oral Dose Administration of [14C]-GSK1349572
Percent of Administered DoseSubject Feces Urine Total531001 72.0 24.0 96.1531002 65.2 30.6 95.8531003 61.0 34.8 95.8531004 59.4 33.8 93.2531005 65.7 29.4 95.1531006a 60.8 36.7 97.6Mean 64.0 31.6 95.6SD 4.7 4.6 1.4
Source Data: m5.3.3.1, Study ING111853, Table 6.a. Subject 531006 withdrew from the study after 144 hours post dose. The subject was excluded from
descriptive statistics after this time point.
Plasma DTG exposure was similar to that of plasma radiocarbon. The individual ratio of plasma DTG AUC(0-)/ total plasma radiocarbon AUC(0-) has a mean of 0.97 with range of 0.95-0.99, meaning the plasma DTG AUC(0-) accounted for an average of 97% of the total plasma radiocarbon AUC(0-). This demonstrates that DTG is the predominant circulating compound in plasma. The estimated terminal half-lives were similar among plasma DTG, plasma radiocarbon and blood radiocarbon, implying no metabolite(s) with prolonged half-life. The mean blood: plasma concentration ratios between 0.5 hour to 72 hours post dose ranged from 0.441 to 0.535, indicating minimal association of radioactivity with blood cellular components. Mean concentration-time profiles for plasma DTG, plasma radiocarbon, and blood radiocarbon are presented inFigure 1. The summaries of PK parameters of plasma DTG, plasma and blood radiocarbon are presented in the Table 11.

CONFIDENTIALModule 2.7.2 Summary of Clinical Pharmacology
29
Figure 1 Mean Concentration-Time Profiles for Plasma DTG, Plasma Radiocarbon, and Blood Radiocarbon
Analyte 572 (ug/mL)Radioactivity Blood (ug/g)Radioactivity Plasma (ug/g)
Concentr
atio
n
0
1
2
3
Planned Relative Time (Hrs)
0 30 60 90 120 150 180 210 240
Source Data: Study ING111853. Figure 11.4
Table 11 Summary of Selected Pharmacokinetic Parameters for Plasma DTG, Plasma Radiocarbon, and Blood Radiocarbon Following a Single Oral Dose Administration of [14C]-GSK1349572a
Analyte n Cmaxb
(g/mL)Tmaxc
(h)AUC(0-t)d
(g.h/mL)AUC(0-)d
(g.h/mL)
CL/F(L/hr)
Vz/F(L)
T1/2(hr)
Plasma DTG 6 2.57(24)
0.50(0.50-2.00)
35.7(12)
35.9(12)
0.56(12)
12.5(9)
15.6(16)
Plasma Radiocarbon
6 2.46(24)
0.50(0.50-1.50)
35.9(11)
36.1(11)
nr nr 15.7(14)
Blood Radiocarbon
6 1.13(25)
1.25(0.50-2.00)
17.7(13)
18.4(13)
nr nr 14.6(12)
Source Data: Study ING111853,Table 11.2.nr = not reporteda. Data are presented as geometric mean (%CVb) unless otherwise noted.b. Cmax is reported in units of g/mL for plasma DTG, and g/g for plasma and blood radiocarbon.c. Presented as median (range).d. AUC is reported in units of g.h/mL for plasma DTG and g.h/g for plasma and blood radiocarbon.
Analyses of metabolite profiles using plasma, urine, and fecal samples revealed the following:
The principal radiolabeled component in plasma pooled from all subjects at 6, 24, and 48 hours post dosing was DTG, representing 95.2%, 96.8% and 99.8% of the plasma radiocarbon, respectively. An ether glucuronide conjugate of DTG (M3) represented ≤2.4% of plasma radiocarbon at 6 and 24 hours post dose, but was not detected at 48 hours post dose.

CONFIDENTIALModule 2.7.2 Summary of Clinical Pharmacology
30
M3 was the major biotransformation product observed in the urine, accounting for 62.5% of the radiocarbon (18.9% of the dose). Two other notable metabolites were also observed in human urine; these resulted from oxidation at the benzylic carbon (M7), representing 10.1% of the urinary radiocarbon (3.0% of the dose), and N-dealkylation(M1), representing 11.8% of the urinary radiocarbon (3.6% of the dose). Renal elimination of unchanged DTG was low (≤2.6% of the sample radiocarbon or ≤0.8% of the dose).
An average of 89.1% of the fecal radiocarbon (53.1% of the dose) was recovered as DTG. Other notable components in feces included a metabolite resulting from the loss of fluorine and the addition of cysteine and oxygen (M13), representing 3.1% of the fecal radiocarbon (1.8% of the dose), and M1 accounting for 2.2% of the fecal radiocarbon (1.3% of the dose). It was unclear how much of the unchanged DTG recovered in feces was due to unabsorbed dose and how much may be due to biliary secretion of M3 with subsequent conversion of the conjugate to the parent drug in feces. However based on such data, the oral bioavailability of DTG (from suspension formulation) is at least 47% assuming unchanged DTG recovered in feces was completely due to unabsorbed doseand no metabolite(s) observed in feces were generated from degradation of DTG by gut lumen bacteria.
The total radioactivity of the glucuronide conjugate metabolite, M3, recovered in urine and feces represented at least 18.9% of total dose administered (possibly higher if accounting for M3 converted to parent drug in feces). The total radioactivity of metabolites formed through oxidation (M1, M7, and M13) that were recovered in urine and feces accounted for approximately 9.7% (mean) of the total dose administered.
Conclusions:
Following oral administration, the total mean recovery of DTG was 95.6% of the administered dose, with a mean recovery of 64.0% in feces and 31.6% in urine.
Unchanged DTG is primarily eliminated through metabolism, with renal elimination of unchanged DTG comprising less than 1% of the total dose administered.
DTG was the predominant circulating compound in plasma.
Low mean blood:plasma concentration ratios indicated minimal association of radioactivity with the blood cellular components.
The observed metabolites included ether glucuronide of DTG (M3), an N-dealkylation metabolite (M1), a metabolite from oxidation at the benzylic carbon(M7), and a metabolite resulting from the loss of fluorine and the addition of cysteine and oxygen (M13).
DTG is mainly metabolized through glucuronidation with oxidation as a minor route.
2.1.1.6. Study ING115465 (Female Genital Tract)
Study Title: A Phase I, open-label, study in healthy female subjects to describe GSK1349572 exposure in blood, cervicovaginal fluid, cervical tissue, and vaginal tissue following single and multiple dosing of GSK1349572

CONFIDENTIALModule 2.7.2 Summary of Clinical Pharmacology
31
Location of Report: m5.3.3.1, Study ING115465
Study Design: Eight healthy, adult female subjects were enrolled to take one 50 mg tablet of DTG orally each day for 5-7 days, and provided evaluable PK data. DTG in cervicovaginal fluid (CVF) and blood plasma (BP) were measured over 24 hours after both the initial dose and at steady state (on Days 5-7). Cervical and vaginal biopsies (CT and VT) were collected once at 3, 6, 12, or 24 hours after the initial dose, and again at steady state at the same single time points. Samples were collected from 2 subjects per time point; the specific tissue sample collection time for each subject was assigned sequentially as enrolled. BP and CVF samples were obtained at 48 and 72 hours following the final DTG dose. Individual PK parameters in BP and CVF, and composite PK parameters in CT and VT, were estimated based on non-compartmental approach.
Results:
Figure 2 Median (IQR) DTG Concentration-over-time Profiles in BP, CVF, VT, and CT at Steady State
Data Source: m5.3.3.1, Study ING115465, Supplementary Figure 36.
Table 12 Summary of DTG PK Parameters in BP, CVF, VT, and CT
PK Parameter BP CVF CT VT
Day 1 AUC(0-24), g.h/mL 37.4 (28) 3.06 (119) 2.75 2.73
Steady State AUC(0-24), g.h/mL 51.8 (24) 3.25 (72) 5.30 4.74
Accumulation Ratio of AUC(0-24) 1.39 (9.8) 0.86 (25) 1.93 1.74
Tissue-to-Plasma Ratio of AUC(0-24) at Steady State
n.a. 0.06 (median) 0.10 0.09
Data Source: Study ING115465, Table 6, Table 7, Table 8, Table 9, Table 10, Table 11, Table 12, Table 13, Table 14, and Table 15.Data presented are geometric mean (%CVb) for BP and CVF, and composite for CT and VT.

CONFIDENTIALModule 2.7.2 Summary of Clinical Pharmacology
32
Conclusions:
DTG exposure in CVF was 6% of plasma exposure at steady-state. There was no accumulation after repeat dosing. Delayed tmax is observed in CVF (tmax=6hr) compared to plasma (tmax=2hr).
DTG exposure in CT was 10% of plasma exposure at steady state. There was a higher accumulation in CT after repeat dosing than in plasma (R=1.9 in CT vs 1.4 in plasma).
DTG exposure in VT was similar to CT, representing 9% of plasma exposure. The accumulation in VT after repeat dosing is higher than in plasma (R=1.7 in VT vs 1.4 in plasma).
CT and VT exposures were highly correlated, and had concentrations above the PA-IC90 (0.064 g/mL) of DTG for wild-type HIV-1 virus at steady state in CT in all women, and in VT in 7/8 women.
2.1.1.7. Study ING116195 (Male Genital Tract)
Study Title: Phase I, open-label study in healthy male subjects describing GSK1349572 exposure in blood plasma, seminal fluid and rectal mucosal tissue following single and multiple dosing (ING116195)
Location of Report: m5.3.3.1, Study ING116195
Study Design: Twelve healthy male subjects were enrolled. A 50 mg oral dose of DTG was administered once daily for 8 days, and drug concentrations after a single dose (Day 1) and at steady state (Day 7 or Day 8) were measured in blood plasma (BP), seminal fluid (SF), rectal mucosal fluid (RF), and rectal mucosal tissue (RT). At each visit, samples for BP, SF, RF, and RT were collected over 24 hours. At the Day 1 visit, SF and RF samples were collected from 4 patients per time point, and RT samples were collected from 2 patients per time point. At the steady state PK visit, the 1, 6, and 18 hour SF and RF samples were collected from each subject on Day 7, and the 3, 12, and 24 hour SF and RF samples were collected from each subject on Day 8; RT samples were collected from 2 patients per time point. Individual PK parameters in BP and composite PK parameters in SF, RF, and RT were estimated based on a non-compartmental approach.
Results:

CONFIDENTIALModule 2.7.2 Summary of Clinical Pharmacology
33
Figure 3 Median (IQR) DTG Concentration-over-time Profiles in BP, SF, RF, and RT at Steady State following DTG 50 mg Once Daily
Data Source: m5.3.3.1, Study ING116195, Supplementary Figure 25.
Table 13 Summary of DTG PK Parameters in BP, SF, RF, and RT
PK Parameter BP SF RF RT
Day 1 AUC(0-24), g.h/mL 30.8 (32) 2.01 0.092(median)
5.28
Day 1 C24, g/mL 0.706 (36) 0.047 (46) 0.017(median)
0.115 (22)
Steady State (Day 7) AUC(0-24), g.h/mL
50.4 (30) 3.18 (42) 0.356 (581) 7.60
Steady State (Day 7) C24, g/mL 1.07 (41) 0.061 (58) 0.0093 (2164)
0.139
Accumulation Ratio of AUC(0-24) 1.64 (23) 1.57 (42) n.a. 1.44
Tissue-to-Plasma Ratio of AUC(0-24) at Steady State
0.07 (33) n.a. 0.17
Data Source: Study ING116195, Table 6, Table 7, Table 8, Table 9, Table 10, Table 11, Table 12, Table 13, Table 14, and Table 15.n.a. = not applicableData presented are geometric mean (%CVb) for BP and SF, and composite for RF and RT.
Conclusions:
Penetration of DTG into SF was ≤7% BP, with SF C24h below the PA-IC90 (0.064 g/mL) of DTG for wild-type HIV-1 virus.
Although the AUC of DTG in RT was <20% BP, RT C24h was approximately 2-fold higher than the PA IC90.
RF was not a strong surrogate for RT concentrations, and demonstrated high intra-and between-subject variability.

CONFIDENTIALModule 2.7.2 Summary of Clinical Pharmacology
34
2.1.2. Pharmacokinetics in Special Populations
2.1.2.1. Study ING115381 (Japanese)
Study Title: An Open-Label, Single Dose Study to Investigate the Pharmacokinetics, Safety and Tolerability of GSK1349572 (Dolutegravir, DTG) in Healthy Japanese Subjects
Location of Report: m5.3.3.3, Study ING115381
Study Design: The purpose of this study was to evaluate the PK of DTG following single oral administration in healthy Japanese subjects to support the development of the drug globally, including in North East Asia. A single 50 mg oral dose of DTG was administered to 10 healthy Japanese subjects resident in the US. Serial plasma samples were to be collected for PK analysis from pre-dose (within 15 minutes of dosing) up to 72 hours post dose.
Results: DTG PK parameters observed in this study in healthy Japanese subjects are summarized in Table 14. PK parameters of DTG reported in previous studies conducted in US in healthy Western subjects (predominantly Caucasian) following a single 50 mg oral dose are also provided in Table 14.
Table 14 Summary of Selected DTG PK Parameters Following a Single 50 mg Dose in Healthy Japanese Subjects and healthy Western, Predominantly Caucasian, Subjects
Clinical Trials/(Study Location)
N Body Weight (kg)
Cmax (g/mL)
Tmax (hours)
AUC(0-∞)(g.h/mL)
T1/2 (hours)
C24g/mL
Healthy Japanese Subjects
ING115381 /(US) 10 66.4 (7.72) 2.14 (47) 3.0 (2.0-4.0) 43.4 (46) 14.6 (10) 0.67 (45)
Historical Data from Healthy Western Data primarily from Caucasian Subjects
ING114005 /(US) 12 83.3 (12.6) 1.83 (35) 2.0 (1.0-4.0) NR 13.6 (24) 0.53 (59)
ING113674 (AP formulation) /(US)
22 68.8 (9.9) 2.67 (35) 3.00 (1.0-5.0) 53.2 (34) 14.2 (19) 0.82 (38)
ING113674 (AW formulation) /US
22 68.8 (9.9) 2.64 (30) 2.56 (1.0-6.0) 50.6 (27) 14.1 (21) 0.76 (33)
ING111602 /US 16 79.6 (11.3) 2.03 (25) 2.5 (0.5-8.0) 35.6 (33) 13.7 (15) 0.51 (38)
ING112941 /US 12 84.7 (13.4) 1.84 (44) 4.0 (1.0-5.0) 34.7 (57) 14.4 (21) 0.56 (63)
ING113097 /US 8 97.2 (22.7) 1.80 (49) 3.0 (1.0-4.0) 37.3 (47) 14.9 (24) 0.57 (44)
ING113125 /US 8 86.6 (17.1) 1.86 (45) 2.00 (1.0-4.0) 37.1 (58) 15.4 (15) NR
Data Source: m5.3.3.3, Study ING115381, Table 6; Table 9; m5.3.3.4, Study ING111602, Table 9.5, Table 11.3; Study ING112941, Table 9.5, Table 11.3; m5.3.3.3, Study ING113097, Table 9.5, Table 11.3; m5.3.3.3, Study ING113125, Table 9.5, Table 11.3; m5.3.1.2, .Study ING113674 Table 9.5, Table 11.2; m5.3.3.4, Study ING114005, Table 9.5, Table 11.6.Data presented are geometric mean (%CVb) except for tmax where median (range) is presented and body weight where mean (SD) are presented. NR: not reported.

CONFIDENTIALModule 2.7.2 Summary of Clinical Pharmacology
35
Conclusions: The pharmacokinetics of DTG following single dose oral administration to healthy Japanese subjects studied in the US were consistent with the DTG PK parameters reported in healthy subjects in the US who were predominantly Caucasian. DTG has low to moderate between-subject PK variability in both the healthy Japanese (%CVb: 11-47%) and Western (15-63%) subjects. Dose adjustment of DTG in Japanese subjects solely based on pharmacokinetic principles would not be necessary.
2.1.2.2. Study ING113097 (Moderate Hepatic Impairment)
Study Title: A Phase I, Open-Label, Parallel-Group, Two-Part, Adaptive Study to Evaluate the Pharmacokinetics and Safety of Dolutegravir in Subjects with Hepatic Impairment and Healthy Matched Control Subjects (ING113097)
Location of Report: m5.3.3.3, Study ING113097
Study Design: In Part 1, 8 subjects with moderate hepatic impairment, defined by a Child-Pugh grade B (score of 7 to 9), and 8 matched control subjects (matched for gender, age, and body mass index) received a single oral dose of DTG 50 mg in the morning followed by 72-hour serial PK sampling to determine total DTG concentration in plasma. Plasma samples at 3 hours and 24 hours post dose were also collected for the determination of unbound DTG concentration in plasma. PK samples obtained in Part 1 were evaluated. If the geometric mean total plasma AUC of DTG among subjects with moderate hepatic impairment was >2-fold above that among matched control subjects, Part 2 of the study would have been conducted, in which subjects with mild hepatic impairment defined by a Child-Pugh grade A (score of 5 to 6) and matched control subjects would have received a single oral dose of DTG 50 mg in the morning followed by 72-hour serial PK sampling. See Section 1.3.5.1 for more details on study design discussion.
Results: Selected DTG PK parameters in Part 1 are summarized in Table 15.

CONFIDENTIALModule 2.7.2 Summary of Clinical Pharmacology
36
Table 15 Summary and Comparison of Selected Plasma DTGPharmacokinetic Parametersa
Cohort Moderately Hepatic
Impaired(n=8)
Healthy(n=8)
Ratio of GLS Means (90% CI)
Hepatic Impaired vs Healthy(n=8)
Cmax(g/mL)
1.78(17)
1.80(49)
1.02[0.754, 1.37]
C24(g/mL)
0.59(36)
0.57(44)
1.04[0.727, 1.48]
AUC(0-∞)( g.h/mL)
38.5(30)
37.3(47)
1.05[0.745, 1.49]
AUC(0-t)( g.h/mL)
36.7(27)
35.5(48)
1.06[0.753, 1.48]
CL/F(L/hr)
1.30(30)
1.34(47)
0.950[0.673, 1.34]
Vz/F(L)
29.1(18)
28.7(50)
0.986[0.737, 1.32]
t1/2(h)
15.5(19)
14.9(24)
1.04[0.845, 1.27]
tmax(h) b
4.00(2.0-5.0)
3.00(1.0-4.0)
1.00[-0.500, 2.50]
Fraction Unbound at 3 hours post dose, FU3,
(%)b
0.58(0.2, 0.8)
0.23(0.2, 0.3)
2.20[1.62, 2.99]
Fraction Unbound at 24 hours post dose, FU24,
(%)b
0.48(0.2, 0.6)
0.23(0.2, 0.3)
1.76[1.23, 2.51]
Source Data: m5.3.3.3, Study ING113097, Table 11.3, Table 11.5, and Table 11.6a. PK parameters are presented as geometric mean (%CVb) unless otherwise noted.b. Presented as median (range).
Total DTG exposure on plasma was similar between subjects with moderate hepatic impairment and matched healthy subjects, while unbound DTG concentration and fraction unbound were higher in subjects with hepatic impairment. Part 2 of the study was not performed. The higher unbound DTG concentration in moderate hepatically impaired subjects is not considered a safety concern at the single digit ng/mL level (a mean value of 8.38 ng/mL at 3h post dose and 2.49 ng/mL at 24h post dose).
Results from Pearson correlation and regression analyses between DTG PK parameters and hepatic function variables revealed that unbound DTG fractions were statistically higher in subjects with higher albumin score (lower serum albumin concentration), higher bilirubin score (higher serum bilirubin concentration), and higher Child-Pugh score. There was no apparent relationship between DTG unbound fraction and total protein concentration.
Data on the PK, safety, or efficacy of DTG in HIV-infected subjects with moderate hepatic impairment have not been generated as these subjects were excluded from Phase IIb and III clinical studies of DTG. However, based on similar DTG PK observed between HIV-negative and HIV-infected subjects without hepatic impairment (Section 3.1.1), data generated in HIV-negative subjects can be applied to HIV-infected subjects.

CONFIDENTIALModule 2.7.2 Summary of Clinical Pharmacology
37
Conclusions:
The pharmacokinetics of total plasma DTG was not affected by moderate hepatic impairment.
The unbound concentration and unbound fraction of DTG in moderately hepaticallyimpaired subjects was 48-106% and 76-120%, respectively, higher than those in healthy subjects, primarily due to lower albumin concentrations and possibly reduced intrinsic clearance.
DTG can be taken without dose adjustment in subjects with mild to moderate hepatic impairment.
2.1.2.3. Study ING113125 (Severe Renal Impairment)
Study Title: A Phase I, Open-Label, Parallel-Group Study to Evaluate the Pharmacokinetics and Safety of Dolutegravir in Subjects with Renal Impairment and Healthy Matched Control Subjects (ING113125)
Location of Report: m5.3.3.3, Study ING113125
Study Design: Eight subjects with severe renal impairment (creatinine clearance [CrCL]<30 mL/min, not on dialysis) and 8 healthy controls (matched for gender, age, and body mass index) received a single dose of DTG 50 mg under fasted conditions. Creatinine clearance was determined after a 24-hour urine collection. Serial plasma samples over 72 hours post dose were collected for the determination of total DTG and DTG ether glucuronide conjugate. Plasma samples at 3 hours and 24 hours post dose were also collected for the determination of unbound DTG concentration. See Section 1.3.5.1 for more details on study design discussion.
Results:
Plasma DTG AUC and Cmax were approximately 40% and 23% lower, respectively, in subjects with severe renal impairment than in healthy subjects. However, there was considerable overlap in DTG concentrations between the groups. Plasma DTG glucuronide AUC and Cmax in the subjects with severe renal impairment were approximately 4-fold and 3-fold higher, respectively, than in the healthy subjects, however, there was no difference in t1/2. DTG unbound plasma concentration was 14% and 49% lower in subjects with severe renal impairment than in healthy subjects at 3 hours and 24 hours post dose, respectively. Unbound fraction (%) of DTG in subjects with severe renal impairment was similar to those in healthy subjects.
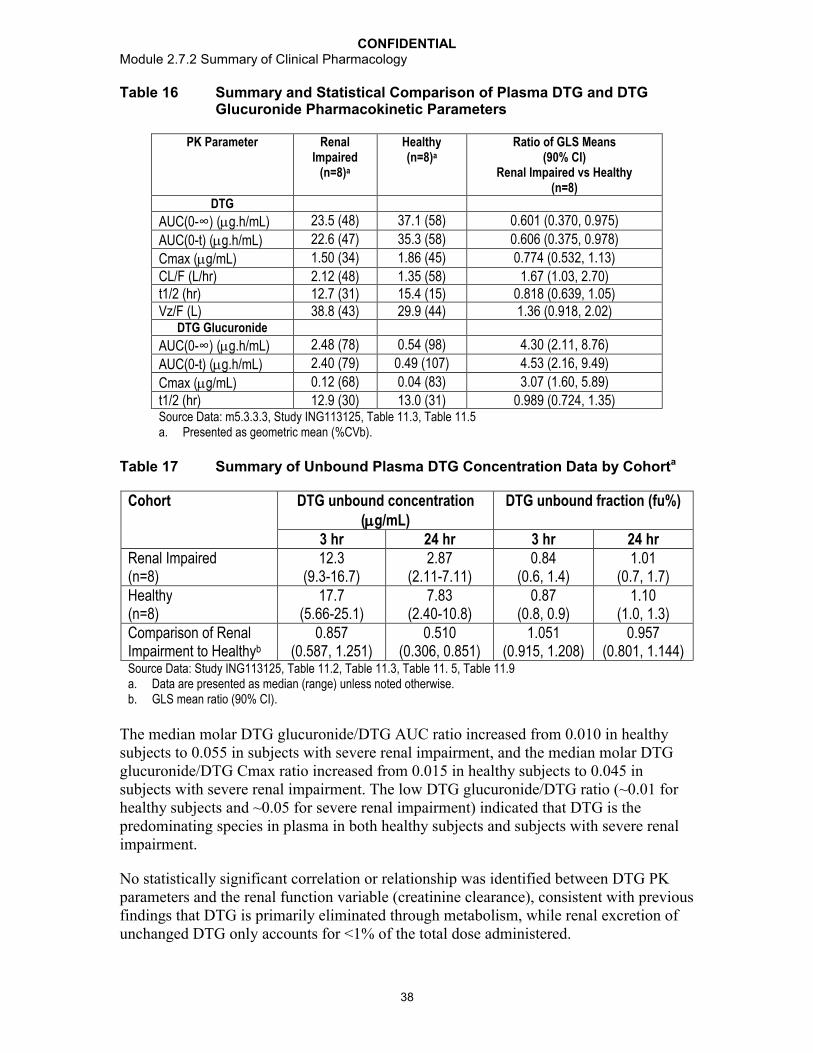
CONFIDENTIALModule 2.7.2 Summary of Clinical Pharmacology
38
Table 16 Summary and Statistical Comparison of Plasma DTG and DTG Glucuronide Pharmacokinetic Parameters
PK Parameter Renal Impaired
(n=8)a
Healthy(n=8)a
Ratio of GLS Means (90% CI)
Renal Impaired vs Healthy(n=8)
DTG
AUC(0-∞) (g.h/mL) 23.5 (48) 37.1 (58) 0.601 (0.370, 0.975)
AUC(0-t) (g.h/mL) 22.6 (47) 35.3 (58) 0.606 (0.375, 0.978)
Cmax (g/mL) 1.50 (34) 1.86 (45) 0.774 (0.532, 1.13)
CL/F (L/hr) 2.12 (48) 1.35 (58) 1.67 (1.03, 2.70)t1/2 (hr) 12.7 (31) 15.4 (15) 0.818 (0.639, 1.05)Vz/F (L) 38.8 (43) 29.9 (44) 1.36 (0.918, 2.02)
DTG Glucuronide
AUC(0-∞) (g.h/mL) 2.48 (78) 0.54 (98) 4.30 (2.11, 8.76)
AUC(0-t) (g.h/mL) 2.40 (79) 0.49 (107) 4.53 (2.16, 9.49)
Cmax (g/mL) 0.12 (68) 0.04 (83) 3.07 (1.60, 5.89)
t1/2 (hr) 12.9 (30) 13.0 (31) 0.989 (0.724, 1.35)Source Data: m5.3.3.3, Study ING113125, Table 11.3, Table 11.5a. Presented as geometric mean (%CVb).
Table 17 Summary of Unbound Plasma DTG Concentration Data by Cohorta
Cohort DTG unbound concentration (g/mL)
DTG unbound fraction (fu%)
3 hr 24 hr 3 hr 24 hrRenal Impaired(n=8)
12.3(9.3-16.7)
2.87(2.11-7.11)
0.84(0.6, 1.4)
1.01(0.7, 1.7)
Healthy(n=8)
17.7(5.66-25.1)
7.83(2.40-10.8)
0.87(0.8, 0.9)
1.10(1.0, 1.3)
Comparison of Renal Impairment to Healthyb
0.857(0.587, 1.251)
0.510(0.306, 0.851)
1.051(0.915, 1.208)
0.957(0.801, 1.144)
Source Data: Study ING113125, Table 11.2, Table 11.3, Table 11. 5, Table 11.9a. Data are presented as median (range) unless noted otherwise.b. GLS mean ratio (90% CI).
The median molar DTG glucuronide/DTG AUC ratio increased from 0.010 in healthy subjects to 0.055 in subjects with severe renal impairment, and the median molar DTG glucuronide/DTG Cmax ratio increased from 0.015 in healthy subjects to 0.045 in subjects with severe renal impairment. The low DTG glucuronide/DTG ratio (~0.01 for healthy subjects and ~0.05 for severe renal impairment) indicated that DTG is the predominating species in plasma in both healthy subjects and subjects with severe renal impairment.
No statistically significant correlation or relationship was identified between DTG PK parameters and the renal function variable (creatinine clearance), consistent with previous findings that DTG is primarily eliminated through metabolism, while renal excretion of unchanged DTG only accounts for <1% of the total dose administered.

CONFIDENTIALModule 2.7.2 Summary of Clinical Pharmacology
39
There was a statistically significant negative correlation between DTG glucuronide PK parameters, including AUC(0-t), AUC(0-) and Cmax, and the renal function variable (creatinine clearance). This implied that renal excretion is an important route of elimination for DTG glucuronide. However the t1/2 of DTG glucuronide was similar between healthy subjects and subjects with severe renal impairment, and was not correlated with creatinine clearance, which is consistent with formation rate-limited kinetics for DTG glucuronide.
The moderate reduction in DTG exposure (total and unbound in plasma) in subjects with severe renal impairment was not considered clinically significant. The increase in DTG glucuronide exposure in subjects with severe renal impairment is not expected to be a safety concern as the glucuronide is still <10% of the exposure of parent DTG, based on molar ratios, and also because glucuronide is a Phase II metabolite, which is consideredgenerally more water soluble, is less pharmacologically active, and does not requiresafety/toxicity testing. The DTG glucuronide metabolite has no antiviral activity and would not contribute to efficacy in HIV-infected subjects.
Conclusions:
DTG exposure was lower in subjects with severe renal impairment (CrCL< 30mL/min) than in healthy, matched subjects: AUC(0-) and Cmax were 40% and 23% lower, respectively.
The moderate reduction in DTG exposure in subjects with severe renal impairment was not considered clinically significant; no dose adjustment of DTG is needed in subjects with mild to severe renal impairment (not on renal replacement therapy).
2.1.2.4. Study ING112578 (Pediatric)
Study Title: IMPAACT P1093: Phase I/II, Multi-Center, Open-Label Pharmacokinetic, Safety, Tolerability and Antiviral Activity of GSK1349572, a Novel Integrase Inhibitor, in Combination Regimens in HIV-1 Infected Infants, Children and Adolescents
Location of Report: m5.3.5.2, Study ING112578 (Cohort 1, 12-18yr olds)
Study Design: The primary endpoints are toxicity through Week 24 and DTG PK, AUC0-24, based on intensive PK sampling. Secondary endpoints include toxicity through Week 48 and beyond, antiviral activity, and additional PK parameters. Eligible subjects were treatment-experienced (but no prior treatment with an integrase inhibitor), HIV-1 infected, male and female subjects, 6 weeks to <18 years old, with a screening plasma HIV-1 RNA ≥1000 copies/milliliter (c/mL), and at least one available fully active drug for the planned optimized background regimen. Pediatric doses were selected based on comparable PK exposure to that observed at 50 mg once daily in adults, as well as safety/tolerability in children. AUC(0-) was the primary PK endpoint and C was a secondary PK endpoint. Subjects were enrolled sequentially by pre-defined age cohortsas well as by Stage within each cohort. Ten subjects of 12 to <18 years old enrolled in Stage I Cohort I and received DTG once daily at approximately 1.0 mg/kg according to weight-based fixed doses, using 10 mg, 25 mg, and 50 mg tablets.

CONFIDENTIALModule 2.7.2 Summary of Clinical Pharmacology
40
Table 18 Initial DTG Dosing Table for Subjects Enrolled in P1093
Weight Range (kg)
Dose (mg)
Tablets taken Dose in mg/kg for lower weight subject
Dose in mg/kg for upper weight subject
15 - <20 20 Two 10 mg tablets 1.33 1.0020 - <30 25 One 25 mg tablet 1.25 0.8330 - <40 35 One 10 mg tablet AND one
25 mg tablet1.17 0.88
40 50 One 50 mg tablet 1.25 1.25
An intensive PK evaluation was performed over 24 hours following an observed dose between Days 5-10, after DTG was added to a stable, failing antiretroviral (ARV)regimen, or started as monotherapy for those not taking ARVs. Background therapies were optimized the day after intensive PK. Assessment for safety, tolerability, and plasma HIV RNA were performed throughout the study. The target PK exposures were predefined based on adult data from ING111521 and ING112276: geometric mean for AUC(0-) at 46 g.h/mL and for C at 0.96 g/mL. However, variability around these targets was considered acceptable, and the target range was defined as follows: the lower limits are 80% of the geometric means (37 µg.h/mL for AUC(0-) and 0.77 µg/mL for C); the upper limits are the 90th percentiles of the AUC(0-) (67 µg.h/mL) and C (2.26 µg/mL) observed in adult subjects in ING112276. Therefore, the target exposure for the geometric mean of AUC(0-) was 46, with an acceptable range of 37-67µg.h/mL; the target exposure for the geometric mean of C was 0.96µg/mL, with an acceptable range of 0.77-2.26µg/mL.
Results:
Among the 10 subjects enrolled in Stage I Cohort I, 9 subjects received DTG 50 mg once daily, and 1 subject received DTG 35 mg once daily based on weight. The median(range) age was 13.5 (12-17) years. There were 3 males and 7 females. Six subjects were African American/African heritage and 4 subjects were White/Caucasian/European Heritage. These 10 subjects have completed 24 weeks of treatment and this study is on-going.
Pharmacokinetics
The geometric mean AUC(0-24) for the Stage I Cohort I was 46 g.h/mL, and the C24h was 0.902 g/mL, meeting the pre-defined targeted PK exposure for AUC0-24 and C24h.This supports DTG 50 mg once daily in subjects 12 - <18 years of age weighing at least 40 kg.
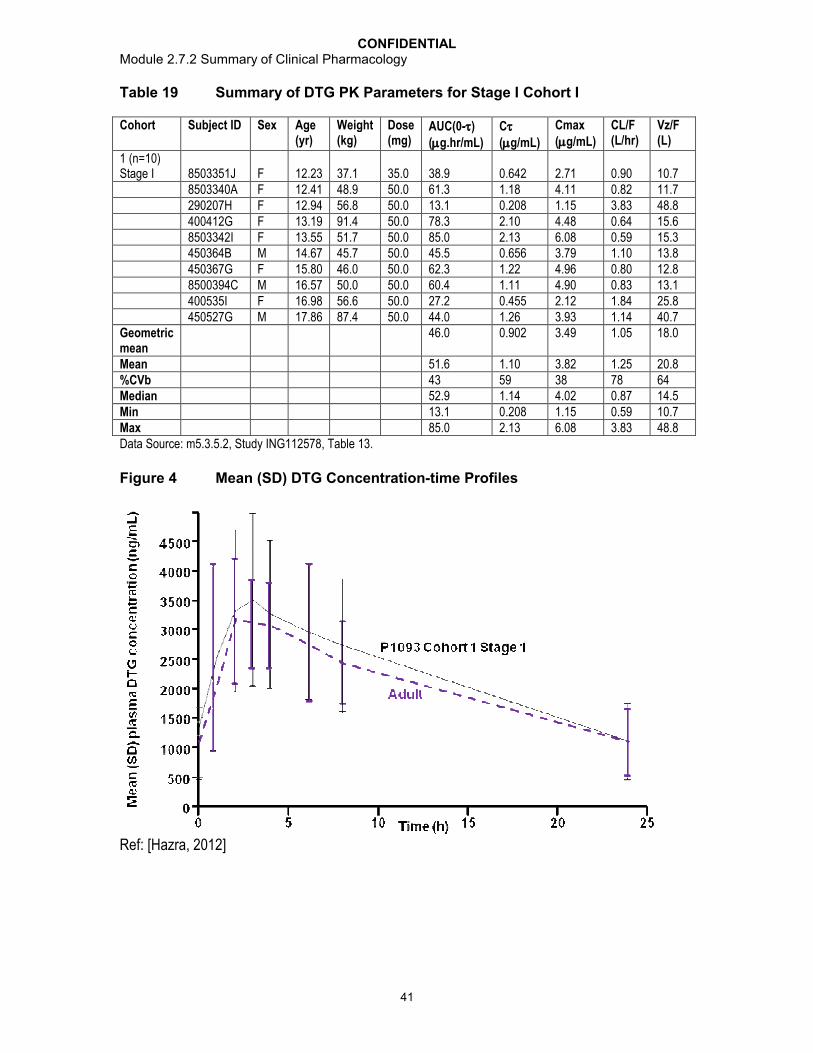
CONFIDENTIALModule 2.7.2 Summary of Clinical Pharmacology
41
Table 19 Summary of DTG PK Parameters for Stage I Cohort I
Cohort Subject ID Sex Age(yr)
Weight(kg)
Dose(mg)
AUC(0-)(g.hr/mL)
C(g/mL)
Cmax(g/mL)
CL/F(L/hr)
Vz/F(L)
1 (n=10) Stage I 8503351J F 12.23 37.1 35.0 38.9 0.642 2.71 0.90 10.7
8503340A F 12.41 48.9 50.0 61.3 1.18 4.11 0.82 11.7290207H F 12.94 56.8 50.0 13.1 0.208 1.15 3.83 48.8400412G F 13.19 91.4 50.0 78.3 2.10 4.48 0.64 15.68503342I F 13.55 51.7 50.0 85.0 2.13 6.08 0.59 15.3450364B M 14.67 45.7 50.0 45.5 0.656 3.79 1.10 13.8450367G F 15.80 46.0 50.0 62.3 1.22 4.96 0.80 12.88500394C M 16.57 50.0 50.0 60.4 1.11 4.90 0.83 13.1400535I F 16.98 56.6 50.0 27.2 0.455 2.12 1.84 25.8450527G M 17.86 87.4 50.0 44.0 1.26 3.93 1.14 40.7
Geometric mean
46.0 0.902 3.49 1.05 18.0
Mean 51.6 1.10 3.82 1.25 20.8%CVb 43 59 38 78 64Median 52.9 1.14 4.02 0.87 14.5Min 13.1 0.208 1.15 0.59 10.7Max 85.0 2.13 6.08 3.83 48.8Data Source: m5.3.5.2, Study ING112578, Table 13.
Figure 4 Mean (SD) DTG Concentration-time Profiles
Ref: [Hazra, 2012]

CONFIDENTIALModule 2.7.2 Summary of Clinical Pharmacology
42
Efficacy
Eight of 10 subjects achieved virologic suppression (HIV-1 RNA <400 c/mL) at Week 24based on the FDA Snapshot analysis, with 7 of 10 subjects achieving HIV-1 RNA <50 c/mL. The 2 subjects who failed to achieve HIV-1 RNA <400 c/mL had documented adherence problems.
Safety
Overall, DTG was demonstrated to be safe and well-tolerated in children 12 to <18 years of age (m2.7.4, Section 5.5).
Although only treatment-experienced children were enrolled in this age cohort of ING112578 (Cohort I), the primary objective of this study was the assessment of PK and safety, which would be expected to be similar in treatment-naïve patients.
Conclusions:
The PK/safety/tolerability/efficacy data support dose selection of 50 mg in children 12 to <18 years older weighing 40kg.
2.1.3. Pharmacokinetic Interactions
2.1.3.1. Study ING111322 (Midazolam)
Study Title: A Double-Blind, Randomized, Placebo-Controlled, Repeat Dose Escalation Study to Investigate the Safety, Tolerability and Pharmacokinetics of GSK1349572 Followed by A Single Dose, Randomized, 3-Period, Balanced, Crossover Study to Assess the Relative Bioavailability of Two Formulations and Food Effect on GSK1349572 in Healthy Male and Female Subjects (ING111322)
Location of Report: m5.3.3.1, Study ING111322
Study Design: In Part 1 of this study, the potential of DTG to inhibit or induce CYP3A activity was examined using MDZ (probe for CYP3A) in a cohort of subjects. Subjects received DTG 25 mg or placebo once daily on Day 1 through Day 10 and a single oral dose of MDZ 3 mg alone on Day -1 and co-administered with the DTG/placebo dose on Day 10. All doses were administered under fasted conditions. Plasma PK samples for MDZ were collected pre-dose and over 12 hours post dose on Day -1 and Day 10. PK samples for plasma DTG concentration were collected pre-dose and over 24 hours post dose on Day 1, and were collected pre-dose and over 72 hours post dose on Day 10. Single pre-dose samples for DTG were collected on the mornings of Days 3 throughDay 9.
Results: MDZ PK was not changed when co-administered with DTG; therefore, DTGdoes not affect CYP3A enzyme activity.

CONFIDENTIALModule 2.7.2 Summary of Clinical Pharmacology
43
Table 20 Summary of MDZ Treatment Comparison
Plasma MDZ PK Parameter
GLS Mean Ratio [90% CI]
DTG 25 mg + MDZa/MDZb
(N=10/10)
AUC(0-∞) 0.953[0.790, 1.15]
AUC(0-t) 0.945[0.815, 1.10]
AUC(0-6) 0.923[0.806, 1.06]
AUC(0-8) 0.927[0.798, 1.08]
Source Data: m5.3.3.1, Study ING111322, Table 11.15a. DTG 25 mg + MDZ = 25 mg DTG suspension once daily x 10 days +
3 mg MDZ single dose on Day 10b. MDZ = 3 mg MDZ single dose
Although the dose used in this study was lower than the Phase III clinical dose, DTG was given as a suspension, which gave a higher drug exposure than the tablet formulation, and provided a DTG exposure only slightly lower than that observed for DTG 50 mg once daily given as a tablet formulation in Phase III trials. Geometric means (%CVb) of DTG AUC(0-) and Cmax were estimated at 38.4 g.h/mL (23%) and 3.09 g/mL(26%), respectively, for DTG 25 mg once daily given as a suspension formulation in this study,verses 53.6 g.hr/mL (26.9%) and 3.67 g/mL (19.7%), respectively, for DTG 50 mg once daily using tablets in the Phase III trials (Section 3.3.1). Therefore, result from this study is applicable to the DTG therapeutic dose.
Conclusions: Co-administration of repeat doses of DTG 25 mg once daily with a single dose of 3 mg MDZ resulted in no significant change in MDZ plasma AUC, indicating no induction or inhibition effect of DTG on CYP3A activity. Thus, DTG will not affectexposure of CYP3A substrates following co-administration.
2.1.3.2. Study ING111405 (Lopinavir/ritonavir, Darunavir/ritonavir)
Study Title: A Phase I, open label, randomized, two period, one-way two sequence crossover study to evaluate the effect of darunavir/ritonavir and lopinavir/ritonavir on GSK1349572 pharmacokinetics in healthy adult subjects (ING111405)
Location of Report: m5.3.3.4, Study ING111405
Study Design: A total of approximately 30 subjects were enrolled in order to obtain 24 evaluable subjects (12 per treatment sequence). All subjects received DTG 30 mg once daily for 5 days in Period 1, followed by DTG 30 mg once daily in combination with either LPV/RTV 400/100 mg twice daily or DRV/RTV 600/100 mg twice daily for 14 days in Period 2. There was no washout between treatment periods. All doses were administered with a moderate fat meal. PK samples for plasma DTG concentration were collected over 24 hours on Day 5 in Period 1 and after the last dose on Day 14 in Period 2. PK samples for plasma LPV, DRV, and RTV concentrations were collected over 24 hours on Day 14 in Period 2.

CONFIDENTIALModule 2.7.2 Summary of Clinical Pharmacology
44
Results: Co-administration of LPV/RTV had no effect on steady state pharmacokinetics of DTG (Table 56). Co-administration of DRV/RTV decreased plasma DTG exposures: plasma DTG AUC(0-), Cmax, and C were decreased by 22%, 11%, and 38%, respectively (Table 56). Co-administration of DTG with DRV/RTV resulted in a 28% increase in CL/F and a 20% shorter t1/2 for DTG. There was no correlation between the treatment ratio of DTG PK parameters [AUC(0-), Cmax, and C] and DRV/RTV exposure. The effect of DRV/RTV on DTG was not considered to be clinically significant (Section 3.2.3). DTG PK parameter values obtained in this study can be found in Appendix Table 3.
LPV, DRV, and RTV PK parameter values observed in this study were consistent with historical data. RTV PK parameters values were similar between LPV/RTV and DRV/RTV treatments.
The disparate effects of DRV/RTV and LPV/RTV on DTG PK were not due to RTV (as the RTV daily dose was the same, and a similar RTV exposure was observed between the treatment groups); rather, this was likely due to the differential effects of LPV and DRV on UGT1A1, the enzyme governing the primary metabolism of DTG (Section 3.1.5).
Conclusions:
Co-administration of LPV/RTV had no effect on plasma DTG pharmacokinetics.
Co-administration of DRV/RTV resulted in decreased plasma DTG exposures;however, these decreases are not considered to be clinically significant (see Section 3.4.3 for rationle). DTG can be co-administered with DRV/RTV or LPV/RTV with no dose adjustment.
2.1.3.3. Study ING111602 (Antacid, Multivitamins)
Study Title: A Phase I, open label, randomized, four-period crossover study to evaluate the effects of Maalox Advanced Maximum Strength and One A Day Maximum on pharmacokinetics of GSK1349572 in healthy adult subjects (ING111602)
Location of Report: m5.3.3.4, Study ING111602
Study Design: A total of 16 subjects were enrolled and each subject 4 different treatments (Table 21) in a crossover manner and treatments were separated by at least 7 days. All doses were administered under fasted conditions. PK samples for plasma DTG concentrations were collected pre-dose and over 72 hours post dose on Days 1, 2, 3, and 4 of all treatment periods.

CONFIDENTIALModule 2.7.2 Summary of Clinical Pharmacology
45
Table 21 Study Treatment and Description in ING111602
Treatment DescriptionA A single dose of DTG 50 mg (five 10 mg tablets)B A single dose of DTG 50 mg co-administered with a single dose of a One
A Day Maximum multivitaminC A single dose of DTG 50 mg co-administered with a single dose of 20 mL
of Maalox Advanced Maximum StrengthD A single dose of DTG 50 mg administered 2 hours prior to administration
of a single dose of 20 mL of Maalox Advanced Maximum Strength
Results: Concurrent administration of a multivitamin decreased DTG AUC, Cmax, and C24 by 33%, 35%, and 32%, respectively, on average (Table 56). Concurrent administration of Maalox decreased DTG AUC, Cmax, and C24 by 74%, 72%, and 74%, respectively, on average (Table 56). Administration of Maalox 2 hr after DTG decreased DTG AUC, Cmax, and C24 by 26%, 18%, and 30%, respectively, on average (Table 56).DTG PK parameter values obtained in this study can be found in Appendix Table 3.
One A Day Maximum contains the most metal cations including iron, magnesium, zinc, and copper, compared to other widely used multivitamin supplements. Maalox Advanced Maximum Strength contains the most metal cations including magnesium and aluminium, compared to other widely used antacids. Therefore, the results from this study represent the worst case and can be applied to other multivitamin and antacid products.
Conclusions:
Concurrent administration of a multivitamin decreased DTG exposure; however, the decrease is not considered clinically relevant. DTG may be taken concomitantly with a multivitamin without dose adjustment.
Concurrent administration of Maalox decreased DTG exposure by more than 70%,and separation by 2 hours attenuated the effect of Maalox. Concomitant administration of DTG and antacids should be avoided. It is recommended that DTG should be administered 2 hours before or 6 hours after antacids similar (similar to quinolones, see Section 3.4.3.3 for details).
2.1.3.4. Study ING111603 (Etravirine)
Study Title: A Phase I, open label, two period, fixed-sequence crossover study to evaluate the effect of etravirine on GSK1349572 pharmacokinetics in healthy adult subjects (ING111603)
Location of Report: m5.3.3.4, Study ING111603
Study Design: Sixteen subjects were enrolled in the study. In Period 1, subjects received DTG 50 mg once daily from Day 1 to Day 5. In Period 2, subjects received DTG 50 mg once daily and ETR 200 mg twice daily from Day 1 to Day 14. There was no washout between treatment periods. All doses were administered following a moderate fat meal.

CONFIDENTIALModule 2.7.2 Summary of Clinical Pharmacology
46
Serial PK samples for plasma DTG concentrations were collected over 24 hours on Day 5 in Period 1, as well as on Day 14 in Period 2. Serial PK samples for plasma ETR concentrations were collected over 12 hours post the morning dose on Day 14 of Period 2.
Results: Co-administration of ETR decreased steady-state plasma DTG exposures. Plasma DTG AUC(0-), Cmax, and C decreased by 71%, 52%, and 88%, respectively(Table 56). Co-administration of DTG with ETR resulted in a 3.4-fold increase in CL/F and a 48% reduction in t1/2 for DTG. DTG PK parameter values obtained in this study can be found in Appendix Table 3. ETR PK parameters values were consistent to historical data in healthy subjects.
The reduction in DTG exposure by ETR is likely due to the combined inductive effect on UGT1A1 and CYP3A4 activity by ETR. The inductive effect on UGT1A1 by ETR is consistent with the modest decreases in plasma raltegravir AUC of 20 to 40% seen with co-administration [Kassahun, 2007; Anderson, 2008]. Support for this hypothesis was demonstrated by the amelioration of the decrease in DTG concentrations following co-administration of the combination product LPV/RTV, which are inhibitors of CYP3A4 and UGT1A1. In addition, ETR is an inhibitor of the multidrug resistance protein 2(MRP2) with an IC50 of 7.8 M [Zembruski, 2011]. Thus, there is a potential for ETR to interfere with the biliary secretion of DTG glucuronide and disrupt enterohepatic recirculation. This has been reported as an explanation for the reduced exposure of mycophenolate mofetil when co-administered with cyclosporine-A [Hesselink, 2005].
Conclusions: Co-administration of DTG and ETR resulted in decreased steady-state plasma DTG AUC(0-), Cmax, and C by 71%, 52%, and 88%, respectively. Co-administration of DTG and ETR is not recommended.
2.1.3.5. Study ING111604 (Tenofovir)
Study Title: A Phase I, Open Label, Single Sequence, Drug Interaction Study Evaluating Plasma GSK1349572 and Tenofovir Pharmacokinetics in Healthy Adult Subjects (ING111604)
Location of Report: m5.3.3.4, Study ING111604
Study Design: Sixteen healthy subjects were enrolled in this study. Subjects received DTG 50 mg once daily for 5 days in Period 1, TDF 300 mg once daily for 7 days in Period 2, and DTG 50 mg once daily and TDF 300 mg once daily for 5 days in Period 3. Serial PK samples over 24 hours were collected on last day of dosing in each period. There was a 6-day washout between the first and second periods, and no washout between Period 2 and Period 3. All doses were administered in the fasting state.
Results: Co-administration of TDF 300 mg once daily and DTG 50 mg once dialy had no effect on DTG pharmacokinetics, with GLS mean ratios for PK parameters ranging from 0.920 to 1.01, and confidence intervals within the bounds of 0.8-1.25 (Table 56). Co-administration of DTG 50 mg once daily and TDF 300 mg once daily resulted in anequivalence in tenofovir AUC(0-) and Cmax, and a slight increase in tenofovir trough plasma exposures (Table 55); however, the small effect is not considered clinically significant. DTG PK parameter values obtained in this study can be found in Appendix Table 3.
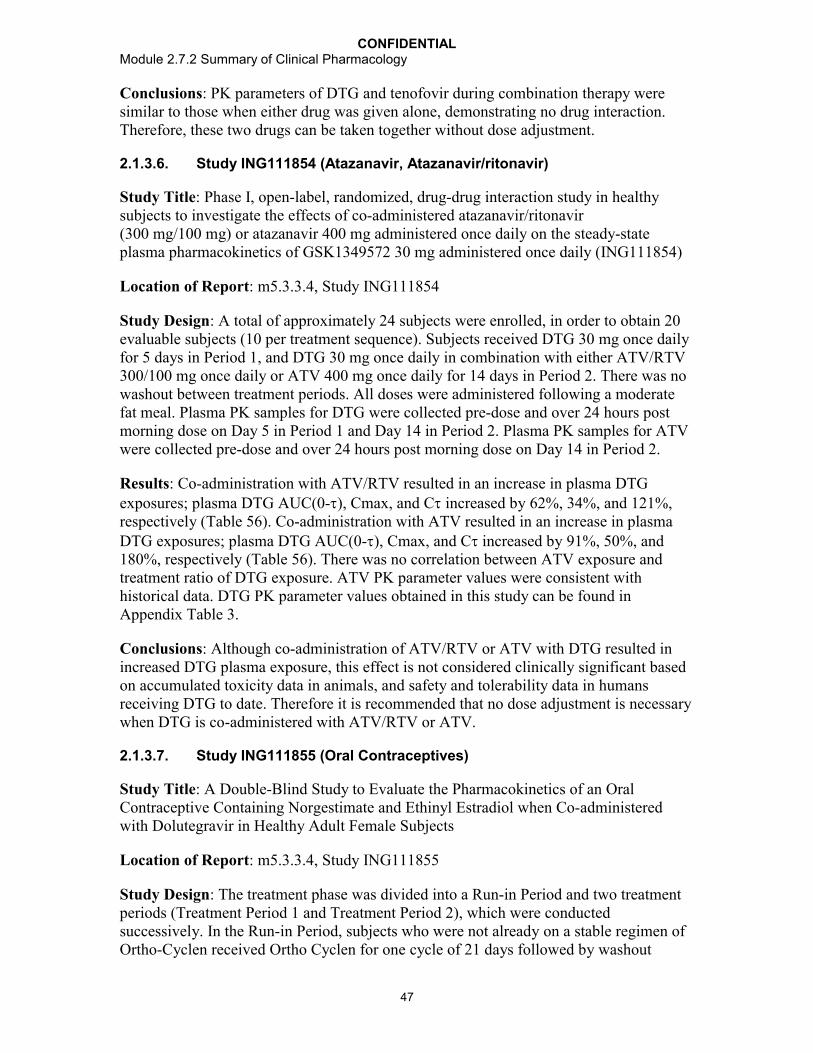
CONFIDENTIALModule 2.7.2 Summary of Clinical Pharmacology
47
Conclusions: PK parameters of DTG and tenofovir during combination therapy were similar to those when either drug was given alone, demonstrating no drug interaction. Therefore, these two drugs can be taken together without dose adjustment.
2.1.3.6. Study ING111854 (Atazanavir, Atazanavir/ritonavir)
Study Title: Phase I, open-label, randomized, drug-drug interaction study in healthy subjects to investigate the effects of co-administered atazanavir/ritonavir (300 mg/100 mg) or atazanavir 400 mg administered once daily on the steady-state plasma pharmacokinetics of GSK1349572 30 mg administered once daily (ING111854)
Location of Report: m5.3.3.4, Study ING111854
Study Design: A total of approximately 24 subjects were enrolled, in order to obtain 20 evaluable subjects (10 per treatment sequence). Subjects received DTG 30 mg once daily for 5 days in Period 1, and DTG 30 mg once daily in combination with either ATV/RTV 300/100 mg once daily or ATV 400 mg once daily for 14 days in Period 2. There was no washout between treatment periods. All doses were administered following a moderate fat meal. Plasma PK samples for DTG were collected pre-dose and over 24 hours postmorning dose on Day 5 in Period 1 and Day 14 in Period 2. Plasma PK samples for ATVwere collected pre-dose and over 24 hours post morning dose on Day 14 in Period 2.
Results: Co-administration with ATV/RTV resulted in an increase in plasma DTG exposures; plasma DTG AUC(0-), Cmax, and C increased by 62%, 34%, and 121%, respectively (Table 56). Co-administration with ATV resulted in an increase in plasma DTG exposures; plasma DTG AUC(0-), Cmax, and C increased by 91%, 50%, and 180%, respectively (Table 56). There was no correlation between ATV exposure and treatment ratio of DTG exposure. ATV PK parameter values were consistent with historical data. DTG PK parameter values obtained in this study can be found in Appendix Table 3.
Conclusions: Although co-administration of ATV/RTV or ATV with DTG resulted in increased DTG plasma exposure, this effect is not considered clinically significant based on accumulated toxicity data in animals, and safety and tolerability data in humans receiving DTG to date. Therefore it is recommended that no dose adjustment is necessary when DTG is co-administered with ATV/RTV or ATV.
2.1.3.7. Study ING111855 (Oral Contraceptives)
Study Title: A Double-Blind Study to Evaluate the Pharmacokinetics of an Oral Contraceptive Containing Norgestimate and Ethinyl Estradiol when Co-administered with Dolutegravir in Healthy Adult Female Subjects
Location of Report: m5.3.3.4, Study ING111855
Study Design: The treatment phase was divided into a Run-in Period and two treatment periods (Treatment Period 1 and Treatment Period 2), which were conducted successively. In the Run-in Period, subjects who were not already on a stable regimen of Ortho-Cyclen received Ortho Cyclen for one cycle of 21 days followed by washout

CONFIDENTIALModule 2.7.2 Summary of Clinical Pharmacology
48
period of 7 days before continuing to Treatment Period 1 and 2. Subjects who were already on a stable dose of Ortho-Cyclen were permitted to skip the Run-in Period.Following the Run-in Period, subjects either received Ortho-Cyclen once daily with DTG twice daily on Days 1-11 (Period 1) and then Ortho-Cyclen with placebo on Days 12 to 21 (Period 2), or the reverse order of treatments in Period 1 and Period 2. On Days 10 and 21, subjects underwent 24-hour serial PK collection for norelgestromin (NGMN) and EE,and 12-hour serial PK collection for DTG. Study drugs were administered with a moderate fat meal on Days 10 and 21.
Results: NGMN and EE PK parameters, AUC, Cmax, and Cmin were similar between the treatment of Ortho-Cyclen with DTG and the treatment of Ortho-Cyclen with placebo (Table 55). Exposure of DTG when administered with Ortho-Cyclen was similar to historical data, suggesting Ortho-Cyclen had no effect on DTG PK. Ortho-Cyclen is an example of a combination estrogen-progestin OC. While it was selected in this study for its widespread use and fixed dose throughout the cycle, there are a wide variety of similar products. Most combination OCs use EE for the estrogen component while the progestin component may include norethindrone, drospirenone, desogestrel, or norgestimate. While there are some differences in metabolism of these drugs, the lack of an effect by DTG on either the estrogen or progestin component in this study support the use of DTG with OC brands other than Ortho-Cyclen. DTG PK parameter values obtained in this study can be found in Appendix Table 3.
Conclusions: Co-administration with DTG had no effect on the pharmacokinetics of norelgestromin (NGMN) and EE in healthy female subjects receiving Ortho-Cyclen. DTG and common oral contraceptives can be co-administered without dose adjustment.
2.1.3.8. Study ING112934 (Etravirine/lopinavir/ritonavir, Etravirine/darunavir/ritonavir)
Study Title: A Phase I, open-label, randomized, three-period, one-way, two-cohort, adaptive crossover study to evaluate the effect of darunavir/ritonavir plus etravirine and lopinavir/ritonavir plus etravirine on GSK 1349572 pharmacokinetics in healthy adult subjects (ING112934)
Location of Report: m5.3.3.4, Study ING112934
Study Design: A sample size of approximately 18 subjects was targeted for enrollment to obtain approximately 12 subjects who would complete dosing and all critical assessments. Periods 1 and 2 evaluated the effect of ETR/LPV/RTV (Cohort 1) and ETR/DRV/RTV (Cohort 2) on the PK of a 50 mg once daily dose of DTG. After completion of Period 2, PK data were analyzed and a decision was made whether to conduct Period 3. The dose of DTG for Period 3 was to be determined based on the results. If a significant drug interaction was observed in Period 2, the dose regimen of DTG in Period 3 would have been adjusted to 50 mg twice daily. As no significant drug interaction was observed, Period 3 was not conducted. In Period 1, all subjects receivedDTG 50 mg once daily from Day 1 to Day 5. All doses were administered following a moderate fat meal in the morning. In Period 2, subjects received DTG 50 mg once dailyand either ETR/LPV/RTV 200/400/100 mg twice daily (Cohort 1) or ETR/DRV/RTV 200/600/100 mg twice daily (Cohort 2) from Day 1 to Day 14. There was no washout

CONFIDENTIALModule 2.7.2 Summary of Clinical Pharmacology
49
between treatment periods. Plasma PK samples for DTG were collected pre-dose and over 24 hours post morning dose on Day 5 in Period 1 and Day 14 in Period 2. Plasma PK samples for ETR were collected pre-dose and over 12 hours post morning dose on Day 14 in Period 2. Trough PK samples for DTG were collected on Days 5, 9, 12, and 13 in Period 2.
Results: Co-administration with ETR/LPV/RTV had no effect on DTG AUC(0-) and Cmax, while increasing C by 28% and t1/2 by 36% (Table 56). Co-administration with ETR/DRV/RTV resulted in decreased plasma DTG exposures, plasma DTG AUC(0-), Cmax, and C were on average 25%, 12%, and 37% lower when co-administered with ETR/DRV/RTV compared to DTG given alone (Table 56). Such effects of ETR/LPV/RTV and ETR/DRV/RTV on DTG exposures are not considered clinically relevant. DTG PK parameter values obtained in this study can be found in Appendix Table 3. ETR PK parameters values obtained in this study were consistent with historical data in healthy subjects.
Conclusions: Co-administration of LPV/RTV and DRV/RTV attenuated the effect of ETR on DTG exposure. DTG may be co-administered with ETR without a dosage adjustment if the subject is receiving concomitant LPV/RTV or DRV/RTV.
2.1.3.9. Study ING112941 (Omeprazole)
Study Title: A randomized, double-blind study to evaluate the safety, tolerability, and pharmacokinetics of a supratherapeutic dose of GSK1349572 250 mg and a randomized, open-label study to evaluate the effects of omeprazole 40 mg daily and a high fat meal on the pharmacokinetics of GSK1349572 50 mg in healthy adult subjects (ING112941)
Location of Report: m5.3.3.4, Study ING112941
Study Design: In Part 1, Periods 1 and 2 evaluated the food effect of a high-fat meal consisting of 53% fat/869 calories on the PK of a single 50 mg dose of DTG (results are presented in m2.7.1, Section 2.3.2). Period 3 of Part 1 evaluated the effect of OMP on the single-dose DTG PK. Approximately 14 subjects were to be randomized into Part 1 of the study. In Period 1 and Period 2, enrolled subjects received a single dose DTG 50 mgunder fasted conditions and with a high-fat meal in a crossover fashion. In Period 3, subjects received OMP 40 mg once daily on Days 1 to 5 after a 10-hour fast and 2 hours before a moderate fat meal. On Day 5, subjects received a single dose DTG 50 mg administered 2 hours after OMP followed by a moderate-fat meal 4 hours after receiving DTG. Plasma PK samples for DTG concentration were collected pre-dose and over 48 hours post dose on Day 5 of each period. The effect of food of Part 1 of this study is presented in module 2.7.1, Section 2.4.2.

CONFIDENTIALModule 2.7.2 Summary of Clinical Pharmacology
50
Results: Co-administration with OMP had no significant effect on plasma DTG AUC(0-), AUC(0-), Cmax, and C24 (Table 56). This result is expected as in vitro solubility evaluation did not show pH-dependent solubility of DTG over the physiological pH range. DTG PK parameter values obtained in this study can be found in Appendix Table 3.
Conclusions: Co-administration with OMP had no effect on DTG plasma PK. DTG can be co-administered with OMP without dose adjustment.
2.1.3.10. Study ING113068 (Fosamprenavir/Ritonavir)
Study Title: Phase I, open label, two period, study to evaluate the effects of fosamprenavir/ritonavir (FPV/RTV) on GSK1349572 pharmacokinetics and a Phase I, randomized, three-way crossover study to evaluate the relative bioavailability of three tablet variants made using micronized, un-micronized and intermediate particle sizes of GSK1349572 in healthy adult subjects (ING113068)
Location of Report: m5.3.3.4, Study ING113068
Study Design: A total of approximately 12 subjects were enrolled in order to obtain 10 evaluable subjects. In Period 1, all subjects received DTG 50 mg once daily for 5 days. In Period 2, subjects received DTG 50 mg once daily in combination with FPV/RTV 700/100 mg twice daily for 10 days. There was no washout between treatment periods. All morning doses of study drugs were administered after a 10-hour overnight fast on PK days. Blood PK samples for plasma DTG concentrations were collected pre-dose and over 24 hours post DTG morning dose on Day 5 in Period 1 and Day 10 in Period 2. Pre-dose PK samples for DTG were collected on Days 8 and 9 in Period 2. Blood PK samples for plasma amprenavir (APV) concentration were collected pre-dose and over 12 hours post FPV/RTV morning dose on Day 10 in Period 2. Part 2 of this study evaluated the relative bioavailability of three tablet variants (micronized, un-micronized, and intermediate particle sizes) of DTG and is summarized in m2.7.1, Section 2.1.2.
Results:
APV exposure following co-administration of FPV/RTV and DTG is similar to historical data of APV; therefore, these data suggest that DTG did not affect APV exposure.
The results of the statistical comparisons showed that co-administration of FPV/RTV decreased DTG SSAUC(0-), Cmax, and C by 35%, 24%, and 49% (Table 56), respectively, resulting from increased CL/F and decreased t1/2 for DTG. DTG PK parameter values obtained in this study can be found in Appendix Table 3.
Conclusions:
APV concentrations in combination with DTG were similar to literature values suggesting that DTG does not have a significant effect on APV exposure.

CONFIDENTIALModule 2.7.2 Summary of Clinical Pharmacology
51
Co-administration of FPV/RTV decreased DTG plasma exposures: AUC(0-),Cmax, and C decreased by 35%, 24%, and 49% , respectively. The effect of FPV/RTV on DTG exposure is not considered clinically significant, therefore no DTG dose adjustment is necessary when co-administered with FPV/RTV (see Section 2.3.8 for details). However caution should be given to INI-resistant subjects.
2.1.3.11. Study ING113096 (Tipranavir/Ritonavir)
Study Title: An Open-Label, Single Sequence, Three-Period Drug Interaction Study of GSK1349572 and Tipranavir/Ritonavir in Healthy Adult Subjects (ING113096)
Location of Report: m5.3.3.4, Study ING113096
Study Design: A total of approximately 18 subjects received DTG 50 mg once daily for 5 days in Period 1. Subjects were administered TPV/RTV 500/200 mg twice daily for 7 days in Period 2, followed by the combination of DTG 50 mg once daily and TPV/RTV 500/200 mg twice daily for 5 days in Period 3. There was no washout period between treatments. DTG doses were administered following a moderate fat meal in the morning. TPV/RTV doses were administered following a moderate fat meal in the morning and evening. Plasma PK serial samples for DTG were collected over 24 hours on Day 5 in Period 1 and over 24 hrs on Day 5 in Period 3. Plasma PK trough samples for DTG were also collected on Days 3 and 4 in Period 3.
Results: Co-administration of TPV/RTV resulted in decreased plasma DTG exposures: plasma DTG AUC(0-), Cmax, and C, were decreased 59%, 46%, and 76% (Table 56), respectively, resulting from 144% increase in CL/F and 47% decrease in t1/2. DTG PK parameter values obtained in this study can be found in Appendix Table 3.
Conclusions: Co-administration with TPV/RTV resulted in a 59%, 46%, and 76% decrease in plasma DTG AUC(0-), Cmax, and C, respectively. DTG 50mg twice daily dosing is recommended when co-administered with TPV/RTV based on clinical efficacy data (see Section 2.3.8 and Section 3.4.3.2 for details)
2.1.3.12. Study ING113099 (Rifampin, Rifabutin)
Study Title: Phase I, open label, two arm, and fixed sequence study to evaluate the effect of rifampin and rifabutin on GSK1349572 pharmacokinetics in healthy male and female volunteers (ING113099)
Location of Report: m5.3.3.4, Study ING113099
Study Design: In all arms of the study, study drugs were administered in a fasted state.
Arm 1: In Period 1, all subjects received DTG 50 mg once daily from Day 1 to Day 7. Serial PK samples were collected over 24 hours on Day 7. Subjects received the first dose in Period 2 after the last PK sample from Period 1 was collected. Day 1 of Period 2 was the day after Day 7 of Period 1. In Period 2, all subjects received DTG 50 mg twice dailyfrom Day 1 to Day 7. Serial PK samples were collected over 12 hours on Day 7. Day 1 of Period 3 was the day after Day 7 of Period 2. Subjects received DTG 50 mg twice daily

CONFIDENTIALModule 2.7.2 Summary of Clinical Pharmacology
52
and RIF 600 mg once daily from Day 1 to Day 14. No evening dose of DTG were given on Day 14. Serial PK samples for DTG concentrations were collected over 12 hours on Day 14.
Arm 2: All subjects received DTG 50 mg once daily from Day 1 to Day 7. Serial PK samples were collected over 24 hours on Day 7. Subjects received the first dose in Period 2 after the last PK sample from Period 1 was collected. Day 1 of Period 2 was the day after Day 7 of Period 1. Subjects received DTG 50 mg once daily and RBT 300 mg once daily from Day 1 to Day 14. Serial PK samples for DTG concentrations were collected over 24 hours on Day 14. Subjects were discharged from the unit after the last PK sample was collected on the morning of Day 15.
Results: Co-administration of DTG 50 mg twice daily with RIF 600 mg once dailysignificantly reduced plasma DTG concentrations relative to DTG 50 mg twice dailyalone, but resulted in 18 to 33% higher plasma DTG Cmax, AUC(0-24), and C than DTG 50 mg once daily alone.
Co-administration of DTG 50 mg once daily with RBT 300 mg once daily resulted in a 16% increase in DTG Cmax, no change in AUC(0-), and a 30% reduction in Ccompared DTG 50 mg once daily alone. DTG PK parameter values obtained in this study can be found in Appendix Table 3.
Table 22 Statistical Comparison of Plasma DTG Pharmacokinetic Parameters
Comparison Ratio of GLS Means(90% CI)
DTG 50 mg twice daily + RIF vs DTG 50 mg twice
daily(Arm 1)
DTG 50 mg twice daily + RIF vs DTG 50 mg once
daily(Arm 1)
DTG 50 mg once daily + RBT vs DTG 50 mg once
daily(Arm 2)
AUC(0-) 0.460 (0.384, 0.552) ND1 0.947 (0.816, 1.10)
AUC(0-24) ND 1.33 (1.15, 1.53) 0.947 (0.816, 1.10)Cmax 0.565 (0.489, 0.652) 1.18 (1.03, 1.37) 1.16 (0.978, 1.37)C0 0.282 (0.164, 0.484) 0.971 (0.566, 1.67) 0.702 (0.531, 0.928)Cmin 0.306 (0.204, 0.460) 1.15 (0.763, 1.72) 0.633 (0.541, 0.742)
C 0.277 (0.228, 0.336) 1.22 (1.01, 1.48) 0.700 (0.566, 0.866)
CL/F 2.17 (1.87, 2.53) 1.51 (1.30, 1.75) 1.06 (0.910, 1.22)t1/2 0.445 (0.383, 0.516) 0.396 (0.342, 0.460) 0.724 (0.642, 0.816)Source Data: m5.3.3.4, ING113099, Table 11.5 (Arm 1) and Table 11.6 (Arm 2)ND: not determined
Conclusions: DTG 50 mg twice daily is recommended when co-administered with RIF.No dose adjustment is needed when DTG is co-administered with RBT.
2.1.3.13. Study ING114005 (Efavirenz)
Study Title: A Phase I, Open Label, Single Sequence, Three Period Study to Evaluate the Single Dose Pharmacokinetics of GSK1349572 100 mg versus 50 mg and the Effect of Efavirenz 600 mg Once Daily on the Pharmacokinetics, Safety and Tolerability of GSK1349572 50 mg Once Daily in Healthy Adult Subjects (ING114005)
CONFIDENTIALModule 2.7.2 Summary of Clinical Pharmacology
53
Location of Report: m5.3.3.4, Study ING114005
Study Design: A total of 12 subjects were enrolled in order to obtain 10 evaluable subjects. In Period 2, subjects received DTG 50 mg once daily in the morning, in the fasted state, for 5 days. In Period 3, subjects received DTG 50 mg once daily in the morning plus EFV 600 mg once daily in the evening for 14 days. All DTG doses wereadministered in the fasted state, and all EFV doses were administered on an empty stomach. There was no washout between Treatment Periods 2 and 3. Serial plasma PK samples for DTG and its metabolites, as well as pooled urine samples for DTG and metabolite profiling, were collected over 24 hours post morning dose on Day 5 in Period 2 and on Day 14 in Period 3. Trough PK samples for plasma DTG were collected on Days 12 and 13 in Period 3. Serial plasma PK samples for EFV concentrations were collected on Day 13 in Period 3.
Results: Co-administration of DTG with EFV resulted in 57%, 39%, and 75% decreases in plasma DTG AUC(0-), Cmax, and C (Table 56), respectively, resulting from a 132% increase in CL/F and a 44% decrease in t1/2. This is likely due to the net inductive effect of EFV on CYP enzymes, and UGT enzymes as well. DTG PK parameter values obtained in this study can be found in Appendix Table 3.
Subjects who are CYP2B6 *1/*1 or *1/*6 show EFV PK exposure similar to those in the EFV product label, which shows a mean AUC(0-) of 184 M.h (58.1 g.h/mL), a mean Cmax of 12.9 M (4.07 g/mL), and a mean Cmin of 5.6 M (1.77 g/mL).[Sustiva, 2009]. Subjects who are CYP2B6*6 homozygous have 2-4 fold higher EFV exposure than CYP2B6 *1/*1 or *1/*6, consistent with other reports [Tozzi, 2010].Therefore it is concluded that DTG did not affect EFV exposure.
Plasma and urine were analyzed by mass spectrometry to evaluate the comparative metabolic profile of DTG to understand which metabolic pathway of DTG is more affected by EFV as DTG is a substrate for UGT1A1 and CYP3A4. Plasma metabolic profiles of DTG were similar between DTG alone and in combination with EFV, with DTG being the major component, while M3 (glucuronidation) and M11 (oxidation, sulfation) were each present at mean values of <2% of DTG. These results are consistent with the plasma metabolic profile from the human mass balance study (ING111853). The urine from subjects receiving DTG in combination with EFV displayed an increase of M3 (glucuronidation), and a concomitant decrease in M1 (N-dealkylation) as compared to the metabolic profile of DTG alone. No other significant urinary metabolite differences between the two dose groups were noted (m5.3.2.2, GlaxoSmithKline DocumentNumber RD2010/00413/00 [Study 10DMR012]).
Conclusions: Co-administration with DTG did not affect EFV exposure. Co-administration with EFV resulted in a 57%, 39%, and 75% decreased plasma DTGAUC(0-), Cmax, and C, respectively. DTG 50mg twice daily is recommended when co-administered with EFV based on clinical efficacy data (see Section 2.3.8 and Section 3.4.3.2 for details)

CONFIDENTIALModule 2.7.2 Summary of Clinical Pharmacology
54
2.1.3.14. Study ING115696 (Prednisone)
Study Title: An Adaptive, Two part, Two period, Single Sequence, Drug Interaction Study between Dolutegravir 50 mg and Prednisone in Adult Healthy Volunteers (ING115696)
Location of Report: m5.3.3.4, Study ING115696
Study Design: In Part 1, approximately 12 subjects received DTG 50 mg once daily for 5 days in Period 1. Subjects were administered DTG 50 mg once daily in combination with prednisone 60 mg for 5 days followed by a 5 day taper (total duration of 10 days) in Period 2. A formal pharmacokinetic and statistical analysis was performed at the end of Part 1 to inform the decision of whether to conduct of Part 2. If the analysis in Part 1 showed that DTG C on Day 5 or Day 10 (whichever demonstrated the bigger effect on DTG exposure) in Period 2 was reduced by more than 50% compared to C on Day 5 in Period 1, Part 2 would have been carried out. Since prednisone increased DTG PK parameters by about 20% in Part 1, Part 2 was not conducted. All doses of study drug were taken following a moderate fat meal (approximately 30% fat content). Plasma PK samples for DTG were collected pre-dose and over 24 hours post dose on Day 5 in Period 1 and Days 5 and 10 in Period 2. Pre-dose PK samples for DTG were collected on Days 8 and 9 in Period 2.
Results: DTG PK parameters were similar between Day 5 and Day 10 in Period 2. Co-administration of prednisone 60 mg once daily x 5 days + 5 days of taper with DTG(Day 10 in Period 2) resulted in an increase in the mean DTG AUC, Cmax and C by 11%, 6%, and 17% (Table 55), respectively. Steady state was reached for DTG following 5 days co-administration of DTG with prednisone. DTG PK parameter values obtained in this study can be found in Appendix Table 3.
Conclusions: No dose adjustment is needed for DTG when co-administered with prednisone.
2.1.3.15. Study ING115697 (Telaprevir, Boceprevir)
Study Title: A Phase I, Open-Label, Randomized, Two Cohort, Two Period, One-Way Study to Evaluate the Effect of Boceprevir and Telaprevir on Dolutegravir Pharmacokinetics in Healthy Adult Subjects
Location of Report: m5.3.3.4, Study ING115697
Study Design: A total of approximately 32 subjects were planned to be enrolled, in order to obtain 24 evaluable subjects (12 per cohort). In Period 1, all subjects received DTG 50 mg once daily for 5 days. In Period 2, subjects received DTG 50 mg once daily with either BCV 800 mg three times daily for 10 days or teleprevir (TVR) 750 mg three times daily for 10 days. There was no washout between treatment periods. All doses of study medications were taken with a moderate-fat meal or snack. Plasma PK samples for DTGwere collected pre-dose and over 24 hours post dose on Day 5 in Period 1 and Day 10 in Period 2. Plasma PK samples for TVR and BCV were collected pre-dose and 1, 2, 3, 4,and 8 hours post the first morning dose of BCV and TVR on Day 10 in Period 2.
CONFIDENTIALModule 2.7.2 Summary of Clinical Pharmacology
55
Results: Co-administration with BCV had no effect on plasma exposure of DTG. Co-administration with TVR resulted in increased DTG plasma exposures: AUC(0-), Cmax, C, increased by 25%, 19%, 37%, respectively (Table 56). DTG PK parameter values obtained in this study can be found in Appendix Table 3.
TVR PK parameters when co-administered with DTG were similar to historical data. BCV PK parameters were not available at this time and will be included in a subsequent amended report.
Conclusions:
Co-administration of BCV or TVR with DTG had no clinically significant effect on DTG pharmacokinetics.
Steady-state Day 10 TVR PK data were very similar to those reported in the Inciveklabel, indicating no effect of DTG on TVR [Incivek, 2012].
2.1.3.16. Study ING115698 (Methadone)
Study Title: A Phase I, Open-Label, 2-Period Drug Interaction Study to Assess Steady State Plasma Methadone Enantiomer Pharmacokinetics Following Co-Administration of Methadone once daily with Dolutegravir (GSK1349572) 50 mg twice daily in Opiate-Dependent, HIV Seronegative Adult Subjects
Location of Report: m5.3.3.4, Study ING115698
Study Design: This was an open label, two-period study in adult male and female opiate-dependent, HIV-seronegative subjects. Twelve subjects receiving individual once dailydoses of methadone were admitted to the clinical site for 3 days (Period 1) then received DTG 50 mg twice daily for 5 days while continuing on their stable methadone therapy(Period 2). Serial PK samples for measurement of plasma concentration of R-methadone and S-methadone were collected on Day 3 in Period 1, and on Day 5 in Period 2. Serial PK samples for plasma DTG were collected on Day 5 in Period 2. Study drugs were taken under fasted conditions on these PK sampling days.
Results: Plasma exposures of total, R-, and S-methadone were similar between methadone alone and when co-administered with 50 mg DTG twice daily.

CONFIDENTIALModule 2.7.2 Summary of Clinical Pharmacology
56
Table 23 Statistical Comparison of Plasma Methadone PK Parameters
Plasma Methadone PK
Parameter
Ratio of GLS Means (90% CI)
Total MethadoneB vs A
R-MethadoneB vs A
S-MethadoneB vs A
AUC(0-) 0.98(0.91, 1.06)
0.95(0.89, 1.02)
1.01(0.93, 1.09)
Cmax 1.00(0.94, 1.06)
0.97(0.91, 1.03)
1.03(0.97, 1.10)
C 0.99(0.91, 1.07)
0.95(0.89, 1.02)
1.02(0.93, 1.12)
CL/F 1.02(0.95, 1.09)
1.05(0.98, 1.12)
0.99(0.92, 1.07)
R/S Methadone AUC Ratio
NA 0.94(0.92, 0.97)
NA
Source Data: m5.3.3.4, Study ING115698, Table 11.8Treatment A: Stable individual once daily methadone doseTreatment B: DTG 50 mg twice daily x 5 days + stable individual methadone dose
DTG PK parameter values obtained in this study can be found in Appendix Table 3.
Conclusions: Co-administration of methadone with repeat doses of 50 mg DTG had no effect on total, R-, and S-methadone pharmacokinetics. No dose adjustment in methadone is required when given in combination with DTG.
2.1.3.17. Study LAI116181 (Rilpivirine)
Study Title: A Phase I, Open-Label, Crossover Study to Evaluate the Pharmacokinetics and Safety of GSK1265744 and Rilpivirine and Dolutegravir and Rilpivirine in Healthy Adult Subjects
Location of Report: m5.3.3.4. Study LAI116181.
Study Design: Cohort 1 of the study was to evaluate the drug interaction between DTG and RPV. Cohort 2 was to evaluate the drug interaction between GSK1265744 and RPV. Twelve subjects enrolled in Cohort 1 and received DTG 50 mg once daily for 5 days in Period 1, RPV 25 mg once daily for 11 days in Period 2, and DTG 50 mg once daily in combination with RPV 25 mg once daily for 5 days in Period 3. There was a 7-day washout between Period 1 and Period 2, and no washout between Period 2 and Period 3. Study drugs were taken with a moderate-fat meal. Serial PK samples were collected on the last day of each period for the measurement of plasma DTG and RPV concentrations.
Results: Co-administration of DTG with RPV resulted in no change in DTG AUC(0-), and Cmax, and a 22% increase in C [Table 56]. Co-administration of DTG with RPV resulted in no change in RPV AUC(0-) and Cmax, and a 21% increase in C (Table 55).DTG PK parameter values obtained in this study can be found in Appendix Table 3.
Conclusions: There was no significant drug interaction between DTG and RPV. DTV and RPV can be co-administered without dose adjustment.
CONFIDENTIALModule 2.7.2 Summary of Clinical Pharmacology
57
2.2. Clinical Pharmacodynamics
2.2.1. Properties Related to Therapeutic Effect
2.2.1.1. Mechanism of Action of Dolutegravir
Dolutegravir inhibits HIV integrase by binding to the integrase active site and blocking the strand transfer step of retroviral deoxyribonucleic acid (DNA) integration, which is essential for the HIV replication cycle.
The antiviral activity of DTG was evaluated using various HIV-1 strains and cell culture-based assays (see m2.7.2.4 for details). Peripheral blood mononuclear cells infected with HIV-1 strain BaL or HIV-1 strain NL432 gave DTG IC50s of 0.51 nM and 0.53 nM, respectively. In a viral integrase susceptibility assay using the integrase coding region from 13 clinically diverse clade B isolates, dolutegravir demonstrated antiviral potency for these isolates that was similar to that against laboratory strains, with a mean IC50 of 0.52 nM (= 0.2 ng/mL). The effect of human serum albumin (20 or 40 mg/mL), 1-acid glycoprotein (AAG) (2 mg/mL), and human serum (extrapolated up to 100%) on the antiviral activity of dolutegravir was evaluated in the PHIV or MT-4 assay systems. In vitro studies suggested a 75-fold shift in IC50 of DTG in the presence of 100% human serum (by method of extrapolation), and the PA IC90 in PBMCs was estimated to be~150 nM (= 0.064 g/mL).
2.2.1.2. Therapeutic Endpoints Used in Clinical Trials for HIV Treatment
Plasma HIV-1 RNA (viral load) is an accepted surrogate marker for efficacy in clinical trials for antiretroviral agents [EMA, 2008; FDA, 2002], and this efficacy variable hasbeen measured in all clinical studies of DTG in HIV-infected subjects.
In all Phase III trials in treatment-naïve (ING113086 and ING114467) and treatment-experienced/INI-naive (ING111762) subjects, as well as the Phase IIb trial in treatment-naïve subjects (ING112276), the primary efficacy endpoint was the proportion of subjects achieving HIV-1 RNA <50 c/mL at a pre-defined time point (Week 24 or Week 48). The secondary efficacy endpoints include the proportion of subjects achieving HIV-1 RNA <400 c/mL at a pre-defined time point (Week 24 or Week 48), the mean HIV-1 RNA change from Baseline (log10 c/mL), and protocol-defined virologic failures (PDVF).
In the Phase IIb and III trials in subjects with INI-resistant virus (ING112961 and ING112574), the primary efficacy endpoint is the HIV-1 RNA change from Baseline (log10 c/mL) to Day 8 or Day 11 upon DTG treatment. The secondary efficacy endpoints include the proportion of subjects achieving HIV-1 RNA <50 c/mL or <400 c/mL at Week 24, and the mean HIV-1 RNA change from Baseline (log10 c/mL) over time.
In the Phase IIa dose-ranging monotherapy trial (ING111521), the primary efficacy endpoint is the HIV-1 RNA change from Baseline (log10 c/mL) to Day 11 upon DTG treatment. The secondary efficacy endpoints include the proportion of subjects achieving HIV-1 RNA <50 c/mL or <400 c/mL at Day 10.
CONFIDENTIALModule 2.7.2 Summary of Clinical Pharmacology
58
Refer to individual clinical studies in patients in m2.7.3 for the results on HIV-1 RNA.All these efficacy endpoints were evaluated for PK/PD relationship (see Section 2.3 for summary of the PK/PD analysis results from individual studies).
2.2.2. Other Pharmacological Properties
2.2.2.1. Study ING111856 (Definitive QT)
Study Title: A Study to Evaluate the Effect of a Single 250 mg Oral Dose of GSK1349572 on Cardiac Conduction as Assessed by 12-lead Electrocardiogram Compared to Placebo and a Single Oral Dose of Moxifloxacin (ING111856)
Location of Report: m5.3.4.1, Study ING111856
Study Design: This was a randomized, partial-blind, placebo-controlled, single dose, cross-over trial investigating the effect of DTG on cardiac repolarisation as compared to placebo in healthy, adult males and females. Forty-two subjects were enrolled in this study and admitted to the clinic for three separate dosing sessions with a washout period of at least 10-14 days between doses (Table 24). Subjects and the investigator were only blind for DTG and placebo treatments; moxifloxacin was open label. Subjects received single dose administrations of placebo, a supratherapeutic dose of DTG (250 mg, suspension), and moxifloxacin (400 mg) in random sequence.
Table 24 Treatment Assignment
Sequence Period 1 Period 2 Period 31 A B C2 A C B3 B A C4 B C A5 C A B6 C B A
Note: There was a washout of 10 to 14 days between treatments and the follow-up visit.Treatment A = DTG 250 mg suspension single doseTreatment B = DTG Placebo suspension single doseTreatment C = Moxifloxacin 400 mg single dose
Safety of the subjects was monitored by clinical observation, measures of vital signs, 12-lead ECGs, and clinical laboratory measurements. Twelve-lead continuous digital data were obtained from two hours prior to dose on Day 1 until 24 hrs post dose of each treatment period using a Mortara H12 plus, 1000 Hz Holter monitor. The primary comparison of interest was the time-matched change from Baseline in QTcF between each active treatment relative to placebo (QTcF). Forty-two subjects (approximately 60% female) were enrolled to ensure that a minimum of 34 subjects completed all treatment periods. Serial pharmacokinetic samples were collected for up to 24 hours following each dose of study drug.

CONFIDENTIALModule 2.7.2 Summary of Clinical Pharmacology
59
Results: DTG had no significant effect on cardiac repolarization. For the primary endpoint, QTcF, all time-matched values and their corresponding upper bounds of the 90% CI were below 10 msec for DTG. The maximum observed time-matched change from Baseline in QTcF for DTG 250 mg was at 4 hours (1.99 msec, 90% CI: -0.55, 4.53msec). The maximum observed time-matched change from Baseline in QTcF for moxifloxacin was at 4 hours (9.58 msec, 90% CI: 7.05, 12.11 msec). Since the study had adequate sensitivity to detect a positive QT effect with moxifloxacin, it is concluded that this study was valid to assess the effects of DTG on cardiac repolarization.
Figure 5 Plot of Least Squares Mean of Treatment Difference from Placebo for QTcF Change from Baseline (90% CIs)
Source Data: m5.3.4.1, Study ING111856, Figure 12.1Treatment: 572 = A single dose of DTG 250 mg (suspension)PBO = A single dose of DTG placebo (suspension)Moxi = A single dose of moxifloxacin 400 mg (one 400 mg tablet)
Selected DTG PK parameters after the 250 mg single dose using suspension are presented in Table 25 overall, as well as by gender. Plasma DTG exposure was similar between males and females. The DTG exposure presented in this study was at a supratherapeutic level: the geometric mean AUC(0-24) of 167 g.h/mL was about 3-fold the value estimated for DTG 50 mg once daily (53.6 g.h/mL in Table 45) and 2-fold the value estimated for DTG 50 mg twice daily in patients (75.1 g.h/mL in Table 45); the geometric mean Cmax of 12.4 g/mL was about 3.4-fold the value estimated for DTG 50 mg once daily (3.67 g/mL in Table 45) and 3-fold the value estimated for DTG 50 mg twice daily in patients (4.15 g/mL in Table 45).

CONFIDENTIALModule 2.7.2 Summary of Clinical Pharmacology
60
Table 25 Summary of Plasma DTG Pharmacokinetic Parameters Following a Single Dose Administrationa
Treatment Sex n Cmax(g/mL)
AUC(0-t)(g.h/mL)
AUC(0-24)(g.h/mL)
tmaxb
(h)C24
(g/mL)
DTG250 mg
F 24 13.5(22)
180(31)
179(31)
3.08(1.52-4.12)
3.96(52)
M 17 10.9(28)
151(35)
150(35)
3.05(2.05-6.05)
3.71(42)
Overall 41 12.4(27)
167(33)
167(33)
3.08(1.52-6.05)
3.86(48)
Source Data: Study ING111856, Table 11.2a. PK parameters are presented as geometric mean (%CVb) unless otherwise noted.b. Presented as median (range).
Conclusions: DTG had no effect on cardiac repolarization at a supratherapeutic dose of 250 mg suspension. The study was sensitive enough to detect the effect of moxifloxacin, the positive control, on QTcF, which confirms that this study is valid for assessing the effects of DTG on cardiac repolarization.
2.2.2.2. Study ING114819 (Effect of DTG on Renal Functions)
Study Title: A Phase I, Open Label, Placebo-Controlled Study to Evaluate the Effect of GSK1349572 on Iohexol and Para-Aminohippurate Clearance in Healthy Subjects (ING114819)
Location of Report: m5.3.4.1, Study ING114819
Study Design: This study was designed to confirm the mechanism behind the increase in serum creatinine observed during DTG therapy; specifically, the study was intended to determine whether DTG had any effect on glomerular filtration rate (GFR) or effective renal plasma flow (ERPF). Other biomarkers for renal function, including cystatin-C, β2-microglobulin, N-acetyl-beta-D-glucosaminidase (NAG), and retinol binding protein,were evaluated as well. Thirty-four healthy adult subjects received DTG 50 mg (twice daily or once daily) or placebo for 14 days. Subjects received iohexol and para-aminohippurate (PAH) infusions on Days -1, 7, and 14. GFR was measured by iohexol plasma clearance. ERPF was assessed by PAH plasma clearance; CrCL was measured by 24-hour urine collection. Plasma samples of iohexol were collected at predose, 0.5, 1, 1.5, 2, 3, 4, and 5 hours after the start of iohexol dose on Days -1, 7, and 14. Plasma samples of PAH were collected at 30, 90, 150, and 180 minutes after the start of the PAH loading dose on Days -1, 7, and 14. On Days -1, 4, and 10 serum and urine creatinine was collected. Serial plasma samples for DTG PK were collected on Day 14. Samples for cystatin-C, β2-microglobulin, NAG, and retinol binding protein were collected on Days -1, 7, and 14.

CONFIDENTIALModule 2.7.2 Summary of Clinical Pharmacology
61
Results: DTG decreased creatinine clearance (by 10% at 50 mg once daily and 14% at 50 mg twice daily, respectively after 14 days of dosing, after adjusted by placebo) but had no effect on GFR (as measured by iohexol plasma clearance) or ERPF, as measured by PAH plasma clearance. These data support in vitro studies that suggest the increases in creatinine observed in clinical studies are due to inhibition of OCT2 in the proximal renal tubules, which mediates the tubular secretion of creatinine.
Table 26 Statistical Analysis Summary of Iohexol Clearance, PAH Clearance, and Creatinine Clearance-Comparison of Day 14 (7)/Day -1 DTG to Day 14 (7)/Day -1 Placebo
PD Parameter Ratio of GLS Means (90% CI)
DTG Once Daily vs Placebo
DTG Twice Daily vs Placebo
BSA-adjusted Iohexol Clearance(mL/min/1.73m2)
Ratio Day 7/Day -1 1.02[0.939, 1.11]
1.01[0.926, 1.10]
Ratio Day 14/Day -1 0.993[0.915, 1.08]
1.05[0.963, 1.14]
BSA-adjusted PAH Clearance(mL/min/1.73m2)
Ratio Day 7/Day -1 0.912[0.822, 1.01]
0.953[0.857, 1.06]
Ratio Day 14/Day -1 1.03[0.921, 1.15]
0.969[0.866, 1.08]
BSA-adjusted Creatinine Clearance(mL/min/1.73m2)
Ratio Day 7/Day -1 0.814[0.735, 0.901]
0.922[0.831, 1.02]
Ratio Day 14/Day -1 0.900[0.808, 1.00]
0.861[0.772, 0.960]
Source Data: m5.3.4.1, Study ING114819, Table 12.6
Selected DTG PK parameters are also summarized in Table 27.
Table 27 Summary of Selected Plasma DTG Pharmacokinetic ParametersFollowing Repeat Dose Administrationa
Treatment N AUC(0-)(g.h/mL)
AUC(0-24)g.h/mL)
Cmax (g/mL)
C0(g/mL)
C(g/mL)
DTG 50 mgonce daily
11 39.1(38)
39.1(38)
2.83(27)
0.91(142)
0.84(61)
DTG 50 mgtwice daily
11 51.6(36)
103(36)
5.50(34)
4.18(44)
3.02(40)
Source Data: Study ING114819, Table 11.4a. Data are presented as geometric mean (%CVb).
There were no correlation between DTG PK parameters [AUC(0-24), Cmax, and C] and change from Baseline in PD endpoints including iohexol clearance, PAH clearance, CrCL, cystatin-C, β2-microglobulin, NAG, and retinol binding protein.
CONFIDENTIALModule 2.7.2 Summary of Clinical Pharmacology
62
Conclusions: Administration of DTG causes a 10-14% reduction in plasma creatinine clearance, which is consistent with previous clinical studies. DTG had no effect on GFRor ERPF.
2.3. Pharmacokinetics and Pharmacokinetic-pharmacodynamic Relationship in Target Patient Population
2.3.1. PK Sampling and Analysis Strategy
In the Phase IIa and IIb studies in adults and children [ING111521, ING112961, ING112276, and ING112578 (P1093)], intensive PK samples for determination of plasma DTG concentrations were collected in all or a subgroup of subjects enrolled. DTG PK parameters were estimated using a non-compartmental approach based on intensive PK sampling. Sparse PK samples at more than one visit were also collected in as many subjects enrolled as possible.
In the Phase III studies in adults, sparse PK samples for plasma DTG concentrations were collected in 3 studies including ING113086 (treatment-naïve), ING111762 (treatment-experienced, INI-naïve), and ING112574 (treatment-experienced, INI-resistant). No DTG PK samples were collected in ING114467 (treatment-naïve). PK samples were collected in as many subjects as possible in these studies. Sparse PK samples (1 or 2 at each visit) were collected at 3 different visits over the course of the study up to the primary analysis time point (Week 48 for ING113086, and Week 24 for ING111762 and ING112574). Since C was identified as the best predictor for antiviral activity for INI (see Section 3.2.1 for details), pre-dose samples (C0) were collected at all PK visits to estimate C in all Phase III studies. An average of these C0 values collected at different visits, C0_avg, was estimated for each subject and used in PK/PD analyses.
In addition, two population PK analyses were performed using both intensive and sparse PK data collected in Phase II and III studies:
Population PK 1: this analysis included PK data from ING111521, ING112276, and ING113086, with the purpose of developing a Population PK model that can best describe DTG PK data obtained in an HIV-positive treatment-naïve patient population (see Section 3.3.1).
Population PK 2: this analysis included PK data from ING111762, ING112961, and ING112574, with the purpose of developing a Population PK model that can best describe DTG PK data obtained in an HIV-positive treatment-experienced patient population (see Section 3.3.2).
2.3.2. Overall Strategy of PK/PD Analyses
Results from PK/PD analyse for each individual Phase II/III study are presented in this module. No PK/PD analyse using pooled data across studies has been performed due to study population difference except for the treatment-naive studies. PK/PD analyses based on pooled data from Study ING112276 and ING113086 and post-hoc estimates of DTG PK parameters were performed and results are presented in Section 3.3.1.

CONFIDENTIALModule 2.7.2 Summary of Clinical Pharmacology
63
PK/PD Analyses for Efficacy
To be in line with the objectives of the Phase II/III studies, the primary efficacy endpointof plasma HIV RNA and the secondary efficacy endpoint of CD4+ cell count wereevaluated for PK/PD relationship.
PK/PD Analyses for Safety
To be in line with the objectives of the Phase2/3 studies, the following safety measures were evaluated for PK/PD relationship:
Phase IIb studies included:
Change from Baseline in serum creatinine level, creatinine clearance at various time points;
Occurrence of any AEs, maximum intensity of AE per subject, key clinical laboratory parameters at various time points (including ALT, total bilirubin, creatine kinase, triglycerides, lipase, and total cholesterol);
Presence of AEs of special interest from the gastrointestinal (GI) system organ class (any GI AEs, abdominal pain, diarrhea, nausea, and vomiting) at various time points.
Phase III studies included:
Dose-limiting AEs or SAEs likely driven by drug exposure (this was intended, but not performed due to lack of significant findings in clinical studies of DTG);
Presence of the top three most common AEs, including diarrhoea, nausea, and headache;
Lab abnormality: change from Baseline in serum creatinine, creatinine clearance, ALT, total bilirubin, albumin/creatinine ratio at the time point of primary evaluation only (e.g., only Week 48 for the treatment-naïve population, and Weeks 24 and 48 for the treatment-experienced population).
2.3.3. Study ING111521 (10-day Monotherapy, 2-50 mg Once Daily)
Study Title: A Phase IIa, Multicenter, Randomized, Parallel, Double-Blind, Dose Ranging, Placebo-Controlled Study to Compare Antiviral Effect, Safety, Tolerability and Pharmacokinetics of GSK1349572 Monotherapy Versus Placebo Over 10 days in HIV-1 Infected Adults (ING111521)
Location of Report: Module 5.3.4.2, Study ING111521
Study Design: This was a Phase IIa dose-ranging study to evaluate DTG monotherapy versus placebo over 10 days in ART-naïve and ART-experienced (INI-naïve) HIV-1-infected adults who were not currently receiving antiretroviral therapy. Among the primary objectives were the characterization of DTG PK in HIV-1-infected patients, and exploring the relationship between DTG PK exposure and change in plasma HIV-1 RNA.

CONFIDENTIALModule 2.7.2 Summary of Clinical Pharmacology
64
Secondary objectives included estimating DTG accumulation and time invariance, and assessing attainment of steady state following repeat administration of DTG in HIV-infected subjects, as well as examining dose proportionality of DTG PK parameters after repeat dose administration. Subjects with HIV RNA > 5000 c/ml and CD4+ cell count>100 cells/mm3 were randomized to once daily doses of DTG 2 mg ,10 mg, or 50 mg, or placebo, using a tablet formulation. Each active treatment (~8 subjects) with matching placebo (~2 subjects) was dosed in the same frequency and with a matching number of tablets to achieve the double-blind. HIV-1 RNA, genotypes/phenotypes, safety labs, vital signs, and ECGs were performed at regular intervals. Subjects were fasted overnight from 10 hours before until 4 hours after receiving investigational product on Days 1 and 10. PK samples for plasma DTG were collected over 24 hours after the first dose on Day 1, at pre-dose on Days 1-4 and 7-10, and over 24 hours after the last dose on Day 10.
Results:
Pharmacokinetics:
Following oral dose administration of the tablet formulation in HIV-infected subjects, DTG was readily absorbed (tlag=0 for the first dose on Day 1) with themaximum concentration achieved between 0.50 to 2 hours post dose across the 2 to 50 mg dose levels. With regard to DTG exposure, Day 1 AUC(0-24) and Cmax, and Day 10 AUC(0-) and Cmax, increased less than proportionally to the increase in dose (Table 29). Following repeat-dose administration, plasma concentrations of DTG reached steady state by 7 days of dosing (Table 30) and moderate accumulation was observed in AUC, Cmax, and C, with accumulation ratios estimated to be 1.25-1.43, 1.23-1.40, and 1.27-1.42, respectively, across the different dose levels. DTG showed time-invariant pharmacokinetics and low to moderate between-subject variability, with %CVb ranging from 16 to 51%. A summary of selected plasma DTG Day 10 PK parameters is presented in Table 28.
Table 28 Summary of Selected Plasma DTG Pharmacokinetic Parameters Following Day 10 Dose Administrationa
Dose N Cmax(g/mL)
tmaxb
(h)AUC(0-)(g.h/mL)
C(g/mL)
Rc
(Cmax)Rc
(AUC)Rc
(C)Time
Invarianced
2 mg 9 0.22(25)
1.00(0.42-3.0)
2.56(29)
0.04(50)
1.23(28)
1.25(26)
1.27(34)
0.973[0.851, 1.11]
10 mg
7 0.80(23)
1.48(0.50-3.0)
10.1(20)
0.19(25)
1.40(20)
1.37(15)
1.28(16)
1.00[0.898, 1.12]
50 mg
10 3.34(16)
2.00(0.97-4.0)
43.4(20)
0.83(26)
1.36(24)
1.43(30)
1.42(33)
1.07[0.903, 1.27]
Source Data: m5.3.4.2, Study ING111521. Table 11.5a. Data are presented as geometric mean (%CVb) unless otherwise noted.b. Data are presented as median (range).c. R: Accumulation ratiod. Data are presented as GLS mean ratio [90%CI] of Day 10 AUC(0-) vs Day 1 AUC(0-).

CONFIDENTIALModule 2.7.2 Summary of Clinical Pharmacology
65
Table 29 Summary of Dose Proportionality of Day 1 and Day10 DTG PK Parameters Using Power Model
Plasma DTG PK Parameter
GLS Mean Ratio [90% CI]Day 1 Day 10
Slope 90%CI Slope 90%CI
AUC(0-∞) or AUC(0-)a 0.849 [0.771, 0.928] 0.880 [0.824, 0.935]
Cmax 0.811 [0.733, 0.888] 0.841 [0.790, 0.892]C24 0.881 [0.792, 0.969] ND NDC0 NDb ND 0.917 [0.819, 1.02]
C ND ND 0.915 [0.832, 0.997]
Cmin ND ND 0.915 [0.878, 1.01]Source Data: Study ING111521. Table 11.6a. Data presented as AUC(0-∞) for Day 1 and AUC(0-) for Day 10.b. ND: Not determined
Table 30 Summary of DTG Steady State Assessment
Days Treatment Slope 90% CI7, 8, 9, and 10 2 mg -0.054 [-0.096, -0.011]
10 mg -0.010 [-0.067, 0.048]50 mg 0.008 [-0.046, 0.062]
8, 9, and 10 2 mg -0.037 [-0.103, 0.029]10 mg 0.001 [-0.093, 0.095]50 mg 0.009 [-0.089, 0.107]
9, and 10 2 mg 0.077 [-0.075, 0.229]10 mg 0.063 [-0.190, 0.315]50 mg -0.015 [-0.268, 0.237]
Source Data: Study ING111521. Table 11.9
PK/PD Relationship:
The relationships between various PK parameters [AUC(0-τ), Cmax, Cmin, C0, Cτ, and Cτ,avg] and inhibitory quotient (IQ) and PD measures [reduction in log10 c/mL plasma HIV-1 RNA to Day 11 from Baseline, and reduction in log10 c/mL plasma HIV-1 RNA from Baseline to the on-treatment nadir (maximum change)] were explored with linear and Emax models. An Emax model (Emax fixed to 2.6, (hill factor) fixed to 1, and PK parameter on the original scale) was selected, based on the lowest Akaike’s Information Criterion (AIC) value. Among PK parameters, the order of goodness of fit is: Cτ > Cτ,avg > Cmin > C0 > AUC(0-τ) > Cmax. The best model selected in this study is described in the equation below and presented as a graph of observed data in Figure 6.
PD Response = Emax * C/(EC50 +C) where Emax = 2.60log, EC50 = 35.68 ng/mL.
where PD Response is reduction in log10 c/mL plasma HIV-1 RNA from Baseline to Day 11.

CONFIDENTIALModule 2.7.2 Summary of Clinical Pharmacology
66
Figure 6 Relationship between Reduction in Log10 Plasma HIV-1 RNA from Baseline to Day 11 and Day 10 C with Emax model
Ctau on Day 10 (ng/mL)
Pla
sma H
IV-1
RN
A C
hange f
rom
Base
line t
o D
ay 1
1 (
log10 C
opie
s/m
L)
0 200 400 600 800 1000 1200
0.0
0.5
1.0
1.5
2.0
2.5
3.0
Emax = 2.60 log10EC50 = 35.68 ng/mL
Note: Lines represent the best fitted line (solid) and 95% CI (dashed). EC90 is estimated at 320 ng/mL based on the Emax model.Data source: Study ING111521, Figure 1.
In the 50-mg dose group, seven of the 10 subjects achieved an HIV-1 RNA level less than 50 c/mL during the study and more importantly, a sustained virologic response was observed from day 11 to day 14 when DTG dose was stopped. The likely explanation is that DTG exposures remained above the protein-adjusted IC50 (0.016mg/ml) through day 14 based on the basis of the observed half-life of DTG and modelled DTG concentrations between day 11 and day 14 [Min, 2011].
Conclusions:
Pharmacokinetics:
Following oral dosing using the tablet formulation, DTG was rapidly absorbed with maximal concentration observed at 1.5 to 2 hours post dose.
Following repeat-dose administration, plasma concentrations of DTG reached steady state by 7 days of dosing, and accumulation ratios ranged from 1.25 to 1.42 across doses.
CONFIDENTIALModule 2.7.2 Summary of Clinical Pharmacology
67
The increase in DTG exposure (AUC and Cmax) was less than dose proportionalfollowing both single- and repeat-dose administration.
DTG showed time-invariant pharmacokinetics and moderate between-subjectvariability with %CVb ranging from 16 to 51%.
PK/PD Relationship:
A mean decrease from Baseline on Day 11 in plasma HIV-1 RNA of 1.51 to 2.46 log10 c/mL was observed across the DTG doses tested (2 mg, 10 mg, 50 mg once daily) compared with placebo (0.05 log10 c/mL increase). A dose response relationship was observed.
Greater antiviral activity was associated with higher DTG plasma exposure by an Emax model. C was the PK parameter that best predicted antiviral activity. DTG exposure from 10 mg once daily dose is around EC90 and DTG exposure from 50 mg once daily is at the plateau of curve.
2.3.4. Study ING112276 (HIV-infected Treatment-Naïve, 10-50 mg Once Daily)
Study Title: A Phase IIb study to select a once daily oral dose of GSK1349572 administered with either abacavir/lamivudine or tenofovir/emtricitabine in HIV-1 infected antiretorviral therapy naïve adult subjects
Location of Report: m5.3.5.1, Study ING112276 (96 week analysis)
Study Design: This is a Phase IIb, randomized, multicenter, parallel group, dose-ranging study conducted in HIV-1 infected, ART-naïve adults. The trial was partially blinded(i.e., subjects and their investigators were blinded to the dose of DTG). Subjects received DTG at one of three doses (10 mg, 25 mg, or 50 mg, all given once daily), or EFV once daily, both co-administered with either abacavir sulfate (abacavir, ABC) and lamivudine (3TC), ABC/3TC fixed dose combination (FDC), or TDF/FTC FDC as background therapy. A total of 208 subjects were randomized (1:1:1:1) to one of the four treatment regimens. The primary objective of this study was to select a DTG once daily dose for further evaluation in Phase III based on a comparison of the Week 16 antiviral activity and tolerability of a range of oral doses of DTG in HIV-1 infected therapy-naïve adult subjects. One of the secondary objectives was to characterize the PK parameters of DTG,using intensive and sparse PK sampling strategies, and to explore exposure-response relationships. Serial PK samples at Week 2 were collected in a subgroup of subjects receiving DTG treatment (n=~15 per DTG dose arm). Sparse PK at Week 2, Week 12, and Week 24 were collected in most subjects receiving DTG with one pre-dose sample and one post-dose sample collected at each visit. DTG was taken with or without food.
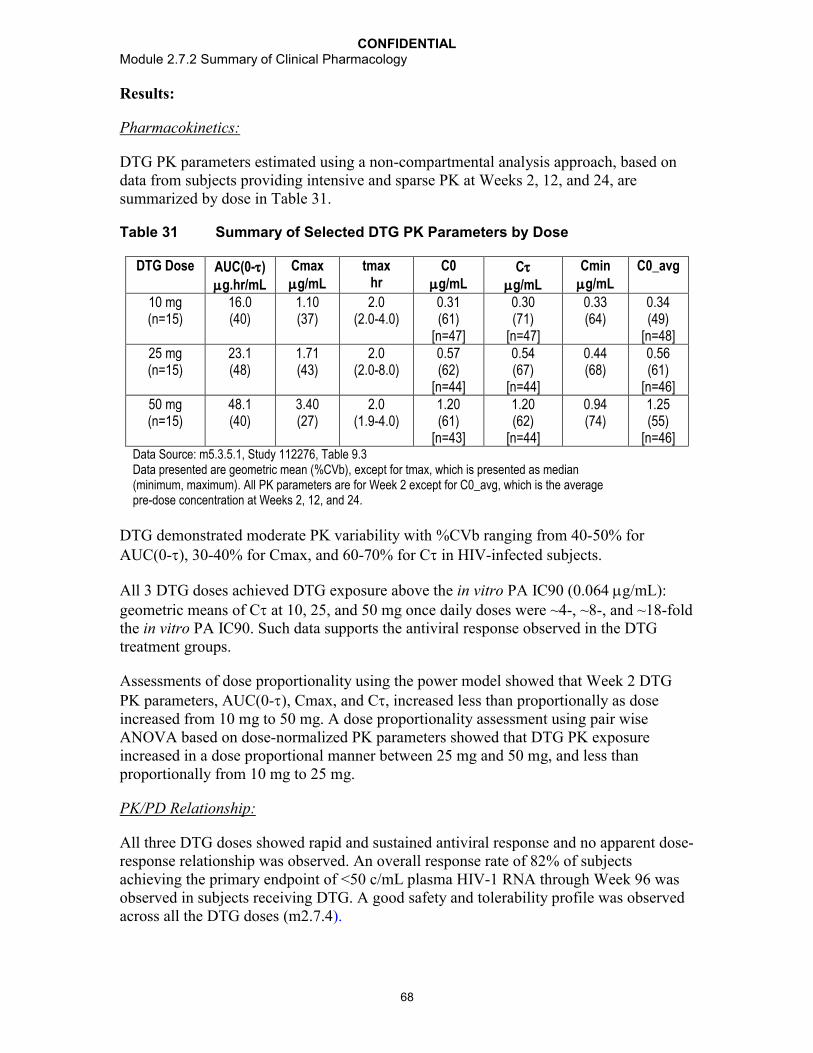
CONFIDENTIALModule 2.7.2 Summary of Clinical Pharmacology
68
Results:
Pharmacokinetics:
DTG PK parameters estimated using a non-compartmental analysis approach, based on data from subjects providing intensive and sparse PK at Weeks 2, 12, and 24, are summarized by dose in Table 31.
Table 31 Summary of Selected DTG PK Parameters by Dose
DTG Dose AUC(0-)g.hr/mL
Cmaxg/mL
tmaxhr
C0g/mL
Cg/mL
Cming/mL
C0_avg
10 mg (n=15)
16.0 (40)
1.10 (37)
2.0 (2.0-4.0)
0.31 (61)
[n=47]
0.30 (71)
[n=47]
0.33 (64)
0.34(49)
[n=48]25 mg (n=15)
23.1 (48)
1.71 (43)
2.0 (2.0-8.0)
0.57 (62)
[n=44]
0.54 (67)
[n=44]
0.44 (68)
0.56 (61)
[n=46]50 mg (n=15)
48.1 (40)
3.40 (27)
2.0 (1.9-4.0)
1.20 (61)
[n=43]
1.20 (62)
[n=44]
0.94 (74)
1.25(55)
[n=46]Data Source: m5.3.5.1, Study 112276, Table 9.3Data presented are geometric mean (%CVb), except for tmax, which is presented as median (minimum, maximum). All PK parameters are for Week 2 except for C0_avg, which is the average pre-dose concentration at Weeks 2, 12, and 24.
DTG demonstrated moderate PK variability with %CVb ranging from 40-50% for AUC(0-), 30-40% for Cmax, and 60-70% for C in HIV-infected subjects.
All 3 DTG doses achieved DTG exposure above the in vitro PA IC90 (0.064 g/mL): geometric means of C at 10, 25, and 50 mg once daily doses were ~4-, ~8-, and ~18-fold the in vitro PA IC90. Such data supports the antiviral response observed in the DTG treatment groups.
Assessments of dose proportionality using the power model showed that Week 2 DTG PK parameters, AUC(0-), Cmax, and C, increased less than proportionally as dose increased from 10 mg to 50 mg. A dose proportionality assessment using pair wise ANOVA based on dose-normalized PK parameters showed that DTG PK exposure increased in a dose proportional manner between 25 mg and 50 mg, and less than proportionally from 10 mg to 25 mg.
PK/PD Relationship:
All three DTG doses showed rapid and sustained antiviral response and no apparent dose-response relationship was observed. An overall response rate of 82% of subjects achieving the primary endpoint of <50 c/mL plasma HIV-1 RNA through Week 96 was observed in subjects receiving DTG. A good safety and tolerability profile was observed across all the DTG doses (m2.7.4).

CONFIDENTIALModule 2.7.2 Summary of Clinical Pharmacology
69
Exposure-Antiviral Activity and Exposure-Immunologic Response Relationships
There was no apparent relationship between plasma DTG exposure and Week 2 virologic response. Plasma DTG exposure, C0_avg, was not correlated with time to virological failure at Week 96, as obtained from the TLOVR algorithm, nor with change from Baseline up to Week 96 in CD4+ cell counts. The lack of exposure-antiviral activity andexposure-immunologic response relationship is consistent with the observation of no dose-response relationship in this study.
Three subjects met protocol-defined virological failure (rebound 400 c/mL) at Week 96. Two subjects in the 10 mg DTG treatment (#77 and #808), 1 subject in the 25 mg DTG treatment (#99), and no subject in the 50 mg DTG treatment met protocol-defined virological failure. DTG PK parameters observed in these subjects were similar to the rest of the subjects in the same DTG dose group. However one subject (#99) has documented noncompliance, which likely explains virological failure at Week 24.
Exposure-Toxicity Relationship
There was a small (~10%) and non-progressive increase in serum creatinine levels upon DTG treatment, consistent with known inhibition of OCT2 by DTG. A statistically significant correlation (p<0.05) was found between DTG C0_avg values and change from Baseline in serum creatinine and creatinine clearance at all visits up to Week 96, with correlation coefficients ranging from 0.201 to 0.317 across the Week 4 to Week 96 assessments. The positive correlation coefficients suggest that serum creatinine change from Baseline was higher in subjects with higher DTG exposure. This is consistent with the observed dose-dependent increase in serum creatinine.
Statistically significant correlations (p<0.05) were found between DTG exposure and total bilirubin (positive correlation), as well as and change from Baseline in ALT (negative correlation), however these correlations were not considered clinically relevant due the small magnitude in changes of these clinical chemistries. No correlation (p >0.05) was found between DTG PK exposure and presence of abdominal pain, diarrhea, nausea, and vomiting.
Conclusions:
Pharmacokinetics:
DTG exposure, including AUC(0-), Cmax, and C, increased as dose increasedfrom 10 mg to 50 mg; the increase in DTG exposure is dose proportional from 25 mgto 50 mg, but less than dose proportional from 10 mg to 25 mg.
DTG PK parameters demonstrated moderate variability with %CVb estimated at 30-50% for AUC(0-) and Cmax and 60-70% for C.
DTG 50 mg once daily dose achieved C of 1.2 g/mL (geometric mean), which is ~18-fold higher than the in vitro PA IC90 of 0.064 g/mL, supporting the dose selection of DTG 50 mg once daily in Phase III studies in INI-naïve subjects.

CONFIDENTIALModule 2.7.2 Summary of Clinical Pharmacology
70
PK/PD Relationship:
No dose or exposure-response relationship was found for DTG antiviral activity due to combination therapy.
There was a positive correlation between DTG dose/exposure and increase in serum creatinine from Baseline.
2.3.5. Study ING113086 (HIV-infected Treatment-naïve, 50 mg Once Daily)
Study Title: A Phase III, randomized, double blind study of the safety and efficacy of GSK1349572 50 mg once daily compared to raltegravir 400 mg twice daily both administered with fixed-dose dual nucleoside reverse transcriptase inhibitor therapy over 96 weeks in HIV-1 infected antiretroviral naïve adult subjects.
Location of Report: m5.3.5.1, Study ING113086 (48 week analysis)
Study Design: This is a multicenter, pivotal Phase III study. The primary objective is to compare the antiviral activity of DTG 50 mg once daily to raltegravir 400 mg twice dailyover 48 weeks in HIV-1 infected therapy-naïve subjects. A total of 827 subjects wererandomized (1:1) to DTG (N=413) or RAL (n=414). One of the secondary objectives is to characterize the pharmacokinetics (PK) of DTG using a sparse PK sampling strategy,and to explore exposure-response relationships of DTG [e.g., the relationship between DTG plasma exposure and virologic response or occurrence of adverse events (AEs)]. Sparse PK samples at Week 4, Week 24, and Week 48 were collected in most subjects receiving DTG. One pre-dose sample was collected at each PK visit and one post-dose sample was collected at the Week 4 and Week 48 visits. DTG was taken with or without food. The DTG pre-dose concentration (C0) was determined and used in PK/PD analyses for efficacy and safety. All DTG PK concentration data were included in a population PK analysis (Section 3.3.1).
Results:
Pharmacokinetics:
A summary of DTG C0 is provided below.

CONFIDENTIALModule 2.7.2 Summary of Clinical Pharmacology
71
Table 32 Summary of DTG C0
Treatment Week 4 Week 24 Week 48 C0_avg (g/mL)
C0(g/mL)
C0(g/mL)
C0(g/mL)
Overall by Response by Background Therapy
Non-responders
Responders ABC/3TC TDF/FTC
DTG50 mgonce daily
1.05(69)[379]
1.17(71) [365]
1.13(72)[351]
1.18(60)[399]
1.20(74)[41]
1.17(58)[358]
1.16(61)[165]
1.19(59)[234]
Data Source: m5.3.5.1, Study 113086, Table 9.3Data presented are geometric mean (%CVb) [n]. C0_avg is average of C0 at Week 4, Week 24, and Week 48.
PK/PD Relationship:
No correlation was observed between plasma DTG exposure (C0_avg) and virologic response (Snapshot response or PDVF) based on box-plots and logistic regression analysis. The lack of PK/PD relationship for efficacy is due to the potency of combination therapy resulting in more than 88% subjects on DTG treatment achieving HIV-1 RNA values <50 c/mL at Week 48.
There was no statistically significant correlation (p>0.05) between DTG C0_avg and the occurrence of the top three most common AEs: diarrhea, headache, or nausea based on graphic exploration and logistic regression.
No statistically significant correlation was found between DTG C0_avg and safety variables including change from Baseline in ALT. There was a statistically significant correlation (p<0.05) between DTG C0_avg and maximum change in total bilirubin, creatinine, and creatinine clearance. The higher the DTG C0_avg, the greater the increase from Baseline in total bilirubin and serum creatinine, and the lower the change in creatinine clearance. However, due to the small magnitude of changes in these clinical lab measures, these PK/PD relationships are not considered clinically relevant.
Conclusions:
Pharmacokinetics:
DTG pre-dose concentrations (C0) and moderate variability are consistent with prior studies, with average C0 well above the in vitro PA IC90, supporting the antiviral response observed in the DTG treatment group.

CONFIDENTIALModule 2.7.2 Summary of Clinical Pharmacology
72
PK/PD Relationship:
DTG pre-dose concentrations were similar between PDVF and non-PDVF subjects.There was no correlation between DTG pre-dose concentratins and virologic response (Snapshot).
No clinically relevant relationship was observed between concentrations and predefined safety assessments/endpoints.
2.3.6. Study ING112961 (HIV-infected Treatment-experienced Integrase-inhibitor-resistant, 50 mg Once Daily and 50 mg Twice Daily)
Title: A Phase IIb pilot study to assess the antiviral activity of dolutegravir containing regimen in antiretroviral therapy (ART)-experienced, HIV-1-infected adult subjects with raltegravir resistance
Location of Report: m5.3.5.2, Study ING112961 (Cohort II Week 48 analysis)
Study Design: This is Phase IIb dose-ranging study to assess the antiviral activity, safety,and PK of DTG with failing background regimen (short-term, 10 days only), as well as optimized background therapy from Day 11 to Week 96 in subjects with demonstrated INI resistance. Among the secondary objectives were an assessment of steady-state plasma DTG PK at Day 10, Week 4, and Week 24, and an evaluation of the PK/PD relationship. A total of 51 subjects enrolled in study: 27 subjects enrolled in Cohort I (DTG 50 mg once daily) and 24 subjects in Cohort II (50 mg twice daily). Cohort II was enrolled upon data review of Day 11 response in Cohort I. Subjects received DTG with failing background regimens on Day 1-10, and with optimized background regimens from Day 11 and onward. Serial DTG PK samples were collected on Day 10 and sparse PK samples were collected at Week 4 and Week 24 in all subjects with one pre-dose sample and one post-dose sample collected at each of the PK visits. DTG was taken with or without food.
Results:
Pharmacokinetics:
The DTG PK data from Cohort I (50 mg once daily) and Cohort II (50 mg twice daily) are summarized below.

CONFIDENTIALModule 2.7.2 Summary of Clinical Pharmacology
73
Table 33 Summary of Selected PK Parameters of DTG
Treatment Day 10 Week 4 Week 24Cmax(g/mL)
tmax(h)
AUC(0-24)(g.h/mL)
C(g/mL)
C0(g/mL)
Cmin(g/mL)
C0(g/mL)
C0(g/mL)
Cohort I (50 mg once daily)n=25
3.04(38)
2.97(1.97-7.92)
36.5(53)
0.69(91)
0.51(139)(n=24)
0.48(136)
0.57(100)(n=20)
0.38(114)(n=17)
Cohort II(50 mgtwice daily)n=23
5.41(40)
2.00(0-7.87)
93.4(50)
2.72(70)
3.20(69)
2.61(67)
2.55(63)(n=24)
2.38(69)(n=21)
Data Source: m5.3.5.2, Study 112961, Table 9.2.Data presented are geometric mean (%CVb) except for tmax where median (range) is presented.
Values for the phenotypic inhibitory quotient (PIQ), a parameter representing the DTG exposure fold coverage above the viral PA-IC90 and Baseline fold change, are provided in Table 34.
Table 34 Summary of PIQ Values of DTG
Treatment Day 10 Week4
Week 24
PIQ_Cavg PIQ_Cmax PIQ_C PIQ_C0 PIQ_Cmin PIQ_C0 PIQ_C0
Cohort I (50 mg once daily)n=25
10.2(237)
20.4(202)
5.16(283)
3.33(311)(n=24)
3.20(327)
3.64(211)(n=20)
3.13(130)(n=17)
Cohort II(50 mg twice daily)n=23
21.64(107)
30.1(108)
15.1(125)
17.8(129)
14.5(116)
14.4(113)(n=24)
13.8(103)(n=21)
Data Source: Study 112961, Table 9.2.Data presented are geometric mean (%CVb).
DTG PK exposures and PIQ values were similar at Day 10, Week 4, and Week 24 within each cohort but higher in Cohort II.
PK/PD Relationship Between DTG Exposure and Plasma HIV-1 RNA Change from Baseline to Day 11 (as a continuous variable)
Univariate Analysis
Among all the PK parameters examined, including Day 10 plasma DTG AUC(0-24), Cmax, Cmin, C0, and C, and PIQs [PIQ_C0, PIQ_Cavg, PIQ_Cmax, PIQ_Cmin, and PIQ_C], only PIQ, a parameter incorporating Baseline susceptibility to DTG was found to be statistically significantly (p<0.001) correlated with plasma HIV-1 RNA change from Baseline at Day 11. Among the PIQs evaluated, PIQ_Cavg and PIQ_Cmax were found to be the best predictors for plasma HIV-1 RNA change from Baseline at Day 11,based on the lowest Akaike’s Information Criterion (AIC) values. PIQ_Cavg was used in the subsequent multivariate analysis.

CONFIDENTIALModule 2.7.2 Summary of Clinical Pharmacology
74
The relationship between PIQ_Cavg and reduction in plasma HIV RNA at Day 11 is best described by an Emax model as detailed in the previous ING112961 clinical study report [Study ING112961, Table 7.9 and Figure 7.12).
Multivariate Analysis
The final best model included: phenotypic susceptibility score (PSS) of the Day 1-10 regimen, IN mutation pathway, and PIQ_Cavg (based on AIC reduction), but only PIQ_Cavg and PSS were statistically significant predictors (p<0.05) of the virologicalresponse at Day 11.
PK/PD Relationship Between DTG Exposure and Plasma HIV-1 RNA Change from Baseline at Day 11 >0.7 log10 c/mL (as a categorical variable)
Based on univariate logistic regression, PIQs were identified as statistically significant predictors for this Day 11 antiviral activity endpoint (p<0.05). As PIQ increases, the possibility of achieving plasma HIV-1 RNA change from Baseline at Day 11 >0.7 log10 c/mL increases.
Relationship between DTG Exposure and Long-term Virological Response (Week 48)
Based on univariate logistic regression using pooled data from both cohorts, C0, Cmin,and C (on log scale), and PIQ_C0 and PIQ_Cmin (on both linear and log scale) were determined to be the statistically significant predictors for virological response (plasma HIV RNA <50 c/mL based on TLOVR) at Week 48 (p<0.05).
Relationship between DTG Exposure and Safety Parameters
No statistically significant correlation was found between examined DTG PK parameters and safety measures, except for the following: there was a statistically significant correlation (p<0.05) between DTG PK [AUC(0-24), Cmax, Cmin, and C0] and creatinine change from Baseline at Day 11. The higher the DTG exposure, the greater the increase from Baseline in serum creatinine. Such correlation diminished over time and became statistically insignificant at Day 21 and beyond.
Conclusions:
Pharmacokinetics:
The PK parameters estimated at Day 10, Week 4, and Week 24 were similar within cohorts, with higher exposures observed in Cohort II compared to Cohort I,consistent with the increased dose administered.
PK/PD Relationship:
Based on multivariate analysis assessing DTG PK measures and other covariates on antiviral activity, PIQ and PSS of failing regimens at Days 1-10 were statistically significant predictors of change from Baseline in plasma HIV-1 RNA at Day11.

CONFIDENTIALModule 2.7.2 Summary of Clinical Pharmacology
75
A significant positive correlation (p<0.05) between DTG PK exposure (AUC, Cmax,and C0) and serum creatinine increase from Baseline was observed, but such correlation diminished over time becoming insignificant at Day 21 and beyond.
2.3.7. Study ING112574 (HIV-infected Treatment-experienced Integrase-inhibitor-resistant, 50 mg Twice Daily)
Study Title: A Phase III study to demonstrate the antiviral activity and safety of dolutegravir in HIV-1 infected adult subjects with treatment failure on an integrase inhibitor containing regimen
Location of Report: m5.3.5.2, Study ING112574 (Week 24 analysis)
Study Design: This is a multicenter, single arm, open-label study to assess the antiviral activity and safety of a DTG-containing regimen in HIV-1 infected, ART-experienced adults who experienced virological failure on an INI containing regimen with historical or current evidence of genotypic and/or phenotypic resistance to RAL or elvitegravir(EVG). Among the secondary objectives was the characterization of the pharmacokinetics (PK) of DTG using a sparse PK sampling strategy and a population modelling approach, an evaluation of the effect of patient characteristics (e.g. demographic factors) and concurrent medications (as covariates) on PK parameters of DTG, and an assessment of the PK/PD relationship. All subjects received 50 mg DTG twice daily along with their current failing background therapy for 7 days beforeswitching to DTG 50 mg twice daily with an optimized background regimen (OBR) from Day 8 onward (the OBR included at least one active drug). A total of 183 subjects were enrolled and provided Day 8 data; 114 subjects provided Week 24 data on efficacy and safety. Sparse PK samples were collected at Day8, Week 4, and Week 24 in the majority of subjects, with one pre-dose sample and one post-dose sample collected at each visit. DTG was taken with or without food. The DTG pre-dose concentration (C0) was determined from PK samples collected. Average C0 (C0_avg) was estimated for each subject as the average of C0 observed at Day 8, Week 4, and Week 24, and used in study-level PK/PD analyses for efficacy and safety. All DTG PK concentration data were included in a population PK analysis (Section 3.3.2).
Results:
Pharmacokinetics:
Plasma DTG C0 and PIQ_C0 were consistent across visits (Table 35). The overall geometric mean plasma DTG pre-dose concentration (C0_avg) was 2.35 g/mL, with high variability (between-subject coefficient of variation [%CVb] of 70%). The geometric mean PIQ_C0_avg was 19.7, and PIQs ranged from 0 to 204.

CONFIDENTIALModule 2.7.2 Summary of Clinical Pharmacology
76
Table 35 Summary of DTG C0 and PIQ_C0 by Visit
Treatment Plasma DTG C0 (g/mL) PIQ_C0
DTG 50 mg twice daily
Day 8(N=148)
Week 4(N=160)
Week 24(N=81)
Average(N=178)
Day 8(N=142)
Week 4(N=154)
Week 24(N=77)
Average(N=171)
2.36(91)
1.94(106)
2.18(98)
2.35(70)
19.4(202)
17.1(206)
22.4(204)
19.7(177)
Data Source: m5.3.5.2, Study ING112574, Table 9.3Data are presented as geometric mean (%CVb).
In the Week 24 ITT-E population (n=114). plasma DTG C0_avg was similar between virology responders and non-responders (where response was defined as <50 c/mL at Week 24), Baseline HIV-1 RNA categories (>100,000 vs 100,000 c/mL), hepatitis infected and non-infected subjects, and subjects who did and did not receive concomitant moderate to strong metabolic (CYP3A4/UGT) inducers (TPVr/ and EFV) in their OBR(Table 36). A small number of subjects (n=3) received ATV/RTV, a UGT1A1 inhibitor, and showed higher DTG exposure.
Table 36 Summary of DTG C0 and PIQ_C0 by Subgroup
Treatment SubgroupDTG50 mg twice daily
Week 24 Virological Response(Snapshot algorithm for Week 24 ITT(E) Population)
C0_avg (g/mL) PIQ_C0_avg
Non-respondersN=41
Responders(N=72)
Non-respondersN=41
RespondersN=68
2.33(77)
2.44(63)
12.7(183)
26.7(143)
Baseline Viral Load Category
C0_avg (g/mL) PIQ_C0_avg
100,000 c/mL(N=138)
>100,000 c/mL(N=40)
100,000 c/mL(N=131)
>100,000 c/mL(N=40)
2.33(67)
2.45(80)
19.2(177)
21.4(179)
HBV/HCV Status
C0_avg (g/mL) PIQ_C0_avg
HBV(N=10)
HCV(N=25)
Hepatitis Negative(N=141)
HBV(N=10)
HCV(N=24)
Hepatitis Negative(N=135)
2.97(89)
2.06(57)
2.41(67)
32.3(135)
20.1(161)
19.1(182)
Co-administration of Moderate/Strong Metabolic (CYP3A/UGT) Inducers
C0_avg (g/mL) PIQ_C0_avg
Inducers Not Co-administered (n=103)
Inducers Co-administered (n=8)
Inducers Not Co-administered (n=98)
Inducers Co-administered
(n=8)2.34 (68)
2.21 (30)
20.0 (168)
14.0 (181)
Data Source: Study ING112574, Table 9.3Data are presented as geometric mean (%CVb). C0_avg is the average of C0 at Day 8, Week 4, and Week 24.

CONFIDENTIALModule 2.7.2 Summary of Clinical Pharmacology
77
PK/PD Relationship:
Day 8 plasma DTG C0 was not a significant predictor of change from Baseline to Day 8 in plasma HIV-1 RNA in the multivariate linear regression analyses that included either Baseline fold-change in DTG IC50, or Baseline number of INI resistance mutations as a measure of viral susceptibility. Plasma DTG C0 at Day 8 was, however, a significant predictor when INI mutational pathway was included. The estimated effect in all three models was small at -0.04 to 0.05 log10 change from Baseline to Day 8 in plasma HIV-1 RNA for each 1 g/mL increase in Day 8 plasma DTG C0.
Plasma DTG C0_avg was not a significant predictor of Week 24 virological response in multivariate logistic regression analyses.
There was no correlation between DTG C0_avg and occurrence of the top three most common AEs (i.e., diarrhoea, headache, or nausea), nor with change from Baseline in clinical laboratory measures including ALT, total bilirubin, serum creatinine, creatinine clearance, and the urine albumin/serum creatinine ratio.
Conclusions:
Pharmacokinetics:
Subjects receiving DTG 50 mg twice daily achieved an average C0 approximately 2-fold higher than previously reported with 50 mg once daily in treatment-naïvesubjects in ING113086. Similar exposures were observed in eight subjects receiving inducers of CYP3A4/UGT1A1 compared to those not receiving these agents.
PK/PD Relationship:
Plasma DTG C0_avg was not statistically predictive of Day 8 or Week 24 antiviral response.
Plasma DTG C0_avg was not correlated with the three most frequently reported AEs or with clinical laboratory tests of interest.
2.3.8. Study ING111762 (HIV-infected Treatment-experienced IntegraseInhibitor-naïve, 50 mg Once Daily)
Study Title: A Phase III Randomized, Double-blind Study of the Safety and Efficacy of GSK1349572 50 mg Once Daily Versus Raltegravir 400 mg Twice Daily, Both administered with an Investigator-selected Background Regimen Over 48 Weeks in HIV-1 Infected, Integrase Inhibitor-Naïve, Antiretroviral Therapy-Experienced Adults
Location of Report: m5.3.5.1, Study ING111762 (Week 24 analysis)
Study Design: This is a multicenter pivotal Phase III study in treatment-experienced,INI-naïve subjects. The primary objective of the study is to assess the non-inferiority (NI margin=12%) of DTG 50 mg once daily to RAL 400 mg twice daily, using the proportion of subjects with HIV-1 RNA <50 c/mL (MSD=F, Snapshot algorithm) through Week 48 as the primary endpoint. A total of 724 subjects were randomized (1:1) to DTG (N=362)

CONFIDENTIALModule 2.7.2 Summary of Clinical Pharmacology
78
or RAL (n=362). One of the secondary objectives is to characterize the pharmacokinetics (PK) of DTG using a sparse PK sampling strategy, and to explore exposure-response relationships of DTG (e.g., the relationship between DTG plasma exposure and efficacyresponse or occurrence of adverse events). Sparse PK samples at Week 4, Week 24, and Week 48 were collected in most subjects receiving DTG. One pre-dose sample was collected at every PK visit, and one post-dose sample was collected at the Week 4 and Week 48 visits. DTG was taken with or without food. DTG concentrations in pre-dose samples, C0, were obtained. C0_avg, the average C0 at Week 4 and Week24, was calculated for each subject and used in study-level PK/PD analyses for efficacy and safety. All DTG PK concentration data available by a cut-off of were included in a population PK analysis (Section 3.3.2).
Results: This report presents all PK data obtained at Week 4 and partial data at Week 24 and Week 48.
Pharmacokinetics:
Table 37 Summary of DTG C0 by Visit
Treatment Plasma DTG C0 (g/mL)DTG
50 mg once daily
Week 4(N=329)
Week 24(N=262)
Week 48(N=106)
C0_avg of Week 4 and Week 24 (N=337)
0.786 (143) 0.956 (129) 0.907 (147) 0.856 (140)Data Source: m5.3.5.1, ING111762, Table 9.3Data presented as geometric mean (%CVb)
Based on the subgroup analysis (Table 38), plasma DTG C0_avg:
Was lower in non-responders than responders (<50 c/mL at Week 24 based on Snapshot);
Was lower in protocol-defined virologic failure (PDVF) subjects than non-PDVF subjects;
Was similar by Baseline HIV-1 RNA categories (>50,000 vs 50,000 c/mL);
Was similar between HCV co-infected subjects and subjects with no HBV or HCV co-infection, but seems to be higher in HBV co-infected subjects.
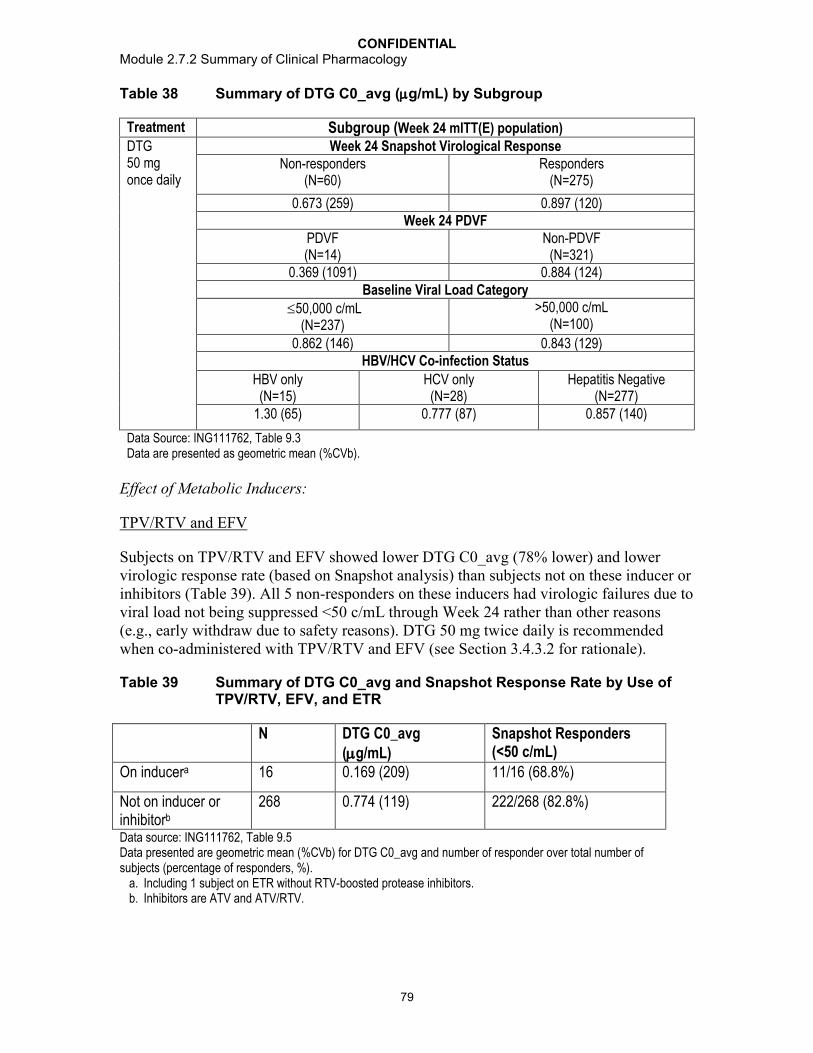
CONFIDENTIALModule 2.7.2 Summary of Clinical Pharmacology
79
Table 38 Summary of DTG C0_avg (g/mL) by Subgroup
Treatment Subgroup (Week 24 mITT(E) population)DTG50 mg once daily
Week 24 Snapshot Virological ResponseNon-responders
(N=60)Responders
(N=275)
0.673 (259) 0.897 (120)Week 24 PDVF
PDVF (N=14)
Non-PDVF (N=321)
0.369 (1091) 0.884 (124)Baseline Viral Load Category
50,000 c/mL(N=237)
>50,000 c/mL(N=100)
0.862 (146) 0.843 (129)HBV/HCV Co-infection Status
HBV only(N=15)
HCV only(N=28)
Hepatitis Negative(N=277)
1.30 (65) 0.777 (87) 0.857 (140)
Data Source: ING111762, Table 9.3Data are presented as geometric mean (%CVb).
Effect of Metabolic Inducers:
TPV/RTV and EFV
Subjects on TPV/RTV and EFV showed lower DTG C0_avg (78% lower) and lower virologic response rate (based on Snapshot analysis) than subjects not on these inducer or inhibitors (Table 39). All 5 non-responders on these inducers had virologic failures due to viral load not being suppressed <50 c/mL through Week 24 rather than other reasons(e.g., early withdraw due to safety reasons). DTG 50 mg twice daily is recommended when co-administered with TPV/RTV and EFV (see Section 3.4.3.2 for rationale).
Table 39 Summary of DTG C0_avg and Snapshot Response Rate by Use of TPV/RTV, EFV, and ETR
N DTG C0_avg(g/mL)
Snapshot Responders(<50 c/mL)
On inducera 16 0.169 (209) 11/16 (68.8%)
Not on inducer or inhibitorb
268 0.774 (119) 222/268 (82.8%)
Data source: ING111762, Table 9.5Data presented are geometric mean (%CVb) for DTG C0_avg and number of responder over total number of subjects (percentage of responders, %).
a. Including 1 subject on ETR without RTV-boosted protease inhibitors.b. Inhibitors are ATV and ATV/RTV.

CONFIDENTIALModule 2.7.2 Summary of Clinical Pharmacology
80
FPV/RTV
DTG C0_avg in subjects on FPV/RTV had a geometric mean (%CVb) of 0.266 g/mL(149%), which is similar to that observed in the Phase I drug interaction study (0.31 g/mL, Study ING113068). Despite the reduced DTG exposure, the virologic response rate (Snapshot analysis) was 80% (8 out of these 10 subjects) (data source: ING111762,Table 9.5), comparable to the response rate in subjects not on inducers (82.9%). Based on the Phase I study (ING113068), the geometric mean ratio (90% CI) of DTG C0 for DTG+ FPV/RTV vs DTG alone is 0.51 (0.41-0.63). The lower bound of the 90% CI remains higher than 0.25, which is the lower bound of the “no effect boundary” defined based on the cumulative understanding of the PK/PD relationship of DTG (3.2.3.1). It is recommended that no DTG dose adjustment is necessary when co-administered with FPV/RTV.
Once Daily Dosing of DRV/RTV
Effect of twice daily dosing of DRV/RTV (600/100 mg) on DTG PK was evaluated in Phase 1 studies (ING111405, Section 2.1.3.2; ING112934, Section 2.1.3.8) which showed no clinically significant impact on DTG PK. The impact of once daily dose of DRV/RTV (800/100mg) was evaluated in this study. Subjects on once daily DRV/RTVas part of their background therapy (N=43) demonstrated (Table 40):
Slightly higher DTG C0_avg than subjects on twice daily DRV/RTV;
Slightly lower DTG C0_avg than subjects on LPV/RTV;
Similar or higher virologic response rate (Snapshot analysis) as those in subjects on twice daily DRV/RTVor LPV/RTV.
Table 40 Summary of DTG C0_avg and Snapshot Response Rate by Use of RTV-boosted Protease Inhibitors
N DTG C0_avg(g/mL)
Snapshot Responder (<50c/mL)
DRV/RTVOnce Daily
43 0.760 (105) 38/43 (88.4%)
DRV/RTVTwice Daily
92 0.645 (110) 77/92 (83.7)
LPV/RTV Twice Daily
86 0.890 (138) 68/86 (79.1%)
Others 114 1.093 (174) 92/114 (80.7%)
Data source: ING111762, Table 9.5Data presented are geometric mean (%CVb) for DTG C0_avg and number of responder over total number of subjects (percentage of responders).
It is recommended that no DTG dose adjustment is necessary when co-administered with once daily dosing of DRV/RTV.

CONFIDENTIALModule 2.7.2 Summary of Clinical Pharmacology
81
DTG C0_avg in subjects on DTG and twice daily DRV/RTV (geometric mean of 0.645 g/mL) observed in this study was about 45% lower than those observed in thePhase III treatment-naïve study ING113086 (1.18 g/mL as the geometric mean, Section 2.3.5), which was similar to that observed in Phase I studies, about 38% reduction on DTG C by twice daily DRV/RTV (ING111405 and ING112934; Table 56).
ATV and ATV/RTV
DTG C0_avg in subjects on UGT1A1/CYP3A inhibitors ATV (n=5) or ATV/RTV(n=46) was estimated at 2.34 g/mL, which is about 98% higher than DTG C0_avg observed in ING113086 (1.18 g/mL as the geometric mean, Section 2.3.5). The magnitude of the effect of ATV or ATV/RTV on DTG C0 observed in this study was similar to that observed in the Phase I drug interaction study (Study ING111854; Table 56). Despite higher DTG concentration, similar Snapshot response rate was observed insubjects on ATV or ATV/RTV compared to subjects not on these inhibitors.
PK/PD Relationship for Virological Response:
When using all available data, DTG exposure [C0_avg (log2 transformed)] was a statistically significant predictor of efficacy response [Snapshot response, PDVF, and Efficacy Related Discontinuation = Failure (ERDF) response] based on univariate logistic regression analyses, as well as a multivariate analysis (Table 41). This multivariate regression model also evaluated Baseline HIV-1 RNA, DRV/RTV use in background regimen without primary PI mutations, and Baseline PSSf (i.e., PSS with full sensitivity only) score of background ART, and identified Baseline HIV-1 RNA as a significant predictor of Snapshot response in addition to DTG C0_avg.
Table 41 Summary of Multivariate Logistic Regression of Snapshot Response at Week 24
Factor Effect of Odds Ratio 95% CI p-valueDTG C0_avg (g/mL)
2-fold increase 1.273 (1.095, 1.480) 0.002
Baseline HIV-1 RNA (c/mL)
>50,000 vs 50,000
0.482 (0.267, 0.869) 0.015
DRV/RTV use in background therapy without primary PI mutations
Yes vs no 1.105 (0.536, 2.274) 0.787
Baseline PSSf of background therapy
2 vs <2 1.031 (0.542, 1.960) 0.926
Data Source: ING111762, Table 7.37.
As the results from the above analysis (using all subjects) was confounded by the use of moderate-strong inducers (TPV/RTV, EFV, and ETR without RTV-boosted protease inhibitors) in the background therapy and noncompliance, additional analysis was

CONFIDENTIALModule 2.7.2 Summary of Clinical Pharmacology
82
performed by excluding subjects on these inducers and of noncompliance (defined as with at least one non-detectable DTG concentration at Week 4 or Week 24). The analysis using censored data demonstrated that DTG drug exposure, C0, was no longer a statistically significant predictor of efficacy response (Table 42). This finding implies that DTG doses higher than the studied dose of 50 mg once daily (therefore higher DTG exposure) may not be beneficial (from an efficacy standpoint) in the study population evaluated, except for subjects using moderate to strong inducers in their background therapy. Therefore, the PK/PD results for efficacy supported the dose recommendation of DTG 50 mg once daily in the treatment-experienced, INI-naïve population, and a DTG dose adjustment to 50 mg twice daily is necessary for subjects who require co-administration with TPV/RTV and EFV.
Table 42 Summary of Multivariate Logistic Regression of Snapshot Response at Week 24 (Data Censored on Use of Inducersa in Background Therapy and Noncomplianceb)
Factor Effect of Odds Ratio 95% CI p-valueDTG C0_avg (g/mL)
2-fold increase 1.047 (0.816, 1.344) 0.718
Baseline HIV-1 RNA (c/mL)
>50,000 vs 50,000
0.510 (0.269, 0.965) 0.038
DRV/RTV use in background therapy without primary PI mutations
Yes vs no 0.989 (0.450, 2.171) 0.978
Baseline PSSf of background therapy
2 vs <2 1.150 (0.579, 2.284) 0.690
Data Source: ING111762, Table 7.50a. Inducers include TPV/RTV, EFV, and ETR without RTV-boosted protease inhibitors. b. Noncompliance is defined as having at least one non-detectable DTG concentration at Week 4 or
Week 24.
PK/PD Relationship for Safety
There was no statistically significant correlation (p>0.05) between DTG C0_avg and occurrence of the top four most common AEs: headache, upper respiratory tract infection, diarrhea, and nausea
There was no statistically significant correlation (p>0.05) between DTG C0_avg and change from Baseline in clinical laboratory measures that included ALT and the urine albumin/serum creatinine ratio.
There was a statistically (p<0.05) significant correlation between DTG C0_avg and change from Baseline of clinical laboratory measures that included total bilirubin, serum creatinine, and creatinine clearance. The higher the DTG C0_avg, the greater increase from Baseline in total bilirubin and serum creatinine, and the greater the decline in creatinine clearance.

CONFIDENTIALModule 2.7.2 Summary of Clinical Pharmacology
83
Conclusions:
Pharmacokinetics:
Trough DTG concentrations observed in treatment-experienced subjects were lower than that observed in treatment-naïve subjects, likely due to drug interactions with concomitant medications, including antiretrovirals, and less optimal compliance.
DTG should be given at 50 mg twice daily when co-administered with TPV/RTVand EFV.
DTG can be co-administered with FPV/RTV without dose adjustment.
DTG can be co-administered with once or twice daily DRV/RTVwithout dose adjustment.
PK/PD Relationship:
DTG drug exposure, C0, was a statistically significant predictor of Week 24 efficacy response using data from all subjects, but was not a predictor once subjects with evidence of non-compliance or on moderate/strong inducers were excluded.
The only PK/PD relationship observed between DTG and safety measureswas a correlation wtih total bilirubin and serum creatinine, likely due to benign competition between DTG and unconjugated bilirubin for UGT1A1 and an expected effect of DTG on OCT2, respectively.
2.3.9. Study ING116070 (Cerebrospinal Fluid)
Study Title: A single-arm study of the safety, efficacy and central nervous system and plasma PK of GSK1349572 (dolutegravir, DTG) 50 mg once daily in combination with the abacavir/lamivudine fixed dose combination tablet over 96 weeks in HIV-1 infected antiretroviral naïve adult subjects.
Location of Report: m5.3.4.2, Study ING116070 (Week 2 interim analysis)
Study Design: This study in approximately 14 HIV-1 infected, ART-naïve adult subjects assessed the cerebral spinal fluid (CSF) penetration of DTG dosed at 50 mg once daily in combination with the abacavir/lamivudine (ABC/3TC) fixed dose combination (FDC)tablet at Weeks 2 and 16. One pair of PK samples, in plasma and CSF (matching time) for determination of DTG concentration (total and unbound concentration in plasma and total concentration in CSF), were collected at Week 2 and Week 16 from each subject.Samples for plasma HIV-1 RNA were collected at Baseline and various time pointsthroughout the study, and samples for HIV-1 RNA levels in the CSF were collected at Baseline, Week 2, and Week 16.
Results: The study is currently ongoing; results presented are based on the last subject completing the Week 2 visit. A total of 13 subjects enrolled in this study. Twelve subjects were ongoing at the time of analysis and one subject withdrew early due to an adverse event. All (100%) subjects were white males, 23% were of Hispanic ethnicity, and the mean age was 40 years. Twelve subjects provided evaluable PK data, and eleven subjects provided paired plasma/CSF samples.
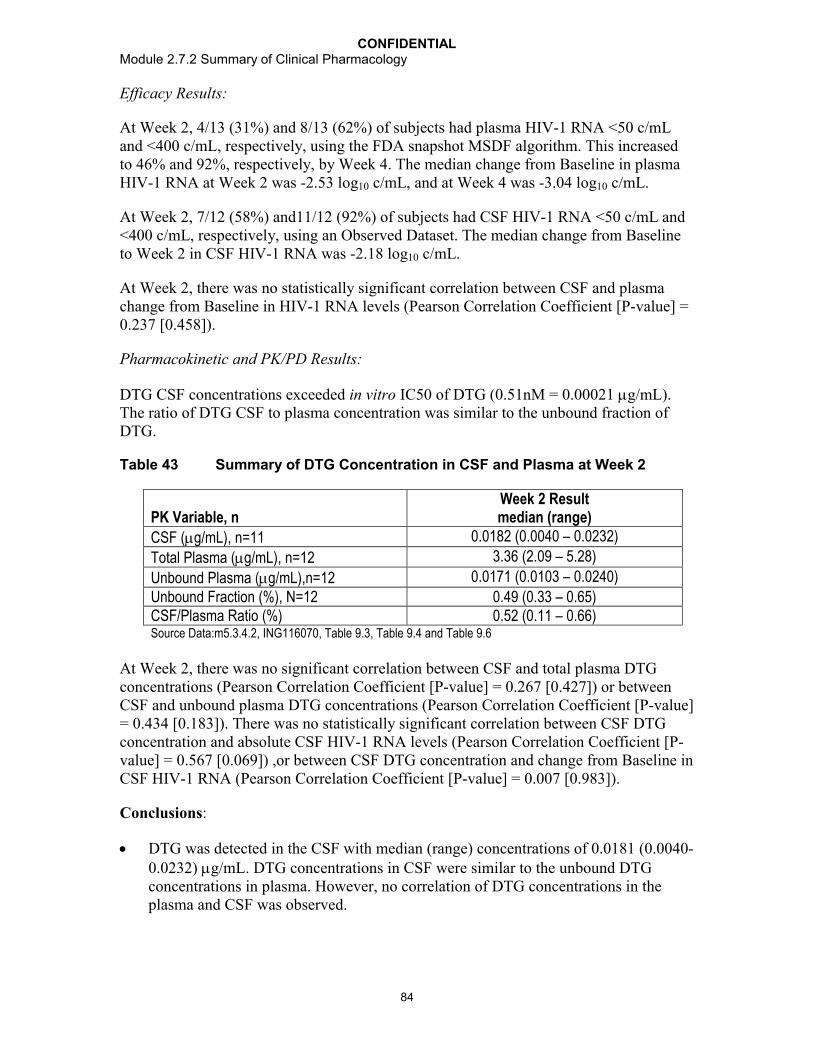
CONFIDENTIALModule 2.7.2 Summary of Clinical Pharmacology
84
Efficacy Results:
At Week 2, 4/13 (31%) and 8/13 (62%) of subjects had plasma HIV-1 RNA <50 c/mL and <400 c/mL, respectively, using the FDA snapshot MSDF algorithm. This increased to 46% and 92%, respectively, by Week 4. The median change from Baseline in plasma HIV-1 RNA at Week 2 was -2.53 log10 c/mL, and at Week 4 was -3.04 log10 c/mL.
At Week 2, 7/12 (58%) and11/12 (92%) of subjects had CSF HIV-1 RNA <50 c/mL and <400 c/mL, respectively, using an Observed Dataset. The median change from Baseline to Week 2 in CSF HIV-1 RNA was -2.18 log10 c/mL.
At Week 2, there was no statistically significant correlation between CSF and plasma change from Baseline in HIV-1 RNA levels (Pearson Correlation Coefficient [P-value] = 0.237 [0.458]).
Pharmacokinetic and PK/PD Results:
DTG CSF concentrations exceeded in vitro IC50 of DTG (0.51nM = 0.00021 g/mL). The ratio of DTG CSF to plasma concentration was similar to the unbound fraction of DTG.
Table 43 Summary of DTG Concentration in CSF and Plasma at Week 2
PK Variable, nWeek 2 Resultmedian (range)
CSF (g/mL), n=11 0.0182 (0.0040 – 0.0232)
Total Plasma (g/mL), n=12 3.36 (2.09 – 5.28)
Unbound Plasma (g/mL),n=12 0.0171 (0.0103 – 0.0240)
Unbound Fraction (%), N=12 0.49 (0.33 – 0.65)CSF/Plasma Ratio (%) 0.52 (0.11 – 0.66)Source Data:m5.3.4.2, ING116070, Table 9.3, Table 9.4 and Table 9.6
At Week 2, there was no significant correlation between CSF and total plasma DTG concentrations (Pearson Correlation Coefficient [P-value] = 0.267 [0.427]) or between CSF and unbound plasma DTG concentrations (Pearson Correlation Coefficient [P-value] = 0.434 [0.183]). There was no statistically significant correlation between CSF DTG concentration and absolute CSF HIV-1 RNA levels (Pearson Correlation Coefficient [P-value] = 0.567 [0.069]) ,or between CSF DTG concentration and change from Baseline in CSF HIV-1 RNA (Pearson Correlation Coefficient [P-value] = 0.007 [0.983]).
Conclusions:
DTG was detected in the CSF with median (range) concentrations of 0.0181 (0.0040-0.0232) g/mL. DTG concentrations in CSF were similar to the unbound DTG concentrations in plasma. However, no correlation of DTG concentrations in the plasma and CSF was observed.

CONFIDENTIALModule 2.7.2 Summary of Clinical Pharmacology
85
DTG concentrations observed in CSF exceed in vitro IC50 against wild-type viruses (0.0002 g/mL) suggesting that DTG is able to reach sanctuary sites within the CNS at therapeutic concentrations.
A regimen of DTG + ABC/3TC was effective in decreasing CSF HIV-1 RNA levels with a median decrease of -2.18 log10 c/mL at Week 2.
No direct correlation of DTG CSF concentrations and change from Baseline in CSF HIV-1 RNA levels was observed likely due to combination therapy and the potent antiviral activity across subjects at Week 2 (decreases in CSF HIV-1 RNA from Baseline ranged from -1.29 to -3.11 log10 c/mL).
Median decreases in CSF HIV-1 RNA levels at Week 2 were similar to those observed in plasma (-2.53 log10 c/mL).
3. COMPARISON AND ANALYSES OF RESULTS ACROSS STUDIES
3.1. Clinical Pharmacokinetics
3.1.1. Summary of Pharmacokinetic Parameters in Healthy Subjects and HIV-infected Subjects
A meta-analysis of DTG PK parameters from DTG 50 mg once daily and twice dailydosing observed in Phase I studies was conducted (m5.3.5.3 CPM). In general, plasma DTG PK parameter values following single- and repeat-dose DTG 50 mg tablet administration are similar between healthy and HIV-infected subjects (Table 44; Table 45). DTG PK exposure from 50 mg twice daily dosing seems to be lower in HIV-1-infected subjects (treatment-experienced) than in healthy subjects, and this is due to wide use of inducers (e.g. DRV/RTV) in the background regimen in the treatment-experienced HIV-1-infected subjects.
Table 44 Summary of Key DTG Pharmacokinetic Parameters following Single Dose 50 mg Tablet Administration in Healthy and HIV-infected Subjects
Population/N
DTG Dose
Data Source Cmax (g/ml)
AUC(0-)(g.h/mL)
C24 (g/mL)
CL/F(L/h)
Vz/F(L/h)
t½(h)
Healthy/ 50 mg Phase I Meta-analysis
2.20(43)
43.7(45)
0.65(49)
1.14(45)
23.3(45)
14.4(19)
HIV-1 infected/10
50 mg ING111521 2.46(32)
40.5(33)
0.59(31)
1.23(33)
ND 11.2(29)a
Data Source: m5.3.5.3 CPM Table 3.3; m5.3.4.2, Study ING111521, Table 11.3.Data presented are geometric mean (%CVb) except for tmax where median (range) is presented. ND: not determined.a. Likely underestimated as based on 24-hour sampling window
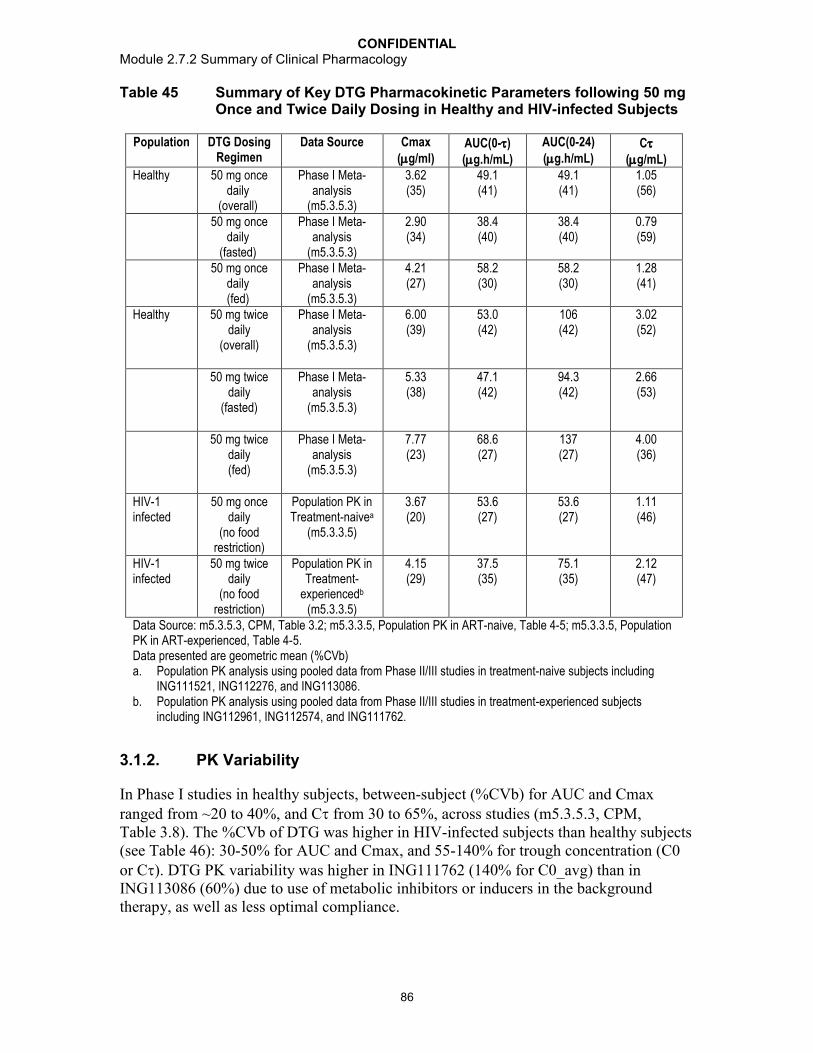
CONFIDENTIALModule 2.7.2 Summary of Clinical Pharmacology
86
Table 45 Summary of Key DTG Pharmacokinetic Parameters following 50 mgOnce and Twice Daily Dosing in Healthy and HIV-infected Subjects
Population DTG Dosing Regimen
Data Source Cmax (g/ml)
AUC(0-)(g.h/mL)
AUC(0-24)(g.h/mL)
C (g/mL)
Healthy 50 mg once daily
(overall)
Phase I Meta-analysis
(m5.3.5.3)
3.62(35)
49.1(41)
49.1(41)
1.05(56)
50 mg once daily
(fasted)
Phase I Meta-analysis
(m5.3.5.3)
2.90(34)
38.4(40)
38.4(40)
0.79(59)
50 mg once daily(fed)
Phase I Meta-analysis
(m5.3.5.3)
4.21(27)
58.2(30)
58.2(30)
1.28(41)
Healthy 50 mg twice daily
(overall)
Phase I Meta-analysis
(m5.3.5.3)
6.00(39)
53.0(42)
106(42)
3.02(52)
50 mg twice daily
(fasted)
Phase I Meta-analysis
(m5.3.5.3)
5.33(38)
47.1(42)
94.3(42)
2.66(53)
50 mg twice daily(fed)
Phase I Meta-analysis
(m5.3.5.3)
7.77(23)
68.6(27)
137(27)
4.00(36)
HIV-1 infected
50 mg once daily
(no food restriction)
Population PK in Treatment-naivea
(m5.3.3.5)
3.67 (20)
53.6 (27)
53.6(27)
1.11 (46)
HIV-1 infected
50 mg twice daily
(no food restriction)
Population PK in Treatment-
experiencedb
(m5.3.3.5)
4.15(29)
37.5(35)
75.1(35)
2.12(47)
Data Source: m5.3.5.3, CPM, Table 3.2; m5.3.3.5, Population PK in ART-naive, Table 4-5; m5.3.3.5, Population PK in ART-experienced, Table 4-5.Data presented are geometric mean (%CVb)a. Population PK analysis using pooled data from Phase II/III studies in treatment-naive subjects including
ING111521, ING112276, and ING113086.b. Population PK analysis using pooled data from Phase II/III studies in treatment-experienced subjects
including ING112961, ING112574, and ING111762.
3.1.2. PK Variability
In Phase I studies in healthy subjects, between-subject (%CVb) for AUC and Cmax ranged from ~20 to 40%, and C from 30 to 65%, across studies (m5.3.5.3, CPM, Table 3.8). The %CVb of DTG was higher in HIV-infected subjects than healthy subjects(see Table 46): 30-50% for AUC and Cmax, and 55-140% for trough concentration (C0 or C). DTG PK variability was higher in ING111762 (140% for C0_avg) than in ING113086 (60%) due to use of metabolic inhibitors or inducers in the background therapy, as well as less optimal compliance.

CONFIDENTIALModule 2.7.2 Summary of Clinical Pharmacology
87
Table 46 Summary of Between-subject Variability (%CVb and N) of Selected DTG PK Parameters in HIV-infected Subjects in Phase IIb/III Studies
Study DTG Dose PK Parameter Data Source
AUC(0-) Cmax C C0_avg
%CVb N %CVb N %CVb N %CVb NING112276 50 mg
once daily40% 15 27% 15 72% 15 55% 46 Table 31
ING113086 50 mgonce daily
ND ND ND 60% 399 Table 32
ING112961 50 mgtwice daily
50% 23 40% 23 70% 23 ND Table 33
ING112574 50 mgtwice daily
ND ND ND 70% 178 Table 35
ING111762 50 mgonce daily
ND ND ND 140% 337 Table 37
Data presented are %CVb and N (number of subjects); ND: not determined.
Between-subject variability (%CVb) accounts for the majority of PK variability while within-subject variability (%CVw) is lower than between-subject variability. In Phase Istudies, the estimated within-subject variability (%CVw) ranged from 8 to 20% for DTG PK parameters including AUC, Cmax, and C24/C. In HIV-infected patients, based on the population PK modelling using pooled data from Studies ING111521, ING112276, and ING113086 in treatment-naïve HIV-infected subjects, inter-occasional variability (a parameter roughly estimating %CVw) was estimated at 17.2% on CL/F, which was lower than the estimated between-subject variability of 23% for CL/F. In the population PK modelling, using pooled data from studies ING111762, ING112961, and ING112574 in treatment-experienced subjects, inter-occasional variability was estimated at 28.9% for CL/F compared to between-subject variability of 28.7% for CL/F.
As DTG shows a moderate between-subject PK variability and a relatively wide therapeutic window (see Section 3.2.3 for details), individualized dose or clinical drug monitoring is not needed for DTG therapy.
3.1.3. Absorption
Following oral administration of tablet formulations, DTG absorption is rapid with no absorption lag time and a median tmax of 2 to 3 hours post dose. DTG concentration declines mono-exponentially with an average terminal half-life of approximately 14 hours.
DTG absorption is increased with co-administration of food (m2.7.1, Section 3.2) anddecreased when co-administered with polyvalent metal cation-containing products (Section 2.1.3.3). The linearity of DTG PK is dependent on dose and formulation. Following oral administration of suspension formulation, DTG exhibits linear PK from 2 to 100 mg (dose-proportional increases in plasma exposure; Section 2.1.1.1) and nonlinear PK between 100 mg and 250 mg (less than dose-proportional increases in
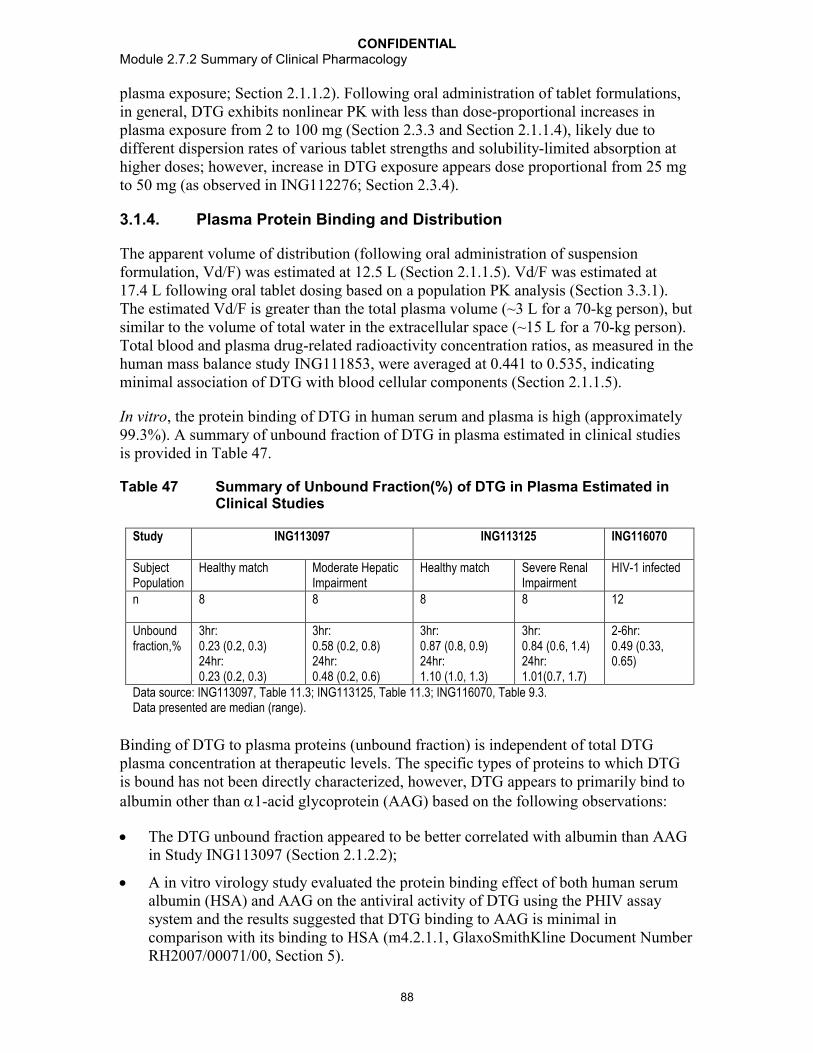
CONFIDENTIALModule 2.7.2 Summary of Clinical Pharmacology
88
plasma exposure; Section 2.1.1.2). Following oral administration of tablet formulations, in general, DTG exhibits nonlinear PK with less than dose-proportional increases in plasma exposure from 2 to 100 mg (Section 2.3.3 and Section 2.1.1.4), likely due to different dispersion rates of various tablet strengths and solubility-limited absorption at higher doses; however, increase in DTG exposure appears dose proportional from 25 mgto 50 mg (as observed in ING112276; Section 2.3.4).
3.1.4. Plasma Protein Binding and Distribution
The apparent volume of distribution (following oral administration of suspension formulation, Vd/F) was estimated at 12.5 L (Section 2.1.1.5). Vd/F was estimated at 17.4 L following oral tablet dosing based on a population PK analysis (Section 3.3.1). The estimated Vd/F is greater than the total plasma volume (~3 L for a 70-kg person), but similar to the volume of total water in the extracellular space (~15 L for a 70-kg person). Total blood and plasma drug-related radioactivity concentration ratios, as measured in the human mass balance study ING111853, were averaged at 0.441 to 0.535, indicating minimal association of DTG with blood cellular components (Section 2.1.1.5).
In vitro, the protein binding of DTG in human serum and plasma is high (approximately 99.3%). A summary of unbound fraction of DTG in plasma estimated in clinical studies is provided in Table 47.
Table 47 Summary of Unbound Fraction(%) of DTG in Plasma Estimated in Clinical Studies
Study ING113097 ING113125 ING116070
SubjectPopulation
Healthy match Moderate Hepatic Impairment
Healthy match Severe Renal Impairment
HIV-1 infected
n 8 8 8 8 12
Unbound fraction,%
3hr: 0.23 (0.2, 0.3)24hr: 0.23 (0.2, 0.3)
3hr: 0.58 (0.2, 0.8)24hr: 0.48 (0.2, 0.6)
3hr: 0.87 (0.8, 0.9)24hr: 1.10 (1.0, 1.3)
3hr:0.84 (0.6, 1.4)24hr:1.01(0.7, 1.7)
2-6hr: 0.49 (0.33, 0.65)
Data source: ING113097, Table 11.3; ING113125, Table 11.3; ING116070, Table 9.3. Data presented are median (range).
Binding of DTG to plasma proteins (unbound fraction) is independent of total DTG plasma concentration at therapeutic levels. The specific types of proteins to which DTG is bound has not been directly characterized, however, DTG appears to primarily bind to albumin other than 1-acid glycoprotein (AAG) based on the following observations:
The DTG unbound fraction appeared to be better correlated with albumin than AAGin Study ING113097 (Section 2.1.2.2);
A in vitro virology study evaluated the protein binding effect of both human serum albumin (HSA) and AAG on the antiviral activity of DTG using the PHIV assay system and the results suggested that DTG binding to AAG is minimal in comparison with its binding to HSA (m4.2.1.1, GlaxoSmithKline Document NumberRH2007/00071/00, Section 5).
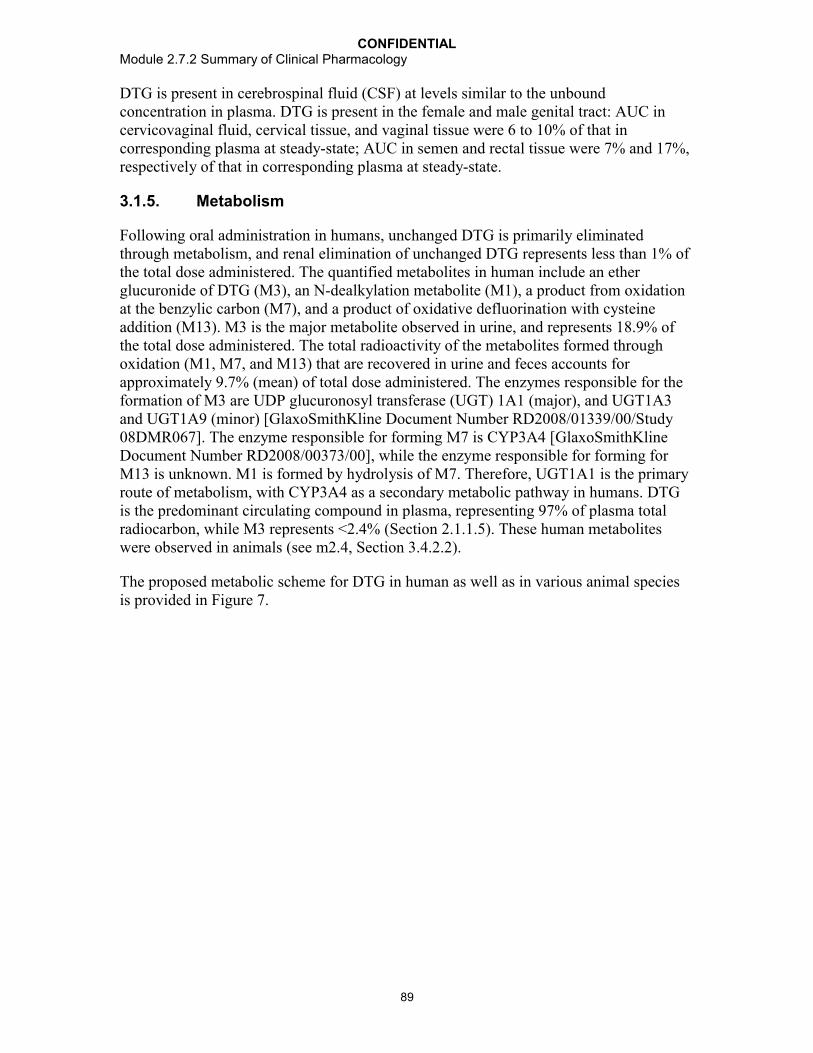
CONFIDENTIALModule 2.7.2 Summary of Clinical Pharmacology
89
DTG is present in cerebrospinal fluid (CSF) at levels similar to the unbound concentration in plasma. DTG is present in the female and male genital tract: AUC in cervicovaginal fluid, cervical tissue, and vaginal tissue were 6 to 10% of that in corresponding plasma at steady-state; AUC in semen and rectal tissue were 7% and 17%, respectively of that in corresponding plasma at steady-state.
3.1.5. Metabolism
Following oral administration in humans, unchanged DTG is primarily eliminated through metabolism, and renal elimination of unchanged DTG represents less than 1% of the total dose administered. The quantified metabolites in human include an ether glucuronide of DTG (M3), an N-dealkylation metabolite (M1), a product from oxidation at the benzylic carbon (M7), and a product of oxidative defluorination with cysteine addition (M13). M3 is the major metabolite observed in urine, and represents 18.9% of the total dose administered. The total radioactivity of the metabolites formed through oxidation (M1, M7, and M13) that are recovered in urine and feces accounts for approximately 9.7% (mean) of total dose administered. The enzymes responsible for the formation of M3 are UDP glucuronosyl transferase (UGT) 1A1 (major), and UGT1A3 and UGT1A9 (minor) [GlaxoSmithKline Document Number RD2008/01339/00/Study 08DMR067]. The enzyme responsible for forming M7 is CYP3A4 [GlaxoSmithKlineDocument Number RD2008/00373/00], while the enzyme responsible for forming for M13 is unknown. M1 is formed by hydrolysis of M7. Therefore, UGT1A1 is the primary route of metabolism, with CYP3A4 as a secondary metabolic pathway in humans. DTG is the predominant circulating compound in plasma, representing 97% of plasma total radiocarbon, while M3 represents <2.4% (Section 2.1.1.5). These human metabolites were observed in animals (see m2.4, Section 3.4.2.2).
The proposed metabolic scheme for DTG in human as well as in various animal speciesis provided in Figure 7.

CONFIDENTIALModule 2.7.2 Summary of Clinical Pharmacology
90
Figure 7 Metabolic Scheme of DTG in Human Compared to Nonclinical Species
GSK1349572Human, Mouse, Rat, Monkey
F O
NH
F
N
N
O
CH3OOH
O
H
O
NH2 N
N
O
CH3OOH
O
H
M1Human, Mouse, Rat, Monkey
F O
NH
F
N
N
O
CH3OOH
O
HOH
M7Human, Mouse, Rat
F O
NH
F
N
N
O
CH3OO
O
H
O
OH
OH
OH
OH
M2Human, Mouse, Rat, Monkey
F O
NH
F
N
N
O
CH3OO
O
H
O
OH
OH
OH
OH
O
M3Human, Mouse, Rat, Monkey
-F
+SO4H
F O
NH
F
N
N
O
CH3OOH
O
H
M10Human, Rat
+SO4
F O
NH
F
N
N
O
CH3OOH
O
H
M11Human, Mouse, Rat
+C6H11O5
F O
NH
F
N
N
O
CH3OOH
O
H
M12 Human, Rat
F O
NH
F
N
N
O
CH3OOH
O
H
S
NH2O
OH
M13Human, Monkey
F O
NH
F
N
N
O
CH3OOH
O
H
-F+2O+cysteine
M14 Human, Mouse
F O
NH
F
N
N
O
CH3OOH
O
H
- CO+Gluc
M16Human, Mouse
F O
NH
F
N
N
O
CH3OOH
O
H
+glutathione+O -F
M15Mouse
-F+O
M9Mouse, Rat
Data source: m2.4, Figure 1.Bolded arrows indicate the primary metabolic products in humans (M3 is the predominant product; M7 is a notable metabolite)
The primary metabolite, ether glucuronide of DTG (M3), in plasma shows formationrate-limited elimination following oral administration of DTG (Section 2.1.2.3). Apparent half-life of the ether glucuronide in plasma is similar to the parent compound, DTG, and renal excretion is a primary route of elimination of this metabolite (Section 2.1.2.3). In subjects with severe renal impairment (Section 2.1.2.3), exposure (AUC) of this metabolite is approximately 3-fold higher than that observed in healthy matching subjects, likely due to impaired renal elimination of the metabolite in subjects with renal impairment. However the apparent half-life of the metabolite is unchanged.
Co-administration of EFV decreases DTG systemic exposure, AUC, by 57% (Section 2.1.3.13). The plasma and urine metabolite profiling data suggests that EFV induces both UGT1A1 and CYP3A pathways. With presence of EFV, DTG is still the major component in plasma, while M3 is present at a mean value of <2% of DTG, similar to that observed from the treatment of DTG alone. DTG and 11 metabolites wereidentified in pooled human urine. The urine from subjects receiving DTG in combination with EFV displays an increase in the ratio of M3 relative to parent DTG, and a concomitant decrease in the ratio of M1 to DTG, when compared to the metabolic profile of DTG alone. No other significant urinary metabolite differences between the two treatments are noted.
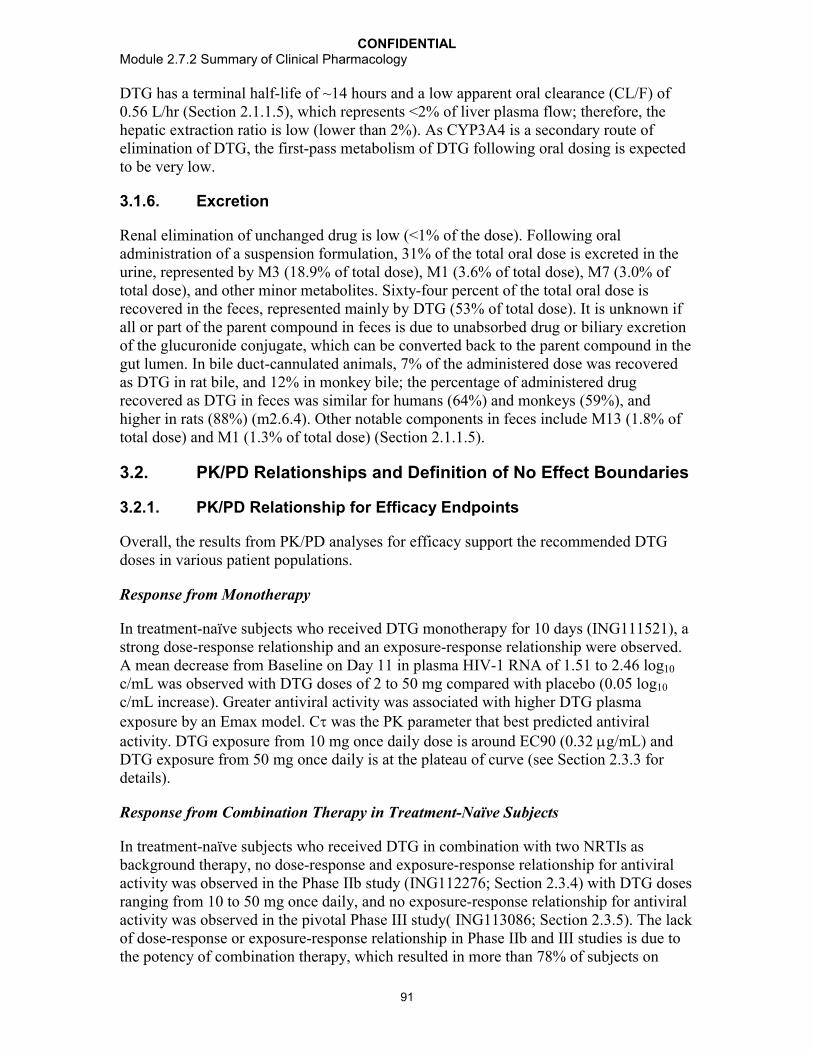
CONFIDENTIALModule 2.7.2 Summary of Clinical Pharmacology
91
DTG has a terminal half-life of ~14 hours and a low apparent oral clearance (CL/F) of 0.56 L/hr (Section 2.1.1.5), which represents <2% of liver plasma flow; therefore, the hepatic extraction ratio is low (lower than 2%). As CYP3A4 is a secondary route of elimination of DTG, the first-pass metabolism of DTG following oral dosing is expected to be very low.
3.1.6. Excretion
Renal elimination of unchanged drug is low (<1% of the dose). Following oral administration of a suspension formulation, 31% of the total oral dose is excreted in the urine, represented by M3 (18.9% of total dose), M1 (3.6% of total dose), M7 (3.0% of total dose), and other minor metabolites. Sixty-four percent of the total oral dose is recovered in the feces, represented mainly by DTG (53% of total dose). It is unknown if all or part of the parent compound in feces is due to unabsorbed drug or biliary excretion of the glucuronide conjugate, which can be converted back to the parent compound in the gut lumen. In bile duct-cannulated animals, 7% of the administered dose was recovered as DTG in rat bile, and 12% in monkey bile; the percentage of administered drug recovered as DTG in feces was similar for humans (64%) and monkeys (59%), and higher in rats (88%) (m2.6.4). Other notable components in feces include M13 (1.8% of total dose) and M1 (1.3% of total dose) (Section 2.1.1.5).
3.2. PK/PD Relationships and Definition of No Effect Boundaries
3.2.1. PK/PD Relationship for Efficacy Endpoints
Overall, the results from PK/PD analyses for efficacy support the recommended DTG doses in various patient populations.
Response from Monotherapy
In treatment-naïve subjects who received DTG monotherapy for 10 days (ING111521), a strong dose-response relationship and an exposure-response relationship were observed.A mean decrease from Baseline on Day 11 in plasma HIV-1 RNA of 1.51 to 2.46 log10
c/mL was observed with DTG doses of 2 to 50 mg compared with placebo (0.05 log10
c/mL increase). Greater antiviral activity was associated with higher DTG plasma exposure by an Emax model. C was the PK parameter that best predicted antiviral activity. DTG exposure from 10 mg once daily dose is around EC90 (0.32 g/mL) and DTG exposure from 50 mg once daily is at the plateau of curve (see Section 2.3.3 for details).
Response from Combination Therapy in Treatment-Naïve Subjects
In treatment-naïve subjects who received DTG in combination with two NRTIs as background therapy, no dose-response and exposure-response relationship for antiviral activity was observed in the Phase IIb study (ING112276; Section 2.3.4) with DTG dosesranging from 10 to 50 mg once daily, and no exposure-response relationship for antiviral activity was observed in the pivotal Phase III study( ING113086; Section 2.3.5). The lack of dose-response or exposure-response relationship in Phase IIb and III studies is due to the potency of combination therapy, which resulted in more than 78% of subjects on

CONFIDENTIALModule 2.7.2 Summary of Clinical Pharmacology
92
DTG treatments achieving HIV RNA values <50 c/mL at Week 96 in the Phase IIb study ING112276, and an 88% response rate at Week 48 in the Phase III study ING113086. Such findings indicate a drug effect at DTG doses of 10 to 50 mg once daily in combination with dual NRTIs background therapy, achieved maximum virological suppression in this population. These data support the selection of DTG 50 mg once dailyfor the treatment-naïve subjects.
Response from Combination Therapy in Treatment-Experienced, Integrase Inhibitor-Naïve Subjects
In ART treatment-experienced, INI-naïve subjects where DTG was given in combination with at least 1 active agent in the optimized background regimen (Study ING111762; Section 2.3.8), plasma DTG drug exposure, C0_avg, was associated with virologicresponse based on all available data.
For subjects receiving moderate/strong inducers as part of their background therapy such as EFV and TPV/RTV, lower DTG exposures and lower virologic responses (11/16, 69%) were observed compared to the rest of the population receiving DTG (222/268, 83%) (Section 2.3.8), supporting the use of a higher DTG dose in this limited sub-population. DTG 50 mg twice daily is the recommended dose for treatment-experienced, INI-naïve patients receiving EFV or TPV/RTV (see Section 3.4.3.2 for rationale).
As the use of moderate-strong inducers (TPV/RTV and EFV) in the background therapy and noncompliance were confounding factors in the PK/PD evaluation, additional PK/PD analysis was performed by excluding subjects on these inducers and with evidence of noncompliance (defined as non-detectable DTG concentration observed at one or more PK visits). The results from this additional analysis showed that DTG C0_avg was no longer a predictor of virological response, suggesting that a sufficiently high DTG exposure was achieved for robust virologic responses for the rest of the population. Subjects on UGT1A1 inhibitor, ATV or ATV/RTV, as part of their background regimens (n=51) demonstrated two folds higher DTG exposure however similar virologic response (Section 2.3.8). Thess findings imply that DTG dose higher than 50 mg once daily (therefore higher DTG exposure) may not be beneficial (from an efficacy standpoint) in the study population evaluated, except for subjects using moderate-strong inducers in their background therapy. Therefore, these PK/PD results for efficacy supported the selection of DTG 50 mg once daily for the treatment-experienced, INI-naïve subjects and DTG dose adjustment to 50 mg BID is neccessary for subjects who require co-administration with TPV/RTV and EFV.
Response from Combination Therapy in Integrase Inhibitor-Resistant Subjects
In the dosing-ranging Phase IIb study (ING112961; Section 2.3.6), which evaluated DTG 50 mg once daily (n=27) and 50 mg twice daily doses (n=24), the univariate logistic regression using pooled data from both cohorts identified C0 and C as statistically significant predictors for virological response (i.e., plasma HIV RNA <50 c/mL based on TLOVR) at Week 48 (p<0.05). However, multivariate analysis performed at Week 24 showed that PSS to Day11 OBR and Baseline CD4+ cell count are statistically significant predictors of Week 24 response, while the effect of DTG C0 was not statistically
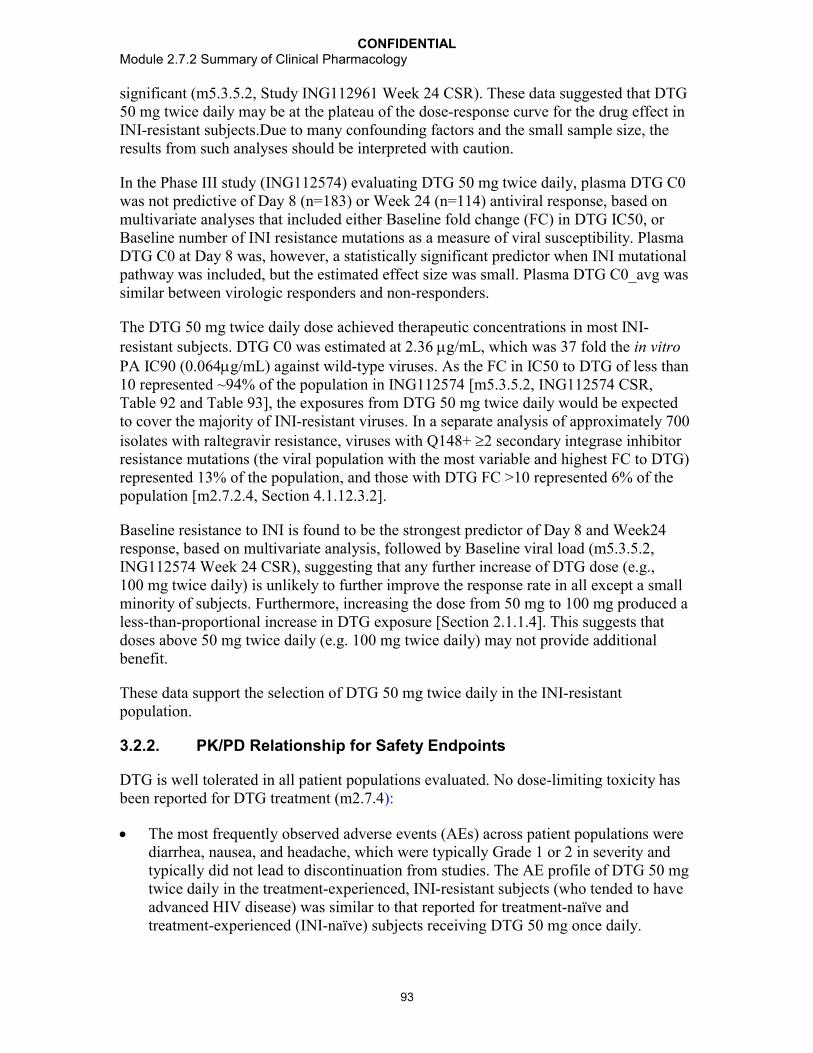
CONFIDENTIALModule 2.7.2 Summary of Clinical Pharmacology
93
significant (m5.3.5.2, Study ING112961 Week 24 CSR). These data suggested that DTG 50 mg twice daily may be at the plateau of the dose-response curve for the drug effect in INI-resistant subjects.Due to many confounding factors and the small sample size, the results from such analyses should be interpreted with caution.
In the Phase III study (ING112574) evaluating DTG 50 mg twice daily, plasma DTG C0was not predictive of Day 8 (n=183) or Week 24 (n=114) antiviral response, based on multivariate analyses that included either Baseline fold change (FC) in DTG IC50, or Baseline number of INI resistance mutations as a measure of viral susceptibility. Plasma DTG C0 at Day 8 was, however, a statistically significant predictor when INI mutational pathway was included, but the estimated effect size was small. Plasma DTG C0_avg was similar between virologic responders and non-responders.
The DTG 50 mg twice daily dose achieved therapeutic concentrations in most INI-resistant subjects. DTG C0 was estimated at 2.36 g/mL, which was 37 fold the in vitroPA IC90 (0.064g/mL) against wild-type viruses. As the FC in IC50 to DTG of less than 10 represented ~94% of the population in ING112574 [m5.3.5.2, ING112574 CSR, Table 92 and Table 93], the exposures from DTG 50 mg twice daily would be expected to cover the majority of INI-resistant viruses. In a separate analysis of approximately 700 isolates with raltegravir resistance, viruses with Q148+ 2 secondary integrase inhibitor resistance mutations (the viral population with the most variable and highest FC to DTG)represented 13% of the population, and those with DTG FC >10 represented 6% of the population [m2.7.2.4, Section 4.1.12.3.2].
Baseline resistance to INI is found to be the strongest predictor of Day 8 and Week24 response, based on multivariate analysis, followed by Baseline viral load (m5.3.5.2, ING112574 Week 24 CSR), suggesting that any further increase of DTG dose (e.g.,100 mg twice daily) is unlikely to further improve the response rate in all except a small minority of subjects. Furthermore, increasing the dose from 50 mg to 100 mg produced a less-than-proportional increase in DTG exposure [Section 2.1.1.4]. This suggests that doses above 50 mg twice daily (e.g. 100 mg twice daily) may not provide additional benefit.
These data support the selection of DTG 50 mg twice daily in the INI-resistant population.
3.2.2. PK/PD Relationship for Safety Endpoints
DTG is well tolerated in all patient populations evaluated. No dose-limiting toxicity has been reported for DTG treatment (m2.7.4):
The most frequently observed adverse events (AEs) across patient populations were diarrhea, nausea, and headache, which were typically Grade 1 or 2 in severity and typically did not lead to discontinuation from studies. The AE profile of DTG 50 mgtwice daily in the treatment-experienced, INI-resistant subjects (who tended to have advanced HIV disease) was similar to that reported for treatment-naïve and treatment-experienced (INI-naïve) subjects receiving DTG 50 mg once daily.

CONFIDENTIALModule 2.7.2 Summary of Clinical Pharmacology
94
Treatment emergent liver chemistry elevations (Grade 3 or 4 per Division of AIDS criteria) for DTG-containing regimens was low, in general, related to alternative causes in most cases (e.g., HCV or HBV acute or chronic co-infection, co-administered medications), comparable between DTG 50 mg once daily and DTG 50 mg twice daily dosing regimens, and comparable (RAL) or lower (EFV-containing regimens) than observed for the comparators.
A modest (approximately 10%), non-progressive increase in serum creatinine levels was observed upon DTG treatment in Phase I/II/III clinical studies, which is related to a benign effect of DTG on creatinine secretion with blockade of OCT2 transporter (Section 3.4.1), with no effect on renal functions such as GFR and ERPF (Section 2.2.2.2).
A small percentage of subjects not receiving co-administered ATV or ATV/RTV were noted to have modest total bilirubin elevations, likely related to competitive use of a common metabolic pathway (UGT1A1) by unconjugated bilirubin and DTG.
PK/PD analysis for safety measures performed in Phase IIb/III revealed the following results:
In treatment-naïve populations (ING112276 and ING113086):
There was no statistically significant correlation (p>0.05) between DTG exposure and occurrence of the most common AEs: diarrhea, headache, nausea, abdominal pain, and vomiting.
There was a positive correlation between DTG dose/exposure and increase in serum creatinine from Baseline.
There was a positive correlation between DTG exposure and increase from Baseline in total bilirubin.
There was a negative correlation between DTG exposure and increase from Baseline in ALT found in ING112276, however such correlation was not found in ING113086.
In treatment-experienced populations (ING112961, ING112574, and ING111762):
In all three studies, there was no correlation between DTG C0_avg and occurrence of the top three most common AEs: diarrhoea, headache, or nausea.
In the treatment-experienced and INI-naïve study (ING111762),
There was no statistically significant correlation between DTG C0_avg and change from Baseline in clinical laboratory measures including ALT and the urine albumin/serum creatinine ratio.
There was a positive correlation between DTG C0_avg and increase from Baseline in total bilirubin for subjects not receiving ATV or ATV/RTV.
There was a positive correlation between DTG C0_avg and increase from Baseline in serum creatinine.

CONFIDENTIALModule 2.7.2 Summary of Clinical Pharmacology
95
In the treatment-experienced and INI-resistant studies (ING112961 and ING112574), there was no correlation between DTG C0_avg and change from Baseline in clinical laboratory measures including ALT, total bilirubin, serum creatinine, creatinine clearance, and the urine albumin/serum creatinine ratio.
Overall, there was no relationship found between DTG dose or exposure and the most common AEs and clinical laboratory measures, except for change from Baseline in total bilirubin and serum creatinine, which would be anticipated based on the likely mechanisms of action. The lack of association between DTG exposure and the most commons AEs including diarrhea, nausea, and headache, suggested that these AEs were not related to the systemic exposure of DTG. The correlation between DTG exposure and the increase in serum creatinine is consistent with the known inhibition of OCT2 transporter by DTG. The correlation between DTG exposure and change from Baseline in total bilirubin is likely due to competition for the UGT1A1 enzyme due to a shared metabolic pathway with unconjugated bilirubin. However, due to the small magnitude of changes in these clinical lab measures and the lack of progression in the creatinine or bilirubin increases, these PK/PD relationships are not considered clinically relevant.
The results from the PK/PD analysis for safety support the recommended DTG doses in various patient populations.
3.2.3. Definition of No Effect Boundaries of Alteration in DTG Exposure
PK/PD relationships for efficacy and safety of DTG not only support the dose recommendation in various patient populations but also help to define the “no effect boundaries” of alteration in DTG exposure due to effect of various intrinsic or extrinsic factors (e.g., drug interaction, special population, age, race). The PK/PD relationship for efficacy defines the lower bound, and the PK/PD relationship for safety defines the upper bound. These “no effect boundaries” were used as justification for recommendations on whether dose adjustment was needed because of drug interactions or the impact of other intrinsic or extrinsic factors on DTG PK. The lower boundary is proposed to be 75% reduction in DTG C based on efficacy, and currently the upper boundary cannot be determined due to good safety and tolerability profiles of DTG. The rationale for defining these boundaries are presented in this section.
3.2.3.1. Lower Boundary Based on Efficacy
For the INI class, available data suggest that C is the primary PK parameter associated with efficacy. This is further supported by a PK/PD analysis using pooled data from 10-day monotherapy with several INIs including raltegravir, elvitegravir, GSK1265744, and GSK1364735 [Song, 2010]. In addition, the long-term clinical data on raltegravir 800 mg once daily compared to 400 mg twice daily support Ctrough as the driver for antiviral activity for raltegravir. Study QDMRK showed raltegravir 800 mg once daily was inferior to 400 mg twice daily in combination with NRTIs in treatment-naïve subjects,based on Week 48 analyses, suggesting C is the primary driver for long-term efficacyfor raltegravir [Eron, 2011]. As C is likely the driver for DTG antiviral activity, the lower boundary was targeted at C.

CONFIDENTIALModule 2.7.2 Summary of Clinical Pharmacology
96
After 10-day monotherapy with DTG, Day11 antiviral response was found best associated with DTG C using an Emax model (Figure 6). Based on this model, EC90 is estimated at 0.32 g/mL.
No PK/PD relationship was observed for DTG doses from 10 to 50 mg once daily in combination with NRTI backbones in treatment-naïve trials (ING112276 and ING113086). In ING112276, the 10 mg once daily dose of DTG demonstrated similar efficacy as the 50 mg once daily dose at 48 and 96 weeks. These data suggested that the drug effect of DTG doses from 10 mg to 50 mg once daily in combination with other active drugs are on the plateau of the dose-response curve for INI-naïve subjects.
DTG exposure observed at 10 mg once daily (0.30 g/mL for C) is considered as the lower boundary (for INI-naïve population). This value is also equivalent to the EC90 estimate (0.32 g/mL), based on the Emax model from the PK/PD analysis using 10-day monotherapy data. As DTG C at 10 mg (0.30 g/mL) is 25% of that observed at 50 mgonce daily (1.20 g/mL) in ING112276 (Section 2.3.4), a reduction of <75% in DTG exposure (from 50 mg once daily) is not considered clinically significant (“no effect”)when considering whether the presence of a factor (e.g., covariate, drug interaction, etc) requires a dose adjustment. Therefore, the lower “no effect boundary” is defined as 25%of DTG C at 50 mg once daily or 0.30 g/mL. Taking into the account of variability, if 90% confidence intervals of the effect (GMR) on DTG C caused by any intrinsic or extrinsic factor is completely above 0.25, the effect of that factor is not considered clinically significant, and DTG dose adjustment by that factor is not necessary.
3.2.3.2. Upper Boundary Based on Safety
DTG is well tolerated in HIV-infected subjects, no dose-limiting toxicity has been observed, and there was no apparent difference in safety profiles across DTG doses evaluated in Phase III studies (m2.5, Section 5). Therefore, an upper limit of exposurethat has been associated with an increase incidence of AEs or significant clinical chemistry toxicity has not been identified. A wide range of exposures was observed with 50 mg once daily and twice daily dosing in various Phase II/III studies; however, PK/PD analyses did not identify an association between plasma exposure and any safety parameter.
The only drug known to significantly increase DTG plasma concentration by up to 2-fold is ATV, an inhibitor of UGT1A1. ATV or ATV/RTV has been used with DTG in ING111762 (n=51 out of 362 DTG subjects included in the Week 24 analysis), and in a small number of subjects in ING112574 (n=3 out of 114 subjects included in the Week24 analysis). DTG exposures in subjects on ATV or ATV/RTV in these Phase III studieswas about 2-fold higher than those observed in subjects who were not on inducers, ATV,or ATV/RTV. No increased toxicity has been observed in these subjects. Based on these data, no dosage reduction in DTG is required due to drug interactions or covariates that increase DTG exposure.
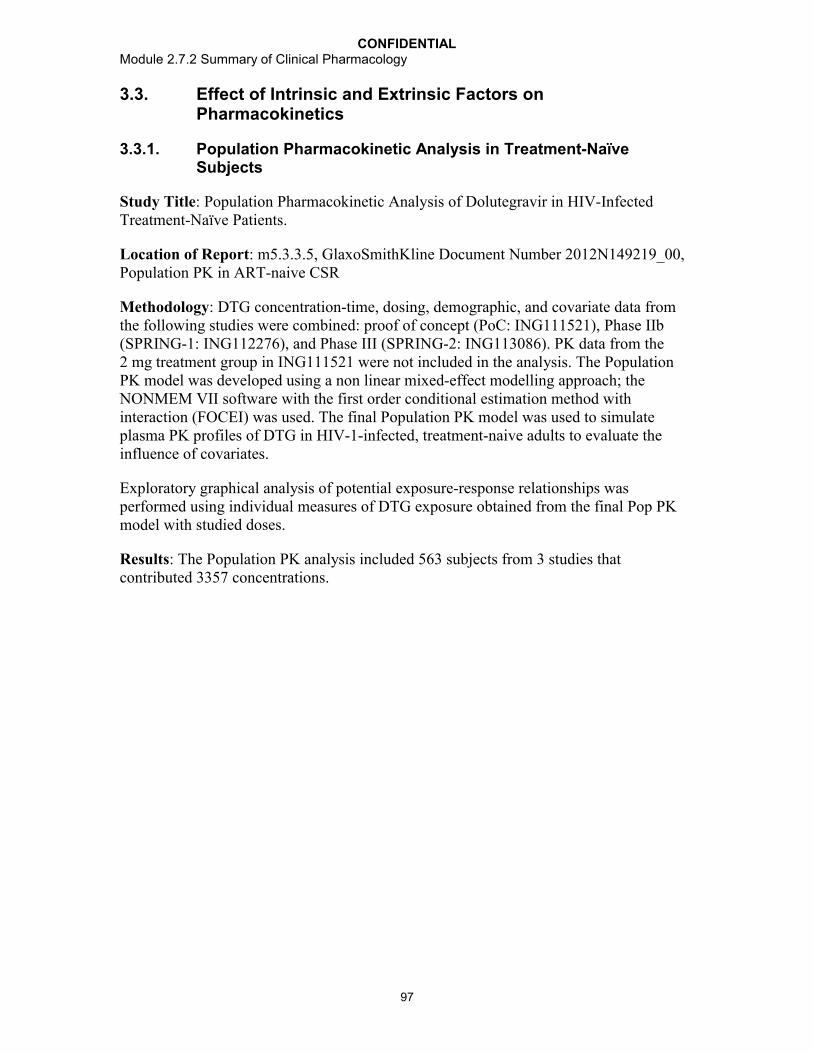
CONFIDENTIALModule 2.7.2 Summary of Clinical Pharmacology
97
3.3. Effect of Intrinsic and Extrinsic Factors on Pharmacokinetics
3.3.1. Population Pharmacokinetic Analysis in Treatment-Naïve Subjects
Study Title: Population Pharmacokinetic Analysis of Dolutegravir in HIV-Infected Treatment-Naïve Patients.
Location of Report: m5.3.3.5, GlaxoSmithKline Document Number 2012N149219_00, Population PK in ART-naive CSR
Methodology: DTG concentration-time, dosing, demographic, and covariate data from the following studies were combined: proof of concept (PoC: ING111521), Phase IIb (SPRING-1: ING112276), and Phase III (SPRING-2: ING113086). PK data from the 2 mg treatment group in ING111521 were not included in the analysis. The Population PK model was developed using a non linear mixed-effect modelling approach; the NONMEM VII software with the first order conditional estimation method with interaction (FOCEI) was used. The final Population PK model was used to simulate plasma PK profiles of DTG in HIV-1-infected, treatment-naive adults to evaluate the influence of covariates.
Exploratory graphical analysis of potential exposure-response relationships was performed using individual measures of DTG exposure obtained from the final Pop PK model with studied doses.
Results: The Population PK analysis included 563 subjects from 3 studies that contributed 3357 concentrations.

CONFIDENTIALModule 2.7.2 Summary of Clinical Pharmacology
98
Table 48 Covariate Distributions (Treatment-naive)
Covariate Statistic or category
All Subjects (n=563)
Age (yrs) at baseline Median [Min-Max] 37 [18-68]Weight (kg) at baseline Median [Min-Max] 74.5 [39.0-135]Body mass index (kg/m2) at baseline
Median [Min-Max]24.2 [14.7-47.9]
Body surface area (m2) at baseline
Median [Min-Max]1.92 [1.27-2.69]
Total bilirubin (µmol/L) at baseline
Median [Min-Max]9.00 [3.00-38.0]
Albumin (g/L) at baseline Median [Min-Max] 45.0 [30.0-54.0]Aspartate aminotransferase (IU/L) at baseline
Median [Min-Max]24.0 [11.0-180]
Alanine aminotransferase (IU/L) at baseline
Median [Min-Max]21.0 [5.00-260]
Creatinine clearance (mL/min) at baseline
Median [Min-Max]121 [54.6-239]
Gender N (%) Male Female
481 (85)82 (15)
Race N (%) CaucasianBlackAsianOther
470 (83)66 (12)6 (1)21 (4)
Ethnicity N (%) Non-Hispanic or LatinoHispanic or Latino
497 (88)66 (12)
Smoking N (%) NeverCurrentFormerUnknown
235 (42)236 (42)73 (13)19 (3)
CDC classification of HIV infection N (%) at baseline
ABC
490 (87)62 (11)11 (2)
Formulation N (%) ALAPAW
68 (12)92 (16)403 (72)
Dose (mg) N (%) 102550
58 (10)46 (8)459 (82)
Data Source: m5.3.3.5, Population PK in ART-naive, Table 4-1.
The PK of DTG following oral administration was adequately described by a linear one-compartment model with first-order absorption and absorption lag-time and first-order elimination, with inter-individual variability (IIV) in apparent clearance (CL/F), apparent volume of distribution (V/F) and first-order absorption (KA) and inter-occasion variability (IOV) in CL/F.
CL/F=0.901·(WT/70)0438·(AGE/40)0.193·(BILI/9)-0.211 for non-smoking subjects
CL/F=0.901·(WT/70)0.438·(AGE/40)0.193·(BILI/9)-0.211·1.16 for smoking subjects

CONFIDENTIALModule 2.7.2 Summary of Clinical Pharmacology
99
V/F=17.4·(WT/70)0.768
Bioavailability (F) =1 for males and =1.21 for females
Table 49 Parameter Estimates of Final DTG Population PK Model (Treatment-Naïve)
Parameter[Units]
NONMEM Estimates Bootstrap Estimatesa
Point Estimate %RSE 95% CI Median 95% CI
CL/F [L/h] 0.901 2.11 0.864-0.938 0.901 0.866-0.940V/F [L] 17.4 2.49 16.5-18.3 17.4 16.6-18.2KA [h-1] 2.24 15.4 1.56-2.92 2.21 1.73-3.10ALAG [h] 0.263 32.7 0.0942-0.432 0.262 0.0833-0.393CL/F~PoC 1.35 4.83 1.22-1.48 1.35 1.24-1.51F~10 mg 1.24 2.92 1.17-1.31 1.24 1.17-1.31CL/F~WT 0.438 16.9 0.293-0.583 0.440 0.290-0.582V/F~WT 0.768 10.8 0.605-0.931 0.774 0.616-0.944F~GEND 1.21 3.27 1.13-1.29 1.21 1.13-1.30CL~SMOK 1.16 2.45 1.10-1.22 1.16 1.10-1.22CL~AGE 0.193 23.7 0.103-0.283 0.195 0.105-0.283CL~BILI -0.211 14.0 -0.269- -0.153 -0.212 -0.267- -0.152Inter-individual or inter-occasion variability CV%*
2CL 0.0551 9.27 0.0451-0.0651 23.5 0.0539 0.0449-0.0652
2V 0.0188 29.5 0.00794-0.0297 13.7 0.0182 0.00714-0.0295
2KA 0.224 38.8 0.0535-0.395 50.1 0.217 0.0613-1.11
2IOV-CL 0.0296 15.6 0.0205-0.0387 17.2 0.0300 0.0184-0.0407
Residual variability CV% Median 95% CI
2prop 0.0704 7.41 0.0602-0.0806 31.3 0.0698 0.0555-0.0830
a. From 1000 completed bootstrap runs.Abbreviations: %RSE: percent relative standard error of the estimate = SE/parameter estimate * 100, 95% CI= 95% confidence interval on the parameter, CL/F = apparent clearance, V/F = volume of central compartment, KA = absorption rate constant, ALAG = absorption lag-time, 2CL, 2V, and 2KA = variance of random effect of CL/F, V/F, and KA, respectively, CV = Coefficient of variation of proportional error (=[2prop]0.5*100), 2prop = proportional component of the residual error model, IOV = Inter-occasion variability. The reference population for PK parameters CL/F and V/F are 40 year old, 70 kg male, non-current smoker, with total bilirubin of 9 µmol/L.
* 2
1P
PTVCV e when 2P exceeds 0.15
Data source: Population PK in ART-naive, Table 4-3.
Weight, smoking status, age, and total bilirubin were predictors of CL/F, and gender was a predictor of bioavailability (F). Following the same dosing regimen, females would have 21% (95% CI: 13-29%) higher F compared to males, and current smokers would have 16% (95% CI: 10-22%) higher CL/F compared to non-current smokers. CL/F andV/F increased with body weight. For the range of weights in the analysis (39-135 kg), CL/F ranged from 23% lower to 33% higher and V/F ranged from 36% lower to 66% higher than for 70-kg individuals. CL/F increased with age. For the range of age in the analysis (18-68 yrs), CL/F ranged from 14% lower to 11% higher compared to a 40 yr old subject. Only one subject was >65 years old. CL/F decreased with total bilirubin. For the range of total bilirubin in the analysis (3-38 µmol/L), CL/F ranged from 26% higher to 26% lower compared to a subject with total bilirubin of 9 µmol/L.
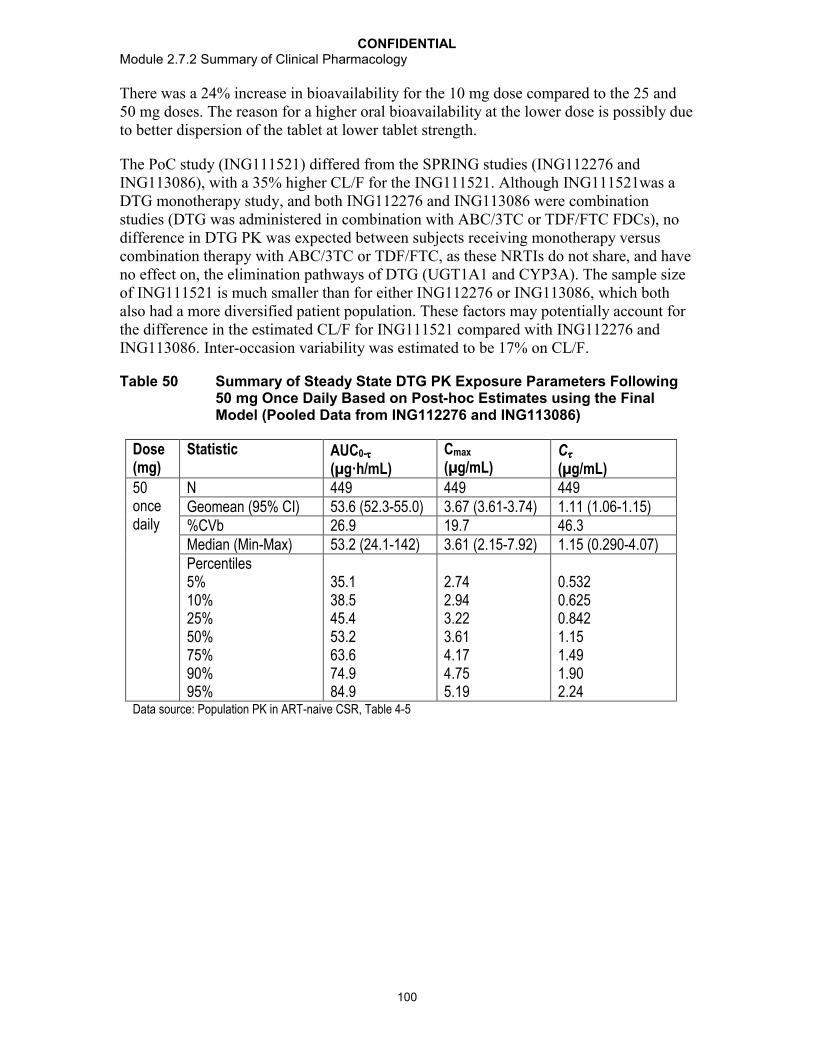
CONFIDENTIALModule 2.7.2 Summary of Clinical Pharmacology
100
There was a 24% increase in bioavailability for the 10 mg dose compared to the 25 and 50 mg doses. The reason for a higher oral bioavailability at the lower dose is possibly due to better dispersion of the tablet at lower tablet strength.
The PoC study (ING111521) differed from the SPRING studies (ING112276 andING113086), with a 35% higher CL/F for the ING111521. Although ING111521was a DTG monotherapy study, and both ING112276 and ING113086 were combination studies (DTG was administered in combination with ABC/3TC or TDF/FTC FDCs), no difference in DTG PK was expected between subjects receiving monotherapy versus combination therapy with ABC/3TC or TDF/FTC, as these NRTIs do not share, and have no effect on, the elimination pathways of DTG (UGT1A1 and CYP3A). The sample size of ING111521 is much smaller than for either ING112276 or ING113086, which both also had a more diversified patient population. These factors may potentially account for the difference in the estimated CL/F for ING111521 compared with ING112276 andING113086. Inter-occasion variability was estimated to be 17% on CL/F.
Table 50 Summary of Steady State DTG PK Exposure Parameters Following 50 mg Once Daily Based on Post-hoc Estimates using the Final Model (Pooled Data from ING112276 and ING113086)
Dose (mg)
Statistic AUC0-
(µg·h/mL)Cmax
(µg/mL)C
(µg/mL)50once daily
N 449 449 449Geomean (95% CI) 53.6 (52.3-55.0) 3.67 (3.61-3.74) 1.11 (1.06-1.15)%CVb 26.9 19.7 46.3Median (Min-Max) 53.2 (24.1-142) 3.61 (2.15-7.92) 1.15 (0.290-4.07)Percentiles5%10%25%50%75%90%95%
35.138.545.453.263.674.984.9
2.742.943.223.614.174.755.19
0.5320.6250.8421.151.491.902.24
Data source: Population PK in ART-naive CSR, Table 4-5
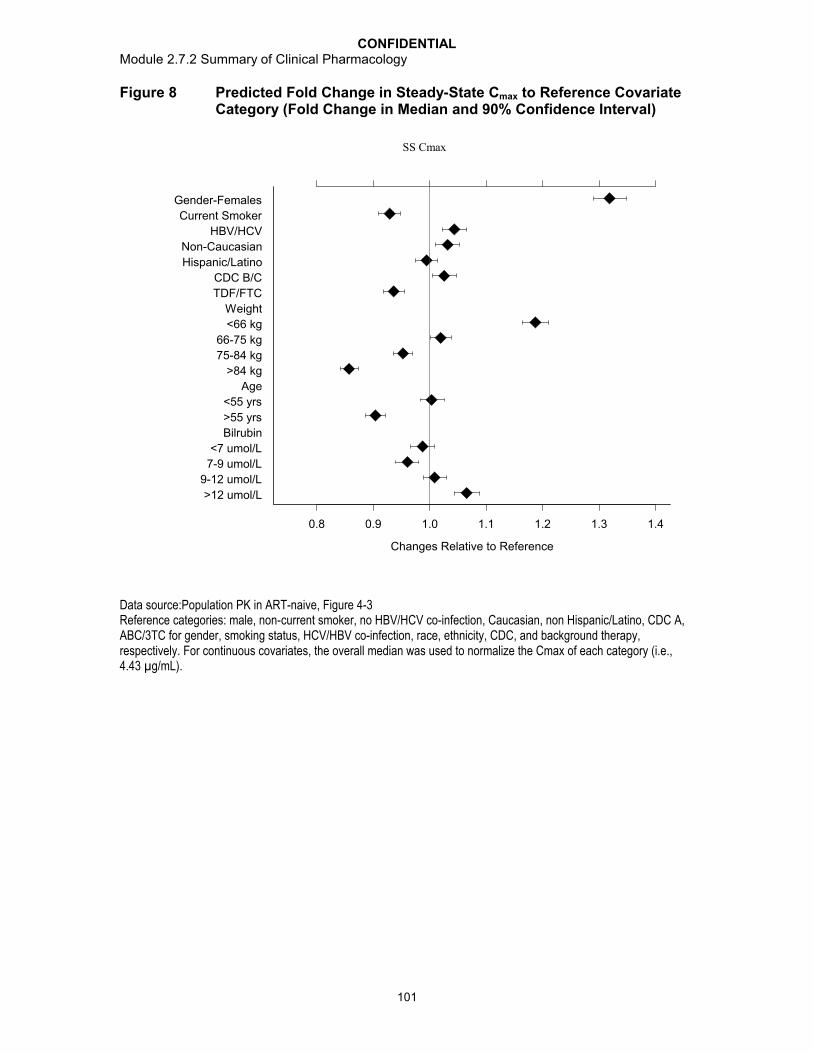
CONFIDENTIALModule 2.7.2 Summary of Clinical Pharmacology
101
Figure 8 Predicted Fold Change in Steady-State Cmax to Reference Covariate Category (Fold Change in Median and 90% Confidence Interval)
>12 umol/L
9-12 umol/L
7-9 umol/L
<7 umol/L
Bilrubin
>55 yrs
<55 yrs
Age
>84 kg
75-84 kg
66-75 kg
<66 kg
Weight
TDF/FTC
CDC B/C
Hispanic/Latino
Non-Caucasian
HBV/HCV
Current Smoker
Gender-Females
0.8 0.9 1.0 1.1 1.2 1.3 1.4
Changes Relative to Reference
SS Cmax
Data source:Population PK in ART-naive, Figure 4-3Reference categories: male, non-current smoker, no HBV/HCV co-infection, Caucasian, non Hispanic/Latino, CDC A, ABC/3TC for gender, smoking status, HCV/HBV co-infection, race, ethnicity, CDC, and background therapy, respectively. For continuous covariates, the overall median was used to normalize the Cmax of each category (i.e., 4.43 µg/mL).

CONFIDENTIALModule 2.7.2 Summary of Clinical Pharmacology
102
Figure 9 Predicted Fold Change in Steady-State AUC to Reference Covariate Category (Fold Change in Median and 90% Confidence Interval)
>12 umol/L
9-12 umol/L
7-9 umol/L
<7 umol/L
Bilrubin
>55 yrs
<55 yrs
Age
>84 kg
75-84 kg
66-75 kg
<66 kg
Weight
TDF/FTC
CDC B/C
Hispanic/Latino
Non-Caucasian
HBV/HCV
Current Smoker
Gender-Females
0.8 0.9 1.0 1.1 1.2 1.3 1.4
Changes Relative to Reference
AUCss
Data source: Population PK in ART-naive, Figure 4-3Reference categories: male, non-current smoker, no HBV/HCV co-infection, Caucasian, non Hispanic/Latino, CDC A, ABC/3TC for gender, smoking status, HCV/HBV co-infection, race, ethnicity, CDC, and background therapy, respectively. For continuous covariates, the overall median was used to normalize AUC0- of each category (i.e., 52.8 µg·h/mL).

CONFIDENTIALModule 2.7.2 Summary of Clinical Pharmacology
103
Figure 10 Predicted Fold Change in Steady-State C to Reference Covariate Category (Fold Change in Median and 90% Confidence Interval)
>12 umol/L
9-12 umol/L
7-9 umol/L
<7 umol/L
Bilrubin
>55 yrs
<55 yrs
Age
>84 kg
75-84 kg
66-75 kg
<66 kg
Weight
TDF/FTC
CDC B/C
Hispanic/Latino
Non-Caucasian
HBV/HCV
Current Smoker
Gender-Females
0.8 0.9 1.0 1.1 1.2 1.3 1.4
Changes Relative to Reference
SS C
Data source: Population PK in ART-naive, Figure 4-3.Reference categories: male, non-current smoker, no HBV/HCV co-infection, Caucasian, non Hispanic/Latino, CDC A, ABC/3TC for gender, smoking status, HCV/HBV co-infection, race, ethnicity, CDC, and background therapy, respectively. For continuous covariates, the overall median was used to normalize the C of each category (i.e., 1.12 µg/mL).
The magnitude of effect of weight, age, gender, total bilirubin, and smoking status on CL/F, V/F, or F was relatively small (all less than 30%), and magnitude of effect on steady-state AUC0-, Cmax, and C of DTG was <32% (Figure 8). Based on the known safety profile and PK/PD relationship for antiviral activity of DTG, the likely range of DTG therapeutic effect encompasses these changes. Subgroup analysis on Week 48 antiviral response in ING113086 demonstrated that there were no effects of gender and age on response (m2.7.3). Thus, the effects of these covariates are not considered clinically significant.

CONFIDENTIALModule 2.7.2 Summary of Clinical Pharmacology
104
Conclusions:
Population Pharmacokinetic Modelling:
The PK of DTG in subjects with HIV following repeat-oral administration were adequately described by a one-compartment model with first-order absorption and absorption lag-time and first-order elimination.
Weight, smoking status, age, and total bilirubin were predictors of CL/F; weight was a predictor of V/F, and gender was a predictor of F. The effect of these covariates were not considered clinically significant, therefore, no DTG dose adjustment by these covariates is necessary.
For a typical 40 year old male, non-current smoker subject that weighed 70 kg with total bilirubin of 9 µmol/L, the estimated mean (95% CI) parameter values were: CL/F=0.901 (0.864, 0.938) L/h, V/F=17.4 (16.5, 18.3) L, KA=2.24 (1.56-2.92) h-1, and ALAG=0.263 (0.0942, 0.432) h.
Race/ethnicity, HCV co-infection, CDC classification, albumin, CrCL, ALT, or AST did not influence the PK of DTG in this analysis. There were limited PK data on subjects with HBV co-infection (n=8, 1%) and subjects of 65 years of age (n=1).
The PK of DTG were dose proportional for the range of doses between 25 and 50 mg, but a greater than dose-proportional PK was found at the 10 mg dose due to its 24% higher oral bioavailability compared to the 25 and 50 mg doses.
Inter-individual variability for CL/F and V/F was relatively low (23.5% and 13.7%),but was high for KA (50.1%).
Inter-occasion variability on CL/F was 17% over the course of studies.
Pharmacokinetic-Pharmacodynamic Relationship:
There was no correlation between DTG exposure (AUC0-, Cmax, and Cmin) and antiviral response and CD4+ cell count change from Baseline.
There was no correlation between DTG exposure (AUC0-, Cmax, and Cmin) and safety measures except for change from Baseline in serum creatinine and creatinine clearance. Change from Baseline in serum creatinine and creatinine clearance appeared correlated with DTG exposure, however, was not clinically significant due to the small magnitude.
3.3.2. Population Pharmacokinetic Analysis in Treatment-Experienced Subjects
Study Title: Population Pharmacokinetic Analysis of Dolutegravir in HIV-1 Infected Treatment-Experienced Adults
Location of Report: m5.3.3.5, GlaxoSmithKline Document Number 2012N149456_00, Population PK in ART-experienced CSR

CONFIDENTIALModule 2.7.2 Summary of Clinical Pharmacology
105
Methodology: DTG concentration-time, dosing, demographic, and covariate data from the following studies were combined: ING112961 (VIKING, Phase IIb raltegravir-resistant), ING112574 (VIKING-3, Phase III integrase inhibitor-resistant) and ING111762 (SAILING, Phase III, treatment-experienced and integrase inhibitor-naïve). The Population PK model was developed using a non-linear mixed-effect modelling approach; the NONMEM VII software with the first-order conditional estimation method with interaction (FOCEI) was used.
A Population PK model for DTG has been developed in HIV-1-infected, treatment-naïve adult subjects. The predictive performance of this previous model was evaluated by applying the final model to the current analysis population and re-estimating all model parameters. Backward deletion was performed to retain covariates that were significant in the current population. Structural model was also refined to ensure parameter identifiability in the current population. Investigation of additional covariate-parameter relationships was based on range of covariate values in the dataset, scientific interest, mechanistic plausibility, and exploratory graphics. The full model approach was implemented in stages, where time-varying concomitant medications considered to be potentially important from the exploratory graphics were entered in the model first. A backward deletion was once again implemented. The resultant semi-full model was subjected to further covariate screening where covariate-parameter relationship deemed potentially influential, based on the exploratory graphics, were entered into the model followed by backward deletion. Insignificant, or poorly estimated covariates (less than 10.83 points increase of objective function value upon covariate removal, and/or confidence interval includes the null value of the parameter, and/or the parameter is estimated with high % relative standard error), were eliminated from the model.
Once the final Population PK model was developed, the ability of the model to describe the observed data was investigated using a predictive check procedure. Precision of the parameter estimates were evaluated using a nonparametric bootstrap procedure.
The final Population PK model was used to simulate plasma PK profiles of DTG in HIV-1-infected, treatment-experienced adults to evaluate the influence of covariates and different dosing schedules.
Results: The population PK analysis included 574 subjects from 3 studies that contributed 2289 DTG concentrations.
Table 51 Covariate Distribution (Treatment-experienced)
Covariate Statistic or category All Subjects(N=574)
Age (yrs) at baseline Median [Min-Max] 45[19-69]
Weight (kg) at baseline Median [Min-Max] 72.0[32.0-163]
Body mass index (kg/m2) at baseline
Median [Min-Max] 24.4[12.7-53.6]
Body surface area (m2) at baseline
Median [Min-Max] 1.87[1.17-3.01]
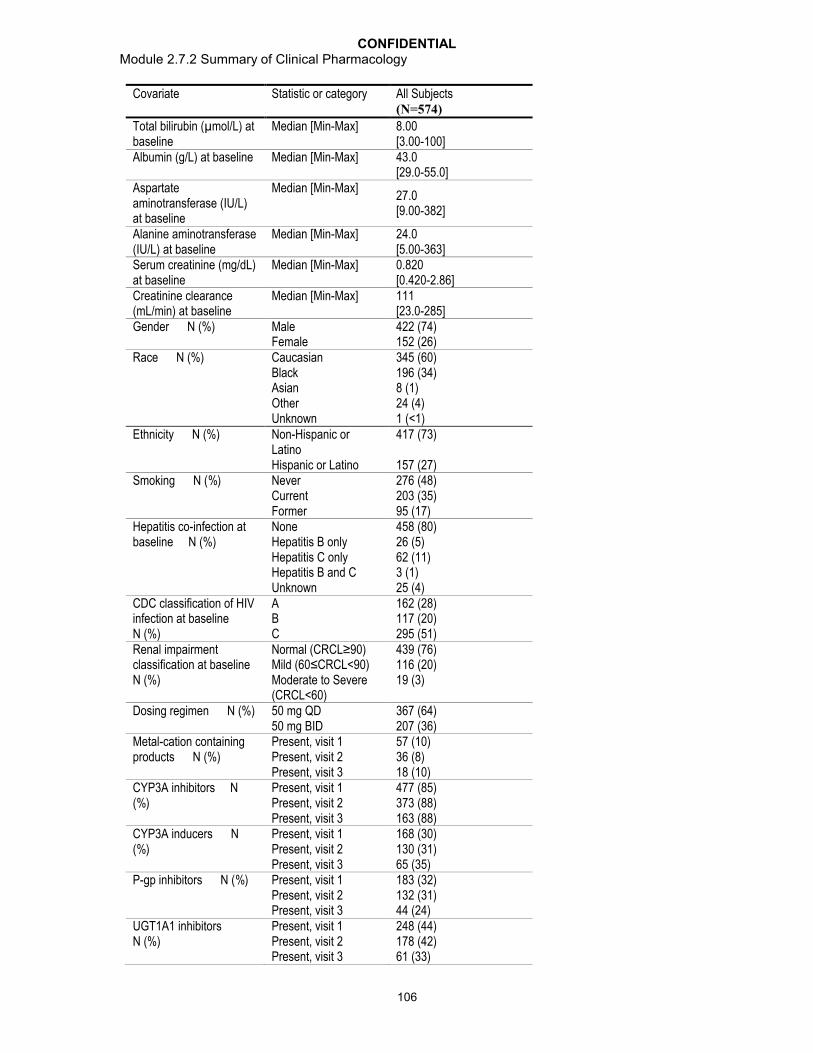
CONFIDENTIALModule 2.7.2 Summary of Clinical Pharmacology
106
Covariate Statistic or category All Subjects(N=574)
Total bilirubin (µmol/L) at baseline
Median [Min-Max] 8.00[3.00-100]
Albumin (g/L) at baseline Median [Min-Max] 43.0[29.0-55.0]
Aspartate aminotransferase (IU/L) at baseline
Median [Min-Max]27.0[9.00-382]
Alanine aminotransferase (IU/L) at baseline
Median [Min-Max] 24.0[5.00-363]
Serum creatinine (mg/dL) at baseline
Median [Min-Max] 0.820[0.420-2.86]
Creatinine clearance (mL/min) at baseline
Median [Min-Max] 111[23.0-285]
Gender N (%) Male Female
422 (74)152 (26)
Race N (%) CaucasianBlackAsianOtherUnknown
345 (60)196 (34)8 (1)24 (4)1 (<1)
Ethnicity N (%) Non-Hispanic or LatinoHispanic or Latino
417 (73)
157 (27)Smoking N (%) Never
CurrentFormer
276 (48)203 (35)95 (17)
Hepatitis co-infection at baseline N (%)
NoneHepatitis B onlyHepatitis C onlyHepatitis B and CUnknown
458 (80)26 (5)62 (11)3 (1)25 (4)
CDC classification of HIV infection at baseline N (%)
ABC
162 (28)117 (20)295 (51)
Renal impairment classification at baseline N (%)
Normal (CRCL≥90)Mild (60≤CRCL<90)Moderate to Severe (CRCL<60)
439 (76)116 (20)19 (3)
Dosing regimen N (%) 50 mg QD50 mg BID
367 (64)207 (36)
Metal-cation containing products N (%)
Present, visit 1Present, visit 2Present, visit 3
57 (10)36 (8)18 (10)
CYP3A inhibitors N (%)
Present, visit 1Present, visit 2Present, visit 3
477 (85)373 (88)163 (88)
CYP3A inducers N (%)
Present, visit 1Present, visit 2Present, visit 3
168 (30)130 (31)65 (35)
P-gp inhibitors N (%) Present, visit 1Present, visit 2Present, visit 3
183 (32)132 (31)44 (24)
UGT1A1 inhibitors N (%)
Present, visit 1Present, visit 2Present, visit 3
248 (44)178 (42)61 (33)

CONFIDENTIALModule 2.7.2 Summary of Clinical Pharmacology
107
Covariate Statistic or category All Subjects(N=574)
UGT1A3 inhibitors N (%)
Present, visit 1Present, visit 2Present, visit 3
192 (34)124 (29)33 (18)
Background ART as inhibitorsa N (%)
Present, visit 1Present, visit 2Present, visit 3
60 (11)37 (9)12 (6)
Background ART as inducersb N (%)
Mild, visit 1Mild, visit 2Mild, visit 3Moderate, visit 1Moderate, visit 2Moderate, visit 3
305 (54)246 (58)132 (71)31 (5)21 (5)9 (5)
Data Source: m5.3.3.5, Population PK in ART-experienced, Table 4-1. a. Background ART as inhibitors include atazanavir and atazanavir-ritonavir.b. Background ART as mild inducers represent any combination therapy
containing darunavir-ritonavir or fosamprenavir-ritonavir. Background ART as moderate inducers represent any combination therapy containing etravirine without ritonavir-boosted protease inhibitors, efavirenz without ritonavir-boosted protease inhibitors, or tipranavir-ritonavir.
The PK of DTG following oral administration was adequately described by a linear one-compartment model with first-order absorption, absorption lag-time and first-order elimination, with inter-individual variability (IIV) and inter-occasion variability (IOV) in apparent clearance (CL/F).
CL/F = 1.05 1.16SMOKC 1.26INDMI 1.73INDMO 0.576INH (WT/70)0.395 (ALBU/43)-0.592 where SMOKC=1 for current smokers and =0 for non-current smokers; INDMI=1 for mild inducers (DRV/r or FPV/r) as part of background ART and =0 for none; INDMO=1 for moderate inducers (TPV/r, ETR without PI/r, and EFV without PI/r)as part of background ART and =0 for none; INH=1 for inhibitors (ATV or ATV/r) as part of background ART and =0 for none;
V/F=19.9 (WT/70)0.697 (ALBU/43)-0.592
F=1.18GEND 0.846MCAT where GEND=1 for females and =0 for males; MCAT=1 for metal-cation containing products and =0 for none.

CONFIDENTIALModule 2.7.2 Summary of Clinical Pharmacology
108
Table 52 Parameter Estimates of Final DTG Population PK Model (Treatment-Experienced)
Parameter[Units]
NONMEM Estimates Bootstrap Estimatesa
Point Estimate %RSE 95% CI Median 95% CI
CL/F [L/hr] 1.05 3.25 0.983-1.12 1.04 0.974-1.12V/F [L] 19.9 2.60 18.9-20.9 19.8 18.3-21.2Ka [hr-1] 2.35 11.2 1.83-2.87 2.30 1.81-3.16ALAG [hr] 0.333 FIX - - - -CL/F~WT 0.395 20.1 0.240-0.550 0.398 0.236-0.567V/F~WT 0.697 12.3 0.530-0.864 0.716 0.496-0.953CL/F~SMOKC 1.16 3.35 1.08-1.24 1.16 1.08-1.24F~GEND 1.18 3.67 1.10-1.26 1.17 1.09-1.27F~MCAT 0.846 6.57 0.737-0.955 0.841 0.752-0.955CL/F~INDMI 1.26 3.16 1.18-1.34 1.26 1.18-1.34CL/F~INDMO 1.73 7.46 1.48-1.98 1.73 1.50-2.01CL/F~INH 0.576 4.64 0.524-0.628 0.578 0.521-0.630CL/F, V/F~ALBU -0.592 29.2 -0.931 - -0.253 -0.596 -0.944 - -0.249
Inter-individual or inter-occasion variability CV%
2CL 0.0823 11.8 0.0632-0.101 28.7 0.0798 0.0609-0.100
2IOV-CL 0.0838 10.8 0.0661-0.101 28.9 0.0843 0.0642-0.105
Residual variability CV% Median 95% CI
2prop 0.0992 5.64 0.0882-0.110 31.5 0.0981 0.0881-0.110a. From 1000 bootstrap runs.Abbreviations: %RSE: percent relative standard error of the estimate = SE/parameter estimate * 100, 95% CI= 95% confidence interval on the parameter, CL/F = apparent clearance, V/F = apparent volume of central compartment, Ka = absorption rate constant, ALAG = absorption lag time, 2CL= variance of random effect of CL/F, CV = Coefficient of variation of proportional error (=[2prop]0.5*100), 2prop = proportional component of the residual error model, IOV = Inter-occasion variability, WT = Baseline weight (kg), ALBU = Baseline albumin (g/L). The reference population for PK parameters CL/F and V/F is 70 kg male, non-current smoker, not currently taking metal-cation containing medications, not receiving metabolic inducers as part of background ART, not receiving metabolic inhibitors as part of or background ART, with albumin of 43 g/L.Data Source:Population PK in ART-experienced, Table 4-3
Weight, smoking status, concomitant use of metabolic inducers as part of background ART classified by their level of induction, use of metabolic inhibitors as part of background ART, and albumin level were predictors of CL/F; weight and albumin were predictors of V/F; and gender and concomitant use of metal cation-containing products were predictors of F. CL/F of DTG was, on average, 16% (95% CI: 8-24%) higher in current smokers than non-current smokers. Subjects who were currently taking, or had taken, mild inducers as part of background ART within the previous two weeks would have 26% (95% CI: 18-34%) higher CL/F compared to those without inducers in their background ART. This increase in CL/F was more pronounced for moderate inducers, at 73% (95% CI: 48-98%) higher than non-users. On the contrary, subjects who were currently taking metabolic inhibitors as part of background ART would have 42% (95% CI: 37-48%) lower CL/F compared to non-users. CL/F and V/F increased with body weight. For the range of weights in the analysis (32-163 kg), CL/F ranged from 27% lower to 40% higher, and V/F ranged from 42% lower to 80% higher, than for 70 kg individuals. CL/F and V/F decreased with albumin to the same extent. For the range of albumin in the analysis (29-55 g/L), CL/F and V/F ranged from 14% lower to 26% higher compared to subjects with albumin of 43 g/L. Subjects who were concurrently taking
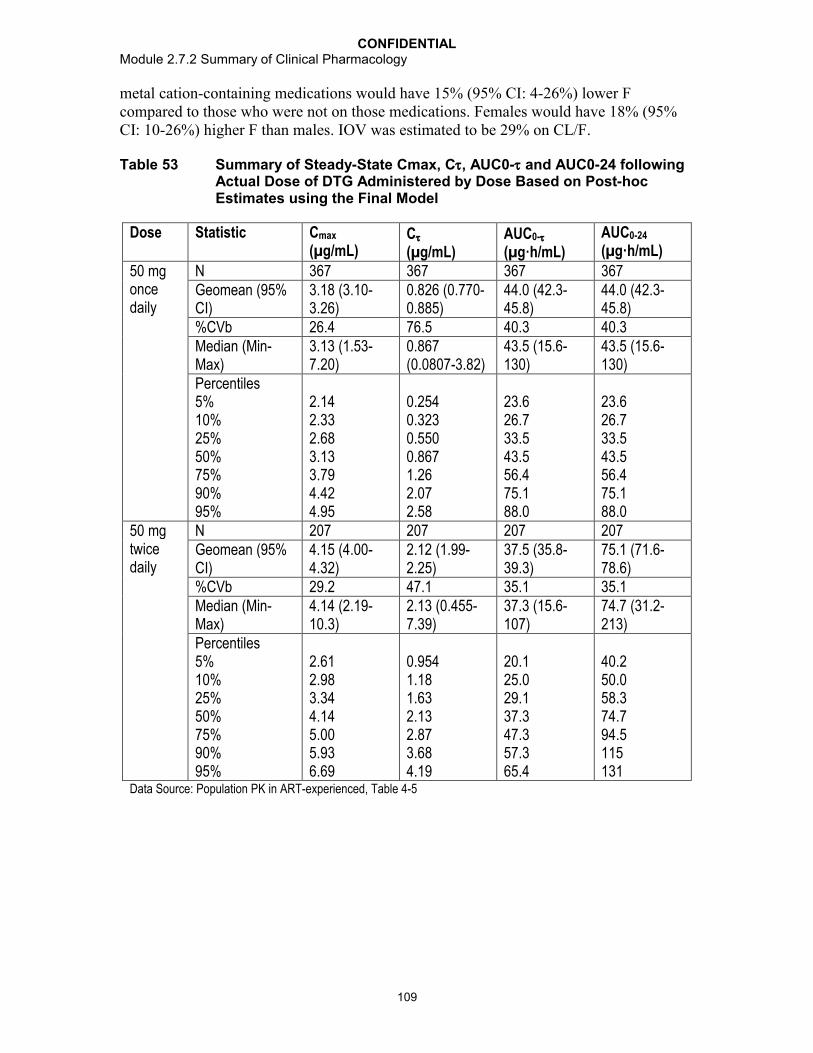
CONFIDENTIALModule 2.7.2 Summary of Clinical Pharmacology
109
metal cation-containing medications would have 15% (95% CI: 4-26%) lower F compared to those who were not on those medications. Females would have 18% (95% CI: 10-26%) higher F than males. IOV was estimated to be 29% on CL/F.
Table 53 Summary of Steady-State Cmax, C, AUC0- and AUC0-24 following Actual Dose of DTG Administered by Dose Based on Post-hoc Estimates using the Final Model
Dose Statistic Cmax
(µg/mL)C
(µg/mL)AUC0-
(µg·h/mL)AUC0-24
(µg·h/mL)
50 mg once daily
N 367 367 367 367Geomean (95% CI)
3.18 (3.10-3.26)
0.826 (0.770-0.885)
44.0 (42.3-45.8)
44.0 (42.3-45.8)
%CVb 26.4 76.5 40.3 40.3Median (Min-Max)
3.13 (1.53-7.20)
0.867 (0.0807-3.82)
43.5 (15.6-130)
43.5 (15.6-130)
Percentiles5%10%25%50%75%90%95%
2.142.332.683.133.794.424.95
0.2540.3230.5500.8671.262.072.58
23.626.733.543.556.475.188.0
23.626.733.543.556.475.188.0
50 mg twice daily
N 207 207 207 207Geomean (95% CI)
4.15 (4.00-4.32)
2.12 (1.99-2.25)
37.5 (35.8-39.3)
75.1 (71.6-78.6)
%CVb 29.2 47.1 35.1 35.1Median (Min-Max)
4.14 (2.19-10.3)
2.13 (0.455-7.39)
37.3 (15.6-107)
74.7 (31.2-213)
Percentiles5%10%25%50%75%90%95%
2.612.983.344.145.005.936.69
0.9541.181.632.132.873.684.19
20.125.029.137.347.357.365.4
40.250.058.374.794.5115131
Data Source: Population PK in ART-experienced, Table 4-5

CONFIDENTIALModule 2.7.2 Summary of Clinical Pharmacology
110
Figure 11 Predicted Fold-Change in Steady-State Cmax Relative to Reference Covariate Category (Fold-Change in Median and 90% Confidence Interval) – 50 mg Once Daily
>46 g/L
43-46 g/L
41-43 g/L
<41 g/L
Albumin
>82 kg
72-82 kg
62-72 kg
<62 kg
Weight
Inhibitors
Moderate Inducers
Mild Inducers
Background ART
Metal-Cation Medication
Current Smoker
Female
0.7 0.8 0.9 1.0 1.1 1.2 1.3 1.4 1.5 1.6
Changes Relative to Reference
Cmax50mg QD
Data Source: Population PK in ART-experienced, Figure 4-3Reference categories: male, non-current smoker, not currently taking metal cation-containing products or metabolic inducers or inhibitors as part of background ART for gender, smoking status, and concomitant medications, respectively. For continuous covariates, the overall median was used to normalize the Cmax (median=3.81 µg/mL of each category.
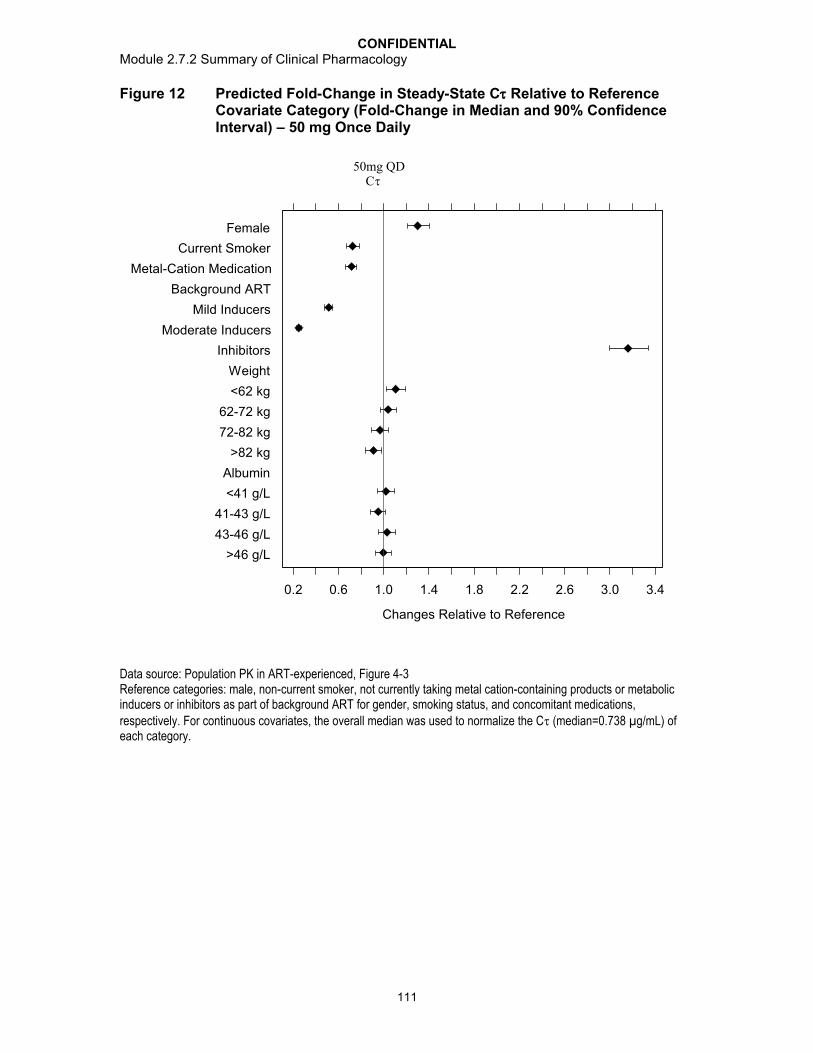
CONFIDENTIALModule 2.7.2 Summary of Clinical Pharmacology
111
Figure 12 Predicted Fold-Change in Steady-State C Relative to Reference Covariate Category (Fold-Change in Median and 90% Confidence Interval) – 50 mg Once Daily
>46 g/L
43-46 g/L
41-43 g/L
<41 g/L
Albumin
>82 kg
72-82 kg
62-72 kg
<62 kg
Weight
Inhibitors
Moderate Inducers
Mild Inducers
Background ART
Metal-Cation Medication
Current Smoker
Female
0.2 0.6 1.0 1.4 1.8 2.2 2.6 3.0 3.4
Changes Relative to Reference
C50mg QD
Data source: Population PK in ART-experienced, Figure 4-3Reference categories: male, non-current smoker, not currently taking metal cation-containing products or metabolic inducers or inhibitors as part of background ART for gender, smoking status, and concomitant medications, respectively. For continuous covariates, the overall median was used to normalize the C (median=0.738 µg/mL) of each category.
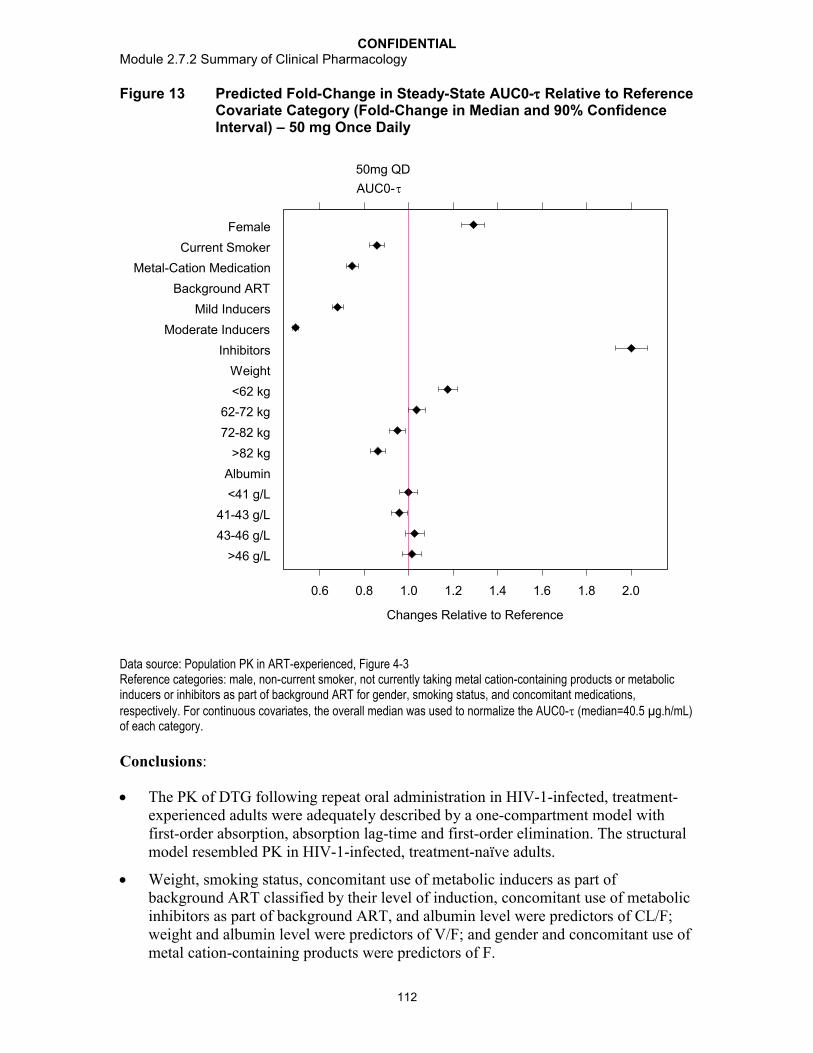
CONFIDENTIALModule 2.7.2 Summary of Clinical Pharmacology
112
Figure 13 Predicted Fold-Change in Steady-State AUC0- Relative to Reference Covariate Category (Fold-Change in Median and 90% Confidence Interval) – 50 mg Once Daily
>46 g/L
43-46 g/L
41-43 g/L
<41 g/L
Albumin
>82 kg
72-82 kg
62-72 kg
<62 kg
Weight
Inhibitors
Moderate Inducers
Mild Inducers
Background ART
Metal-Cation Medication
Current Smoker
Female
0.6 0.8 1.0 1.2 1.4 1.6 1.8 2.0
Changes Relative to Reference
AUC0-
50mg QD
Data source: Population PK in ART-experienced, Figure 4-3Reference categories: male, non-current smoker, not currently taking metal cation-containing products or metabolic inducers or inhibitors as part of background ART for gender, smoking status, and concomitant medications, respectively. For continuous covariates, the overall median was used to normalize the AUC0- (median=40.5 µg.h/mL) of each category.
Conclusions:
The PK of DTG following repeat oral administration in HIV-1-infected, treatment-experienced adults were adequately described by a one-compartment model with first-order absorption, absorption lag-time and first-order elimination. The structural model resembled PK in HIV-1-infected, treatment-naïve adults.
Weight, smoking status, concomitant use of metabolic inducers as part of background ART classified by their level of induction, concomitant use of metabolic inhibitors as part of background ART, and albumin level were predictors of CL/F; weight and albumin level were predictors of V/F; and gender and concomitant use of metal cation-containing products were predictors of F.
CONFIDENTIALModule 2.7.2 Summary of Clinical Pharmacology
113
The effect of weight, gender, smoking status, albumin, and concomitant use of mild metabolic inducers as part of background ART, and concomitant use of metal cation-containing products are unlikely to be clinically significant due to the small magnitude of effects.
Moderate/strong metabolic inducers (TPV/RTV and EFV) increased and metabolic inhibitors (ATV or ATV/RTV) decreased DTG clearance significantly and the estimated effect size in the final model is similar to observed in Phase 1 studies.
For a typical 70-kg male, non-current smoker, not currently receiving metabolic inducers or inhibitors as part of background ART, not taking any metal cation-containing medications, with albumin of 43 g/L, the estimated mean (95% CI) parameter values were CL/F=1.05 (0.983, 1.12) L/hr, V/F=19.9 (18.9, 20.9) L, Ka=2.35 (1.83, 2.87) hr-1, and ALAG=0.333 (fixed) hr.
Race/ethnicity, HCV co-infection, CDC classification, mild to moderate renal impairment, CrCL, ALT, or AST did not influence the PK of DTG in this analysis.There were limited PK data on subjects with HBV co-infection (n=29, 5%) and subjects of 65 years of age (n=11, 2%).
The PK of DTG appeared to be dose proportional between 50 mg once daily and 50 mg twice daily regimens.
Inter-individual variability (IIV) for CL/F was relatively low (CV=28.7%). IIV for V/F and KA could not be estimated due to lack of PK samples during the absorption phase.
Inter-occasion variability on CL/F was moderate, at 29% over the course of studies in treatment-experienced subjects; however, it was higher than that estimated in treatment-naïve subjects (17%).
3.3.3. Study ING116265 (PGx Analysis)
Study Title: PGx432 Evaluation of the effect of UGT1A1 polymorphisms on dolutegravir PK: meta-analysis of Phase I studies ING111521, ING111603, ING111604, ING112934, ING113068, ING113096, ING114005, ING114819, ING113099
Location of Report: m5.3.5.3, Study ING116265
Study Design: The objective of this meta-analysis was to determine the effect of UGT1A1 genotypes on DTG PK and to explore the influence of CYP3A4, CYP3A5 and pregnane X receptor variants (NR1I2) in relation to DTG PK. Nine clinical pharmacology studies with DTG steady state PK data from 50 mg once daily, administered as a tablet formulation, were selected for inclusion in the analysis, and only data from subjects consented to PGx analyses were used.
DNA was extracted from venous blood collected from each consented subject for genotyping of the UGT1A1, CYP3A4, CYP3A5, and NR1I2 variants. UGT1A1 TA repeat genotyping was performed in a CLIA-certified laboratory (LabCorp, Durham, NC, USA).Control DNA samples known to carry specific UGT1A1 TA repeat genotypes were included to control for the detection of all four repeat alleles. Genotyping of the CYP3A4,
CONFIDENTIALModule 2.7.2 Summary of Clinical Pharmacology
114
CYP3A5, and NR1I2 variants was performed using the Affymetrix DMET-Plus array under research conditions (Gen-Probe, Manchester, UK). Control DNA samples known to carry CYP3A4, CYP3A5, and NR1I2 functional alleles were included to control for the detection of the various functional alleles.
DTG PK parameters, including CL/F, AUC(0-), and Cmax, were retrieved from each study and combined. Associations of DTG PK parameters with UGT1A1 star alleles and with known functional variants in genes from the CYP3A pathway were evaluated by analysis of covariance using a mixed effect model with covariates, study, and genetic marker as fixed effects, and subject as a random effect. Covariates evaluated included age, gender, and fasting status. UGT1A1 genotype was categorized into three groups; low, reduced, and normal UGT1A1 activity as predicted from the genotypes for the two UGT1A1 genetic markers evaluated. CYP3A4 and CYP3A5 genotype was categorized into two predicted functional enzyme activity groups: low/reduced activity vs. normal activity.
Results: A total of 89 unique individuals were included in the Genetic analysis population with both genetic and PK data: 37 with African American/African heritage, 5 were Asian, and 46 were White; 7 were Hispanic, while 82 were not Hispanic; and 11were female and 78 were male.
CL/F decreased 23%, while AUC(0-) and Cmax increased 31% and 22%, respectively, in subjects with low and reduced UGT1A1 activity compared to subjects with normal UGT1A1 activity.
CL/F decreased 32%, while AUC(0-) and Cmax increased 46% and 32%, respectively, in subjects with low UGT1A1 activity (*28/*28; *28/*37; *37/*37) compared to subjects with normal UGT1A1 activity(*1/*1, *1/*36).

CONFIDENTIALModule 2.7.2 Summary of Clinical Pharmacology
115
Table 54 Summary of PK Parameter Comparisons between UGT1A1 Predicted Enzyme Activity
PK Parameter
Geometric LS Mean
ComparisonGeometric Mean Ratio(92% CI)
Normal Activity (N=41)
Reduced Activity (N=40)
Low Activity (N=7)
CL/F (L/hr) 1.094 0.936 0.749 Low+Reduced vs Normal
0.765 (0.659-0.889)
Low vs Normal 0.684 (0.543-0.862)
AUC(0-)(g*h/mL)
45.7 53.4 66.8 Low+Reduced vs Normal
1.307 (1.125-1.518)
Low vs Normal 1.462 (1.160-1.842)
Cmax (g/mL) 3.45 3.89 4.57 Low+Reduced vs Normal
1.221 (1.063-1.402)
Low vs Normal 1.323 (1.068-1.638)
Source Data: m5.3.5.3, Study ING116265, Table 1.10From mixed effect model includes Predicted enzyme activity, Sex, and Study as fixed effect, and Subject as random effect. One subject had a genotype with metabolizer status as unknown.
DTG PK parameters were similar between CYP3A4 and CYP3A5 functional groups (low, reduced, and normal metabolizers). There were no statistically significant differences in PK parameters (CL/F, AUC, and Cmax) among the number of low activity or risk allele markers for UGT1A1, CYP3A4/5, and NR1I2.
It was also found that gender was a significant covariate in the analysis, with female subjects demonstrating ~30% lower CL/F than male subjects. Such a finding is consistent with historical DTG PK data.
The increased DTG exposure in UGT1A1 poor metabolizer is not considered clinically significant. This position is supported by the observation of no dose-limiting toxicities in dose-ranging Phase IIb studies as well as on-going Phase III studies. In addition, subjects receiving concomitant ATV or ATV/RTV have higher exposures but have not demonstrated an increase in toxicity to DTG.
Conclusions:
Subjects with genotypes conferring poor metabolizer status of UGT1A1 (*28/*28; *28/*37; *37/*37) had a 32% lower clearance, 46% higher AUC, and 32% higher Cmax of DTG compared to subjects with genotypes associated with normal UGT1A1 activity (*1/*1, *1/*36).
Subjects with genotypes conferring intermediate and poor metabolizer status of UGT1A1 had a 23% lower clearance of DTG and 31% higher AUC compared to subjects with genotypes associated with normal UGT1A1 activity.

CONFIDENTIALModule 2.7.2 Summary of Clinical Pharmacology
116
Polymorphisms in CYP3A4, CYP3A5 and NR1I2 were not associated with differences in the PK of DTG.
Increases in DTG exposure due to UGT1A1 polymorphisms are not considered clinically significant based on the accumulated safety data for DTG.
3.3.4. Summary
Effects of intrinsic and extrinsic factors on DTG PK were evaluated in either Phase Istudies or through population PK modelling, and findings are summarized here as well as in Figure 14:
Body size, age, gender, and smoking: these are statistically significant covariates of DTG CL/F, Vd/F, and/or F, but the effects are not considered clinically significant; no DTG dose adjustment according to these covariates is needed. Pharmacokinetic data of DTG in subjects of >65 years old are very limited;
Race: race (Caucasian, African American, and Japanese ancestry) or ethnicity(Hispanic/Latino or Not-Hispanic/Latino) has no effect on DTG PK parameters; no DTG dose adjustment according to race or ethnicity is needed;
Hepatic impairment: DTG PK are similar between healthy subjects and subjects with moderate hepatic impairment (Child-Pugh grade B) (Section 2.1.2.2); no DTG dose adjustment is needed in subjects with mild to moderate hepatic impairment (Child-Pugh grade A or B); the effect of severe hepatic impairment on the pharmacokinetics of DTG has not been studied;
Renal impairment: There is no clinically relavant difference in DTG PK in subjects with mild/moderate renal impairment (Section 3.3.2) or severe renal impairment (CrCL <30mL/min) (Section 2.1.2.3); no DTG dosage adjustment is needed for subjects with mild, moderate, and severe (CrCL<30mL /min, not on dialysis) renal impairment; currently there is no data on DTG PK in subjects on hemodialysisalthough no effect of hemodialysis on DTG PK is expected due to high protein binding of DTG in plasma;
UGT1A1 polymorphism: subjects with genotypes conferring poor metabolizer status of UGT1A1 (*28/*28; *28/*37; *37/*37) had a 32% lower clearance, 46% higher AUC, and 32% higher Cmax of DTG compared to subjects with genotypes associated with normal UGT1A1 activity (*1/*1, *1/*36). Increases in DTG exposure due to UGT1A1 polymorphisms are not considered clinically significant.No DTG dose adjustment according to UGT1A1 polymorphism is needed;
HBV/HCV Co-infection: HCV co-infection has no effect on DTG PK exposure. There were limited PK data for subjects with HBV co-infection. There is no drug interaction between DTG and commonly/recently approved drugs for the treatment of HBV or HCV (Section 3.4). DTG can be used in HBV or HCV co-infected subjects.

CONFIDENTIALModule 2.7.2 Summary of Clinical Pharmacology
117
Figure 14 Forrest Plot of Effect of Intrinsic Factors on DTG PharmacokineticPK Parameters based on Phase I Studies
Results from subgroup analysis of integrated efficacy (m2.7.3) and integrated safety (m2.7.4) indicated that there was no apparent or consistent difference in efficacy andsafety by age, gender, or race, supporting the conclusions of no dose adjustment for DTG by these intrinsic and extrinsic factors. Differences in the safety profile of DTG for HBV and HCV co-infected subjects is likely due to the intrinsic nature of these diseases and to the more robust virologic and immunologic activity of DTG, especially in treatment-experienced subjects, rather than direct toxicity of DTG. Therefore, dose adjustment is also unnecessary due to this intrinsic factor.
3.4. Drug-Drug Interactions
In addition to background antiretroviral drugs, DTG is expected to be co-administered with drugs that are used to treat opportunistic infections or the side effects associated with taking other antiretrovirals, and with other medications commonly used in HIV-infected subjects. A total of 17 Phase I studies in healthy subjects have been performed to assess the interaction between DTG and various drugs, including ART for HIV treatmentand non-ART medications expected to be used concomitantly with DTG (Section 1.3.4).

CONFIDENTIALModule 2.7.2 Summary of Clinical Pharmacology
118
3.4.1. Supporting Non-clinical Data
DTG is primarily metabolized by UGT1A1 with a notable contribution from CYP3A4. UGT1A3 and 1A9 were minor pathways. Therefore, drugs that are strong inducers of UGT1A1 or CYP3A4 may decrease DTG plasma concentrations and reduce the therapeutic effect of DTG. Drugs that inhibit UGT1A1 and CYP3A4 may increase DTGplasma concentrations (m2.6.5). In vitro, DTG was a substrate for the human efflux transporters P-glycoprotein (Pgp) and human breast cancer resistance protein (BCRP). DTG was determined to have high passive and absorptive membrane permeability (3 x10⁻⁴ cm/s) across the absorptive pH range of 5.5 to 7.4 and provided support for classification as a BCS Class II drug (m2.7.1). High permeability and rapid absorption has the potential to attenuate any impact of efflux inhibitors. In clinical studies, no notable effect on DTG pharmacokinetics was observed following co-administration with the efflux transport inhibitors LPV/RTV and TVR (Section 3.4.3).
In vitro, DTG was noted to have little or no inductive effects on the human Pregnane X Receptor (PXR), on CYP1A2, 2B6 or 3A4 mRNA. DTG demonstrated little or no directinhibition (IC50 values >50 M) in vitro on the transporters BCRP, multi-drug resistance protein (MRP) 2, organic anion transporting polypeptide (OATP) 1B1, 1B3, organic cation transporter (OCT) 1, and Pgp, or the enzymes CYP1A2, 2A6, 2B6, 2C8, 2C9, 2C19, 2D6, 3A4, UGT1A1 or 2B7. Therefore DTG has a low propensity to cause drug interaction. DTG glucuronide, GSK2832500, did not inhibit MRP2, thus inhibition of biliary clearance of bilirubin glucuronides or glucuronide conjugates of co-administered drugs is not expected (m2.6.5).
In vitro, DTG was an inhibitor of the renal organic cation transporter 2 (OCT2). In vitroincubation with DTG concentrations that were observed in vivo after a 50 mg oral dose produced a 90% inhibition of OCT2. These in vitro results indicate the potential for a drug interaction in vivo with cationic compounds that are renally cleared by this transporter, such as the endogenous substrate, creatinine, and the antiarrhythmic drug, dofetilide. Caution should be used when considering co-administration of narrow therapeutic index drugs in which a significant part of their clearance is by renal proximal tubule secretion by OCT2 (see Section 3.4.2 for details).
3.4.2. Effect of DTG on the Pharmacokinetics of Co-administered Drug
In vivo drug interaction studies with sensitive substrates for CYP3A4 (MDZ) and CYP2B6 (EFV) confirmed the low propensity of DTG to alter the pharmacokinetics of agents metabolized by either CYP3A4 or CYP2B6 in vivo, by demonstrating a lack of effect of DTG on the pharmacokinetics of MDZ and EFV. Drug interaction studies also indicated no clinically meaningful effect of DTG on tenofovir (a renal OAT1, OAT3,MRP2, and MRP4 substrate), RPV (a CYP3A substrate), methadone (primarily metabolized by CYP2B6 and CYP2C19 with CYP3A as a minor route), and oral contraceptive (OC) containing norgestimate and EE, which have complex metabolism,including oxidation, reduction, and conjugation.

CONFIDENTIALModule 2.7.2 Summary of Clinical Pharmacology
119
Table 55 Summary of Effects of DTG on PK of Co-administered Drugs
Concomitant drug
Concomitant drug dose
DTG dose N GM Ratio (90% CI)Co-ad drug +DTG / co-ad drug alone
Study Conclusion
C24/C AUC Cmax
MDZ (CYP 3A4 substrate)
3 mg SD 25 mg once daily(suspension)
10 NA 0.945(0.815, 1.095)
NA ING111322 No effect on MDZ
TDF 300 mg once daily
50 mg once daily
15 1.186(1.042-1.350)
1.119(1.012-1.238)
1.094(0.974-1.228)
ING111604 No TDF dose adjustment
Methadone Individualized dose
50 mg twice daily
11 Total methadone0.99(0.91, 1.07)
R-methadone0.95(0.89, 1.02)
S-methadone1.02(0.93, 1.12)
0.98(0.91, 1.06)
0.95(0.89, 1.02)
1.01(0.93, 1.09)
1.00(0.94, 1.06)
0.97(0.91, 1.03)
1.03(0.97, 1.10)
ING115698 No methadone dose adjustment
Oral Contraceptive(Ortho-Cyclen)
norgestimate 0.25 mg and
EE 0.035 mg
50 mg twice daily
15 0.932(0.846, 1.027)
1.019(0.934, 1.112]
0.975(0.910, 1.044)
1.032(0.964, 1.105)
0.890(0.815, 0.973)
0.988(0.907, 1.077)
ING111855 No OC dose adjustment
RPV 25 mg once daily
50 mg once daily
16 1.214(1.070, 1.378)
1.063(0.976, 1.158)
1.102(0.992, 1.224)
LAI116181 No RPV dose adjustment
Data source:ING111322, Table 11.15; ING111604, Table 11.10; ING115698, Table 11.8; ING111855, Table 3.6, Table 3.10; LAI116181, Table 11.12
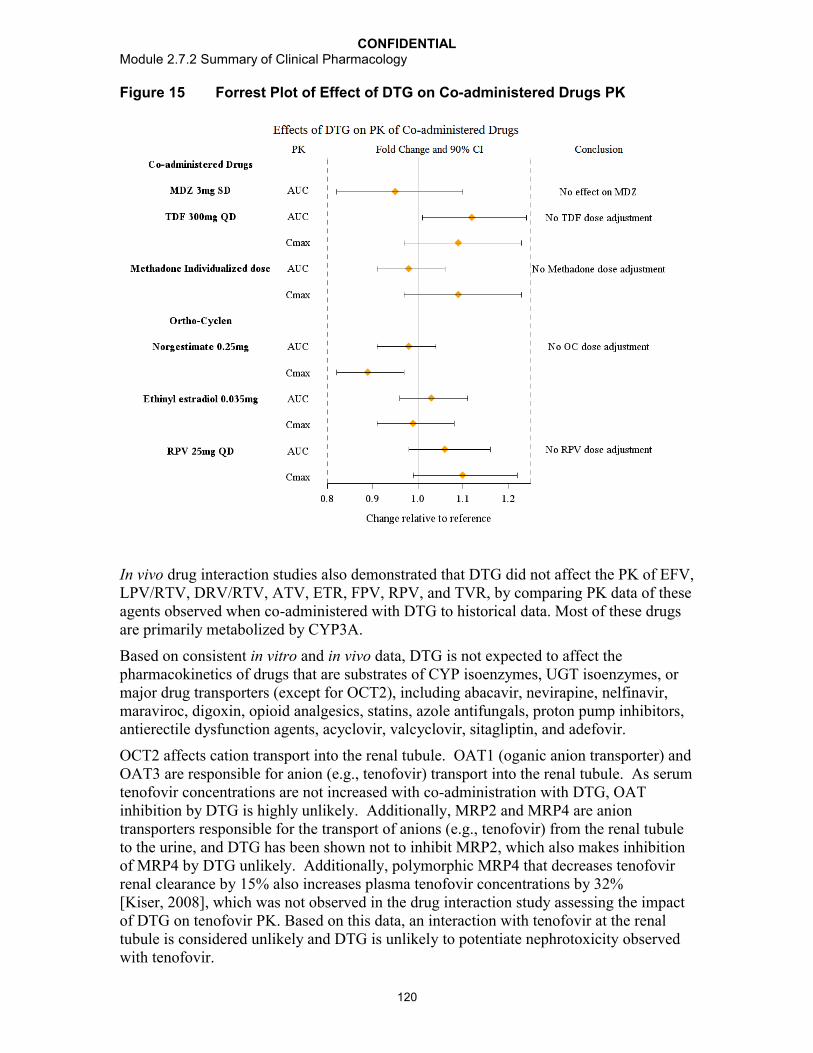
CONFIDENTIALModule 2.7.2 Summary of Clinical Pharmacology
120
Figure 15 Forrest Plot of Effect of DTG on Co-administered Drugs PK
In vivo drug interaction studies also demonstrated that DTG did not affect the PK of EFV, LPV/RTV, DRV/RTV, ATV, ETR, FPV, RPV, and TVR, by comparing PK data of these agents observed when co-administered with DTG to historical data. Most of these drugs are primarily metabolized by CYP3A.
Based on consistent in vitro and in vivo data, DTG is not expected to affect the pharmacokinetics of drugs that are substrates of CYP isoenzymes, UGT isoenzymes, or major drug transporters (except for OCT2), including abacavir, nevirapine, nelfinavir, maraviroc, digoxin, opioid analgesics, statins, azole antifungals, proton pump inhibitors, antierectile dysfunction agents, acyclovir, valcyclovir, sitagliptin, and adefovir.
OCT2 affects cation transport into the renal tubule. OAT1 (oganic anion transporter) and OAT3 are responsible for anion (e.g., tenofovir) transport into the renal tubule. As serum tenofovir concentrations are not increased with co-administration with DTG, OAT inhibition by DTG is highly unlikely. Additionally, MRP2 and MRP4 are anion transporters responsible for the transport of anions (e.g., tenofovir) from the renal tubule to the urine, and DTG has been shown not to inhibit MRP2, which also makes inhibition of MRP4 by DTG unlikely. Additionally, polymorphic MRP4 that decreases tenofovir renal clearance by 15% also increases plasma tenofovir concentrations by 32%[Kiser, 2008], which was not observed in the drug interaction study assessing the impact of DTG on tenofovir PK. Based on this data, an interaction with tenofovir at the renal tubule is considered unlikely and DTG is unlikely to potentiate nephrotoxicity observed with tenofovir.
CONFIDENTIALModule 2.7.2 Summary of Clinical Pharmacology
121
DTG may increase the exposure of 3TC and FTC through the inhibition of OCT2, which may be involved in active secretion of these agents in the urine [Moore, 1996]. Abacavirand zidovudine are not substrates of OCT2 and their metabolism through UGT2B7(abacavir and zidovudine) and alcohol dehydrogenase (abacavir) are not expected to be affected by DTG. A clinically significant drug-drug interaction between DTG and 3TC or FTC is unlikely, given the safety profile observed across the treatment-naive studies, where subjects have received DTG in combination with 3TC or FTC for up to 96 weeks(ING112276) or up to 48 weeks and beyond (ING113086 and ING114467) (m2.7.4).
DTG inhibited the renal transporter OCT2, a mechanism that is consistent with a benign increase in serum creatinine. Based on this observation, DTG may reduce the excretion of dofetilide, thereby increasing plasma concentrations to toxic levels. Co-administration of DTG and dofetilide is contra-indicated. The concentration of metformin may be increased by the same mechanism and dose adjustment of metformin may be considered [Somogyi, 1987]. Metformin should be titrated against its effect on blood glucose and should be started at a low dose, with gradual dose escalation up to a maximum of 2,550 mg in adults, both to reduce gastrointestinal side effects and to permit identification of the minimum dose required for adequate glycemic control of the patient [Glucophage, 2008]. It does not cause hypoglycemia under normal conditions of use. Although theoretically, increases in metformin concentration may increase the risk of lactic acidosis, it would be expected that any effect of DTG on metformin concentration would be reflected by a lower dose being required to achieve the desired therapeutic effect, rather than a clinically significant increase in exposure.
3.4.3. Effect of Co-administered Drug on Pharmacokinetics of DTG
A summary of the effects of co-administered drugs on DTG PK can be found in Table 56.

CONFIDENTIALModule 2.7.2 Summary of Clinical Pharmacology
122
Table 56 Summary of Effects of Co-administered Drugs on DTG PK
Co-administered Drug
Co-administeredDrug Dose
DTG Dose N Geometric Mean Ratio (90% CI) of DTG PK Parameters with/without Co-administered Drugs
No Effect = 1.00
Data Source
DTG Dose Recommendation
C or C24 AUC Cmax
TDF 300 mg once daily 50 mg once daily 15 0.920(0.816-1.036)
1.005(0.908-1.113)
0.969(0.867-1.083)
ING111604Table 11.6
No dose adjustment
DRV/RTV 600/100 mg twice daily
30 mg once daily 15 0.620(0.555-0.694)
0.782(0.722-0.848)
0.892(0.825-0.965)
ING111405Table 11.6
No dose adjustment
LPV/RTV 400/100 mg twice daily
30 mg once daily 15 0.944(0.848-1.052)
0.973(0.911-1.039)
1.000(0.937-1.066)
ING111405Table 11.6
No dose adjustment
ETR 200 mg twice daily 50 mg once daily 15 0.121(0.093-0.157)
0.294(0.257-0.337)
0.484(0.433-0.542)
ING111603Table 11.6
Not recommended
ETR/LPV/RTV 200/400/100 mg twice daily
50 mg once daily 8 1.278(1.130-1.445)
1.105(1.017-1.201)
1.072(1.020-1.128)
ING112934Table 11.6
No dose adjustment
ETR/DRV/RTV 200/600/100 mg twice daily
50 mg once daily 9 0.629(0.523-0.758)
0.750(0.691-0.814)
0.882(0.781-0.997)
ING112934Table 11.6
No dose adjustment
Multivitamins One-a-Day 50 mg SD 16 0.679(0.560-0.824)
0.668(0.553-0.806)
0.646(0.540-0.774)
ING111602Table 11.4
No dose adjustment
Maalox 20 mL 50 mg SD 16 0.256(0.211-0.311)
0.264(0.218-0.318)
0.276(0.231-0.331)
ING111602Table 11.4
DTG should be taken 2 hours before or 6 hours
after antacidMaalox 2 hrs after 20 mL 50 mg SD 16 0.703(0.579-0.853)
0.743(0.615-0.897)
0.821(0.686-0.984)
ING111602Table 11.4
ATV/RTV 300/100 mg once daily
30 mg once daily 12 2.206(1.972-2.468)
1.617(1.500-1.743)
1.336(1.254-1.423)
ING111854Table 11.6
No dose adjustment
ATV 400 mg once daily 30 mg once daily 12 2.802(2.523-3.113)
1.911(1.802-2.026)
1.495(1.404-1.591)
ING111854Table 11.6
No dose adjustment
OMP 40 mg once daily 50 mg SD 12 0.954(0.752-1.209)
0.971(0.783-1.203)
0.915(0.754-1.111)
ING112941Table 11.4
No dose adjustment
TPV/RTV 500/200 mg twice daily
50 mg once daily 14 0.239(0.212-0.270)
0.409(0.379-0.443)
0.535(0.500-0.572)
ING113096Table 11.6
DTG 50 mg twice dailyc
EFV 600 mg once daily 50 mg once daily 12 0.245(0.179-0.336)
0.431(0.346-0.536)
0.608(0.506-0.730)
ING114005Table 11.10
DTG 50 mg twice dailyc
FPV/RTV 700/100 mg twice daily
50 mg once daily 12 0.510(0.413-0.629)
0.651(0.542-0.782)
0.763(0.632-0.921)
ING113068Table 11.12
No dose adjustment

CONFIDENTIALModule 2.7.2 Summary of Clinical Pharmacology
123
Co-administered Drug
Co-administeredDrug Dose
DTG Dose N Geometric Mean Ratio (90% CI) of DTG PK Parameters with/without Co-administered Drugs
No Effect = 1.00
Data Source
DTG Dose Recommendation
C or C24 AUC Cmax
RIF 600 mg once daily 50 mg twice dailya 11 1.220(1.005, 1.480)
1.327(1.152, 1.529)
1.184(1.026, 1.366)
ING113099Table 11.5
DTG 50 mg twice daily
50 mg twice dailyb 11 0.277(0.228, 0.336)
0.460(0.384, 0.552)
0.565(0.489, 0.652)
RBT 300 mg once daily 50 mg once daily 9 0.700(0.566, 0.866)
0.947(0.816, 1.098)
1.156(0.978, 1.365)
ING113099Table 11.6
No dose adjustment
Prednisone 60 mg once daily 50 mg once daily 12 1.167(1.062, 1.281)
1.111(1.030, 1.198)
1.062(0.991, 1.139)
ING115696Table 11.5
No dose adjustment
BCV 800 mg three times daily
50 mg once daily 13 1.080(0.911, 1.281)
1.068(0.948, 1.203)
1.052(0.960, 1.153)
ING115697Table 3.7
No dose adjustment
TVR 750 mg three times daily
50 mg once daily 15 1.368(1.290, 1.450)
1.253(1.196, 1.314)
1.185(1.111, 1.264)
ING115697Table 3.8
No dose adjustment
RPV 250 mg once daily 50 mg once daily 16 1.223(1.149, 1.302)
1.121(1.053, 1.194)
1.130(1.055, 1.210)
LAI116181Table 11.5
No dose adjustment
Data source: see table.a. Comparison was between DTG 50 mg twice daily + RIF (test treatment) vs DTG 50 mg once daily (reference treatment).b. Comparison was between DTG 50 mg twice daily + RIF (test treatment) vs DTG 50 mg twice daily (reference treatment).c. Caution should be given to INI-resistant subjects.

CONFIDENTIALModule 2.7.2 Summary of Clinical Pharmacology
124
Figure 16 Forrest Plot of Effect of Co-administered Drugs (Non-inducers) on DTG PK
Dashed line represents 0.25 or 75% reduction in DTG exposure, the lower end of the “no effect boundaries”.

CONFIDENTIALModule 2.7.2 Summary of Clinical Pharmacology
125
Figure 17 Forrest Plot of Effect of Co-administered Drugs (Inducers) on DTG PK
Dashed line represents 0.25 or 75% reduction in DTG exposure, the lower end of the “no effect boundaries”.
3.4.3.1. UGT/CYP3A Inhibitors
LPV/RTV, LPV/ RTV +ETR, ATV, ATV/ RTV, BCV, and TVR were evaluated in Phase I clinical drug interaction studies and showed no clinically significant effect on DTG PK as GMRs all fell within the “no effect boundaries” defined in Section 3.2.3.
LPV/RTV, BCV, and TVR are strong inhibitors of CYP3A4 as well as Pgp, but had no or minimal effect on DTG exposure. Therefore, other unstudied CYP3A4/Pgp inhibitors, (e.g., ketoconzaole) are not expected to affect DTG exposure either. No DTG dose adjustment is necessary when co-administered with CYP3A4 inhibitors. Nelfinavir is a weak CYP3A inhibitor, and therefore not expected to affect DTG PK significantly, so no DTG dose adjustment is needed. Use of UGT/CYP3A inhibitors as either background ART or concurrent medications were allowed in Phase II/III studies.
CONFIDENTIALModule 2.7.2 Summary of Clinical Pharmacology
126
ATV is a strong inhibitor of UGT1A1, and ATV and ATV/RTV both increased DTG AUC by 62-91%. DTG exposure may be affected by other UGT1A1 inhibitors. However, since the effects of ATV and ATV/RTV are not considered clinically significant, the effects of other UGT1A1 inhibitors are expected to be not clinically significant either. No DTG dose adjustment is necessary when co-administered with UGT1A1 inhibitors.
3.4.3.2. UGT/CYP3A Inducers
DRV/RTV, FPV/RTV, TPV/RTV, DRV/RTV + ETR, RIF, RBT, prednisone, ETR, EFV, and RPV were evaluated in clinical studies and showed varied effect on DTG PK. Based on the observed effects and regulatory guidance [FDA, 2012; EMA, 2012], these inducers are classified into 3 groups:
No net inductive effect (reducing DTG AUC by <20%): including RBT, prednisone,RPV, and LPV/RTV/ETR.
Weak inducers (reducing DTG AUC by 20 to 50%): including DRV/RTV, ETR +DRV/RTV, FPV/RTV.
Moderate inducers (reducing DTG AUC by 50-80%): including ETR (without a boosted PIs), EFV, TPV/RTV, and RIF.
A 75% reduction in DTG C or the geometric mean ratio on DTG C of 0.25 is defined as the lower bound of the “no effect boundaries” (Section 3.2.3). Based on such criteria, no DTG dose adjustment is needed when co-administered with these drugs, except for ETR, TPV/RTV, EFV, and RIF. The 90% CI of geometric mean ratio of ETR effect on DTG C was (0.093-0.157), which is completely outside the lower bound of the “no effect boundaries”, 0.25 (see Figure 16). Therefore ETR is recommended to be contraindicated with DTG. The 90% CIs of geometric mean ratios of the effects of TPV/RTV, EFV, and RIF on DTG C, at (0.212-0.270), (0.179-0.336), (0.23, 0.34), respectively, overlap with the lower bound of the “no effect boundaries”, 0.25 (see Figure 16); therefore DTG dose adjustment is needed when co-administered with TPV/RTV, EFV, and RIF.
Limited clinical data on the combination of DTG with TPV/RTV or EFV are available in ING111762 (SAILING). Significantly reduced DTG C0 by co-administration with TPV/RTV or EFV was confirmed in this study: DTG C0 in subjects on these inducers(n=16) was estimated at 0.169 g/mL (%CVb of 209%;Table 39), and is much lower than the lower bound of the “no effect boundaries” (0.3 g/mL as defined in Section 3.2.3.1). The observed antiviral response rate (Snapshot) in subjects on these inducers was consequently 14% lower than that in the subjects not on these inducers (Table 39). The lack of response in subjects on these inducers was driven by virologic failure rather than other causes (e.g., adverse events, lost to follow up, etc). Such data, even though limited, suggested the necessity of DTG dose adjustment when co-administered with TPV/RTV or EFV.
DTG 50 mg twice daily is recommended when co-administered with TPV/RTV or EFV. DTG C0 from 50 mg twice daily dosing co-administered with these moderate/strong inducers is estimated at 1.20 g/mL (m5.3.3.5, Population PK in ART-experienced,
CONFIDENTIALModule 2.7.2 Summary of Clinical Pharmacology
127
Table 4-9), which is 40% higher than the geometric mean of C0 observed in ING111762 (0.856 g/mL). It is expected that DTG 50 mg twice daily with TPV/RTV or EFV would demonstrate comparable antiviral response as observed in ING111762.
In the INI-resistant population in ING112574 (VIKING-3), a small number of subjects (n=8) received EFV and TPV/RTV in OBR with DTG 50mg twice daily. These subjects showed similar DTG C to other subjects not on these inducers, and showed higher Week 24 response rate (6/8: 75%) than the overall population (63%). These data support that DTG may be used without dose adjustment in combination with moderate inducers such as EFV and TPV/RTV in an INI-resistant population, however data are limited. Therefore caution is advised when DTG is co-administered with EFV and TPV/RTV in INI-resistant subjects.
DTG 50 mg twice daily should be used in subjects who require RIF therapy for treatment of TB infection. DTG 50 mg twice daily with RIF demonstrated DTG exposure at 18-30% higher than that observed with DTG 50 mg once daily alone, supporting the recommendation of DTG 50 mg twice daily with RIF. Caution is advised when DTG is co-administered with RIF in INI-resistant subjects.
However, DTG can be dosed with ETR without dose adjustment if ETR is also co-administered with boosted PIs, including LPV/RTV, DRV/RTV, and ATV/RTV. The ability of LPV/RTV and DRV/RTV to attenuate the induction of ETR was demonstrated in ING112934, and this combination has been used in Phase III trials. ATV/RTV, as a strong UGT1A1 inhibitor, is likely to have the ability to attenuate the induction of ETR as well, although a drug interaction study evaluating the combination of ATV/RTV and ETR on DTG exposure has not been performed. Previous studies have demonstrated that RTV-boosted PIs can counteract the induction effect of EFV [Abel, 2008; Duval, 2000; Morse, 2005].
The effect of DRV/RTV on DTG PK was evaluated in a Phase I drug interaction study using DRV/RTV 600 mg/100 mg twice daily (Section 2.1.3.2). Twice daily dosing of DRV/RTV reduced DTG exposure without clinical significance; DTG AUC was reduced by 22% and C was reduced by 38%. There were a significant number of subjects on DRV/RTV twice daily dosing (N=92) as well as once daily dosing (800 mg/100 mgDRV/RTV, N=43) in the Phase III study ING111762. Clinical data in this study supports that DTG can be dosed with once daily DRV/RTV without dose adjustment (Section 2.3.8). No drug interaction study with once daily dosing of DRV/RTV is needed.
3.4.3.3. Metal Cation-Containing Products
Metal cation-containing antacids and multivitamins are used frequently in the HIV-infected populations. Chelation with metal cations has the potential to reduce DTG absorption. The effects of the antacid Maalox and multivitamins on DTG PK were evaluated in a clinical study (See Section 2.1.3.3). Due to a significant reduction in DTG exposure by antacid (>70% on AUC) and attenuation with separated dosing by 2 hours(Section 2.1.3.3), dosing separation is needed when DTG is given together with antacids.The antacid product selected for this study had the largest amount of metal cations to demonstrate the worst case scenario that might occur in clinical use. It is well known that

CONFIDENTIALModule 2.7.2 Summary of Clinical Pharmacology
128
quinolones are recommended to be given at least 6 hours [Cipro, 2011] after antacids due to reduced absorption resulting from chelation with metal cations; therefore it is recommended that DTG should be administered 2 hours before or 6 hours after antacids. DTG should be taken 2 hours before or 6 hours after antacid dose. The effect of antacids on DTG PK is not a pH effect as OMP has shown no effect on DTG PK (See Section 2.1.3.9). DTG can be dosed with multivitamins without dosing separation. Other multivitamin products, althoughnot evaluated in a clinical study, are not expected to have significant effects on DTG PK since the multivitamin product (One A Day Maximum) that was evaluated represents a worse case scenario as it contains the highest level of metal cations: 162 mg calcium, 18 mg iron, 100 mg magnesium, 15 mg zinc, and 2 mg copper) (Section 2.1.3.3).
Reduction in DTG exposure by high-dose replacement therapy with metal cations (Ca, Fe, Mg, Al) is expected, although the magnitude is unknown. Dosing principles similar to antacids should apply to other high-dose metal cation supplements (Ca, Fe, Mg, Al) until further data are available. A specific study to evaluate the effect of calcium supplements on DTG PK has not been conducted. Calcium carbonate and citrate are the two most commonly used calcium supplements, and contain 40% and 21% of elemental calcium, respectively. The effect of a common calcium supplement dose of 1000 to 1200 mg (calcium carbonate or calcium citrate), containing about 200 to 480 mg elemental calcium, on DTG PK, is likely to be similar to that observed from One A Day Maximum due to similar elemental cations contained.
Milk also contains calcium. A specific study to assess a possible interaction of dolutegravir with milk alone has not be conducted; however, a Phase I study performed to assess the effects of food with varying fat/calories (m2.7.1, Section 2.3.3) evaluated dosing with meals that included milk. Milk was administered in both the moderate fat meal (2% milk, containing ~300 mg calcium per cup) and high fat meal (whole milk, containing ~250 mg calcium per cup) dosing arms. Increases in DTG exposure were observed in both arms. The amount of calcium in a glass of milk appears to have no impact on absorption. The effect of fat in food and milk increases solubilization of DTG and leads to improved absorption and higher plasma concentrations.
3.4.4. Summary of Predicted Drug Interaction
By extrapolating observed drug interaction results to drugs that have not been evaluated in clinical studies, but have similar metabolic properties, or by extrapolating based on in vitro data, the following can be anticipated:

CONFIDENTIALModule 2.7.2 Summary of Clinical Pharmacology
129
Table 57 Recommendations Based on Predicted Drug Interactions
Concomitant Drug Class:Drug Name
Anticipated Effect on Concentration of Dolutegravir or Concomitant Drug
Clinical Comment
HIV-1 Antiviral AgentsNNRTI:Nevirapine
Co-administration with nevirapine has the potential to decrease dolutegravir plasma concentration to the extent similar to or less than EFV due to enzyme induction.
DTG dose adjustment to 50 mg twice daily is recommended when co-administration with nevirapine is needed. Caution is warranted and clinical monitoring is recommended when the combination is given in INI-resistant patients.
PI:Nelfinavir
Although an inhibitor of CYP3A4, based on data from other inhibitors, an increase is not expected.
No dose adjustment is necessary.
CCR5 Antagonist: Maraviroc A CYP3A4 substrate. No drug interaction expected
No dose adjustment is necessary
NRTIs: abacavir, lamivudine, emtricitabine, zidovudine
No drug interaction expected No dose adjustment is necessary
Other AgentsAntacids containing divalent cations (e.g., Mg, Al or Ca) other than Maalox
Co-administration of antacids containing divalent cations has the potential to decrease DTG exposure.
DTG is recommended to be administered 2 hours before or 6 hours after taking antacid products containing divalent cations.
Proton Pump Inhibitors other than omeprazole (e.g lansoprazole, esomethrazole, and pantoprazole)
No drug interaction expected No dose adjustment necessary
Histamine-2 receptor antagonists (cimetidine, ranitidine, famotidine, nizatidine),
No drug interaction expected No dose adjustment necessary
Dofetilide Co-administration of DTG has the potential to increase dofetilide plasma concentration via inhibition of OCT2 transporter.
DTG and dofetilide co-administration is contraindicated due to potential life-threatening toxicity caused by high dofetilide concentration.
Metformin Co-administration of DTG has the potential to increase metformin plasma concentration via inhibition of OCT2 transporter
Clinical monitoring of blood sugar and for symptoms of lactic acidosis is recommended.
Weak metabolic inducers: glucocorticoids (<30 days of use), modafinil, pioglitazone, troglitazone
No drug interaction expected No dose adjustment necessary
Moderate/strong metabolic inducers: oxcarbazepine, rifapentine, phenytoin, phenobarbital, carbamazepine, St. John’s wort
Co-administration with these metabolic inducers may decrease DTG exposure
Co-administration with these metabolic inducers should be avoided.
Statins Statins are mostly substrates of CYP3A4 and OATP. No drug interaction with DTG is expected.
No dose adjustment necessary
CONFIDENTIALModule 2.7.2 Summary of Clinical Pharmacology
130
Concomitant Drug Class:Drug Name
Anticipated Effect on Concentration of Dolutegravir or Concomitant Drug
Clinical Comment
Digoxin, opioid analgesics, azole antifungals, antierectile dysfunction agents, acyclovir, valcyclovir, sitagliptin, adefovir, telbivudine, and entecavir
No drug interaction expected No dose adjustment necessary
Buprenorphine, naltrexone No drug interaction expected No dose adjustment necessary
4. SPECIAL STUDIES
Please note that m2.7.2.4, Special Studies (Summary of Microbiology/Virology), is provided as a standalone module.
5. CONCLUSIONS
Summary of characteristics of clinical pharmacology of DTG is presented in Section 1.2. Overall, pharmacokinetics, pharmacodynamics, PK/PD relationship in various patientpopulation, and drug interaction profiles of DTG support the following dose recommendation:
Treatment-naïve adults: DTG 50 mg once daily.
Treatment-experienced but integrase inhibitor-naïve adults: DTG 50 mg once daily.
Integrase inhibitor resistant adults: DTG 50 mg twice daily.
Integrase inhibitor-naïve children of 12-<18 years of age and weighing greater than or equal to 40 kg: DTG 50 mg once daily.
No DTG dose adjustment is necessary based on age, gender, race/ethnicity, weight, smoking, CDC classification of HIV infection, HBV/HCV co-infection, UGT1A1 polymorphisms, in subjects with mild to moderate hepatic impairment (Child Pugh grade A or B), and in subjects with mild, moderate, or severe (CrCL<30 mL /min, not on dialysis) renal impairment. DTG can be co-administered with most ART or non-ART drugs without dose adjustment except for the following:
Moderate/strong metabolic inducers: DTG 50mg twice daily dose is recommendedwhen co-administered with TPV/RTV, EFV, and RIF; DTG should not be co-administered with ETR if the subject is not receiving concomitant RTV-boosted protease inhibitors (PIs) including LPV/RTV, DRV/RTV, and ATV/RTV.
Ployvalent metal cation-containing antacids: DTG should be dose 2 hours prior to or 6 hours after antacids.

CONFIDENTIALModule 2.7.2 Summary of Clinical Pharmacology
131
6. REFERENCES
Abel, S., T.M. Jenkins, L.A. Whitlock, C.E. Ridgway, and G.J. Muirhead. Effects of CYP3A4 inducers with and without CYP3A4 inhibitors on the pharmacokinetics of maraviroc in healthy volunteers. Br. J. Clin. Pharmacol. 2008;65(Suppl. 1):38-46.
Anderson MS, Kakuda TN, Hanley W, Miller J, Kost JT, Stoltz R, Wenning LA, Stone JA, Hoetelmans RW, Wagner JA, and Iwamoto M. Minimal Pharmacokinetic Interaction between the Human Immunodeficiency Virus Nonnucleoside Reverse Transcriptase Inhibitor Etravirine and the Integrase Inhibitor Raltegravir in Healthy Subjects. Antimicrob Agents Chemother. 2008. 52(12): 4228–4232.
Cipro (ciprofloxacin) Product Information, 2011. Available at http://www.accessdata.fda.gov/drugsatfda_docs/label/2011/019537s074,020780s032lbl.pdf. Date accessed: November 1, 2012.
Duval, X., V. Le Moing, C. Longuet, C. Leport, J.L. Vildé, C. Lamotte, G. Peytavin, and R. Farinotti. Efavirenz-induced decrease in plasma amprenavir levels in human immunodeficiency virus-infected patients and correction by ritonavir. Antimicrob. Agents Chemother. 2000;44:2593.
Eron, JJ, Rockstroh JK, Reynes J, et al. Raltegravir once daily or twice daily in previously untreated patients with HIV-1: a randomized, active-controlled, phase 3 non-inferiority trial. Lancet Infec Dis. 2011;11:907-15.
European Medicine Agency (EMA). Guideline On The Clinical Development Of Medicinal Products For The Treatment Of HIV Infection. CHMP, London, UK; 2008. Doc. Ref. EMEA/CPMP/EWP/633/02 Revision 2. Available at http://www.ema.europa.eu/docs/en_GB/document_library/Scientific_guideline/2009/09/WC500003460.pdf. Date accessed: March 6, 2012.
European Medicine Agency (EMA). Guideline On The Evaluation Of The Pharmacokinetics Of Medicinal Products In Patients With Impaired Hepatic Function. CHMP, London, UK; 2005. Available at http://www.ema.europa.eu/docs/en_GB/document_library/Scientific_guideline/2009/09/WC500003122.pdf. Date accessed: October 31, 2012.
European Medicine Agency (EMA).Note for Guidance On The Evaluation Of The Pharmacokinetics Of Medicinal Products In Patients With Impaired Renal Function. CHMP, London, UK; 2004. Available at http://www.ema.europa.eu/docs/en_GB/document_library/Scientific_guideline/2009/09/WC500003123.pdf. Date accessed: October 31, 2012.
European Medicines Agency (EMA). Guideline on the Investigation of Drug Interactions (final). CHMP, London, UK; 2012. CPMP/EWP/560/95/Rev. 1. Available at http://www.ema.europa.eu/docs/en_GB/document_library/Scientific_guideline/2012/07/WC500129606.pdf. Date accessed: Oct 03, 2012.

CONFIDENTIALModule 2.7.2 Summary of Clinical Pharmacology
132
Food and Drug Administration (FDA). Guidance for Industry. Antiretroviral Drugs Using Plasma HIV RNA Measurements — Clinical Considerations for Accelerated and Traditional Approval. CDER, Rockville, MD; 2002. Available at http://www.fda.gov/downloads/Drugs/GuidanceComplianceRegulatoryInformation/Guidances/UCM070968.pdf. Date accessed: March 6, 2012.
Food and Drug Administration (FDA). Guidance for Industry. Drug Interaction Studies -Study Design, Data Analysis, Implications for Dosing, and Labeling Recommendations. Draft Guidance. CDER. Rockville, MD; 2012. Available at http://www.fda.gov/downloads/Drugs/GuidanceComplianceRegulatoryInformation/Guidances/UCM292362.pdf. Date accessed: March 6, 2012.
Food and Drug Administration (FDA). Guidance for Industry. Pharmacokinetics in Patients with Impaired Renal Function — Study Design, Data Analysis, and Impact on Dosing and Labeling. Draft Guidance. CDER. Rockville, MD; 2010. Available at http://www.fda.gov/downloads/Drugs/GuidanceComplianceRegulatoryInformation/Guidances/UCM204959.pdf. Date accessed: March 6, 2012.
Food and Drug Administration (FDA). Guidance for Industry. Pharmacokinetics in Patients with Impaired Hepatic Function — Study Design, Data Analysis, and Impact on Dosing and Labeling. CDER. Rockville, MD; 2003. Available at http://www.fda.gov/downloads/Drugs/GuidanceComplianceRegulatoryInformation/Guidances/UCM072123.pdf. Date accessed: March 6, 2012.
Glucophage prescribing information. 08/27/2008. Available at http://www.accessdata.fda.gov/drugsatfda_docs/label/2008/020357s031,021202s016lbl.pdf. Date accessed: November 1, 2012.
Hazra R, Viani R, Acosta E, et al., Pharmacokinetics, safety and efficacy of dolutegravir (DTG; S/GSK1349572) in HIV-1-positive adolescents: preliminary analysis from IMPAACT P1093. Abstract TUAB0203. Presented at: 19th International AIDS Conference; July 22-27, 2012; Washington, DC. Available online at http://www.iasociety.org/Abstracts/A200745155.aspx. Date accessed: November 12, 2012.
Hesselink DA, van Hest RM, Mathot RA, Bonthuis F, Weimar W, de Bruin RWF, and van Gelder T. Cyclosporine interacts with mycophenolic acid by inhibiting the multidrugresistance-associated protein 2. Am J Transplant. 2005. 5:987-994.
Incivek prescribing information. Revised October 2012. Available online at: http://pi.vrtx.com/files/uspi_telaprevir.pdf. Date accessed: November 7, 2012.
Iwamoto M, Wenning LA, Nguyen B-Y, etc. Effects of Omeprazole on Plasma Levels of Raltegravir. Clinical Infectious Diseases. 2009. 48:489-492.
Kassahun K, McIntosh I, Cui D, Hreniuk D, Merschman S, Lasseter K, Azrolan N, Iwamoto M, Wagner J, and Wenning L. Metabolism and Disposition in Humans of Raltegravir (MK-0518),an Anti-AIDS Drug Targeting the Human Immunodeficiency Virus 1Integrase Enzyme. Drug Metabolism and Disposition. 2007. 35(9): 1657-1663.

CONFIDENTIALModule 2.7.2 Summary of Clinical Pharmacology
133
Kiser JJ, Carten ML, Aquilante CL, Anderson PL, Wolfe P, King TM, Delahunty T, Bushman LR, and Fletcher CV. The Effect of Lopinavir/Ritonavir on the Renal Clearance of Tenofovir in HIV-infected Patients. Clinical Pharmacology & Therapeutics. 2008. 83(2): 265-272.
Min S, Sloan L, DeJesus E, etc. Antiviral Activity, Safety, and Pharmacokinetics/ pharmacodynamics of Dolutegravir as 10-day Monotherapy in HIV-1-infected Adults. AIDS. 2011;25:1737-1745.
Moore KH, Yuen GJ, Raasch RH, Eron JJ, Martin D, Mydlow PK, Hussey EK. Pharmacokinetics of lamivudine administered alone and with trimethoprim-sulfamethoxazole. Clin Pharmacol Ther. 1996 May;59(5):550-8.
Morse, G.D., S. Rosenkranz, M.F. Para, Y. Segal, R. Difrancesco, E. Adams, B. Brizz, K.E. Yarasheski, and R.C. Reichman. Amprenavir and efavirenz pharmacokinetics before and after the addition of nelfinavir, indinavir, ritonavir, or saquinavir in seronegative individuals. Antimicrob. Agents Chemother. 2005;49:3373-3381.
Somogyi A, Stockley C, Keal J, Rolan P, and Bochner F. Reduction of metformin Renal Tubular Secretion by Cimetidine in Man. Br. J.Clin. Pharm. 1987; 23:545-551.
SongI, Chen S, and Piscitelli S. Meta-analysis of Pharmacokinetic-Pharmacodynamic Relationship of Integrase Inhibitors following Short-term Monotherapy. 11th International Workshop on Clinical Pharmacology of HIV Therapy. Sorrento, Italy. April 7-9, 2010. Abstract 50.
Sustiva (efavirenz) Product Information. March 2009. Available online at: http://www.accessdata.fda.gov/drugsatfda_docs/label/2012/020972s042,021360s030lbl.pdf. Date accessed: November 7, 2012.
Tozzi V. Pharmacogenetics of antiretovirals. Antiviral Res. 2010; 85:190-200.
Zembruski N, Haefeli WE, and Weiss J. Interaction Potential of Etravirine with DrugTransporters Assessed In Vitro. Antimicrobial Agents Chemotherapy. 2011. 55(3):1282-1284.
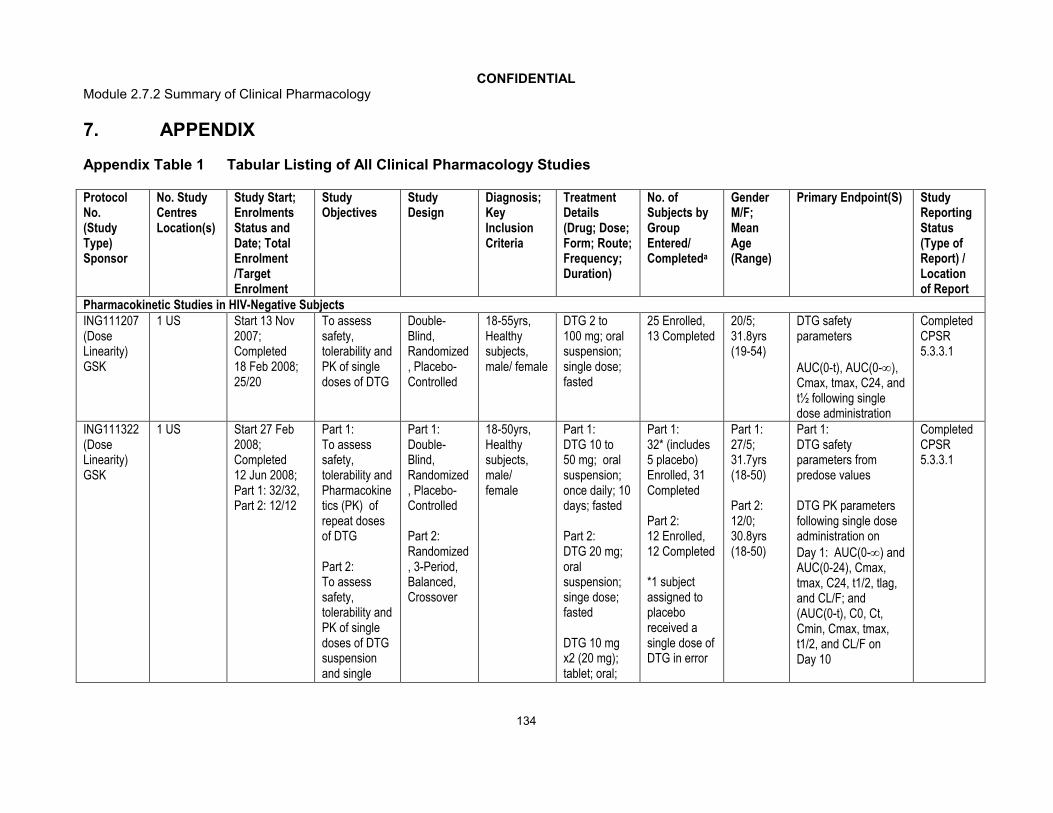
CONFIDENTIALModule 2.7.2 Summary of Clinical Pharmacology
134
7. APPENDIX
Appendix Table 1 Tabular Listing of All Clinical Pharmacology Studies
Protocol No.(Study Type)Sponsor
No. Study Centres Location(s)
Study Start; Enrolments Status and Date; Total Enrolment /Target Enrolment
Study Objectives
Study Design
Diagnosis; Key Inclusion Criteria
Treatment Details (Drug; Dose; Form; Route; Frequency; Duration)
No. of Subjects by Group Entered/ Completeda
Gender M/F; Mean Age (Range)
Primary Endpoint(S) Study Reporting Status (Type of Report) / Location of Report
Pharmacokinetic Studies in HIV-Negative SubjectsING111207 (Dose Linearity)GSK
1 US Start 13 Nov 2007;Completed18 Feb 2008;25/20
To assess safety, tolerability and PK of single doses of DTG
Double-Blind, Randomized, Placebo-Controlled
18-55yrs, Healthy subjects, male/ female
DTG 2 to 100 mg; oral suspension; single dose; fasted
25 Enrolled, 13 Completed
20/5;31.8yrs (19-54)
DTG safety parameters
AUC(0-t), AUC(0-), Cmax, tmax, C24, and t½ following single dose administration
Completed CPSR 5.3.3.1
ING111322 (Dose Linearity)GSK
1 US Start 27 Feb 2008;Completed12 Jun 2008; Part 1: 32/32,Part 2: 12/12
Part 1: To assess safety, tolerability and Pharmacokinetics (PK) of repeat doses of DTG
Part 2: To assess safety, tolerability and PK of single doses of DTG suspension and single
Part 1: Double-Blind, Randomized, Placebo-Controlled
Part 2: Randomized, 3-Period, Balanced, Crossover
18-50yrs, Healthy subjects, male/female
Part 1: DTG 10 to 50 mg; oral suspension; once daily; 10 days; fasted
Part 2: DTG 20 mg; oral suspension; singe dose; fasted
DTG 10 mg x2 (20 mg); tablet; oral;
Part 1: 32* (includes 5 placebo) Enrolled, 31 Completed
Part 2: 12 Enrolled,12 Completed
*1 subject assigned to placebo received a single dose of DTG in error
Part 1: 27/5; 31.7yrs (18-50)
Part 2: 12/0; 30.8yrs (18-50)
Part 1: DTG safety parameters from predose values
DTG PK parameters following single dose administration on Day 1: AUC(0-) and AUC(0-24), Cmax, tmax, C24, t1/2, tlag, and CL/F; and (AUC(0-t), C0, Ct, Cmin, Cmax, tmax, t1/2, and CL/F on Day 10
Completed CPSR 5.3.3.1

CONFIDENTIALModule 2.7.2 Summary of Clinical Pharmacology
135
Protocol No.(Study Type)Sponsor
No. Study Centres Location(s)
Study Start; Enrolments Status and Date; Total Enrolment /Target Enrolment
Study Objectives
Study Design
Diagnosis; Key Inclusion Criteria
Treatment Details (Drug; Dose; Form; Route; Frequency; Duration)
No. of Subjects by Group Entered/ Completeda
Gender M/F; Mean Age (Range)
Primary Endpoint(S) Study Reporting Status (Type of Report) / Location of Report
doses of DTG tablets with or without food
single dose;fasted
DTG 10 mg x2 (20 mg); tablet; oral; single dose; fed
Part 2:Single dose plasma DTG PK parameters: AUC(0-t), AUC(0-), Cmax, and C24
ING111853 (Mass Balance)GSK
1 US Start 17 Feb 2009;Completed 21 Apr 2009;6/6
To investigate the recovery, excretion, and PK of 14C-DTG
Open-label, single dose study
30-55yrs, Healthy subjects, male
DTG 20 mg; oral suspension; single dose; fasted
6 Enrolled, 6 Completed
6/0;37.5yrs (32-46)
Percent recovery of total radiocarbon in urine and feces. AUC(0-t), AUC(0-∞), Cmax, tmax, λz, tlag, and t½ of total drug-related material (radiocarbon) in blood and plasma following oral suspension [14C]-DTG dosing
AUC(0-t), AUC(0-∞), Cmax, tmax, λz, tlag, CL/F, Vz/F, and t½ of DTG in plasma following oral suspension [14C]-DTG dosing
Collection of samples for use in a separate
Completed CPSR5.3.3.1

CONFIDENTIALModule 2.7.2 Summary of Clinical Pharmacology
136
Protocol No.(Study Type)Sponsor
No. Study Centres Location(s)
Study Start; Enrolments Status and Date; Total Enrolment /Target Enrolment
Study Objectives
Study Design
Diagnosis; Key Inclusion Criteria
Treatment Details (Drug; Dose; Form; Route; Frequency; Duration)
No. of Subjects by Group Entered/ Completeda
Gender M/F; Mean Age (Range)
Primary Endpoint(S) Study Reporting Status (Type of Report) / Location of Report
study for characterization and quantification of DTG-related metabolites in plasma, urine and fecal homogenates
ING115465(PK, Investigator sponsored)
1 US Start 30 Aug 2011;Completed16 Apr 2012;11/8
To describe DTG exposure in cervicovaginal fluid, cervical and vaginal tissue
Open-label, repeat dose study
18-35yrs, Healthy subjects, female
DTG 50 mg; tablet; oral; once daily; 5-7 days
11 Enrolled, 8 Completed
ITT-E: 0/8;*21yrs (18-27)
*Median age
AUC(0-24), AUClast, AUCinf, Clast, Cmax, Tmax, and t½ for blood plasma (BP), cervicovaginal fluid (CVF), cervical tissue (CT), and vaginal tissue (VT) after dosing of DTG 50-mg tablet on the first dosing day (Day 1) and at steady-state after 5-7 days of treatment
Accumulation ratio of DTG in BP, CVF, CT, and VT
CVF:BP, CT:BP, VT:BP, CT:CVF, and VT:CVF DTG AUC ratios
Completed CPSR5.3.3.1

CONFIDENTIALModule 2.7.2 Summary of Clinical Pharmacology
137
Protocol No.(Study Type)Sponsor
No. Study Centres Location(s)
Study Start; Enrolments Status and Date; Total Enrolment /Target Enrolment
Study Objectives
Study Design
Diagnosis; Key Inclusion Criteria
Treatment Details (Drug; Dose; Form; Route; Frequency; Duration)
No. of Subjects by Group Entered/ Completeda
Gender M/F; Mean Age (Range)
Primary Endpoint(S) Study Reporting Status (Type of Report) / Location of Report
ING116195PK,
Investigator sponsored)
1 US Start 14 Dec 2011; Completed 22 May 2012; 14/12
To describe DTG exposure in semen and rectal tissue
Open-label, repeat dose study
18-49yrs, Healthy subjects, male
DTG 50 mg; tablet; oral; once daily; 8 days
14 Enrolled, 12 Completed
ITT-E: 12/0; *25.5yrs (21-44)
*Median age
AUC(0-24), AUClast, AUCinf, Clast, Cmax, tmax for blood plasma (BP), seminal fluid (SF), rectal mucosal fluid (RF), and rectal mucosal tissue (RT) after dosing of DTG 50mg tablet on the first dosing day (Day1; PK) and at a steady-state 7 and 8 days later
Accumulation of ratio of DTG in BP, SF, RF, and RT
SF: BP, RT:BP, and RF: RT DTG AUC ratios
Completed CPSR5.3.3.1
ING113125 (PK)ViiV Healthcare
1 US Start 28 Jun 2011;Completed20 April 2012;16/16
To evaluate the single dose PK and safety of DTG in healthy subjects and in subjects with severe renal
Single dose, open-label, parallel group, two-part study
18-70yrs, Severe renal impairment subjects and matched, healthy control subjects with normal renal
DTG 50 mg; tablet; oral; single dose
Renal: 8 Enrolled, 8 Completed
Healthy:8 Enrolled, 8 Completed
Renal:5/3; 56.8yrs(47-65)
Healthy:5/3;56.1yrs (43-68)
Plasma DTG tlag, tmax, Cmax, AUC(0-t), AUC(0-∞), %AUCex,t½, CL/F and Vz/F
Completed CPSR5.3.3.3
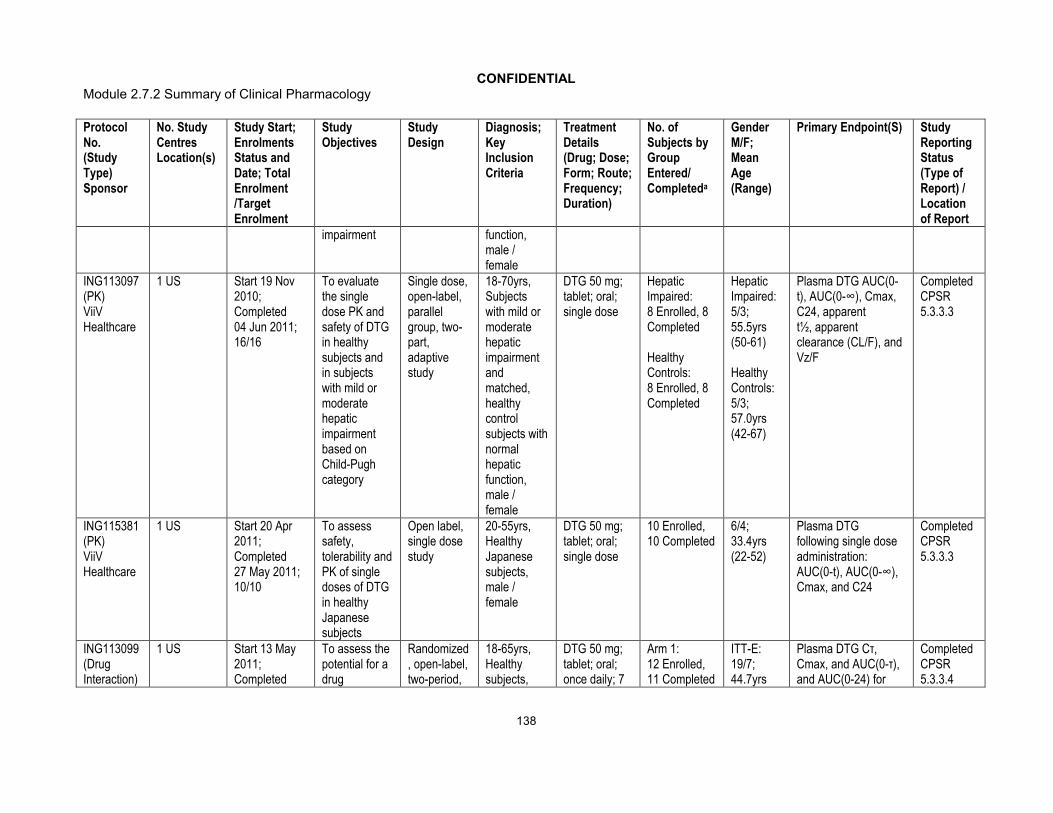
CONFIDENTIALModule 2.7.2 Summary of Clinical Pharmacology
138
Protocol No.(Study Type)Sponsor
No. Study Centres Location(s)
Study Start; Enrolments Status and Date; Total Enrolment /Target Enrolment
Study Objectives
Study Design
Diagnosis; Key Inclusion Criteria
Treatment Details (Drug; Dose; Form; Route; Frequency; Duration)
No. of Subjects by Group Entered/ Completeda
Gender M/F; Mean Age (Range)
Primary Endpoint(S) Study Reporting Status (Type of Report) / Location of Report
impairment function, male / female
ING113097 (PK)ViiV Healthcare
1 US Start 19 Nov 2010;Completed04 Jun 2011;16/16
To evaluate the single dose PK and safety of DTG in healthy subjects and in subjects with mild or moderate hepatic impairment based on Child-Pugh category
Single dose, open-label, parallel group, two-part, adaptive study
18-70yrs, Subjects with mild or moderate hepatic impairment and matched, healthy control subjects with normal hepatic function, male / female
DTG 50 mg; tablet; oral; single dose
Hepatic Impaired:8 Enrolled, 8 Completed
Healthy Controls: 8 Enrolled, 8 Completed
Hepatic Impaired: 5/3; 55.5yrs(50-61)
Healthy Controls: 5/3; 57.0yrs(42-67)
Plasma DTG AUC(0-t), AUC(0-∞), Cmax, C24, apparentt½, apparent clearance (CL/F), and Vz/F
Completed CPSR5.3.3.3
ING115381 (PK)ViiV Healthcare
1 US Start 20 Apr 2011; Completed 27 May 2011;10/10
To assess safety, tolerability and PK of single doses of DTG in healthy Japanese subjects
Open label, single dose study
20-55yrs, Healthy Japanese subjects, male / female
DTG 50 mg; tablet; oral; single dose
10 Enrolled, 10 Completed
6/4;33.4yrs (22-52)
Plasma DTG following single dose administration: AUC(0-t), AUC(0-∞), Cmax, and C24
Completed CPSR5.3.3.3
ING113099 (Drug Interaction)
1 US Start 13 May 2011; Completed
To assess the potential for a drug
Randomized, open-label, two-period,
18-65yrs, Healthy subjects,
DTG 50 mg; tablet; oral; once daily; 7
Arm 1: 12 Enrolled, 11 Completed
ITT-E: 19/7;44.7yrs
Plasma DTG Cτ, Cmax, and AUC(0-τ), and AUC(0-24) for
Completed CPSR5.3.3.4
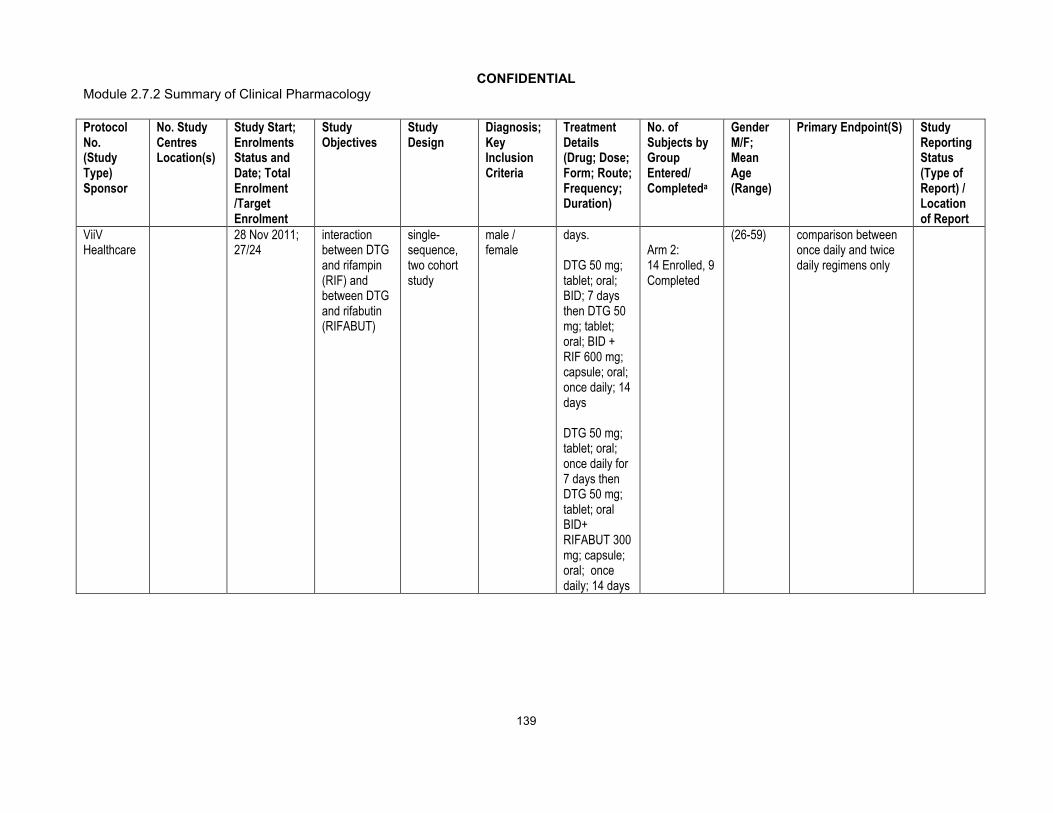
CONFIDENTIALModule 2.7.2 Summary of Clinical Pharmacology
139
Protocol No.(Study Type)Sponsor
No. Study Centres Location(s)
Study Start; Enrolments Status and Date; Total Enrolment /Target Enrolment
Study Objectives
Study Design
Diagnosis; Key Inclusion Criteria
Treatment Details (Drug; Dose; Form; Route; Frequency; Duration)
No. of Subjects by Group Entered/ Completeda
Gender M/F; Mean Age (Range)
Primary Endpoint(S) Study Reporting Status (Type of Report) / Location of Report
ViiVHealthcare
28 Nov 2011; 27/24
interaction between DTG and rifampin (RIF) and between DTG and rifabutin (RIFABUT)
single-sequence, two cohort study
male / female
days.
DTG 50 mg; tablet; oral; BID; 7 days then DTG 50 mg; tablet; oral; BID + RIF 600 mg; capsule; oral; once daily; 14 days
DTG 50 mg; tablet; oral; once daily for 7 days then DTG 50 mg; tablet; oral BID+ RIFABUT 300 mg; capsule; oral; once daily; 14 days
Arm 2: 14 Enrolled, 9 Completed
(26-59) comparison between once daily and twice daily regimens only

CONFIDENTIALModule 2.7.2 Summary of Clinical Pharmacology
140
Protocol No.(Study Type)Sponsor
No. Study Centres Location(s)
Study Start; Enrolments Status and Date; Total Enrolment /Target Enrolment
Study Objectives
Study Design
Diagnosis; Key Inclusion Criteria
Treatment Details (Drug; Dose; Form; Route; Frequency; Duration)
No. of Subjects by Group Entered/ Completeda
Gender M/F; Mean Age (Range)
Primary Endpoint(S) Study Reporting Status (Type of Report) / Location of Report
ING115696(Drug
Interaction)ViiV Healthcare
1 US Start 01 Sep 2011;Completed 17 Oct 2011;12/12
To investigate the effects of prednisone on the steady-state PK of DTG
Open-label, repeat dose, two-period, single-sequence
18-65yrs, Healthy subjects, male / female
DTG 50 mg; tablet; oral; once daily; 5 days
DTG 50 mg; tablet; oral; once daily; Days 1-10 + prednisone; tablet; oral; once daily (60 mg Days 1-5; 50 mg Day 6; 40 mg Day 7; 30 mg Day 8; 20 mg Day 9; 10 mg Day 10)
12 Enrolled, 12 Completed
5/7;28.5yrs(23-38)
DTG PK parameters on Day 5 and Day 10: AUC(0-), Cmax, C0, C, Cmin, CL/F, and t½
Completed CPSR5.3.3.4
ING115697 (Drug Interaction)ViiV Healthcare
1 US Start 13 Mar 2012; Completed23 May 2012;32/32
To assess the potential for a drug interaction between DTG and telaprevir (TLV) and between DTG and bocepravir (BCV)
Randomized, open-label, two-period, single-sequence, two cohort study
18-65yrs, Healthy subjects, male / female
DTG 50 mg; tablet; oral; once daily; 5 days
DTG 50 mg; tablet; oral; once daily + TLV 750 mg; tablet; oral; q8h; 10 days
DTG + BCV 16 enrolled, 13 completed
DTG + TLV 16 enrolled, 15 completed
19/13;42.5yrs (19-65)
Plasma steady-state DTG AUC(0-), Cmax, Cmin, C, following administration of DTG 50 mg once daily (q24h) for 5 days and following co-administration with BCV 800 mg q8h for 10 days or TVR 750
Completed CPSR5.3.3.4
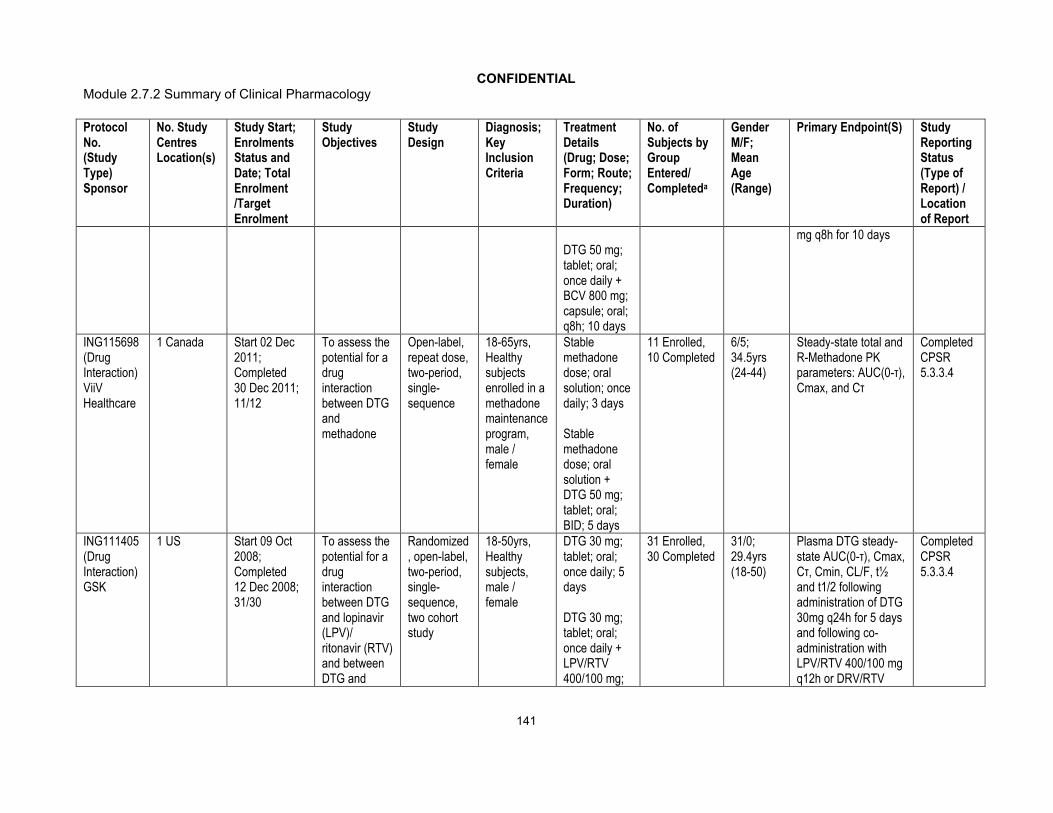
CONFIDENTIALModule 2.7.2 Summary of Clinical Pharmacology
141
Protocol No.(Study Type)Sponsor
No. Study Centres Location(s)
Study Start; Enrolments Status and Date; Total Enrolment /Target Enrolment
Study Objectives
Study Design
Diagnosis; Key Inclusion Criteria
Treatment Details (Drug; Dose; Form; Route; Frequency; Duration)
No. of Subjects by Group Entered/ Completeda
Gender M/F; Mean Age (Range)
Primary Endpoint(S) Study Reporting Status (Type of Report) / Location of Report
DTG 50 mg; tablet; oral; once daily +BCV 800 mg; capsule; oral; q8h; 10 days
mg q8h for 10 days
ING115698 (Drug Interaction)ViiV Healthcare
1 Canada Start 02 Dec 2011;Completed30 Dec 2011;11/12
To assess the potential for a drug interaction between DTG and methadone
Open-label, repeat dose, two-period, single-sequence
18-65yrs, Healthy subjects enrolled in a methadone maintenance program, male / female
Stable methadone dose; oral solution; once daily; 3 days
Stable methadone dose; oral solution + DTG 50 mg; tablet; oral; BID; 5 days
11 Enrolled, 10 Completed
6/5;34.5yrs(24-44)
Steady-state total and R-Methadone PK parameters: AUC(0-τ), Cmax, and Cτ
Completed CPSR5.3.3.4
ING111405 (Drug Interaction)GSK
1 US Start 09 Oct 2008; Completed 12 Dec 2008;31/30
To assess the potential for a drug interaction between DTG and lopinavir (LPV)/ ritonavir (RTV) and between DTG and
Randomized, open-label, two-period, single-sequence, two cohort study
18-50yrs, Healthy subjects, male / female
DTG 30 mg; tablet; oral; once daily; 5 days
DTG 30 mg; tablet; oral; once daily + LPV/RTV 400/100 mg;
31 Enrolled, 30 Completed
31/0; 29.4yrs (18-50)
Plasma DTG steady-state AUC(0-τ), Cmax, Cτ, Cmin, CL/F, t½ and t1/2 following administration of DTG 30mg q24h for 5 days and following co-administration with LPV/RTV 400/100 mg q12h or DRV/RTV
Completed CPSR5.3.3.4

CONFIDENTIALModule 2.7.2 Summary of Clinical Pharmacology
142
Protocol No.(Study Type)Sponsor
No. Study Centres Location(s)
Study Start; Enrolments Status and Date; Total Enrolment /Target Enrolment
Study Objectives
Study Design
Diagnosis; Key Inclusion Criteria
Treatment Details (Drug; Dose; Form; Route; Frequency; Duration)
No. of Subjects by Group Entered/ Completeda
Gender M/F; Mean Age (Range)
Primary Endpoint(S) Study Reporting Status (Type of Report) / Location of Report
darunavir (DRV)/ RTV
tablet; oral; q12h; 14 days
DTG 30 mg; tablet; oral; once daily + DRV (tablet) /RTV (capsule) 600/100 mg; oral; q12h; 14 days
600/100 mg q12h for 14 days
ING111602 (Drug Interaction)GSK
1 US Start 07 Jan 2009;Completed 05 Mar 2009;16/16
To assess the potential for a drug interaction between DTG and multivitamin and between DTG and Maalox
Open-label, single dose, randomized, four-period crossover study
18-65yrs, Healthy subjects, male/ female
DTG 50 mg; tablet; oral; single dose
DTG 50 mg; tablet; oral; single dose + multivitamin; tablet; oral; single dose
DTG 50 mg; tablet; oral; single dose + MaaloxAdvanced Maximum Strength;
16 Enrolled, 16 Completed
16/0; 30.8yrs (18-53)
Single dose plasma DTG AUC(0-∞), Cmax, and C24
Completed CPSR5.3.3.4
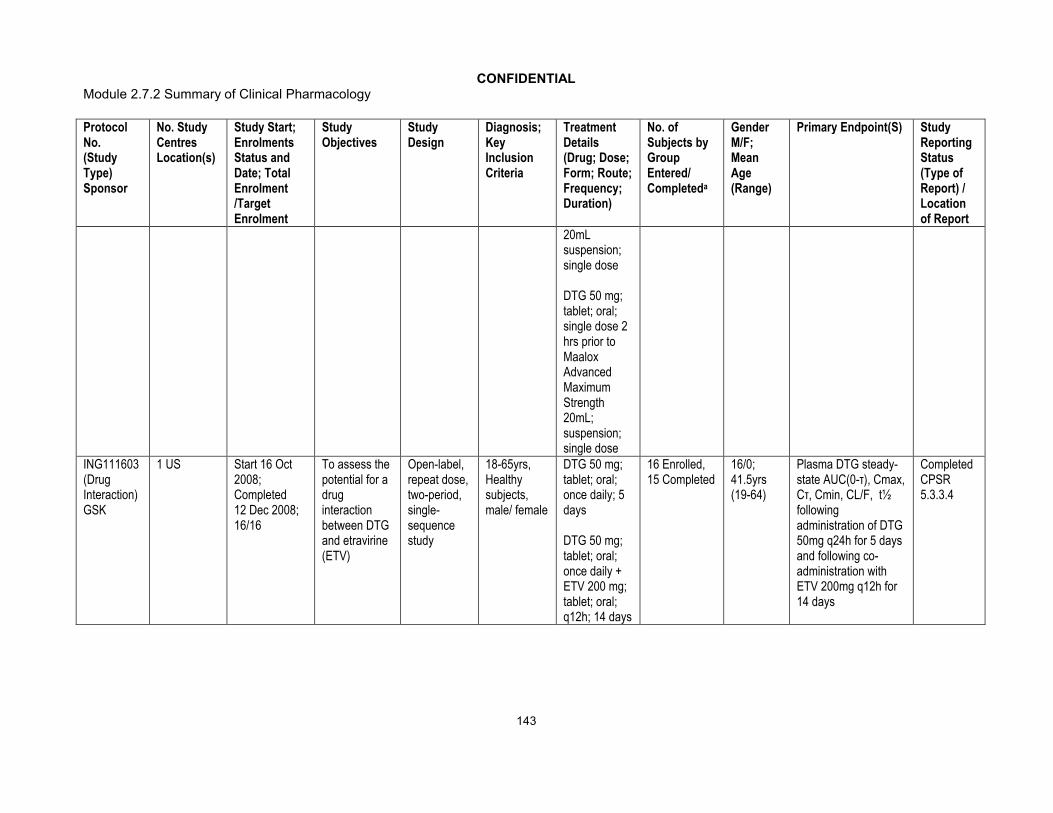
CONFIDENTIALModule 2.7.2 Summary of Clinical Pharmacology
143
Protocol No.(Study Type)Sponsor
No. Study Centres Location(s)
Study Start; Enrolments Status and Date; Total Enrolment /Target Enrolment
Study Objectives
Study Design
Diagnosis; Key Inclusion Criteria
Treatment Details (Drug; Dose; Form; Route; Frequency; Duration)
No. of Subjects by Group Entered/ Completeda
Gender M/F; Mean Age (Range)
Primary Endpoint(S) Study Reporting Status (Type of Report) / Location of Report
20mL suspension; single dose
DTG 50 mg; tablet; oral; single dose 2 hrs prior to MaaloxAdvanced Maximum Strength 20mL; suspension; single dose
ING111603 (Drug Interaction)GSK
1 US Start 16 Oct 2008;Completed12 Dec 2008;16/16
To assess the potential for a drug interaction between DTG and etravirine (ETV)
Open-label, repeat dose, two-period, single-sequence study
18-65yrs, Healthy subjects, male/ female
DTG 50 mg; tablet; oral; once daily; 5 days
DTG 50 mg; tablet; oral; once daily + ETV 200 mg; tablet; oral; q12h; 14 days
16 Enrolled, 15 Completed
16/0; 41.5yrs (19-64)
Plasma DTG steady-state AUC(0-τ), Cmax, Cτ, Cmin, CL/F, t½ following administration of DTG 50mg q24h for 5 days and following co-administration with ETV 200mg q12h for 14 days
Completed CPSR5.3.3.4

CONFIDENTIALModule 2.7.2 Summary of Clinical Pharmacology
144
Protocol No.(Study Type)Sponsor
No. Study Centres Location(s)
Study Start; Enrolments Status and Date; Total Enrolment /Target Enrolment
Study Objectives
Study Design
Diagnosis; Key Inclusion Criteria
Treatment Details (Drug; Dose; Form; Route; Frequency; Duration)
No. of Subjects by Group Entered/ Completeda
Gender M/F; Mean Age (Range)
Primary Endpoint(S) Study Reporting Status (Type of Report) / Location of Report
ING111604 (Drug Interaction)GSK
1 US Start 11 Aug 2008; Completed 01 Oct 2008; 16/16
To assess the potential for a drug interaction between DTG and tenofovir (TDF)
Open-label, repeat-dose, single-sequence, three-period study
18-65yrs, Healthy subjects, male/ female
DTG 50 mg; tablet; oral; once daily; 5 days
TDF 300 mg; tablet; oral; once daily; 7 days
DTG 50 mg; tablet; oral; once daily + TDF 300 mg; tablet; oral; once daily; 5 days
16 Enrolled,15 Completed
15/1;38.6yrs
(20-58)
Plasma DTG steady-state AUC[0-], Cmax and C following administration of DTG 50 mg q24h for 5 days and following co-administration with TDF 300 mg q24h for 5 days
Completed CPSR5.3.3.4
ING111854 (Drug Interaction)GSK
1 US Start 07 Apr 2009;Completed09 Jun 2009;24/24
To assess the potential for a drug interaction between DTG and atazanavir (ATV) and between DTG and ATV/RTV
Randomized, open-label, repeat dose, two-period, single-sequence, two-cohort study
18-65yrs, Healthy subjects, male / female
Period 1:DTG 30 mg; tablet; oral; once daily; 5 days; fed
Period 2:DTG 30 mg; tablet; oral; once daily + ATV/RTV 300/100 mg; capsule; once
24 Enrolled,24 Completed
21/3; 37.2yrs (18-61)
Plasma DTG steady-state AUC(0-τ), Cmax, C0, Cτ, and Cmin following administration of DTG 30mg q24h for 5 days and following co-administration with ATV/RTV 300/100mg q24h or ATV 400mg q24h for 14 days
Completed CPSR5.3.3.4

CONFIDENTIALModule 2.7.2 Summary of Clinical Pharmacology
145
Protocol No.(Study Type)Sponsor
No. Study Centres Location(s)
Study Start; Enrolments Status and Date; Total Enrolment /Target Enrolment
Study Objectives
Study Design
Diagnosis; Key Inclusion Criteria
Treatment Details (Drug; Dose; Form; Route; Frequency; Duration)
No. of Subjects by Group Entered/ Completeda
Gender M/F; Mean Age (Range)
Primary Endpoint(S) Study Reporting Status (Type of Report) / Location of Report
daily; 14 days
DTG 30 mg; tablet; oral; once daily + ATV 400mg; capsule; oral; once daily; 14 days
ING111855 (Drug Interaction)ViiV Healthcare
1 US Start 13 Dec 2011;Completed28 Mar 2012;16/16
To assess the potential for a drug interaction between DTG and oral contraceptives (ethinyl estradiol (EE) /norgestimate [NGM])
Randomized, two-period, double-blind study
18-40yrs, Healthy subjects, female
DTG 50 mg or placebo; oral; tablet; once daily days 1-11 and DTG 50 mg or placebo; tablet; oral; once dailydays 12-21
EE / NGM; tablet; oral; once dailydays 1-21
16 Enrolled, 15 Completed
0/16;31.1yrs (20-40)
AUC[0-τ] of Norelgestromin and EE after Ortho-Cyclen alone and afterOrtho-Cyclen with DTG
Completed CPSR5.3.3.4
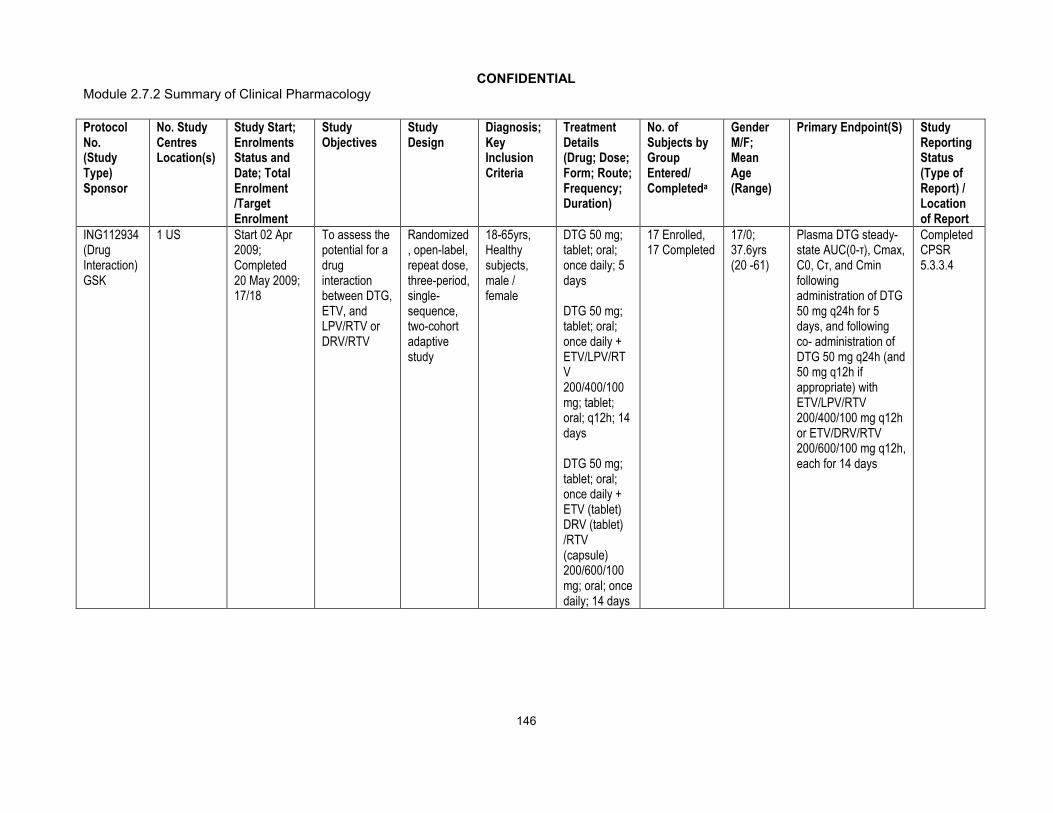
CONFIDENTIALModule 2.7.2 Summary of Clinical Pharmacology
146
Protocol No.(Study Type)Sponsor
No. Study Centres Location(s)
Study Start; Enrolments Status and Date; Total Enrolment /Target Enrolment
Study Objectives
Study Design
Diagnosis; Key Inclusion Criteria
Treatment Details (Drug; Dose; Form; Route; Frequency; Duration)
No. of Subjects by Group Entered/ Completeda
Gender M/F; Mean Age (Range)
Primary Endpoint(S) Study Reporting Status (Type of Report) / Location of Report
ING112934 (Drug Interaction)GSK
1 US Start 02 Apr 2009;Completed20 May 2009;17/18
To assess the potential for a drug interaction between DTG, ETV, and LPV/RTV or DRV/RTV
Randomized, open-label, repeat dose, three-period, single-sequence, two-cohort adaptive study
18-65yrs, Healthy subjects, male / female
DTG 50 mg; tablet; oral; once daily; 5 days
DTG 50 mg; tablet; oral; once daily + ETV/LPV/RTV 200/400/100 mg; tablet; oral; q12h; 14 days
DTG 50 mg; tablet; oral; once daily + ETV (tablet) DRV (tablet) /RTV (capsule) 200/600/100 mg; oral; once daily; 14 days
17 Enrolled, 17 Completed
17/0;37.6yrs (20 -61)
Plasma DTG steady-state AUC(0-τ), Cmax, C0, Cτ, and Cmin following administration of DTG 50 mg q24h for 5 days, and following co- administration of DTG 50 mg q24h (and 50 mg q12h if appropriate) with ETV/LPV/RTV 200/400/100 mg q12h or ETV/DRV/RTV 200/600/100 mg q12h, each for 14 days
Completed CPSR5.3.3.4

CONFIDENTIALModule 2.7.2 Summary of Clinical Pharmacology
147
Protocol No.(Study Type)Sponsor
No. Study Centres Location(s)
Study Start; Enrolments Status and Date; Total Enrolment /Target Enrolment
Study Objectives
Study Design
Diagnosis; Key Inclusion Criteria
Treatment Details (Drug; Dose; Form; Route; Frequency; Duration)
No. of Subjects by Group Entered/ Completeda
Gender M/F; Mean Age (Range)
Primary Endpoint(S) Study Reporting Status (Type of Report) / Location of Report
ING112941 (Drug Interaction)GSK
1 US Start 23 Jul 2009;Completed28 Sep 2009;Part 1: 14/14,Part 2: 10/10
To evaluate the effect of a high fat meal and omeprazole on DTG PK and to evaluate the safety and PK of a 250 mg dose of DTG
Part 1: Randomized, open-label, two sequence, three treatment crossover
Part 2: Randomized, double-blind, single dose PK study
18-65yrs, healthy subjects, male / female
Part 1: DTG 50 mg; tablet; oral; single dose; fasted
DTG 50 mg; tablet; oral; single dose; within 30 minutes after the start of a high fat meal
DTG 50 mg; tablet; oral; single dose + omeprazole 40 mg; capsule; oral; once daily; 5 days
Part 2: DTG 250 mg or placebo; oral suspension, single dose; fasted
Part 1: 14 Enrolled, 12 Completed
Part 2: 10 Enrolled (includes 2 placebo), 10 Completed
Part 1: 12/2;40.6yrs (23-55)
Part 2: 9/1;38.4yrs (21-54)
Plasma DTG following a single dose administration of 50 mg under fasted conditions with and without OMP 40 mg: AUC(0-t), AUC(0-∞), Cmax, tmax, C24, tlag
Plasma DTG following a single dose administration of 50 mg under fasted conditions and with a high-fat meal: AUC(0-t), AUC(0-∞), Cmax, tmax, C24, and tlag
Plasma DTG following a single dose administration of 250 mg under fastedconditions: AUC(0-t), AUC(0-∞), Cmax, tmax, C24, and tlagSafety and tolerability parameters following a single supratherapeutic dose of DTG 250 mg
Completed CPSR5.3.3.4

CONFIDENTIALModule 2.7.2 Summary of Clinical Pharmacology
148
Protocol No.(Study Type)Sponsor
No. Study Centres Location(s)
Study Start; Enrolments Status and Date; Total Enrolment /Target Enrolment
Study Objectives
Study Design
Diagnosis; Key Inclusion Criteria
Treatment Details (Drug; Dose; Form; Route; Frequency; Duration)
No. of Subjects by Group Entered/ Completeda
Gender M/F; Mean Age (Range)
Primary Endpoint(S) Study Reporting Status (Type of Report) / Location of Report
ING113068 (Drug Interaction)ViiV Healthcare
1 US Start 09 Sep 2010;Completed04 Nov 2010;Part A: 12/12,Part B: 15/15
To investigate the effects of fosamprenavir (FPV)/ RTV on the steady-state PK of DTG and to evaluate relative bioavailability of tablets with varying particle size
Part A: Open-label, repeat dose, two-period, single-sequence
Part B: Open-label, single dose, randomized, three-period, cross over study
18-65yrs, Healthy subjects, male / female
Part A:DTG 50 mg; tablet; oral; once daily; 5 days
DTG 50 mg; tablet; oral; once daily + FPV 700 mg; tablet / RTV 100 mg; capsule; oral; q12h; 10 days
Part B:DTG 50 mg using 25 mg tablets with micronized drug substance; oral; single dose
DTG 50 mg using 25 mg tablets with unmicronized drug
Part A: 12 Enrolled12, Completed
Part B: 15 Enrolled, 15 Completed
Part A: 10/2; 33.4yrs(24-55)
Part B: 4/11; 34.7yrs(20-60)
Part A: Plasma DTG steady-state AUC(0-), Cmax, C0, C, and Cmin following administration of DTG 50 mg q24h for 5 days and following co-administration with FPV/RTV 700/100 mg q12h for 10 days
Part B: Plasma DTG AUC(0-), AUC(0-t), and Cmax following a single dose of DTG 50 mg
Completed CPSR5.3.3.4

CONFIDENTIALModule 2.7.2 Summary of Clinical Pharmacology
149
Protocol No.(Study Type)Sponsor
No. Study Centres Location(s)
Study Start; Enrolments Status and Date; Total Enrolment /Target Enrolment
Study Objectives
Study Design
Diagnosis; Key Inclusion Criteria
Treatment Details (Drug; Dose; Form; Route; Frequency; Duration)
No. of Subjects by Group Entered/ Completeda
Gender M/F; Mean Age (Range)
Primary Endpoint(S) Study Reporting Status (Type of Report) / Location of Report
substance; oral; single dose
DTG 50 mg using 25 mg tablets with intermediate particle size drug substance; oral; single dose

CONFIDENTIALModule 2.7.2 Summary of Clinical Pharmacology
150
Protocol No.(Study Type)Sponsor
No. Study Centres Location(s)
Study Start; Enrolments Status and Date; Total Enrolment /Target Enrolment
Study Objectives
Study Design
Diagnosis; Key Inclusion Criteria
Treatment Details (Drug; Dose; Form; Route; Frequency; Duration)
No. of Subjects by Group Entered/ Completeda
Gender M/F; Mean Age (Range)
Primary Endpoint(S) Study Reporting Status (Type of Report) / Location of Report
ING113096 (Drug Interaction)GSK
1 US Start 15 Feb 2010;Completed05 Apr 2010;18/18
To assess the safety, tolerability and PK of repeat dose co-administration of DTG alone, tipranavir (TPV)/RTV alone, and DTG in combination with TPV/RTV
Randomized, open-label, repeat dose, three-period single-sequence, study
18-55yrs, Healthy subjects, male / female
DTG 50 mg; tablet; oral; once daily; 5 days
TPV / RTV 500/200 mg; capsule; oral; BID; 7 days
DTG 50 mg; tablet; oral; once daily andTPV / RTV 500/200 mg; capsule; oral; BID; 5 days
18 Enrolled,13 Completed
14/4;29.3yrs (19-45)
Plasma DTG steady-state AUC(0-), Cmax, C0, C, and Cmin following administration of DTG 50 mg once daily for 5 days and following co-administration with TPV/RTV 500/200 mg BID for 5 days
Completed CPSR5.3.3.4
ING114005 (Drug Interaction)ViiV Healthcare
1 US Start 16 Mar 2010;Completed 26 May 2010;12/12
To evaluate PK of DTG 100 mg versus 50 mg and the effect of efavirenz (EFV) on the PK, safety and tolerability of DTG 50 mg
Open label, repeat dose, three period single-sequence
18-65yrs, Healthy subjects, male / female
DTG 100 mg; tablet; oral; single dose
DTG 50 mg; tablet; oral; once daily; 5 days
DTG 50 mg; tablet; oral; once daily in
12 Enrolled,12 Completed
12/0; 38.7yrs (20-65)
Plasma DTG AUC(0-24), Cmax, and C24, and dose-normalized AUC(0-24), Cmax, and C24 following single dose administration of 100 mg and 50 mg
Plasma DTG steady-state AUC(0-), Cmax, C0, C, and
Completed CPSR5.3.3.4

CONFIDENTIALModule 2.7.2 Summary of Clinical Pharmacology
151
Protocol No.(Study Type)Sponsor
No. Study Centres Location(s)
Study Start; Enrolments Status and Date; Total Enrolment /Target Enrolment
Study Objectives
Study Design
Diagnosis; Key Inclusion Criteria
Treatment Details (Drug; Dose; Form; Route; Frequency; Duration)
No. of Subjects by Group Entered/ Completeda
Gender M/F; Mean Age (Range)
Primary Endpoint(S) Study Reporting Status (Type of Report) / Location of Report
AM + EFV 600 mg; tablet; oral; once daily in PM; 14 days
Cmin following administration of DTG 50 mg q24h for 5 days and following co-administration with EFV 600 mg q24h for 14 days
LAI116181 (Drug Interaction)ViiV Healthcare
1 US Start 07 Nov 2011; Completed20 Feb 2012;Cohort 1: 16/16,Cohort 2: 12/12
To assess the potential for a drug interaction between DTG and rilpivirine (RPV)
Open label, repeat dose, single-sequence, 3-period study
18-55yrs Healthy subjects, male / female
Cohort 1: Treatment A = DTG 50 mg; tablet; oral; q24h; 5 days
Treatment B = RPV 25 mg; tablet; oral; q24h; 11 days
Treatment C = RPV 25 mg; tablet; oral; q24h + DTG 50 mg; tablet; oral; q24h; 5 days
Cohort 1: 16 Enrolled, 16 Completed
Cohort 2: 12 Enrolled, 11 Completed
24/4; 31.4yrs (18-50)
Plasma DTG AUC(0-τ), Cmax, and tmax, and Cτ, following 50 mg q24h administration with and without RPV 25 mgq24h
Plasma GSK1265744 steady-state AUC(0-τ), Cmax, tmax, and Cτ followingGSK1265744 30 mg q24h administration with and without RPV 25 mg q24h
Plasma RPV steady-state AUC(0-τ), Cmax,
Completed CPSR5.3.4.4
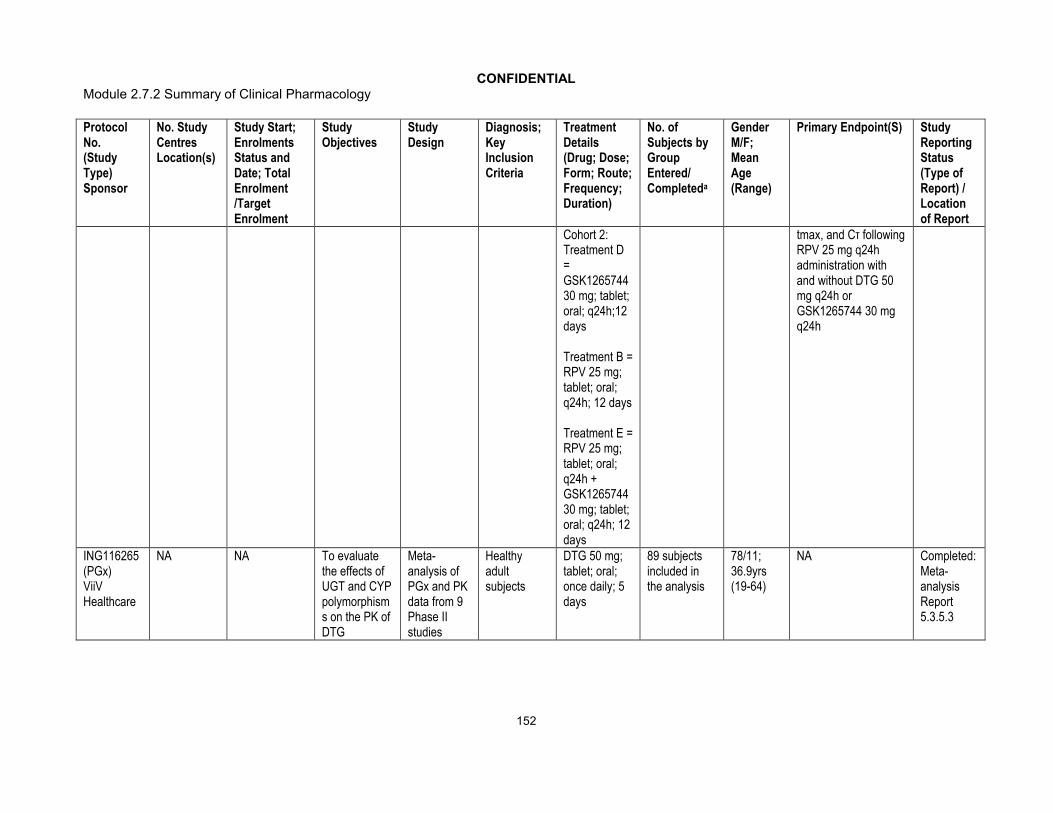
CONFIDENTIALModule 2.7.2 Summary of Clinical Pharmacology
152
Protocol No.(Study Type)Sponsor
No. Study Centres Location(s)
Study Start; Enrolments Status and Date; Total Enrolment /Target Enrolment
Study Objectives
Study Design
Diagnosis; Key Inclusion Criteria
Treatment Details (Drug; Dose; Form; Route; Frequency; Duration)
No. of Subjects by Group Entered/ Completeda
Gender M/F; Mean Age (Range)
Primary Endpoint(S) Study Reporting Status (Type of Report) / Location of Report
Cohort 2: Treatment D = GSK1265744 30 mg; tablet; oral; q24h;12 days
Treatment B = RPV 25 mg; tablet; oral; q24h; 12 days
Treatment E = RPV 25 mg; tablet; oral; q24h + GSK1265744 30 mg; tablet; oral; q24h; 12 days
tmax, and Cτ following RPV 25 mg q24hadministration with and without DTG 50 mg q24h or GSK1265744 30 mg q24h
ING116265 (PGx)ViiV Healthcare
NA NA To evaluate the effects of UGT and CYP polymorphisms on the PK of DTG
Meta-analysis of PGx and PK data from 9 Phase II studies
Healthy adult subjects
DTG 50 mg; tablet; oral; once daily; 5 days
89 subjects included in the analysis
78/11; 36.9yrs (19-64)
NA Completed: Meta-analysis Report 5.3.5.3

CONFIDENTIALModule 2.7.2 Summary of Clinical Pharmacology
153
Protocol No.(Study Type)Sponsor
No. Study Centres Location(s)
Study Start; Enrolments Status and Date; Total Enrolment /Target Enrolment
Study Objectives
Study Design
Diagnosis; Key Inclusion Criteria
Treatment Details (Drug; Dose; Form; Route; Frequency; Duration)
No. of Subjects by Group Entered/ Completeda
Gender M/F; Mean Age (Range)
Primary Endpoint(S) Study Reporting Status (Type of Report) / Location of Report
Human Pharmacodynamic StudiesING111856 (PD)GSK
1 US Start 28 Sep 2009;Completed29 Dec 2009;42/42
To evaluate the effect of DTG on cardiac conduction as assessed by 12-lead electrocardiogram compared to placebo and moxifloxacin (Thorough QTc study of DTG)
Randomized, partial-blind, single dose, three-period, cross-over study
18-55yrs, Healthy subjects, male / female
DTG 250 mg; oral suspension; single dose
Placebo; oral suspension; single dose
Moxifloxacin 400 mg; tablet; oral; single dose
42 Enrolled, 38 Completed
17/25;34.5yrs (18-55)
Change from Baseline in QTcF for DTG
Completed CPSR5.3.4.1
ING114819 (PD)ViiV Healthcare
1 US Start 05 Oct 2010;Completed03 Dec 2010;38/36
To evaluate the effect of DTG on glomerular filtration rate as measured by iohexol and to evaluate creatinine clearance, extra-glomerular creatinine excretion, and
Open-label, randomized, three-arm, parallel, placebo-controlled
18-65yrs, Healthy subjects, male / female
DTG 50 mg; tablet; oral; once daily; 14 days
DTG 50 mg; tablet; oral; q12h; 14 days
Placebo; tablet; oral; once daily; 14 days
38 Enrolled,34 Completed
28/10; 31.8yrs (19-59)
GFR as measured by iohexol plasma clearance at Days -1, 7, and 14
Completed CPSR5.3.4.1
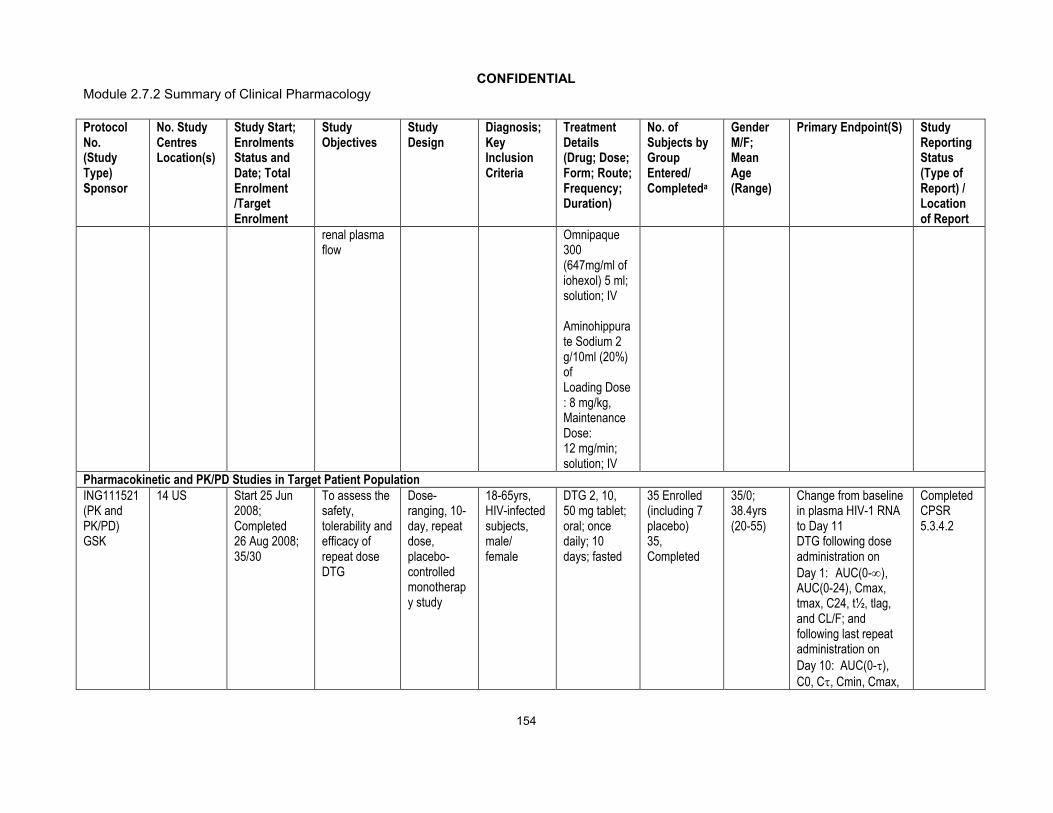
CONFIDENTIALModule 2.7.2 Summary of Clinical Pharmacology
154
Protocol No.(Study Type)Sponsor
No. Study Centres Location(s)
Study Start; Enrolments Status and Date; Total Enrolment /Target Enrolment
Study Objectives
Study Design
Diagnosis; Key Inclusion Criteria
Treatment Details (Drug; Dose; Form; Route; Frequency; Duration)
No. of Subjects by Group Entered/ Completeda
Gender M/F; Mean Age (Range)
Primary Endpoint(S) Study Reporting Status (Type of Report) / Location of Report
renal plasma flow
Omnipaque 300 (647mg/ml of iohexol) 5 ml; solution; IV
Aminohippurate Sodium 2 g/10ml (20%) ofLoading Dose : 8 mg/kg, Maintenance Dose:12 mg/min; solution; IV
Pharmacokinetic and PK/PD Studies in Target Patient PopulationING111521 (PK and PK/PD)GSK
14 US Start 25 Jun 2008;Completed 26 Aug 2008;35/30
To assess the safety, tolerability and efficacy of repeat dose DTG
Dose-ranging, 10-day, repeat dose, placebo-controlled monotherapy study
18-65yrs, HIV-infected subjects, male/female
DTG 2, 10, 50 mg tablet; oral; once daily; 10 days; fasted
35 Enrolled (including 7 placebo) 35, Completed
35/0;38.4yrs (20-55)
Change from baseline in plasma HIV-1 RNA to Day 11DTG following dose administration on Day 1: AUC(0-), AUC(0-24), Cmax, tmax, C24, t½, tlag, and CL/F; and following last repeat administration on Day 10: AUC(0-),C0, C, Cmin, Cmax,
Completed CPSR5.3.4.2

CONFIDENTIALModule 2.7.2 Summary of Clinical Pharmacology
155
Protocol No.(Study Type)Sponsor
No. Study Centres Location(s)
Study Start; Enrolments Status and Date; Total Enrolment /Target Enrolment
Study Objectives
Study Design
Diagnosis; Key Inclusion Criteria
Treatment Details (Drug; Dose; Form; Route; Frequency; Duration)
No. of Subjects by Group Entered/ Completeda
Gender M/F; Mean Age (Range)
Primary Endpoint(S) Study Reporting Status (Type of Report) / Location of Report
tmax, t½, and CL/F, if data permit
Safety and tolerability parameters
ING116070 (PK)ViiV Healthcare
3 US Start 24 Jan2012; Ongoing; 13/14
To determine plasma (total and unbound) DTG concentration and evaluate the relationship between DTG concentration in plasma and CSF
Phase IIIb single-arm, open-label, multicenter study
18yrs, HIV-infected, ART-naïve subjects, male / female
DTG 50 mg; tablet; oral; once daily + ABC/3TC 600/300 mg; tablet; oral; once daily; 96 weeks
13 Enrolled, 12 Ongoing
ITT-E:13/0;40.2yrs (28-52)
Proportion of subjects with plasma HIV-1 RNA <50 c/mL over time;
Absolute values and change from Baseline in plasma HIV-1 RNA over time;Absolute values and changes from Baseline in CD4+ and CD8+ T cell counts overtime
Incidence of disease progression HIV-associated conditions, acquiredimmunodeficiency syndrome [AIDS] and death
CompletedWeek 2 Synoptic Clinical Study Report (CSR)5.3.4.2

CONFIDENTIALModule 2.7.2 Summary of Clinical Pharmacology
156
Protocol No.(Study Type)Sponsor
No. Study Centres Location(s)
Study Start; Enrolments Status and Date; Total Enrolment /Target Enrolment
Study Objectives
Study Design
Diagnosis; Key Inclusion Criteria
Treatment Details (Drug; Dose; Form; Route; Frequency; Duration)
No. of Subjects by Group Entered/ Completeda
Gender M/F; Mean Age (Range)
Primary Endpoint(S) Study Reporting Status (Type of Report) / Location of Report
ING112276 (PK and PK/PD)ViiV Healthcare
34 centres:6 France, 4 Germany, 3 Russia, 4 Italy, 5 Spain, 12 US
Start 30 Jul 2009; Ongoing;205/200
To select a once daily oral dose of DTG administered with either ABC/3TC or TDF/ emtricitabine (FTC) and to evaluate antiviral activity, safety and PK over time
Phase IIb, Randomized, multicentre, parallel group, dose-ranging
18yrs, HIV-infected, ART-naïve subjects, male / female
DTG 10 mg; tablet; oral + ABC/3TC 600mg/300 mg or TDF/FTC 300mg/200mg; tablet; oral; once daily; 96 weeks
DTG 25 mg; tablet; oral + ABC/3TC 600mg/300mg or TDF/FTC 300mg/200mg; oral; once daily; 96 weeks
DTG 50 mg; tablet; oral + ABC/3TC 600mg/300mg or TDF/FTC 300mg/200mg; oral; once daily; 96 weeks
DTG 10 mg: 53 Randomized, 47 Completed DTG 25 mg: 51 Randomized, 45 Completed
DTG 50 mg: 51 Randomized, 46 Completed
EFV 600 mg: 50 Randomized, 39 Completed
DTG 50 mg Open label: 138 Enrolled, 127 Ongoing
177/28; 37.2yrs (20-79)
Proportion of subjectswith HIV-1 RNA <50 c/mL (c/mL) through Week 16 using the Time to Loss of Virological Response (TLOVR) algorithm. Dose selection will be based primarily on antiviral activity and tolerability in conjunction with immunologic, safety and PK measures will also be considered
Completed:
(Week 16 Synoptic CSR)
(Week 24 Full CSR)
(Week 48 Abbreviated CSR)
(Week 96 Full CSR)
5.3.5.1

CONFIDENTIALModule 2.7.2 Summary of Clinical Pharmacology
157
Protocol No.(Study Type)Sponsor
No. Study Centres Location(s)
Study Start; Enrolments Status and Date; Total Enrolment /Target Enrolment
Study Objectives
Study Design
Diagnosis; Key Inclusion Criteria
Treatment Details (Drug; Dose; Form; Route; Frequency; Duration)
No. of Subjects by Group Entered/ Completeda
Gender M/F; Mean Age (Range)
Primary Endpoint(S) Study Reporting Status (Type of Report) / Location of Report
EFV 600 mg + ABC/3TC 600mg/300mg or TDF/FTC 300mg/200 mg; oral; once daily; 96 weeks
ING113086 (PK and PK/PD)ViiV Healthcare
100 centres:27 Spain 19 US,12 France, 11 Russia, 10 Germany, 7 Canada,7 Italy,4 Australia,3 UK
Start 19 Oct 2010;Ongoing; 822/788
To assess safety and efficacy of DTG 50 mg once daily to RAL 400 mg BID both administered with fixed-dose dual nucleoside reverse transcriptase inhibitor therapy
Phase III, multicentre randomized,double blind, double-dummy, active-controlled, parallel group, fully-powered non-inferiority study
18yrs, HIV-infected, ART-naïve subjects, male / female
DTG 50 mg; tablet; oral; once daily orRAL 400 mg; tablet; oral; once daily + ABC/3TC 600mg/300mg or TDF/ FTC 300mg/200mg; tablet; oral; once daily; 96 weeks
DTG: 411 Randomized, 359 Ongoing. RAL: 411 Randomized, 345 Ongoing
703/119; 37.0yrs (18-75)
The proportion of subjects with HIV-1 RNA <50 c/mL through Week 48 using a Missing, Switch or Discontinuation = Failure (MSDF) algorithm
Completed: Week 48 Full CSR5.3.5.1
ING111762 (PK and PK/PD)ViiV Healthcare
185 centres: 4 Belgium, 12 France,4 Greece,1 Hungary,7 Italy,
Start 26 Oct 2010; Ongoing;719/688
To evaluate safety and efficacy of DTG 50 mg once daily vs. raltegravir
Phase 3, multicentre randomized, double-blind, active-controlled,
18yrs, HIV-infected, ART-experienced subjects, integrase
DTG 50 mg; tablet; oral; once daily orRAL 400 mg; tablet; oral; BID +
DTG: 362 Randomized, 48 Completed, 263 Ongoing
487/232; 42.5yrs (18-73)
The proportion of subjects with HIV-1 RNA <50 c/mL through Week 48 using MSDF algorithm as codified by the
Completed: Week 24 Full CSR 5.3.5.1

CONFIDENTIALModule 2.7.2 Summary of Clinical Pharmacology
158
Protocol No.(Study Type)Sponsor
No. Study Centres Location(s)
Study Start; Enrolments Status and Date; Total Enrolment /Target Enrolment
Study Objectives
Study Design
Diagnosis; Key Inclusion Criteria
Treatment Details (Drug; Dose; Form; Route; Frequency; Duration)
No. of Subjects by Group Entered/ Completeda
Gender M/F; Mean Age (Range)
Primary Endpoint(S) Study Reporting Status (Type of Report) / Location of Report
2 Netherlands,3 Romania,24 Spain,4 UK,6 Canada,72 USA,6 Argentina,2 Australia,9 Brazil,5 Chile,4 Mexico,12 Russia,3 South Africa,5 Taiwan
(RAL) 400 mg BID, both administered with an investigator-selected background regimen
parallel group, non-inferiority study
inhibitor naïve regimen, male / female
Investigator-selected background regimen; 48 weeks
RAL: 357 Randomized, 57 Completed, 242 Ongoing
FDA’s “snapshot algorithm. The proportion of subjects with plasma HIV-1 RNA <50 c/mL will also be assessed at Week 24
ING112961 (PK and PK/PD)ViiV Healthcare
16 centres: 7 France,1 Italy, 2 Spain,6 US
Start 31 Aug 2009; Ongoing; Cohort I: 27/30,Cohort II: 24/50
To assess the antiviral activity of DTG containing regimen
Phase IIb, multicentre, open-label, single-arm, sequential cohort, pilot study
18yrs, HIV-infected, ART-experiencedsubjects, raltegravir resistance, male / female
Cohort I: DTG 50 mg; tablet; oral; once daily; 96 weeks
Cohort II: DTG 50 mg; tablet; oral; BID; 48 weeks
Cohort I: 27 Randomized, 12 Ongoing
Cohort II: 24 Randomized, 17 Ongoing
Cohort I: 25/2;46.7yrs (19-61)
Cohort II: 18/6;47.4yrs (33-68)
The proportion of subjects with Day 11 plasma HIV-1 RNA <400 c/mL or at least 0.7 log10 c/mL below their Baseline value (sample for evaluation of plasma HIV-1 RNA to be taken prior to Day 11 background treatment optimization)
Completed:
(Week 24 Cohort 1 Full CSR)
(Week 72 Cohort I/ Week 24 Cohort II Full CSR)
(Week 96 Cohort I/
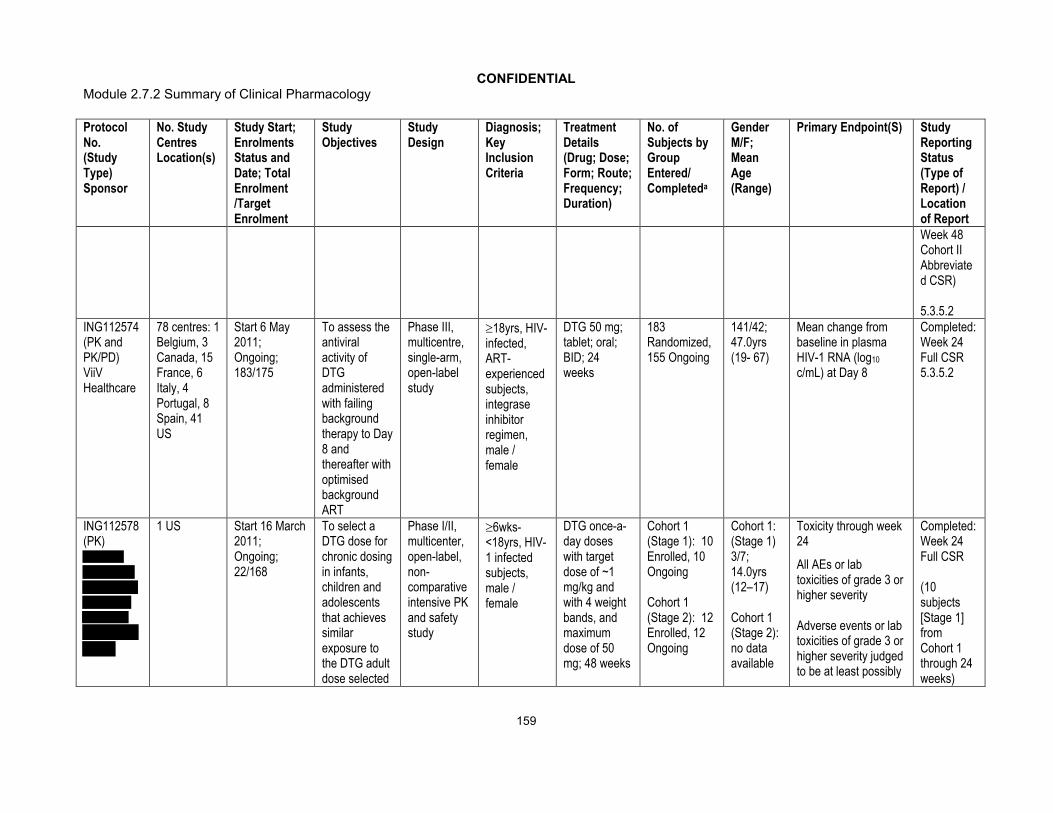
CONFIDENTIALModule 2.7.2 Summary of Clinical Pharmacology
159
Protocol No.(Study Type)Sponsor
No. Study Centres Location(s)
Study Start; Enrolments Status and Date; Total Enrolment /Target Enrolment
Study Objectives
Study Design
Diagnosis; Key Inclusion Criteria
Treatment Details (Drug; Dose; Form; Route; Frequency; Duration)
No. of Subjects by Group Entered/ Completeda
Gender M/F; Mean Age (Range)
Primary Endpoint(S) Study Reporting Status (Type of Report) / Location of ReportWeek 48 Cohort II Abbreviated CSR)
5.3.5.2ING112574 (PK and PK/PD)ViiV Healthcare
78 centres: 1 Belgium, 3 Canada, 15 France, 6 Italy, 4 Portugal, 8 Spain, 41 US
Start 6 May 2011; Ongoing; 183/175
To assess the antiviral activity of DTG administered with failing background therapy to Day 8 and thereafter with optimised background ART
Phase III, multicentre, single-arm, open-label study
18yrs, HIV-infected, ART-experiencedsubjects, integrase inhibitor regimen, male / female
DTG 50 mg; tablet; oral; BID; 24 weeks
183 Randomized, 155 Ongoing
141/42;47.0yrs (19- 67)
Mean change from baseline in plasma HIV-1 RNA (log10
c/mL) at Day 8
Completed: Week 24 Full CSR 5.3.5.2
ING112578 (PK)
1 US Start 16 March 2011;Ongoing;22/168
To select a DTG dose for chronic dosing in infants, children and adolescents that achieves similar exposure to the DTG adult dose selected
Phase I/II, multicenter, open-label, non-comparative intensive PK and safety study
6wks-<18yrs, HIV-1 infected subjects, male / female
DTG once-a-day doses with target dose of ~1 mg/kg and with 4 weight bands, and maximum dose of 50 mg; 48 weeks
Cohort 1 (Stage 1): 10 Enrolled, 10 Ongoing
Cohort 1 (Stage 2): 12 Enrolled, 12 Ongoing
Cohort 1: (Stage 1) 3/7;14.0yrs (12–17)
Cohort 1 (Stage 2): no data available
Toxicity through week 24
All AEs or lab toxicities of grade 3 or higher severity
Adverse events or lab toxicities of grade 3 or higher severity judged to be at least possibly
Completed:Week 24 Full CSR
(10 subjects [Stage 1] from Cohort 1 through 24 weeks)

CONFIDENTIALModule 2.7.2 Summary of Clinical Pharmacology
160
Protocol No.(Study Type)Sponsor
No. Study Centres Location(s)
Study Start; Enrolments Status and Date; Total Enrolment /Target Enrolment
Study Objectives
Study Design
Diagnosis; Key Inclusion Criteria
Treatment Details (Drug; Dose; Form; Route; Frequency; Duration)
No. of Subjects by Group Entered/ Completeda
Gender M/F; Mean Age (Range)
Primary Endpoint(S) Study Reporting Status (Type of Report) / Location of Report
from the Phase IIb clinical trial in ART-naïve adult subjects (ING112276), to evaluate safety, tolerability, and steady-state PK of DTG in combination with other ARTs
attributable to the study medication
Termination from treatment due to a suspected adverse drug reaction (SADR)Death
Pharmacokinetics
AUC(0-24)
5.3.5.2

CONFIDENTIALModule 2.7.2 Summary of Clinical Pharmacology
161
Protocol No.(Study Type)Sponsor
No. Study Centres Location(s)
Study Start; Enrolments Status and Date; Total Enrolment /Target Enrolment
Study Objectives
Study Design
Diagnosis; Key Inclusion Criteria
Treatment Details (Drug; Dose; Form; Route; Frequency; Duration)
No. of Subjects by Group Entered/ Completeda
Gender M/F; Mean Age (Range)
Primary Endpoint(S) Study Reporting Status (Type of Report) / Location of Report
ING116529 (PK and PK/PD)ViiV Healthcare
26 US Start 18 Apr 2012; Ongoing; 4/30
To quantify the antiviral activity of DTG compared to placebo (PCB) when administered with failing background therapy for 7 days
Phase III, randomized, multicentre, placebo-controlled, double-blind followed by an openlabel phase
18yrs, HIV-infected, ART-experiencedsubjects, integrase inhibitor regimen, male / female
DTG 50 mg; tablet; oral; BID orPlacebo; tablet oral; BID + current failing regimen; 7 days
4 Randomized; 4 Ongoing
No data available
The mean change from baseline in plasma HIV-1 RNA (log10 c/mL) at Day 8, using a last observation carried forward with discontinuation equals baseline
Completed: Brief Study Summary5.3.5.4
a. For ongoing studies, the number of ongoing subjects reported as of data cut off date (~ or data cut off date in respective CSR)3TC = lamivudine; ABC = abacavir; ART = antiretroviral therapy; ATV = atazanavir; BA = bioavailability ; BCV = boceprevir; BID = twice daily; CPSR = clinical pharmacology study report ; CSR = clinical study report; DRV = darunavir; DTG = dolutegravir ; EE= ethinyl estradiol; EFV = efavirenz; ETR = etravirine; FPV = fosamprenavir; FTC = emtricitabine; IV = intravenous; LPV= lopinavir; NGM = norgestimate; OL = open label ; OMP = omeprazole ; PD = pharmacodynamics; PD = pharmacodynamics; PK = pharmacokinetics; PK = pharmacokinetics; QD = once daily; RAL = raltegravir; RBT = rifabutin; RIF = rifampin; RPV = rilpivirine; RTV = ritonavir; TDF = tenofovir disoproxil fumarate; TLV = telaprevir; TPV = tipranavir

CONFIDENTIALModule 2.7.2 Summary of Clinical Pharmacology
162
Appendix Table 2 Summary of Single Dose DTG Pharmacokinetic Parameters
Study/ Location of Study Report
Population/ No. of Subjectscompleted
Route of Administration/ Dosage Form
Dose/ No. of Subjects Parametera,c
Cmax (g/ml) Tmax(h)
AUC (0-)(g.h/mL)
T1/2(h)
C24(g/ml)
ING111207/ m5.3.3.1 Healthy adult/ 13 Oral Suspension 2 mg/ 8 0.23 (20) 0.63 (0.25-1.00) 2.78 (26) 12.7 (20) 0.038 (41)
5 mg/ 7 0.66 (20) 0.5 (0.50-1.50) 8.87 (27) 14.3 (25) 0.126 (28)
10 mg/ 8 1.23 (9) 0.63 (0.25-1.50) 14.6 (21) 12.7 (9) 0.196 (34)
25 mg/ 8 2.76 (12) 0.75 (0.50-1.50) 35.1 (30) 12.7 (21) 0.469 (41)
50 mg/ 6 4.56 (21) 1.25 (0.50-3.00) 73.2 (19) 14.2 (19) 1.06 (27)
100 mg/ 5 8.14 (12) 1.00 (0.75-3.00) 136 (24) 14.7 (23) 1.80 (33)
ING111322/ m5.3.3.1 Healthy adult/32 Oral Suspension 10mg/ 8 1.24 (12) 0.50 (0.50-1.00) 15.8(12) 11.8 (19) 0.23 (19)
25mg/ 10 2.66 (21) 1.00 (0.50-2.00) 43.1(28) 12.6 (17) 0.65 (33)
50mg/ 8 4.52 (20) 0.75 (0.50-1.00) 75.8(28) 12.6 (14) 1.18 (32)
ING111521/ m5.3.4.2 HIV-infected/ 35 Oral Tablet 2 mg (fasted)/ 9 0.18 (35) 1.5 (0.5-3.0) 2.63 (39) 10.7 (30) 0.03 (49)10 mg (fasted)/ 7 0.57 (28) 2.0(1.0-6.0) 10.1 (26) 11.8 (22) 0.15 (30)50 mg (fasted)/ 10 2.46 (32) 2.1 (1.0-3.97) 40.5 (33) 11.2 (29) 0.59 (31)
ING111602/ m5.3.3.4 Healthy adult/ 16 Oral Tablet 50 mg (alone)/ 16 2.03 (25) 2.5 (0.5-8.0) 35.6 (33) NR 0.51 (38)50 mg (+ multi-vitamin)/ 16
1.31 (25) 2.5 (0.5-8.0) 23.74 (30) NR 0.34 (33)
50 mg (+ Maalox)/ 16 0.56 (29) 2.5 (0.5-8.0) 9.40 (36) NR 0.13 (41)50 mg (+ Maalox 2 hrs post dose)/ 16
1.67 (51) 2.5 (0.5-8.0) 26.33 (45) NR 0.36 (42)
ING111853/ m5.3.3.1 Healthy adult/ 6 Oral Suspension 20 mg (fasted)/ 6 2.57 (24) 0.50 (0.50-2.00) 35.9 (12) 15.6 (16) N/AING111856/ m5.3.4.1 Healthy adult/ 42 Oral Suspension 250 mg (fasted)/ 41 12.4 (27) 3.08 (1.52-6.05) 167 (33) NR 3.86 (48) ING112941/ m5.3.3.4 Healthy adult/ 14 Oral Tablet 50 mg (fasted)/ 12 1.84 (44) 4.00 (1.00-5.00) 34.7 (57) 14.4 (21) 0.56 (63)
50 mg (fasted + OMP)/ 12 1.69 (19) 3.00 (1.00-5.03) 34.8 (26) 16.3 (20) 0.53 (27)
Oral Suspension 250 mg/ 8 14.1 (10) 2.50 (1.50-4.00) 278 (15) 14.5 (10) 4.08 (17)
ING113097/ m5.3.3.3 Healthy and moderate hepatic impairment adult/ 16
Oral Tablet 50 mg (fasted)/ 8 healthy matches
1.80 (49) 3.0 (1.0-4.0) 37.3 (47) 14.9 (24) 0.57 (44)
50 mg (fasted)/ 8 with moderate hepatic impairment
1.78 (17) 4.0 (2.0-5.0) 38.5 (30) 15.5 (19) 0.59 (36)

CONFIDENTIALModule 2.7.2 Summary of Clinical Pharmacology
163
Study/ Location of Study Report
Population/ No. of Subjectscompleted
Route of Administration/ Dosage Form
Dose/ No. of Subjects Parametera,c
Cmax (g/ml) Tmax(h)
AUC (0-)(g.h/mL)
T1/2(h)
C24(g/ml)
ING113125/ m5.3.3.3 Healthy and severe renal impairment adult/ 16
Oral Tablet 50 mg (fasted)/ 8 healthy matches
1.86 (45) 2.00 (1.0, 4.0) 37.1 (58) 15.4 (15) NR
50 mg (fasted)/ 8 with severe renal impairment
1.50 (34) 2.00 (1.0, 3.0) 23.5 (48) 12.7 (31) NR
ING114005/ m5.3.3.4 Healthy adult/ 12 Oral Tablet 50 mg (fasted)/ 12 1.83 (35) 2 (1-4) 24.3 (44)b 13.6 (24) 0.53 (59)
100 mg (fasted)/ 12 2.77 (35) 2 (1-4) 34.3 (41) NR 0.80 (53)
ING115381/m5.3.3.3
Healthy adult (Japanese)/ 10
Oral Tablet 50 mg(fasted)/ 10 2.14 (47) NR(2.0-4.0) 43.4 (46) 14.6 (10) 0.67 (45)
a. Data presented are geometric mean (%CVb) except for tmax where median (range) are presented.b. AUC(0-24) is reported.c. NR: not reported.
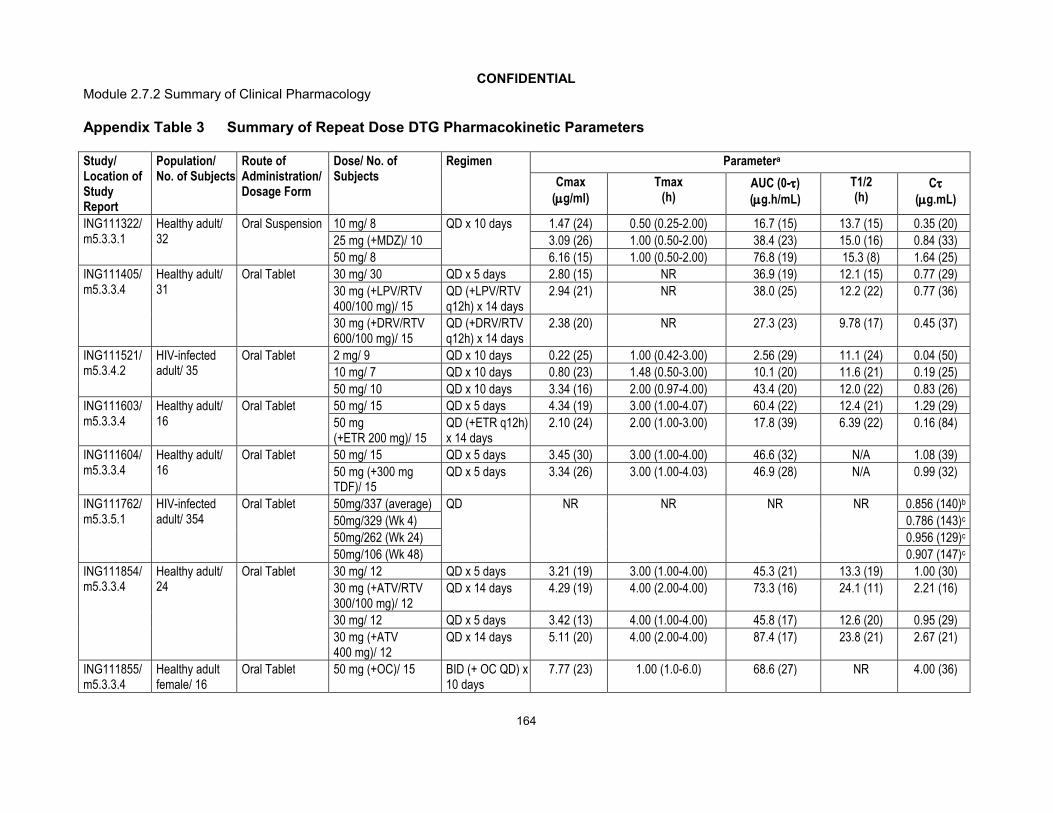
CONFIDENTIALModule 2.7.2 Summary of Clinical Pharmacology
164
Appendix Table 3 Summary of Repeat Dose DTG Pharmacokinetic Parameters
Study/ Location of Study Report
Population/ No. of Subjects
Route of Administration/ Dosage Form
Dose/ No. of Subjects
Regimen Parametera
Cmax (g/ml)
Tmax (h)
AUC (0-)(g.h/mL)
T1/2 (h)
C(g.mL)
ING111322/m5.3.3.1
Healthy adult/ 32
Oral Suspension 10 mg/ 8 QD x 10 days 1.47 (24) 0.50 (0.25-2.00) 16.7 (15) 13.7 (15) 0.35 (20)
25 mg (+MDZ)/ 10 3.09 (26) 1.00 (0.50-2.00) 38.4 (23) 15.0 (16) 0.84 (33)
50 mg/ 8 6.16 (15) 1.00 (0.50-2.00) 76.8 (19) 15.3 (8) 1.64 (25)
ING111405/m5.3.3.4
Healthy adult/ 31
Oral Tablet 30 mg/ 30 QD x 5 days 2.80 (15) NR 36.9 (19) 12.1 (15) 0.77 (29)
30 mg (+LPV/RTV 400/100 mg)/ 15
QD (+LPV/RTV q12h) x 14 days
2.94 (21) NR 38.0 (25) 12.2 (22) 0.77 (36)
30 mg (+DRV/RTV 600/100 mg)/ 15
QD (+DRV/RTV q12h) x 14 days
2.38 (20) NR 27.3 (23) 9.78 (17) 0.45 (37)
ING111521/m5.3.4.2
HIV-infected adult/ 35
Oral Tablet 2 mg/ 9 QD x 10 days 0.22 (25) 1.00 (0.42-3.00) 2.56 (29) 11.1 (24) 0.04 (50)
10 mg/ 7 QD x 10 days 0.80 (23) 1.48 (0.50-3.00) 10.1 (20) 11.6 (21) 0.19 (25)
50 mg/ 10 QD x 10 days 3.34 (16) 2.00 (0.97-4.00) 43.4 (20) 12.0 (22) 0.83 (26)
ING111603/ m5.3.3.4
Healthy adult/ 16
Oral Tablet 50 mg/ 15 QD x 5 days 4.34 (19) 3.00 (1.00-4.07) 60.4 (22) 12.4 (21) 1.29 (29)
50 mg (+ETR 200 mg)/ 15
QD (+ETR q12h) x 14 days
2.10 (24) 2.00 (1.00-3.00) 17.8 (39) 6.39 (22) 0.16 (84)
ING111604/m5.3.3.4
Healthy adult/ 16
Oral Tablet 50 mg/ 15 QD x 5 days 3.45 (30) 3.00 (1.00-4.00) 46.6 (32) N/A 1.08 (39)
50 mg (+300 mg TDF)/ 15
QD x 5 days 3.34 (26) 3.00 (1.00-4.03) 46.9 (28) N/A 0.99 (32)
ING111762/m5.3.5.1
HIV-infected adult/ 354
Oral Tablet 50mg/337 (average) QD NR NR NR NR 0.856 (140)b
50mg/329 (Wk 4) 0.786 (143)c
50mg/262 (Wk 24) 0.956 (129)c
50mg/106 (Wk 48) 0.907 (147)c
ING111854/ m5.3.3.4
Healthy adult/ 24
Oral Tablet 30 mg/ 12 QD x 5 days 3.21 (19) 3.00 (1.00-4.00) 45.3 (21) 13.3 (19) 1.00 (30)
30 mg (+ATV/RTV 300/100 mg)/ 12
QD x 14 days 4.29 (19) 4.00 (2.00-4.00) 73.3 (16) 24.1 (11) 2.21 (16)
30 mg/ 12 QD x 5 days 3.42 (13) 4.00 (1.00-4.00) 45.8 (17) 12.6 (20) 0.95 (29)
30 mg (+ATV400 mg)/ 12
QD x 14 days 5.11 (20) 4.00 (2.00-4.00) 87.4 (17) 23.8 (21) 2.67 (21)
ING111855/m5.3.3.4
Healthy adult female/ 16
Oral Tablet 50 mg (+OC)/ 15 BID (+ OC QD) x 10 days
7.77 (23) 1.00 (1.0-6.0) 68.6 (27) NR 4.00 (36)

CONFIDENTIALModule 2.7.2 Summary of Clinical Pharmacology
165
Study/ Location of Study Report
Population/ No. of Subjects
Route of Administration/ Dosage Form
Dose/ No. of Subjects
Regimen Parametera
Cmax (g/ml)
Tmax (h)
AUC (0-)(g.h/mL)
T1/2 (h)
C(g.mL)
ING112276/m5.3.5.1
HIV-infected adult/ 155
Oral Tablet 10 mg/ 15 QD x 10 days 1.10 (37) 2.0 (2.0-4.0) 16.0 (40) NR 0.30 (71)
25 mg/ 15 QD x 10 days 1.71 (43) 2.0 (2.0-8.0) 23.1 (48) NR 0.54 (67)
50 mg/ 15 QD x 10 days 3.40 (27) 2.0 (2.0-4.0) 48.1 (40) NR 1.20 (62)
ING112574/m5.3.5.2
HIV-infected adult/ 178
Oral Tablet 50 mg/ 178 (Average) QD NR NR NR NR 2.35 (70)b
50 mg/ 148 (Day 8) 2.36 (91)c
50 mg/ 160 (Wk 4) 1.94 (106)c
50 mg/ 81 (Wk 24) 2.18 (98)c
ING112578/m5.3.5.2
HIV-infected adolescent (12 to <18 years)/ 10
Oral Tablet 50 mg (~1mg/kg)/ 10 QD 3.49 (1.15-6.08d)
2.74 (3.00-6.00) 46.0 (13.1-85.0d) 11.9 (8.4-24.8d)
0.53 (0.002-2.22d)c
ING112934/ m5.3.3.4
Healthy adult/ 17
Oral Tablet 50 mg/ 8 (Cohort 1) QD x 5 days 3.52 (12) 3.50 (2.00-4.00) 47.8 (19) 11.3 (18) 0.97 (33)
50 mg/ 8 (Cohort 2) QD x 5 days 3.38 (26) 3.02 (1.00-12.00) 45.2 (22) 10.4 (17) 0.94 (40)
50 mg (+ ETR 200 mg and LPV/RTV 400/100 mg)/ 8
QD (+ETR and LPV/RTV q12h) x 14 days
3.78 (12) 3.50 (1.00-4.00) 52.8 (18) 15.4 (25) 1.23 (32)
50 mg (+ ETR 200 mg and DRV/RTV 600/100 mg)/ 9
QD (+ETR and DRV/RTV q12h) x 14 days
2.98 (18) 4.00 (1.00-4.00) 33.9 (22) 10.2 (16) 0.59 (33)
ING112961/m5.3.5.2
HIV-infected adult/ 48
Oral Tablet 50 mg/ 25 (Day 10) QD 3.04 (38) 2.97 (1.97-7.92) 36.5 (53) NR 0.69 (91)
50 mg/ 23 (Day 10) BID 5.41 (40) 2.0 (0-7.87) 46.7 (50) NR 2.72 (70)
ING113068/ m5.3.3.4
Healthy adult/ 12
Oral Tablet 50 mg/ 12 QD x 5 days 2.38 (38) 2.0 (1.0-4.0) 30.6 (39) 12.1 (19) 0.61 (45)
50 mg (+FPV/RTV 700/100 BID)/ 12
QD x 10 days 1.82 (57) 2.0 (1.0-4.0) 19.9 (57) 9.54 (26) 0.31 (64)
ING113086/m5.3.5.1
HIV-infected adult/ 404
Oral Tablet 50 mg/ 399 (average) QD NR NR NR NR 1.18 (60)b
50 mg/ 379 (Wk 4) 1.05 (69)c
50 mg/ 365 (Wk 24) 1.17 (71)c
50 mg/ 351 (Wk 48) 1.13 (72)c

CONFIDENTIALModule 2.7.2 Summary of Clinical Pharmacology
166
Study/ Location of Study Report
Population/ No. of Subjects
Route of Administration/ Dosage Form
Dose/ No. of Subjects
Regimen Parametera
Cmax (g/ml)
Tmax (h)
AUC (0-)(g.h/mL)
T1/2 (h)
C(g.mL)
ING113096/ m5.3.3.4
Healthy adult/ 18
Oral Tablet 50 mg/ 14 QD x 5 days 4.53 (23) 3.00 (2.00-3.00) 64.5 (28) 14.8 (22) 1.48 (40)
50 mg (+TPV/RTV 500/200 mg)/ 14
QD (+TPV/RTV BID) x 5 days
2.42 (23) 4.00 (1.00-4.00) 26.4 (30) 7.88 (20) 0.35 (54)
ING113099/ m5.3.3.4
Healthy adult/ 27
Oral Tablet 50 mg/ 20 QD x 7 days 2.78 (34) 2.0 (1.0-5.1) 35.1 (42) 11.2 (30) 0.63 (72)
50 mg/ 11 BID x 7 days 5.55 (49) 1.0 (1.0-4.0) 46.3 (55) 9.54 (48) 2.41 (77)
50 mg (+ RIF600 mg)/ 11
BID (+RIF QD) x 14 days
3.13 (25) 2.0 (1.0-5.0) 42.6 (31) 4.24 (23) 0.67 (55)
50 mg (+ RBT300 mg)/ 9
QD x 14 days 3.41 (23) 3.0 (1.0-4.0) 37.0 (32) 8.64 (22) 0.53 (56)
ING114005/ m5.3.3.4
Healthy adult/ 12
Oral Tablet 50 mg/ 12 QD x 5 days 3.08 (30) 2.0 (1.0-4.0) 42.3 (39) 13.9 (23) 0.91 (53)
50 mg (+EFV 600 mg QD)/ 12
QD x 14 days 1.87 (42) 1.0 (1.0-4.0) 18.2 (50) 7.82 (21) 0.22 (76)
ING114819/m5.3.4.1
Healthy adult/ 38
Oral Tablet 50 mg (+iohexol and PAH infusion)/ 11
QD x 14 days 2.83 (27) NR 39.1 (38) NR 0.84 (61)
50 mg (+iohexol and PAH infusion)/ 11
BID x 14 days 5.50 (34) NR 51.6 (36) NR 3.02 (40)
ING115696/ m5.3.3.4
Healthy adult/ 12
Oral Tablet 50 mg/ 12 QD x 5 days 4.27 (25) 4.0 (1.0-4.0) 58.6 (32) 13.8 (21) 1.32 (40)
50 mg (+prednisone)/ 12
QD x 10 days (Day 5)
4.47 (31) 3.5 (1.0-4.0) 65.9 (37) 15.2 (17) 1.59 (47)
50 mg (+prednisone)/ 12
QD x 10 days (Day 10)
4.54 (29) 3.5 (1.0-4.0) 65.0 (37) 14.6 (24) 1.53 (50)
ING115697/m5.3.3.4
Healthy adult/ 32
Oral Tablet 50 mg/ 16 (Cohort 1) QD x 5 days 4.62 (21) 2.50 (1.0, 4.0) 61.5 (27) 13.2 (18) 1.31 (38)
50 mg/ 16 (Cohort 2) QD x 5 days 4.99 (23) 3.00 (1.0, 4.0) 68.9 (25) 14.5 (19) 1.59 (35)
50 mg (+BCV 800 mg)/ 13
QD (+q8h BCV) x 10 days
4.82 (17) 3.00 (1.0, 4.0) 65.3 (22) 13.8 (19) 1.40 (36)
50 mg (+TLV 750 mg)/ 15
QD (+ q8h TVR) x 10 days
5.81 (15) 4.00 (1.1, 4.0) 84.2 (21) 16.7 (18)3 2.09 (28)
ING115698/ m5.3.3.4
Healthy adult/ 11
Oral Tablet 50 mg (+methadone)/ 11
BID x 5 days 4.88 (35) NR 44.3 (37) NR 2.63 (41)

CONFIDENTIALModule 2.7.2 Summary of Clinical Pharmacology
167
Study/ Location of Study Report
Population/ No. of Subjects
Route of Administration/ Dosage Form
Dose/ No. of Subjects
Regimen Parametera
Cmax (g/ml)
Tmax (h)
AUC (0-)(g.h/mL)
T1/2 (h)
C(g.mL)
LAI116181/ m5.3.3.4
Healthy adult/ 28
Oral Tablet 50 mg/ 16 QD x 5 days 3.46 (30) 3.50 (1.0-4.0) 48.8 (35) NR 1.07 (45)
50 mg (+RPV 25 mg)/ 16
QD x 5 days 3.90 (25) 3.50 (1.0-4.0) 54.7 (33) NR 1.31 (46)
a. Data presented are geometric mean (%CVb) except for tmax where median (range) are presented.b. Data presented as C0_Avgc. Data presented as C0d. %CVb not reported, data presented as (Min-Max)ATV = atazanavir; BCV = boceprevir; BID = twice daily; ETR = etravirine; LPV= lopinavir; MDZ = midazolam; NR = not reported; OC = oral contraceptive; PAH = para-aminohippurate;QD = once daily; RPV = rilpivirine; RTV = ritonavir; TDF = tenofovir disoproxil fumarate; TVR = telaprevir; TPV = tipranavir; QD=once daily; BID=twice daily.

CONFIDENTIALModule 2.7.2 Summary of Clinical Pharmacology
168
Appendix Table 4 Summary of PK Parameters of Co-administered Drugs
Study/ Location of Study Report
Population/ No. of Subjects
Co-administered Drug/Route of Administration/ Dosage Form
Dose/ No. of Subjects
Regimen Parametera of Co-administered Drug
Cmax (g/ml)
Tmax (h)
AUC (0-)(g.h/mL)
T1/2 (h)
C(g.mL)
ING111322/m5.3.3.1
Healthy adult/ 32
MDZ/ Oral Tablet 3 mg/ 10 Single dose NR NR 0.0163 (23)b NR NR
3 mg(+25 mg DTG)/ 10
Single dose(DTG once daily x 10 days)
NR NR 0.0154 (41)b NR NR
ING111405/m5.3.3.4
Healthy adult/ 31
LPV/ Oral Tablet 400 mg(+100 mg RTV+ 30 mg DTG)/ 15
BID(RTV BID, DGT once daily) x 14 days
11.5 (22) NR 95.8 (25) NR 4.52 (43)
DRV/ Oral Tablet 600 mg(+100 mg RTV+ 30 mg DTG)/ 15
BID(RTV BID, DGT once daily) x 14 days
5.811 (23) NR 46.5 (29) NR 2.190 (47)
RTV/ Oral Tablet 100 mg(+400 mg LPV+ 30 mg DTG)/ 15
BID(LPV BID, DGT once daily) x 14 days
0.884 (36) NR 4.59 (33) NR 0.115 (50)
RTV/ Oral Tablet 100 mg(+600 mg DRV + 30 mg DTG)/ 15
BID(DRV BID, DGT once daily) x 14 days
0.815 (32) NR 5.42 (25) NR 0.202 (34)
ING111603/ m5.3.3.4
Healthy adult/ 16
ETR/Oral Tablet 200 mg(+50 mg DTG)/ 15
BID(DTG once daily) x 14 days
1.12 (28) NR 10.3 (24) NR 0.638 (24)
ING111604/m5.3.3.4
Healthy adult/ 16
TDF/Oral Tablet 300 mg/ 15 Once daily x 7days
0.274 (34) 1.00 (1.00-2.00) 2.45 (41) NR 0.0472 (49)
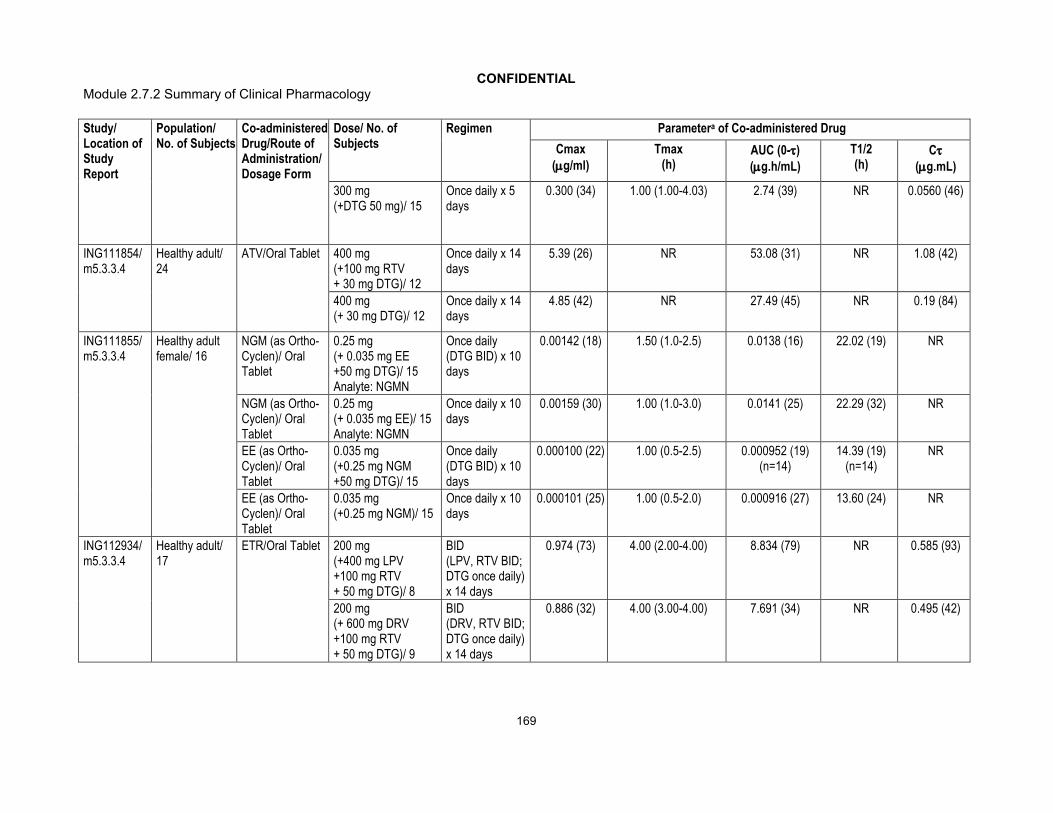
CONFIDENTIALModule 2.7.2 Summary of Clinical Pharmacology
169
Study/ Location of Study Report
Population/ No. of Subjects
Co-administered Drug/Route of Administration/ Dosage Form
Dose/ No. of Subjects
Regimen Parametera of Co-administered Drug
Cmax (g/ml)
Tmax (h)
AUC (0-)(g.h/mL)
T1/2 (h)
C(g.mL)
300 mg(+DTG 50 mg)/ 15
Once daily x 5 days
0.300 (34) 1.00 (1.00-4.03) 2.74 (39) NR 0.0560 (46)
ING111854/ m5.3.3.4
Healthy adult/ 24
ATV/Oral Tablet 400 mg(+100 mg RTV+ 30 mg DTG)/ 12
Once daily x 14 days
5.39 (26) NR 53.08 (31) NR 1.08 (42)
400 mg(+ 30 mg DTG)/ 12
Once daily x 14 days
4.85 (42) NR 27.49 (45) NR 0.19 (84)
ING111855/m5.3.3.4
Healthy adult female/ 16
NGM (as Ortho-Cyclen)/ Oral Tablet
0.25 mg(+ 0.035 mg EE+50 mg DTG)/ 15Analyte: NGMN
Once daily(DTG BID) x 10 days
0.00142 (18) 1.50 (1.0-2.5) 0.0138 (16) 22.02 (19) NR
NGM (as Ortho-Cyclen)/ Oral Tablet
0.25 mg(+ 0.035 mg EE)/ 15Analyte: NGMN
Once daily x 10 days
0.00159 (30) 1.00 (1.0-3.0) 0.0141 (25) 22.29 (32) NR
EE (as Ortho-Cyclen)/ Oral Tablet
0.035 mg(+0.25 mg NGM+50 mg DTG)/ 15
Once daily(DTG BID) x 10 days
0.000100 (22) 1.00 (0.5-2.5) 0.000952 (19)(n=14)
14.39 (19)(n=14)
NR
EE (as Ortho-Cyclen)/ Oral Tablet
0.035 mg(+0.25 mg NGM)/ 15
Once daily x 10 days
0.000101 (25) 1.00 (0.5-2.0) 0.000916 (27) 13.60 (24) NR
ING112934/ m5.3.3.4
Healthy adult/ 17
ETR/Oral Tablet 200 mg(+400 mg LPV+100 mg RTV + 50 mg DTG)/ 8
BID(LPV, RTV BID;DTG once daily)x 14 days
0.974 (73) 4.00 (2.00-4.00) 8.834 (79) NR 0.585 (93)
200 mg(+ 600 mg DRV+100 mg RTV+ 50 mg DTG)/ 9
BID(DRV, RTV BID; DTG once daily)x 14 days
0.886 (32) 4.00 (3.00-4.00) 7.691 (34) NR 0.495 (42)
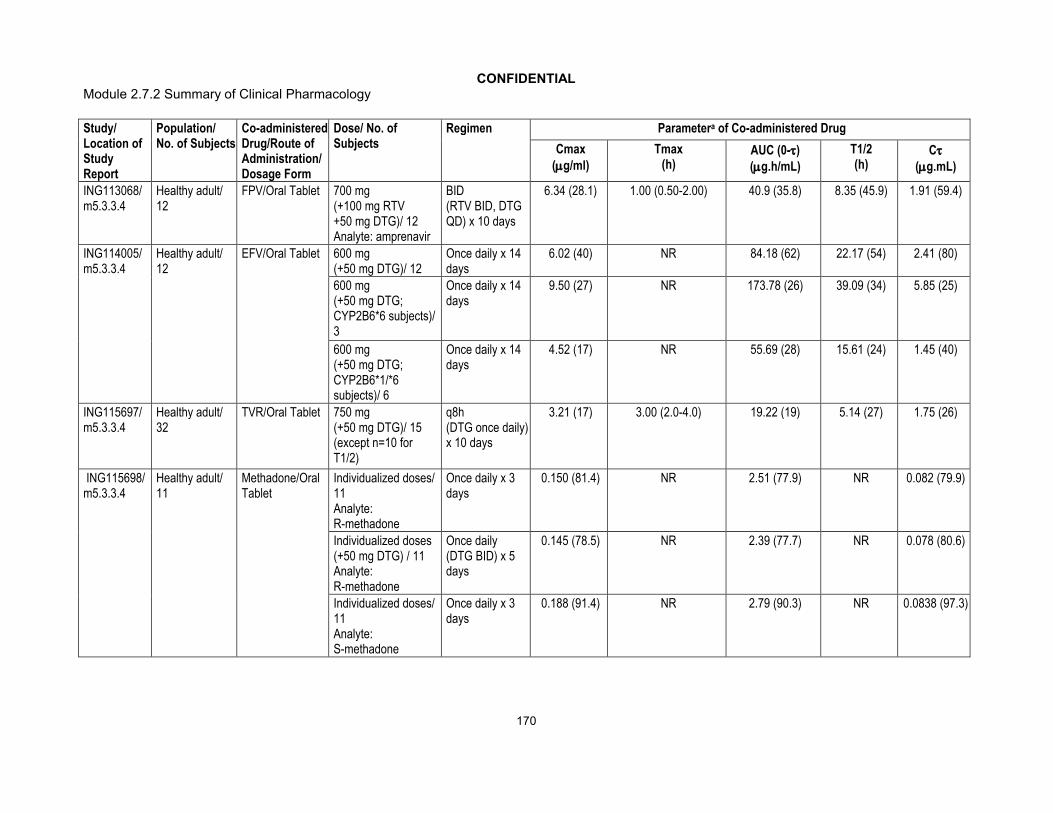
CONFIDENTIALModule 2.7.2 Summary of Clinical Pharmacology
170
Study/ Location of Study Report
Population/ No. of Subjects
Co-administered Drug/Route of Administration/ Dosage Form
Dose/ No. of Subjects
Regimen Parametera of Co-administered Drug
Cmax (g/ml)
Tmax (h)
AUC (0-)(g.h/mL)
T1/2 (h)
C(g.mL)
ING113068/ m5.3.3.4
Healthy adult/ 12
FPV/Oral Tablet 700 mg(+100 mg RTV+50 mg DTG)/ 12Analyte: amprenavir
BID(RTV BID, DTG QD) x 10 days
6.34 (28.1) 1.00 (0.50-2.00) 40.9 (35.8) 8.35 (45.9) 1.91 (59.4)
ING114005/ m5.3.3.4
Healthy adult/ 12
EFV/Oral Tablet 600 mg(+50 mg DTG)/ 12
Once daily x 14 days
6.02 (40) NR 84.18 (62) 22.17 (54) 2.41 (80)
600 mg(+50 mg DTG; CYP2B6*6 subjects)/ 3
Once daily x 14 days
9.50 (27) NR 173.78 (26) 39.09 (34) 5.85 (25)
600 mg(+50 mg DTG; CYP2B6*1/*6 subjects)/ 6
Once daily x 14 days
4.52 (17) NR 55.69 (28) 15.61 (24) 1.45 (40)
ING115697/m5.3.3.4
Healthy adult/ 32
TVR/Oral Tablet 750 mg(+50 mg DTG)/ 15 (except n=10 for T1/2)
q8h(DTG once daily)x 10 days
3.21 (17) 3.00 (2.0-4.0) 19.22 (19) 5.14 (27) 1.75 (26)
ING115698/ m5.3.3.4
Healthy adult/ 11
Methadone/Oral Tablet
Individualized doses/ 11 Analyte: R-methadone
Once daily x 3 days
0.150 (81.4) NR 2.51 (77.9) NR 0.082 (79.9)
Individualized doses(+50 mg DTG) / 11Analyte: R-methadone
Once daily(DTG BID) x 5 days
0.145 (78.5) NR 2.39 (77.7) NR 0.078 (80.6)
Individualized doses/ 11 Analyte: S-methadone
Once daily x 3 days
0.188 (91.4) NR 2.79 (90.3) NR 0.0838 (97.3)

CONFIDENTIALModule 2.7.2 Summary of Clinical Pharmacology
171
Study/ Location of Study Report
Population/ No. of Subjects
Co-administered Drug/Route of Administration/ Dosage Form
Dose/ No. of Subjects
Regimen Parametera of Co-administered Drug
Cmax (g/ml)
Tmax (h)
AUC (0-)(g.h/mL)
T1/2 (h)
C(g.mL)
Individualized doses(+50 mg DTG) / 11Analyte: S-methadone
Once daily(DTG BID) x 5 days
0.195 (82.3) NR 2.81 (85.4) NR 0.0847 (92.7)
Individualized doses/ 11 Analyte: total methadone
Once daily x 3 days
0.337 (86.5) NR 5.32 (83.2) NR 0.166 (86.9)
Individualized doses(+50 mg DTG) / 11Analyte: total methadone
Once daily(DTG BID) x 5 days
0.337 (80.1) NR 5.23 (80.6) NR 0.164 (84.9)
LAI116181/ m5.3.3.4
Healthy adult/ 28
RPV/Oral Tablet 25 mg/ 16(Cohort 1, Period 2)
Once daily x 11 days
0.148 (29) 4.00 (4.0-6.0) 2.23 (33) 0.0745 (41)
25 mg(+50 mg DTG)/ 16(Cohort 1, Period 3)
Once daily x 5 days
0.164 (36) 4.00 (2.0-5.0) 2.37 (34) NR 0.0905 (48)
a. Data are presented are geometric mean (%CVb) except for tmax where median (range) is presented.b. Presented as AUC(0-t).
ATV = atazanavir; BID = twice daily; DRV = darunavir; EE = ethinyl estradiol; EFV = efavirenz; ETR = etravirine; FPV=fosamprenavir; LPV= lopinavir; NGM = norgestimate; NGMN = norelgestromin; MDZ = midazolam; NR = not reported; OC = oral contraceptive; PAH = para-aminohippurate; q8h = dosed every 8 hours (three times daily); RPV = rilpivirine; RTV = ritonavir; TDF = tenofovir disoproxil fumarate; TVR = telaprevir; TPV = tipranavir.

CONFIDENTIALModule 2.7.2.4 Special Studies
1
Module 2.7.2.4
Special Studies
Copyright 2012 ViiV Healthcare the GlaxoSmithKline group of companies. All rights reserved. Unauthorised copying or use of this information is prohibited.
CONFIDENTIALModule 2.7.2.4 Special Studies
2
TABLE OF CONTENTS
PAGE
ABBREVIATIONS ...........................................................................................................4
1. BACKGROUND AND OVERVIEW OF CLINICAL PHARMACOLOGY .....................7
2. SUMMARY OF RESULTS OF INDIVIDUAL STUDIES.............................................7
3. COMPARISON AND ANALYSES OF RESULTS ACROSS STUDIES .....................7
4. SPECIAL STUDIES..................................................................................................74.1. Nonclinical Virology ......................................................................................8
4.1.1. Listing of in vitro Virology Non-Clinical Studies ..............................94.1.2. Mechanism of Action ...................................................................134.1.3. Cell Based Antiviral Assays .........................................................134.1.4. Effect of Human Serum and Serum Proteins ...............................144.1.5. Antiviral Activity in Combination with other Antiviral Agents .........144.1.6. Evaluation of Cytotoxicity in Antiviral Assays ...............................154.1.7. Evaluation of Cytotoxicity in Human Cell Lines and
Peripheral Blood Mononuclear Cells ............................................154.1.8. Susceptibility of Multiple Clade B Clinical Isolates of HIV-1..........164.1.9. Susceptibility of a Panel of HIV-1 and HIV-2 Isolates in
PBMCs and Monocyte Derived Macrophages..............................174.1.10. Activity against non-HIV Viruses ..................................................194.1.11. Isolation of DTG Resistant HIV-1 Mutants....................................20
4.1.11.1. Isolation from Wild type HIV-1 Strain IIIB....................214.1.11.2. Isolation from Wild Type and Site Directed
Mutant INI Resistant HIV-1 Strain NL432 ...................224.1.11.3. Selection of R263K in Passage Experiments
using HIV-1 with Subtype B, C, and A/G.....................244.1.12. Assessment of Resistance...........................................................25
4.1.12.1. Sixty Integrase Inhibitor Resistant HIV-1 Strains........................................................................25
4.1.12.2. Integrase Inhibitor Resistant HIV-2 Strains .................304.1.12.3. Clinical Isolates from RAL Therapy Virologic
Failure Subjects..........................................................304.1.12.3.1. Activity against Thirty-nine Clinical
Isolates...................................................304.1.12.3.2. Activity against 705 RAL Resistant
Clinical Isolates.......................................324.1.12.3.3. Characterization of DTG
resistance in the Raltegravir Resistant Clinical Isolate Population ..............................................34
4.1.13. Evaluation of DTG Dissociation from Wild Type and Integrase Inhibitor Resistant Integrase-DNA Complexes .............38
4.1.14. Minority Species Analysis from Antiretroviral Therapy, Raltegravir Resistant Experienced Adults in Phase 2b Study ING112961 ........................................................................41

CONFIDENTIALModule 2.7.2.4 Special Studies
3
4.1.15. Integrase Polymorphism Effects on DTG Resistance and Clinical Response ........................................................................46
4.2. Clinical Virology ..........................................................................................484.2.1. Phase III Clinical Studies .............................................................50
4.2.1.1. Studies of Treatment-Naive Subjects .........................504.2.1.1.1. ING113086 .............................................504.2.1.1.2. ING114467 .............................................54
4.2.1.2. Studies of Treatment-Experienced (INI-naive) Subjects .....................................................................594.2.1.2.1. ING111762 .............................................59
4.2.1.3. Studies of Treatment-Experienced (Integrase Inhibitor Resistant) Subjects .......................................754.2.1.3.1. ING112574 .............................................754.2.1.3.2. An Exploratory Analysis of Minor
Variants in HIV-1 Integrase for Subjects Enrolled in ING112574 Having Only Historic Evidence of Primary IN Resistance (Appendix 5) ............................................................99
4.2.1.3.3. Antiviral Activity of DTG in ING112574 by Baseline Resistance............................................104
4.2.2. Phase IIb Clinical Studies ..........................................................1204.2.2.1. ING112276...............................................................1214.2.2.2. ING112961...............................................................122
4.2.3. Conclusions ...............................................................................1374.3. References ...............................................................................................139

CONFIDENTIALModule 2.7.2.4 Special Studies
4
ABBREVIATIONS
3TC LamivudineAAG 1-acid glycoproteinABC Abacavir AIDS Acquired immunodeficiency syndromeAPV AmprenavirBID Twice daily (bis in die)BVDV Bovine Viral Diarrhea VirusCBMC Umbilical cord blood mononuclear cellsCCR5 Chemokine receptor 5CDC Centers for Disease and Prevention ControlCI Confidence IntervalCIP4 Cell line derived from 293T cellsCmax Maximal drug concentrationCmin Minimal drug concentration CSR Clinical study reportD4T StavudineDAIDS Division of Acquired Immunodeficiency SyndromeDTG DolutegravirDRV/r Darunavir + ritonavirEBV Epstein-Barr virusEFV EfavirenzEVG ElvitegravirETR EtravirineFC Fold ChangeFDA Food and Drug AdministrationFPV FosamprenavirFTC Emtricitabineg GramGSK GlaxoSmithKlineGSS Genotypic susceptibility scoreHBV Hepatitis B VirusHCV Hepatitis C VirusHCMV Human CytomegalovirusHeLa CD4 Human cell lineHIV-1 Human Immunodeficiency Virus type 1IC50 50% Inhibitory ConcentrationIM9 Human B cell lymphocytic leukemia cell lineIN IntegraseINI Integrase InhibitorIP Investigational productIQR Interquartile rangeITT-E Intent to treat exposedLANL Los Alamos National Laboratory HIV Sequence DatabaseLOCFDB Last observation carried forward, discontinuation=Baseline
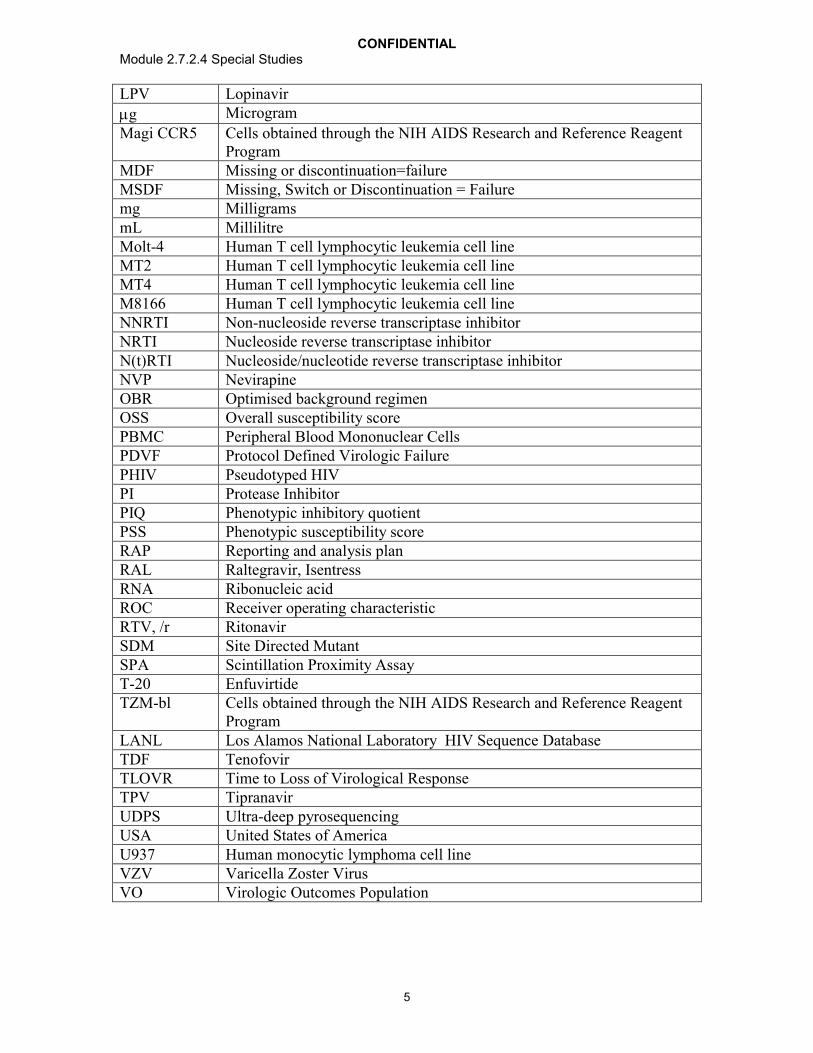
CONFIDENTIALModule 2.7.2.4 Special Studies
5
LPV Lopinavir
g Microgram
Magi CCR5 Cells obtained through the NIH AIDS Research and Reference Reagent Program
MDF Missing or discontinuation=failureMSDF Missing, Switch or Discontinuation = Failuremg MilligramsmL MillilitreMolt-4 Human T cell lymphocytic leukemia cell lineMT2 Human T cell lymphocytic leukemia cell lineMT4 Human T cell lymphocytic leukemia cell lineM8166 Human T cell lymphocytic leukemia cell lineNNRTI Non-nucleoside reverse transcriptase inhibitorNRTI Nucleoside reverse transcriptase inhibitorN(t)RTI Nucleoside/nucleotide reverse transcriptase inhibitorNVP NevirapineOBR Optimised background regimenOSS Overall susceptibility scorePBMC Peripheral Blood Mononuclear CellsPDVF Protocol Defined Virologic FailurePHIV Pseudotyped HIVPI Protease InhibitorPIQ Phenotypic inhibitory quotientPSS Phenotypic susceptibility scoreRAP Reporting and analysis planRAL Raltegravir, IsentressRNA Ribonucleic acidROC Receiver operating characteristicRTV, /r RitonavirSDM Site Directed MutantSPA Scintillation Proximity AssayT-20 EnfuvirtideTZM-bl Cells obtained through the NIH AIDS Research and Reference Reagent
ProgramLANL Los Alamos National Laboratory HIV Sequence DatabaseTDF TenofovirTLOVR Time to Loss of Virological ResponseTPV TipranavirUDPS Ultra-deep pyrosequencingUSA United States of AmericaU937 Human monocytic lymphoma cell lineVZV Varicella Zoster VirusVO Virologic Outcomes Population
CONFIDENTIALModule 2.7.2.4 Special Studies
6
Trademark Information
Trademarks of ViiV Healthcare Trademarks not owned ViiV Healthcare
NONE GenSeqPhenoSense

CONFIDENTIALModule 2.7.2.4 Special Studies
7
1. BACKGROUND AND OVERVIEW OF CLINICAL PHARMACOLOGY
Refer to m2.7.2 as these headings are not relevant to m2.7.2.4.
2. SUMMARY OF RESULTS OF INDIVIDUAL STUDIES
Refer to m2.7.2 as these headings are not relevant to m2.7.2.4.
3. COMPARISON AND ANALYSES OF RESULTS ACROSS STUDIES
Refer to m2.7.2 as these headings are not relevant to m2.7.2.4.
4. SPECIAL STUDIES
Dolutegravir (DTG) inhibits HIV integrase by binding to the integrase active site and blocking the strand transfer step of retroviral DNA integration which is essential for the HIV replication cycle. In vitro data are supportive of DTG’s high barrier to resistance. DTG retained activity against a vast majority of 60 RAL resistant site-directed HIV-1 mutants and 6 site directed HIV-2 mutants. Additionally, susceptibilities to DTG and RAL were determined for over 700 RAL resistance clinical isolates with DTG retaining activity <10 FC against >90% of them. DTG was slower to select for resistant mutants during in vitro passage than RAL; the level of DTG fold change in these mutants was less than for RAL. DTG demonstrated slower dissociation from all IN-DNA complexes tested as compared to RAL and elvitegravir, including those with single, double, and up to four residue clinically relevant IN substitutions.
Dolutegravir 50 mg once daily has a higher barrier to resistance in INI-naive patients, as demonstrated in the treatment-experienced (INI-naive) study ING111762 where significantly fewer virologic failures and significantly fewer subjects with INI resistance (in addition to less treatment-emergent resistance to the background regimens) were observed when compared with RAL. Data from two studies (ING1133086 and ING114467) including over 1600 treatment-naive patients are also supportive of DTG’s higher barrier to resistance, given that no subjects on the DTG regimen developed resistance to either the INI or the background NRTIs, whereas resistance to both the third agent and the background NRTIs was observed in both the RAL and EFV-based comparator arms.
In a study of treatment experienced (INI-resistant) subjects (ING112574) three IN mutation groups derived from Day 8 antiviral responses also provided good prediction for Week 24 responses. The vast majority of subjects with virus in the “No Q148” group achieved <400 c/mL HIV-1 RNA at Week 24 (85%) lower response rates were seen with Q148+1 secondary mutation and Q148 +2 secondary mutations, (50% and 22 %respectively). Those with Q148 +2 secondary mutations, however, represent a minority of the INI-resistant population (~11-12% overall). This analysis suggests that a regimen of DTG 50 mg twice daily will provide benefit to the majority of subjects and that the
CONFIDENTIALModule 2.7.2.4 Special Studies
8
derived IN mutation groups can further aid prescribers who would use DTG in INI-resistant patients.
4.1. Nonclinical Virology
Dolutegravir (DTG) inhibits HIV integrase by binding to the integrase active site and blocking the strand transfer step of retroviral DNA integration which is essential for the HIV replication cycle.
Dolutegravir has low nM activity against wild type HIV-1 and HIV-2 in a variety of cells lines, regardless of subtype. DTG has little activity against non-HIV viruses. Human serum causes approximately 75-fold increase in DTG IC50 against HIV-1. DTG is additive or synergistic when assayed in combination with other antiretroviral agents.
When HIV-1 Strain IIIB was passaged in the presence of DTG for 112 days, viruses with a 4.1-fold maximum increase in IC50 and S153Y or S153F substitutions in the integrase gene were observed. Passage of the wild type HIV-1 NL432 in the presence of 6.4 nM DTG selected for E92Q (FC=3.1) and G193E (FC=3.2) substitutions in the IN region on Day 56. Passage of HIV-1 NL432 with Q148H, Q148K, or Q148R RAL resistant mutations resulted in selection of additional mutations and an increase in DTG FC. Passage of HIV-1 NL432 with E92Q, Y143C, Y143R or N155H RAL resistant mutations did not lead to additional substitutions. Passage of HIV-1 subtypes B, and A/G in TZM-bl cells selected for integrase mutation R263K.
Comparative susceptibilities to DTG and raltegravir (RAL) were obtained from 60 RAL resistant site directed HIV-1 mutants and 6 site directed HIV-2 mutants. DTG retained activity against a vast majority of these mutants, and had similar activity for equivalent mutants for both HIV-1 and HIV-2. Additionally, susceptibilities to DTG and RAL were determined for over 700 RAL resistant clinical isolates, with DTG retaining activity <10 FC against >90% of them.
Evaluation of ~1000 RAL- resistant isolates from Aug 2008 to Mar 2012 demonstrated a decreasing proportion of Q148+≥2 pathway isolates over time. The derived mutational group Q148+≥2 (i.e., with L74I, E138A/K/T, G140A/C/S) associated with decreased response in ING112574 was 54% of 115 isolates with more inclusive RAL-associated secondary resistance mutations.
The dissociation of DTG, RAL, and EVG from wild type and mutant IN proteins complexed with DNA was investigated to obtain a better understanding of INI dissociation kinetics. DTG demonstrated slower dissociation from all IN-DNA complexes test, including those with single, double, and up to four residue clinically relevant IN substitutions; these studies provide a mechanism-based explanation for DTG’s different in vitro and clinical profile.
Clonal analyses provided information that the INI-associated resistance mutations reside on the same subset of viral genomes and that this accumulation of INI-associated resistance mutations results in the reduction of DTG susceptibility. Polymorphisms at the most variable positions in wild type IN do not reduce susceptibility to DTG

CONFIDENTIALModule 2.7.2.4 Special Studies
9
4.1.1. Listing of in vitro Virology Non-Clinical Studies
A series of in vitro studies have been conducted to investigate the virology of DTG. Alisting of these studies is provided in Table 1.

CONFIDENTIALModule 2.7.2.4 Special Studies
10
Table 1 List of Virology (Primary Pharmacodynamic) Non-Clinical Studies Performed with DTG
Type of Study Species (Strain)/Test System
Method ofAdministration
Form GLP TestingFacility
Report No.(Study No.)
Location in CTD
Antiviral mechanistic study using quantitative PCR
MT-4 cells In vitro B No RH2010/00018/00 m5.3.5.4
Anti-HIV activity in peripheral blood mononuclear cells (PBMCs)
Human PBMCs In vitro B No GSK and RH2007/00071/00 and RH2007/00116/00
m5.3.5.4
Antiviral activity in tissue culture cells Human MT-4 and CIP-4 cells
In vitro B No GSK and RH2007/00071/00 and RH2007/00116/00
m5.3.5.4
Integrase inhibition in strand transfer assays Recombinant HIV integrase
In vitro B No GSK and RH2007/00071/00 and RH2007/00116/00
m5.3.5.4
Anti-HIV activity in the presence of human serum and purified human serum proteins
Human MT-4 and CIP-4 cells
In vitro B No GSK and RH2007/00071/00 and RH2007/00116/00
m5.3.5.4
Anti-HIV activity in combination with other antiviral agentsa
MT-4 cells In vitro A No GSK RH2009/00002/00 m5.3.5.4
Anti-HIV activity in combination with maraviroc Magi-CCR5 cells In vitro A No RH2009/00009/00 m5.3.5.4
Evaluation of cytotoxicity in antiviral assays Human MT-4 and CIP-4 cells
In vitro B No GSK and RH2007/00071/00 and RH2007/00116/00
m5.3.5.4
Evaluation of cytotoxicity in human cell lines and peripheral blood lymphocytes (PBLs)
Human leukemic B-and T-cells lines and
PBLs
In vitro B No GSK RH2007/00036/00 m5.3.5.4
Dissociation from integrase-DNA complexes Wildtype and mutantintegrase protein
In vitro B No GSK 2011N114191_00 m5.3.5.4
Integrase inhibitor susceptibility of multiple clinical isolates of HIV-1
293 cells In vitro A No RH2007/00090/00 m5.3.5.4
Anti-HIV activity against a panel of HIV-1 and HIV-2 isolates
Human PBMC and MDM cells
In vitro A No RH2008/00134/00 m5.3.5.4
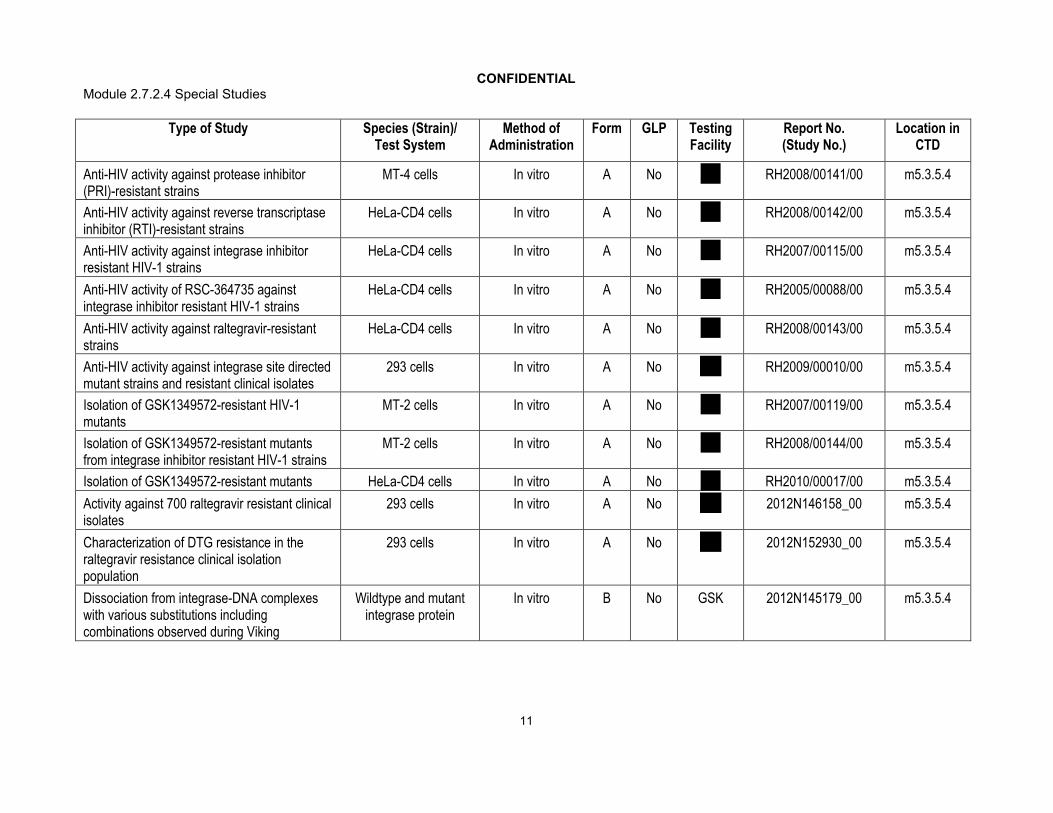
CONFIDENTIALModule 2.7.2.4 Special Studies
11
Type of Study Species (Strain)/Test System
Method ofAdministration
Form GLP TestingFacility
Report No.(Study No.)
Location in CTD
Anti-HIV activity against protease inhibitor (PRI)-resistant strains
MT-4 cells In vitro A No RH2008/00141/00 m5.3.5.4
Anti-HIV activity against reverse transcriptase inhibitor (RTI)-resistant strains
HeLa-CD4 cells In vitro A No RH2008/00142/00 m5.3.5.4
Anti-HIV activity against integrase inhibitor resistant HIV-1 strains
HeLa-CD4 cells In vitro A No RH2007/00115/00 m5.3.5.4
Anti-HIV activity of RSC-364735 against integrase inhibitor resistant HIV-1 strains
HeLa-CD4 cells In vitro A No RH2005/00088/00 m5.3.5.4
Anti-HIV activity against raltegravir-resistant strains
HeLa-CD4 cells In vitro A No RH2008/00143/00 m5.3.5.4
Anti-HIV activity against integrase site directed mutant strains and resistant clinical isolates
293 cells In vitro A No RH2009/00010/00 m5.3.5.4
Isolation of GSK1349572-resistant HIV-1 mutants
MT-2 cells In vitro A No RH2007/00119/00 m5.3.5.4
Isolation of GSK1349572-resistant mutants from integrase inhibitor resistant HIV-1 strains
MT-2 cells In vitro A No RH2008/00144/00 m5.3.5.4
Isolation of GSK1349572-resistant mutants HeLa-CD4 cells In vitro A No RH2010/00017/00 m5.3.5.4
Activity against 700 raltegravir resistant clinical isolates
293 cells In vitro A No 2012N146158_00 m5.3.5.4
Characterization of DTG resistance in the raltegravir resistance clinical isolation population
293 cells In vitro A No 2012N152930_00 m5.3.5.4
Dissociation from integrase-DNA complexeswith various substitutions including combinations observed during Viking
Wildtype and mutantintegrase protein
In vitro B No GSK 2012N145179_00 m5.3.5.4
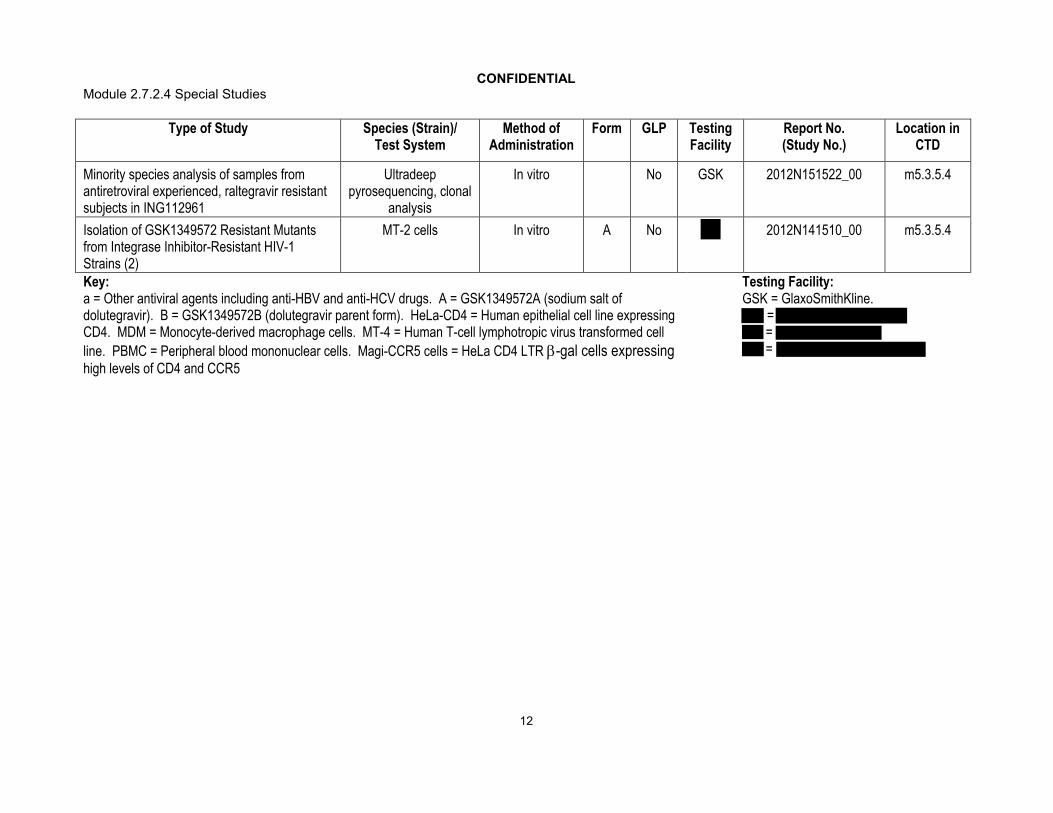
CONFIDENTIALModule 2.7.2.4 Special Studies
12
Type of Study Species (Strain)/Test System
Method ofAdministration
Form GLP TestingFacility
Report No.(Study No.)
Location in CTD
Minority species analysis of samples from antiretroviral experienced, raltegravir resistant subjects in ING112961
Ultradeep pyrosequencing, clonal
analysis
In vitro No GSK 2012N151522_00 m5.3.5.4
Isolation of GSK1349572 Resistant Mutants from Integrase Inhibitor-Resistant HIV-1 Strains (2)
MT-2 cells In vitro A No 2012N141510_00 m5.3.5.4
Key:a = Other antiviral agents including anti-HBV and anti-HCV drugs. A = GSK1349572A (sodium salt of dolutegravir). B = GSK1349572B (dolutegravir parent form). HeLa-CD4 = Human epithelial cell line expressing CD4. MDM = Monocyte-derived macrophage cells. MT-4 = Human T-cell lymphotropic virus transformed cell
line. PBMC = Peripheral blood mononuclear cells. Magi-CCR5 cells = HeLa CD4 LTR -gal cells expressing high levels of CD4 and CCR5
Testing Facility:GSK = GlaxoSmithKline.
= = =

CONFIDENTIALModule 2.7.2.4 Special Studies
13
4.1.2. Mechanism of Action
Dolutegravir inhibits HIV integrase by binding to the integrase active site and blocking the strand transfer step of retroviral Deoxyribonucleic acid (DNA) integration which is essential for the HIV replication cycle.
The antiviral mechanism of DTG on HIV replication was investigated (m5.3.5.4,RH2010/00018/00, RH2007/00119/00, RH2010/00017/00, 2011N114191_00) usingquantitative PCR. A dose dependent decrease in integrated HIV-1 DNA (Alu PCR) and an increase of 2 LTR circles was observed with DTG treatment suggesting that the antiviral activity is a direct consequence of its effect on viral integration. Dolutegravir demonstrated equivalent potency against two nonnucleoside inhibitor resistant, three nucleoside inhibitor resistant and two protease inhibitor resistant HIV-1 mutant clones (one with three and one with six mutations) compared with the wild type strain (m5.3.5.4, RH2008/00141/00, RH2008/00142/00). In addition, passage studies with DTG selected mutations within the integrase enzyme; some of those mutations recreated as site-direct mutant HIV virus conferred moderate but greater than wild-type levels of DTGresistance. Direct and prolonged DTG binding to integrase protein was demonstrated with purified integrase in cDNA:Mg2+ complexes in bead based assays. These data are also consistent with direct targeting of the HIV-1 integrase in cells.
4.1.3. Cell Based Antiviral Assays
Dolutegravir activity against Ba-L HIV-1 in PBMCs, HIV-1 strain IIIB in MT4 cells and pseudotyped HIV-1 in CIP4 cells was examined (m5.3.5.4, RH2007/0071/00, RH2007/00116/00).
For peripheral blood mononuclear cell (PBMC) assays, cells were stimulated with phytohemagglutinin and interleukin-2 and infected with HIV-1 strain BaL or HIV-1 strain NL432. Following incubation with DTG for 4 or 7 days, the antiviral activity was assayed by reverse transcriptase (RT) resulting in IC50s of 0.51 nM (BaL) and 0.51 nM (NL432). For MT-4 assays, cells were infected with HIV-1 strain IIIB and incubated with DTG for 4 or 5 days followed by cell viability analyses with CellTiter-Glo or MTT resulting in IC50s of 0.71 and 2.1 nM, respectively Table 2). For pseudotyped HIV (PHIV) assays, the infected cells were incubated with DTG for 2 days and when assayed for cell viability by Steady Glo gave an IC50 of 2.2 nM. In vitro strand transfer biochemical assays using purified HIV-1 integrase, which measure the inhibition of the amount of donor DNA covalently attached to target DNA by DTG using either [3H] target DNA or a sandwich ELISA resulted in IC50s of 2.7 nM and 12.6 nM, respectively.

CONFIDENTIALModule 2.7.2.4 Special Studies
14
Table 2 Antiviral Activity of DTG in PBMC, MT4, or CIP4 cells
Cell linesVirus DTG Geometric
mean IC50 (nM) 95% CIN
PBMC Ba-L 0.51 0.34-0.77 12PBMC NL432 0.53 SD = 0.21 5MT4 HIV-1IIIB 0.71 0.40-1.3 9MT4 HIV-1IIIB 2.1 SD = 0.82 3CIP4 PHIV vector 2.2 0.96-5.2 2
4.1.4. Effect of Human Serum and Serum Proteins
The effect of human serum albumin (HSA)(20 or 40 mg/mL), 1-acid glycoprotein (AAG) (2 mg/mL) (Table 3) and human serum (extrapolated up to 100%) on the antiviral activity of DTG was evaluated in the PHIV or MT-4 assay systems. HSA was the predominant DTG binding component compared with AAG. Maximum fold shiftobserved with MT-4 assays performed at GSK (m5.3.5.4, RH2007/00071/00) and
(m5.3.5.4, RH2007/00116/00) and extrapolated to 100% human serum provided a mean consensus 75-fold shift in the IC50 values for DTG and a resulting PA-IC50 of 38 nM for PBMCs in 100% serum.
Table 3 The Effect of Serum Proteins on Antiviral Activity of DTG in HIV-1 IIIB-Infected MT4 Cells
Serum Protein Geometric Mean IC50
95% Confidence Interval
Potency Shift
N
40 mg/mL HSA 18 nM 16 – 21 nM 12-fold 102 mg/mL AAG 3 nM 2.6 – 3.5 nM 2-fold 4
4.1.5. Antiviral Activity in Combination with other Antiviral Agents
Dolutegravir was tested for antiviral activity in combination with currently approved antiviral drugs (m5.3.5.4, RH2009/00002/00, RH2009/00009/00). The greatest value of the in vitro combination studies is to identify antagonism of antiviral activity indicatingthat certain drugs should not be used clinically in combination. In this regard, the in vitro combination data support the conclusion that the antiviral activity of DTG is compatible with other approved antiretrovirals.
The in vitro anti-HIV-1 activity of DTG was studied in checkerboard format in combination with representative anti-HIV drugs (stavudine, abacavir, efavirenz, nevirapine, lopinavir, amprenavir, enfuvirtide, and RAL) and anti-HBV (adefovir) and anti-HCV (ribavirin) drugs in MT-4 cells with HIV-1 strain IIIB (Table 4), and in combination with the anti-HIV drug maraviroc in Magi-CCR5 cell line with HIV-1 strain BaL (Table 5). All drugs with inherent anti-HIV activity were additive or synergistic with DTG, or if without inherent anti-HIV activity (ribavirin) had no apparent effect on DTG activity.
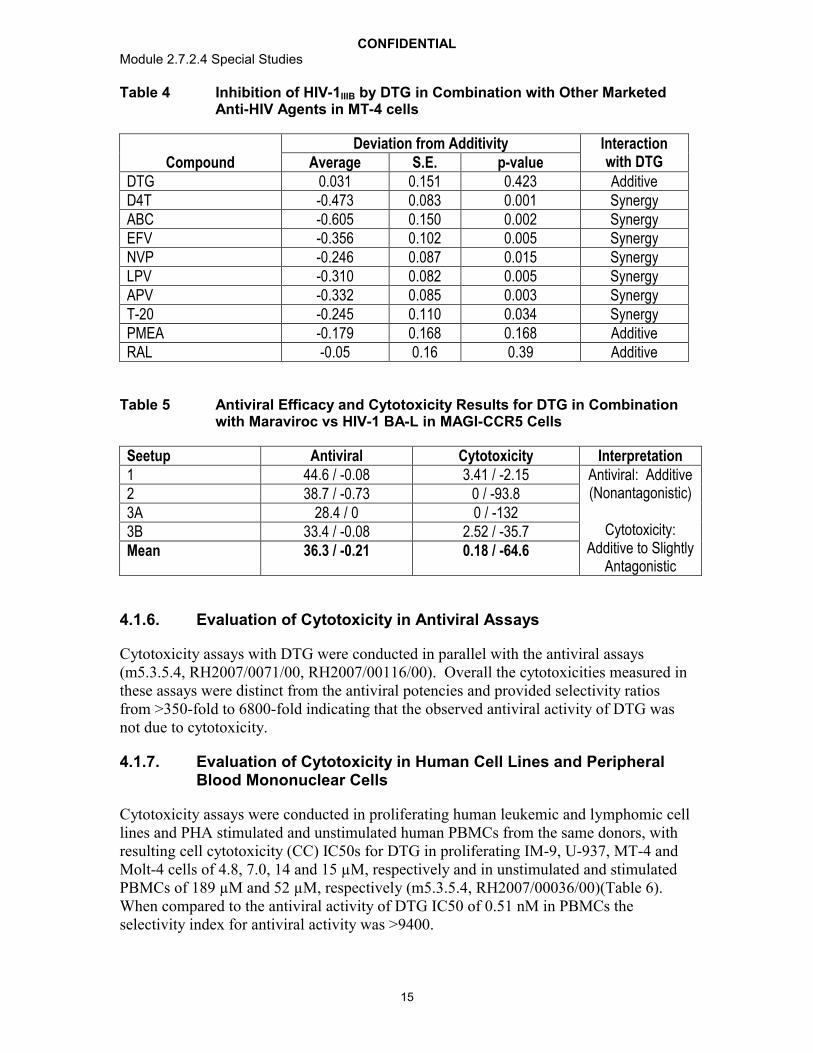
CONFIDENTIALModule 2.7.2.4 Special Studies
15
Table 4 Inhibition of HIV-1IIIB by DTG in Combination with Other Marketed Anti-HIV Agents in MT-4 cells
CompoundDeviation from Additivity Interaction
with DTGAverage S.E. p-valueDTG 0.031 0.151 0.423 AdditiveD4T -0.473 0.083 0.001 SynergyABC -0.605 0.150 0.002 SynergyEFV -0.356 0.102 0.005 SynergyNVP -0.246 0.087 0.015 SynergyLPV -0.310 0.082 0.005 SynergyAPV -0.332 0.085 0.003 SynergyT-20 -0.245 0.110 0.034 SynergyPMEA -0.179 0.168 0.168 AdditiveRAL -0.05 0.16 0.39 Additive
Table 5 Antiviral Efficacy and Cytotoxicity Results for DTG in Combination with Maraviroc vs HIV-1 BA-L in MAGI-CCR5 Cells
Seetup Antiviral Cytotoxicity Interpretation1 44.6 / -0.08 3.41 / -2.15 Antiviral: Additive
(Nonantagonistic)
Cytotoxicity: Additive to Slightly
Antagonistic
2 38.7 / -0.73 0 / -93.83A 28.4 / 0 0 / -1323B 33.4 / -0.08 2.52 / -35.7Mean 36.3 / -0.21 0.18 / -64.6
4.1.6. Evaluation of Cytotoxicity in Antiviral Assays
Cytotoxicity assays with DTG were conducted in parallel with the antiviral assays(m5.3.5.4, RH2007/0071/00, RH2007/00116/00). Overall the cytotoxicities measured in these assays were distinct from the antiviral potencies and provided selectivity ratios from >350-fold to 6800-fold indicating that the observed antiviral activity of DTG was not due to cytotoxicity.
4.1.7. Evaluation of Cytotoxicity in Human Cell Lines and Peripheral Blood Mononuclear Cells
Cytotoxicity assays were conducted in proliferating human leukemic and lymphomic cell lines and PHA stimulated and unstimulated human PBMCs from the same donors, with resulting cell cytotoxicity (CC) IC50s for DTG in proliferating IM-9, U-937, MT-4 and Molt-4 cells of 4.8, 7.0, 14 and 15 µM, respectively and in unstimulated and stimulated PBMCs of 189 µM and 52 µM, respectively (m5.3.5.4, RH2007/00036/00)(Table 6). When compared to the antiviral activity of DTG IC50 of 0.51 nM in PBMCs the selectivity index for antiviral activity was >9400.

CONFIDENTIALModule 2.7.2.4 Special Studies
16
Table 6 Cytotoxicity Assay Results in PBLs and B and T Cells
Cell lines DTG CC50 (M)
95% CI Flavopiridol CC50 (M)
95% CI
IM-9 (n=4) 4.8 3.0-7.7 0.019 0.012-0.030U-937 (n=4) 7.0 4.8-10 0.035 0.024-0.050MT-4 (n=4) 14 7.0-29 0.13 0.062-0.26Molt-4 (n=4) 15 12-19 0.16 0.13-0.21Stimulated PBLs (n=8) 52 36-76 0.36 0.25-0.53Unstimulated PBLs (n=8) 189 58-620 0.29 0.15-0.56
4.1.8. Susceptibility of Multiple Clade B Clinical Isolates of HIV-1
Dolutegravir activity against site directed mutant strains and clinical isolates with integrase resistance mutations was evaluated at Monogram Biosciences using the Integrase PhenoSense assay (m5.3.5.4, RH2007/00090/00).
The susceptibility of 13 clinically diverse HIV-1 clade B isolates to integrase inhibition by DTG was tested with Monogram Bioscience’s PhenoSense assay. The mean IC50 for viral replication of the clinical isolate based viruses was 0.52 nM (range 0.41 to 0.60 nM)(Table 7).

CONFIDENTIALModule 2.7.2.4 Special Studies
17
Table 7 Activity of DTG against a Panel of HIV-1 Clinical Isolates
Virus IC50 (nM)ASJM 108 0.54
ASM 34 0.54
ASM 42 0.59
NIH 57 0.60
NIH 660 0.41
NIH 657 0.54
NIH 714 0.54
NIH 727 0.50
CV 110 0.49
CV 154 0.49
CV 163 0.55
CV 243 0.43
CV 281 0.49
HIV-1 IIIB 0.46
HXB2 0.65
NL4-3 0.60
Isolate mean 0.52
Isolate Median 0.54
Isolate standard deviation 0.06
Isolate range 0.41 - 0.60
Laboratory virus mean 0.57
Laboratory virus median 0.60
Laboratory virus standard deviation 0.10
Laboratory virus range 0.46 - 0.65
4.1.9. Susceptibility of a Panel of HIV-1 and HIV-2 Isolates in PBMCsand Monocyte Derived Macrophages
The antiviral activity of DTG was tested against a panel of HIV-1 isolates (3 in each group of M clades A, B, C, D, E, F and G, and 3 group O isolates) (Table 8) and 3 HIV-2 isolates, in PBMC assays (m5.3.5.4, RH2008/00134/00) (Table 9). The antiviral activity of DTG against four clade B HIV-1 isolates was also evaluated in cell based monocyte-derived macrophage assays (Table 10). DTG was highly active with broad activity against all HIV-1 (geometric mean IC50 of 0.20 nM and range of 0.02 to 2.14 nM) and HIV-2 (geometric mean IC50 of 0.18 nM and range of 0.09 to 0.61 nM) isolates tested. In the monocyte-derived macrophage assays using 4 clade B isolates, the geometric mean IC50 was 0.87 nM and values ranged from 0.37 to 1.98 nM. Mean IC50s for each of these categories are listed in Table 11.

CONFIDENTIALModule 2.7.2.4 Special Studies
18
Table 8 Activity of DTG against HIV-1 in PBMCs
HIV-1 Isolate Envelope Subtype IC50 (nM)92RW009 A 0.1892UG037 A 0.0992UG029 A 0.5092BR014 B 2.14JR-CSF B 0.0592TH026 B 0.08Ba-L B <0.10Ba-L B 0.2092BR025 C 0.1493IN101 C <0.1093IN101 C 0.5193MW959 C 0.0592UG001 D 0.1792UG024 D 0.3592UG046 D 0.1693TH073 E 0.09CMU08 E 0.24CMU06 E 0.3293BR019 F 0.4493BR020 F 0.2393BR029 F <0.1093BR029 F 0.07JV1083 G 0.87RU132 G 0.20G3 G 0.02BCF01 O 0.41BCF02 O 0.42BCF03 O 1.79
Table 9 Activity of DTG against HIV-2 Isolates in PBMCs
HIV-2 Isolate IC50 (nM)CDC 310319 0.61CDC 310342 <0.10CEC 310342 0.18CBL 20 0.09

CONFIDENTIALModule 2.7.2.4 Special Studies
19
Table 10 Activity of DTG against Subtype B Isolates in Macrophages
HIV-1 Isolate IC50 (nM)Ada 1.33Ba-L 1.9892BR014 0.5892TH026 0.37
Table 11 Mean Activity of DTG against Broad Subtypes and HIV-2 in PBMCs, and Subtype B Isolates in Macrophages
Virus Mean IC50 (nM)Subtype A 0.26Subtype B 0.62Subtype C 0.23Subtype D 0.23Subtype E 0.22Subtype F 0.25Subtype G 0.36Group O 0.87HIV-2 0.29Subtype B in Macrophages 1.07
4.1.10. Activity against non-HIV Viruses
Dolutegravir was evaluated for antiviral activity against a panel of 19 non-HIV viruses. In general, DTG did not exhibit significant antiviral activity in this panel (m5.3.5.4, 2011N113854_00). Some activity was observed against BVDV (IC50 = 66 M), DENV(IC50 = 69.5 M), measles (IC50 = 30.3 M), HCV (IC50 = 11.2 M), and VZV (IC50 = 88.1M) (Table 12, Table 13, Table 14). DTG displayed the highest antiviral activity against HCV. DTG caused a mild cytotoxic effect at the high test concentration.
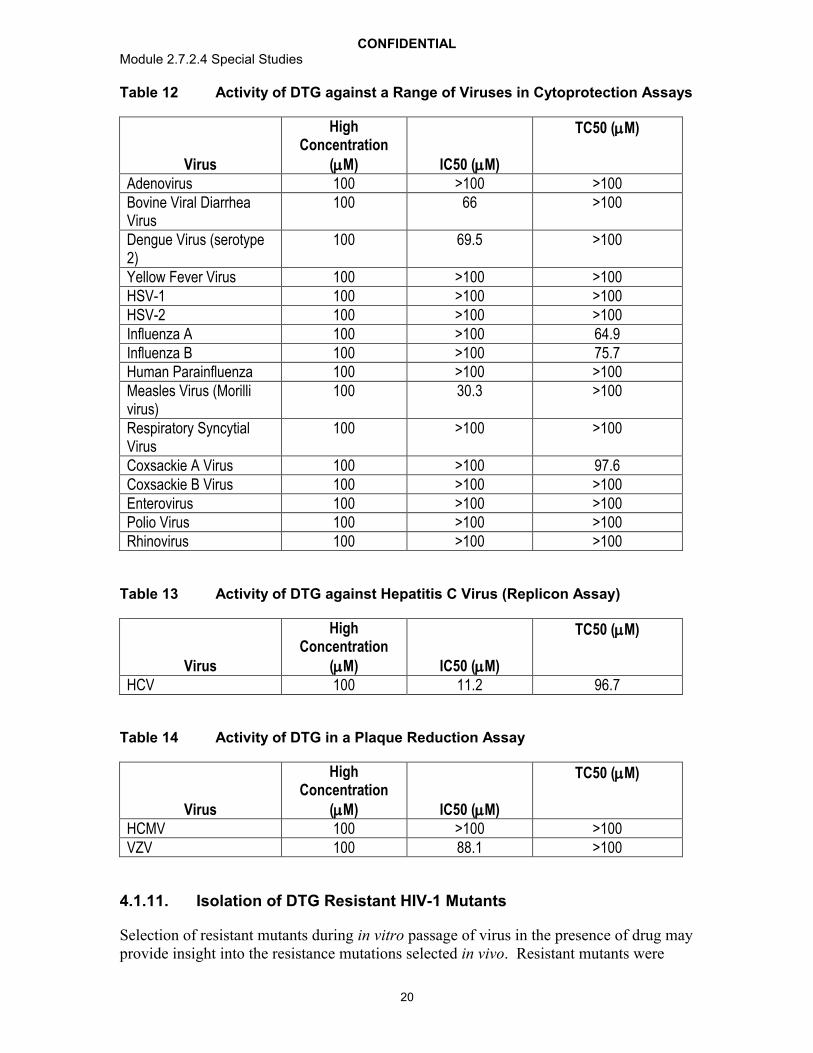
CONFIDENTIALModule 2.7.2.4 Special Studies
20
Table 12 Activity of DTG against a Range of Viruses in Cytoprotection Assays
Virus
High Concentration
(M) IC50 (M)
TC50 (M)
Adenovirus 100 >100 >100Bovine Viral Diarrhea Virus
100 66 >100
Dengue Virus (serotype 2)
100 69.5 >100
Yellow Fever Virus 100 >100 >100HSV-1 100 >100 >100HSV-2 100 >100 >100Influenza A 100 >100 64.9Influenza B 100 >100 75.7Human Parainfluenza 100 >100 >100Measles Virus (Morilli virus)
100 30.3 >100
Respiratory Syncytial Virus
100 >100 >100
Coxsackie A Virus 100 >100 97.6Coxsackie B Virus 100 >100 >100Enterovirus 100 >100 >100Polio Virus 100 >100 >100Rhinovirus 100 >100 >100
Table 13 Activity of DTG against Hepatitis C Virus (Replicon Assay)
Virus
High Concentration
(M) IC50 (M)
TC50 (M)
HCV 100 11.2 96.7
Table 14 Activity of DTG in a Plaque Reduction Assay
Virus
High Concentration
(M) IC50 (M)
TC50 (M)
HCMV 100 >100 >100VZV 100 88.1 >100
4.1.11. Isolation of DTG Resistant HIV-1 Mutants
Selection of resistant mutants during in vitro passage of virus in the presence of drug may provide insight into the resistance mutations selected in vivo. Resistant mutants were

CONFIDENTIALModule 2.7.2.4 Special Studies
21
isolated during passage of wild type virus, virus with RAL resistant mutants, and during simultaneous passage of HIV-1 subtypes B, A/G, and C.
4.1.11.1. Isolation from Wild type HIV-1 Strain IIIB
Virus cultures were derived by co-culturing MT-2 cells with Molt-4 cells persistently infected with HIV-1 strain IIIB (m5.3.5.4, RH2007/00119/00). This strain has ~40% T124A polymorphism in integrase in viral stocks used for passage (Kobayashi, 2011). The culture media from the co-cultures including resuspended co-cultured cells was used for initiating passage of resistant variants. Every 3 or 4 days the cells were examined for apparent cytopathic effects and supernatants were used to infect new MT-2 cells in the presence of increasing DTG concentrations (up to 5-fold). Infected cell DNA was prepared and HIV proviral DNA sequence was determined.
At selected intervals (14, 28, 42, 56, 70, 84, 98 and 112 days), susceptibility to DTG was measured using the supernatant from passaged cells (briefly expanded in fresh M8166 cells) in assays using HeLa-CD4 cells carrying a reporter -galactosidase gene. Viruses highly resistant to DTG were not observed during the 112 day passage, with a 4.1-fold maximum fold resistance observed for the passaged resistant virus with substitutions at the conserved IN positions S153Y and S153F. These data are consistent with direct targeting of the HIV-1 integrase in cells and provide a relative fold resistance level for virus with these substitutions (Table 15).
Table 15 Passage with HIV IIIB
Days of Culture Amino Acid Substitution DTG Fold Change14 T124A 1.2-2.528 T124A 0.57-1.0
T124A, S153F 1.942 T124A 0.48-1.7
T124A, S153F 1.756 T124A 0.95-2.9
T124A, S153F 2.770 T124A 1.1-3.1
T124A, S153Y 2.9L101I, T124A, S153F 2.4
84 T124A 0.82-3.1S153Y 3.7
T124A, S153Y 3.3L101I, T124A, S153F 2.4
98 T124A 1.3-3.1T124A, S153Y 4.1
L101I, T124A, S153F 3.0112 T124A 1.2-4.1
S153Y 2.1T124A, S153Y 1.8-2.6
L101I, T124A/, 153F 2.0

CONFIDENTIALModule 2.7.2.4 Special Studies
22
4.1.11.2. Isolation from Wild Type and Site Directed Mutant INI Resistant HIV-1 Strain NL432
Wild type HIV-1 NL432 and molecular clones with single amino acid substitutions (E92Q, Q148H, Q148K, Q148R, and N155H) within the IN open reading frame were passaged sequentially under increasing concentration of DTG for up to 56 days(m5.3.5.4, RH2008/00144/00). Passaged virus populations were analyzed for genotypic changes on Days 14, 28, 42 and 56, and for phenotypic fold change (FC) on Day 56 samples (Table 16).

CONFIDENTIALModule 2.7.2.4 Special Studies
23
Table 16 Passage of NL-432 and Single Mutants with DTG.
Initial Virus DTG Initial Conc. / Final Conc (nM)
Days of Culture
Amino Acid Substitution DTG Fold Change of Passaged Virus
Pools
NL-432 6.4 / 6.4 56 E92Q 3.1G193E 3.2
Q148K 6.4 / 32 14 E138K, Q148K -28 E138K, Q148K -42 E138K, Q148K -56 E138K, Q148K 47 - 190
Q148R 6.4 / 6.4 or 32
14 Q148R -28 G140S, Q148R -42 G140S, Q148R -56 G140S, Q148R 16 (6.4 final conc.)
G140S, Q148R, V201I 39 (32 final conc.)Q148R 6.4 / 6.4 14 E138K, Q148R -
28 E138K, Q148R -42 E138K, Q148R -56 E138K, G140S, Q148R 13
Q148H 6.4 / 6.4 or 32
14 G140S, Q148H -28 G140S, Q148H -42 G140S, Q148H -56 G140S, Q148H 4.8 – 8.0 (6.4 final
conc.)T97A, G140S, Q148H 44 (32 final conc)V75I, E138K, G140S,
Q148H, M154I46 (32 final conc)
N155H 6.4 / 32 14 N155H -28 N155H -42 N155H -56 N155H 2.0 – 3.9
E92Q 6.4 / 6.4 14 E92Q -28 E92Q -42 E92Q -56 E92Q 2.9 – 4.1
Passage of the wild type HIV-1 NL432 in the presence of 6.4 nM DTG selected for E92Q (FC=3.1) and G193E (FC=3.2) substitutions in the IN region on Day 56. Passage of the Q148K mutant selected E138K/Q148K (FC=47 to190) on Day 14 and was present throughout the remaining passages up to 32 nM DTG with no additional substitutions selected up to Day 56. Passage of the Q148R mutant selected E138K/Q148R and G140S/Q148R (FR=16) on Days 14 and 28, respectively, in the presence of 6.4 nM DTG. Further passage at 32 nM DTG selected E138K/G140S/Q148R (FC=13) and
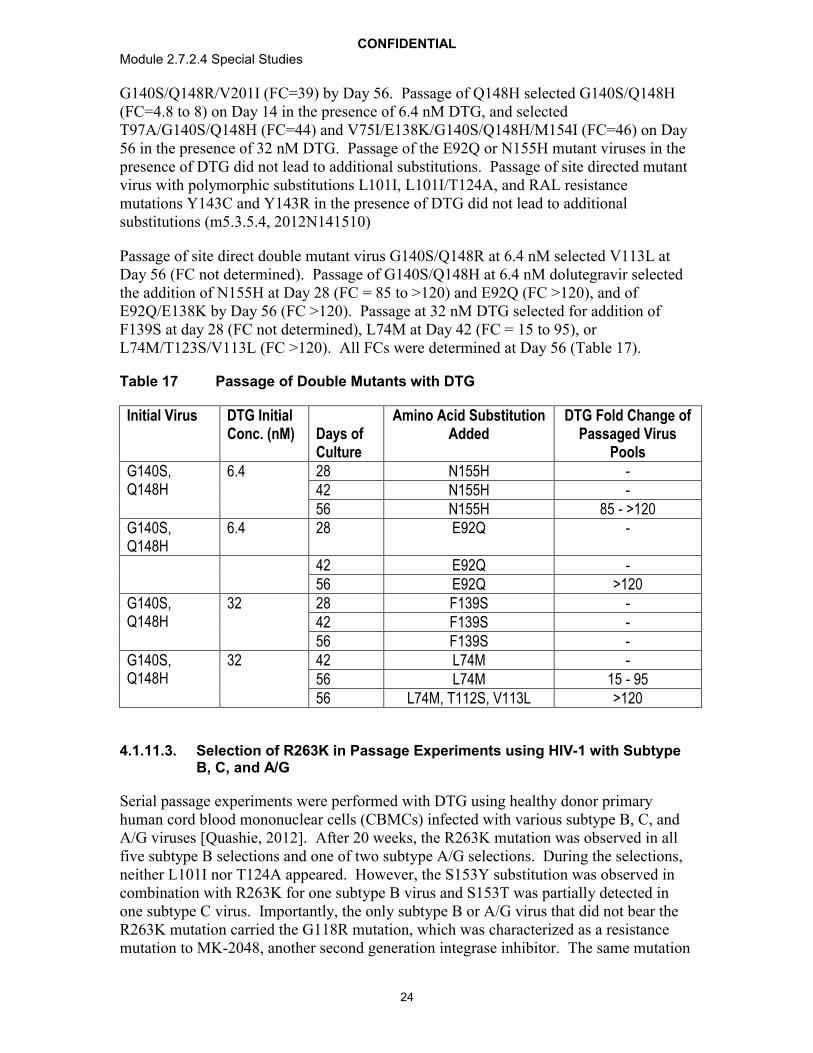
CONFIDENTIALModule 2.7.2.4 Special Studies
24
G140S/Q148R/V201I (FC=39) by Day 56. Passage of Q148H selected G140S/Q148H (FC=4.8 to 8) on Day 14 in the presence of 6.4 nM DTG, and selected T97A/G140S/Q148H (FC=44) and V75I/E138K/G140S/Q148H/M154I (FC=46) on Day 56 in the presence of 32 nM DTG. Passage of the E92Q or N155H mutant viruses in the presence of DTG did not lead to additional substitutions. Passage of site directed mutant virus with polymorphic substitutions L101I, L101I/T124A, and RAL resistance mutations Y143C and Y143R in the presence of DTG did not lead to additional substitutions (m5.3.5.4, 2012N141510)
Passage of site direct double mutant virus G140S/Q148R at 6.4 nM selected V113L at Day 56 (FC not determined). Passage of G140S/Q148H at 6.4 nM dolutegravir selected the addition of N155H at Day 28 (FC = 85 to >120) and E92Q (FC >120), and of E92Q/E138K by Day 56 (FC >120). Passage at 32 nM DTG selected for addition of F139S at day 28 (FC not determined), L74M at Day 42 (FC = 15 to 95), or L74M/T123S/V113L (FC >120). All FCs were determined at Day 56 (Table 17).
Table 17 Passage of Double Mutants with DTG
Initial Virus DTG Initial Conc. (nM) Days of
Culture
Amino Acid SubstitutionAdded
DTG Fold Change of Passaged Virus
PoolsG140S, Q148H
6.4 28 N155H -42 N155H -56 N155H 85 - >120
G140S, Q148H
6.4 28 E92Q -
42 E92Q -56 E92Q >120
G140S, Q148H
32 28 F139S -42 F139S -56 F139S -
G140S, Q148H
32 42 L74M -56 L74M 15 - 9556 L74M, T112S, V113L >120
4.1.11.3. Selection of R263K in Passage Experiments using HIV-1 with Subtype B, C, and A/G
Serial passage experiments were performed with DTG using healthy donor primary human cord blood mononuclear cells (CBMCs) infected with various subtype B, C, andA/G viruses [Quashie, 2012]. After 20 weeks, the R263K mutation was observed in all five subtype B selections and one of two subtype A/G selections. During the selections, neither L101I nor T124A appeared. However, the S153Y substitution was observed in combination with R263K for one subtype B virus and S153T was partially detected in one subtype C virus. Importantly, the only subtype B or A/G virus that did not bear the R263K mutation carried the G118R mutation, which was characterized as a resistance mutation to MK-2048, another second generation integrase inhibitor. The same mutation

CONFIDENTIALModule 2.7.2.4 Special Studies
25
(G118R) was observed in one subtype C virus. The R263K mutation was detected alone or in combination with other substitutions that varied among virus strains. R263K emerged early in culture in both subtype B and A/G viruses (Table 18).
Table 18 Serial Passage Experiments with CBMCs infected with Subtype B, A/G, and C HIV-1 Viruses in the Presence of Increasing Concentrations of DTG
Week 20 Week 37Subtype Virus DTG
Concentration (M)
Acquired Mutations
DTG Concentration
(M)
Acquired Mutations
B 5331 0.05 R263KB BK-132 0.05 R263K,
W243G/W0.05 R263K,
E138E/KB 5326 0.05 R263K/R,
S153Y, R166K/R
0.05 S153Y
B PNL4.3 0.05 R263K, M50I/M, V151I
0.05 R263K, M50I, V151I
B 12197 RAL TI
0.01 R263K, D288E 0.025 R263K, D288E (week
34)A/G 6399 0.025 G118R, E69E/K 0.05 G118RA/G 96USSN20 0.1 R263K 0.1 R263K,
H51H/YC 4742 0.05 G118R 0.05 G118R,
H51YC 96USNG31 0.01 S153S/T 0.025 H51Y,
G193E/G
4.1.12. Assessment of Resistance
Comparative susceptibilities to DTG and RAL were obtained from 60 RAL resistant site directed HIV-1 mutants and 6 site directed HIV-2 mutants.
4.1.12.1. Sixty Integrase Inhibitor Resistant HIV-1 Strains
HIV-1 viruses (28 with single mutations, Table 19) and 32 with two or more mutations,(Table 20) were produced from wildtype virus NL-432 using site directed mutagenesis DTG and other INI susceptibilities were tested in HeLa-CD4 cell assay carrying a reporter -galactosidase gene driven by HIV-1 LTR (m5.3.5.4, RH2007/00088/00, RH2007/00115/00, RH2008/00148/00, RH2010/00017/00). DTG showed anti-HIV activity (susceptibility) with fold change (FC) <5 against 27 of 28 INI-resistant mutant viruses with single mutations including T66A/I/K, E92Q/V, Y143C/H/R, Q148H/K/R, Q148R, and N155H, while for RAL there were 17/28 mutant viruses with FC <5. EVG(compound 3927 in m5.3.5.4, RH2005/00088/00) FC was obtained for 21 of these 28

CONFIDENTIALModule 2.7.2.4 Special Studies
26
viruses; 11 of 21 had FC <5. In addition, of the 32 INI-resistant mutant viruses with two or more mutations, 23 of 32 showed FC <5 to DTG compared with FC < 5 for 4 of 32 for RAL. EVG FC was obtained for 25 of these 32 viruses; 2 of 25 had FC <5.
Overall against the 60 site directed mutant viruses (single and 2 mutations), DTG showed a fold change (FC) of <2 for 39 of 60, while RAL showed a FC of <2 for 16 of 60. DTG showed a FC of 10 for 3 of 60, while RAL showed a FC of 10 for 32 of 60. Of the 46 mutant viruses with data for EVG, 7 of 46 showed a FC of <2, and 30 of 46 showed a FC of 10.

CONFIDENTIALModule 2.7.2.4 Special Studies
27
Table 19 Fold Change (FC) of DTG and RAL against INI-Resistance Single Mutant Viruses by HeLa-CD4 Assay
virus DTG FC (SD) RAL FC (SD) EVG FC (SD)Wild type (NL432) 1.0 (IC50=2.1 nM, SD=0.36) 1.0 (IC50=6.1 nM, SD=0.89) -Wild type (NL432) 1.0 (IC50=2.0 nM, SD=0.34) 1.0 (IC50=8.6 nM, SD=1.3) 1.0 (IC50=1.3 nM, SD=0.24)T66A 0.26 (0.01) 0.61 (0.09) -T66I 0.26 (0.09) 0.51 (0.10 8 (1.7)T66K 2.3 (0.35) 9.6 (1.3) 84 (29)E92I 1.5 (0.19) 2.1 (0.62) -E92Q 1.6 (0.12) 3.5 (1.4) 19 (8.1)E92V 1.3 (0.20) 1.4 (0.18) -G118R 10 (4.7) 7.2 (1.5) -G118S 1.1 (0.21) 1.2 (0.30) -F121Y 0.81 (0.12) 6.1 (1.3) 36 (23)T124A 0.95 (0.19) 0.82 (0.08) 1.2 (0.29)E138K 0.97(0.029) 1.0 (0.30) 0.93 (0.12)G140S 0.86 (0.30) 1.1 (0.22) 2.7 (0.63)Y143C 0.95 (0.26 3.2 (0.57) 1.5 (0.46)Y143R 1.4 (0.29) 16 (3.9) 1.8 (0.16)Y143H 0.89 (0.11) 1.8 (0.38) 1.5 (0.047)P145S 0.49 (0.08) 0.87 (0.20) >345Q146R 1.6 (0.17) 1.2 (0.26) 2.8 (0.72)Q148H 0.97 (0.67) 13 (5.0) 7.3 (2.3)Q148K 1.1 (0.19) 83 (6.6) >1726Q148R 1.2 (0.21) 47 (9.3) 244 (91)+I151L 3.6 (3.6) 8.4 (4.7) -S153F 1.6 (0.20) 1.3 (0.14) 2.8 (0.93)S153Y 2.5 (1.1) 1.3 (0.19) 2.3 (0.49)M154I 0.93 (0.27) 0.82 (0.18) 1.1 (0.18)N155H 0.99 (0.094) 8.4 (1.8) 25 (7.8)N155S 1.4 (0.36) 6.2 (1.9) 68 (2.6)N155T 1.9 (0.32) 5.2 (2.0) -G193E 1.3 (0.25) 1.3 (0.35) 1.3 (0.40)

CONFIDENTIALModule 2.7.2.4 Special Studies
28
Table 20 Fold Change (FC) of DTG and RAL against INI-Resistance Multiple Mutant Viruses by HeLa-CD4 Assay
virus DTG FC (SD) RAL FC (SD) EVG FC (SD)Wild type (NL432) 1.0 (IC50=2.1 nM, SD=0.36) 1.0 (IC50=6.1 nM, SD=0.89) -Wild type (NL432) 1.0 (IC50=2.0 nM, SD=0.34) 1.0 (IC50=8.6 nM, SD=1.3 1.0 (IC50=1.3 nM, SD=0.24)T66I, I74M 0.35 (0.08) 2.0 (0.81) -T66I, E92Q 1.2 (0.19) 18 (3.6) 185 (103)T66K, L74M 3.5 (0.94) 40 (13) 117 (33)V72I, F121Y, T125K 1.3 (0.54) 13 (7.1) -V72I, F121Y, T125K, I151V 1.2 (0.32) 7.0 (2.8) -L74M, N155H 0.91 (0.17) 28 (12) 42 (8.6)V75I, E138K, G140S, Q148H, M154I
21 (6.6) >660 2600 (450)
E92Q, N155H 2.5 (1.2) >130 320 (39)T97A, N155H 1.1 (0.46) 26 (7.9) 37 (6.9)T97A, G140S, Q148H 13 (2.1) >660 3900 (630)L101I, S153F 2.0 (0.11) 1.3 (0.54) 2.6 (0.23)L101I, T124A, S153F 1.9 (0.24) 1.4 (0.14) 2.0 (0.40)F121Y, T125K 0.98 (0.35) 11 (0.49) -E138K, Q148H 0.89 (0.24) 17 (5.9) 6.7 (1.5)E138K, Q148K 19 (8.0) 330 (75) -E138K, Q148R 4.0 (1.1) 110 (37) 461 (229)E138A, Q148R 2.6 (0.47) 110 260 (12)E138K, G140S, Q148H 4.5 (1.1) 500 (210) 1600 (370)E138K, G140S, Q148R 8.3 (1.1) >660 190 (43)E138K, G140S, Q148H, M154I 8.4 (1.5) >660 2400 (670)E138A, S147G, Q148R 1.9 (0.89) 27 (3.7) 130 (8.8)G140C, Q148R 4.9 (1.8) 200 (42) -G140S, Q148H 2.6 (1.4) >130 >890G140S, Q148K 1.5 (0.10 3.7 (1.3) 94 (53)

CONFIDENTIALModule 2.7.2.4 Special Studies
29
virus DTG FC (SD) RAL FC (SD) EVG FC (SD)G140S, Q148R 8.4 (4.0) 200 (5.3) -G140S, Q148H, M154I 7.0 (0.98) >660 3000 (780)G140S, Q148R, V201I 10 (3.0) >660 420 (80)Y143H, N155H 1.7 (0.27) 38 16 (4.6)Q148R, N155H 10 (1.4) >140 390N155H, G163R 1.1 (0.18) 17 (5.9) 35 (12)N155H, G163K 1.4 (0.40) 23 (7.2) 35 (4.4)N155H, D232N 1.4 (0.25 20 (3.9) 36 (7.1)
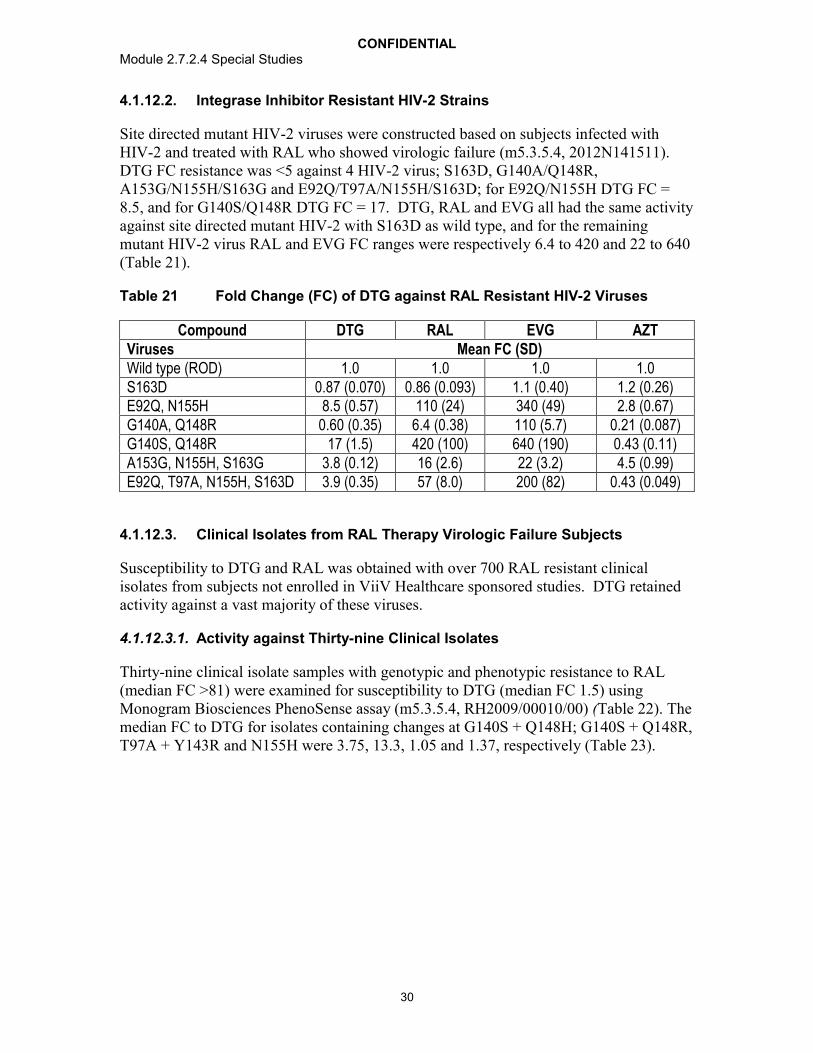
CONFIDENTIALModule 2.7.2.4 Special Studies
30
4.1.12.2. Integrase Inhibitor Resistant HIV-2 Strains
Site directed mutant HIV-2 viruses were constructed based on subjects infected with HIV-2 and treated with RAL who showed virologic failure (m5.3.5.4, 2012N141511). DTG FC resistance was <5 against 4 HIV-2 virus; S163D, G140A/Q148R, A153G/N155H/S163G and E92Q/T97A/N155H/S163D; for E92Q/N155H DTG FC = 8.5, and for G140S/Q148R DTG FC = 17. DTG, RAL and EVG all had the same activity against site directed mutant HIV-2 with S163D as wild type, and for the remaining mutant HIV-2 virus RAL and EVG FC ranges were respectively 6.4 to 420 and 22 to 640(Table 21).
Table 21 Fold Change (FC) of DTG against RAL Resistant HIV-2 Viruses
Compound DTG RAL EVG AZTViruses Mean FC (SD)Wild type (ROD) 1.0 1.0 1.0 1.0S163D 0.87 (0.070) 0.86 (0.093) 1.1 (0.40) 1.2 (0.26)E92Q, N155H 8.5 (0.57) 110 (24) 340 (49) 2.8 (0.67)G140A, Q148R 0.60 (0.35) 6.4 (0.38) 110 (5.7) 0.21 (0.087)G140S, Q148R 17 (1.5) 420 (100) 640 (190) 0.43 (0.11)A153G, N155H, S163G 3.8 (0.12) 16 (2.6) 22 (3.2) 4.5 (0.99)E92Q, T97A, N155H, S163D 3.9 (0.35) 57 (8.0) 200 (82) 0.43 (0.049)
4.1.12.3. Clinical Isolates from RAL Therapy Virologic Failure Subjects
Susceptibility to DTG and RAL was obtained with over 700 RAL resistant clinical isolates from subjects not enrolled in ViiV Healthcare sponsored studies. DTG retained activity against a vast majority of these viruses.
4.1.12.3.1. Activity against Thirty-nine Clinical Isolates
Thirty-nine clinical isolate samples with genotypic and phenotypic resistance to RAL(median FC >81) were examined for susceptibility to DTG (median FC 1.5) using Monogram Biosciences PhenoSense assay (m5.3.5.4, RH2009/00010/00) (Table 22). The median FC to DTG for isolates containing changes at G140S + Q148H; G140S + Q148R, T97A + Y143R and N155H were 3.75, 13.3, 1.05 and 1.37, respectively (Table 23).

CONFIDENTIALModule 2.7.2.4 Special Studies
31
Table 22 Genotypes and FCs to DTG and RAL for Clinical Isolates in Subjects Failing RAL Therapy
Sample Number Genotype DTG FC
RAL FC Months on RAL
3242 N155H 1.37 34 5.73242 N155H 1.22 36 7.53251 N155H 1.45 14 6.73246 T97A, Y143R 1.04 >81 6.43246 T97A, Y143R 1.06 >81 11.63249 T97A, Y143Y/C 1.09 49 5.63249 T97T/A, Y143Y/C 1.05 7.08 9.63249 T97T/A, Y143Y/C 0.91 >81 14.43261 T97T/A, N155N/H 1.11 3.74 13.73508 E92E/Q, T97T/A, Y143R 0.87 59 6.63501 G140G/S, Q148Q/H 1.38 3.9 5.63180 G140S, Q148H 4.96 >87 5.93180 G140S, Q148H 3.75 >87 7.83223 G140S, Q148H 3.16 >87 10.53240 G140S, Q148H 15.0 >87 3.33501 G140S, Q148H 2.05 58 1.83501 E138E/A, G140G/S,
Q148Q/H2.96 >81 7.5
3501 E138E/A, G140G/S, Q148Q/H
1.94 19 8.9
3501 E138E/A, G140G/S, Q148Q/H
2.64 >81 11.3
3501 E138E/A, G140G/S, Q148Q/H
1.58 12 3.8
3508 E92Q, N155N/H, G140G/S, Q148Q/R
4.07 >81 2.8
3501 E138E/K, G140G/S, Q148Q/H, N155N/D
2.16 25 6.3
3180 Wild type 1.11 1.18 -0.73223 Wild type 0.69 0.9 -2.23223 Wild type 0.65 0.85 6.23240 Wild type 0.64 1.02 03242 Wild type 0.59 0.45 03242 Wild type 0.54 0.45 8.73261 Wild type 0.84 0.79 6.73501 Wild type 0.79 0.58 03508 Wild type 0.63 0.83 -0.2Library 44 N155H 1.45 18 NALibrary 45 G140S, Q148R 7.57 >87 NALibrary 46 G140S, Q148R 19 >87 NALibrary 47 N155H 1.33 19 NALibrary 48 T97A, E138E/K, Y143R 1.32 >87 NA
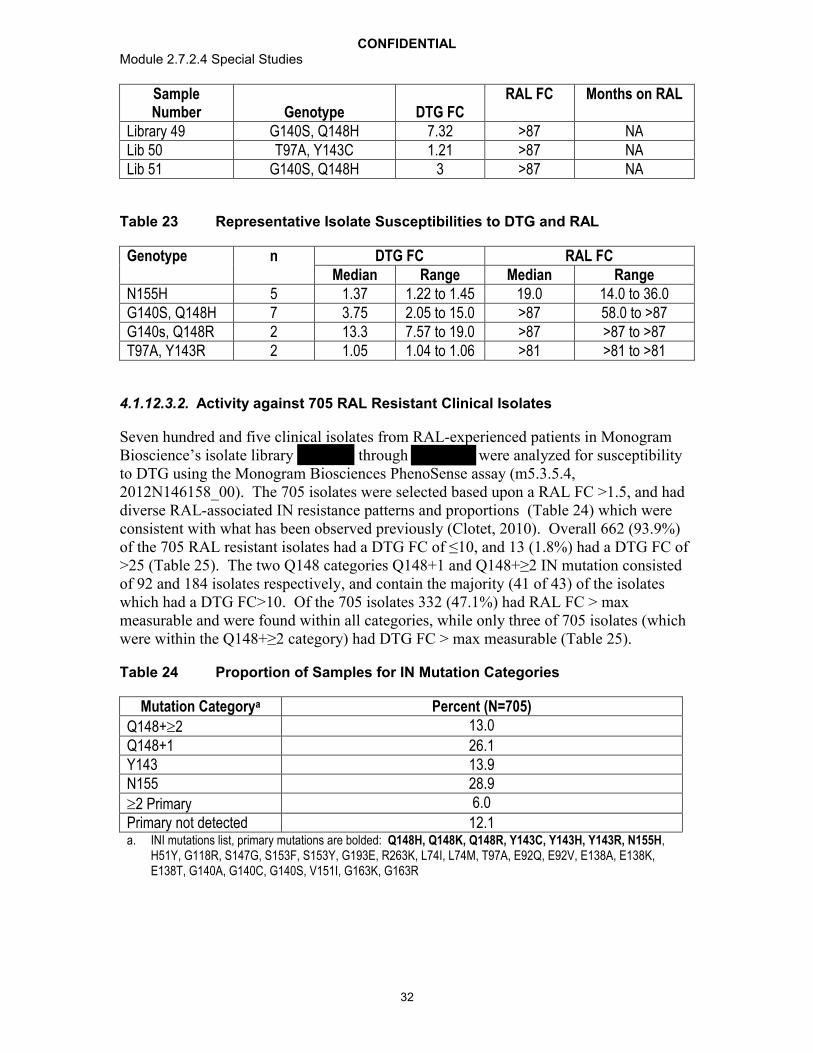
CONFIDENTIALModule 2.7.2.4 Special Studies
32
Sample Number Genotype DTG FC
RAL FC Months on RAL
Library 49 G140S, Q148H 7.32 >87 NALib 50 T97A, Y143C 1.21 >87 NALib 51 G140S, Q148H 3 >87 NA
Table 23 Representative Isolate Susceptibilities to DTG and RAL
Genotype n DTG FC RAL FCMedian Range Median Range
N155H 5 1.37 1.22 to 1.45 19.0 14.0 to 36.0G140S, Q148H 7 3.75 2.05 to 15.0 >87 58.0 to >87G140s, Q148R 2 13.3 7.57 to 19.0 >87 >87 to >87T97A, Y143R 2 1.05 1.04 to 1.06 >81 >81 to >81
4.1.12.3.2. Activity against 705 RAL Resistant Clinical Isolates
Seven hundred and five clinical isolates from RAL-experienced patients in Monogram Bioscience’s isolate library through were analyzed for susceptibility to DTG using the Monogram Biosciences PhenoSense assay (m5.3.5.4,2012N146158_00). The 705 isolates were selected based upon a RAL FC >1.5, and had diverse RAL-associated IN resistance patterns and proportions (Table 24) which were consistent with what has been observed previously (Clotet, 2010). Overall 662 (93.9%)of the 705 RAL resistant isolates had a DTG FC of ≤10, and 13 (1.8%) had a DTG FC of >25 (Table 25). The two Q148 categories Q148+1 and Q148+≥2 IN mutation consisted of 92 and 184 isolates respectively, and contain the majority (41 of 43) of the isolates which had a DTG FC>10. Of the 705 isolates 332 (47.1%) had RAL FC > max measurable and were found within all categories, while only three of 705 isolates (which were within the Q148+≥2 category) had DTG FC > max measurable (Table 25).
Table 24 Proportion of Samples for IN Mutation Categories
Mutation Categorya Percent (N=705)
Q148+2 13.0
Q148+1 26.1Y143 13.9N155 28.9
2 Primary 6.0
Primary not detected 12.1a. INI mutations list, primary mutations are bolded: Q148H, Q148K, Q148R, Y143C, Y143H, Y143R, N155H,
H51Y, G118R, S147G, S153F, S153Y, G193E, R263K, L74I, L74M, T97A, E92Q, E92V, E138A, E138K, E138T, G140A, G140C, G140S, V151I, G163K, G163R
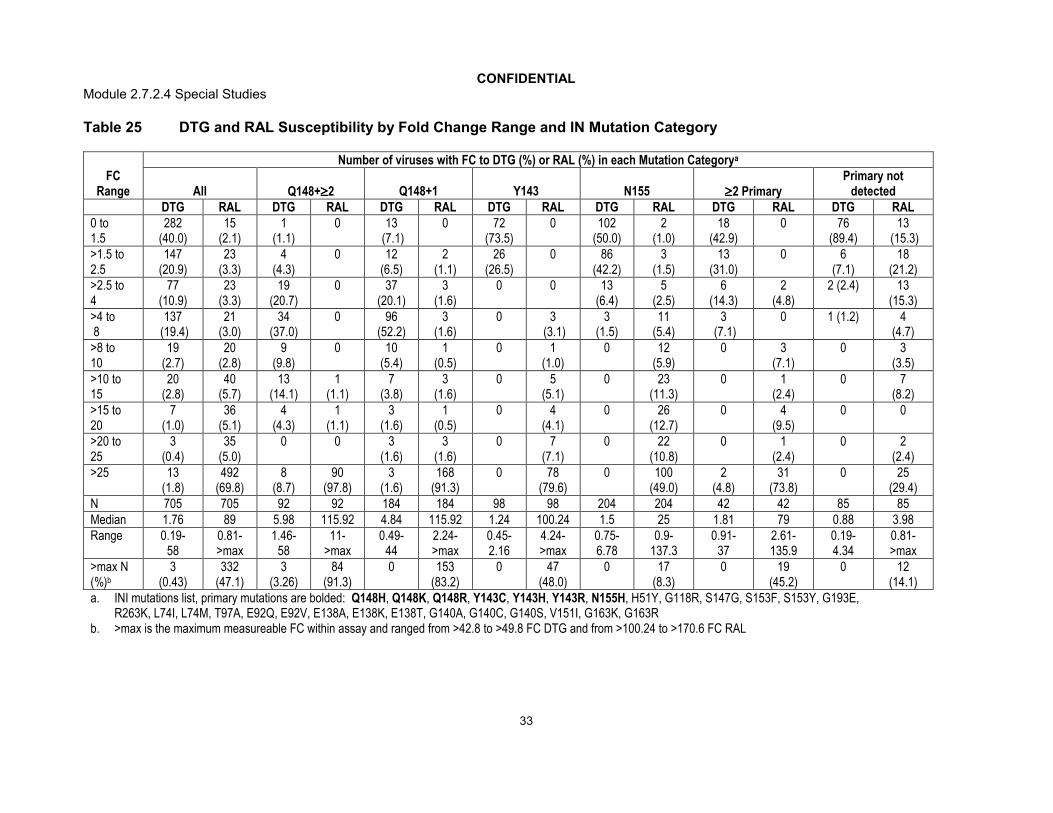
CONFIDENTIALModule 2.7.2.4 Special Studies
33
Table 25 DTG and RAL Susceptibility by Fold Change Range and IN Mutation Category
FC Range
Number of viruses with FC to DTG (%) or RAL (%) in each Mutation Categorya
All Q148+2 Q148+1 Y143 N155 2 PrimaryPrimary not
detectedDTG RAL DTG RAL DTG RAL DTG RAL DTG RAL DTG RAL DTG RAL
0 to 1.5
282 (40.0)
15 (2.1)
1 (1.1)
0 13(7.1)
0 72 (73.5)
0 102 (50.0)
2 (1.0)
18 (42.9)
0 76 (89.4)
13(15.3)
>1.5 to2.5
147 (20.9)
23 (3.3)
4 (4.3)
0 12 (6.5)
2 (1.1)
26 (26.5)
0 86 (42.2)
3 (1.5)
13 (31.0)
0 6 (7.1)
18 (21.2)
>2.5 to 4
77(10.9)
23 (3.3)
19 (20.7)
0 37 (20.1)
3 (1.6)
0 0 13 (6.4)
5(2.5)
6 (14.3)
2 (4.8)
2 (2.4) 13 (15.3)
>4 to8
137(19.4)
21 (3.0)
34 (37.0)
0 96 (52.2)
3 (1.6)
0 3(3.1)
3 (1.5)
11 (5.4)
3(7.1)
0 1 (1.2) 4 (4.7)
>8 to 10
19 (2.7)
20 (2.8)
9 (9.8)
0 10 (5.4)
1 (0.5)
0 1 (1.0)
0 12 (5.9)
0 3 (7.1)
0 3 (3.5)
>10 to 15
20(2.8)
40 (5.7)
13 (14.1)
1 (1.1)
7 (3.8)
3 (1.6)
0 5 (5.1)
0 23 (11.3)
0 1 (2.4)
0 7 (8.2)
>15 to 20
7 (1.0)
36 (5.1)
4 (4.3)
1 (1.1)
3 (1.6)
1 (0.5)
0 4 (4.1)
0 26 (12.7)
0 4 (9.5)
0 0
>20 to 25
3(0.4)
35 (5.0)
0 0 3 (1.6)
3 (1.6)
0 7 (7.1)
0 22 (10.8)
0 1 (2.4)
0 2 (2.4)
>25 13 (1.8)
492 (69.8)
8 (8.7)
90 (97.8)
3 (1.6)
168(91.3)
0 78 (79.6)
0 100 (49.0)
2 (4.8)
31 (73.8)
0 25 (29.4)
N 705 705 92 92 184 184 98 98 204 204 42 42 85 85Median 1.76 89 5.98 115.92 4.84 115.92 1.24 100.24 1.5 25 1.81 79 0.88 3.98Range 0.19-
580.81->max
1.46-58
11->max
0.49-44
2.24->max
0.45-2.16
4.24->max
0.75-6.78
0.9-137.3
0.91-37
2.61-135.9
0.19-4.34
0.81->max
>max N(%)b
3 (0.43)
332 (47.1)
3 (3.26)
84 (91.3)
0 153 (83.2)
0 47 (48.0)
0 17 (8.3)
0 19 (45.2)
0 12 (14.1)
a. INI mutations list, primary mutations are bolded: Q148H, Q148K, Q148R, Y143C, Y143H, Y143R, N155H, H51Y, G118R, S147G, S153F, S153Y, G193E, R263K, L74I, L74M, T97A, E92Q, E92V, E138A, E138K, E138T, G140A, G140C, G140S, V151I, G163K, G163R
b. >max is the maximum measureable FC within assay and ranged from >42.8 to >49.8 FC DTG and from >100.24 to >170.6 FC RAL

CONFIDENTIALModule 2.7.2.4 Special Studies
34
4.1.12.3.3. Characterization of DTG resistance in the Raltegravir Resistant Clinical Isolate Population
To better understand the extent and evolving characteristics of DTG resistance in broad clinical practice for subjects experiencing virologic failure on RAL, queries into RAL resistant pathway frequencies was carried out on 1079 patient samples with an aim to detecting genotypic changes over time, and the proportion of isolates with potential increased DTG fold change resistance (m5.3.5.4, 2010N152930_00).
Query analysis
The query was in two parts and compared samples received and tested at Monogram Biosciences over two time periods encompassing collection dates between through inclusive (N=273) compared with through inclusive (N=806). Monogram Biosciences carried out the Queries into their dataset and provided proportions within the defined groups.
Query One compared proportions of specific primary and secondary mutations and also samples without the defined mutations:
Primary mutations: Y143C; Y143H; Y143R; Q148H; Q148K; Q148R; N155H. Secondary mutations: L74I,M; T97A; E92Q,V; E138A,K,T; G140A,C,S; V151I; G163K,R; None of above mutations.
Query parameters: Mixtures at a specific position will be counted as one mutation (example: both E92Q/V and E92Q will be counted as one E92Q mutation).
Query Two compared Q148H/K/R in combination with increasing number of other RAL associated secondary resistance mutations, or with other primary resistance mutations:
Primary RAL Resistance Associated Mutations: Y143C, Y143H, Y143R, N155H. Secondary RAL Resistance Associated Mutations: L74I, L74M, T97A, E92Q, E92V, E138A, E138K, E138T, G140A, G140C, G140S, V151I, G163K, G163R
Parameters: Proportions of five groups were determined: Q148H or Q148K or Q148R + 1 secondary; Q148H or Q148K or Q148R + 2 secondary; Q148H or Q148K or Q148R + 3 secondary; Q148H or Q148K or Q148R + 4 secondary; or Q148H or Q148K or Q148R + other primaries. Mixtures at a specific position were counted as one mutation (example: both E92Q/V and E92Q be counted as one E92Q mutation). Prevalence for categories 1, 2, 3, and 4 were calculated within samples with no other primary RAL resistance associated mutations.
Enumeration of key RAL associated resistance mutations in virus samples with Q148+≥2
Data for the frequencies of RAL primary and secondary mutations (and associated DTG susceptibilities) for a set of 705 isolates randomly selected from the 806 isolates in the
through window is found in m5.3.5.4, 2012N146158_00. The

CONFIDENTIALModule 2.7.2.4 Special Studies
35
different IN mutation categories evaluated within that report were Q148 + ≥2 mutation category, Q148+1 mutation category, Y143 mutation category, N155 mutation category, ≥2 Primary IN mutations category, and Primary not detected category.
Isolates from the ≥2 Primary IN mutations category with genotypes demonstrating presence of Q148 + at least two secondary mutations were included within the Q148 + ≥2 mutation category for this enumeration. This supergroup category called Q148 + ≥2 +P allows for evaluating proportions of key resistance mutations (L74I, E138A/K/T, and G140A/C/S) in all available virus possessing Q148 + ≥2 RAL associated resistance mutations.
Phenotypic data was provided with listed defined INI-associated resistance mutations within the integrase open reading frame. The defined list of mutations is provided, primary mutations are in bold: Q148H, Q148K, Q148R, Y143C, Y143H, Y143R, N155H, H51Y, G118R, S147G, S153F, S153Y, G193E, R263K, L74I, L74M, T97A, E92Q, E92V, E138A, E138K, E138T, G140A, G140C, G140S, V151I, G163K, G163R.
Table 26 provides the proportions of isolate samples for IN single mutation categories. There were decreases in the proportion of Q148 pathway virus, including the tightly associated G140 secondary mutation, from the early to late window. N155H increased during this time.
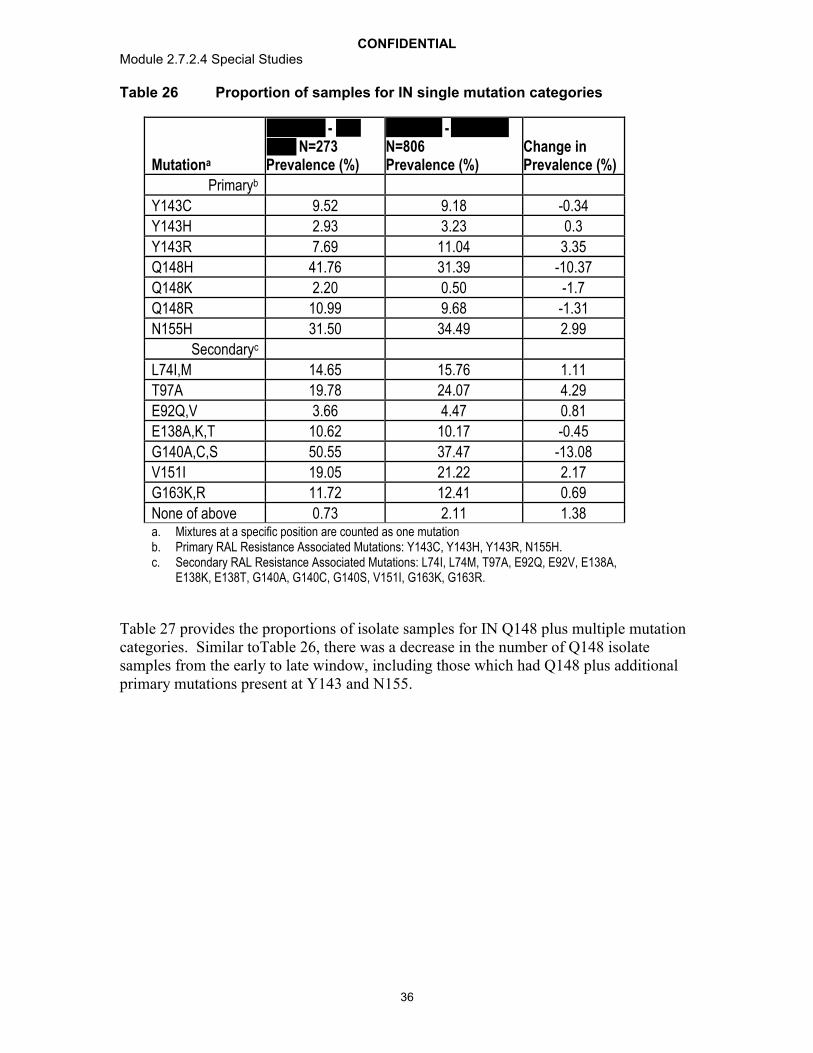
CONFIDENTIALModule 2.7.2.4 Special Studies
36
Table 26 Proportion of samples for IN single mutation categories
Mutationa
- N=273
Prevalence (%)
- N=806Prevalence (%)
Change in Prevalence (%)
Primaryb
Y143C 9.52 9.18 -0.34
Y143H 2.93 3.23 0.3
Y143R 7.69 11.04 3.35
Q148H 41.76 31.39 -10.37
Q148K 2.20 0.50 -1.7
Q148R 10.99 9.68 -1.31
N155H 31.50 34.49 2.99
Secondaryc
L74I,M 14.65 15.76 1.11
T97A 19.78 24.07 4.29
E92Q,V 3.66 4.47 0.81
E138A,K,T 10.62 10.17 -0.45
G140A,C,S 50.55 37.47 -13.08
V151I 19.05 21.22 2.17
G163K,R 11.72 12.41 0.69
None of above 0.73 2.11 1.38a. Mixtures at a specific position are counted as one mutationb. Primary RAL Resistance Associated Mutations: Y143C, Y143H, Y143R, N155H. c. Secondary RAL Resistance Associated Mutations: L74I, L74M, T97A, E92Q, E92V, E138A,
E138K, E138T, G140A, G140C, G140S, V151I, G163K, G163R.
Table 27 provides the proportions of isolate samples for IN Q148 plus multiple mutation categories. Similar toTable 26, there was a decrease in the number of Q148 isolate samples from the early to late window, including those which had Q148 plus additional primary mutations present at Y143 and N155.

CONFIDENTIALModule 2.7.2.4 Special Studies
37
Table 27 Proportion of samples for IN Q148 plus multiple mutation categories
Mutation Profile -N=273
Prevalence (%)
- N=806
Prevalence (%)
Difference in Prevalence (%)
Q148H/K/R + 1a 33.33 26.67 -6.66
Q148H/K/R + ≥2 15.75 10.3 -5.45
Q148H/K/R + 2 13.55 9.06 -4.49
Q148H/K/R + 3 2.2 1.24 -0.96
Q148H/K/R + other primary(s)b 4.4 3.23 -1.17
a. Q148H or Q148K or Q148R + 1, 2, 3, or 4 secondaries were evaluated. Secondaries: H51Y, G118R, S147G, S153F, S153Y, G193E, R263K, L74I, L74M, T97A, E92Q, E92V, E138A, E138K, E138T, G140A, G140C, G140S, V151I, G163K, G163R. Mixtures at a specific position were counted as one mutation.
b. Primaries: Q148H, Q148K, Q148R, Y143C, Y143H, Y143R, N155H
Table 28 is for 115 isolates of a total of 705 random isolates from the through time frame (m5.3.5.4, 2012N146158_00). The 115 isolate samples include 92
isolates from the Q148 + ≥2 mutations category + 23 isolates from the ≥2 Primary IN mutations category with (in addition to a second primary mutation at Y143 or N155) a Q148 signature mutation plus at least two RAL-associated secondary mutations. There were overall 62 subjects with at least two derived key mutations within the 115 subjects. The majority of those 62 subjects with the derived mutations were in the set Q148 + G140 + E138 (n=46) followed by Q148 + G140 + L74 (n=14) and then all 3 Q148 + G140 + E138 + L74 (n=2).

CONFIDENTIALModule 2.7.2.4 Special Studies
38
Table 28 Proportion of Samples with Key Mutations in the Q148+>=2 + P Group
Mutationsa from Q148 derived mutation group present
Total number per Group
All three mutations: Q148 + G140 + E138 + L74 2
Two of three Mutations: Q148 + G140 + E138 46 Q148 + G140 + L74 14 Q148 + L74 + E138 0
One of three mutations: Q148 + L74 0 Q148 + E138 9 Q148 + G140 41
Zero of three mutations: Not L74 or E138 or G140 3
Total 115a. Key mutations L74I, E138A/K/T, G140A/C/S.
4.1.13. Evaluation of DTG Dissociation from Wild Type and Integrase Inhibitor Resistant Integrase-DNA Complexes
The dissociation of DTG, RAL, and EVG from wild type and mutant IN proteins complexed with DNA was investigated to obtain a better understanding of INI dissociation kinetics. DTG demonstrated slower dissociation from all IN-DNA complexes tested, including those with single and double residue IN substitutions, compared to RAL and EVG.
The dissociation rate of [3H]-labeled INIs, including DTG was determined at 37°C against a panel of integrase proteins, including wild type and signature RAL and EVGresistant mutations (WT, E92Q, G140S, Y143C, Y143H, Y143R, Q148H, Q148K, Q148R, N155H, E92Q/N155H, E138K/Q148R, G140S/Q148H) (m5.3.5.4,2011N114191_00). Integrase:DNA duplexes attached to Scintillation Proximity Assay(SPA) imaging beads were incubated with [3H]-labeled DTG, RAL, or EVG overnight to achieve maximum binding. Excess unlabeled INI was added to block re-binding of the released 3H-INI which results in a decrease in signal measured via a ViewLux™ CCD imager for up to 2.5 weeks.
For wild type integrase, the half-life of dissociation for DTG was approximately 71 hours at 37°C, substantially longer than the half-life for RAL (8.8 hours) or EVG (2.7 hours). Prolonged binding (t1/2 of at least 7 hours) was observed for DTG with E92, Y143, Q148,

CONFIDENTIALModule 2.7.2.4 Special Studies
39
and N155 integrase mutants. For all of the integrase mutants tested, the off-rate of DTG was significantly slower (from 6 to 60 times slower) than the off-rate of RAL or EVG. The addition of a second mutant to either a Q148 or N155 mutant resulted in an increase in the dissociation rate compared to the single mutant but DTG retained significant binding (Table 29).
Table 29 Dissociation of INIs from IN-DNA Complexes at 37C
INKoff(s-1)a (10-6) t1/2(h)
DTG RAL EVG DTG RAL EVG
Wild type 2.7 0.4 22 2 71 4 71 8.8 2.7
E92Q 11.4 0.3 59 9 430 20 17 3.3 0.4
E138K 2.3 0.2 17 0.3 52 1 84 11 3.7
G140S 9.6 0.8 44 3 180 20 20 4.4 1.1
Y143C 3.2 0.1 96 4 91 2 60 2.0 2.1
Y143H 4.4 0.2 78 2 120 6 44 2.5 1.6
Y143R 4.6 0.3 176 4 116 5 42 1.1 1.7
Q148H 37 3 1160 120 1130 140 5.2 0.2 0.2
Q148K 18 5 730 130 ND 11 0.3 ND
Q148R 21 2 480 80 ND 9.2 0.4 ND
N155H 20 2 300 80 500 140 9.6 0.6 0.4
E92Q/N155H 49 3 770 70 ND 3.9 0.3 ND
E138K/Q148H 53 10 900 340 ND 3.6 0.2 ND
G140S/Q148H 58 8 1130 210 ND 3.3 0.2 NDa. koff values represent mean and SD for 3 to 8 independent experiments. ND denotes not determined due to low
signal with [3H]EVG.
In addition to specific RAL and EVG resistance-based mutant integrase proteins, the binding of DTG, RAL, and EVG was determined for integrase proteins based on treatment emergent resistance mutations observed with RAL resistant viruses in the clinical study ING112961 and for substitutions and combinations of substitutions identified during passage studies and their related control proteins (m5.3.5.4,2012N145179_00). G118R and G118R/E138K were observed during passage with MK-2048, P145S was observed during passage with EVG, R263K was observed during passage with DTG, and the V75I/E138K/G140S/Q148H/M154I combination was observed during passage of Q148H virus with DTG. Under the conditions used in these experiments the signal with [3H]RAL and [3H]EVG was not sufficient to determine koff
for some of the IN substitutions.
Prolonged binding (t1/2>1 h) was observed for DTG with all of the combinations of IN substitutions derived from the ING112961 study genotypes (Table 30), except for proteins with the combinations of E92Q/G140S/Q148H (t1/2 = 0.4 – 0.6 h) and G140S/Q148H/N155H (t1/2 = 0.3 – 0.5 h).

CONFIDENTIALModule 2.7.2.4 Special Studies
40
Table 30 Dissociation of INIs from IN-DNA Complexes at 37C: IN Substitutions Observed during VIKING
INk . (s-1)a (x10-6) t 1/2 (h)b
DTG RAL EVG DTG RAL EVG
T97A/Y143R/N155H 84 10 ND ND 2.3 0.1 ND
L74M/T97A/Y143R 20 2 760 50 280 40 9.6 0.3 0.7
L74M/T97A/Y143R/N155H 80 11 ND ND 2.4 ND ND
L74M/T97A/E138A/Y143R/N155H 89 16 2619
2550 620 2.2 0.1 0.1
L74M/G140S/Q148H 58 6 1430 350 ND 3.3 0.1 ND
L74M/E138A/G140S/Q148H 81 15 2482 ND 2.4 0.1 ND
L74M/T97A/G140S/Q148H 170 50 2275 ND 1.1 0.1 ND
G140S/Y143H/Q148H 50 9 ND ND 3.9 ND ND
E92Q/G140S/Q148H 300 40 ND ND 0.6 ND ND
E92Q/E138T/G140S/Q148H 450 50 ND ND 0.4 ND ND
E138K/G140S/Q148H 64 11 1140 300 ND 3.0 0.2 ND
G140S/Q148H/N155H 380 8 ND ND 0.5 ND ND
E138K/G140S/Q148H/N155H
560 20 ND ND 0.3 ND ND
a. koff values represent mean and SD for 3 to 7 independent experiments except where noted with * (“n = 1 or 2). ND denotes not determined due to low signal with [3H]EVG
b. For reference, t1/2 values for DTG, RAL, and EVG with a wild type IN-DNA complex with IN protein from BH10 virus are 71 h, 8.8 h, and 2.7 h, respectively..
The addition of multiple RAL secondary substitutions to IN with Q148H generally resulted in faster DTG dissociation. Dissociative half-lives of 2.1 h and 1.0 h were obtained for DTG with IN-DNA complexes containing the E138K/G140S/Q148H/M154I and V75I/E138K/G140S/Q148H/M154I substitution, respectively. The dissociative half-life for DTG was greater than 10 h (10.3 to 15.5 h) for IN-DNA complexes containing the IN substitutions from DTG passage studies G118R, G118R/E138K, P145S, or R263K Table 31).

CONFIDENTIALModule 2.7.2.4 Special Studies
41
Table 31 Dissociation of INIs from IN-DNA Complexes at 37C: IN Substitutions Observed during Passage Studies
INk . (s-1)a (x10-6) t 1/2 (h)b
DTG RAL EVG DTG RAL EVG
E138K/G140S/Q148H/M154I 90 17 1630 60 ND 2.1 0.1 ND
V75I/E138K/G140S/Q148H/M154I 200 40 ND
ND 1.0 ND ND
G118R 18 1 71 12 215 11 10.7 2.7 0.9
G118R/E138K 19 1 61 3 168 6 10.1 3.2 1.1
P145S 11.1 0.5 57 4 ND 17.3 3.4 ND
WT (B) 7.5 0.4 40 1 88 3 25.7 4.8 2.2
WT(C) 5 0.1 23 1 73 3 38.5 8.4 2.6
R263K(B) 12.4 0.4 52 2 164 8 15.5 3.7 1.2
R263K(C) 8.6 1.1 31 1 ND 22.4 6.2 NDa. koff values represent mean and SD for 3 to 7 independent experiments except where noted with * (“n = 1 or 2).
ND denotes not determined due to low signal with [3H]EVGb. For reference, t1/2 values for DTG, RAL, and EVG with a wild type IN-DNA complex with IN protein from BH10
virus are 71 h, 8.8 h, and 2.7 h, respectively.
4.1.14. Minority Species Analysis from Antiretroviral Therapy, Raltegravir Resistant Experienced Adults in Phase 2b Study ING112961
Plasma samples from subjects representing an array of raltegravir therapy (days on RAL and days off RAL) were selected for ultradeep pyrosequencing (UDPS) at both Screen and Day 1 of ING112961 and are summarized in Table 32 (m5.3.5.4, 2012N151522_00). A total of 40 viruses (16 Screen, 24 Day 1) were analyzed by UDPS. Not all subjects analyzed by UDPS were enrolled in ING112961 (i.e, Screen). Included in Table 32 are the visit type, HIV RNA levels, the length of time (days) the subject had taken raltegravir, as one component of antiretroviral therapy, the length of time (days) that the subject was off of raltegravir before initiating DTG therapy, and a summary of UDPS results. Also, shown in Table 32 the unique mutations/substitutions detected by UDPS but not detected by population genotyping.

CONFIDENTIALModule 2.7.2.4 Special Studies
42
Table 32 UDPS Summary INI-Associated Resistance Mutations Detected in Screen or Day 1 virus but Not Detected by Population Genotyping
SubjectVisit Type
Viral RNA
Time On RAL
Time Off RAL
Screen/Day1 Population GenotypingINI-Associated Resistance Mutations
Screen/Day1 UDPS Summary INI-Associated Resistance Mutations not Detected by Population Genotyping (Frequency 1%)
1110. Screen 35361 333 146 none none1140 Screen 41467 29 351 none none1150 Screen 7765 177 688 none none1130b. Day 1 1781 700 0 G140S, Q148H none
1141 Day 1 26776 827 0L74L/M/I, E138D, V151V/I, N155H,
G163R
L74M (10.07%), V151I (21.02%)
1171 Day 1 815
674 0 G140S, Q148H none
1610 Day 1 48736 1176 0 V151I, N155H none
1611 Day 1 13350 802 0L74M, E92A,
Y143Rnone
1612 Day 1 52935 816 287 L74I, T97A, Y143R none
1621 Day 1 57497 1254 0L74M, T97A,
E138A, Y143Rnone
1622 Day 1 7385 810 20L74L/M, T97A, E138K/T/Q/P,
Y143Rnone
1630 Day 1 7434 944 0L74I, G140S,
Q148Hnone
1640 Day 1 173080 103 0L74M, T97A,
Y143Rnone
1662 Day 1 5587 1078 169 E92QN155H (22.30%), T97A (1.76%), G193E (2.38%)
1680 Day 1 240221 743 0G140S, Y143H,
Q148HL74I (2.63%), L74M
(1.0%), E138A (6.32%)1681 Day 1 9771 754 0 G140S, Q148H none
1703 Day 1 10255 731 71E138A, G140S, Y143H, Q148H
none
1811 Day 1 45907 1078 96 noneG140S (4.52%),
Q148 (4.4%)2000c. Screen 42263 1178 0 NAa. E92Q (8.28%)2100 Screen 234337 762 41 NA none2101 Screen 2971 728 67 G163E G163K (23.78%)
2102 Screen 2261 1076 0 noneT97A (1.76%), N155H
(33.24%), G193E (2.38%)2103 Screen 16278 147 579 none T97A (7.29%),

CONFIDENTIALModule 2.7.2.4 Special Studies
43
SubjectVisit Type
Viral RNA
Time On RAL
Time Off RAL
Screen/Day1 Population GenotypingINI-Associated Resistance Mutations
Screen/Day1 UDPS Summary INI-Associated Resistance Mutations not Detected by Population Genotyping (Frequency 1%)
2104 Screen 160576 818 55 none none2122 Screen 14151 363 572 NA none2201 Screen 75422 174 103 none none
2202 Day 1 18621 1901 0E138E/K, G140G/S,
Q148Q/Hnone
2310 Day 1 68652 1174 0 G140S, Q148H none
2340 Day 1 60256 1505 0T97A, V151I,
N155Hnone
2360 Screen 1291 490 561 none L74I (15.22%)2369 Screen 4508 984 287 none none
2410 Day 1 12841 836 0L74L/M, E138E/K,
Y143RL74M (2.56%), Q148R (3.60%), T97A (56.6%)
2415 Day 1 147851 941 312L74L/M, T97T/A,
Y143Y/Cnone
2430 Day 1 28875 310 664 E138A, Q148H E138T (3.98%)
2432 Day 1 51505 NA NAG140S,
Y143Y/H/R/C, Q148H
G163R (2.47%)
2460 Day 1 12378 316 0 G140S, Q148H none2461 Screen 210935 930 0 E138E/D, V151I G193E (1.11%)2462 Day 1 16306 868 0 G140S, Q148H none2464 Screen 16522 1123 0 none none2480 Screen 75938 247 3 L74M, E92Q, T97A nonea. NA- Data not availableb. Subjects enrolled in Cohort I are Day 1 and numbered in the 1000 range c. Subjects enrolled in Cohort II are Day 1 and numbered in the 2000 range
Clonal analyses were performed on virus from subjects experiencing virologic failure by week 24 at both the Day 1 and protocol defined virologic failure (PDVF) time points. A summary of the results for detection and frequency of INI-associated resistance mutations seen by clonal analyses but not by population genotyping are shown in Table 33.

CONFIDENTIALModule 2.7.2.4 Special Studies
44
Table 33 Summary of INI-Associated Resistance Mutations Detected and Frequency at Day 1 and VF by Clonal Analyses but Not by Population Genotyping
SubjectIN
Mutational Group
Virologic Failure
Visit
INI-Associated Resistance MutationsDay 1
PopulationDay 1 Additional
Mutations detected by
Clonala
VF Population VF Additional Mutations
detected by Clonala
1680d Mixture Day 11 G140S, Y143H, Q148H
L74M (3.2%) L74I (2.4%)
E138A (96.8%)
L74I/M, T124Ab, E138E/A, G140S,
Q148H
Y143H (17.2%)
1630 Q148+2 Day 11 L74I, G140S, Q148H
T97A (0.8%) L74I, T124A, G140S, Q148H
NAc
1624 Q148+2 Day 11 E138K/T, G140S, Q148H
T97A (27.4%), Y143C (0.5%),
E138K, G140S, Q148H
T97A (2.0%)
1625 Q148+2 Day 11 L74I, G140S, Q148R,G163R
T66I (3.9%), T97A (0.7%)
L74I , G140S, Q148R, G163R
Nonef.
1681 Q148+1 Day 11 G140S,Q148H T97A (0.7%) G140S, Q148H None1703 Mixture Day 11 E138A,G140S,
Y143H, Q148HR263K (0.5%) E138A, G140S,
Y143H, Q148HG193E (0.6%)
1811 Other Week 8 None T97A (0.6%), G140S (1.8%), Y143H (0.6%), Q148H (1.8%)
L74L/M/I, T97A, G140S, Q148H
N155H (5.4%)
1610 N155 Week 12 V151I, N155H T97A (0.4%), G193E (0.4%)
V151V/I, N155H Y143H (0.9%)
1623 Y143 Week 12 L74I, T97T/A, E138E/K.Y143R
T66A (0.6%), L74V (4.0%),
E138A (65.2%).
L74I, T97A, E138K, Y143R
NA
1700 Y143 Week 16 L74L/M, Y143R E138K (1.2%) Y143R T97A (0.5%)
1621 Y143 Week 24 L74M, T97A, E138A, Y143R
G140S (0.3%), Q148H (0.3%)
L74M, T97A, E138A, Y143R,
N155H
Y143C (0.9%)
1640 Y143 Week 24 L74M, T97A, Y143R
Y143C (0.7%) L74M, T97A, Y143R, N155H
None
2310e Q148+1 Week 16 G140S, Q148H None T97T/A,E138E/K, G140S, Q148H,
N155H
T66A (0.8%)
2340 N155H Day 11 T97A, V151I, N155H
None T97A, V151I, N155H
NA
2462 Q148+1 Week 8 G140S, Q148H None E92E/V, E138E/K, G140S, Q148H,
N155H
None
a. INI-associated resistance mutations not detected by population genotyping (frequency)b. T124A is a well characterized polymorphism that has no impact on integrase resistancec. NA – Amplicon could not be generatedd. Subjects enrolled in Cohort I are numbered in the 1000 rangee. Subjects enrolled in Cohort II are numbered in the 2000 rangef. None- no mutations detected

CONFIDENTIALModule 2.7.2.4 Special Studies
45
Clonal analyses afford, in addition to the frequency of mutations, the frequency of primary and/or secondary INI- associated mutations residing on a subset of genomes. Table 34 represents the frequency of primary and/or secondary mutations residing on the most prevalent subset of genomes within a specified virus population. Clonal analyses have shown that the INI-associated resistance mutations detected by population genotyping accumulate and reside on a subset of genomes.
Table 34 Prevalent Frequencies of INI-Associated Resistance Mutations Residing on a Subset of Viral Genomes for Day 1 and VF Timepoints as Determined by Clonal Analyses
SubjectIN Mutational Group
Virologic Failure Visit
Prevalent Frequency of INI-Associated Resistance Mutations
Day 1 VF
1680c Mixture Day 11 E138A, G140S, Y143H, Q148H (91.2%)
L74I, E138A, G140S, Q148H (51.7%)
1630 Q148+2 Day 11 L74I, G140S, Q148H (98.3%) NDb
1624 Q148+2 Day 11 E138K, G140S, Q148H (34.1%); none (31.3%); T97A (25.4%)
E138K, G140S, Q148H (93.1%)
1625 Q148+2 Day 11 L74I, G140S, Q148R, G163R (95.4%)
L74I, G140S, Q148R, G163R (98.9%)
1681 Q148+1 Day 11 G140S, Q148H (97.3%) G140S, Q148H (100%)1703 Mixture Day 11 E138A, G140S, Y143H,
Q148H (97.4%)E138A, G140S, Y143H, Q148H (97.7%)
1811 Other Week 8 G140S, Q148H (1.8%); nonea
(97.0%)T97A, G140S, Q148H (92.4%)
1610 N155 Week 12 V151I, N155H (84.1%) V151I, N155H (45.5%); N155H (99.1%)1623 Y143 Week 12 L74I, T97A, E138A, Y143R
(61.1%); L74I, T97A, E138K, Y143R (33.7%)
ND
1700 Y143 Week 16 Y143R (98.2%) Y143 (100% )1621 Y143 Week 24 L74M, T97A, E138A, Y143R
(97.7%)L74M, T97A, Y143R, N155H (94.4 %)
1640 Y143 Week 24 L74M, T97A, Y143R (89.3%) L74M, T97A, Y143R, N155H (100%)2310d Q148+1 Week 16 G140S, Q148H (98.6%) G140S, Q148H, N155H (100%)2340 N155H Day 11 T97A, V151I, N155H (95.5%) ND2430 Q148+2 Week 8 E138A, G140S, Q148H
(92.6%); E138T, G140S, Q148H (6.0%); E138K, G140S, Q148H (0.9%)
E92E, T97A, E138T, G140S, Q148H (55.4%), E92Q, T97T, E138T, G140S, Q148H (41.4%), E92Q, T97A, E138T, G140S, Q148H (1.3%)
2462 Q148+1 Week 8 G140S, Q148H (97.9%) G140S, Q148H, N155H (99.4%)a. None- wild-type, no INI-associated mutations detectedb. ND-analysis not performed due to inability to obtain ampliconc. Subjects enrolled in Cohort Id. Subjects enrolled in Cohort II
Genetic analyses of subjects with PDVF could not identify any de novo mutations within the viral integrase gene that are associated with resistance to DTG. UDPS identified additional INI-associated resistance mutations in minority quasispecies at screen or Day 1 in 10% of samples tested. Clonal analyses on paired Day 1 and PDVF virus provided

CONFIDENTIALModule 2.7.2.4 Special Studies
46
additional information that the INI-associated resistance mutation that emerged at PDVF were added to pre-existing Day 1 INI associated resistance mutation profiles and that this accumulation of INI-associated resistance mutations results in the reduction of DTG susceptibility.
4.1.15. Integrase Polymorphism Effects on DTG Resistance and Clinical Response
A total of 2997 IN sequences were identified and aligned from integrase inhibitor naive sequences obtained from LANL and SRD. The major genomic subtypes represented in this data set included B (55%), CRF02_AG (13%), C (13%), and CRF01_AE (6%). The analysis revealed a high degree of conservation across the 288 amino acid residues. The majority of positions (59% were found to vary by <1 % at the amino acid level (ie. >99% conservation). These highly conserved positions spanned long regions across the IN protein. However a total of 34 positions met the criteria for a polymorphic site (>10% amino acid diversity) and were found to be distributed across IN (Vavro, 2012).
To characterize any impact on DTG susceptibility of polymorphisms seen in the integrase enzyme, a panel of site-directed molecular clones (SDMs) was constructed from pNL-432 with single, double, and triple mutants (Vavro, 2012). This panel comprised IN substitutions identified during in vitro passage with DTG as well as IN polymorphic sites. Baseline viruses from a study in INI naive, HIV-infected patients were evaluated for DTG and RAL susceptibility and differences in HIV-1 RNA decline with DTG monotherapy were evaluated. Fold change susceptibility to DTG and RAL was measured using HeLa CD4 cells.
The SDMs with polymorphic amino acid changes T124A and L101I had DTG FC values below the assay cutoff for reduced susceptibility. Fold change for SDMs ranged from 0.91 for the L101I/T124A double substitution to 2.5 for the non-polymorphic substitution S153Y, which arose during in vitro passage of DTG (Table 35). The mean FC for L101I was 1.4 for DTG and 1.2 for RAL, each of which is within the assay’s variability. The addition of polymorphisms L101I and T124A to the S153F mutation had FC within the assay’s variability of 2. DTG trough concentrations are 19-fold above the protein-adjusted inhibitory concentration at 90% (IC90) of 152 nM that was observed at the once-daily, 50 mg dose; this is well above the maximum FC for all SDMs tested in this study.

CONFIDENTIALModule 2.7.2.4 Special Studies
47
Table 35 In vitro drug susceptibilitya for site-directed mutants with polymorphisms and substitutions observed during DTG passage
Amino acid substitution in NL-432
Where observed DTG FC, mean RAL FC, mean
L101I Polymorphism/Passage 1.40 1.20T124A Polymorphism/Passage 0.95 0.82L101I/T124A Polymorphism 0.91 0.77S153F Passage 1.60 1.30S153Y Passage 2.50 1.30L101I/S153F Polymorphism/Passage 2.00 1.30L101I/T124A/S153F Polymorphism/Passage 1.90 1.40E92Q Passage 1.60 3.50G193E Passage 1.30 1.30a. Assay variability of 2-fold changes

CONFIDENTIALModule 2.7.2.4 Special Studies
48
In the phase IIa dose-ranging study of DTG monotherapy, HIV-infected subjects were randomized to receive DTG (2, 10, or 15 mg) as a monotherapy or placebo every 24 hours for 10 days (Min, 2011). IN genotypes and phenotypes were determined at Day 1 by Monogram Biosciences. Differences in the group median FC were calculated for DTG and RAL at sites 101 and 124 (Table 36). All 101 and 124 genotypes had similar IC50 values and overlapping variance ranges for DTG and RAL. The average FC to DTG was 0.79, and the average FC to RAL was 0.89. No polymorphism showed an average shift in susceptibility >2-fold to either DTG or RAS, and no median FC observed was greater than the FC assay variability.
Table 36 Fold Change Response to DTG and RAL for Day 1 Isolate Samples (N = 36) with variation at amino acids 101 and 124
Site DTG FCMedian (range)
RAL FCMedian (range)101 124 Subjects, n
L101L T124T 6 0.64 (0.47 – 0.89) 0.72 (0.5 – 0.95)L101L T124A 5 0.97 (0.63 – 1.17) 0.91 (0.58 – 1.05)L101L T124N 7 0.78 (0.66 – 0.82) 0.92 (0.83 – 1.41)L101L T124S 2 0.825 (0.79 – 0.86) 0.965 (0.96 – 0.97)L101L T124T/N 1 0.89 0.82L101L T124T/N/D/A 1 0.89 1.15L101I T124T 5 0.79 (0.72 – 0.88) 0.86 (0.84 – 1.16)L101I T124A 3 0.81 (0.78 – 0.89) 0.79 (0.76 – 0.97)L101I T124N 3 0.85 (0.46 – 0.86) 0.97 (0.89 – 0.98)L101I T124S 1 0.74 0.64L101I T124T/N 1 0.8 1.16
Two additional analyses for the phase IIa dose-ranging study evaluated polymorphism effects. Dose-adjusted differences in viral load response at Day 11 were compared across the 34 polymorphic positions. The residuals (ie, differences in change from baseline in log10 HIV-1 RNA at day 11 after adjusting for the effect of dose in a linear model) at positions of polymorphic substitutions were consistent with random variation about a mean of zero and a small variance (<0.3 log10 c/mL). This indicated no apparent difference in viral load decline with any polymorphism. In addition, the effect of substitutions at each position was tested using a multivariate linear model that adjusted for dose and the presence or absence of substitutions at each position. The distribution of P values ranged from 0.035 to 0.99, a pattern consistent with no position examined having an effect on day 11 response to DTG.
Baseline clinical samples taken from participants in the phase IIa study showed no differences in HIV-1 RNA decline with any polymorphism, including those involving sites 101 and 124.
4.2. Clinical Virology
Treatment-naive (ING112276, ING113086, ING114467): No virologic resistance was observed on DTG (50mg once daily)-containing regimens in the treatment-naive

CONFIDENTIALModule 2.7.2.4 Special Studies
49
population to either integrase or the background regimen (NRTI), whereas virologic resistance to the 3rd agent (RAL or EFV) and/or the background regimen (NRTI) has been observed on the comparator arms.
Treatment-experienced, INI-naive (ING111762): Results from this Week 24 interim analysis show DTG has a higher barrier to resistance in this patient population. Astatistically significant difference in favour of DTG was demonstrated by planned virologic analyses for emergent integrase resistance. In a pre-specified analysis, there was a statistically significant difference in favor of DTG for the proportion of mITT-E subjects harboring virus with evidence of INI Resistance by Week 24 (DTG: 2/354 (0.6%); RAL: 10/361(2.8%); p=0.016). An additional prespecified analysis using a common FC cutoff to determine phenotypic resistance to RAL and DTG also confirmed a statistically significant difference in favour of DTG.
Of the PDVF subjects with matched baseline and PDVF resistance testing there were 2/9 (22%) in the DTG arm and 9/27 (33%) in the RAL arm with emergent integrase genotypic and/or phenotypic resistance. The observed mutations in the RAL arm were clinically relevant INI resistance mutations commonly observed during RAL therapy and included the primary resistance mutations at Y143, Q148, and N155 and associated secondary mutations. In the DTG arm no primary or secondary resistance mutations commonly selected during RAL therapy emerged. In both cases of emergent resistance in the DTG arm the IN substitution observed were at position R263.
Treatment-experienced, INI-resistant (ING112961, ING112574): DTG is efficacious (sustained viral load suppression) in patients with current or historic integrase mutations and DTG FC in INI-resistant population (ING112574). ING112574 enrolled sufficient range and diversity with respect to DTG FC and IN resistance patterns (respectively) allowing for an appropriate evaluation of DTG in the HIV-1 INI-resistant population. At Baseline, the viral population of enrolled subjects showed minimal cross-resistance between RAL and DTG: median FC to RAL was: 47.5 [0.49, 127.0], (n=176) and median FC to DTG was: 1.29 [0.45, 37.0], (n=176). Eight percent (15/183) of subjects had DTG FC >10 and 28% (53/183) had Q148+ additional mutations which is consistent with the INI-resistant viruses in the general HIV population (4.1.12.3.2). Good short term and long term responses to DTG were seen in subjects harbouring 143/155/66 historic integrase mutations; lower responses were observed in 148 pathways. Secondary IN mutations influenced response in 148 pathway but not in 143/155/66 pathway. Including all subjects (N=111) with data at Day 1 and Day 8, treatment emergent IN resistance was detected in few subjects (12%) under functional monotherapy; the only mutations that were identified have been previously described for the integrase class. From the 35 subjects with PDVF in the ITT-E population (N=183), 31 subjects had paired Baseline and time of virological failure samples. Of these, 15/31 had treatment-emergent mutations detected at virological failure. Treatment-emergent resistance was detected in virus harbouring a mutation at Q148 (at Baseline or historic) for 13/15 (87%) subjects.
Increasing Baseline DTG FC was significantly associated with decreasing antiviral activity, however, no precise phenotypic FC cut-off could be defined to effectively predict antiviral activity at both Day 8 and Week 24. For genotypic resistance groups, three baseline groups (No Q148, Q148+1, and Q148+2) were identified based on their

CONFIDENTIALModule 2.7.2.4 Special Studies
50
differential impact on DTG antiviral response. The best antiviral responses were seen in the No Q148 group. The derived genotypic groups provide a robust and predictive genotypic guidance for response in this INI resistant population.
4.2.1. Phase III Clinical Studies
4.2.1.1. Studies of Treatment-Naive Subjects
Of the 825 treatment-naive subjects in ING113086 and ING114467 randomized to receive DTG 50 mg once daily, 38 had PDVF. None of these subjects had treatment emergent INI or NRTI primary resistance mutations through 48 Weeks of treatment, whereas subjects receiving comparator drugs (RAL or Atripla) were noted to have NRTI, INI and/or NNRTI resistance.
4.2.1.1.1. ING113086
Study Title: A Phase III, randomized, double blind study of the safety and efficacy of GSK1349572 50mg once daily compared to raltegravir 400mg twice daily both administered with fixed-dose dual nucleoside reverse transcriptase inhibitor therapy over 96 weeks in HIV-1 infected antiretroviral naive adult subjects.
Location of Report: 5.3.5.1
Study Design: ING113086 is a Phase III randomized, double-blind, double dummy, active-controlled, multicenter, parallel group, fully-powered non-inferiority study. Subjects were randomized to DTG 50 mg once daily or 400 mg RAL twice daily, both in combination with either abacavir/lamivudine (ABC/3TC), or tenofovir/emtricitabine (TDF/FTC). Protocol defined virologic failure (PDVF) required two consecutive HIV-1 RNA values 50 c/mL HIV-1 RNA on or after Week 24. At the Week 96 visit, subjects randomized to RAL are discontinued from the study, while subjects randomized to DTG are given the opportunity to remain on the study while receiving DTG 50 mg once daily during the Open-label Phase of the study.
Viral genotyping and phenotyping study population
High response rates in study ING113086 were observed despite the application of a strict PDVF criterion – namely, two consecutive HIV-1 RNA values 50c/mL HIV-1 RNA on or after Week 24, which mandated withdrawal from the trial (if confirmed before Week 48) and testing for resistance. The majority of subjects who met PDVF in study ING113086 had low-level viremia: 75% of subjects in both arms with PDVF failed with <200 c/mL HIV-1 RNA (Table 37). All 20 subjects with PDVF on DTG had <1000 c/mL HIV-1 RNA at confirmed failure, while 3 (11%) of subjects with PDVF on RAL had >10,000 c/mL HIV-1 RNA at the time of confirmed failure (Table 37).
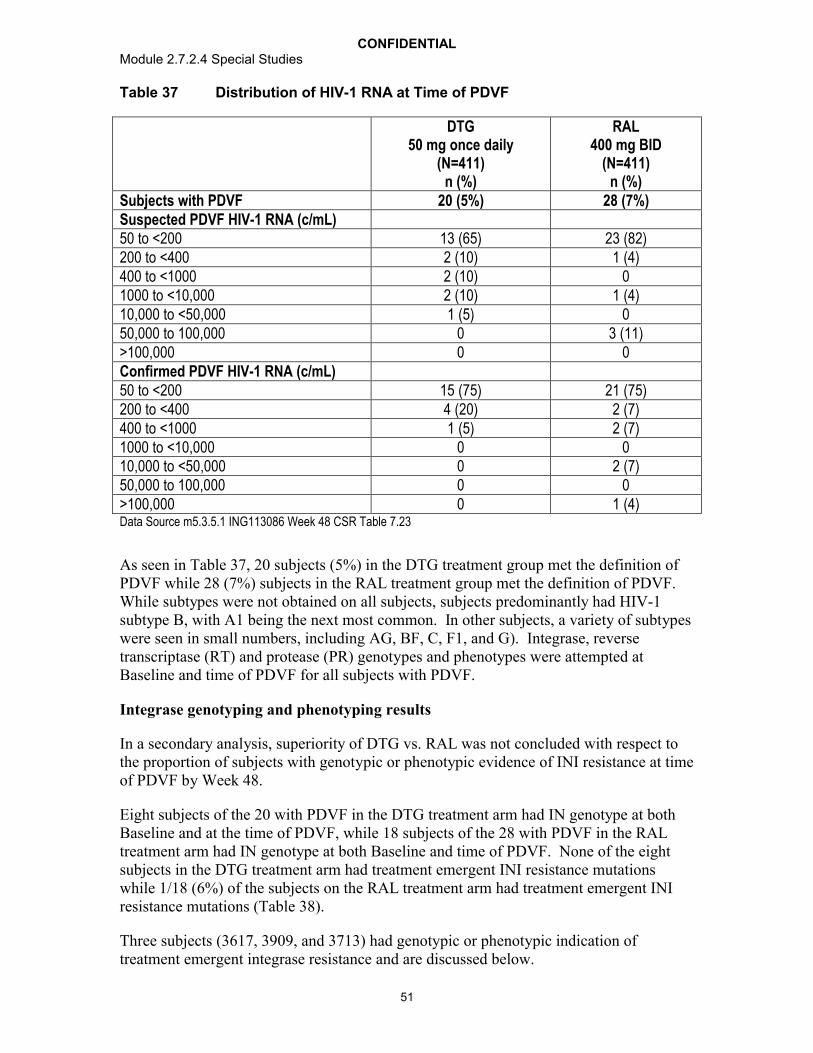
CONFIDENTIALModule 2.7.2.4 Special Studies
51
Table 37 Distribution of HIV-1 RNA at Time of PDVF
DTG50 mg once daily
(N=411)n (%)
RAL400 mg BID
(N=411)n (%)
Subjects with PDVF 20 (5%) 28 (7%)Suspected PDVF HIV-1 RNA (c/mL)50 to <200 13 (65) 23 (82)200 to <400 2 (10) 1 (4)400 to <1000 2 (10) 01000 to <10,000 2 (10) 1 (4)10,000 to <50,000 1 (5) 050,000 to 100,000 0 3 (11)>100,000 0 0Confirmed PDVF HIV-1 RNA (c/mL)50 to <200 15 (75) 21 (75)200 to <400 4 (20) 2 (7)400 to <1000 1 (5) 2 (7)1000 to <10,000 0 010,000 to <50,000 0 2 (7)50,000 to 100,000 0 0>100,000 0 1 (4)Data Source m5.3.5.1 ING113086 Week 48 CSR Table 7.23
As seen in Table 37, 20 subjects (5%) in the DTG treatment group met the definition of PDVF while 28 (7%) subjects in the RAL treatment group met the definition of PDVF. While subtypes were not obtained on all subjects, subjects predominantly had HIV-1 subtype B, with A1 being the next most common. In other subjects, a variety of subtypes were seen in small numbers, including AG, BF, C, F1, and G). Integrase, reversetranscriptase (RT) and protease (PR) genotypes and phenotypes were attempted at Baseline and time of PDVF for all subjects with PDVF.
Integrase genotyping and phenotyping results
In a secondary analysis, superiority of DTG vs. RAL was not concluded with respect to the proportion of subjects with genotypic or phenotypic evidence of INI resistance at time of PDVF by Week 48.
Eight subjects of the 20 with PDVF in the DTG treatment arm had IN genotype at both Baseline and at the time of PDVF, while 18 subjects of the 28 with PDVF in the RAL treatment arm had IN genotype at both Baseline and time of PDVF. None of the eight subjects in the DTG treatment arm had treatment emergent INI resistance mutations while 1/18 (6%) of the subjects on the RAL treatment arm had treatment emergent INI resistance mutations (Table 38).
Three subjects (3617, 3909, and 3713) had genotypic or phenotypic indication of treatment emergent integrase resistance and are discussed below.
CONFIDENTIALModule 2.7.2.4 Special Studies
52
Subject 3617 was randomized to the RAL treatment group and received TDF/FTC as the nucleoside backbone. This subject had 3,346,333 c/mL HIV-1 RNA at Baseline, reached a nadir of 11,959 c/mL HIV-1 RNA at Week 2, and increased to 88,126 c/mL HIV-1 RNA at Week 24.
Of note in Subject 3617:
Treatment emergent INI resistance mutations at Week 24 were T97T/A, E138E/D, V151V/I, and N155H.
Week 24 virus had a 34 fold change (FC) to RAL and 2.02 FC to DTG, as compared to 1.15 FC to RAL and 1.48 FC to DTG at Baseline.
Week 24 virus also had treatment emergent NRTI mutations A62A/V, K65K/R, K70K/E, and M184V with accompanying 1.44 FC to TDF and MAX FC to FTC.
Two additional subjects (3909 and 3713) had treatment emergent elevated FC to RAL (Table 38). Subject 3909, who was randomized to the DTG group and received TDF/FTC, had 2.01 FC to RAL (0.96 FC to DTG) at PDVF (Week 32). As there were no treatment emergent INI resistance mutations at Week 32, all IN substitutions at Baseline and Week 32 were compared.
Of note in Subject 3909:
Baseline virus had IN substitutions K14R, V32I, E48E/K, V72I, Y99F, L101I, V113I, S119P, T122I, T124A, T125A, G134N, K136T, K188R, V201I, T206S, Y227F, S255N, D256E, and S283G.
IN substitutions at Week 32 were identical to those observed at Baseline with the exception that E48K was a full substitution at Week 32.
Subject 3713, who received RAL and TDF/FTC as the nucleoside backbone, had 1.62 FC to RAL (1.40 FC to DTG) at PDVF (Week 24). As there were no treatment emergent INI resistance mutations at Week 24, all IN substitutions at Baseline and Week 24 were compared.
Of note in Subject 3713:
Baseline virus had IN substitutions E11E/D, V31I, V72I, L101I, V113I, V201I, T206S, K215T, Q216Q/K, T218I, I220L, V234L, and D256E.
IN substitutions at Week 24 were identical to those observed at Baseline with the exceptions that E11D was a full substitution at Week 24 and Q216 was fully Q at Week 24.

CONFIDENTIALModule 2.7.2.4 Special Studies
53
Table 38 Treatment Emergent Phenotypic or Genotypic Evidence of Integrase Inhibitor Resistance
Subjects with PDVFDTGN=20
RALN=28
IN Genotypic Results at Baseline and PDVF N=8 N=18INI resistance mutations 0 1/18 (6%)a
Phenotypic evidence of INI resistanceSubject 3617 RAL FC = 34a
Subject 3909 RAL FC = 2.01Subject 3713 RAL FC = 1.62
a. T97T/A, E138E/D, V151V/I, N155HData Source: ING113086 Week 48 CSR Table 7.10, Listing 44
Reverse transcriptase genotyping and phenotyping results
Twelve of the 20 subjects with PDVF in the DTG treatment group had PR/RT genotype at both Baseline and time of PDVF, while 19 of the 28 with PDVF in the RAL treatment group had PR/RT genotype at both Baseline and time of PDVF (Table 39). None of the twelve subjects with Baseline and PDVF RT and PR genotypic data in the DTG treatment arm had treatment emergent NRTI resistance mutations while 4/19 (21%) of the subjects on the RAL treatment arm had treatment emergent NRTI resistance mutations (Table 39). In addition to Subject 3617 (NRTI treatment emergent mutations A62A/V, K65K/R, K70K/E, and M184V) described above, subjects 3173, 3294, and 4424 had treatment emergent NRTI resistance mutations at PDVF.
Subject 3173, who was in the RAL treatment group and received TDF/FTC as the NRTI backbone, had treatment emergent mutation M184M/I at PDVF (Week 24) with no accompanying phenotypic change to TDF or FTC.
Subject 3294, who was randomized to RAL and received TDF/FTC as the NRTI backbone, had treatment emergent mutation A62A/V at PDVF (Week 24) with no phenotypic change to TDF or FTC.
Subject 4424, who was randomized to RAL and received ABC/3TC as the NRTI backbone, had treatment emergent mutation M184M/V with 2.56 FC to ABC and MAX FC to 3TC.
Table 39 Treatment Emergent Genotypic Evidence of NRTI Resistance
Subjects with PDVFDTGN=20
RALN=28
RT/PR Genotype Results at BL and PDVF 12 19Subjects with NRTI resistance mutations 0 4/19 (21%)
Genotypic Evidence of NRTI resistance3617 A62A/V, K65K/R, K70K/E, M184V3173 M184M/I3294 A62A/V4424 M184M/V
Data Source: ING113086 Week 48 CSR Table 7.22, Listing 43

CONFIDENTIALModule 2.7.2.4 Special Studies
54
If subjects with PDVF with <400 c/mL HIV-1 RNA are censored from this analysis, there were only 5 subjects with PDVF in the DTG treatment group, none of whom had any treatment emergent resistance mutations, and only 4 subjects with PDVF in the RALtreatment group, including the one subject with RAL resistance mutations T97T/A, E138E/D, V151V/I, and N155H and NRTI resistance mutations A62A/V, K65K/R, K70K/E, and M184V.
4.2.1.1.2. ING114467
Study Title: A Phase III, randomized, double-blind study of the safety and efficacy of DTG plus abacavir-lamivudine fixed-dose combination therapy administered once daily compared to Atripla over 96 weeks in HIV-1 infected antiretroviral therapy naive adult subjects
Location of Report: 5.3.5.1
Study Design: ING114467 is a Phase 3 randomized, stratified, double-blind, double-placebo, active-controlled, multicentre, parallel group, fully-powered non-inferiority study. Subjects were randomized 1:1 to receive DTG 50 mg plus ABC/3TC FDC therapy once daily or Atripla once daily. Subjects were stratified by screening HIV-1 RNA and CD4 cell count. PDVF required two consecutive HIV-1 RNA values 50 c/mL HIV-1 RNA on or after Week 24. The primary analysis took place after the last subject completed 48 weeks on therapy; an additional analysis will be conducted after the last subject completes Week 96 and Week 144 on study.
Viral Genotyping and Phenotyping Study Population
High response rates were observed despite the application of a strict PDVF criterion –namely, two consecutive HIV-1 RNA values 50 c/mL HIV-1 RNA on or after Week 24, which mandated withdrawal from the trial (if confirmed before Week 48) and testing for resistance. The majority of subjects who met PDVF in study ING114467 had low-level viremia (23/35, or 66% of subjects in both treatment groups with PDVF failed with <200 c/mL HIV-1 RNA). At confirmed failure 16/18 (89%) subjects with PDVF on DTG + ABC/3TC had <200 c/mL HIV-1 RNA, while 11/17 (65%) of subjects with PDVF on Atripla had <200 c/mL HIV-1 RNA (Table 40).
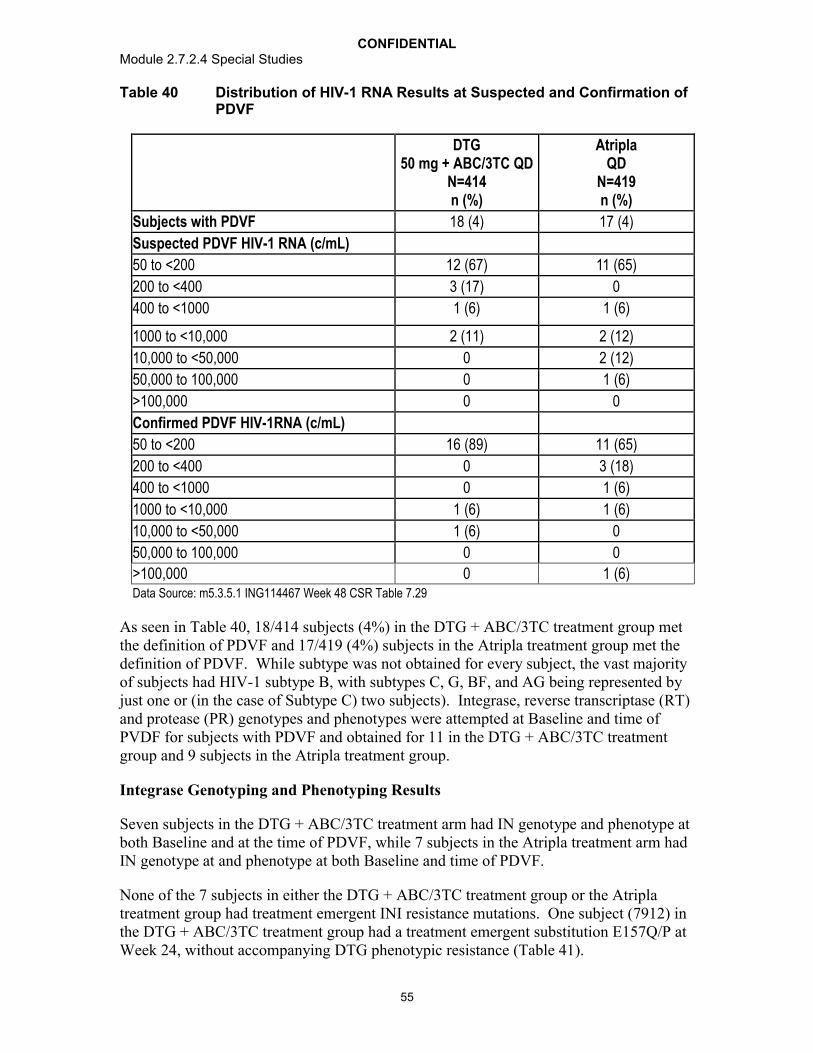
CONFIDENTIALModule 2.7.2.4 Special Studies
55
Table 40 Distribution of HIV-1 RNA Results at Suspected and Confirmation of PDVF
DTG50 mg + ABC/3TC QD
N=414n (%)
AtriplaQD
N=419n (%)
Subjects with PDVF 18 (4) 17 (4)
Suspected PDVF HIV-1 RNA (c/mL)
50 to <200 12 (67) 11 (65)
200 to <400 3 (17) 0
400 to <1000 1 (6) 1 (6)
1000 to <10,000 2 (11) 2 (12)
10,000 to <50,000 0 2 (12)
50,000 to 100,000 0 1 (6)
>100,000 0 0
Confirmed PDVF HIV-1RNA (c/mL)
50 to <200 16 (89) 11 (65)
200 to <400 0 3 (18)
400 to <1000 0 1 (6)
1000 to <10,000 1 (6) 1 (6)
10,000 to <50,000 1 (6) 0
50,000 to 100,000 0 0
>100,000 0 1 (6)Data Source: m5.3.5.1 ING114467 Week 48 CSR Table 7.29
As seen in Table 40, 18/414 subjects (4%) in the DTG + ABC/3TC treatment group met the definition of PDVF and 17/419 (4%) subjects in the Atripla treatment group met the definition of PDVF. While subtype was not obtained for every subject, the vast majority of subjects had HIV-1 subtype B, with subtypes C, G, BF, and AG being represented by just one or (in the case of Subtype C) two subjects). Integrase, reverse transcriptase (RT) and protease (PR) genotypes and phenotypes were attempted at Baseline and time of PVDF for subjects with PDVF and obtained for 11 in the DTG + ABC/3TC treatment group and 9 subjects in the Atripla treatment group.
Integrase Genotyping and Phenotyping Results
Seven subjects in the DTG + ABC/3TC treatment arm had IN genotype and phenotype at both Baseline and at the time of PDVF, while 7 subjects in the Atripla treatment arm had IN genotype at and phenotype at both Baseline and time of PDVF.
None of the 7 subjects in either the DTG + ABC/3TC treatment group or the Atripla treatment group had treatment emergent INI resistance mutations. One subject (7912) in the DTG + ABC/3TC treatment group had a treatment emergent substitution E157Q/P at Week 24, without accompanying DTG phenotypic resistance (Table 41).
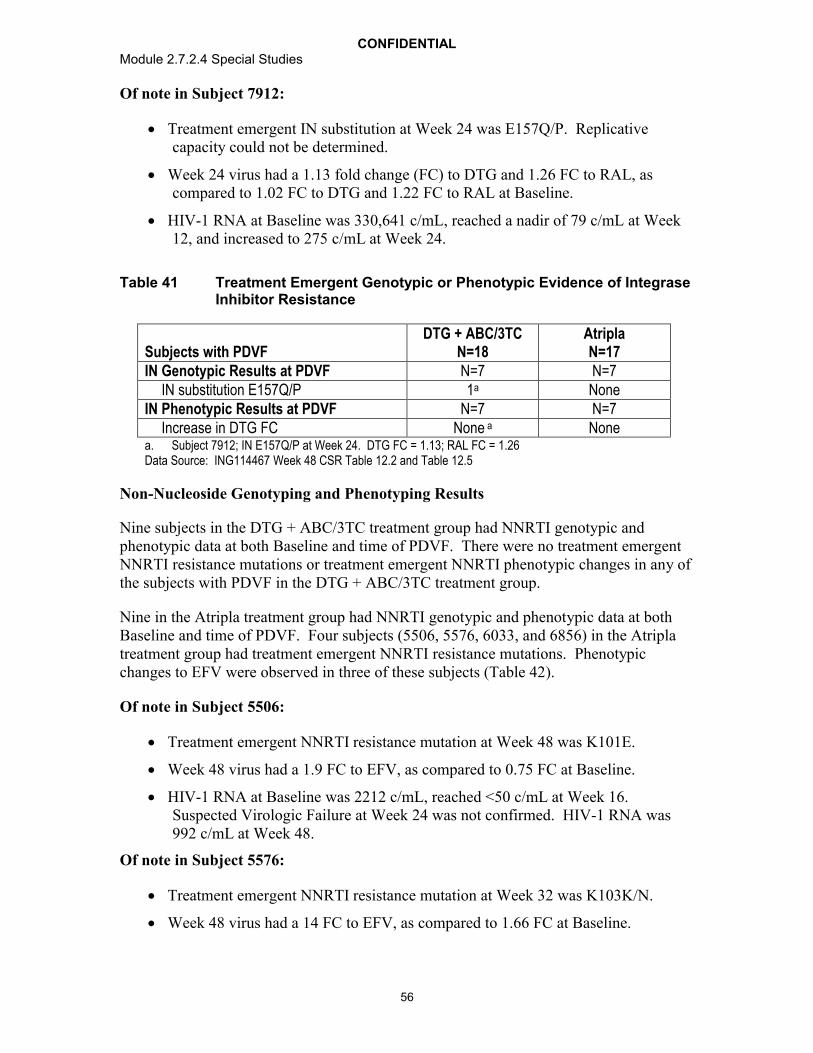
CONFIDENTIALModule 2.7.2.4 Special Studies
56
Of note in Subject 7912:
Treatment emergent IN substitution at Week 24 was E157Q/P. Replicative capacity could not be determined.
Week 24 virus had a 1.13 fold change (FC) to DTG and 1.26 FC to RAL, as compared to 1.02 FC to DTG and 1.22 FC to RAL at Baseline.
HIV-1 RNA at Baseline was 330,641 c/mL, reached a nadir of 79 c/mL at Week 12, and increased to 275 c/mL at Week 24.
Table 41 Treatment Emergent Genotypic or Phenotypic Evidence of Integrase Inhibitor Resistance
Subjects with PDVFDTG + ABC/3TC
N=18AtriplaN=17
IN Genotypic Results at PDVF N=7 N=7IN substitution E157Q/P 1a None
IN Phenotypic Results at PDVF N=7 N=7Increase in DTG FC None a None
a. Subject 7912; IN E157Q/P at Week 24. DTG FC = 1.13; RAL FC = 1.26Data Source: ING114467 Week 48 CSR Table 12.2 and Table 12.5
Non-Nucleoside Genotyping and Phenotyping Results
Nine subjects in the DTG + ABC/3TC treatment group had NNRTI genotypic and phenotypic data at both Baseline and time of PDVF. There were no treatment emergent NNRTI resistance mutations or treatment emergent NNRTI phenotypic changes in any of the subjects with PDVF in the DTG + ABC/3TC treatment group.
Nine in the Atripla treatment group had NNRTI genotypic and phenotypic data at both Baseline and time of PDVF. Four subjects (5506, 5576, 6033, and 6856) in the Atripla treatment group had treatment emergent NNRTI resistance mutations. Phenotypic changes to EFV were observed in three of these subjects (Table 42).
Of note in Subject 5506:
Treatment emergent NNRTI resistance mutation at Week 48 was K101E.
Week 48 virus had a 1.9 FC to EFV, as compared to 0.75 FC at Baseline.
HIV-1 RNA at Baseline was 2212 c/mL, reached <50 c/mL at Week 16. Suspected Virologic Failure at Week 24 was not confirmed. HIV-1 RNA was 992 c/mL at Week 48.
Of note in Subject 5576:
Treatment emergent NNRTI resistance mutation at Week 32 was K103K/N.
Week 48 virus had a 14 FC to EFV, as compared to 1.66 FC at Baseline.

CONFIDENTIALModule 2.7.2.4 Special Studies
57
HIV-1 RNA at Baseline was 53,961 c/mL, reached a nadir of <50 c/mL at Week 16, and increased to 6882 c/mL at Week 32.
Of note in Subject 6033:
Treatment emergent NNRTI resistance mutations at Week 24 were K103N and G190G/A.
Week 24 virus had a 22 fold change (FC) to EFV, as compared to 1.03 FC to at Baseline.
HIV-1 RNA at Baseline was 112,284 c/mL, reached a nadir of <50 c/mL at Week 16, and increased to 40,751 c/mL at Week 24.
Of note in Subject 6856:
Treatment emergent NNRTI resistance mutation at Week 24 was G190G/A. Additional treatment emergent NNRTI mutations were K103R and V179V/D.
Week 24 virus had a 20 fold change (FC) to EFV, as compared to 1.05 FC to at Baseline.
HIV-1 RNA at Baseline was 5218 c/mL, reached a nadir of 89 c/mL at Week 16, and increased to 29.777 c/mL at Week 24.
Table 42 Treatment Emergent Genotypic or Phenotypic Evidence of NNRTI Resistance
Subjects with PDVFMutation
N=17NNRTI Phenotype Treatment
GroupNNRTI Genotype and Phenotype Results at PDVF
9 9
5506 K101E 1.9 FC to EFV Atripla5576 K103K/N 14 FC to EFV Atripla6033 K103N,
G190G/A22 FC to EFV Atripla
6856 G190G/A 20 FC to EFV AtriplaData Source: ING114467 Week 48 CSR Table 12.4 and Table 12.5
Nucleoside Reverse Transcriptase Genotyping and Phenotyping Results
Nine with PDVF in the DTG + ABC/3TC treatment group had NRTI and PI genotypic and phenotypic data at both Baseline and time of PDVF, while 9 in the Atripla treatment group had NRTI and PI genotypic and phenotypic data at both Baseline and time of PDVF.
There were no treatment emergent PI resistance mutations in either treatment group.

CONFIDENTIALModule 2.7.2.4 Special Studies
58
There were no treatment emergent NRTI resistance mutations in any of the subjects with PDVF in the DTG + ABC/3TC treatment group. One subject (7762) in the DTG + ABC/3TC treatment group had a treatment emergent phenotypic change to DDI without accompanying genotypic changes (Table 43).
One subject in the Atripla treatment group (6707) had the treatment emergent NRTI resistance mutation K65K/R. This subject did not have treatment emergent phenotypic changes, although the Monogram Net Assessment predicted resistance to all NRTIs with the exception of AZT and d4T (Table 43).
Of note in Subject 6707:
Treatment emergent NRTI resistance mutation at Week 24 was K65K/R.
Week 24 virus had a 0.69 FC to TDF and 1.27 FC to FTC, although the Monogram Biosciences Net Assessment predicted resistance to FC to ABC, DDI, FTC, 3TC, and TDF.
HIV-1 RNA at Baseline was 376,229 c/mL. HIV-1 RNA was 131 c/mL at Week 24.
Of note in Subject 7762:
Week 32 virus had a 1.39 FC to DDI (clinical cut off = 1.3), without treatment emergent NRTI resistance mutations.
HIV-1 RNA at Baseline was 564,854 c/mL, was <50 c/mL at Week 12 and Week 24, and increased to 66 c/mL at Week 32.
Table 43 Treatment Emergent Genotypic Evidence of NRTI Resistance
Subjects with PDVFMutation
N=17NRTI Phenotype Treatment
GroupNRTI Genotype and Phenotype Results at PDVF
9 9
6707 K65K/R No change Atripla7762 0 1.39 FC to DDI DTG +
ABC/3TCData Source: ING114467 Week 48 CSR Table 12.4 and Table 12.5
If subjects with PDVF with <400 c/mL HIV-1 RNA are censored from this analysis, there were only 3 subjects with PDVF in the DTG + ABC/3TC treatment group, none of whom had any treatment emergent resistance mutations, and only 6 subjects with PDVF in the Atripla treatment group, including the four subjects with NNRTI resistance mutations.

CONFIDENTIALModule 2.7.2.4 Special Studies
59
4.2.1.2. Studies of Treatment-Experienced (INI-naive) Subjects
Results from this Week 24 interim analysis of ING111762 show DTG has a higher barrier to resistance in this patient population. A statistically significant difference in favor of DTG was demonstrated by planned virologic analyses for emergent integrase resistance. In a pre-specified analysis, there was a statistically significant difference in favor of DTG for the proportion of mITT-E subjects harbouring virus with evidence of INI Resistance by Week 24 (DTG: 2/354 (0.6%); RAL: 10/361(2.8%); p=0.016). An additional prespecified analysis using a common FC cutoff to determine phenotypic resistance to RAL and DTG also confirmed a statistically significant difference in favor of DTG.
4.2.1.2.1. ING111762
Study Title: A Phase III Randomized, Double-blind Study of the Safety and Efficacy ofGSK1349572 50 mg Once Daily Versus Raltegravir 400 mg Twice Daily, BothAdministered with an Investigator-selected Background Regimen Over 48 Weeks inHIV-1 Infected, Integrase Inhibitor-Naïve, Antiretroviral Therapy-Experienced Adults -Week 24 Results
Location of Report: 5.3.5.1
Study Design: ING111762 is a Phase III randomized, double-blind, active-controlled, multicenter, parallel group, fully-powered non-inferiority study. Subjects wererandomized to DTG 50 mg once daily or RAL 400 mg twice daily (BID), both in combination with investigator selected background therapy based on Screening and historic resistance results. The background therapy was limited to no more than two antiretroviral agents. At the Week 48 visit, subjects randomized to RAL will be discontinued from the study (if RAL is approved and commercially available in the country), while subjects randomized to DTG will be given the opportunity to remain on the study while receiving DTG 50 mg once daily during the Open-label Phase of the study.
Protocol-defined virologic failure (PDVF) was defined as the following:
Virologic Non-response
A decrease in plasma HIV-1 RNA of less than 1 log10 c/mL by Week 16, with subsequent confirmation, unless plasma HIV-1 RNA is <400 c/mL.
Confirmed plasma HIV-1 RNA levels ≥400 c/mL on or after Week 24.
Virologic Rebound
Confirmed rebound in plasma HIV-1 RNA levels to ≥400 c/mL after prior confirmed suppression to <400 c/mL.
Confirmed plasma HIV-1 RNA levels >1 log10 c/mL above the nadir value where nadir is the lowest HIV-1 RNA value ≥400 c/mL.

CONFIDENTIALModule 2.7.2.4 Special Studies
60
Results:
PDVF Frequency
Virologic failure through Week 24 occurred earlier and more frequently in the RAL arm(Table 44). At Week 16 there were 10 (3%) confirmed virologic failures for the DTG arm and 21 (6%) for the RAL arm. At Week 24 there were respectively 14 (4%) and 34 (9%) virologic failures for DTG and RAL. The difference through Week 24 was driven by a greater proportion of virologic non-response in the RAL arm 5% versus <1% in the DTG arm, with a similar proportion of virologic rebound in both arms (4%). In terms focused on subjects experiencing virologic failure, through Week24 there was a greater proportion of virologic non-response in the RAL arm with 19 non-responders of 34 PDVFs, compared with greater proportion of virologic rebounders with 13 rebounders of 14 PDVFs in the DTG arm.
Table 44 Cumulative Summary of Protocol-Defined Virologic Failures by Visit (mITT-E) Through Week 24
Week DTG 50 mg Once DailyN=354n/N (%)
RAL 400 mg BIDN=361n/N (%)
Week 8 1 (<1) 1 (<1)
Rebound 1 (<1) 1 (<1)
Week 12 4 (1) 6 (2)
Rebound 4 (1) 6 (2)
Week 16 10 (3) 21 (6)
Virologic non-response 0 13(4)
Rebound 10 (3) 8(2)
Week 24 14 (4) 34 (9)
Virologic non-response 1 (<1) 19 (5)
Rebound 13 (4) 15 (4)Data Source: m5.3.5.1 ING111762 Week 24 CSR Table 7.10.
Genotypic and Phenotypic Accountability
Integrase PhenoSense and PhenoSense GT assay was performed at Monogram BioSciences (MBI) as well as PhenoSense Entry and Trofile (the latter two only when requested by investigator) to assess resistance to other ARTs for eligibility purposes andto aid in the selection of the background regimen. All Baseline and On-treatment genotypic (Table 45) and phenotypic testing (Table 46) were conducted at MBI.
Due to integrase assay failure, paired data (baseline and time of PDVF) for IN resistance was not available for 5/14 DTG PDVF samples and 7/34 RAL samples (Data Source: ING111762 Week 24 Clinical Study ReportTable 7.10, Table 12.2 for genotypic and Table 12.40 for phenotypic). This is typically due to viral load < 500 copies/mL, reduced viral fitness, or compromised sample collection/handling. One exception is Subject 2785,

CONFIDENTIALModule 2.7.2.4 Special Studies
61
who does not have paired data because a sample was not available at the suspected PDVF timepoint..
Table 45 Genotypes Available in PDVF Genotypic Population through Week 24
GenotypeAssessment
DTG 50 mg Once DailyN=11n (%)
RAL 400 mg BIDN=31n (%)
Integrase
Screen 0 2 (6)
Baseline Sample 11 (100) 30 (97)
On-Treatment PDVF Sample 9 (82) 27 (87)
On-Treatment Non-PDVF Sample 0 1 (3)
Baseline and On-Treatment PDVF 9 (82) 27 (87)
Baseline and On-Treatment Non-PDVF 0 1 (3)
Reverse Transcriptase
Screen 11 (100) 31 (100)
Baseline Sample 11 (100) 31 (100)
On-Treatment PDVF Sample 11 (100) 31 (100)
On-Treatment Non-PDVF Sample 0 1 (3)
Baseline and On-Treatment PDVF 11 (100) 31 (100)
Baseline and On-Treatment Non-PDVF 0 1 (3)
Protease
Screen 11 (100) 31 (100)
Baseline Sample 11 (100) 31 (100)
On-Treatment PDVF Sample 11 (100) 31 (100)
On-Treatment Non-PDVF Sample 0 1 (3)
Baseline and On-Treatment PDVF 11 (100) 31 (100)
Baseline and On-Treatment Non-PDVF 0 1 (3)Data Source: ING111762 Week 24 CSR Table 12.1
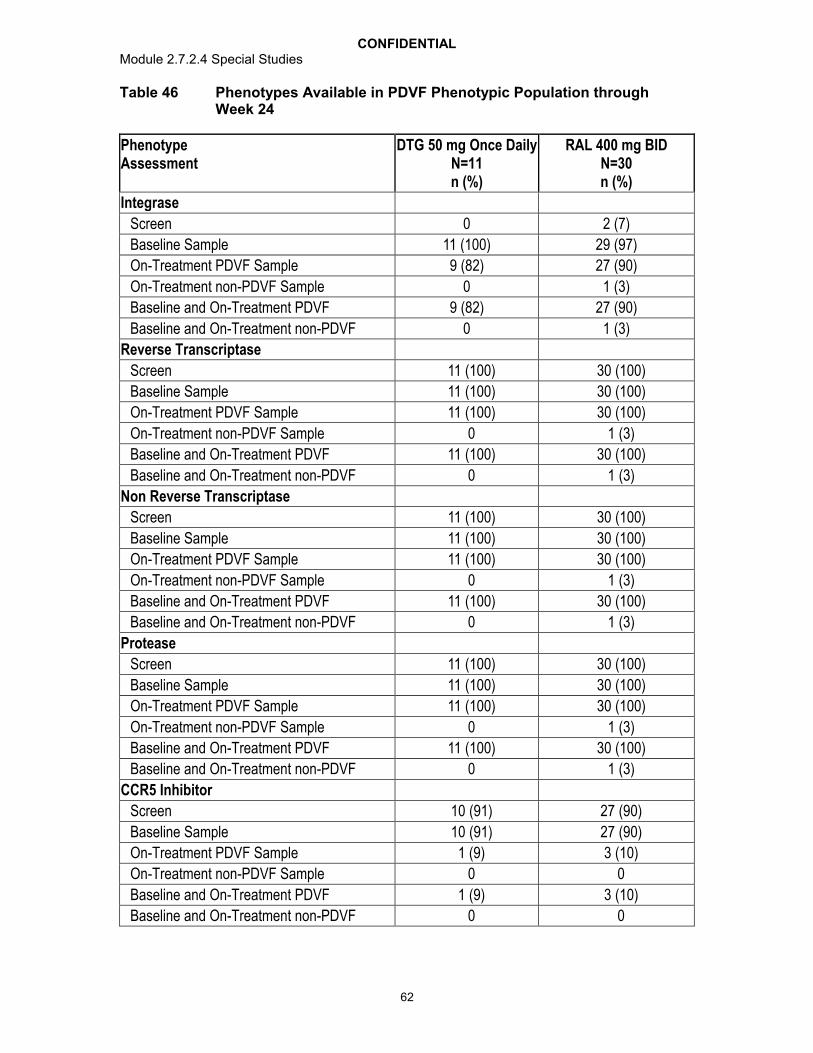
CONFIDENTIALModule 2.7.2.4 Special Studies
62
Table 46 Phenotypes Available in PDVF Phenotypic Population through Week 24
PhenotypeAssessment
DTG 50 mg Once DailyN=11n (%)
RAL 400 mg BIDN=30n (%)
Integrase
Screen 0 2 (7)
Baseline Sample 11 (100) 29 (97)
On-Treatment PDVF Sample 9 (82) 27 (90)
On-Treatment non-PDVF Sample 0 1 (3)
Baseline and On-Treatment PDVF 9 (82) 27 (90)
Baseline and On-Treatment non-PDVF 0 1 (3)
Reverse Transcriptase
Screen 11 (100) 30 (100)
Baseline Sample 11 (100) 30 (100)
On-Treatment PDVF Sample 11 (100) 30 (100)
On-Treatment non-PDVF Sample 0 1 (3)
Baseline and On-Treatment PDVF 11 (100) 30 (100)
Baseline and On-Treatment non-PDVF 0 1 (3)
Non Reverse Transcriptase
Screen 11 (100) 30 (100)
Baseline Sample 11 (100) 30 (100)
On-Treatment PDVF Sample 11 (100) 30 (100)
On-Treatment non-PDVF Sample 0 1 (3)
Baseline and On-Treatment PDVF 11 (100) 30 (100)
Baseline and On-Treatment non-PDVF 0 1 (3)
Protease
Screen 11 (100) 30 (100)
Baseline Sample 11 (100) 30 (100)
On-Treatment PDVF Sample 11 (100) 30 (100)
On-Treatment non-PDVF Sample 0 1 (3)
Baseline and On-Treatment PDVF 11 (100) 30 (100)
Baseline and On-Treatment non-PDVF 0 1 (3)
CCR5 Inhibitor
Screen 10 (91) 27 (90)
Baseline Sample 10 (91) 27 (90)
On-Treatment PDVF Sample 1 (9) 3 (10)
On-Treatment non-PDVF Sample 0 0
Baseline and On-Treatment PDVF 1 (9) 3 (10)
Baseline and On-Treatment non-PDVF 0 0

CONFIDENTIALModule 2.7.2.4 Special Studies
63
PhenotypeAssessment
DTG 50 mg Once DailyN=11n (%)
RAL 400 mg BIDN=30n (%)
Fusion
Screen 7 (64) 23 (77)
Baseline Sample 7 (64) 23 (77)
On-Treatment PDVF Sample 1 (9) 1 (3)
On-Treatment non-PDVF Sample 0 0
Baseline and On-Treatment PDVF 0 1 (3)
Baseline and On-Treatment non-PDVF 0 0Data Source: ING111762 CSR Table 12.37
Proportion of Subjects with Detectable Virus with Evidence of INI Resistance by Week 24 (mITT-E population)
For the mITT-E population, 0.6% of subjects receiving DTG and 2.8% of subjects receiving RAL had evidence of treatment emergent genotypic or phenotypic INI resistance at the time of protocol defined virologic failure by Week 24 (Table 47). The treatment difference was statistically significant in favor of DTG (p=0.016, less than the pre-specified two-sided 5% type I error cutoff) based on a pre-specified analysis of this key secondary endpoint.
Genotypic evidence of INI resistance was determined according to the presence of IN substitutions associated with development of resistance to RAL or DTG (as specified in the RAP) that were not present at Baseline.
Phenotypic evidence of INI resistance was determined as FC in IC50 relative to wild-type, as provided by the PhenoSense HIV assays from Monogram Biosciences Inc., above the 1.5 cutoff for RAL or 2.5 cutoff for DTG (standard cut-off used by Monogram Biosciences Inc. until clinical or biological cut-off has been determined), if not above the cutoff at Baseline.

CONFIDENTIALModule 2.7.2.4 Special Studies
64
Table 47 Summary of Analysis for Proportion of Subjects with Detectable Virus that has Treatment Emergent Genotypic or Phenotypic Evidence of INI Resistance by Week 24 (mITT-E Population)
Treatment Number ofResponders /
Total Assessed
Adjusted Difference inProportionb (95% CI)
(DTG - RAL)
P-Valuea
DTG 50 mg Once Daily 2 / 354 (0.6%)
RAL 400 mg BID 10 / 361 (2.8%) -2.3 (-4.2, -0.4) 0.016
Data Source: ING111762 Week 24 CSR Table 7.14a. Difference: Proportion on DTG - Proportion on RAL.b. Based on Cochran-Mantel Haenszel stratified analysis adjusting for the following baseline stratification factors:
baseline HIV-1 RNA, (<=50,000 vs. >50,000 c/mL), DRV/r use without primary PI mutations (yes vs. no), and baseline PSS (2 vs. <2) to background regimen. PSS based on full susceptibility, category ‘2’ includes two subjects with PSS=3.
Proportion of Subjects with Phenotypic Resistance to RAL and DTG using a Common Fold Change Cutoff
A statistically significant difference in favor of DTG was observed with the planned sensitivity analysis in Table 48 using a common FC cutoff of 2.5 to assess phenotypic resistance to DTG and RAL.
Table 48 Summary of Sensitivity Analysis for Proportion of Subjects with Detectable Virus that has Treatment Emergent Phenotypic Evidence of INI Resistance by Week 24
Treatment Number MeetingCriteria / Number
Assessed
Difference inProportiona (95%
CI)
Adjusted Difference in Proportionb (%) (95% CI)
DTG 50 mg Once Daily
2 / 354 (<1%)
RAL 400 mg BID
9 / 361 (2%) -1.9 (-3.7, -0.1) -2.0 (-3.8, -0.2)
Data Source: ING111762 Week 24 CSR Table 7.16a. Difference: Proportion on DTG - Proportion on RAL.b. Based on Cochran-Mantel Haenszel stratified analysis adjusting for the following baseline stratification factors:
baseline HIV-1 RNA, (<=50,000 vs. >50,000 c/mL), DRV/r use without primary PI mutations (yes vs. no), and baseline PSS (2 vs. <2) to background regimen. PSS based on full susceptibility, category ‘2’ includes two subjects with PSS=3.
Treatment Emergent INI Genotypic Resistance
There were 9 subjects experiencing PDVF in the DTG arm and 27 in the RAL arm with matched baseline and PDVF resistance testing available. Overall, 2 of the 9 (22%) subjects with confirmed virologic failure in the DTG treatment arm had treatment emergent INI resistance mutations which were both at position R263 in the IN open reading frame (Table 49). No primary or secondary resistance mutations commonly

CONFIDENTIALModule 2.7.2.4 Special Studies
65
selected during RAL therapy were observed. Of 27 subjects with confirmed virologic failure on the RAL treatment arm, 9 (33%) had treatment emergent INI resistance mutations commonly observed during RAL therapy including the primary resistance mutations at Y143, Q148, and N155 as well as associated secondary mutations.
Table 49 Treatment Emergent Integrase Substitutions from Baseline (Week 24 PDVF Genotypic Population - IN results at Baseline and time of PDVF)
Codona Treatment Emergent IN Genotype
DTG 50 mg Once DailyN=9
n (%)
RAL 400 mg BIDN=27n (%)
Any 2 (22) 9 (33)
68 L68L/V 0 1 (4)
74 L74L/M 0 1 (4)
92 E92E/Q 0 1 (4)
97 T97A, T97T/A 0 3 (11)
140 G140A, G140S 0 2 (7)
143Y143Y/C, Y143R, Y143Y/R/H/C 0 3 (11)
148 Q148H, Q148Q/R 0 3 (11)
151 V151I, V151V/I 0 2 (7)
155 N155H, N155N/H 0 5 (19)
157 E157E/Q 0 1 (4)
163 G163K 0 1 (4)
263 R263K, R263R/K* 2 (22) 0Data Source: ING111762 Week 24 CSR Table 12.2a. Per RAP definition RAL or DTG associated resistance mutations: H51Y, T66A, T66I, T66K, L68V, L68I, L74I,
L74M, L74R4, E92Q, E92V, Q95K, T97A, G118R, E138A, E138K, E138T, G140A, G140C, G140S, Y143C, Y143H, Y143R, P145S, S147G, Q148H, Q148K, Q148R, V151I, V151L, S153F, S153Y, N155H, E157Q, G163R, G163K, G193E, R263K. IN substitutions listed above in bold were defined from the Stanford database (http://hivdb6.stanford.edu) with a score of >45. Other mutations are secondary IN resistance mutations from the Stanford database detected during INI clinical investigation, or were observed during other clinical investigation or in vitro studies with DTG.
Treatment Emergent INI Phenotypic Resistance
Within the DTG arm all nine subject samples had a DTG fold change of below the Mongram Biosciences FC cutoff <2.5; all nine RAL subject samples had RAL fold change of <1.5 (Monogram Biosciences RAL cutoff). Within the RAL arm three of the subject samples had a DTG fold change of ≥2.5 and nine had RAL fold changes of ≥1.5 (Table 50).

CONFIDENTIALModule 2.7.2.4 Special Studies
66
Table 50 Summary of Fold Change to DTG and RAL at Time of PDVF (Week 24 PDVF Phenotypic Population)
Investigational Product Fold-Change Compared to Wildtype Virus
DTG 50 mg Once Daily
N=11n (%)
RAL 400 mg Twice Daily
N=30n (%)
DTG n 9 27
0 to 2.5 9 (82) 24 (80)
>2.5 to 4 0 1 (3)
>4 to 8 0 1 (3)
>8 to 10 0 0
>10 to 15 0 0
>15 to 20 0 1 (3)
>20 to 25 0 0
>25 0 0
Median (Range) 0.92 (0.71 – 1.93) 1.04 (0.67 – 18.00)
RAL n 9 27
0 to 1.5 9 (82) 18 (60)
>1.5 to 4 0 2 (7)
>4 to 8 0 0
>8 to 10 0 0
>10 to 20 0 0
>20 to maximum of assay limit
0 4 (13)
>maximum of assay limit 0 3 (10)
Median (Range) 0.93 (0.80 – 1.12) 1.11 (0.59 – 117.00)Data Source: ING111762 Week 24 CSR Table 12.39
Paired Analysis of Day 1 and Virologic Failure Integrase Genotypic and Phenotypic Results
Table 51 includes subjects on DTG or RAL with emergent integrase genotypic or phenotypic resistance. Additional details are found in case narrative sections, Subjects With Treatment Emergent Resistance and Subjects Without Treatment Emergent Resistance.
There were two subjects in the DTG arm (Subjects 672 and 2568) with emergent integrase-defined substitutions. Both had experienced virologic rebound instead of non-response, had no defined integrase resistance substitutions at Baseline, and acquired a substitution at R263 in the integrase open reading frame. In each case the DTG fold change was < 2, as was the maximum RAL fold change. Neither of these subjects with emergent substitutions at R263 had RAL-associated secondary mutations at Baseline.
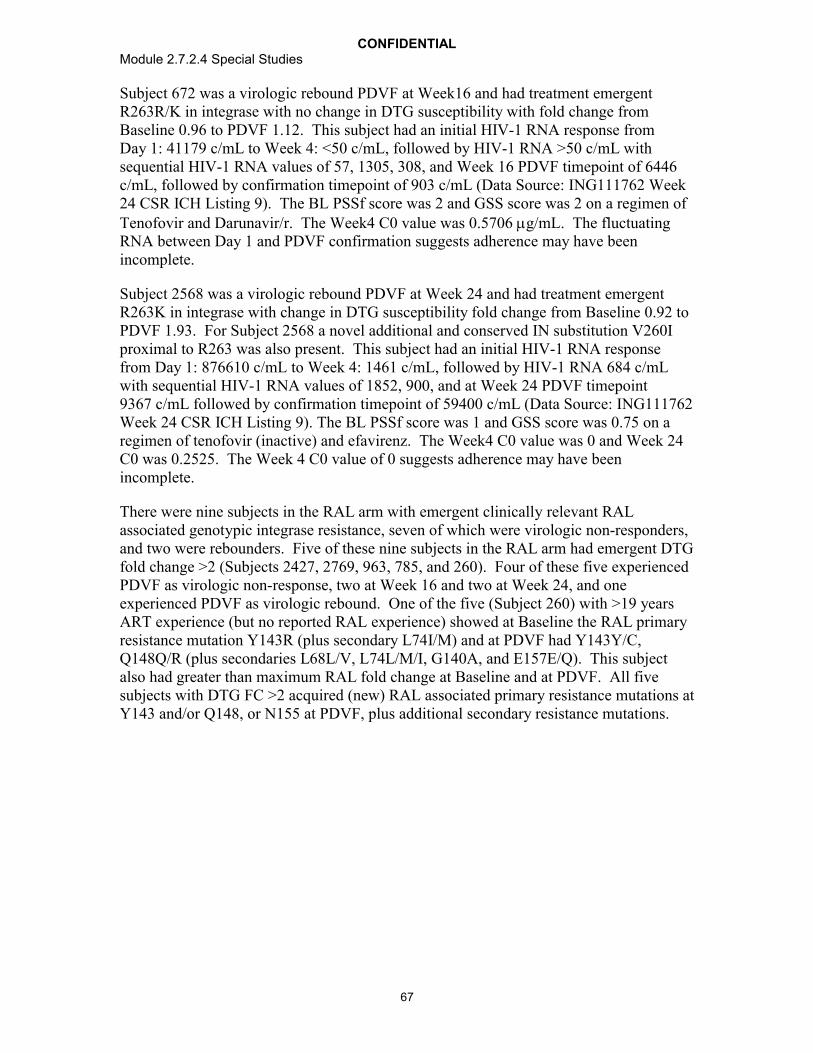
CONFIDENTIALModule 2.7.2.4 Special Studies
67
Subject 672 was a virologic rebound PDVF at Week16 and had treatment emergent R263R/K in integrase with no change in DTG susceptibility with fold change from Baseline 0.96 to PDVF 1.12. This subject had an initial HIV-1 RNA response from Day 1: 41179 c/mL to Week 4: <50 c/mL, followed by HIV-1 RNA >50 c/mL with sequential HIV-1 RNA values of 57, 1305, 308, and Week 16 PDVF timepoint of 6446 c/mL, followed by confirmation timepoint of 903 c/mL (Data Source: ING111762 Week 24 CSR ICH Listing 9). The BL PSSf score was 2 and GSS score was 2 on a regimen of Tenofovir and Darunavir/r. The Week4 C0 value was 0.5706 g/mL. The fluctuating RNA between Day 1 and PDVF confirmation suggests adherence may have been incomplete.
Subject 2568 was a virologic rebound PDVF at Week 24 and had treatment emergent R263K in integrase with change in DTG susceptibility fold change from Baseline 0.92 to PDVF 1.93. For Subject 2568 a novel additional and conserved IN substitution V260I proximal to R263 was also present. This subject had an initial HIV-1 RNA responsefrom Day 1: 876610 c/mL to Week 4: 1461 c/mL, followed by HIV-1 RNA 684 c/mL with sequential HIV-1 RNA values of 1852, 900, and at Week 24 PDVF timepoint 9367 c/mL followed by confirmation timepoint of 59400 c/mL (Data Source: ING111762 Week 24 CSR ICH Listing 9). The BL PSSf score was 1 and GSS score was 0.75 on aregimen of tenofovir (inactive) and efavirenz. The Week4 C0 value was 0 and Week 24 C0 was 0.2525. The Week 4 C0 value of 0 suggests adherence may have been incomplete.
There were nine subjects in the RAL arm with emergent clinically relevant RAL associated genotypic integrase resistance, seven of which were virologic non-responders, and two were rebounders. Five of these nine subjects in the RAL arm had emergent DTG fold change >2 (Subjects 2427, 2769, 963, 785, and 260). Four of these five experienced PDVF as virologic non-response, two at Week 16 and two at Week 24, and one experienced PDVF as virologic rebound. One of the five (Subject 260) with >19 years ART experience (but no reported RAL experience) showed at Baseline the RAL primary resistance mutation Y143R (plus secondary L74I/M) and at PDVF had Y143Y/C, Q148Q/R (plus secondaries L68L/V, L74L/M/I, G140A, and E157E/Q). This subject also had greater than maximum RAL fold change at Baseline and at PDVF. All five subjects with DTG FC >2 acquired (new) RAL associated primary resistance mutations at Y143 and/or Q148, or N155 at PDVF, plus additional secondary resistance mutations.

CONFIDENTIALModule 2.7.2.4 Special Studies
68
Table 51 Summary of Subjects with Paired Day 1 and PDVF IN Genotype and Phenotype Exhibiting Genotypic or Phenotypic Changes Through Week 24
Arm / Subj
PDVF Visit
PSSf / GSS
Virologic Failure
HIV-1 RNA c/mL DTG FC RAL FC IN Genotype
Baseline PDVF Baseline PDVF Baseline PDVF Baseline PDVFDTG / 672
Week 16
2 / 2 Rebound 41179 6446 0.96 1.12 1.02 0.94 None R263R/K
DTG / 2568
Week 24
1 / 0.75 Rebound 876610 9367 0.92 1.93 1.11 1.12 None R263K
RAL / 260
Week 16
2 / 1.25 Virologic non-response
98571 10725 0.71 18 >Maxa >Max L74I/M, Y143Rb
L68L/V, L74L/M/I, G140A, Y143Y/C, Q148Q/R, E157E/Q
RAL / 2769
Week 16
1 / 1 Virologic non-response
641416 84973 1.3 3.73 1.18 117 None E92E/Q, T97T/A, V151V/I, N155H
RAL / 1146
Week 16
0 / 0 Virologic non-response
63449 58433 1.04 1.27 1.46 114 None T97A, Y143R
RAL / 2472
Week 16
1 / 1 Virologic non-response
18441 2300 0.83 0.92 1.04 98 L74I L74I, Y143Y/R/H/C, Q148Q/R
RAL / 419
Week 24
1 / 1 Virologic non-response
131377 7203 1.28 1.89 1.01 >Max None L74L/M, T97T/A, V151I, N155H, G163K
RAL / 963
Week 24
2 / 1 Virologic non-response
856849 28931 1.13 4.12 1.23 >Max E157Q G140S, Q148H, E157Q
RAL / 2427
Week 24
1 / 1 Rebound 936821 10472 1 2.12 0.96 22 L74I L74I, N155H
RAL / 2688
Week 24
2 / 2 Virologic non-response
28814 2734 1.14 0.89 1.14 1.44 None N155N/H
RAL / 9088
Week 24
1 / 1 Rebound 535742 3007185 0.92 1.38 1.09 3.78 L74I L74I, N155N/H
Data Source: ING111762 Week 24 CSR Table 12.59 and Other Listing 52a Greater than maximum measureable in assay fold change resistance = >114.82.b Per RAP definition RAL or DTG associated resistance mutations: L74M, L74I, T97A, E92Q, E138A, E138K, G140S, Y143C, Y143H, Y143R, Q148H, Q148K, Q148R, V151I,
N155H, S153Y, S153F, G163K, G163R, G193E, R263K.

CONFIDENTIALModule 2.7.2.4 Special Studies
69
Treatment Emergent Non-INI Resistance
There were numerically more examples of emergent resistance to the background regimen in the RAL arm (6/351 versus 3/354 in the DTG arm), but the treatment difference was not statistically significant owing to the small number of cases (Table 52).
There were 3 subjects on DTG with emergent resistance to BR at PDVF are summarized herein; one also had emergent INI resistance. Subject 2568: received tenofovir and efavirenz and had a PSSf of 1 and GSS of 0.75. At Week 24 PDVF the PSSf and GSS score both changed to zero as NNRTI mutation G190S emerged, and integrase substitution R263K emerged.
Subject 1067: received tenofovir and darunavir/r and had aPSSf of 2 and GSS of 1.75. At Week 16 PDVF the PSSf score remained 2 while GSS score changed to 1.50 according to Stanford HIV/db guidance, but no primary resistance mutation emerged, and no integrase substitutions emerged.
Subject 941: received tenofovir and atazanavir/r and had a PSSf score of 2 and GSS of 2.0. At Week 12 PDVF the PSSf score remained 2 while GSS score changed to 1.25 and the NNRTI mutation K101P/Q emerged, and no integrase substitutions emerged.
In the RAL arm, four subjects (Subjects 260, 977, 2427, and 963) had treatment emergent background regimen resistance and emergent INI resistance (Data Source: ING111762 Week 24 CSR Other Listing 50). As mentioned previously, Subject 260 showed at Baseline the RAL primary resistance mutation Y143R plus secondary L74I/M. Three other PDVF subjects in the RAL arm (Subjects 2201 and 2360) with treatment emergent background resistance did not have emergent integrase resistance at PDVF.
Table 52 Summary of Emergence of Genotypic and/or Phenotypic Resistance to the Background Regimen at Time of PDVF (mITT-E Population)
Treatment Number meeting Criteria / Total
Assessed
Difference in Proportion (95% CI)
(DTG - RAL)
Adjusted Difference in Proportiona (95%
CI) (DTG - RAL)
DTG 50 mg Once Daily 3 / 354 (<1%)RAL 400 mg BID 6 / 361 (2%) -0.8 (-2.48, 0.8) -0.8 (-2.48, 0.8)Data Source: ING111762 Week 24 CSR Table 7.30.a. Based on Cochran-Mantel Haenszel stratified analysis adjusting for the following baseline stratification factors: baseline HIV-1 RNA (<=50,000 vs. >50,000 c/mL), DRV/r use without primary PI mutations (yes vs. no), and baseline PSS (2 vs. <2) to background regimen. PSS based on full susceptibility, category ‘2’ includes two subjects with PSS=3.

CONFIDENTIALModule 2.7.2.4 Special Studies
70
Week 48 Analysis Based on Data to Date
The Week 48 PDVF Genotypic and Phenotypic populations were used to assess the occurrence of PDVF and the development of genotypic and/or phenotypic INI resistance between Week 24 and Week 48 (based on data through Week 48 to date).
Additional summaries of genotypic and phenotypic analysis through Week 48 are provided in the source tables.
Comparison of PDVF Protocol Defined Virologic Failure by Visit (mITT-E Population): Week 24 Through Week 48
Data was also available for subjects through Week 48 during which time an additional 4 subjects experienced virologic rebound on DTG for total of 18 (5%) PDVFs, and for RAL an additional 8 subjects experienced virologic rebound for a total of 42 (12%) PDVFs (Table 53).
Table 53 Cumulative Summary of Protocol-Defined Virologic Failures by Visit (mITT-E Population): Week 24 Through Week 48
Week DTG 50 mg Once DailyN=354n/N (%)
RAL 400 mg BIDN=361n/N (%)
Week 24 14 (4) 34 (9)
Virologic non-response 1 (<1) 19 (5)
Rebound 13 (4) 15 (4)
Week 32 18 (5) 37 (10)
Virologic non-response 2 (<1) 19 (5)
Rebound 13 (4) 15 (4)
Week 40 18 (5) 41 (11)
Virologic non-response 2 (<1) 19 (5)
Rebound 16 (5) 22 (6)
Week 48 18 (5) 42 (12)
Virologic non-response 2 (<1) 19 (5)
Rebound 16 (5) 23 (6)Data Source: ING111762 Week 24 CSR Table 7.10
Distribution of HIV-1 RNA Levels at PDVF
Proportions of subjects experiencing virologic failure through Week 48 were distributed across the varying RNA ranges in each arm, and overall were proportionally similar between DTG versus RAL (Table 54). Although there were more PDVFs proportionally within the ≥100,000 c/mL range for the RAL arm there was a low absolute number within the DTG arm in this range.

CONFIDENTIALModule 2.7.2.4 Special Studies
71
Table 54 Distribution of HIV-1 RNA at Time of PDVF through Week 48
DTG 50 mg Once DailyN=354n/N (%)
RAL 400 mg BIDN=361n/N (%)
Subjects with PDVF 18 (5) 42 (12)
PDVF HIV-1 RNA (c/mL)a
<1000 1 (6) 6 (14)
1000 to <10,000 9 (50) 15 (36)
10,000 to <50,000 4 (22) 7 (17)
50,000 to <100,000 3 (17) 6 (14)
100,000 1 (6) 8 (19)Data Source: ING111762 Week 24 CSR Table 7.33a. HIV-1 RNA at time point of suspected PDVF
Treatment emergent INI Genotypic Resistance by Week 48
From Week 24 to Week 48, the proportion of subjects having genotypic IN resistance decreased for the DTG arm and increased for the RAL arm (Table 55).
Table 55 Week 24 and Week 48 PDVF Genotypic (IN results at Baseline and time of PDVF)
DTG50 mg Once Daily
RAL400 mg BID
Cumulative Proportion with Pre-specified Treatment Emergent IN substitutions by:Week 24 2/9 (22%) 9/27 (33%)Week 48 2 /12 (17%) 13/32 (41%)Data Source: ING111762 Week 24 CSR Table 12.2 and Table 12.12
Treatment Emergent INI Phenotypic Resistance by Week 48
There continued to be no subjects with DTG or RAL phenotypic resistance on the DTG arm from Week 24 to Week48, and the proportion of subjects with phenotypic resistance on RAL for both DTG and RAL increased (Table 56).
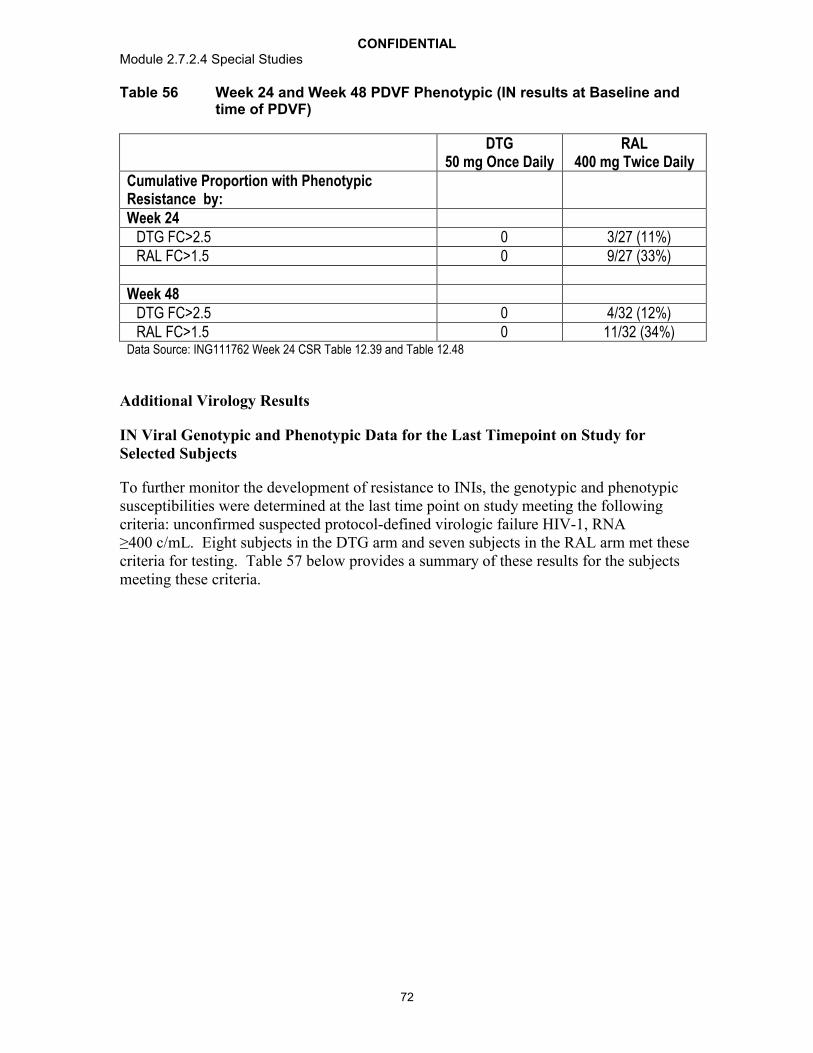
CONFIDENTIALModule 2.7.2.4 Special Studies
72
Table 56 Week 24 and Week 48 PDVF Phenotypic (IN results at Baseline and time of PDVF)
DTG50 mg Once Daily
RAL400 mg Twice Daily
Cumulative Proportion with Phenotypic Resistance by:Week 24
DTG FC>2.5 0 3/27 (11%)RAL FC>1.5 0 9/27 (33%)
Week 48DTG FC>2.5 0 4/32 (12%)RAL FC>1.5 0 11/32 (34%)
Data Source: ING111762 Week 24 CSR Table 12.39 and Table 12.48
Additional Virology Results
IN Viral Genotypic and Phenotypic Data for the Last Timepoint on Study for Selected Subjects
To further monitor the development of resistance to INIs, the genotypic and phenotypic susceptibilities were determined at the last time point on study meeting the following criteria: unconfirmed suspected protocol-defined virologic failure HIV-1, RNA ≥400 c/mL. Eight subjects in the DTG arm and seven subjects in the RAL arm met these criteria for testing. Table 57 below provides a summary of these results for the subjects meeting these criteria.
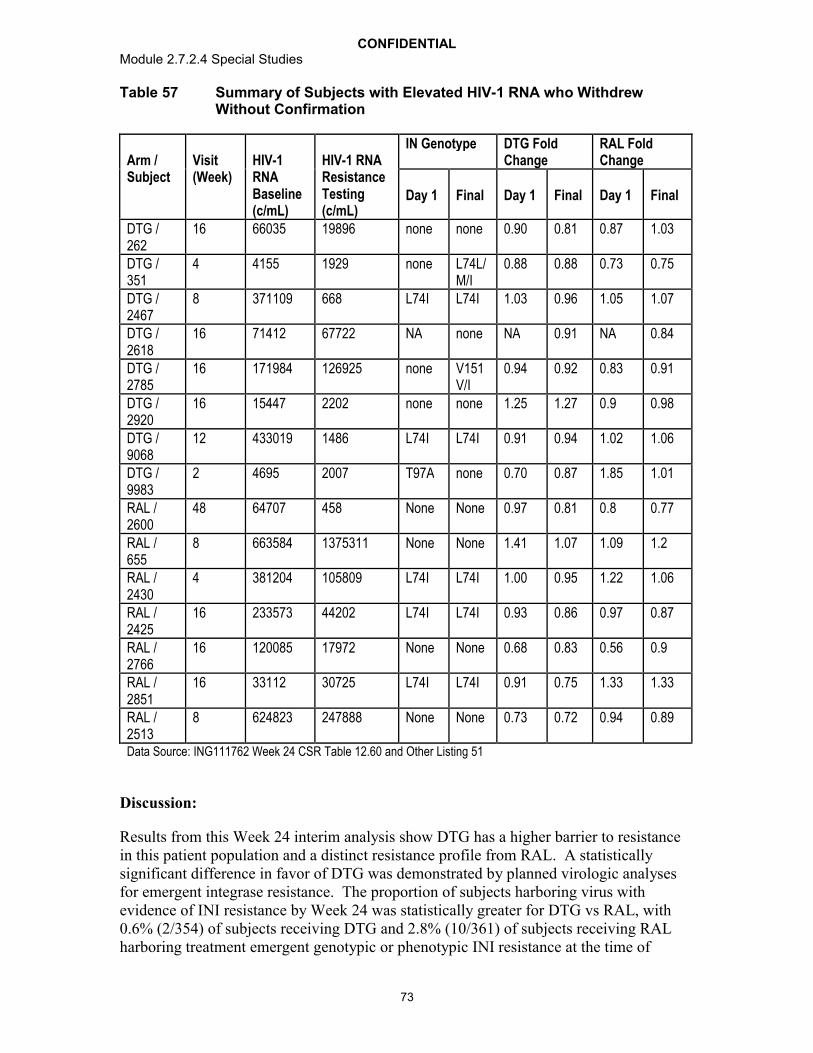
CONFIDENTIALModule 2.7.2.4 Special Studies
73
Table 57 Summary of Subjects with Elevated HIV-1 RNA who Withdrew Without Confirmation
Arm / Subject
Visit(Week)
HIV-1 RNA Baseline (c/mL)
HIV-1 RNA Resistance Testing(c/mL)
IN Genotype DTG Fold Change
RAL Fold Change
Day 1 Final Day 1 Final Day 1 Final
DTG / 262
16 66035 19896 none none 0.90 0.81 0.87 1.03
DTG / 351
4 4155 1929 none L74L/M/I
0.88 0.88 0.73 0.75
DTG / 2467
8 371109 668 L74I L74I 1.03 0.96 1.05 1.07
DTG / 2618
16 71412 67722 NA none NA 0.91 NA 0.84
DTG / 2785
16 171984 126925 none V151V/I
0.94 0.92 0.83 0.91
DTG / 2920
16 15447 2202 none none 1.25 1.27 0.9 0.98
DTG / 9068
12 433019 1486 L74I L74I 0.91 0.94 1.02 1.06
DTG / 9983
2 4695 2007 T97A none 0.70 0.87 1.85 1.01
RAL / 2600
48 64707 458 None None 0.97 0.81 0.8 0.77
RAL / 655
8 663584 1375311 None None 1.41 1.07 1.09 1.2
RAL / 2430
4 381204 105809 L74I L74I 1.00 0.95 1.22 1.06
RAL / 2425
16 233573 44202 L74I L74I 0.93 0.86 0.97 0.87
RAL / 2766
16 120085 17972 None None 0.68 0.83 0.56 0.9
RAL / 2851
16 33112 30725 L74I L74I 0.91 0.75 1.33 1.33
RAL / 2513
8 624823 247888 None None 0.73 0.72 0.94 0.89
Data Source: ING111762 Week 24 CSR Table 12.60 and Other Listing 51
Discussion:
Results from this Week 24 interim analysis show DTG has a higher barrier to resistance in this patient population and a distinct resistance profile from RAL. A statistically significant difference in favor of DTG was demonstrated by planned virologic analyses for emergent integrase resistance. The proportion of subjects harboring virus with evidence of INI resistance by Week 24 was statistically greater for DTG vs RAL, with0.6% (2/354) of subjects receiving DTG and 2.8% (10/361) of subjects receiving RAL harboring treatment emergent genotypic or phenotypic INI resistance at the time of

CONFIDENTIALModule 2.7.2.4 Special Studies
74
protocol-defined virologic failure. An additional prespecified analysis using a common FC cutoff to determine phenotypic resistance to RAL and DTG also confirmed a statistically significant difference in favor of DTG.
Dolutegravir exhibits a higher barrier to treatment failure than RAL. PDVF occurred earlier and more frequently in the RAL arm compared with the DTG arm, which reflects the greater suppressive effect in this ART-experienced patient population for DTG versus RAL.
Two PDVF subjects on DTG and 9 on RAL with matched Baseline and PDVF resistance testing developed treatment emergent integrase genotypic and/or phenotypic resistance. The observed mutations in the RAL arm were as expected clinically relevant INI resistance mutations commonly observed during RAL therapy, and including the primary resistance mutations at Y143, Q148, and N155 and associated secondary mutations. In the DTG arm no primary or secondary resistance mutations commonly selected during RAL therapy emerged. In both cases of emergent substitutions in IN for the DTG arm the IN mutations observed were at position R263.
The R263K mutation has been selected during passage with EVG [Jones, 2007], has been infrequently observed during RAL therapy [Brenner, 2011], and most recently was selected during in vitro passage with DTG [Quashie, 2012; Oliveira, 2012]. Position 263 is in the C-terminal domain of the IN protein, resides within a posited integrase nuclear localization motif [De Houwer, 2012], and is distal from the typical location of strand transfer integrase inhibitor mutations which usually are positioned at or near component residues of the catalytic pocket or its sublayers. Based on a set of 2997 aligned integrase sequences selected from integrase inhibitor naive subjects, R263 was highly conserved at a 99.77% level, with 263K present at 0.11% frequency. Of note, binding of DTG with R263K mutant protein: DNA complexes revealed prolonged binding with a dissociation half life t1/2 of 15.5 hours for subtype B based R263K in comparison with a t1/2 of 25.7 hours for parental wildtype subtype B protein, and similarly a t1/2 of 22.4 hours with subtype C based R263K in comparison with t1/2 of 38.5 hours for parental wildtype subtype C protein [m5.3.5.4, 2011N114191_00]. Finally, the change in DTG or RAL susceptibility observed in two subjects upon acquisition of R263K was minimal with these integrase substitutions, suggesting that they did not confer high level resistance to either DTG or RAL.
Overall, RAL and EVG have strongly overlapping resistance profiles while DTG has been demonstrated to have a distinct resistance profile based on in vitro [Kobayashi, 2011] and now in vivo evaluations from this study.
Genotypic and/or phenotypic resistance to the background regimen was observed infrequently in both treatment arms. Overall there were not enough cases to determine whether a statistically significant difference existed in emergence of resistance to back ground regimens across arms.
While low levels of HIV-1 RNA were observed at PDVF for the ART-naive DTG studies ING113086 [m5.3.5.1 ING113086 Week 48 CSR] and [m5.3.5.1 [ING114467 Week 48 CSR], subjects experiencing virologic failure through Week 48 in this study typically had higher HIV-1 RNA levels that were more broadly distributed across HIV-1 RNA ranges.

CONFIDENTIALModule 2.7.2.4 Special Studies
75
Most HIV-1 RNA levels were above 1000 c/mL and >40% were above 10,000 c/mL. Thus, the virologic failures in this study had sufficient viral replication for a robust assessment of integrase resistance. Despite these higher viral loads at failure, clinically relevant resistance to DTG was not observed, while clinically relevant RAL resistance was observed.
The virologic results of this study combined with the supporting 48-week results in treatment-naïve patients, as well as accumulating in vitro data [Kobayashi, 2011; m5.3.5.4, 2011N114191_00] show that DTG possesses a higher barrier to resistance thanother INIs and RTIs.
Conclusions:
DTG exhibits a higher barrier to treatment failure than RAL.
In a prespecified analysis, there was a statistically significant difference in favor of DTG for the proportion of subjects who failed therapy with evidence of INI Resistance through Week 24.
A unique IN substitution was observed (R263K or R263R/K mixture) in the 2 subjects with treatment emergent resistance on DTG that conferred little change in susceptibility to DTG and to RAL.
4.2.1.3. Studies of Treatment-Experienced (Integrase Inhibitor Resistant) Subjects
Protocol-defined virologic failure (PDVF) was observed in 19% of subjects enrolled in ING112574, the majority of whom harboured Q148 pathway virus at Baseline. Highest DTG FC was observed in virus harbouring Q148+2 additional IN mutations however this subgroup was represented in only 11% of the enrolled population. Good short term and long term responses were seen in subjects with 143/155/66 mutations or historic evidence of IN resistance which make up the majority of RAL resistant virual isolateslower response rates were observed in virus harbouring Q148/G140 dual mutations.
4.2.1.3.1. ING112574
Study Title: A Phase III study to demonstrate the antiviral activity and safety of dolutegravir in HIV-1 infected adult subjects with treatment failure on an integrase inhibitor containing regimen (ING112574 – Week 24 results)
Location of Report: 5.3.5.2
Study Design: Study ING112574 is a multicenter, single arm, open-label study to assess the antiviral activity and safety of a DTG containing regimen in HIV-1 infected, ART-experienced adults who experienced virologic failure on an INI containing regimen with historical or current evidence of genotypic and/or phenotypic resistance to RAL or EVG. All subjects received 50 mg DTG twice daily alongside their current failing background therapy for 7 days then transferred to DTG with an optimised background therapy (OBR) from Day 8 (OBR included at least one active drug). Subjects who completed 24 weeks

CONFIDENTIALModule 2.7.2.4 Special Studies
76
on the optimised treatment phase continue to have access to DTG, where feasible as per protocol. Antiviral activity, safety and tolerability of DTG were evaluated at Day 8 andover time. 200 subjects were planned and 183 subjects were enrolled. 155 subjects remained ongoing at the time of this analysis. This report will focus on efficacy data through Day 8 for all subjects enrolled and through 24 weeks for the initial 114 subjects enrolled to address the primary objective.
Virologic failure at Day 8 was based on a single plasma HIV-1 RNA evaluation at Day 8 and did not require confirmation. During the Optimised Phase, virologic non-response was defined as a decrease in plasma HIV-1 RNA of less than 1 log10 c/mL by Week 16, with subsequent confirmation, unless plasma HIV-1 RNA is <400 c/mL.or confirmedplasma HIV-1 RNA levels 400 c/mL on or after Week 24. Virologic rebound was defined as confirmed rebound in plasma HIV-1 RNA levels to 400 c/mL after prior confirmed suppression to <400 c/mL or confirmed plasma HIV-1 RNA levels >1 log10 c/mL above the nadir value where nadir is 400 c/mL.
All subjects had genotypic and phenotypic resistance testing at Baseline to conduct analyses of response by Baseline resistance. Subjects with confirmed virologic failure had genotypic and phenotypic testing performed on the sample collected at time of suspected virologic failure. Additional genotypic and phenotypic testing was conducted on subjects at Day 8 (virus with HIV-1 RNA 150c/mL), at last timepoint on treatment (for subjects with HIV-1 RNA >400 and >12 weeks form last resistance testing), and for patient management during the optimized phase of the study.
Results:
Prevalence of IN substitutions
The ITT-E population of ING112574 (N=183) showed diverse IN resistance patternswith proportions of each IN mutational pathway similar to those detected in earlier studies evaluating raltegravir [Garrido, 2012].
Of the 183 subjects enrolled, 57/183 (31%) harboured virus with a mutation at Q148 at Baseline. Virus with mutations at position148 has shown moderate to high DTG FC and as such is important for the evaluation of DTG. At position 148 mutations Q148H(n=46), Q148R (n=11), Q148K (n=1) and Q148N (n=2) were detected as full mutations or as mixtures. The Q148N substitution is not a recognized IN resistance mutation. In this study the Q148N was only seen as a minor variant in a population of virus with Q148H present suggesting it may have only a small contribution to the phenotype of the virus.
In the study 15% of subjects harboured Y143 mutations at Day 1. At position Y143mutations Y143C (n=7), Y143R (n=23) and Y143H (n=1). The virus harbouring Y143H also had Q148H present. This mutational profile was seen in previous studies investigating DTG (m5.3.5.1 ING112961 Week 48 CSR) and in general was associated with a good antiviral response.
As well as those mutations noted above, the study also enrolled 18% of subjects with N155H. Both the N155H and Q148 mutations are clinically relevant resistance

CONFIDENTIALModule 2.7.2.4 Special Studies
77
associated mutations for EVG and therefore the population enrolled allowed adequate evaluation of DTG in virus with reduced susceptibility to EVG. Two additional EVG associated mutations T66A/I/K and E92Q were detected in few subjects. E92Q was detected in only 2 Baseline viruses and in each case seen with another IN primary mutation. The T66 mutations were noted in 4 subjects but only one subject (Subject 481)had this mutation detected with no other IN primary mutation and this subject had no prior exposure to EVG. All subjects with the detection of either E92Q or T66A/I/K had prior exposure to only RAL.
Table 58 Summary of Number of Subjects Per IN Mutation Category
Number of subjects with IN mutation category
ITT-E Week 24 ITT-E
50 mg DTG BIDN = 183, n (%)
50 mg DTG BIDN = 114, n/N (%)
Q148+1 32 (17) 20 (18)Q148+2 21 (11) 12 (11)N155 33 (18) 21 (18)Y143 28 (15) 15 (13)
T66 1 (<1) 1 (<1)
2 Primary mutations 8 (4) 5 (4)
Primary not detected 60 (33) 40 (35)
Data Source: m5.3.5.2 ING112574 Week 24 CSR Table 12.9 and Table 12.64
In vitro and prior clinical investigations of DTG have shown specific IN primary mutations (specifically Q148 mutations) impact DTG FC. The numbers of IN resistance-associated mutations when present with Q148 mutations are also associated with elevated DTG FC and protocol-defined virologic failure (Kobayashi, 2011; Vavro, 2012,m5.3.5.4, 2011N114191_00, m5.3.5.2, 2012N145179_00). The table below (Table 59) provides the proportion of subjects enrolled in ING112574 by the number of INresistance-associated mutations. Of the 183 subjects enrolled, 62/183 (34%) have 3 or more IN resistance-associated mutations.
Table 59 Summary of Number of Baseline Pre-specified IN Mutations
Number of subjects with 0, 1, 2, 3,4 and 5 pre-specified primary or secondary mutations
ITT-E Week 24 ITT-E
50 mg DTG BIDN = 183, n (%)
50 mg DTG BIDN = 114, n (%)
0 mutations 47 (26) 33 (29)1 17 (9) 10 (9)2 57 (31) 31 (27)3 34 (19) 23 (20)4 20 (11) 12 (11)5 8 (4) 5(4)Data Source: ING112574 Week 24 CSR Table 12.8 and Table 12.63

CONFIDENTIALModule 2.7.2.4 Special Studies
78
Phenotypic susceptibilities to INIs at Day 1
Limited cross resistance to RAL was seen in the study population with the median DTG FC of 1.29 (0.45, 37) vs. RAL with a median FC of 47 (0.49, 127) and only 9% of subjects had virus with DTG FC of >10 (Table 60). Thirty-one percent of subjects enrolled have a RAL FC of <1.5 as determined by the population-based phenotypic measure of susceptibility. This result is associated with virus that has documented historic evidence of INI resistance only. At the time this study was conducted, EVG was not approved and thus no measure of EVG FC could be produced. IN genotype and IN phenotype are correlated in that Y143 and N155 mutants have lower DTG FC and the highest DTG FC was seen in subjects with Q148 +2 (Table 78).
Table 60 Fold Change in IC50 to DTG and RAL
Drug FC compared to wild type virus
ITT-E Week 24 ITT-E50 mg DTG BID
N=183n (%)
50 mg DTG BIDN=114n (%)
DTG n 176 1100 to 2.5 122 (67) 78 (68)
>2.5 to 4 13 (7) 8 (7)>4 to 8 22 (12) 11 (10)
>8 to 10 4 (2) 4 (4)>10 to 15 8 (4) 5 (4)>15 to 20 3 (2) 3 (3)>20 to 25 1 (<1) 0
>25 3 (2) 1 (<1)DTG Median (range) [IQR] 1.29 (0.45, 37.00) 1.29 (0.47, 37.00)RAL n 176 110
0 to 1.5 56 (31) 38 (33)>1.5 to 4 6 (3) 3 (3)>4 to 8 2 (1) 1 (<1)
>8 to 10 0 0>10 to 20 10 (5) 7 (6)
>20 to maximum of assay limit
26 (14) 15 (13)
>maximum of assay limit
76 (42) 46 (40)
RAL Median (range) [IQR] 47.50 (0.49, 127.00) 40.50 (0.68, 127.00)Data Source: ING112574 Week 24 CSR Table 12.42 and Table 12.60
CONFIDENTIALModule 2.7.2.4 Special Studies
79
Change from baseline in plasma HIV-1 RNA at Day 8 by presence of IN resistance mutations
Day 8 response for the virologic outcome (VO) population (N=177, which consisted of all subjects in the ITT-E population excluding subjects who received incorrect IP, had IP interruption, received a prohibited medication, or discontinued IP prior to the analysis timepoint for a reason other than lack of efficacy) was good with a median change from Baseline in HIV-1 RNA of 1.4 log10 c/mL (95% CO 1.3 -1.5 log10 c/mL). . In Table 61below, short term responses are provided by predefined primary mutations in IN and compared to wildtype for a given codon. IN mutations at codon 143 or 155 had no impact on short term antiviral activity of DTG. However, mutations at codon 148 demonstrated a statistically significantly reduced short term response (p-value <0.001). With regards to specific substitutions at codon 148, Q148H had the greatest impact on response followed by Q148R as was predicted by in vitro characterization of DTG.
Few subjects harboured mutations at positions T66 and E92 and in all but one subject they were seen with other IN primary mutations. As such no conclusions can be drawn with respect to mutations at these two sites and short term antiviral response, although most viruses with these mutations showed a strong response at Day 8, except for one subject harbouring virus mutation T66A, which also had the 148 mutation.

CONFIDENTIALModule 2.7.2.4 Special Studies
80
Table 61 Summary of Change from Baseline in Plasma HIV-1 RNA log10 c/mLat Day 8 by Baseline Primary IN Resistance Mutation (LOCFDB, VO)
Codon Mutation TotalN=177
P-value
n Mean (SE)Q148 Wild type or non-resistance mutation 122 -1.591 (0.0461) -
Any resistance mutation 55 -1.086 (0.0870) <0.001AnyQ148H 46 -1.065 (0.0912) <0.001AnyQ148R 9 -1.194 (0.2678) 0.033Q148H 42 -1.041 (0.0969) <0.001Q148N/H 1 -1.678 (0) 0.865Q148Q/H 2 -1.071 (0.5061) 0.156Q148Q/N/K/H 1 -1.443 (0) 0.772Q148Q/R 2 -1.150 (0.3699) 0.226Q148R 7 -1.207 (0.3410) 0.067
Y143 Wild type or non-resistance mutation 146 -1.386 (0.0510) -Any resistance mutation 31 -1.661 (0.0834) 0.020Y143C 7 -1.586 (0.1281) 0.397Y143H 1 -2.108 (0) 0.246Y143R 23 -1.664 (0.1046) 0.042
E92 Wild type or non-resistance mutation 175 -1.426 (0.0452) -Any resistance mutation 2 -2.175 (0.2760) 0.079Any E92Q 2 -2.175 (0.2760) 0.079E92E/Q 1 -1.899 (0) 0.431
E92Q 1 -2.451 (0) 0.089
T66 Wild type or non-resistance mutation 173 -1.438 (0.0456) -Any resistance mutation 4 -1.260 (0.3527) 0.558Any T66A 2 -0.879 (0.6408) 0.193T66A 1 -0.238 (0) 0.048T66K 1 -1.428 (0) 0.986T66T/A 1 -1.520 (0) 0.893T66T/I 1 -1.854 (0) 0.491
N155 Wild type or non-resistance mutation 144 -1.422 (0.0513) -
Any resistance mutation 33 -1.489 (0.0936) 0.563AnyN155H 33 -1.489 (0.0936) 0.563N155H 28 -1.519 (0.1056) 0.441N155N/H 5 -1.324 (0.1810) 0.725
Note: p-values at each mutation are from a t-test of the difference between all subjects with that mutation and all subjects with wild type or non-resistance mutationData Source: ING112574 Week 24 CSR Table 12.15
The table below provides results to address the impact of additional IN resistance mutations seen with the Q148 on short term response. When additional IN resistance-
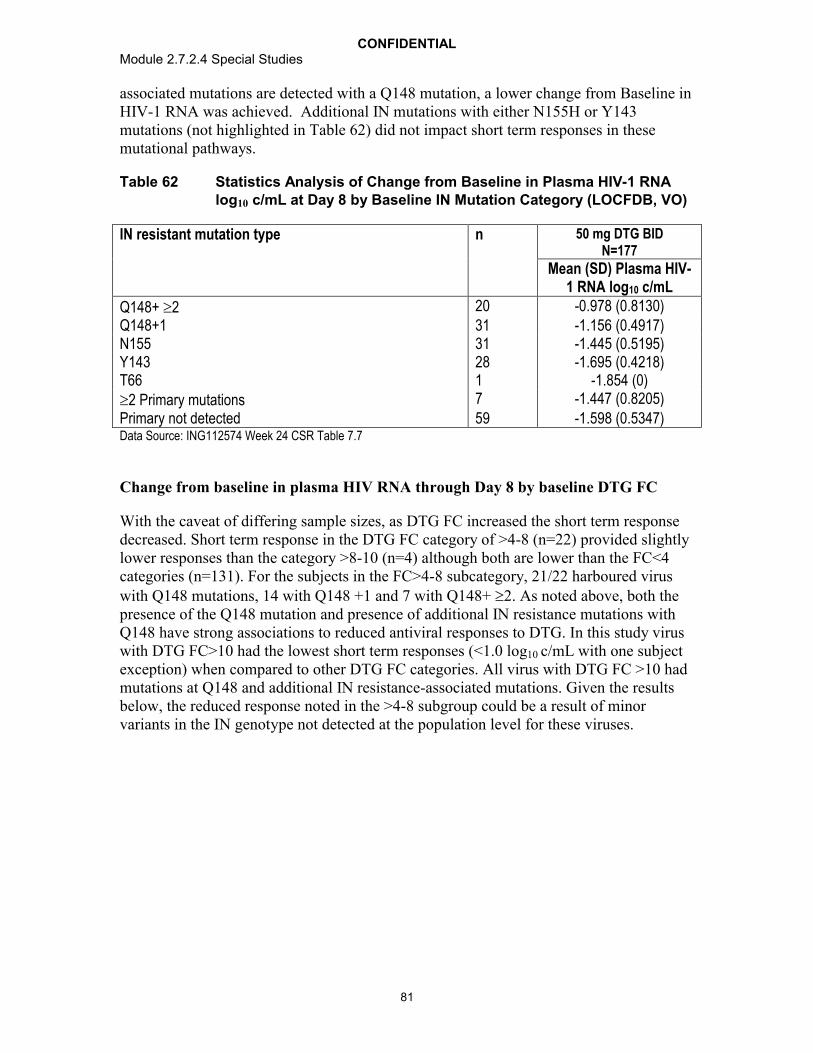
CONFIDENTIALModule 2.7.2.4 Special Studies
81
associated mutations are detected with a Q148 mutation, a lower change from Baseline in HIV-1 RNA was achieved. Additional IN mutations with either N155H or Y143 mutations (not highlighted in Table 62) did not impact short term responses in these mutational pathways.
Table 62 Statistics Analysis of Change from Baseline in Plasma HIV-1 RNA log10 c/mL at Day 8 by Baseline IN Mutation Category (LOCFDB, VO)
IN resistant mutation type n 50 mg DTG BIDN=177
Mean (SD) Plasma HIV-1 RNA log10 c/mL
Q148+ 2 20 -0.978 (0.8130)Q148+1 31 -1.156 (0.4917)N155 31 -1.445 (0.5195)Y143 28 -1.695 (0.4218)T66 1 -1.854 (0)2 Primary mutations 7 -1.447 (0.8205)Primary not detected 59 -1.598 (0.5347)Data Source: ING112574 Week 24 CSR Table 7.7
Change from baseline in plasma HIV RNA through Day 8 by baseline DTG FC
With the caveat of differing sample sizes, as DTG FC increased the short term response decreased. Short term response in the DTG FC category of >4-8 (n=22) provided slightly lower responses than the category >8-10 (n=4) although both are lower than the FC<4 categories (n=131). For the subjects in the FC>4-8 subcategory, 21/22 harboured virus with Q148 mutations, 14 with Q148 +1 and 7 with Q148+ 2. As noted above, both the presence of the Q148 mutation and presence of additional IN resistance mutations with Q148 have strong associations to reduced antiviral responses to DTG. In this study virus with DTG FC>10 had the lowest short term responses (<1.0 log10 c/mL with one subject exception) when compared to other DTG FC categories. All virus with DTG FC >10 had mutations at Q148 and additional IN resistance-associated mutations. Given the results below, the reduced response noted in the >4-8 subgroup could be a result of minor variants in the IN genotype not detected at the population level for these viruses.

CONFIDENTIALModule 2.7.2.4 Special Studies
82
Table 63 Statistics Analysis of Change from Baseline in Plasma HIV-1 RNA log10 c/mL at Day 8 by Baseline DTG FC Category (LOCFDB, VO)
Baseline DTG FC subcategories n 50 mg DTG BIDN=114
Mean (SD) Plasma HIV-1 RNA log10 c/mL0 to 2.5, 119 -1.598 (0.5123)>2.5 to 4, 12 -1.438 (0.5547)>4 to 8, 22 -1.042 (0.5700)>8 to 10, 4 -1.235 (0.6648)>10 to 15, 7 -0.858 (0.7094)>15 to 20, 3 -0.902 (1.0613)>20 to 25 1 -1.405 (0)>25 3 -0.152 (0.2637)Missing 6 -1.333 (0.3808)Data Source: ING112574 Week 24 CSR Table 7.7
Proportion of subjects with less than 50 c/mL HIV-1 RNA at Week 24 by presence of IN resistance mutations
Through Week 24 the proportion of subjects with <50 c/mL in the Virologic Outcome population was 63%. Subjects harbouring virus with mutations at codon 143 or 155 had greater proportions of subjects with <50 c/mL at Week 24 as compared with the full population, however, mutations at codon 148 demonstrate a statistically significantreduced long term response (p-value <0.001). With regards to specific substitutions at codon 148, Q148H had the greatest impact on response. Other mutations at codon 148 were detected in too few subjects to provide a meaningful conclusion.

CONFIDENTIALModule 2.7.2.4 Special Studies
83
Table 64 Proportion of Subjects with Plasma HIV-1 RNA below 50 c/mL at Week 24 by Baseline IN Resistance Mutation (MSDF, VO)
DTG 50 mg BIDCodon N Mutation % <50 c/mL at
Week 24(N=101)n/N (%)
P-value
Q148 101 Wild type or non-resistance mutation
57/72 (79) -
Any resistance mutation 10/29 (34) <0.001 Any Q148H 8/25 (32) <0.001 Any Q148R 2/4 (50) 0.214 Q148H 7/23 (30) <0.001 Q148N/H 1/1 (100) >0.999 Q148Q/H 0/1 0.219 Q148Q/R 1/2 (50) 0.388 Q148R 1/2 (50) 0.388
N155 101 Wild type or non-resistance mutation
50/81 (62) -
Any resistance mutation 17/20 (85) 0.064Any N155H 17/20 (85) 0.064 N155H 16/19 (84) 0.104 N155N/H 1/1 (100) >0.999
T66 101 Wild type or non-resistance mutation
64/98 (65) -
Any resistance mutation 3/3 (100) 0.549 T66K 1/1 (100) >0.999 T66T/A 1/1 (100) >0.999 T66T/I 1/1 (100) >0.999
Y143 101 Wild type or non-resistance mutation
56/85 (66) >0.999
Any resistance mutation 11/16 (69) >0.999 Y143C 4/4 (100) 0.299 Y143R 7/12 (58) 0.748
Note: p-values at each mutation are from a Fisher's exact test comparing the proportion of responders withthat mutation and the proportion of responders with wild type or non-resistance mutation.Data Source: ING112574 Week 24 CSR Table 12.16
IN genotypic and phenotypic correlates to antiviral response at Week 24 were similar to those identified in short term responses at Day 8 (Table 61 and Table 63). Virus with the presence of mutation at Q148 and virus with additional IN resistance-associated mutations with Q148 had lower Week 24 responses than those harbouring N155 or Y143 mutations. As DTG FC increased, Week 24 responses decreased and no subject with DTG FC >10 achieved <50 c/mL by Week 24 (as per VO population analysis).

CONFIDENTIALModule 2.7.2.4 Special Studies
84
Paired analysis of Day 1 and Day 8 IN genotype and phenotype results
Of the 183 subjects enrolled in ING112574, 124/183(%) had HIV-1 RNA 150 c/mL at Day 8 and were sent for IN genotypic and phenotypic testing. Of these, 111 had paired Day 1 and Day 8 samples to examine IN treatment emergent genotypic and/or phenotypic changes. In only 13/111 (12%) subjects was treatment emergent IN genotypic resistance identified and only two viruses (Subjects 10 and 1844) had a 2-fold increase in DTG FC from Day 1 to Day 8. In all but 2 of the 13 subjects with treatment emergent IN genotypic resistance, IN resistance associated mutations detected were mixtures of wildtype and mutant. All treatment-emergent mutations detected were well characterized RAL and/or EVG IN resistance associated mutations. One subject (Subject 1844) had phenotypic but no genotypic evidence of resistance evolution. These data demonstrate minimal evolution in IN during the eight-day functional monotherapy phase of DTG clinical investigation.

CONFIDENTIALModule 2.7.2.4 Special Studies
85
Table 65 Summary of Subjects with Paired Day 1 and Day 8 IN Genotype and Phenotype Exhibiting Genotypic and/or Phenotypic Changes
SubjectINI
Mutational Group
OSS for failing background ART
HIV-1RNA
at Day 1(c/mL)
HIV-1 RNA Change
from Day 1
RAL-associated Resistance Mutation DTG FCa
Day 1 Day 8 Day 8 Treatment Emergent Mutations
Day 1 Day 8
10 Q148+1 1 9224 -0.78 L74L/I/M, Q148Q/R L74I, G140A, Q148R G140A 0.72 23.0015 Q148+2 1 25488 -0.41 E138E/T/K/A,
G140S, Q148HE138E/T/K/A,
G140S, Q148H, E157E/Q
E157E/Q 13.00 16.00
221 Q148+1 2 56686 -0.49 G140S, Q148H T97T/A, G140S, Q148H
T97T/A 9.15 9.86
231 Q148+1 0 11817 -0.69 G140S, Q148H T97T/A, G140S, Q148H
T97T/A 5.28 8.59
565 Y143 0 40741 -1.30 L74I, T97A, Y143R L74I, T97A, Y143R, G163G/R
G163G/R 1.05 1.07
566 Q148+2 1 195737 -2.08 E138T, G140S, Q148H
E138K/T, G140S, Q148H
E138K/T 10.00 7.43
582 Y143 0 13152 -1.69 L74M, T97A, Y143R L74I, T97A, Y143R L74I 1.15 0.911001 Primary not
detected0 170395 -1.86 None G140G/S, Q148Q/H G140G/S, Q148Q/H 1.05 1.21
1004 Q148+1 0 17547 -1.11 G140S, Q148H E138E/K, G140S, Q148H
E138E/K 5.24 5.29
1065 Primary not detected
1 282206 -1.89 L74I L74I, E157E/Q E157E/Q 1.30 1.36
1243 Primary not detected
1 171547 -1.40 G140G/S G140G/S, Q148Q/H Q148Q/H 1.05 1.79
1264 Q148+2 1 74097 -0.56 E138E/A, G140G/S, Q148Q/H, G193E
E138E/T/K/A, G140G/S, Q148Q/H,
G193E
E138E/T/K/A 4.35 6.43
1273 Primary not detected
0 50738 -1.21 T97A T97A, G163G/R G163G/R 0.66 0.65
1844 Q148+1 0 716 -0.73 G140S, Q148H G140S, Q148H None 3.44 7.58Data Source: ING112574 Week 24 CSR Table 12.56

CONFIDENTIALModule 2.7.2.4 Special Studies
86
Genotype and phenotype analysis of virus at PDVF
At the interim data reporting, 35/183 (19%) subjects enrolled met the criteria for protocol-defined virologic failure. Of the 35 subjects with protocol-defined virologicfailure, 31/35 had paired Baseline and time point of virologic failure samples for evaluation of treatment-emergent resistance.
IN genotypic and phenotypic results at time of virologic failure
Table 66 provides the summary by visit of protocol defined virologic failure for the Week 24 ITT-E population (n=114) through Week 24 (n=26). Table 68 describes specific IN genotypic and phenotypic results for each of the 26 subjects with PDVF in the Week 24 ITT-E population. For the ITT-E population (N=183), 35 subjects met PDVF on study, 9 of whom were identified either post Week 24 (from the ITT-E Week 24 population) or from the full study population (not yet reaching Week 24 at time of data cut-off). Treatment-emergent IN resistance was detected at PDVF for two subjects and each had a mutation at Q148 at Baseline. These subjects are summarised in Table 69below.
Table 66 Summary (cumulative) of Protocol-Defined Virologic Failures by Visit (Week 24 ITT-E)
Visit 50 mg DTG BIDN=114n (%)
Day 8 9 (8)Virologic non-response 9 (8)Week 4 10 (9) Virologic non-response 9 (8) Virologic rebound 1 (<1)Week 8 14 (12) Virologic non-response 9 (8) Virologic rebound 5 (4)Week 12 17 (15) Virologic non-response 9 (8) Virologic rebound 8 (7)Week 16 21 (18) Virologic non-response 11 (10) Virologic rebound 10 (9)Week 24 26 (23)
Virologic non-response 13 (11) Virologic rebound 13 (11)Data Source: ING112574 Week 24 CSR Table 7.9
For the 31 subjects with PDVF and paired samples for analysis, 22/31 had virus with Q148 mutations and 2 or more additional IN resistance-associated mutations present at Baseline. The proportion of subjects with this IN genotype was higher for PDVF when compared with the full study population (Table 67).

CONFIDENTIALModule 2.7.2.4 Special Studies
87
Table 67 Summary of Virus with Q148+ Additional IN Secondary Mutations in PDVF
ING112574DTG 50 mg BID
(N=183)
ING112574DTG 50 mg BID
(N=31)
IN Mutation Category Baseline PDVF
Q148+2 21 (11%) 16 (52%)
2 Primary mutations 8 (4%)a 7 (23%)b
a. 4 subjects with Q148+≥ 2 with T66 or Y143 mutationsb. 6 subjects with Q148+≥ 2 with N155, E92, Y143, or T66 mutations Data Source: ING112574 Week 24 CSR Table 12.9 and Table 12.23
For the 26/114 (23%) subjects of the Week 24 ITT-E population who met protocol-defined virologic failure through Week 24, 16 had a Q148 mutation detected in the Baseline IN genotype. Of the remaining 10 subjects, 2 subjects had N155H and 8 subjects had no primary detected at Baseline. Of the 26 subjects with PDVF, 25 had paired Baseline and PDVF resistance data for analysis and 13 (52%) had treatment-emergent IN resistance at the time point of virologic failure. For 11/13 subjects with treatment-emergent IN resistance detected at PDVF, a mutation at Q148 was seen at Baseline or historic.
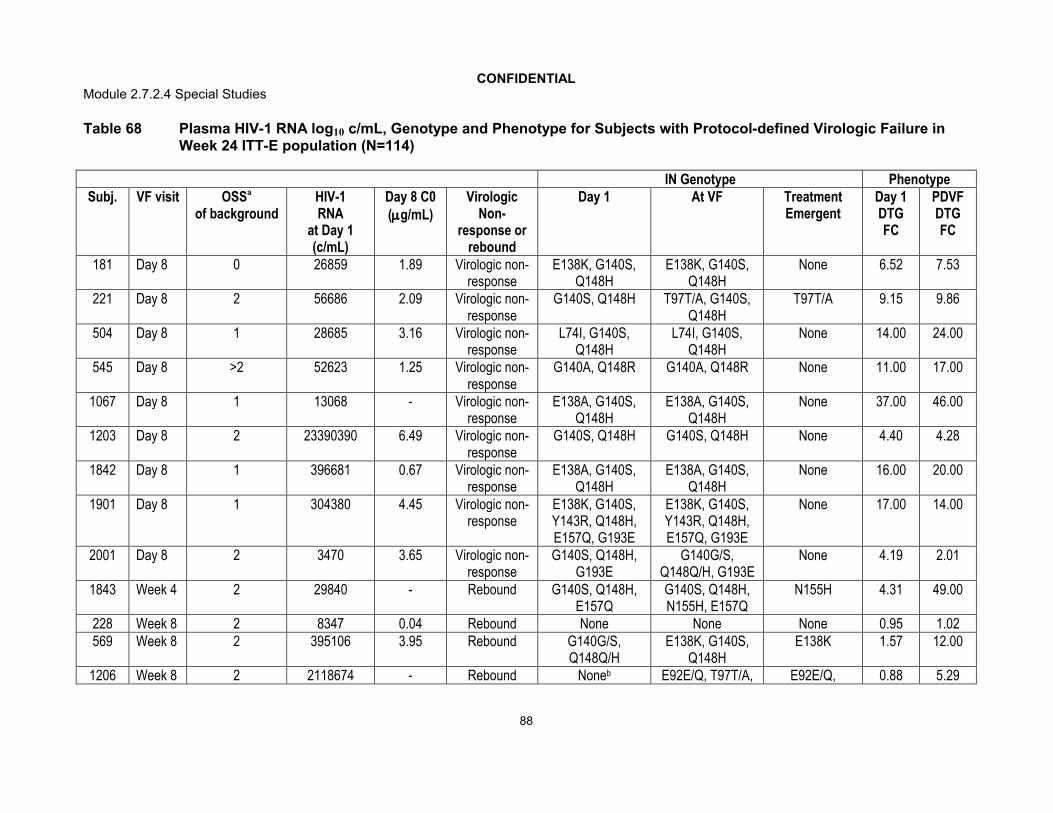
CONFIDENTIALModule 2.7.2.4 Special Studies
88
Table 68 Plasma HIV-1 RNA log10 c/mL, Genotype and Phenotype for Subjects with Protocol-defined Virologic Failure in Week 24 ITT-E population (N=114)
IN Genotype PhenotypeSubj. VF visit OSSa
of backgroundHIV-1RNA
at Day 1(c/mL)
Day 8 C0(g/mL)
VirologicNon-
response or rebound
Day 1 At VF Treatment Emergent
Day 1DTG FC
PDVFDTG FC
181 Day 8 0 26859 1.89 Virologic non-response
E138K, G140S, Q148H
E138K, G140S, Q148H
None 6.52 7.53
221 Day 8 2 56686 2.09 Virologic non-response
G140S, Q148H T97T/A, G140S, Q148H
T97T/A 9.15 9.86
504 Day 8 1 28685 3.16 Virologic non-response
L74I, G140S, Q148H
L74I, G140S, Q148H
None 14.00 24.00
545 Day 8 >2 52623 1.25 Virologic non-response
G140A, Q148R G140A, Q148R None 11.00 17.00
1067 Day 8 1 13068 - Virologic non-response
E138A, G140S, Q148H
E138A, G140S, Q148H
None 37.00 46.00
1203 Day 8 2 23390390 6.49 Virologic non-response
G140S, Q148H G140S, Q148H None 4.40 4.28
1842 Day 8 1 396681 0.67 Virologic non-response
E138A, G140S, Q148H
E138A, G140S, Q148H
None 16.00 20.00
1901 Day 8 1 304380 4.45 Virologic non-response
E138K, G140S, Y143R, Q148H, E157Q, G193E
E138K, G140S, Y143R, Q148H, E157Q, G193E
None 17.00 14.00
2001 Day 8 2 3470 3.65 Virologic non-response
G140S, Q148H, G193E
G140G/S, Q148Q/H, G193E
None 4.19 2.01
1843 Week 4 2 29840 - Rebound G140S, Q148H, E157Q
G140S, Q148H, N155H, E157Q
N155H 4.31 49.00
228 Week 8 2 8347 0.04 Rebound None None None 0.95 1.02569 Week 8 2 395106 3.95 Rebound G140G/S,
Q148Q/HE138K, G140S,
Q148HE138K 1.57 12.00
1206 Week 8 2 2118674 - Rebound Noneb E92E/Q, T97T/A, E92E/Q, 0.88 5.29
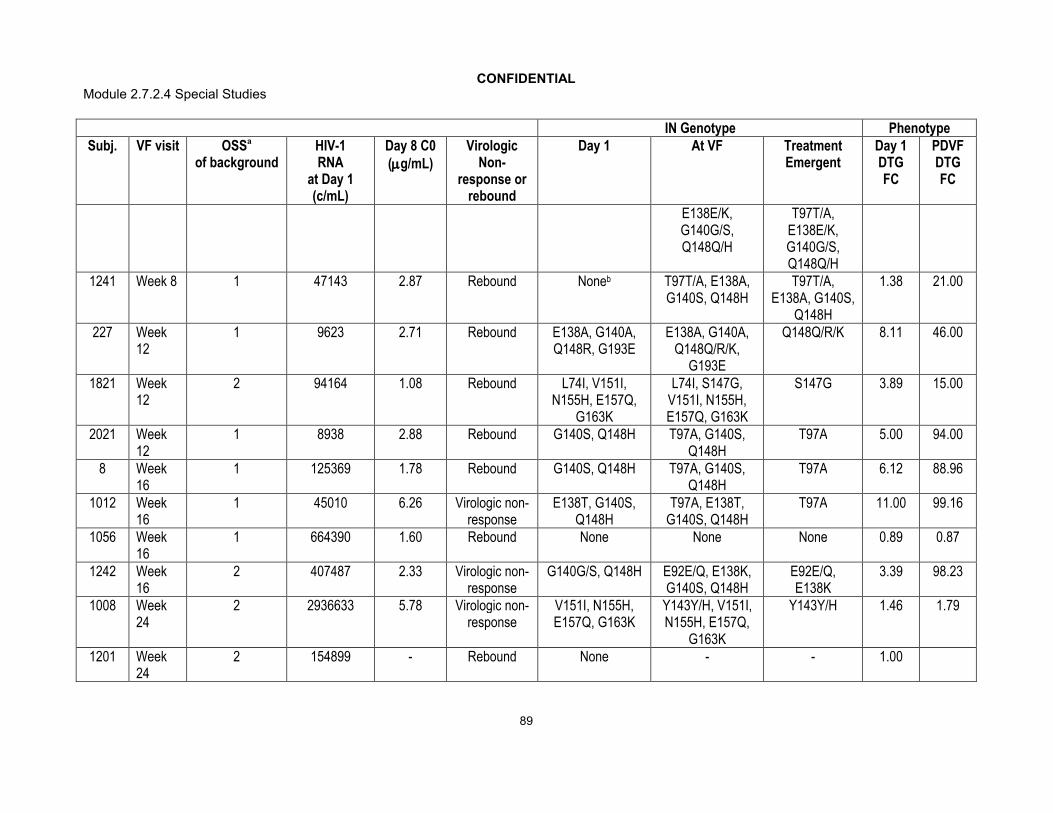
CONFIDENTIALModule 2.7.2.4 Special Studies
89
IN Genotype PhenotypeSubj. VF visit OSSa
of backgroundHIV-1RNA
at Day 1(c/mL)
Day 8 C0(g/mL)
VirologicNon-
response or rebound
Day 1 At VF Treatment Emergent
Day 1DTG FC
PDVFDTG FC
E138E/K, G140G/S, Q148Q/H
T97T/A, E138E/K, G140G/S, Q148Q/H
1241 Week 8 1 47143 2.87 Rebound Noneb T97T/A, E138A, G140S, Q148H
T97T/A, E138A, G140S,
Q148H
1.38 21.00
227 Week 12
1 9623 2.71 Rebound E138A, G140A, Q148R, G193E
E138A, G140A, Q148Q/R/K,
G193E
Q148Q/R/K 8.11 46.00
1821 Week 12
2 94164 1.08 Rebound L74I, V151I, N155H, E157Q,
G163K
L74I, S147G, V151I, N155H, E157Q, G163K
S147G 3.89 15.00
2021 Week 12
1 8938 2.88 Rebound G140S, Q148H T97A, G140S, Q148H
T97A 5.00 94.00
8 Week 16
1 125369 1.78 Rebound G140S, Q148H T97A, G140S, Q148H
T97A 6.12 88.96
1012 Week 16
1 45010 6.26 Virologic non-response
E138T, G140S, Q148H
T97A, E138T, G140S, Q148H
T97A 11.00 99.16
1056 Week 16
1 664390 1.60 Rebound None None None 0.89 0.87
1242 Week 16
2 407487 2.33 Virologic non-response
G140G/S, Q148H E92E/Q, E138K, G140S, Q148H
E92E/Q, E138K
3.39 98.23
1008 Week 24
2 2936633 5.78 Virologic non-response
V151I, N155H, E157Q, G163K
Y143Y/H, V151I, N155H, E157Q,
G163K
Y143Y/H 1.46 1.79
1201 Week 24
2 154899 - Rebound None - - 1.00

CONFIDENTIALModule 2.7.2.4 Special Studies
90
IN Genotype PhenotypeSubj. VF visit OSSa
of backgroundHIV-1RNA
at Day 1(c/mL)
Day 8 C0(g/mL)
VirologicNon-
response or rebound
Day 1 At VF Treatment Emergent
Day 1DTG FC
PDVFDTG FC
1214 Week 24
2 14830 0.65 Rebound None None None 0.84 0.90
1243 Week 24
1 171547 3.67 Rebound G140G/Sb E138E/K, G140G/S, Q148Q/H
E138E/K, Q148Q/H
1.05 4.27
1274 Week 24
>2 633135 3.60 Virologic non-response
None None None 0.91 1.04
a. OSS at time of protocol defined virologic failure (VF)b. Historic evidence of Q148 mutation for this virusData Source: ING112574 Week 24 CSR Table 12.55

CONFIDENTIALModule 2.7.2.4 Special Studies
91
Table 69 Plasma HIV-1 RNA log10 c/mL, Genotype and Phenotype for 9 Additional Subjects with Protocol-Defined VirologicFailure from ITT-E Population (N=183)
IN Genotype Phenotype
Subj. VF visit OSSa
of background
HIV-1RNA
at Day 1(c/mL)
Day 8 C0(g/mL)
VirologicNon-
response or rebound
Day 1 At VF Treatment Emergent
Day 1DTG FC
PDVFDTG FC
15 Day 8 2 25488 - Virologicanon-
response
E138E/T/K/A, G140S, Q148H
E138E/T/K/A, G140S, Q148H,
E157E/Q
E157E/Q 13.00 16.00
585 Day 8 1 10426 3.62 Virologicnon-
response
L74I/M, T97T/A, E138E/K, G140G/A, S147S/G, Q148R,
V151V/I/M
L74M, G140A, Q148R
None 34.00 64.00
1806 Day 8 2 13130 2.38 Virologicnon-
response
E138A, G140S, Q148H
E138A, G140S, Q148H
None 11.00 15.00
1964 Day 8 2 7430 4.34 Virologicnon-
response
T66A, L74I, E138K, S147G, Q148R, G163R
T66A, L74I, E138K, S147G, Q148R, G163R
None 27.00 36.00
1090 Week 4
0 293311 0.91 Rebound L74I, T97A, E138E/T/K/A,
Y143R, E157E/Q
- - 1.43
1219 Week 8
>2 1218 5.12 Rebound T97A, Y143R - - 0.81
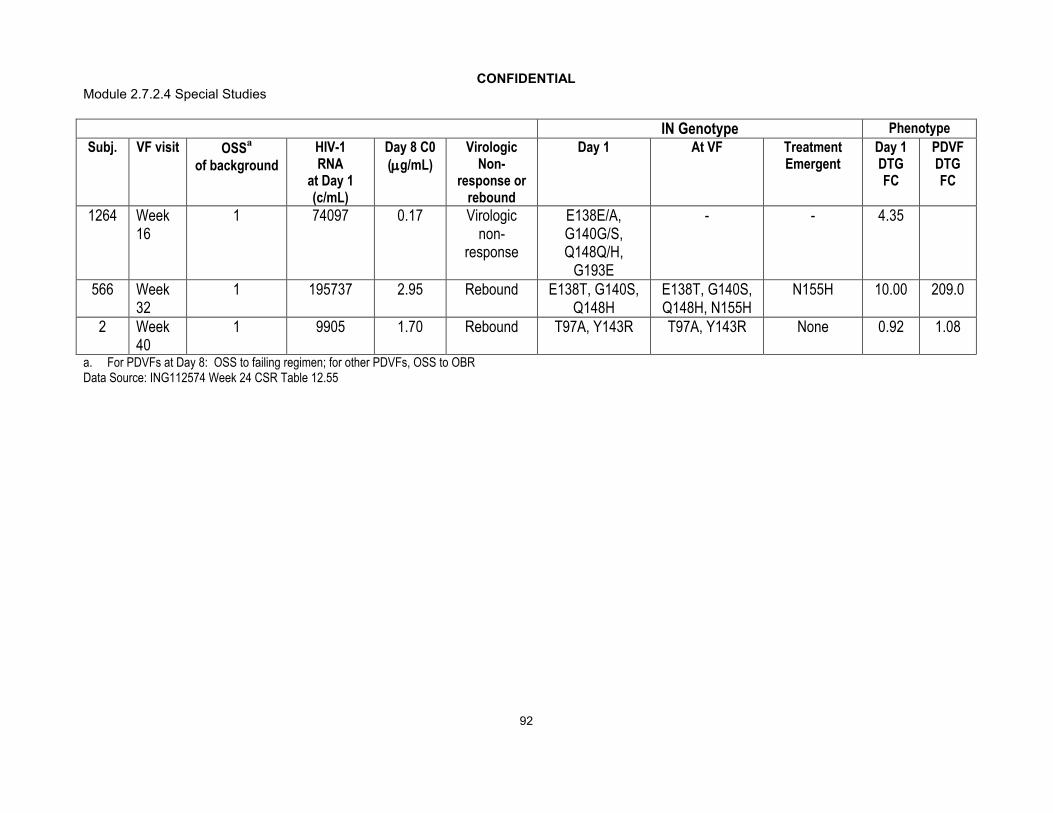
CONFIDENTIALModule 2.7.2.4 Special Studies
92
IN Genotype Phenotype
Subj. VF visit OSSa
of background
HIV-1RNA
at Day 1(c/mL)
Day 8 C0(g/mL)
VirologicNon-
response or rebound
Day 1 At VF Treatment Emergent
Day 1DTG FC
PDVFDTG FC
1264 Week 16
1 74097 0.17 Virologicnon-
response
E138E/A, G140G/S, Q148Q/H,
G193E
- - 4.35
566 Week 32
1 195737 2.95 Rebound E138T, G140S, Q148H
E138T, G140S, Q148H, N155H
N155H 10.00 209.0
2 Week 40
1 9905 1.70 Rebound T97A, Y143R T97A, Y143R None 0.92 1.08
a. For PDVFs at Day 8: OSS to failing regimen; for other PDVFs, OSS to OBRData Source: ING112574 Week 24 CSR Table 12.55

CONFIDENTIALModule 2.7.2.4 Special Studies
93
Summary of treatment emergent resistance detected at PDVF
From the 35 subjects with PDVF in the ITT-E population (N=183), 31 subjects had paired Baseline and time of virologic failure samples. Of these, 15/31 had treatment-emergent mutations detected at virologic failure (Table 70). Treatment-emergent resistance was detected in virus harbouring a mutation at Q148 (at Baseline or historic) for 13/15 (87%) subjects. The most prevalent treatment- emergent mutations detected were IN resistance-associated secondary mutations that were added to a viral genotype with IN primary mutations present. All treatment-emergent mutations detected were well characterized RAL and/or EVG resistance associated mutations. Of note, 4 subjects had virus with treatment emergent mutations at position 148. Three of these subjects entered the study with only historic evidence of IN resistance and for all 3; the historic IN resistance provided was Q148H. A fourth subject with Q148R at Day 1 had a treatment emergent mixture of Q148Q/R/K at the time point of PDVF.
Table 70 Summary of Treatment- Emergent IN Genotypic Resistance Detected at PDVF
Codon Baseline IN Genotype
Treatment Emergent Mutation Detected
50 mg DTG BIDPDVF genotypic
PopN=31n (%)
Any - - 15 (48%)97 T97 T97A, T97T/A 6 (19%)138 E138 E138A, E138E/K, E138K 5 (16%)148 Q148 Q148H, Q148Q/H, Q148Q/R/K 4 (13%)92 E92 E92E/Q 2 (6%)140 G140 G140G/S, G140S 2 (6%)155 N155 N155H 2 (6%)157 E157 E157E/Q 1 (3%)147 S147 S147G 1 (3%)143 Y143 Y143Y/H 1 (3%)Data Source: ING112574 Week 24 CSR Table 12.27
For subjects meeting PDVF while on study, only 12/31(39%) had increases in DTG FC more than 2-fold of that detected at Baseline (Table 71). For all 12 subjects there was additional IN resistance associated mutations detected with the increased DTG FC.

CONFIDENTIALModule 2.7.2.4 Special Studies
94
Table 71 Summary of Treatment Emergent Increases in DTG FC in Subjects with PDVF (N=31)
50DTG FC Ratio of Baseline and PDVF time point
50 mg DTG BIDPDVF phenotypic Pop
N=31n (%)
N 31<1 4 (13)
1-<2 15 (48)2-<4 1 (3)4-<8 4 (13)8 7 (23)
Data Source: ING112574 Week 24 CSR 12.53
Summary of the IN genotype for the screening population
The screening population provides a good evaluation of the INI-resistant populationduring enrolment of this study. From these results we conclude that ~25% of subject experiencing virologic failure on a prior RAL or EVG treatment with IN resistance will have a Q148H mutation while the remaining 75% of subjects will harbour virus with Y143, N155, T66 or E92 mutations. Only 10% of subjects in the screening population harbour Q148 +2 additional mutations.
Table 72 Summary of Subjects Screened by IN Primary Mutation Categories
IN Primary mutation Category Screening Population with Genotypic Data at Screening
(N=323)n (%)
n 269N155 42 (16)Q148+1 36 (13)Y143 36 (13)Q148+2 26 (10)T66 1 (<1)E92 1 (<1)2 primary mutations 9 (3)Primary not detected 118 (44)Data Source: ING112574 Week 24 CSR Table 12.10
Summary of DTG and RAL FC for the screening population
The study screening population showed a low proportion of subjects with DTG FC>10 (~5%) however 76% of subjects potentially available for the study had DTG FC at <2.5. In this study, 80%of subjects with virus having DTG FC <2.5 achieved <50 c/mL
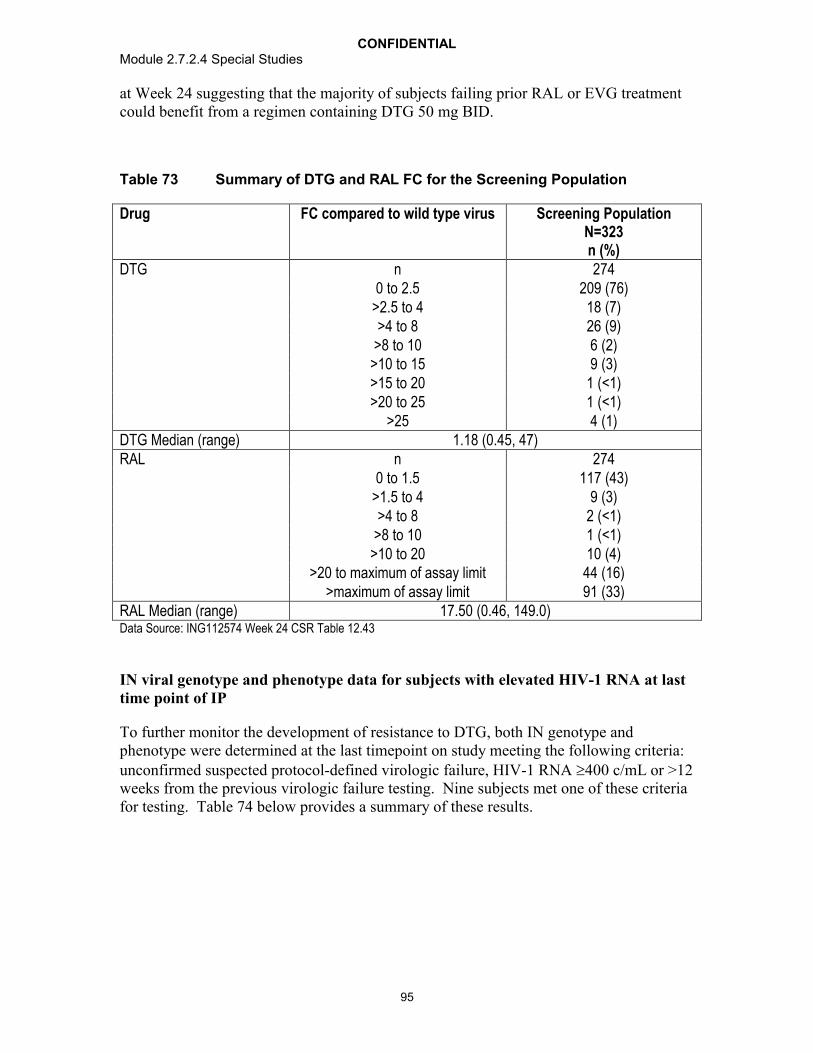
CONFIDENTIALModule 2.7.2.4 Special Studies
95
at Week 24 suggesting that the majority of subjects failing prior RAL or EVG treatment could benefit from a regimen containing DTG 50 mg BID.
Table 73 Summary of DTG and RAL FC for the Screening Population
Drug FC compared to wild type virus Screening PopulationN=323n (%)
DTG n 2740 to 2.5 209 (76)
>2.5 to 4 18 (7)>4 to 8 26 (9)
>8 to 10 6 (2)>10 to 15 9 (3)>15 to 20 1 (<1)>20 to 25 1 (<1)
>25 4 (1)DTG Median (range) 1.18 (0.45, 47)RAL n 274
0 to 1.5 117 (43)>1.5 to 4 9 (3)>4 to 8 2 (<1)
>8 to 10 1 (<1)>10 to 20 10 (4)
>20 to maximum of assay limit 44 (16)>maximum of assay limit 91 (33)
RAL Median (range) 17.50 (0.46, 149.0)Data Source: ING112574 Week 24 CSR Table 12.43
IN viral genotype and phenotype data for subjects with elevated HIV-1 RNA at last time point of IP
To further monitor the development of resistance to DTG, both IN genotype and phenotype were determined at the last timepoint on study meeting the following criteria: unconfirmed suspected protocol-defined virologic failure, HIV-1 RNA 400 c/mL or >12 weeks from the previous virologic failure testing. Nine subjects met one of these criteria for testing. Table 74 below provides a summary of these results.

CONFIDENTIALModule 2.7.2.4 Special Studies
96
Table 74 Plasma HIV-1 RNA log10 c/mL, Genotype and Phenotype for Subjects at Last Assessment Other than Time of Virologic Failure
Subj. Testvisit
OSSOBR
Baselinemutation
Group
Day 8 c0(ug/mL)
HIV-1 RNA c/mL DTG FC Prespecified IN Genotype Week24ITT-EBaseline Last Baseline Last Baseline Last
41 Follow-up 1 Y143 - 121533 49864 0.84 0.92 T97T/A, Y143R T97A, Y143R, G163K/N/Q/H
Y
221 Week 8 2 Q148+1 2.09 56686 44155 9.15 78.00 G140S, Q148H T97A, G140S, Q148H
Y
226 Follow-up 2 Q148+1 11.01 36340 34483 2.54 1.82 G140S, Q148H G140G/S, Q148Q/H
Y
461 Follow-up >2 Q148+2 1.28 120055 80427 13.00 100.05 E138T, G140S, Q148H
T97A, E138T, G140S, Q148H
Y
504 Week 16 1 Q148+2 3.16 28685 35549 14.00 103.24 L74I, G140S, Q148H
L74I, T97A, G140S, Q148H
Y
1203 Follow-up 2 Q148+1 6.49 23390390 17722840 4.40 17.00 G140S, Q148H T97T/A, G140S, Q148H
Y
1206 Week 24 2 Primary not
detected
- 2118674 511569 0.88 104.45 None L74L/M, T97T/A, E138E/K, G140S,
Q148H
Y
1241 Week 12 1 Primary not
detected
2.87 47143 94263 1.38 88.00 None T97A, E138A, G140S, Q148H
Y
1901 Week 16 1 2 primary
mutations
4.45 304380 31960 17.00 66.00 E138K, G140S, Y143R, Q148H, E157Q, G193E
T97T/A, E138K, G140S, Y143R/C, Q148H, E157Q,
G193E
Y
Data Source: ING112574 Week 24 CSR Table 12.57

CONFIDENTIALModule 2.7.2.4 Special Studies
97
Discussion
The population of ING112574 reflects the diversity of INI resistant virus in the general population in that the proportion of virus with Y143 and N155 and Q148 mutations was similar to that seen in treatment failures from previous RAL clinical studies and in earlier phase clinical investigation of DTG [Cooper, 2008; Hatano 2010; Clotet, 2010]. IN mutational patterns seen in the ING112574 also provide a good representation of those that can arise on EVG treatment and therefore provide for appropriate investigation of DTG for EVG associated resistance as well. The broad range of DTG FC and diverse resistance patterns observed allowed an appropriate test of DTG in this HIV-1 INI resistant population.
Thirty-two percent of subjects enrolled had received RAL or EVG as a component of an earlier regimen and had only historic evidence of IN resistance at Screening. In a minor variant analysis of subjects with no primary IN resistance at Baseline, the documented IN resistance was confirmed in only 9.6% of subjects. These results were not unexpected given the long duration post last dose of RAL or EVG at the time of testing. Earlier studies have suggested that minor variants of IN primary resistance diminish as early as 6 months post RAL interruption [Codoner, 2011; Canducci, 2011.
A broad range of DTG FC was seen at Baseline with minimal cross resistance to RAL/EVG. This result is a striking contrast to RAL and EVG which had broad cross resistance detected in both in vitro and clinical investigation [Garrido, 2012;Blanco, 2011; Kobayashi, 2011; Molina, 2012; Sax, 2012; Margot, 2012]. As noted in earlier clinical investigation, DTG FC was highly correlated to IN resistance pathways in that low DTG FC’s were seen with 143/155/66 plus secondary mutations and moderate to high DTG FC was seen with the Q148 mutation pathway. The highest DTG FC wasdetected in virus with Q148+2 additional IN resistance mutations. The broad diversity in DTG FC seen with 148 pathway virus may be due to the presence of secondary mutations in disparate number and combinations, or due to wildtype virus masking mutant virus resistance when present as a positional mixture (e.g. as Q148Q/H G140G/S [Underwood, 2009]).
Results from ING112574 show good short term and long term antiviral responses with virus harbouring 143/155/66 primary mutations as well as virus with only historic IN primary resistance, regardless of additional IN secondary mutations being present. However, virus having Q148/G140 dual mutations had reduced short term and long term responses as compared to the full population. Furthermore, virus harbouring the Q148/G140 dual mutations with additional IN secondary mutations (Q148+2) showed further reductions in short term responses. Further, no subject with this mutational profile achieved <50 c/mL at Week 24 although 2 subjects did achieve <400 c/mL. In vitro characterization of DTG and recent clinical reports support both the reduced antiviral activity of DTG on virus harbouring Q148 mutations as well as the expected good DTG antiviral activity that was achieved in virus harbouring Y143 and N155 mutations(Kobayashi, 2011; m5.3.5.4, 2011N127961_00) As previously noted, Q148 mutations arepresent in approximately 30% of subjects failing prior RAL or EVG treatment with IN resistance however only 11% of subjects harbour virus with Q148+2 suggesting a

CONFIDENTIALModule 2.7.2.4 Special Studies
98
HAART regimen that contains DTG 50 mg BID could provide good efficacy in at least89% of IN resistant virus.
A separate analysis was conducted specifically to provide potential IN phenotypic and/or genotypic guidance for use of DTG in this INI-resistant population, based on correlation between baseline resistance and antiviral response (GlaxoSmithKline Document Number m5.3.5.4, 2012N148111_00).This analysis showed that no robust phenotypic FC cut offcould be defined, however, 3 baseline genotypic resistance groups were identified based on their differential impact on DTG antiviral response. These 3 distinct IN genotypic groups were: the No Q148 mutation group (includes Y143, N155H, T66, E92 mutations or historical evidence of resistance); the Q148+1 group (Q148_HKR with one mutation [G140_ACS, L74I, E138_AKT]); and the Q148+2 group (Q148_HKR with two or more mutations [G140_ACS, L74I, E138_AKT]). The best antiviral responses were seen with the IN mutational group “No Q148” and lowest responses with “Q148+2” group and confirm the conclusions presented in this study report. A strong statistically significant association, in presence at Baseline, was seen between the Q148_HKR mutation and G140_ACS mutation such that their individual impact on antiviral response could not be determined. (The G140 was detected in 53/57 [93%] genotypes with the Q148 mutation at baseline.)
Viral evolution during functional monotherapy of DTG was assessed at Day 8 and showed only few subjects (12%) had treatment-emergent IN resistance. The treatment-emergent IN resistance that was detected for the majority was mixtures of IN secondary mutations suggesting their presence as minor variants in the Baseline population. All treatment-emergent mutations detected were well characterised INI resistance-associated mutations [Stanford database, Stanford].
Conclusions
ING112574 enrolled a broad range of DTG FC and diverse IN resistance patterns allowing for appropriate evaluation of DTG in the HIV-1 INI resistant population.
Low DTG FC was observed in subjects harbouring 143/155/66 or historic evidence of IN resistance while moderate to high DTG FC was observed with virus harbouring Q148 virus. Highest DTG FC was observed in virus harbouring Q148+2 additional IN mutations however this subgroup was represented in only 11% of the enrolled population.
Good short term and long term responses were seen in subjects with 143/155/66 mutations or historic evidence of IN resistance which make up the majority of RAL resistant virus; lower response rates were observed in virus harbouring Q148/G140 dual mutations. Protocol-defined virologic failure (PDVF) was observed in 19% of subjects the majority of whom harboured Q148 pathway virus at Baseline.
Limited viral evolution was detected at PDVF consisting of previously identified, INI secondary mutations which lead to an increase in DTG FC; the majority of which were identified in virus harbouring Q148 mutations.
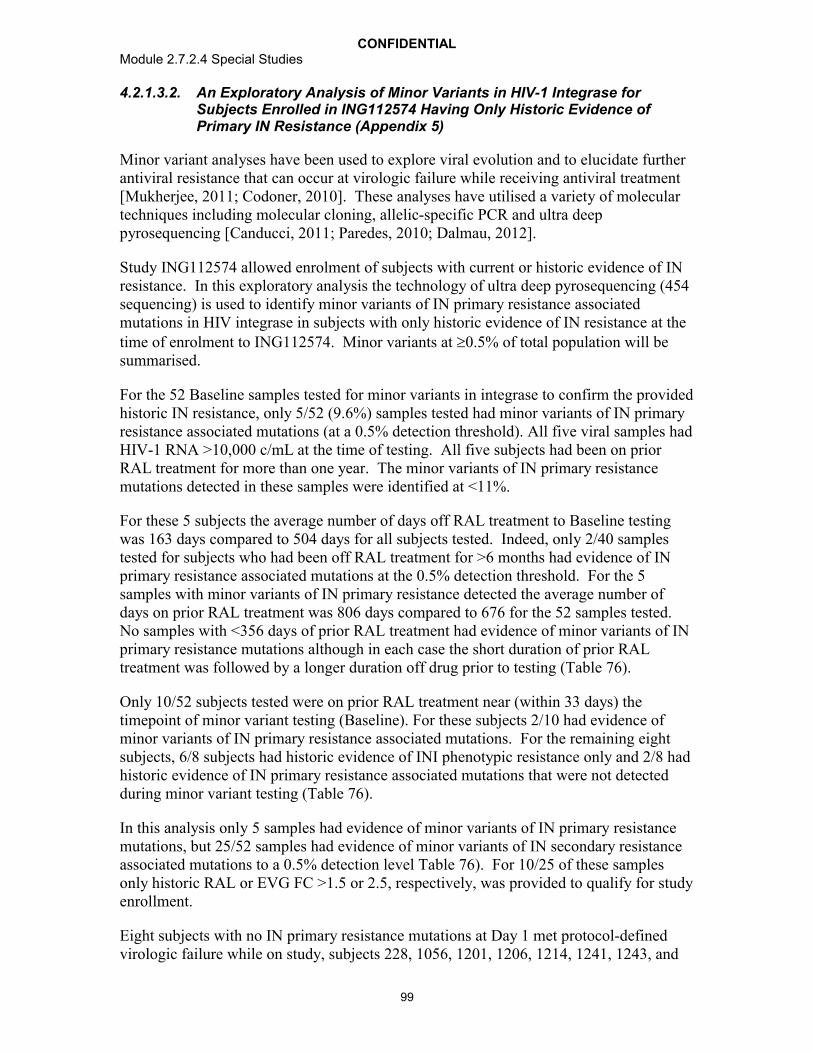
CONFIDENTIALModule 2.7.2.4 Special Studies
99
4.2.1.3.2. An Exploratory Analysis of Minor Variants in HIV-1 Integrase for Subjects Enrolled in ING112574 Having Only Historic Evidence of Primary IN Resistance (Appendix 5)
Minor variant analyses have been used to explore viral evolution and to elucidate further antiviral resistance that can occur at virologic failure while receiving antiviral treatment [Mukherjee, 2011; Codoner, 2010]. These analyses have utilised a variety of molecular techniques including molecular cloning, allelic-specific PCR and ultra deep pyrosequencing [Canducci, 2011; Paredes, 2010; Dalmau, 2012].
Study ING112574 allowed enrolment of subjects with current or historic evidence of IN resistance. In this exploratory analysis the technology of ultra deep pyrosequencing (454 sequencing) is used to identify minor variants of IN primary resistance associated mutations in HIV integrase in subjects with only historic evidence of IN resistance at the time of enrolment to ING112574. Minor variants at 0.5% of total population will be summarised.
For the 52 Baseline samples tested for minor variants in integrase to confirm the provided historic IN resistance, only 5/52 (9.6%) samples tested had minor variants of IN primary resistance associated mutations (at a 0.5% detection threshold). All five viral samples had HIV-1 RNA >10,000 c/mL at the time of testing. All five subjects had been on prior RAL treatment for more than one year. The minor variants of IN primary resistance mutations detected in these samples were identified at <11%.
For these 5 subjects the average number of days off RAL treatment to Baseline testing was 163 days compared to 504 days for all subjects tested. Indeed, only 2/40 samples tested for subjects who had been off RAL treatment for >6 months had evidence of IN primary resistance associated mutations at the 0.5% detection threshold. For the 5 samples with minor variants of IN primary resistance detected the average number of days on prior RAL treatment was 806 days compared to 676 for the 52 samples tested. No samples with <356 days of prior RAL treatment had evidence of minor variants of IN primary resistance mutations although in each case the short duration of prior RAL treatment was followed by a longer duration off drug prior to testing (Table 76).
Only 10/52 subjects tested were on prior RAL treatment near (within 33 days) the timepoint of minor variant testing (Baseline). For these subjects 2/10 had evidence of minor variants of IN primary resistance associated mutations. For the remaining eight subjects, 6/8 subjects had historic evidence of INI phenotypic resistance only and 2/8 had historic evidence of IN primary resistance associated mutations that were not detected during minor variant testing (Table 76).
In this analysis only 5 samples had evidence of minor variants of IN primary resistance mutations, but 25/52 samples had evidence of minor variants of IN secondary resistance associated mutations to a 0.5% detection level Table 76). For 10/25 of these samples only historic RAL or EVG FC >1.5 or 2.5, respectively, was provided to qualify for study enrollment.
Eight subjects with no IN primary resistance mutations at Day 1 met protocol-defined virologic failure while on study, subjects 228, 1056, 1201, 1206, 1214, 1241, 1243, and

CONFIDENTIALModule 2.7.2.4 Special Studies
100
1274. Results from population IN genotyping performed at the timepoint of virologic failure showed only three of these eight subjects had treatment-emergent IN resistance (subjects 1206, 1241 and 1243). In each case the virus at virologic failure had treatment emergent Q148H. For these three subjects the historic IN resistance that was provided was Q148H but only subject 1243 had minor variants of Q148H detected at Day 1(at 4%).
Table 75 Summary of Confirmed Historic Primary INI Mutations at Baseline by Minor Variant Detection
Subject ID
Historic IN resistance provided
Baseline HIV-1 RNA
Duration of prior INI treatment (days)
Time to IP since INI stopped (days)
Baseline IN Genotype
Baseline Minority Variants detected and (proportion)
381 Q148H 373747 1247 119 G140S(.0487), Q148H(.049)
1001 Q148H 170395 477 483E138A(.0099), G140S(.1081), Q148H(.1063)
1243 Q148H 171547 357 2 G140G/S G140S(.0399), Q148H(.0406)
1273RAL FC = 2.86 50738 717 2 T97A
T66A(.0085), T97A(.9899), V151I(.0286), G163R(.0754)
1402 N155H 34035 1232 211V151I, G163R
G140S(.008), V151I(.9967), N155H(.0062), G163R(.9875)
0.5% detection thresholdNote: Bolded mutations are primary IN resistance associated mutationsData Source: ING112574 Week 24 CSR: NON-ICH Listing 13, NON-ICH Listing 45 and NON–ICH Listing 47

CONFIDENTIALModule 2.7.2.4 Special Studies
101
Table 76 Summary of Minor Variant Detection for 53 Samples Tested
Subject ID
Historic IN resistance provided
Baseline HIV-1 RNA
Duration of prior INI treatment (days)
Time to IP since INI stopped (days)
Baseline IN Genotype
Baseline Minority
Variants detecteda
and (proportion)
Comments
1RAL FC= 84 72577 580 380 V151V/I V151I(.2889)
24RAL FC MAX 644 1162 33 Q95K,T97A/V
Q95K(.9975), T97A(.9986), V151I(.0182)
102RAL FC MAX 366 1400 263
107 N155H 132039 1078 278
143RAL FC = 33 32489 1064 322 V151I(.0304)
228RAL FC MAX 8347 542 662
all amplicons did not provide
sequenceb
262 Q148H 9464 911 562 T97A(.0136)
381 Q148H 373747 1247 119G140S(.0487), Q148H(.049)
all amplicons did not provide
sequenceb
387 N155H 12352 NA 483
463RAL FC = 48 14281 2115 2
L74M, Q95K, T97A, S147G
Q95K(.9804), T97A(.9955), S147G(.9924)
all amplicons did not provide
sequenceb
663RAL FC = 1.98 95255 896 2 E138A E138A(.9815)
1001 Q148H 170395 477 483
E138A(.0099), G140S(.1081), Q148H(.1063)
1002 N155H 3208 118 513 V151I(.0303)
all amplicons did not provide
sequenceb
1006 N155H 535 708 604 E157Q(.0776)1011 N155H 102008 1078 860
1022 N155H 1955 923 848L68V, V151V/I
L68V(.9981), V151I(.6265)
1026 E92Q 10065 575 657
1036 N155H 7034 782 309
E138K(.0157), S147G(.0147), V151I(.1928)
1041 Q148H 320949 611 1090
1051 N155H 24207 226 799
all amplicons did not

CONFIDENTIALModule 2.7.2.4 Special Studies
102
Subject ID
Historic IN resistance provided
Baseline HIV-1 RNA
Duration of prior INI treatment (days)
Time to IP since INI stopped (days)
Baseline IN Genotype
Baseline Minority
Variants detecteda
and (proportion)
Comments
provide
sequenceb
1056 Q148R 664390 1428 2 V151I(.0099)1057 N155H 57974 1289 331 L74M(.1259)
1065RAL FC = 65 282206 1863 1 L74I
L74I(.9971), E157Q(.0835)
1076 Y143R 34759 722 785
1088 Q148H 9572 594 1137bNR
b
1202 Q148R 104203 525 946
1205 Q148H 10312 607 681G140S(.9804), Q148H(.9838)
Results removed from analysis due to sample ID error
1206 Q148H 2118674 472 879 V151I(.0085)1209 Q148H 127663 147 4101210 Y143R 41637 922 21212 Q148H 373713 321 2071214 Y143C 14830 782 863 L74M(.0508)1215 E92Q 50023 1237 5951217 Q148R 84534 239 8691221 N155H 25681 974 2511241 Q148H 47143 585 483
1243 Q148H 171547 357 2 G140G/SG140S(.0399), Q148H(.0406)
1265 N155H 7743 428 614
1271 N155H 1309 468 224bNR
b
1272 Q148H 1194036 153 461
1273RAL FC = 2.86 50738 717 2 T97A
T66A(.0085), T97A(.9899), V151I(.0286), G163R(.0754)
1274 N155H 633135 385 905
1401RAL FC = 1.62 81587 918 2 L74M, T97A
L74M(.9459), T97A(.9966), V151I(.0133)
1402 N155H 34035 1232 211V151I, G163R
G140S(.008), V151I(.9967), N155H(.0062), G163R(.9875)
1403 Q148R 289238 322 6231481 N155H 38581 690 469 G193E(.0104)
1611RAL FC = 4.12 804 1460 1 T97A
L74M(.0287)/Q(.7574), T97A(.9912), E138A(.0058)
1612 Q148H 3045 647 10521861 Q148H 2724 1067 455
1902RAL FC = 66 26658 1399 133 L74L/M
L74M(.1527), V151I(.1639)

CONFIDENTIALModule 2.7.2.4 Special Studies
103
Subject ID
Historic IN resistance provided
Baseline HIV-1 RNA
Duration of prior INI treatment (days)
Time to IP since INI stopped (days)
Baseline IN Genotype
Baseline Minority
Variants detecteda
and (proportion)
Comments
1922RAL FC = 38 12149 192 433
1961 N155H 7789 162 835 E157K(.0063)/Q(.0064)1962 N155H 121371 396 1636a. 0.5% detection level, b. All amplicons did not provide sequence but results were obtained from amplicon containing IN primary resistance
mutations.Data Source: ING112574 Week 24 CSR: NON-ICH Listing 13, NON-ICH Listing 45 and NON –ICH Listing 47
Discussion
In a minor variant analysis conducted on 52 Baseline samples of study ING112574 with only historic evidence of IN resistance for study enrollment, only 9.6% of the samples tested had evidence of IN primary resistance mutations as minor variants in the viral population. Ultra deep pyrosequencing of integrase with a detection level of 0.5% was used for this evaluation [Mukherjee, 2011; Codoner, 2010]. All minor variants of IN primary resistance mutations detected were at <11% of the total viral population for each tested viral sample. This detection level would preclude their identification on a population-based genotyping assay as was used at Baseline to determine IN resistance in these subjects.
In this study the average number of days off RAL treatment before minor variant testing was 504 days and in only 2/40 subjects off RAL treatment for >6 months were minor variants of IN primary resistance mutations detected. Prior studies have shown that virus resistant to RAL can appear to revert to wild type by the outgrowth of more fit wildtype viral variants or within weeks after RAL treatment interruption [Canducci, 2011]. In another study it was shown that interruptions or incomplete adherence could impact detection of minor variant to a 1% detection level [Codoner, 2011]. Therefore given the number of samples tested in this study off RAL treatment for longer periods of time, the low proportion of minor variant detection of IN primary resistance is an expected finding.
Reduced INI susceptibility (elevated RAL FC) was provided as historic evidence of IN resistance for 13 (25%) samples tested and therefore no IN primary resistance mutations were provided to confirm with minor variant evaluation. Study ING112574 was conducted in both the US and EU, and the monitoring of INI resistance in the US is typically performed with a phenotypic assay to measure RAL susceptibility. In this study, 10/13 samples did have minor variants of one or more IN secondary mutations present at Baseline, suggesting reduced RAL susceptibility could be the result of a virus with only IN secondary mutations present.
In this exploratory analysis only 5 subjects had IN primary resistance minor variants detected at >0.5%. The low proportion of viral samples with detectable IN primary resistance on pyrosequencing, below the level of population genotyping detection is likely due to the increased time off prior RAL treatment at the time of testing.

CONFIDENTIALModule 2.7.2.4 Special Studies
104
Conclusions
For the 52 Baseline samples tested for minor variants in integrase to confirm the provided historic IN resistance, only 5/52 (9.6%) samples tested had minor variants of IN primary resistance associated mutations (at a 0.5% detection threshold)
4.2.1.3.3. Antiviral Activity of DTG in ING112574 by Baseline Resistance
Analyses of antiviral activity of DTG observed in Study ING112574 according to genotypic and/or phenotypic resistance (m5.3.5.4, RM2008/00752/01) were conducted as per the requirements set out FDA and EMA guidance (FDA, 2007; EMA, 2008)
Antiviral activity (e.g. change from Baseline in HIV-1 RNA log10 c/mL) at Day 8 was used for quantifying the association of response in relation to Baseline genotypic/ phenotypic data.
The change from Baseline in HIV-1 RNA at Day 8 was also categorized in line with the categories specified in Annex B, i.e. ‘activity not affected’, ‘activity decreased’, and ‘resistance’. The summaries of the response category by the derived phenotypic/genotypic cut-offs/groups were produced.
Full response (i.e. activity not affected): reduction >1.0 log10 c/mL or HIV-1 RNA <50 c/mL at Day 8
Intermediate (i.e. activity decreased): reduction 0.5 – 1.0 log10 c/mL or HIV-1 RNA <400 c/mL at Day 8
No response (i.e. resistance): reduction <0.5 log10 c/mL at Day 8
The Week 24 response summary by Baseline resistance (i.e. genotypic/phenotypic groupings based on the derived cut-offs/groups from Day 8 analyses) was also produced. The antiviral activity (HIV-1 RNA viral load at Week 24) was defined as:
Response: <50 c/mL
No response: ≥50 c/mL based on FDA ‘Snapshot’ (missing, switch, discontinuation=failure) algorithm.
Study population and baseline characteristics
The ITT-E Population consisted of 183 subjects who received DTG 50mg twice daily in ING112574. Of these, 177 (98%) were included in the Day 8 Virologic Outcome (VO)Population. Of a total of 114 subjects who had completed the Week 24 visit or discontinued IP as of the data cut-off for this analysis, 101 met virologic outcome population criteria for the Week 24 timepoint.
The ITT-E population of ING112574 showed diverse IN resistance patterns, and 31% of subjects had virus with mutations at position Q148 at Baseline (m5.3.5.1 ING112574 Week 24 Clinical Study Report Source Data: Table 12.7). Subjects had moderate to high

CONFIDENTIALModule 2.7.2.4 Special Studies
105
DTG FC in virus harboring Q148 mutations with additional primary or secondary mutations present. Subjects with virus harbouring 143 and 155 mutations had lower DTG FC. The highest DTG FC was seen with Q148 with two or more secondary mutations. Thirty-three percent of subjects harboured virus with historic IN resistance only (Table 77, Table 78).
Table 77 Genotypic and phenotypic resistance at Baseline, ITT-E population
DTG 50mg BID(N=183)
Mutation category
Q148+≥2 21 (11%)
Q148+1 32 (17%)
N155 33 (18%)
Y143 28 (15%)
T66 1 (<1%)
>=2 Primary 8 (4%)
Primary not detected 60 (33%)
Median FC (range)
DTG 1.29 (0.45-37)
RAL 47.5 (0.49->127)Data Source: m5.3.5.4 ING112574 Annex B Clinical Virology Report Table 12.9 Table 12.42, Figure 12.1
Table 78 Baseline DTG FC by Baseline pre-defined IN mutation category, ITT-E population
DTG 50mg BID(N=183)a
Q148+≥2 Q148+1 N155 Y143 ≥2 Primary Primary not detected
n 21 31 30 28 7 59
Median 10.00 4.60 1.49 1.10 4.57 0.89
Q1 4.47 3.39 1.29 0.91 1.68 0.80
Q3 13.00 6.27 1.76 1.18 20.00 1.04
Min. 2.56 0.47 0.82 0.78 1.46 0.45
Max. 37.00 12.00 3.89 2.01 27.00 3.97
a. Six subjects had missing DTG FC at BaselineData Source: m5.3.5.4 ING112574 Annex B Clinical Virology Report Table 12.66
Limited DTG cross resistance with RAL was noted at baseline. While only 15 (8%)subjects enrolled had virus with DTG FC >10, 112 (61%) subjects had baseline viral phenotypes showing RAL FC at >10.

CONFIDENTIALModule 2.7.2.4 Special Studies
106
Antiviral activity by baseline phenotypic resistance based on short term functional monotherapy
Phenotypic cut-offs
In the Day 8 VO population (N=177, which consisted of all subjects in the ITT-E population excluding subjects who received incorrect IP, had IP interruption, received a prohibited medication, or discontinued IP prior to the analysis timepoint for a reason other than lack of efficacy) the median change from baseline in HIV-1 RNA was -1.4 log10 c/mL. When the Day 8 response data was categorized using the response categories defined above, 82% of subjects achieved a full response and 93% achieved an intermediate or full response.
In the Day 8 VO Population, 3% (6/177) subjects who had missing DTG FC at Baseline were not included in this analysis. Figure 1 plots Baseline DTG FC against Day 8 virologic response category for the 171 subjects with DTG FC available at Baseline. On average, the 12 subjects with no response at Day 8 had the highest DTG FC. Considerable overlap in DTG FC was noted between subjects with intermediate and full responses, and several subjects with full responses had FC values that were within the FC IQR for subjects with no response.
Figure 1 Box Plot of Baseline DTG FC by Day 8 Response Category (N=177)
Note: diamond indicates mean of DTG FC; Triangle indicates outliers of 95% CIData Source: ING112574 Annex B Clinical Virology Report Figure 12.103
Linear regression model
As reported in the ING112574 CSR a multivariate analysis was conducted to assess the impact of Day 1 covariates (e.g. demographics, HIV RNA, resistance to DTG, overall susceptibility score of background ART) and PK on antiviral. The results (impact) of
n
12
18
141
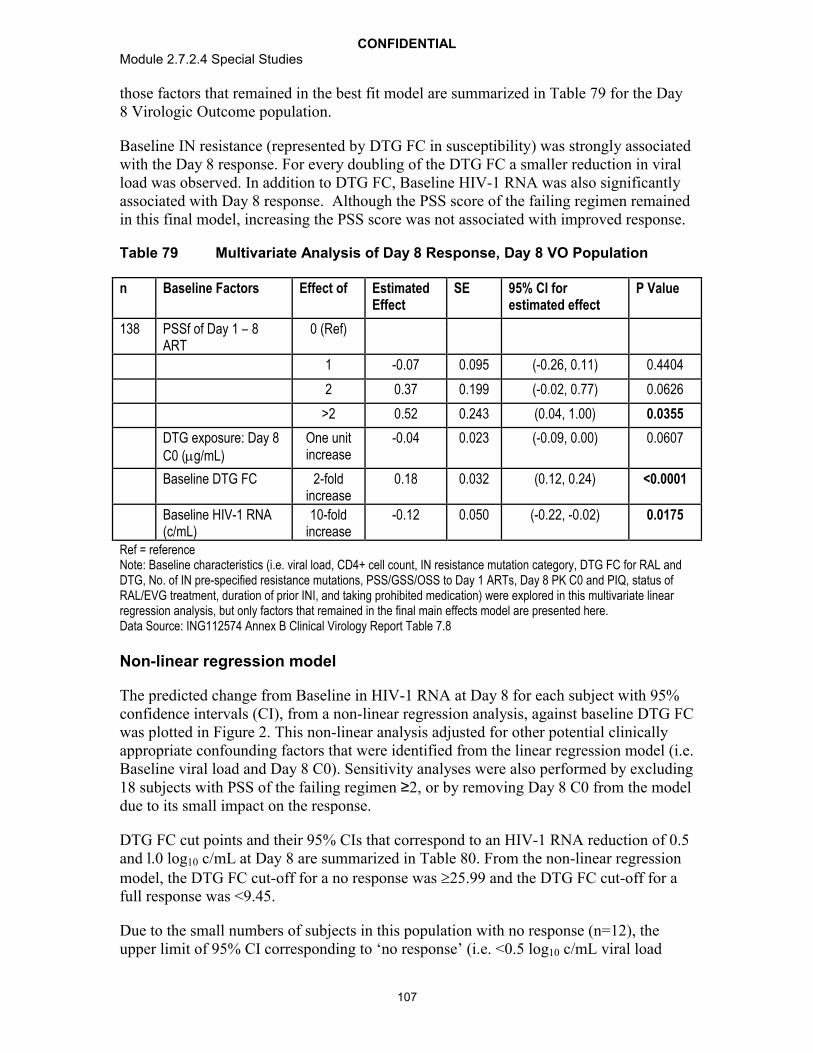
CONFIDENTIALModule 2.7.2.4 Special Studies
107
those factors that remained in the best fit model are summarized in Table 79 for the Day 8 Virologic Outcome population.
Baseline IN resistance (represented by DTG FC in susceptibility) was strongly associated with the Day 8 response. For every doubling of the DTG FC a smaller reduction in viral load was observed. In addition to DTG FC, Baseline HIV-1 RNA was also significantly associated with Day 8 response. Although the PSS score of the failing regimen remainedin this final model, increasing the PSS score was not associated with improved response.
Table 79 Multivariate Analysis of Day 8 Response, Day 8 VO Population
n Baseline Factors Effect of Estimated Effect
SE 95% CI for estimated effect
P Value
138 PSSf of Day 1 – 8 ART
0 (Ref)
1 -0.07 0.095 (-0.26, 0.11) 0.4404
2 0.37 0.199 (-0.02, 0.77) 0.0626
>2 0.52 0.243 (0.04, 1.00) 0.0355
DTG exposure: Day 8 C0 (g/mL)
One unit increase
-0.04 0.023 (-0.09, 0.00) 0.0607
Baseline DTG FC 2-fold increase
0.18 0.032 (0.12, 0.24) <0.0001
Baseline HIV-1 RNA (c/mL)
10-fold increase
-0.12 0.050 (-0.22, -0.02) 0.0175
Ref = referenceNote: Baseline characteristics (i.e. viral load, CD4+ cell count, IN resistance mutation category, DTG FC for RAL and DTG, No. of IN pre-specified resistance mutations, PSS/GSS/OSS to Day 1 ARTs, Day 8 PK C0 and PIQ, status of RAL/EVG treatment, duration of prior INI, and taking prohibited medication) were explored in this multivariate linear regression analysis, but only factors that remained in the final main effects model are presented here.Data Source: ING112574 Annex B Clinical Virology Report Table 7.8
Non-linear regression model
The predicted change from Baseline in HIV-1 RNA at Day 8 for each subject with 95% confidence intervals (CI), from a non-linear regression analysis, against baseline DTG FC was plotted in Figure 2. This non-linear analysis adjusted for other potential clinically appropriate confounding factors that were identified from the linear regression model (i.e. Baseline viral load and Day 8 C0). Sensitivity analyses were also performed by excluding 18 subjects with PSS of the failing regimen ≥2, or by removing Day 8 C0 from the model due to its small impact on the response.
DTG FC cut points and their 95% CIs that correspond to an HIV-1 RNA reduction of 0.5 and l.0 log10 c/mL at Day 8 are summarized in Table 80. From the non-linear regression model, the DTG FC cut-off for a no response was 25.99 and the DTG FC cut-off for a full response was <9.45.
Due to the small numbers of subjects in this population with no response (n=12), the upper limit of 95% CI corresponding to ‘no response’ (i.e. <0.5 log10 c/mL viral load

CONFIDENTIALModule 2.7.2.4 Special Studies
108
reduction, DTG FC cut-off: 25.99) could not be obtained (Table 80). The cut-off for full response was also subject to a large variation with 95% CIs ranging from 5.98 to 15.88.
Figure 2 Plot of Change from Baseline in HIV-1 RNA log10 c/mL by DTG FC, Day 8 VO Population*
*Based on a non-linear regression model adjusted for Baseline viral load and DTG exposure (Day 8 C0).Data Source: ING112574 Annex B Clinical Virology Report Figure 12.101
Table 80 Estimated Baseline DTG FC Cut-offs for Predicting Change from Baseline in Plasma HIV1-RNA at Day 8 (LOCFDB), Day 8 VO Population*
n Change from Baseline in HIV-1 RNA at Day 8
(log10 c/mL)
Estimated DTG FC (95% CI)
138 -0.5 25.99 (15.92, - )
-1 9.45 (5.98, 15.88)Based on a non-linear regression model adjusted for Baseline viral load and DTG exposure (Day 8 C0).Data Source: ING112574 Annex B Clinical Virology Report Table 12.102
Since some subjects had no Day 8 C0 assessment, only 78% (138/177) of subjects were included in this non-linear regression analysis (Table 80). To ensure the robustness of results, a sensitivity analysis was performed by excluding the covariate of Day 8 C0 from this modeling (based on 171 subjects with non-missing Baseline DTG FC and baseline viral load). The estimated DTG cut-offs were consistent with the findings from the

CONFIDENTIALModule 2.7.2.4 Special Studies
109
original analysis. These similar findings were also observed from the sensitivity analysis by excluding subjects with PSS of the failing regimen ≥2.
Day 8 C0 was not included in the genotypic modeling analysis described in the remaining sections, due to a large proportion of subjects with missing Day 8 C0 and no clinically significant impact of DTG exposure on antiviral activity.
Agreement between the derived phenotypic cut-offs and observed response at Day 8 and Week 24
Table 81 summarizes the agreement between the derived phenotypic group and observed response at Day 8. For subjects with DTG FC <9.45 at Baseline (who were predicted to have a full response), 87% (136/156, PPV) achieved a full response. For subjects with DTG FC ≥9.45 (who were predicted to have either an intermediate or no response), 67% (10/15, NPV) had a ‘less than full response’, which means the cut-off of 9.45 misclassifies 33% of subjects with ‘full response’ as ‘less than full response’. For subjects with DTG FC <25.99 at Baseline, 95% (159/168, PPV) achievedfull/intermediate responses. For subjects with DTG FC ≥25.99, 100% (3/3, NPV) had no response as predicted.
Table 81 Summary of Phenotypic Cut-offs and Virologic Response at Day 8, Day 8 VO Population
Observed Response
Full response Intermediateresponse
No response
Predicted Response, n (%)
Full response (<9.45) 136 (77) 16 (9) 4 (2)
Intermediate (9.45 - <25.99) 5 (3) 2 (1) 5 (3)
No response (≥25.99) 0 0 3 (2)
Unknown DTG FC 5 (3) 1 (<1) 0
Total 146 (82%) 19 (11) 12 (7)Data Source: ING112574 Annex B Clinical Virology Report Table 12.103
Although both negative and positive predictive values for the DTG cut-off of 25.99 were above 70%, the predicted values were derived from a population with DTG FC ≥25.99 in 3 subjects only. Hence, the PPVs and NPVs pertaining to these cut-offs are subject to large uncertainty.
For the DTG cut-off of response (full or intermediate) determined as 25.99, the PPV was 159/168 (95%) and the NPV was 3/3 (100%) which suggests that any DTG FC below 25.99 FC could be predicted to achieve at least a 0.5 log10 decline in HIV-1 RNA. As noted, few subjects enrolled had high DTG FC, and the DTG FC cut-off of 25.99 was confirmed in this analysis with only three baseline samples. While this phenotypic cut-off did achieve a moderate prediction level of 70%, caution should be used in interpreting these results, given the small number of subjects with ‘no response’ with elevated DTG FC.

CONFIDENTIALModule 2.7.2.4 Special Studies
110
For the DTG FC cut-off for full response of 9.45, the PPV was 87% (136/156) and the NPV was 67% (10/15). The less than 70% NPV indicates that more than 30% subjects with a DTG FC> 9.45 and achieving full response would be misclassified to ‘less than full response’ based on this cut-off. Therefore the DTG cut-off of 9.45 is not precise in predicting antiviral response.
Analysis of virologic response (Day 8/Week 24) by pre-specified phenotypic group
The data failed to provide a precise phenotypic cut-off for predicting antiviral activity. Therefore, antiviral response at both Day 8 and Week 24 were analyzed by pre-specified clinical phenotypic groupings (Table 82).
Table 82 Virologic Response by pre-specified DTG fold change group at Baseline, VO populations
Day 8 Responsea
n (%)(N=177)
WK 24 Response n/N (%)(N=101)
DTG FC Full response Intermediate response
No response HIV-1 RNA <50 c/mL (Snapshot)
Missing 5 (83) 1 (17) 0 4/4 (100)0 to 2.5 109 (92) 10 (8) 0 55/71 (77)>2.5 to 4 11 (92) 1 (8) 0 2/6 (33)>4 to 8 14 (64) 5 (23) 3 (14) 5/11 (45)>8 to 10 3 (75) 0 1 (25) 1/4 (25)>10 to 15 2 (29) 2 (29) 3 (43) 0/2>15 to 20 1 (33) 0 2 (67) 0/2>20 to 25 1 (100) 0 0 0>25 0 0 3 (100) 0/1a. Full response: HIV-1 RNA reduction from Baseline >1.0 log10 c/mL or HIV-1 RNA <50 c/mL at Day 8;
Intermediate: HIV-1 RNA reduction from Baseline 0.5 - 1.0 log10 c/mL or HIV-1 RNA <400 c/mL at Day 8; No response: HIV-1 RNA reduction from Baseline reduction < 0.5 log10 c/mL at Day 8
Data Source: ING112574 Annex B Clinical Virology Report Table 12.111 and Table 12.18
The proportion of subjects with plasma HIV-1 RNA <50 c/mL at Week 24 by the snapshot algorithm are presented in Table 83 by susceptibility of OBR (i.e. OSS) and phenotypic resistance cut-offs derived from the Day 8 response analysis for the Week 24 VO Population (N=101). The DTG FC cut-off of 9.45 correctly predicted a full response at Week 24 in 69% of subjects with DTG FC<9.45. However, only six subjects had a DTG FC ≥9.45 available for analysis at Week 24.
DTG FC cut-off could not be applied to 4 subjects with full response at Week 24 due to missing DTG FC at Baseline.
Data presented in Table 83 also show that the response at Week 24 did not increase with increasing OSS, which is consistent with findings from the multivariate analysis reported in the m5.3.5.1, ING112574 Week 24 Clinical Study Report.
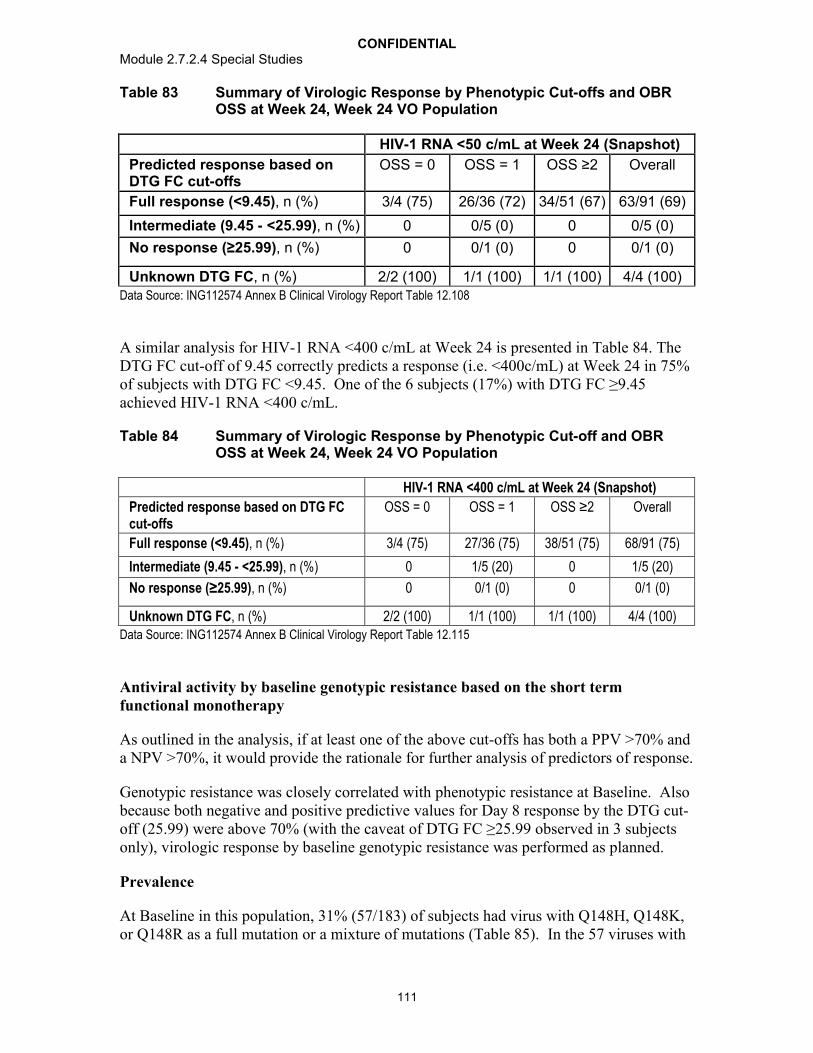
CONFIDENTIALModule 2.7.2.4 Special Studies
111
Table 83 Summary of Virologic Response by Phenotypic Cut-offs and OBR OSS at Week 24, Week 24 VO Population
HIV-1 RNA <50 c/mL at Week 24 (Snapshot)
Predicted response based on DTG FC cut-offs
OSS = 0 OSS = 1 OSS ≥2 Overall
Full response (<9.45), n (%) 3/4 (75) 26/36 (72) 34/51 (67) 63/91 (69)
Intermediate (9.45 - <25.99), n (%) 0 0/5 (0) 0 0/5 (0)
No response (≥25.99), n (%) 0 0/1 (0) 0 0/1 (0)
Unknown DTG FC, n (%) 2/2 (100) 1/1 (100) 1/1 (100) 4/4 (100)Data Source: ING112574 Annex B Clinical Virology Report Table 12.108
A similar analysis for HIV-1 RNA <400 c/mL at Week 24 is presented in Table 84. The DTG FC cut-off of 9.45 correctly predicts a response (i.e. <400c/mL) at Week 24 in 75% of subjects with DTG FC <9.45. One of the 6 subjects (17%) with DTG FC ≥9.45 achieved HIV-1 RNA <400 c/mL.
Table 84 Summary of Virologic Response by Phenotypic Cut-off and OBR OSS at Week 24, Week 24 VO Population
HIV-1 RNA <400 c/mL at Week 24 (Snapshot)
Predicted response based on DTG FC cut-offs
OSS = 0 OSS = 1 OSS ≥2 Overall
Full response (<9.45), n (%) 3/4 (75) 27/36 (75) 38/51 (75) 68/91 (75)
Intermediate (9.45 - <25.99), n (%) 0 1/5 (20) 0 1/5 (20)
No response (≥25.99), n (%) 0 0/1 (0) 0 0/1 (0)
Unknown DTG FC, n (%) 2/2 (100) 1/1 (100) 1/1 (100) 4/4 (100)Data Source: ING112574 Annex B Clinical Virology Report Table 12.115
Antiviral activity by baseline genotypic resistance based on the short term functional monotherapy
As outlined in the analysis, if at least one of the above cut-offs has both a PPV >70% and a NPV >70%, it would provide the rationale for further analysis of predictors of response.
Genotypic resistance was closely correlated with phenotypic resistance at Baseline. Also because both negative and positive predictive values for Day 8 response by the DTG cut-off (25.99) were above 70% (with the caveat of DTG FC ≥25.99 observed in 3 subjects only), virologic response by baseline genotypic resistance was performed as planned.
Prevalence
At Baseline in this population, 31% (57/183) of subjects had virus with Q148H, Q148K, or Q148R as a full mutation or a mixture of mutations (Table 85). In the 57 viruses with
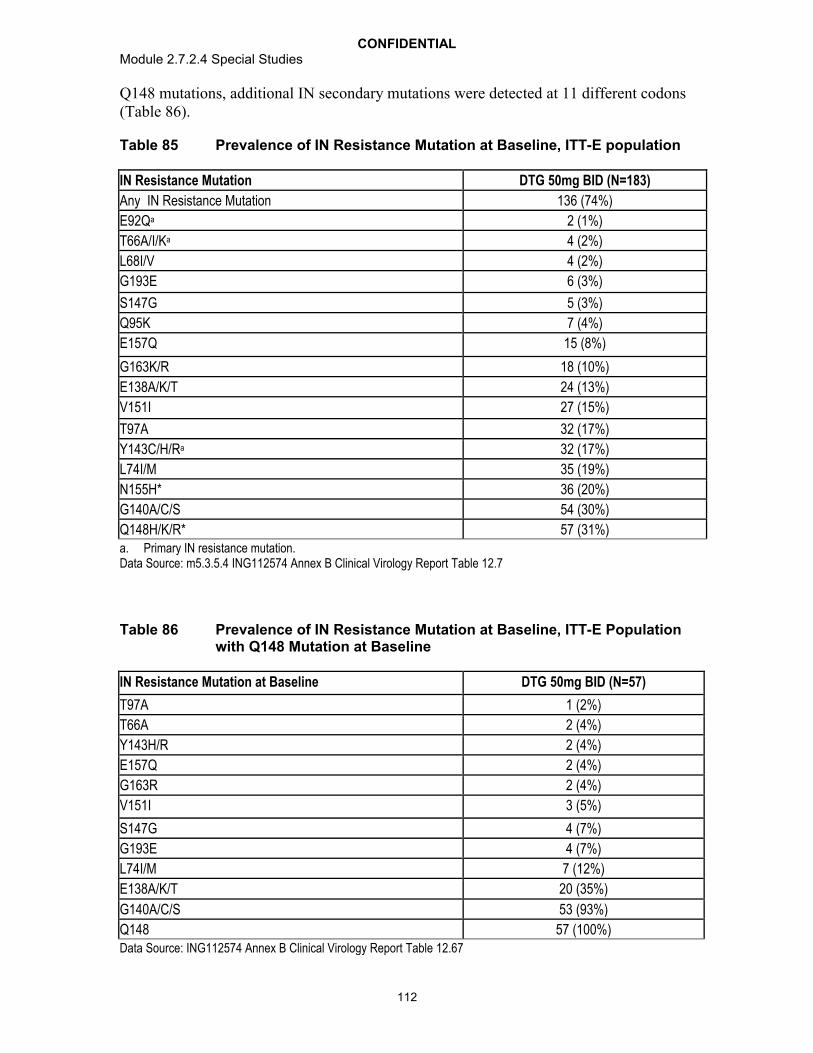
CONFIDENTIALModule 2.7.2.4 Special Studies
112
Q148 mutations, additional IN secondary mutations were detected at 11 different codons (Table 86).
Table 85 Prevalence of IN Resistance Mutation at Baseline, ITT-E population
IN Resistance Mutation DTG 50mg BID (N=183)
Any IN Resistance Mutation 136 (74%)
E92Qa 2 (1%)
T66A/I/Ka 4 (2%)
L68I/V 4 (2%)
G193E 6 (3%)
S147G 5 (3%)
Q95K 7 (4%)
E157Q 15 (8%)
G163K/R 18 (10%)
E138A/K/T 24 (13%)
V151I 27 (15%)
T97A 32 (17%)
Y143C/H/Ra 32 (17%)
L74I/M 35 (19%)
N155H* 36 (20%)
G140A/C/S 54 (30%)
Q148H/K/R* 57 (31%)a. Primary IN resistance mutation. Data Source: m5.3.5.4 ING112574 Annex B Clinical Virology Report Table 12.7
Table 86 Prevalence of IN Resistance Mutation at Baseline, ITT-E Population with Q148 Mutation at Baseline
IN Resistance Mutation at Baseline DTG 50mg BID (N=57)
T97A 1 (2%)
T66A 2 (4%)
Y143H/R 2 (4%)
E157Q 2 (4%)
G163R 2 (4%)
V151I 3 (5%)
S147G 4 (7%)
G193E 4 (7%)
L74I/M 7 (12%)
E138A/K/T 20 (35%)
G140A/C/S 53 (93%)
Q148 57 (100%)Data Source: ING112574 Annex B Clinical Virology Report Table 12.67
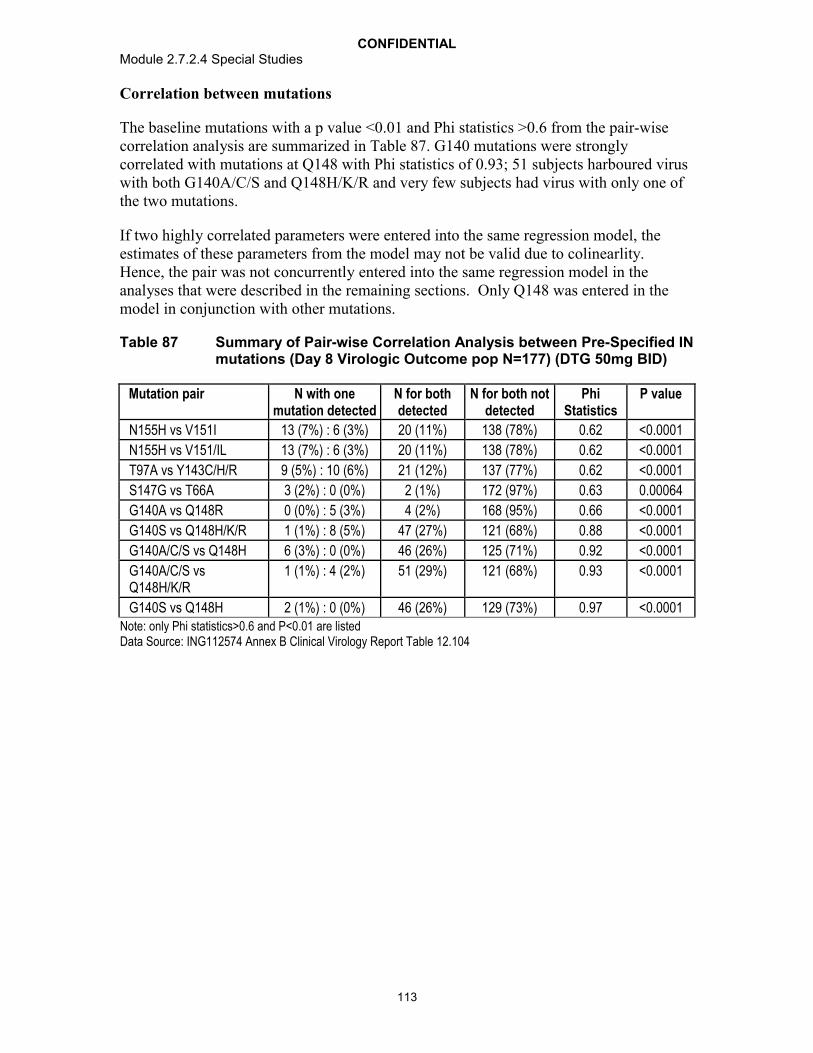
CONFIDENTIALModule 2.7.2.4 Special Studies
113
Correlation between mutations
The baseline mutations with a p value <0.01 and Phi statistics >0.6 from the pair-wise correlation analysis are summarized in Table 87. G140 mutations were strongly correlated with mutations at Q148 with Phi statistics of 0.93; 51 subjects harboured virus with both G140A/C/S and Q148H/K/R and very few subjects had virus with only one of the two mutations.
If two highly correlated parameters were entered into the same regression model, the estimates of these parameters from the model may not be valid due to colinearlity. Hence, the pair was not concurrently entered into the same regression model in the analyses that were described in the remaining sections. Only Q148 was entered in the model in conjunction with other mutations.
Table 87 Summary of Pair-wise Correlation Analysis between Pre-Specified IN mutations (Day 8 Virologic Outcome pop N=177) (DTG 50mg BID)
Mutation pair N with one mutation detected
N for bothdetected
N for both notdetected
Phi Statistics
P value
N155H vs V151I 13 (7%) : 6 (3%) 20 (11%) 138 (78%) 0.62 <0.0001
N155H vs V151/IL 13 (7%) : 6 (3%) 20 (11%) 138 (78%) 0.62 <0.0001
T97A vs Y143C/H/R 9 (5%) : 10 (6%) 21 (12%) 137 (77%) 0.62 <0.0001
S147G vs T66A 3 (2%) : 0 (0%) 2 (1%) 172 (97%) 0.63 0.00064
G140A vs Q148R 0 (0%) : 5 (3%) 4 (2%) 168 (95%) 0.66 <0.0001
G140S vs Q148H/K/R 1 (1%) : 8 (5%) 47 (27%) 121 (68%) 0.88 <0.0001
G140A/C/S vs Q148H 6 (3%) : 0 (0%) 46 (26%) 125 (71%) 0.92 <0.0001
G140A/C/S vs Q148H/K/R
1 (1%) : 4 (2%) 51 (29%) 121 (68%) 0.93 <0.0001
G140S vs Q148H 2 (1%) : 0 (0%) 46 (26%) 129 (73%) 0.97 <0.0001Note: only Phi statistics>0.6 and P<0.01 are listedData Source: ING112574 Annex B Clinical Virology Report Table 12.104

CONFIDENTIALModule 2.7.2.4 Special Studies
114
Regression analyses
Regression analyses were used to determine specific mutations associated with Day 8 responses in a stepwise fashion. First mutations with a moderate association (p<0.3) were identified, Second, the identified mutations from step 1 were entered into a boostrap re-sampling analysis to quantify mutations significantly predicting Day 8 responses. Mutations identified in this analysis were E138A/K/T, E92Q, L68I, L74I, Q148H/K/R. Third, these mutations and their 2-way interaction terms were entered into a series of linear regression models with all possible parameter combinations. The results (impact) of these mutations and their interaction terms that remained in the best fit of model with the smallest AIC were displayed. Based on the results from this third step and the mutation prevalence analyses, IN mutation groups at Baseline were derived to better predict virologic response.
Derived IN resistance mutation group
Three IN mutation groups at Baseline were derived based on the results from the multivariate analysis:
No Q148 mutation (143, 155, 66, 92, or historical resistance only),
Q148+ 1 (Q148H/K/R with one mutation [G140A/C/S, L74I, E138A/K/T]), and
Q148 +2 (Q148H/K/R with two or three mutations (G140A/C/S, L74I, E138A/K/T).
Analysis of virologic response (Day 8/Week 24) by derived genotypic group
The analysis of Day 8 antiviral response by the derived IN mutation groups revealed that a full response (>1 log10 c/ml decrease in HIV-1 RNA or <50c/mL) was seen in 92% of subjects harbouring virus with no Q148 mutations. In virus with Q148 mutations, decreased proportions of subjects with full response were seen with each additional IN secondary resistance mutation (i.e. L74I, E138_AKT) (Table 88). A similar pattern of response by the derived IN mutation groups was seen at Week 24, which was independent of the activity of the background regimen as determined by the overall susceptibility score (OSS) (Table 89 and Table 90).
Table 88 Day 8 Virologic Response by Derived Mutational Group from the Part II Analysis, Day 8 VO Population
DTG 50mg BID Change from Baseline in VL (log10 c/mL) Full Responseb
Derived Group N Mean SD Median Min Max n (%)
No Q148 122 -1.59 0.509 -1.65 -3.4 0.0 112 (92)
Q148 + 1a 35 -1.18 0.520 -1.10 -2.6 -0.1 25 (71)
Q148 + 2a 20 -0.92 0.810 -0.735 -2.3 0.4 9 (45)a. L74I, Q138A/K/T , G140A/C/Sb. Full response: reduction from baseline in HIV-1 RNA>1 log10 c/mL or HIV-1 RNA <50 c/mL at Day 8Data Source: ING112574 Annex B Clinical Virology Report Table 12.106, Table 12.110

CONFIDENTIALModule 2.7.2.4 Special Studies
115
Table 89 Week 24 Virologic Response (HIV-1 RNA <50 c/mL) by Derived Mutational Group and OSS of OBR, Week 24 VO Population
HIV-1 RNA <50 c/mL at Week 24 (Snapshot)Derived IN Mutation Group OSS=0 OSS=1 OSS=2 OSS>2 Total
No Q148a, n (%) 2/2 (100) 24/29 (83) 21/28 (75) 10/13 (77) 57 (79)Q148 + 1b, n (%) 2/2 (100) 3/7 (43) 4/11 (36) 0 9 (45)
Q148 + 2b, n (%) 1/2 (50) 0/7 (0) 0 0 1 (11)a. 143, 155, 66, 92, historical resistant evidence only.b. G140A/C/S, E138A/K/T, L74IData Source: ING112574 Annex B Clinical Virology Report Table 12.107
Table 90 Week 24 Virologic Response (HIV-1 RNA <400 c/mL), by Derived Mutational Group and OSS of OBR, Week 24 VO Population
HIV-1 RNA <400 c/mL at Week 24 (Snapshot)
Derived IN Mutation Group OSS=0 OSS=1 OSS2 Total
No Q148a, n (%) 2/2 (100) 24/29 (83) 35/41 (85) 61 (85)
Q148 + 1b, n (%) 2/2 (100) 4/7 (57) 4/11 (36) 10 (50)
Q148 +2b, n (%) 1/2 (50) 1/7 (14) 0 2 (22)a. 143, 155, 66, 92, historical resistant evidence only.b. G140A/C/S, E138A/K/T, L74IData Source: m5.3.5.4 ING112574 Annex B Clinical Virology Report Table 12.114
Summary of analysis for phenotypic and genotypic correlates to antiviral response
CHMP guidance for new drug application in an existing class requires an attempted summary of antiviral activity for a new drug by phenotypic cut points and genotypic mutation scoring. This summary cannot be provided for DTG for the following reasons.Upper and lower phenotypic clinical cut-offs were estimated for DTG, but the confidence intervals around these values were very wide suggesting large uncertainty with the cut-offs (Table 84). No genotypic scoring could be derived from the dataset for this patient population, however 3 derived IN mutation groups were identified and short term and Week 24 responses are provided by these groups (Table 88 and Table 89). Study specific factors influencing this conclusion were a small study size, few subjects with high DTG FC and excellent short term antiviral response rates.
Ad-hoc analyses
As per the EMA guideline, data from the functional monotherapy phase were used to derive phenotypic cut-off points. The use of the functional monotherapy phase data allows assessment of the intrinsic activity of this investigational product and minimizes confounding factors. In study ING112574 the functional monotherapy phase was short (7 days), However, there were several limitations to using longer term on treatment study data to determine the phenotypic cut-off points for DTG in this clinical study.

CONFIDENTIALModule 2.7.2.4 Special Studies
116
Given that the activity of the background regimen was optimized at Day 8, investigating the impact of only DTG on antiviral response after this timepoint would be complicated by the need of controlling for the activity of the background regimen co-administered with DTG. This is further complicated when a ‘precise’ measure of the activity of the background regimen is difficult to obtain in such a highly treatment experienced population with potential archived resistant virus.
In a longer term investigation of the activity of DTG, drug adherence could also impact the accuracy of the derived phenotypic cut points. Incomplete compliance over time would provide an inaccurate determination of drug activity and could potentially result in lower phenotypic cut points.
Understanding these limitations and their potential impact on the derivation of a phenotypic cut point, an analysis was conducted using antiviral response data at Week 24 and DTG FC. This investigation was not part of the planned analysis and does not meet the EMA requirements for phenotypic cut point derivation and as such should be considered exploratory.
The number and proportion of subjects achieving full response (i.e. <50 c/mL, Snapshot) at Week 24 for each pre-specified DTG FC value at Baseline are summarized in Table 91. For example, 74% (57/77) of subjects with DTG FC ≤4 at baseline achieved full response at Week 24 and 30% ( 6/20) of subjects with DTG FC >4 also achieved full response at Week 24.
The number of subjects with DTG FC >10 is small (n=9).
Table 91 HIV-1 RNA <50 copies/mL (Snapshot) at Week 24 by Pre-specified DTG FC Value at Baseline (N=101)
Baseline DTG FC Pre-specified value
Less or Equal to Pre-specified Valuen (%)
Greater than Pre-specified Valuen (%)
2.5 55/71 (77) 8/26 (31)
4 57/77 (74) 6/20 (30)
8 62/88 (70) 1/9 (11)
10 63/92 (68) 0/5
15 63/94 (67) 0/3
20 63/96 (66) 0/1
25 63/97 (65) 0/0Note: Only 97 subjects with DTG FC available at Baseline were included in this analysis.
Data Source: ING112574 Annex B Clinical Virology Report Table 7.32
A receiver operating characteristic (ROC) analysis was produced in attempt to identify a DTG cut-off that would differentiate the Week 24 response (Figure 3). The X axis indicates ‘1 minus specificity’ (i.e. specificity: the proportion of responders at Week 24 with DTG FC ≤cut-off ). The Y axis indicates sensitivity (i.e. proportion of non-responders at Week 24 with DTG FC >cut-off). The perfect predictor would yield a point in the upper left corner or coordinate (0, 1) of the ROC space, representing 100%
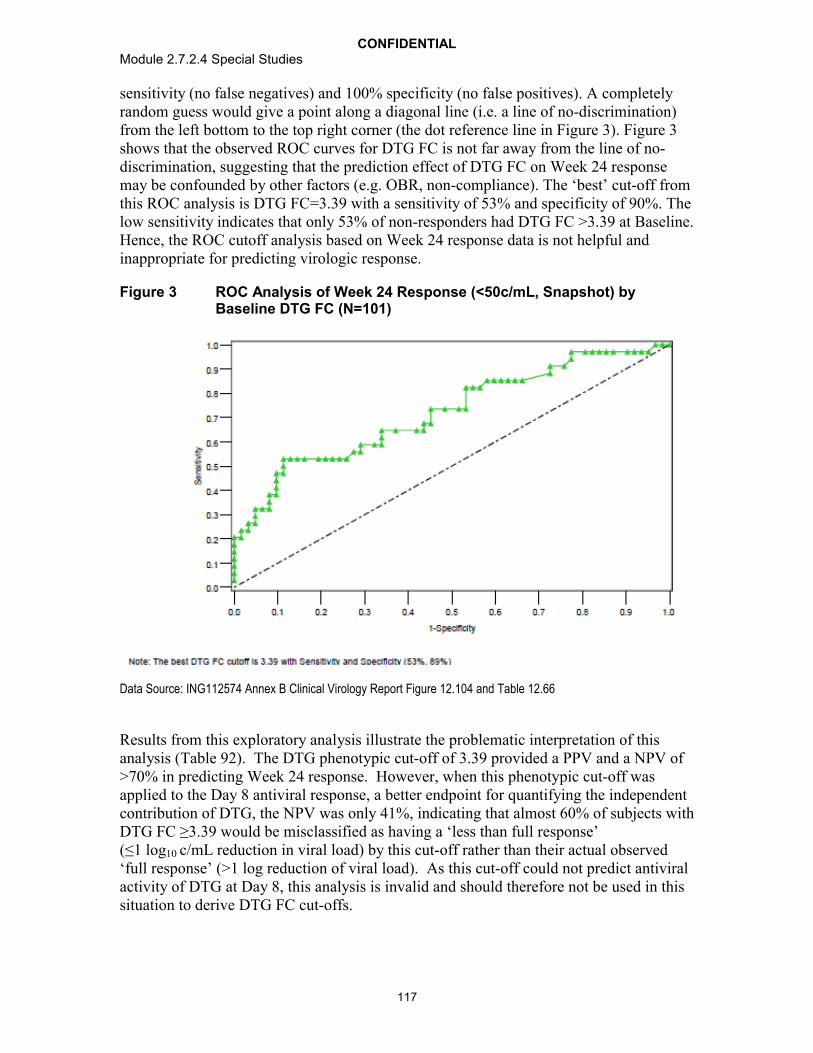
CONFIDENTIALModule 2.7.2.4 Special Studies
117
sensitivity (no false negatives) and 100% specificity (no false positives). A completely random guess would give a point along a diagonal line (i.e. a line of no-discrimination) from the left bottom to the top right corner (the dot reference line in Figure 3). Figure 3shows that the observed ROC curves for DTG FC is not far away from the line of no-discrimination, suggesting that the prediction effect of DTG FC on Week 24 response may be confounded by other factors (e.g. OBR, non-compliance). The ‘best’ cut-off from this ROC analysis is DTG FC=3.39 with a sensitivity of 53% and specificity of 90%. The low sensitivity indicates that only 53% of non-responders had DTG FC >3.39 at Baseline. Hence, the ROC cutoff analysis based on Week 24 response data is not helpful and inappropriate for predicting virologic response.
Figure 3 ROC Analysis of Week 24 Response (<50c/mL, Snapshot) by Baseline DTG FC (N=101)
Data Source: ING112574 Annex B Clinical Virology Report Figure 12.104 and Table 12.66
Results from this exploratory analysis illustrate the problematic interpretation of this analysis (Table 92). The DTG phenotypic cut-off of 3.39 provided a PPV and a NPV of >70% in predicting Week 24 response. However, when this phenotypic cut-off was applied to the Day 8 antiviral response, a better endpoint for quantifying the independent contribution of DTG, the NPV was only 41%, indicating that almost 60% of subjects with DTG FC ≥3.39 would be misclassified as having a ‘less than full response’ (≤1 log10 c/mL reduction in viral load) by this cut-off rather than their actual observed ‘full response’ (>1 log reduction of viral load). As this cut-off could not predict antiviral activity of DTG at Day 8, this analysis is invalid and should therefore not be used in thissituation to derive DTG FC cut-offs.

CONFIDENTIALModule 2.7.2.4 Special Studies
118
Table 92 Response Rate based on DTG FC Cut-off of 3.39
Timepoint DTG FC at Baseline Observed Response rate
PPV NPV
WK24 (<50c/mL) <3.39 56/72(78%) 78%
≥3.39 7/25 (28%) 72%
Day 8 (HIV-1 RNA reduction >1.0 log10 c/mL or <50 c/mL )
<3.39 112/122 (92%) 92%
≥3.39 29/49 (59%) 41%
Data Source: ING112574 Annex B Clinical Virology Report Table 12.113 and Table 12.109
Discussion:
According to the FDA and EMA Guidance for clinical development of medicinalproducts, antiviral activity of a new agent should be provided by Baseline phenotypic and genotypic resistance. In this report, phenotypic resistance was defined as the DTG FC cut-off and genotypic resistance was defined as the mutation or mutational group that leads to a reduced response. Since DTG phenotypic data are highly correlated to genotypic data, an assessment of DTG cut-off was conducted first. If this analysis provided a DTG FC cut-off with a modest PPV and NPV of >70%, an investigation of genotype would be performed.
Upper and lower phenotypic cut-offs were estimated from a non-linear regression model based on the antiviral response data at Day 8. However, the confidence intervals for both estimated cut-offs were very wide or not definable, suggesting large uncertainties with the two cut-offs. Not surprisingly, the prediction of long term response at Week 24 with these cut-offs was not accurate. The derived genotypic grouping appears to be more effective in predicting both short and long-term response. Results from this analysis complement those from the multivariate analysis presented in the m5.3.5.1,ING112574 Week 24 Clinical Study Report, which showed that baseline resistance (as DTG FC) was strongly associated with the Day 8 response in that increasing DTG FC led to smallerreductions in HIV-1 RNA. The low prediction rate of derived phenotypic cut-offs seen in this study could potentially be due to the study population responding well to DTG BID. In fact, 82% of subjects had a full response to DTG (>1 log10 c/mL decline from baseline in plasma HIV-1 RNA) at Day 8. Additional reasons for the low predictive value of the derived DTG FC cut-offs could be the small number of subjects with DTG FC greater than the derived cut-off for full response (8%, 15/177) in this INI-resistant population. Previous studies have shown that adequate sample size and sufficient numbers of subjects with elevated FC are required to ensure the accuracy of these determinations [de Meyer , 2008; Schapiro, 2010; de Luca , 2011].
Three IN mutation groups were derived from the analysis: ‘No Q148 mutation’ (Y143, N155H, T66, and E92Q mutations or historical evidence of INI resistance), ‘Q148+1’ (Q148H/K/R with one mutation [G140ACS, L74I, E138_AKT]), and ‘Q148+2’ (Q148H/K/R with two or three mutations [G140A/C/S, L74I, E138A/K/T]). At Day 8,
CONFIDENTIALModule 2.7.2.4 Special Studies
119
the majority (92%) of subjects harbouring virus with “No Q148” had a >1 log10 c/mL decline in HIV-1RNA, while 71% and 48% response rates were seen in subjects from the IN mutation groups Q148+1 and Q148+2, respectively. In this patient population, the Q148+2 virus was detected in only 11% of subjects at Baseline. This proportion is similar to that observed in larger INI resistant populations (m5.3.5.2, 2012N146158_00).
Results from this analysis confirm earlier in vitro and in vivo investigations of DTG, which showed that each additional IN secondary mutation in a Q148 mutant virus further reduced antiviral responses are expected [Kobayashi, 2011; Vavro, 2012]. One explanation for the better observed predictions with IN genotypic correlates as compared to DTG FC involves the broad range of DTG FC seen with Q148 mutant virus. As noted in earlier clinical investigation, DTG FC was highly correlated to IN resistance pathways in that moderate to high DTG FC was seen with the Q148 mutant virus and. the highest DTG FC was detected in virus with Q148+2 additional IN resistance mutations. In this study, a broad diversity in DTG FC was seen with Q148+2 virus. This broad diversity in DTG FC may be due to the presence of secondary mutations in disparate number and combinations, or due to wild-type virus masking mutant virus resistance when present as a positional mixture (e.g. as Q148Q/H G140G/S) [Underwood, 2009].
The three derived IN mutation groups also provided good prediction for Week 24 antiviral responses. As was seen with the Day 8 analysis, the vast majority of subjects with virus in the “No Q148” group achieved <400 c/mL at Week 24 (85%) and lower response rates were seen with Q148+1 and Q148 +2, 50% and 22 % respectively. Given the heavily treatment-experienced population that was enrolled in ING112574, the 22% of subjects with Q148+2 achieving HIV-1 RNA of <400 c/mL at Week 24 is an encouraging result, which may potentially be improved upon with the co-administration of a background regimen with robust antiviral activity (in this study a fully active boosted PI as part of Day 8 OBR was used in only 23% of subjects). In comparison with other studies in a similar patient population [Clotet 2007], the findings from this analysis suggest that a regimen of DTG BID given with an OBR with PSS1 will provide benefit to the majority of subjects and that the derived IN mutation groups can further aid prescribers who would use DTG in INI-resistant patients.
An exploratory analysis to produce DTG FC cut-offs using Week 24 viral responses was attempted and produced a DTG FC cut-off of 3.39 for full response (HIV-1 RNA <50c/mL). However, when this cut-off was applied to Day 8 responses it did not accurately predict viral response. Possible limitations to this exploratory analysis included additional antiviral effect of the background regimen at Week 24 and poor adherence over longer term evaluation [Brun-Vézinet , 2004]. The background regimen was optimized after 7 days of functional monotherapy, thereby limiting the opportunity to evaluate the precise effect of DTG alone longer-term. This exploratory analysis was conducted outside of the CHMP-recommended short-term treatment duration.
In conclusion, the analysis to determine phenotypic and genotypic correlates to viral responses provided IN genotypic mutational groups but no DTG FC cut-off that effectively predicted antiviral response. Therefore, Annex B requirements were met by providing Week 24 responses by OSS of the OBR and the derived IN genotypicmutational groups or pre-specified DTG FC categories. Our analyses suggest that the

CONFIDENTIALModule 2.7.2.4 Special Studies
120
derived IN genotypic group best describes the likelihood of response according to baseline resistance profile.
Periodic surveys of emerging IN mutation patterns may be necessary to sustain the accuracy of the derived genotypic groups to predict DTG antiviral response, particularly following more widespread use of the drug.
Conclusions
Increasing Baseline DTG FC was significantly associated with decreasing antiviral activity. However, no precise phenotypic FC cut-off could be defined to effectively predict antiviral activity at both Day 8 and Week 24.
Three baseline genotypic resistance groups were identified based on their differential impact on DTG antiviral response. These three distinct IN genotypic groups are:
o No Q148: includes Y143, N155H, T66, E92 mutations, or historical evidence of resistance;
o Q148+1: Q148H/K/R with one mutation of G140A/C/S, L74I, E138A/K/T]; and
o Q148+2: Q148H/K/R with two or more mutations of G140A/C/S, L74I, E138A/K/T.
The best antiviral responses (at both Day 8 and Week 24) were seen in the ‘No Q148’ group. In subjects harbouring virus of Q148, a decreased response was observed with increasing numbers of mutations of G140A/C/S, L74I, E138A/K/T.
The derived genotypic groups provide a robust and predictive genotypic guidance for response in this INI-resistant patient population.
4.2.2. Phase IIb Clinical Studies
Two Phase IIb studies were conducted for dose selection in INI-naive and INI-resistant patients, ING112276 (treatment-naive) and ING112961 (treatment-experienced, integrase-resistant). There were no INI resistance mutations nor changes in DTG susceptibility at the time of virologic failure for any of the three subjects receiving DTG in ING112276. DTG trough concentration for a single 50 mg dose in integrase inhibitor naïve subjects was 1.20 g/mL, 19 times higher than the estimated PA-IC90.
Due to the large diversity of IN genotypic profiles at baseline in ING112961 and upon virologic failure, and the limited number of subjects’ data, it is difficult to make any conclusions about INI resistance mutations selected by DTG and potential relationship with treatment outcome. The data in this Phase 2b study support the continued and definitive evaluation of 50mg BID DTG in Phase III in subjects with evidence of INI resistance at current or prior virologic failure with RAL or EVG containing regimen.

CONFIDENTIALModule 2.7.2.4 Special Studies
121
4.2.2.1. ING112276
Study Title: A Phase IIb study to select a once daily oral dose of GSK1349572 administered with either abacavir/lamivudine or tenofovir/emtricitabine in HIV-1 infected antiretroviral therapy naive adult subjects. 96 week results
Location of Report: 5.3.5.1
Study Design: Study ING112276 is a Phase IIb, randomized, multicentre, parallel group, dose-ranging study conducted in HIV-1 infected ART-naïve adults. The trial was partially blinded, i.e. subjects and their investigators were blinded to the dose of DTG. Subjects received DTG, at one of three doses, or EFV once daily, both co-administered with either abacavir sulfate (abacavir, ABC) and lamivudine (3TC), (abacavir/lamivudine, ABC/3TC), or tenofovir/emtricitabine (TDF/FTC) fixed dose combinations (FDC) as background therapy. The current analysis was conducted after the last subject completed Week 96. At the Week 96 visit, subjects randomized to EFV were discontinued from the study, while subjects randomized to receive DTG were given the opportunity to remain on the study while receiving DTG 50 mg during an open-label phase of the study.
Virologic failure was defined as a less than 1.0 log10 c/mL decrease in plasma HIV-1 RNA by week 4 unless the measure was lower than 400 c/mL, failure to suppress plasma HIV-1 RNA to less than 400 c/mL on or after week 24, rebound to 400 c/mL or more after suppression to less than 400 c/mL, or rebound to greater than 0.5 log10 above nadir if 400 c/mL or greater. Participants with confirmed virologic failure (two consecutive samples 1-4 weeks apart) were assessed for study discontinuation and had samples analyzed for genotypic and phenotypic resistance.
Results: Four subjects, including one subject who received EFV, had PDVF by week 48. No additional subjects had PDVF through week 96.
Subject 77, who received TDF/FTC and 10 mg of DTG, had a 2.84 log10 c/mL decline in RNA at Week 2, but rebounded at Week 4. The only RT resistance mutation observed on treatment was M184M/V. No INI-associated substitutions or changes in susceptibility to either DTG or RAL were demonstrated. This subject was withdrawn at the time of conformation.
Subject 102 received TDF/FTC and EFV, and had less than a 1 log10 c/mL decrease in HIV-1 RNA by Week 4. On treatment GT and PT showed no changes in RT, and the subject continued on study with subsequent suppression at Week 20.
Subject 99 met the definition of protocol-defined virologic failure at Week 24. The subject received ABC/3TC and DTG 25 mg and had a plasma HIV-1 RNA value of 404 c/mL at the Week 24 visit. The confirmatory plasma HIV-1 RNA value was 483 c/mL. There is documented noncompliance with study medication for this subject. At Baseline, this subject had no primary mutations in HIV reverse transcriptase or protease (RT/PRO) and no phenotypic resistance to NRTIs, NNRTIs or protease inhibitors (PIs).

CONFIDENTIALModule 2.7.2.4 Special Studies
122
Genotypic data (RT/PRO) could not be generated at virologic failure (Week 24), likely due to the low level of plasma HIV-1 RNA. There were no primary INI resistance mutations detected at either Day 1 or Week 24. This subject was withdrawn at the time of conformation.
Subject 808 who received ABC/3TC and 10 mg DTG, rebounded to >400 c/mL at Week 40. The subject was non-compliant with study medications at the time of virologic failure. Virologic failure was confirmed two week later prior to the subject becoming compliant with study medications. The subject began taking study medications and HIV-1 RNA was <400 c/mL three weeks after the confirmatory sample. No RT or INI mutations or changes in PT were detected at the time of virologic failure (Week 40). The subject continued in the study with continued response to therapy up to Week 108 at which time the subject withdrew..
There were no integrase inhibitor resistance mutations nor changes in DTG susceptibility at the time of virologic failure for any of the three subjects receiving DTG.
Dolutegravir trough concentration for a single 50 mg dose in integrase inhibitor naïve subjects was 1.20 g/mL, 19 times higher than the estimated PA-IC90.
Discussion
A low rate of confirmed protocol-defined virological failure was observed with notreatment emergent mutations in the integrase gene detected in the three subjects receiving DTG who developed virologic failure. The rate of viral decay was much faster in the DTG treatments arms than the EFV arm, similar to what has been observed for Raltegravir, indicating a unique mechanism of the antiviral activity of integrase inhibitors. A post hoc analyses using an assay with a lower limit of detection of <2 c/mL at Weeks 16, 24, 48 and 96 confirmed the faster rate of decay of subjects in the 50 mg dose arm than the EFV control
Conclusions
No subject in the 50 mg DTG group met protocol defined virologic failure through 96 weeks. No integrase mutation swere identified in this study.
Dolutegravir trough concentration for a single 50 mg dose in integrase inhibitor naïve subjects was 1.20 mcg/mL, 19 times higher than the estimated PA-IC90.
4.2.2.2. ING112961
Study Title: A Phase IIb pilot study to assess the antiviral activity of dolutegravir containing regimen in antiretroviral therapy (ART)-experienced, HIV-1-infected adult subjects with raltegravir resistance (Cohort I Week 96, Cohort II Week 48)
Location of Report: 5.3.5.2

CONFIDENTIALModule 2.7.2.4 Special Studies
123
Study Design: Study ING112961 (VIKING) was a Phase IIb, multicenter, open-label, single arm pilot study to assess the antiviral activity of dolutegravir (DTG) containing regimen in human immunodeficiency virus type 1 (HIV-1) infected ART-experienced adults with raltegravir (RAL) resistance. The study was originally designed to include approximately 30 ART-experienced subjects with either current or past virologic failure to RAL and harbouring RAL associated, primary IN resistance mutations. As pre-specified in the protocol, as some subjects with higher level of DTG resistance had an inadequate response to DTG 50 mg once daily, an additional cohort exploring a higher dose of DTG (50 mg BID) was initiated. In Cohorts I and II, subjects with current RAL virologic failure substituted RAL with DTG 50 mg once daily (Cohort I) or twice daily (Cohort II) or subjects with historical RAL virologic failure added DTG 50 mg once daily(Cohort I) or twice daily (Cohort II). On Day 11 all subjects continued DTG and optimized their background therapy, where feasible, but were required to have at least 1 fully active background drug (PSS1) in Cohort II. Antiviral activity, safety and tolerability of DTG were evaluated at Day 11 and over time.
Methods for Virologic Analysis: Baseline IN genotypic resistance data were used to produce 6 categories for analysis based on mutational pathway: (1) Q148 + 1 (associated mutation at one of codons 74, 138, or 140, but not codons 155 or 143); (2) Q148 + 2(associated mutations at 2 of codons 74, 138, or 140, but not 155 or 143); (3) mixture (mutations at codons 148,155 or 143); (4) N155 (mutations at codon 155 but not at 148 or143); (5) Y143 (mutations at codon 143 but not at 148 or 155); and (6) other (no mutations at codons 148, 155, or 143). A comparison of on-treatment to Day 1 genotypic and phenotypic data was made for all subjects with data available at Day 11 (samples with plasma HIV-1 RNA ≥150c/mL) and for subjects meeting the criteria for PDVF.
Protocol-defined virologic failure was defined as the following: at Day 11,<0.7 log10 c/mL decrease in plasma HIV 1 RNA unless absolute value was <400 c/mL; ator after Week 8, <1.0 log10 c/mL decrease unless absolute value was <400 c/mL, or 1.0 log10 c/mL increase in plasma HIV-1 RNA from the nadir value; or for visits at or after Week 16, plasma HIV-1 400 c/mL. Virologic failure at Day 11 was based on a single plasma HIV-1 RNA evaluation and did not require confirmation. Confirmation testing was required for visits at or after Week 8.
Results:
The Baseline Populations for viral genotyping/phenotyping analyses for Cohort I (N=27) and Cohort II (N=24) included all subjects in the Intent-to-Treat (Exposed) population(ITT-E). All on-treatment genotypic and phenotypic data were compared with Baseline data (Day 1).
The On-treatment Resistance Populations for Cohort I (N=16) and Cohort II (N=5) consisted of ITT-E subjects who met the criteria for protocol-defined virologic failure(PDVF). These subjects were tested at the first timepoint of the PDFV criterion rather than at the confirmatory test (if applicable) and the resulting viral genotypic and/or phenotypic data were compared to the Baseline (Day 1) data. Additionally, an ad hoc analysis of INI genotype and phenotype was conducted at Day 11 for any subject with plasma HIV-1 RNA 150 c/mL.

CONFIDENTIALModule 2.7.2.4 Special Studies
124
Baseline (Day 1) Viral Genotyping/Phenotyping Analyses
Prior RAL duration by In Mutational Group
In Cohort I, 18/27 subjects entered the study with Screening RAL signature mutations consistent with the protocol-led Group Q148, Y143 or N155 and 9/27 subjects entered with RAL associated mutations consistent with Group Q148+>1. For the 24 subjects enrolled in Cohort II, 13/24 subjects entered with Screening RAL signature mutations consistent with Group Q148, Y143 or N155 and 11/24 subjects entered with RAL associated mutations consistent with Group Q148+>1.
Prevalence of IN Substitutions at Day 1 by IN Mutational Group.
Table 93 and Table 94 give the summary of INI resistance-associated substitutions as well as several additional IN substitutions observed in greater than 50% of the viral genotypes examined.
Cohort I
The Y143 group (N=12) was the largest mutational group and showed the most viral diversity with 10/12 viral populations also harbouring: L74L/M, M or I; T97T/A or A and less frequently substitutions at the 138 or 163 positions.

CONFIDENTIALModule 2.7.2.4 Special Studies
125
Table 93 Cohort I: Summary of the Prevalence of IN substitutions by INI Mutational Group
a
IN Codonb Q148 + 2N=3
Q148 +1N=4
MixtureN=2
Y143N=12
N155N=4
OtherN=2
TotalN=27
V72I 3 4 2 12 4 2 27L74I,M 2 - - 10 1 - 13E92Q - - - - - 1 1T97A - - - 10 2 - 12
L101I,T 2 3 2 7 2 1 17V113I,L 3 4 2 11 3 2 25
S119P,R,G,T 1 3 1 10 2 1 18T124N,S,A,D 3 2 1 7 4 2 19
E138K,T,A,D,Q,P 1 - 1 4 1 - 7G140S 3 4 2 - - - 9
Y143H,R,C 2 12 - - 14Q148H,R 3 4 2 - - - 9
V151I - - - - 3 - 3N155H - - - - 4 - 4G163R 1 - - 3 1 - 5G193D - - - 1 - - 1V201I 1 3 1 6 3 1 15
V234L,I 2 4 2 11 4 1 24a. Pre-defined IN mutations are highlighted in grey rows b. Note that some mutations detected were mixtures of amino acids.Data Source: m5.3.5.1 ING112961 Cohort I Week 96/ Cohort II Week 48 CSR Table 12.4 and Table 12.11
Each subject with viral isolates harbouring the Q148H/R mutation (n=9), also had RAL associated mutation G140S, and IN substitutions at position 113 and 72. The Q148K mutation was not observed. For those in the Q148+2 mutational group (N=3), all 3 had G140S, two viruses harboured L74I and one had E138K/T. For the viral isolates in the Q148+1 mutational group (N=4), all 4 had G140S only. The Mixture group (N=2) could include viruses with Q148H/K/R and N155H or Y143C/H/R. In this study only mixtures of Q148H and Y143H were detected.
For the 4 subjects with virus from the N155H group, 3/4 viral populations additionally had the V151I or V/I, 2/4 had T97A and one had L74 L/M/I.
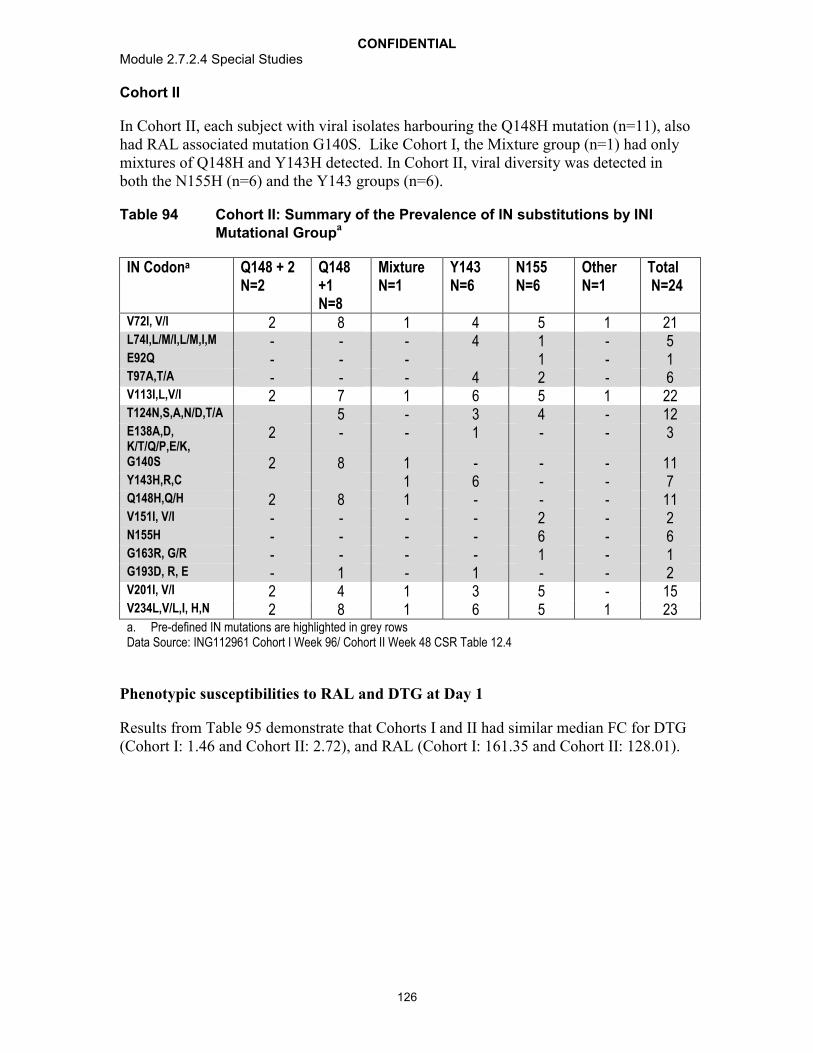
CONFIDENTIALModule 2.7.2.4 Special Studies
126
Cohort II
In Cohort II, each subject with viral isolates harbouring the Q148H mutation (n=11), also had RAL associated mutation G140S. Like Cohort I, the Mixture group (n=1) had only mixtures of Q148H and Y143H detected. In Cohort II, viral diversity was detected in both the N155H (n=6) and the Y143 groups (n=6).
Table 94 Cohort II: Summary of the Prevalence of IN substitutions by INI Mutational Group
a
IN Codona Q148 + 2N=2
Q148 +1N=8
MixtureN=1
Y143N=6
N155N=6
OtherN=1
TotalN=24
V72I, V/I 2 8 1 4 5 1 21L74I,L/M/I,L/M,I,M - - - 4 1 - 5E92Q - - - 1 - 1T97A,T/A - - - 4 2 - 6V113I,L,V/I 2 7 1 6 5 1 22T124N,S,A,N/D,T/A 5 - 3 4 - 12E138A,D, K/T/Q/P,E/K,
2 - - 1 - - 3
G140S 2 8 1 - - - 11Y143H,R,C 1 6 - - 7Q148H,Q/H 2 8 1 - - - 11V151I, V/I - - - - 2 - 2N155H - - - - 6 - 6G163R, G/R - - - - 1 - 1G193D, R, E - 1 - 1 - - 2V201I, V/I 2 4 1 3 5 - 15V234L,V/L,I, H,N 2 8 1 6 5 1 23a. Pre-defined IN mutations are highlighted in grey rows Data Source: ING112961 Cohort I Week 96/ Cohort II Week 48 CSR Table 12.4
Phenotypic susceptibilities to RAL and DTG at Day 1
Results from Table 95 demonstrate that Cohorts I and II had similar median FC for DTG (Cohort I: 1.46 and Cohort II: 2.72), and RAL (Cohort I: 161.35 and Cohort II: 128.01).

CONFIDENTIALModule 2.7.2.4 Special Studies
127
Table 95 Summary of Day 1 Susceptibility for DTG and RAL in Cohorts I and II
Drug Fold Change compared to wildtype virus
Cohort I50 mg once daily
N=27n (%)
Cohort II50 mg twice daily
N=24n (%)
DTG <1 5 (19) 2 (8)1-<2 11 (41) 7 (29)2-<4 2 (7) 5 (21)4-<8 4(15) 8 (33)
8 5 (19) 2 (8)
DTG Median (range)
- 1.46(0.55-35)
2.72(0.87-9.48)
Raltegravir <1 1 (4) 1 (4)1-<2 - 1 (4)2-<4 - -4-<8 1 (4) -
8 to Max of assay limit 7 (26) 9 (38)
Max of assay limit 18 (67) 13 (54)
Raltegravir Median (range)
- 161.35(0.57-165.54)
128.01(0.78-182.79)
Data Source: ING112961 Cohort I Week 96/ Cohort II Week 48 CSR Table 12.26
Results from Table 96 demonstrate that viruses with RAL signature changes, Y143 and N155 have relatively low fold changes in susceptibility to DTG. However for viruses in both Cohorts harbouring multiple mutations with Q148 (Q148+2, Q148+1, and Mixture groups), all but one subject’s virus have DTG FC >3 suggesting that as the number of RAL associated secondary mutations increased so did DTG FC for these viruses.

CONFIDENTIALModule 2.7.2.4 Special Studies
128
Table 96 Summary of Median Fold Change for DTG by IN Mutational Group
INI Mutational Group
Cohort I50 mg once daily
(N=27)
Cohort II50 mg twice daily
(N=24)n Median FC (range) n Median FC (range)
All 27 1.46(0.55-35)
24 2.72(0.87-9.48)
Q148 +2 3 21(14-35)
2 4(2.1-6.0)
Q148 +1 4 5.5(3.3-25)
8 5.5(4.1-8.2)
Mixturea 2 7.8(6.5-9.1)
1 9.48
Y143 12 1.1(0.6-1.4)
6 1.2(0.92-1.8)
N155 4 1.8(1.5-5.1)
6 2.3(1.3-4.0)
Otherb 2 1.2(0.9-1.5)
1 0.9
a. Subjects with virus containing more than one Y143, Q148 or N155 mutation at Day 1. For Cohort I –Subject 1680: Q148H, Y143H, and G140S; Subject 1703: Q148H, Y143H, G140S, and E138A and for Cohort II – Subject 2432:Q148H, Y143Y/H, and G140S
b. Subjects with virus having no mutations at codons 143, 148, or 155 at Day 1. Cohort I - Subject 1662 and 1811 and Cohort II – Subject 2320
Data Source: ING112961 Cohort I Week 96/ Cohort II Week 48 CSR Table 12.39
On Treatment Viral Genotyping / Phenotyping
Paired Analysis of Day 1 and Day 11 Integrase Genotypic and Phenotypic Results
Of the 27 subjects in Cohort I and the 24 subjects in Cohort II, 18 and 15 subjects respectively, had samples at Day 11 with HIV-1 RNA 150 c/mL allowing assessment of further IN genotypic evolution or reduction in DTG susceptibility during the functional monotherapy phase of the study. Table 97 and Table 98 provide data summaries inCohorts I and II, respectively.
IN genotypic and/or phenotypic changes resulting in further IN genotypic evolution or further reduced susceptibility to DTG were noted in 3 (1630, 1680 and 1633) of the 18 subjects with paired Day 1 and Day 11 data from Cohort I. Two (subjects 1630 and1680) of these 3 subjects, each with <0.7 log10 c/mL decline at Day 11 (virologic failure), had apparent changes in DTG FC although values for subject 1630 were within 1 standard deviation of each other, possibly reflecting assay variance.
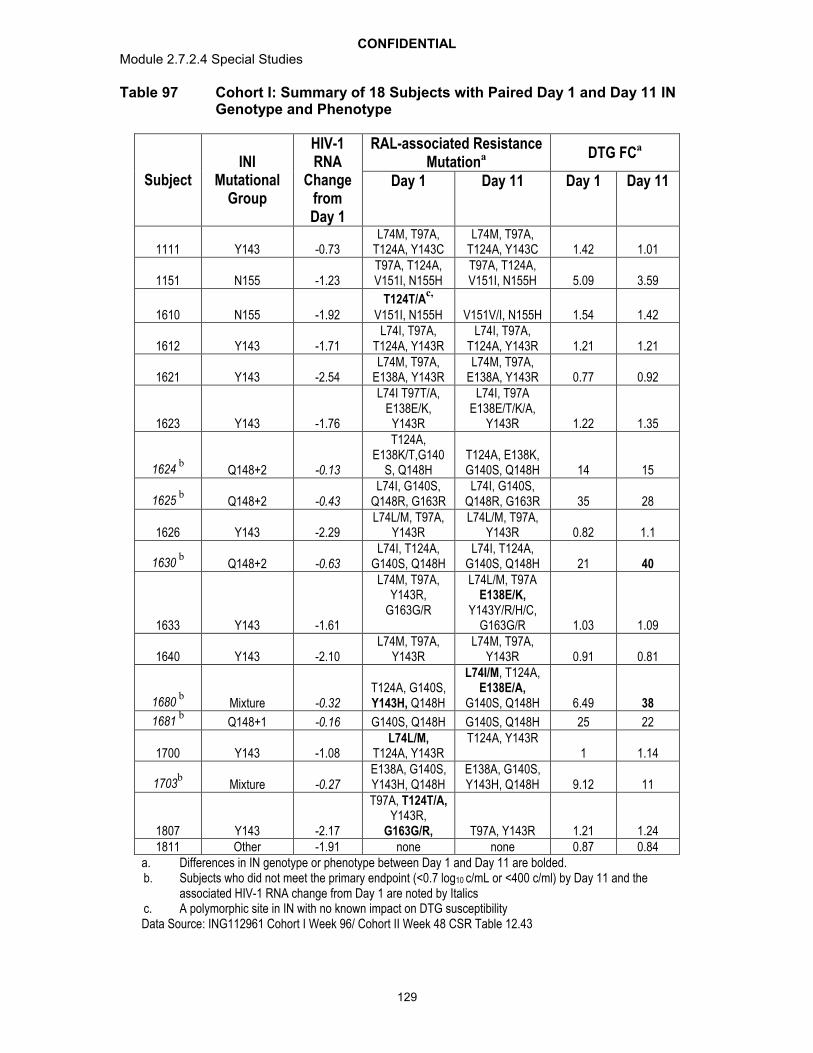
CONFIDENTIALModule 2.7.2.4 Special Studies
129
Table 97 Cohort I: Summary of 18 Subjects with Paired Day 1 and Day 11 IN Genotype and Phenotype
SubjectINI
Mutational Group
HIV-1 RNA
Change from Day 1
RAL-associated Resistance Mutationa DTG FCa
Day 1 Day 11 Day 1 Day 11
1111 Y143 -0.73L74M, T97A,
T124A, Y143CL74M, T97A,
T124A, Y143C 1.42 1.01
1151 N155 -1.23T97A, T124A, V151I, N155H
T97A, T124A, V151I, N155H 5.09 3.59
1610 N155 -1.92T124T/A
c,
V151I, N155H V151V/I, N155H 1.54 1.42
1612 Y143 -1.71L74I, T97A,
T124A, Y143RL74I, T97A,
T124A, Y143R 1.21 1.21
1621 Y143 -2.54L74M, T97A,
E138A, Y143RL74M, T97A,
E138A, Y143R 0.77 0.92
1623 Y143 -1.76
L74I T97T/A, E138E/K,
Y143R
L74I, T97A E138E/T/K/A,
Y143R 1.22 1.35
1624b
Q148+2 -0.13
T124A, E138K/T,G140
S, Q148HT124A, E138K, G140S, Q148H 14 15
1625b
Q148+2 -0.43L74I, G140S,
Q148R, G163RL74I, G140S,
Q148R, G163R 35 28
1626 Y143 -2.29L74L/M, T97A,
Y143RL74L/M, T97A,
Y143R 0.82 1.1
1630b
Q148+2 -0.63L74I, T124A,
G140S, Q148HL74I, T124A,
G140S, Q148H 21 40
1633 Y143 -1.61
L74M, T97A, Y143R,
G163G/R
L74L/M, T97A E138E/K,
Y143Y/R/H/C, G163G/R 1.03 1.09
1640 Y143 -2.10L74M, T97A,
Y143RL74M, T97A,
Y143R 0.91 0.81
1680b
Mixture -0.32T124A, G140S,Y143H, Q148H
L74I/M, T124A, E138E/A,
G140S, Q148H 6.49 38
1681b
Q148+1 -0.16 G140S, Q148H G140S, Q148H 25 22
1700 Y143 -1.08L74L/M,
T124A, Y143RT124A, Y143R
1 1.14
1703b
Mixture -0.27E138A, G140S,Y143H, Q148H
E138A, G140S,Y143H, Q148H 9.12 11
1807 Y143 -2.17
T97A, T124T/A,Y143R,
G163G/R, T97A, Y143R 1.21 1.241811 Other -1.91 none none 0.87 0.84
a. Differences in IN genotype or phenotype between Day 1 and Day 11 are bolded. b. Subjects who did not meet the primary endpoint (<0.7 log10 c/mL or <400 c/ml) by Day 11 and the
associated HIV-1 RNA change from Day 1 are noted by Italicsc. A polymorphic site in IN with no known impact on DTG susceptibilityData Source: ING112961 Cohort I Week 96/ Cohort II Week 48 CSR Table 12.43
CONFIDENTIALModule 2.7.2.4 Special Studies
130
For Cohort II, the single subject (2340) who met the virologic failure definition at Day 11, showed no evidence of IN genotypic or phenotypic change in his virus. IN genotypic and phenotypic differences were noted in only 3 (2202,2310 and 2430) of the 15 subjects with paired Day 1 and Day 11 viral isolate data and all were mixtures of INI mutations that were not seen at Day 1 and detected in virus with Q148H +>1 additional INI resistance associated mutations at Day 1. Genotypic changes in integrase resulted in changes in DTG FC in 2/2 subjects (2202 and 2430) with Day 11 phenotypic data. In both subjects a mixture at T97T/A was noted. One additional subject (2310) had virus with a mixture of N155N/H at Day 11 with no corresponding IN phenotypic result for comparison.

CONFIDENTIALModule 2.7.2.4 Special Studies
131
Table 98 Cohort II: Summary of 15 Subjects with Paired Day 1 and Day 11 IN Genotype and Phenotype
SubjectINI Mutational Group
HIV-1 RNA Change from Day 1
RAL-associated Resistance Mutationa DTG FCa
Day 1 Day 11 Day 1
Day 11
2110 Q148+1 -0.79T124Ac, G140S,
Q148HT124A, G140S,
Q148H8.23 8.94
2115 Q148+1 -1.43T124A, G140S,
Q148HT124A, G140S,
Q148H4.84 5.08
2200 Y143 -1.95 L74M,T97A, Y143C L74M,T97A, Y143C 1.77 1.74
2202 Q148+2 -1.79E138E/K, G140G/S,
Q148Q/HT97T/A, E138E/K,
G140S, Q148H2.10 11
2310 Q148+1 -1.57 G140S, Q148HG140S, Q148H,
N155N/H6.23 NR
2320 Other -2.92 None None 0.87 0.90
2340b N155H -0.46
T97A, T124A,V151I, N155H
T97A, T124A,V151I, N155H
3.94 4.25
2400 Q148+1 -1.99 G140S, Q148H G140S, Q148H 4.48 4.65
2415 Y143 -2.08L74L/M, T97T/A, T124A, Y143Y/C,
L74L/M, T97T/A, T124A, Y143Y/C,
1.01 1.26
2430 Q148+2 -0.9E138A, G140S,
Q148HT97T/A, E138T/A,
G140S, Q148H6.04 21
2431 Y143 -2.06 Y143C, G193/ET124T/A
c, Y143C,
G193E1.63 1.77
2432Mixture
(Q148+Y143)-1.35
G140S, Y143Y/H/R/C, Q148H
G140S, Y143Y/H, Q148H
9.48 4.94
2440 Y143 -2.07 T97A,Y143C T97A,Y143C 1.35 1.56
2442 Y143 -2.06L74L/M, T97T/A,
T124A, Y143Y/R/H/CL74M, T97A,
T124A, Y143R0.92 1.11
2462 Q148+1-1.97 T124A, G140S,
Q148HNR 4.11 NR
2110 Q148+1 -0.79T124A, G140S,
Q148HT124A, G140S,
Q148H8.23 8.94
2115 Q148+1 -1.43T124A, G140S,
Q148HT124A, G140S,
Q148H4.84 5.08
2200 Y143 -1.95 L74M,T97A, Y143C L74M,T97A, Y143C 1.77 1.74a. Differences in IN genotype or phenotype between Day 1 and Day 11 are bolded. b. Subjects who did not meet the primary endpoint (<0.7 log10c/mL or <400 c/ml) by Day 11 and the associated HIV-
1 RNA change from Day 1 are noted by Italics.c. A polymorphic site in IN with no known impact on DTG susceptibility.Data Source: ING112961 Cohort I Week 96/ Cohort II Week 48 CSR Table 12.43
IN Genotypic and Phenotypic Analyses of Virus at Protocol-Defined VirologicFailure
Protocol-defined virologic failure was defined as the following: at Day 11,<0.7 log10 c/mL decrease in plasma HIV 1 RNA unless absolute value was <400 c/mL; at or after Week 8, <1.0 log10 c/mL decrease unless absolute value was <400 c/mL, or 1.0 log10 c/mL increase in plasma HIV-1 RNA from the nadir value; or for visits at or after Week 16, plasma HIV-1 400 c/mL. Virologic failure at Day 11 was based on a

CONFIDENTIALModule 2.7.2.4 Special Studies
132
single plasma HIV-1 RNA evaluation and did not require confirmation. Confirmation testing was required for visits at or after Week 8.
For Cohort I, during the 96 weeks of DTG treatment (with OBR from Day 11 onward), 16/27 (59%) subjects met the PDVF criteria, with 13 identified by Week 48 . In Cohort II there was no new subject experiencing virologic failure post Week 24. Seven of the 24 subjects in this cohort had completed Week 60 by the data cut-off. Table 99 summarises protocol-defined virologic failure for both cohorts.
Table 99 Summary (cumulative) of Protocol-Defined Virologic Failures by Visit (ITT-E)
Week Cohort I50 mg once daily
(N=27)n (%)
Cohort II50 mg twice daily
(N=24)n (%)
Day 11 6 (22) 1(4)Week 8 7 (26) 3 (13)
Week 12 9 (33) 3 (13)Week 16 10 (37) 5 (21)Week 20 10 (37) 5 (21)Week 24 12 (44) 5 (21)Week 32 12 (44) 5 (21)Week 40 12 (44) 5 (21)Week 48 13 (48) 5 (21)Week 60 13 (48) NAWeek 72 14 (52) NAWeek 84 15 (56) NAWeek 96 16 (59) NA
NA=not applicableData Source: ING112961 Cohort I Week 96/ Cohort II Week 48 CSR Table 7.20
In Table 100 and Table 101 below IN genotypic and phenotypic data are summarised for the subjects in Cohorts I and II experiencing virologic failure, noting subjects regarded as PDVFs through Weeks 48 (Cohort I) and 24 (Cohort II) have been discussed previously[m5.3.5.2, 2011N116146].
Through Week 96, 8/16 subjects identified as PDVFs in Cohort I harboured virus at the failure timepoint with IN genotypic and/or phenotypic treatment emergent changes. These 8 subjects were 1680, 1811, 1623, 1621, 1640, 1141, 1151 and 1171 (subject 1630 is not included, because the DTG FC increase was <2 fold). Three additional subject in Cohort I have met the PDFV criteria since the cut-off for the previous report (subjects1141, 1151, 1171):
Subject 1141 with virologic failure at Week 72 harboured virus with L74L/M/I, T124A, V151V/I, N155H, G163G/R at Day 1 but had further evolution to L74M, T124A, G140S,

CONFIDENTIALModule 2.7.2.4 Special Studies
133
Q148H N155H and the DTG FC for this subject was 2.14 and 109 respectively for Day 1 and Week72.
Subject 1171 who experienced virologic failue at Week 96 had virus at Day 1 with Q148H + 1 but added T97A and E138E/K at the virologic failure timepoint while the DTG FC increased from 5.9 at Day 1 to 68.5 at Week 96.
Subject 1151, who met the PDVF criteria at Week 84, was one of three subjects (1151, 1630, 1623) whose virus exhibited an increased DTG FC without corresponding change in IN genotype.
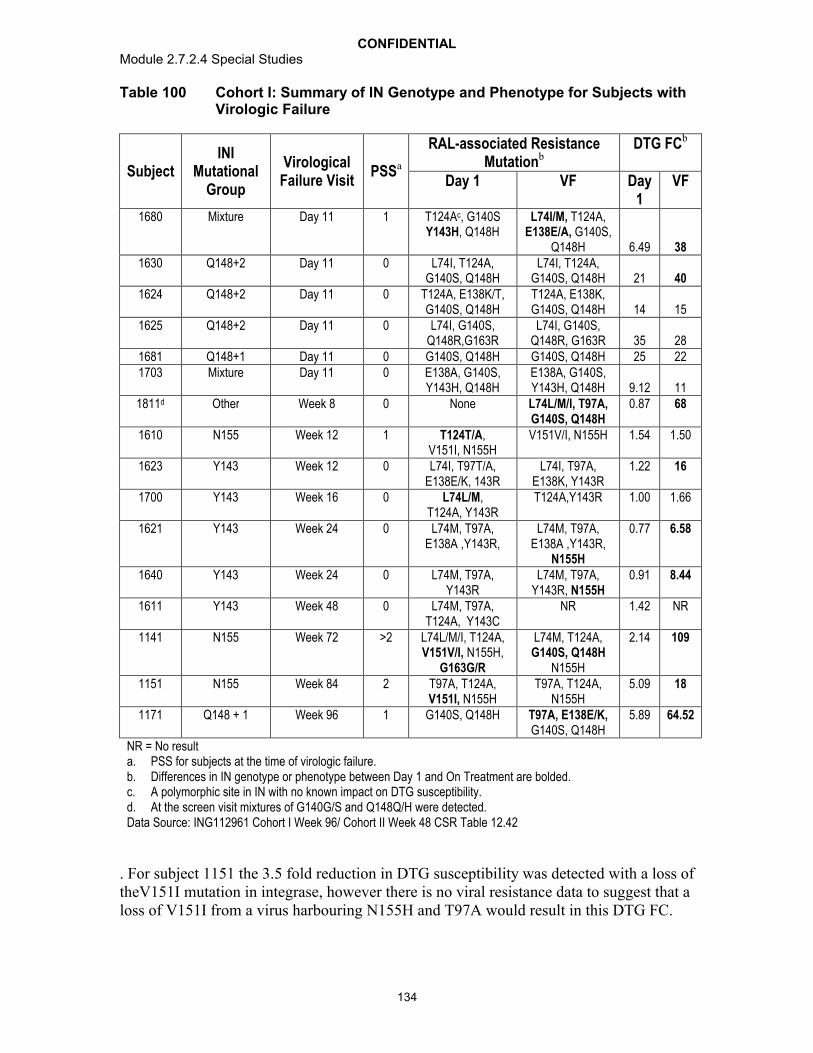
CONFIDENTIALModule 2.7.2.4 Special Studies
134
Table 100 Cohort I: Summary of IN Genotype and Phenotype for Subjects with Virologic Failure
SubjectINI
Mutational Group
Virological Failure Visit
PSSa
RAL-associated Resistance Mutationb
DTG FCb
Day 1 VF Day 1
VF
1680 Mixture Day 11 1 T124Ac, G140S Y143H, Q148H
L74I/M, T124A, E138E/A, G140S,
Q148H 6.49 381630 Q148+2 Day 11 0 L74I, T124A,
G140S, Q148HL74I, T124A,
G140S, Q148H 21 401624 Q148+2 Day 11 0 T124A, E138K/T,
G140S, Q148HT124A, E138K, G140S, Q148H 14 15
1625 Q148+2 Day 11 0 L74I, G140S, Q148R,G163R
L74I, G140S, Q148R, G163R 35 28
1681 Q148+1 Day 11 0 G140S, Q148H G140S, Q148H 25 221703 Mixture Day 11 0 E138A, G140S,
Y143H, Q148HE138A, G140S, Y143H, Q148H 9.12 11
1811d Other Week 8 0 None L74L/M/I, T97A, G140S, Q148H
0.87 68
1610 N155 Week 12 1 T124T/A,V151I, N155H
V151V/I, N155H 1.54 1.50
1623 Y143 Week 12 0 L74I, T97T/A, E138E/K, 143R
L74I, T97A, E138K, Y143R
1.22 16
1700 Y143 Week 16 0 L74L/M,T124A, Y143R
T124A,Y143R 1.00 1.66
1621 Y143 Week 24 0 L74M, T97A, E138A ,Y143R,
L74M, T97A, E138A ,Y143R,
N155H
0.77 6.58
1640 Y143 Week 24 0 L74M, T97A, Y143R
L74M, T97A, Y143R, N155H
0.91 8.44
1611 Y143 Week 48 0 L74M, T97A, T124A, Y143C
NR 1.42 NR
1141 N155 Week 72 >2 L74L/M/I, T124A, V151V/I, N155H,
G163G/R
L74M, T124A, G140S, Q148H
N155H
2.14 109
1151 N155 Week 84 2 T97A, T124A, V151I, N155H
T97A, T124A, N155H
5.09 18
1171 Q148 + 1 Week 96 1 G140S, Q148H T97A, E138E/K,G140S, Q148H
5.89 64.52
NR = No resulta. PSS for subjects at the time of virologic failure. b. Differences in IN genotype or phenotype between Day 1 and On Treatment are bolded. c. A polymorphic site in IN with no known impact on DTG susceptibility.d. At the screen visit mixtures of G140G/S and Q148Q/H were detected.Data Source: ING112961 Cohort I Week 96/ Cohort II Week 48 CSR Table 12.42
. For subject 1151 the 3.5 fold reduction in DTG susceptibility was detected with a loss of theV151I mutation in integrase, however there is no viral resistance data to suggest that a loss of V151I from a virus harbouring N155H and T97A would result in this DTG FC.

CONFIDENTIALModule 2.7.2.4 Special Studies
135
For the 16/27 subjects meeting the protocol definition for virologic failure in Cohort I per the current data cut-off, 11 subjects had a PSS of 0 for their background regimenadministered at time of failure.
In Cohort II, 5/24 subjects met the definition for virologic failure through Week 48, all of whom have been discussed previously [m5.3.5.2, 2011N116146_00]. Inclusion intoCohort II mandated one fully active drug in the OBR from Day 11 onward and as such no subject with virologic failure in Cohort II had PSS=0.
Three of the 5 PDVFs in Cohort II had treatment emergent resistance-associated IN mutations and reduced DTG susceptibility at the time point of failure. All 3 subjects(2310, 2430 and 2462) at Day 1 harboured virus with Q148 +1 additional IN resistance associated mutations and virus all 3 subjects had further evolution in integrase resulting in a virus with Q148H + >3 additional INI associated resistance mutations Furthermore in each case there was an increase in DTG FC detected.
Table 101 Cohort II: Summary of IN Genotype and Phenotype for Subjects with Virologic Failure
SubjectINI
Mutational Group
VirologicFailure
VisitPSSa
RAL-associated Resistance Mutationb
DTG FCb
Day 1 VF Day 1
VF
2310 Q148+1 Week 16 2G140S, Q148H
T97T/A,E138E/K,G140S,Q148H, N155H
6.23 93
2340 N155H Day 11 1T97A,
T124A,V151I, N155H
T97A, T124A,V151I, N155H
3.94 4.25
2415 Y143 Week 16 1
L74L/M, T97T/A, T124A,
Y143Y/C,
T97T/A, T124A, Y143Y/C, 1.01 1.21
2430 Q148+2 Week 8 1E138A, G140S, Q148H
E92E/Q, T97T/A,
T124T/Ad, E138Tc,G140S, Q148H
6.04 42.32
2462 Q148+1 Week 8 4T124A, G140S, Q148H
E92E/Vc, T124A, E138E/K, G140S, Q148H, N155H
4.11 63
a. PSS for subjects at the time of virologicafailure. b. Differences in IN genotype or phenotype between Day 1 and Day 11 are bolded. c. Specific amino acids seen at these positions not identified in list of amino acids associated with INI resistance.d. A polymorphic site in IN with no known impact on DTG susceptibilityData Source: ING112961 Cohort I Week 96/ Cohort II Week 48 CSR Table 12.42.
For subjects meeting protocol-defined virologic failure in both Cohort I and II, there was minimal further evolution in RT and PR.
In viral genotypic an phenotypic data for the last timepoint on study for selected subjects
To further monitor the development of resistance to DTG, both the genotypic and phenotypic susceptibility to DTG were determined at the last timepoint on study meeting
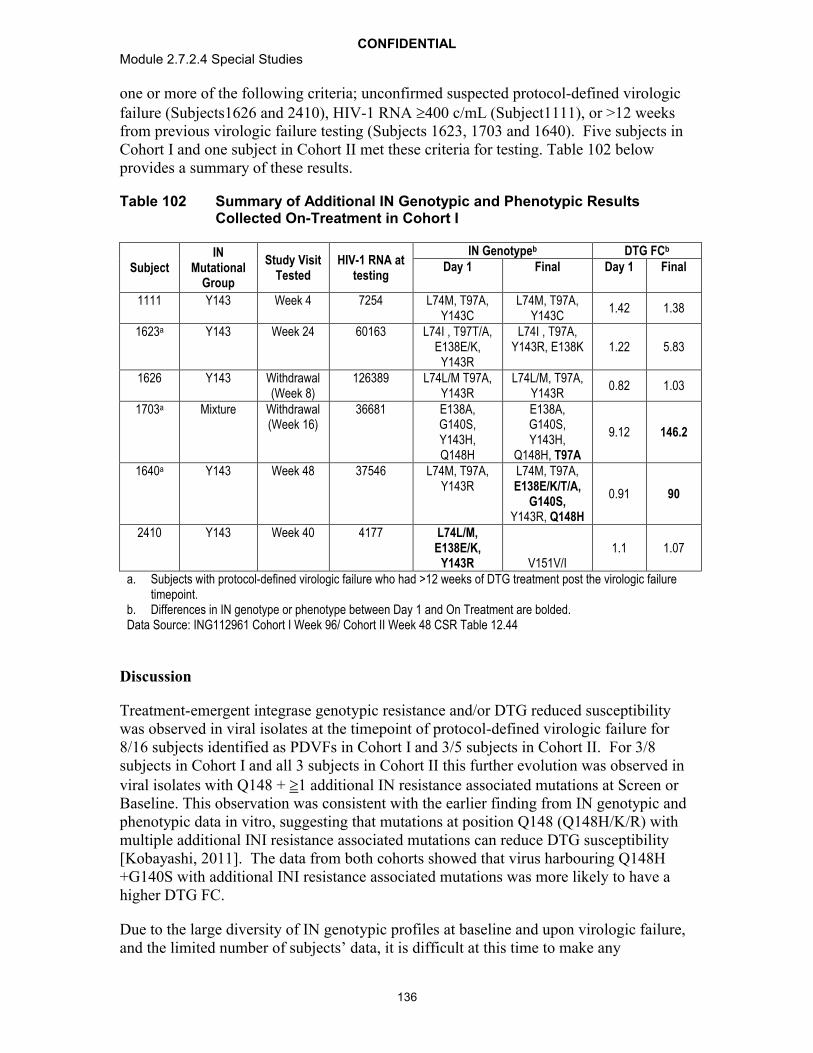
CONFIDENTIALModule 2.7.2.4 Special Studies
136
one or more of the following criteria; unconfirmed suspected protocol-defined virologicfailure (Subjects1626 and 2410), HIV-1 RNA 400 c/mL (Subject1111), or >12 weeks from previous virologic failure testing (Subjects 1623, 1703 and 1640). Five subjects in Cohort I and one subject in Cohort II met these criteria for testing. Table 102 below provides a summary of these results.
Table 102 Summary of Additional IN Genotypic and Phenotypic Results Collected On-Treatment in Cohort I
SubjectIN
Mutational Group
Study Visit Tested
HIV-1 RNA at testing
IN Genotypeb DTG FCb
Day 1 Final Day 1 Final
1111 Y143 Week 4 7254 L74M, T97A, Y143C
L74M, T97A, Y143C
1.42 1.38
1623a Y143 Week 24 60163 L74I , T97T/A, E138E/K,
Y143R
L74I , T97A,Y143R, E138K 1.22 5.83
1626 Y143 Withdrawal(Week 8)
126389 L74L/M T97A,Y143R
L74L/M, T97A,Y143R
0.82 1.03
1703a Mixture Withdrawal(Week 16)
36681 E138A,G140S, Y143H, Q148H
E138A,G140S, Y143H,
Q148H, T97A
9.12 146.2
1640a Y143 Week 48 37546 L74M, T97A, Y143R
L74M, T97A, E138E/K/T/A,
G140S, Y143R, Q148H
0.91 90
2410 Y143 Week 40 4177 L74L/M, E138E/K,
Y143R V151V/I1.1 1.07
a. Subjects with protocol-defined virologic failure who had >12 weeks of DTG treatment post the virologic failure timepoint.
b. Differences in IN genotype or phenotype between Day 1 and On Treatment are bolded.Data Source: ING112961 Cohort I Week 96/ Cohort II Week 48 CSR Table 12.44
Discussion
Treatment-emergent integrase genotypic resistance and/or DTG reduced susceptibility was observed in viral isolates at the timepoint of protocol-defined virologic failure for 8/16 subjects identified as PDVFs in Cohort I and 3/5 subjects in Cohort II. For 3/8subjects in Cohort I and all 3 subjects in Cohort II this further evolution was observed in viral isolates with Q148 + 1 additional IN resistance associated mutations at Screen or Baseline. This observation was consistent with the earlier finding from IN genotypic and phenotypic data in vitro, suggesting that mutations at position Q148 (Q148H/K/R) with multiple additional INI resistance associated mutations can reduce DTG susceptibility [Kobayashi, 2011]. The data from both cohorts showed that virus harbouring Q148H +G140S with additional INI resistance associated mutations was more likely to have a higher DTG FC.
Due to the large diversity of IN genotypic profiles at baseline and upon virologic failure, and the limited number of subjects’ data, it is difficult at this time to make any
CONFIDENTIALModule 2.7.2.4 Special Studies
137
conclusions about integrase resistance mutations selected by DTG and potential relationship with treatment outcome. Future studies in INI-naive and INI-experienced subjects may provide further clarity around the resistance profile of DTG. The efficacy data, however, show that DTG 50 mg BID effectively inhibited and suppressed over the longer term the majority of viruses with RAL resistance.
These data and the safety data determined in this Phase 2b study support the continued and definitive evaluation of 50mg BID DTG in Phase III in subjects with evidence of INI resistance at current or prior virologic failure with RAL or ELV containing regimen.
Conclusions:
Of the 21 subjects with protocol defined virologic failure through Week 96 (n=16, Cohort I) or Week 48 (n=5, Cohort II), 11 subjects (n=8 Cohort I and n=3 Cohort II), harboured virus exhibiting treatment emergent resistance with further IN genotypic and/or phenotypic evolution.
Ten of the 11 virus isolates had 4 INI resistance-associated mutations at the virologicfailure timepoint but the limited data set preclude conclusions on mutations selected under DTG pressure and relationship with treatment outcome.
4.2.3. Conclusions
Nonclinical Virology
Dolutegravir (DTG) inhibits HIV integrase by binding to the integrase active site and blocking the strand transfer step of retroviral DNA integration which is essential for the HIV replication cycle.
DTG has low nM activity against wild type HIV-1 and HIV-2 in a variety of cells lines, regardless of subtype. Human serum causes approximately 75-fold increase in DTG IC50. DTG is additive or synergistic when assayed in combination with other antiretroviral agents.
When HIV-1 Strain IIIB was passaged in the presence of DTG for 112 days, viruses with a 4.1-fold maximum increase in IC50 and S153Y or S153F substitutions in integrase were observed. Passage of the wild type HIV-1 NL432 in the presence of 6.4 nM DTG selected for E92Q (FR=3.1) and G193E (FC=3.2) substitutions in the IN region on Day 56. Passage of HIV-1 NL432 with Q148H, Q148K, or Q148R RAL resistant mutations resulted in selection of additional mutations and an increase in DTG FC. Passage of HIV-1 subtypes B, and A/G in TZM-bl cells selected for integrase mutation R263K.
Comparative susceptibilities to DTG and raltegravir (RAL) were obtained from 60 RAL resistant site directed HIV-1 mutants and 6 site directed HIV-2 mutants. DTG retained activity against a vast majority of these mutants. Additionally,

CONFIDENTIALModule 2.7.2.4 Special Studies
138
susceptibilities to DTG and RAL were determined for over 700 RAL resistant clinical isolates, with DTG retaining activity (<10 FC) against >90% of them.
The dissociation of DTG, RAL, and EVG from wild type and mutant IN proteins complexed with DNA was investigated to obtain a better understanding of INI resistance and dissociation kinetics. DTG demonstrated slower dissociation from all IN-DNA complexes tested, including those with single, double, and up to fourresidue clinically relevant IN substitutions.
There has been a decrease in the number of Q148 isolate samples from the 2008 – to – , including those which had Q148 plus additional primary mutations present at Y143 and N155.
The proportions of samples harboring key RAL associated secondary resistance mutations (L74I, E138A/K/T, and G140A/C/S) associated with reduced response within the Q148 + ≥2 category were evaluated. Overall isolates with ≥two of the derived key mutations were present in ~53.9% of the isolates with Q148 + ≥2.
Clonal analyses on paired Day 1 and PDVF virus provided information that the INI-associated resistance mutation that emerged at PDVF were added to pre-existing Day 1 INI associated resistance mutation profiles and that this accumulation of INI-associated resistance mutations results in the reduction of DTG susceptibility.
Analysis of site directed mutants at IN sites 101 and 124 as either single or double mutants demonstrated no effect on DTG susceptibility
Clinical Virology
DTG 50 mg once daily has a higher barrier to resistance in INI-naïve patients, as demonstrated in the treatment-experienced (INI-naïve) population where significantly fewer virologic failures and significantly fewer subjects with INI resistance (in addition to less treatment-emergent resistance to the background regimens) were observed when compared with RAL.
Data from two studies including over 1600 treatment-naïve patients are also supportive of DTG’s higher barrier to resistance, given that no subjects on the DTG regimen developed resistance to either the INI or the background NRTIs, whereas resistance to both the third agent and the background NRTIs was observed in both the RAL and EFV-based comparator arms.
A unique IN substitution was observed (R263K or R263R/K mixture) in two subjects with protocol-defined virologic failure in ING111762 on DTG; these conferred no to a low fold change in susceptibility to DTG and to RAL.
Low DTG FC was observed in subjects harbouring 143/155/66 or historic evidence of IN resistance while moderate to high DTG FC was observed with virus harbouring Q148 plus additional RAL secondary mutations in ING112574. Highest DTG FC was observed in virus harbouring Q148+2 additional IN
CONFIDENTIALModule 2.7.2.4 Special Studies
139
mutations however this subgroup was represented in only 11% of the enrolled population.
Good short term and long term responses were seen in subjects with 143/155/66 mutations or historic evidence of IN resistance which make up the majority of RAL resistant virus; lower response rates were observed in virus harbouring Q148/G140 dual mutations in ING112574. Protocol-defined virologic failure(PDVF) was observed in 19% of subjects the majority of whom harboured Q148 pathway virus at Baseline.
Limited viral evolution was detected at PDVF in ING112574 consisting ofpreviously identified, INI secondary mutations which lead to an increase in DTG FC; the majority of these were identified in virus harbouring Q148 mutations.
For the 52 Baseline samples from ING112574 which were tested for minor variants in integrase to confirm the provided historic IN resistance, only 5/52 (9.6%) samples tested had minor variants of IN primary resistance associated mutations (at a 0.5% detection threshold)
Increasing Baseline DTG FC was significantly associated with decreasing antiviral activity in ING112574. However, no precise phenotypic FC cut-off could be defined to effectively predict antiviral activity at both Day 8 and Week 24.
The best antiviral responses (at both Day 8 and Week 24) in ING112574 were seen in the ‘No Q148’ group. In subjects harbouring virus of Q148, a decreased response was observed with increasing numbers of mutations of G140A/C/S, L74I, E138A/K/T.
4.3. References
Akaike, H. Information measures and model selection. Bulletin of the International Statistical Institute 1983; 50:277-290.
Armenia D, Vandenbroucke I, Fabeni L, Van Marck H, Cento V. Study of genotypic and phenotypic HIV-1 dynamics of integrase mutations during raltegravir treatment: a refined analysis by ultr-deep 454 pyrosequencing. The Journal of Infectious Diseases 2012; 205:557–567.
Blanco J, Varghese V, Rhee S, Gtell J, and Shafer R. HIV-1 integrase inhibitor resistance and its clinical implications. Journal of Infectious Diseases. 2011, 203: 1204-1214.
Brenner BG, Lowe M, Moisi D, Hardy I, Gagnon S, Charest H, Baril JG, Wainberg MA, Roger M: Subtype diversity associated with the development of HIV-1 resistance to integrase inhibitors. Journal of Medical Virology 2011, 83:751-759.
Brun-Vézinet F, Costagliola D, Ait Khaled M, et al. Clinically validated genotype analysis: guiding principles and statistical concerns. Antiviral Therapy 2004; 9:465-478.
CONFIDENTIALModule 2.7.2.4 Special Studies
140
Canducci F, Barda B, Ceresola E, Spagnuolo V, Sampaolo M, et al. Evolution patterns of raltegravir-resistant mutations after integrase inhibitor interruption. Clinical Microbiology and Infection, 2011; 17: 928–934.
Clotet B, Bellos N, Molina J-M, Cooper D, Goffard J-C, et al. Efficacy and safety of darunavir-ritonavir at week 48 in treatment-experienced patients with HIV-1 infection in POWER 1 and 2: a pooled subgroup analysis of data from two randomised trials. The Lancet, 2007; 369: 1169–78.
Clotet B, Katlama C, Lalezari J, et al. HIV integrase resistance profiles and S/GSK1349572 Baseline phenotypic susceptibility for individuals experiencing virologicalfailure on raltegravir and enrolling in the VIKING phase IIb pilot study (ING112961). HIV and Hepatitis Drug Resistance Workshop. June 8-12, 2010. Dubrovnik, Croatia. Abstract 50.
Codoner F, Pou C, Thielen A, Garcia F, Delgado R, et al. Added value of deep sequencing relative to population sequencing in heavily pre-treated HIV-1-infected subjects. PLoS ONE, 2011; 6(5): e19461. doi:10.1371/journal.pone.0019461
Codoner F, Pou C, Thielen A, Garcia F, Delgado R, et al. Dynamic escape of pre-existing raltegravir-resistant HIV-1 from raltegravir selection pressure. Antiviral Research. 2010; 88: 281-286.
Cooper D, Steigbigel R, Gatell J, Rockstroh J, Katlama C. Subgroup and resistance analyses of raltegravir for resistant HIV-1 infection. New England Journal of Medicine. 2008; 359: 355-365.
Dalmau J, Codoner F, Erkizia I, Pino M Pou C. In–Depth Characterization of Viral Isolates from Plasma and Cells Compared with Plasma Circulating Quasispecies in Early HIV-1 Infection. PLoS ONE, 2012; 7(2): e32714. doi:10.1371/journal.pone.0032714
De Houwer S, Demeulemeester J, Thys W, Taltynov O,Christ F, Debyser Z. Identification of residues in the C-terminal domain of HIV-1 integrase that mediate binding to TRN-SR2. JBC Papers in Press. Published on August 7, 2012 as Manuscript M112.387944
de Luca A, Di Giambenedetto S, Maserati R, et al. Interpretation of genotypic HIV-1 resistance to darunavir and virological response: validation of available systems and of a new score. Antivir Ther 2011; 16:489-497.
de Meyer S, Vangeneugden, T, van Baelen B, et al. Resistance profile of darunavir: combined 24-week results from the POWER trials. AIDS Res Hum Retrovir 2008; 24:379-388.
EMA. Committee for Medicinal Products for Human Use (CHMP). Guideline on the clinical development of medicinal products for the treatment of HIV infection. London, 20 November 2008.

CONFIDENTIALModule 2.7.2.4 Special Studies
141
FDA. Guidance for Industry. Role of HIV Resistance Testing in Antiretroviral Drug Development. October 2007.
Garrido C, Villacian J, Zahonero N, et al. Broad phenotypic cross-resistance to elvitegravir in HIV-infected patients failing on raltegravir-containing regimens. Antimicrobial Agents and Chemotherapy. 2012; [Epub ahead of print].
Hatano H, Lampiris H, Fransen S et al. Evolution of Integrase resistance during failure of Integrase Inhibitor based anti-retroviral therapy. JAIDS. 2010; 54 (4): 389-392.
HIVdb (Integrated Genotypic Resistance Interpretation Systems) by Stanford: http://hivdb.stanford.edu/.
Jones G, Ledford R, Yu F, Miller M, Tsiang M, McColl D. Resistance profile of HIV-1 mutants in vitro selected by the HIV-1 integrase inhibitor, GS-9137 (JTK-303). [Abstract 627.] 14th Conference on Retroviruses and Opportunistic Infections (CROI). February 25-28, 2007; Los Angeles, CA.
Kobayashi M, Yoshinaga T, Seki T, et al. In vitro antiretroviral properties of S/GSK1349572, a next-generation HIV integrase inhibitor. Antimicrob Agents Ch.2011;55:813–821.
Lennox J, DeJesus E, Berger D, et al. for the STARTMRK Investigators. Raltegravir-versus efavirenz regimens in treatment-naïve HIV-1-Infected patients: 96-week efficacy, durability, subgroup, safety,and metabolic analyses. J Acquir Immune Defic Syndr.2010;55(1):39-48.
Low A, Prada N, Topper M, Vaida F, Castor D, Mohri H, Hazuda D, Muesing M, and Markowitz M. Natural Polymorphisms of Human Immunodeficiency Virus Type 1 Integrase and Inherent Susceptibilities to a Panel of Integrase Inhibitors. Antimicrob Agents and Chemother. 2009:53(10): 4275–4282.
Malet I, Delelis O, Valantin M, Montes B, Coulie C, Wirden M, Tchertanov L, Peytavin G, Reynes J, Mouscadet J, Katlama C, Calvez V, and Marcelin A. Mutations Associated with Failure of Raltegravir Treatment Affect Integrase Sensitivity to the Inhibitor In Vitro. Antimicrob Agents and Chemother. 2008:52(4): 1351–1358.
Margot N, Rhee M, Szwarcberg J, Miller M. Low rates of integrase resistance for elvitegravir and raltegravir through week 96 in the phase 3 clinical study GS-US-183-0145. XIX International AIDS Conference. July 22-27, 2012. Washington DC, USA. #TUPE050.
Min s, Sloan L, DeJesus e, et al. Antiviral activity, safety, and pharmacokinetics/pharmacodynamics of dolutegravir as 10-day monotherapy in HIV-1-infected adults AIDS.2011:25:1737-1745
Molina J-M, LaMarca A, Andrade-Villanueva J, Clotet B, Clumeck N, et al. Efficacy and safety of once daily elvitegravir versus twice daily raltegravir in treatment-experienced patients with HIV-1 receiving a ritonavir-boosted protease inhibitor: randomised, double-
CONFIDENTIALModule 2.7.2.4 Special Studies
142
blind, phase 3, non-inferiority study. The Lancet Infectious Diseases, 2012; 12(1):27-35. Published online October 19, 2011, DOI:10.1016/S1473-3099(11)70249-3
Mukherjee R, Jensen S, Male F, Bittinger K, Hodinka R, Miller M, Bushman F. Switching between raltegravir resistance pathways analyzed by deep sequencing. AIDS. 2011; 25:1951-1959.
Oliveira et al. Novel Mutational Changes Involved in Delayed Development of Dolutegravir Resistance in HIV-1 B and non-B Subtypes. Abstract M-166. 19th
Conference on Retroviruses and Opportunistic Infections (CROI). March 5-8, 2012; Seattle, WA.
Paredes R, Lalama C, Ribaudo H, Schackman B, Shikuma C, Meyer W, et al. Presence of minor populations of Y181C mutants detected by allele-specific PCR and risk of efavirenz failure in treatment-naïve patients: results of an ACTG 5095 case-cohort study. 17th Annual Conference on Retroviruses and Opportunistic Infections. February 16-19, 2010. San Francisco, CA. #83.
Quashie P, Thibault M, Han Y-S, Oliveira M, Singhroy D, Fujiwara T, Underwood M, and Wainberg M. Characterization of the R263K Mutation in HIV-1 Integrase that Confers Low-Level Resistance to the Second-Generation Integrase Strand Transfer Inhibitor dolutegravir. J Virol. 2012:86(5):2696-2705.
Schapiro JM, Scherer J, Boucher CA, et al. Improving the prediction of the virological response of tipranavir: the development and validation of a tipranavir-weighted mutation score. Antiviral Therapy 2010; 15:1001-1019
Sax P, DeJesus E, Mills A, Zolopa A, Cohen C, Wohl D. Co-formulated elvitegravir, cobicicstat, emtricitabine, and tenofovir versus co-formulated efavirenz, emtrecitabine, and tenofovir for initial treatment of HIV-1 infection: a randomised, double-blind, phase 3 trial, analysis of results after 48 weeks. Lancet 2012; 379:2439-2448.
Underwood MR, Ross LL, Irlbeck DM, et al. Sensitivity of phenotypic susceptibility analyses for nonthymidine nucleoside analogues conferred by K65R or M184V inmixtures with wild-type HIV-1. J Infect Dis 2009; 199:84–88.
Vavro C, Underwood M, Madsen H, et al. Polymorphisms at position 101 and 124 in the HIV-1 integrase (IN) gene: Lack of effects on in vitro susceptibility to S/GSK1349572. 2010 ICAAC.Abstract H-935
Vavro C, Dudas K, Hasan S, et al. Dolutegravir treatment of HIV subjects with raltegravir resistance: integrase resistance evolution in Cohort II of the VIKING study. International Workshop on HIV and Hepatitis Virus Drug Resistance and Curative Strategies, 5-9 June, 2012, Sitges, Spain.

Summary of Amino Acid Conservation for 2997 Integrase Sequencesa prior to 2005
Position in Integrase Referenceb Variantc Variant Count Total Countd Percentage
1 F1 F 2957 2964 99.761 F1 S 5 2964 0.171 F1 F/L 1 2964 0.031 F1 V 1 2964 0.032 L2 L 2961 2964 99.902 L2 W/L 1 2964 0.032 L2 F 1 2964 0.032 L2 I 1 2964 0.033 D3 D 2858 2971 96.203 D3 E 107 2971 3.603 D3 N 4 2971 0.133 D3 G 2 2971 0.074 G4 G 2959 2970 99.634 G4 E 4 2970 0.134 G4 R 3 2970 0.104 G4 S 2 2970 0.074 G4 K 1 2970 0.034 G4 G/E 1 2970 0.035 I5 I 2978 2988 99.675 I5 V 5 2988 0.175 I5 L 2 2988 0.075 I5 M 1 2988 0.035 I5 T 1 2988 0.035 I5 K 1 2988 0.036 D6 D 2856 2989 95.556 D6 E 82 2989 2.746 D6 S 21 2989 0.706 D6 N 20 2989 0.676 D6 T 4 2989 0.136 D6 D/E 3 2989 0.106 D6 G 2 2989 0.076 D6 S/T 1 2989 0.037 K7 K 2798 2988 93.647 K7 Q 102 2988 3.417 K7 R 54 2988 1.817 K7 E 16 2988 0.547 K7 R/K 10 2988 0.337 K7 T 2 2988 0.077 K7 I 2 2988 0.077 K7 D/E 1 2988 0.037 K7 I/K 1 2988 0.037 K7 M/K 1 2988 0.03
Page 1 of 40
m2.7.2.4 Integrase Amino Acid Frequency TableCONFIDENTIAL
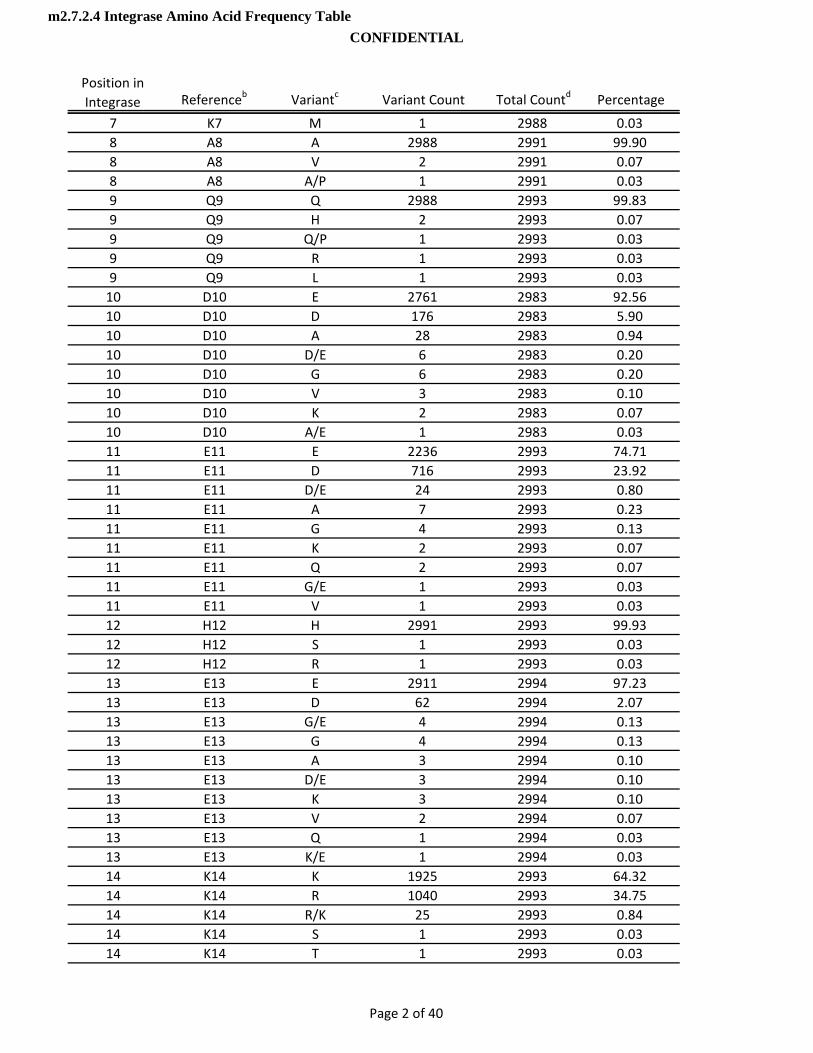
Position in Integrase Referenceb Variantc Variant Count Total Countd Percentage
7 K7 M 1 2988 0.038 A8 A 2988 2991 99.908 A8 V 2 2991 0.078 A8 A/P 1 2991 0.039 Q9 Q 2988 2993 99.839 Q9 H 2 2993 0.079 Q9 Q/P 1 2993 0.039 Q9 R 1 2993 0.039 Q9 L 1 2993 0.0310 D10 E 2761 2983 92.5610 D10 D 176 2983 5.9010 D10 A 28 2983 0.9410 D10 D/E 6 2983 0.2010 D10 G 6 2983 0.2010 D10 V 3 2983 0.1010 D10 K 2 2983 0.0710 D10 A/E 1 2983 0.0311 E11 E 2236 2993 74.7111 E11 D 716 2993 23.9211 E11 D/E 24 2993 0.8011 E11 A 7 2993 0.2311 E11 G 4 2993 0.1311 E11 K 2 2993 0.0711 E11 Q 2 2993 0 0711 E11 Q 2 2993 0.0711 E11 G/E 1 2993 0.0311 E11 V 1 2993 0.0312 H12 H 2991 2993 99.9312 H12 S 1 2993 0.0312 H12 R 1 2993 0.0313 E13 E 2911 2994 97.2313 E13 D 62 2994 2.0713 E13 G/E 4 2994 0.1313 E13 G 4 2994 0.1313 E13 A 3 2994 0.1013 E13 D/E 3 2994 0.1013 E13 K 3 2994 0.1013 E13 V 2 2994 0.0713 E13 Q 1 2994 0.0313 E13 K/E 1 2994 0.0314 K14 K 1925 2993 64.3214 K14 R 1040 2993 34.7514 K14 R/K 25 2993 0.8414 K14 S 1 2993 0.0314 K14 T 1 2993 0.03
Page 2 of 40
m2.7.2.4 Integrase Amino Acid Frequency TableCONFIDENTIAL

Position in Integrase Referenceb Variantc Variant Count Total Countd Percentage
14 K14 E 1 2993 0.0315 Y15 Y 2985 2994 99.7015 Y15 C 3 2994 0.1015 Y15 F 2 2994 0.0715 Y15 H 2 2994 0.0715 Y15 */Y 1 2994 0.0315 Y15 * 1 2994 0.0316 H16 H 2984 2993 99.7016 H16 R 5 2993 0.1716 H16 P 1 2993 0.0316 H16 Y 1 2993 0.0316 H16 H/P 1 2993 0.0316 H16 H/L 1 2993 0.0317 S17 S 2459 2994 82.1317 S17 N 445 2994 14.8617 S17 C 37 2994 1.2417 S17 T 26 2994 0.8717 S17 S/N 9 2994 0.3017 S17 R 6 2994 0.2017 S17 G 4 2994 0.1317 S17 S/T 2 2994 0.0717 S17 H/N 1 2994 0.0317 S17 N/K 1 2994 0.0317 S17 S/C 1 2994 0 0317 S17 S/C 1 2994 0.0317 S17 I 1 2994 0.0317 S17 S/R 1 2994 0.0317 S17 S/T/I 1 2994 0.0318 N18 N 2986 2996 99.6718 N18 S 3 2996 0.1018 N18 H/N 2 2996 0.0718 N18 S/N 1 2996 0.0318 N18 K 1 2996 0.0318 N18 Y 1 2996 0.0318 N18 H 1 2996 0.0318 N18 D 1 2996 0.0319 W19 W 2987 2997 99.6719 W19 * 6 2997 0.2019 W19 K 1 2997 0.0319 W19 W/* 1 2997 0.0319 W19 R 1 2997 0.0319 W19 G 1 2997 0.0320 R20 R 2824 2997 94.2320 R20 K 159 2997 5.3120 R20 R/K 9 2997 0.30
Page 3 of 40
m2.7.2.4 Integrase Amino Acid Frequency TableCONFIDENTIAL
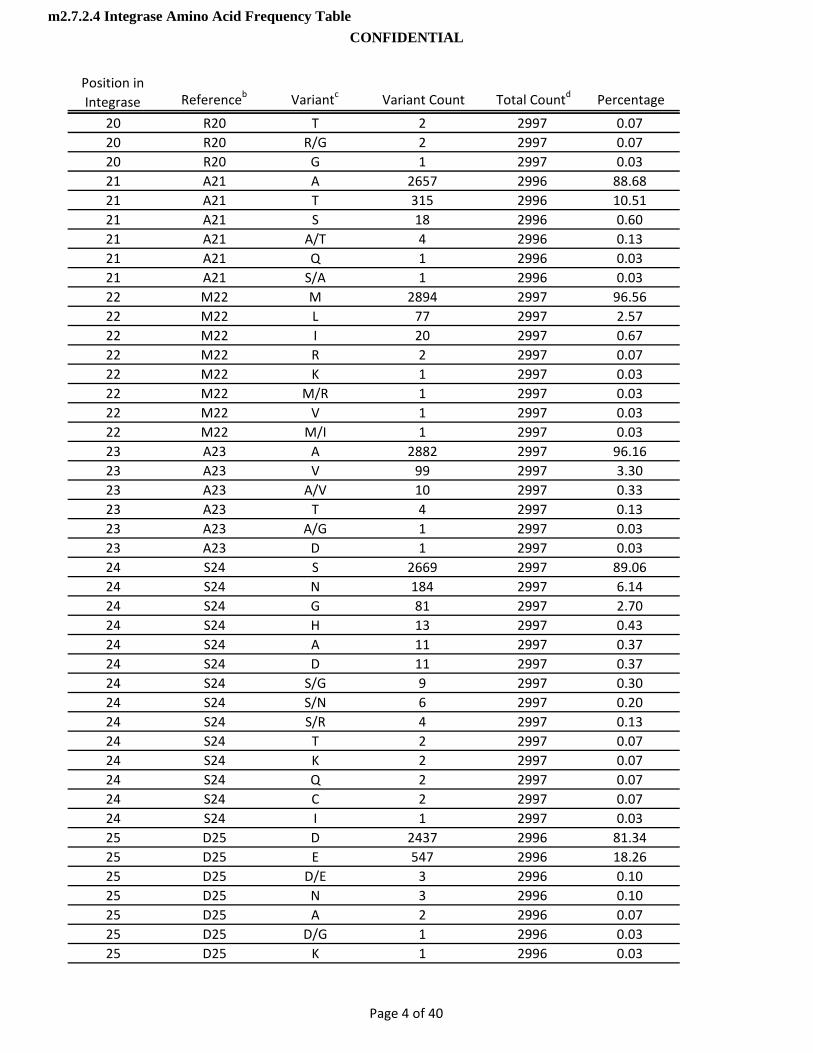
Position in Integrase Referenceb Variantc Variant Count Total Countd Percentage
20 R20 T 2 2997 0.0720 R20 R/G 2 2997 0.0720 R20 G 1 2997 0.0321 A21 A 2657 2996 88.6821 A21 T 315 2996 10.5121 A21 S 18 2996 0.6021 A21 A/T 4 2996 0.1321 A21 Q 1 2996 0.0321 A21 S/A 1 2996 0.0322 M22 M 2894 2997 96.5622 M22 L 77 2997 2.5722 M22 I 20 2997 0.6722 M22 R 2 2997 0.0722 M22 K 1 2997 0.0322 M22 M/R 1 2997 0.0322 M22 V 1 2997 0.0322 M22 M/I 1 2997 0.0323 A23 A 2882 2997 96.1623 A23 V 99 2997 3.3023 A23 A/V 10 2997 0.3323 A23 T 4 2997 0.1323 A23 A/G 1 2997 0.0323 A23 D 1 2997 0.0324 S24 S 2669 2997 89 0624 S24 S 2669 2997 89.0624 S24 N 184 2997 6.1424 S24 G 81 2997 2.7024 S24 H 13 2997 0.4324 S24 A 11 2997 0.3724 S24 D 11 2997 0.3724 S24 S/G 9 2997 0.3024 S24 S/N 6 2997 0.2024 S24 S/R 4 2997 0.1324 S24 T 2 2997 0.0724 S24 K 2 2997 0.0724 S24 Q 2 2997 0.0724 S24 C 2 2997 0.0724 S24 I 1 2997 0.0325 D25 D 2437 2996 81.3425 D25 E 547 2996 18.2625 D25 D/E 3 2996 0.1025 D25 N 3 2996 0.1025 D25 A 2 2996 0.0725 D25 D/G 1 2996 0.0325 D25 K 1 2996 0.03
Page 4 of 40
m2.7.2.4 Integrase Amino Acid Frequency TableCONFIDENTIAL

Position in Integrase Referenceb Variantc Variant Count Total Countd Percentage
25 D25 D/N 1 2996 0.0325 D25 G 1 2996 0.0326 F26 F 2991 2997 99.8026 F26 Y 5 2997 0.1726 F26 F/Y 1 2997 0.0327 N27 N 2899 2997 96.7327 N27 G 77 2997 2.5727 N27 S 7 2997 0.2327 N27 H 5 2997 0.1727 N27 D 4 2997 0.1327 N27 S/N 2 2997 0.0727 N27 T 1 2997 0.0327 N27 D/N 1 2997 0.0327 N27 I 1 2997 0.0328 L28 L 2891 2997 96.4628 L28 I 99 2997 3.3028 L28 P 4 2997 0.1328 L28 M 2 2997 0.0728 L28 M/I/L 1 2997 0.0329 P29 P 2996 2997 99.9729 P29 S 1 2997 0.0330 P30 P 2962 2996 98.8730 P30 S 16 2996 0.5330 P30 A 11 2996 0 3730 P30 A 11 2996 0.3730 P30 H 4 2996 0.1330 P30 P/L 2 2996 0.0730 P30 L 1 2996 0.0331 V31 I 1528 2995 51.0231 V31 V 1439 2995 48.0531 V31 I/V 24 2995 0.8031 V31 M 2 2995 0.0731 V31 */L/E/V 1 2995 0.0331 V31 I/R 1 2995 0.0332 V32 V 2830 2996 94.4632 V32 I 148 2996 4.9432 V32 L 13 2996 0.4332 V32 I/V 5 2996 0.1733 A33 A 2993 2996 99.9033 A33 P 3 2996 0.1034 K34 K 2927 2996 97.7034 K34 R 64 2996 2.1434 K34 R/K 3 2996 0.1034 K34 T 1 2996 0.0334 K34 E 1 2996 0.03
Page 5 of 40
m2.7.2.4 Integrase Amino Acid Frequency TableCONFIDENTIAL
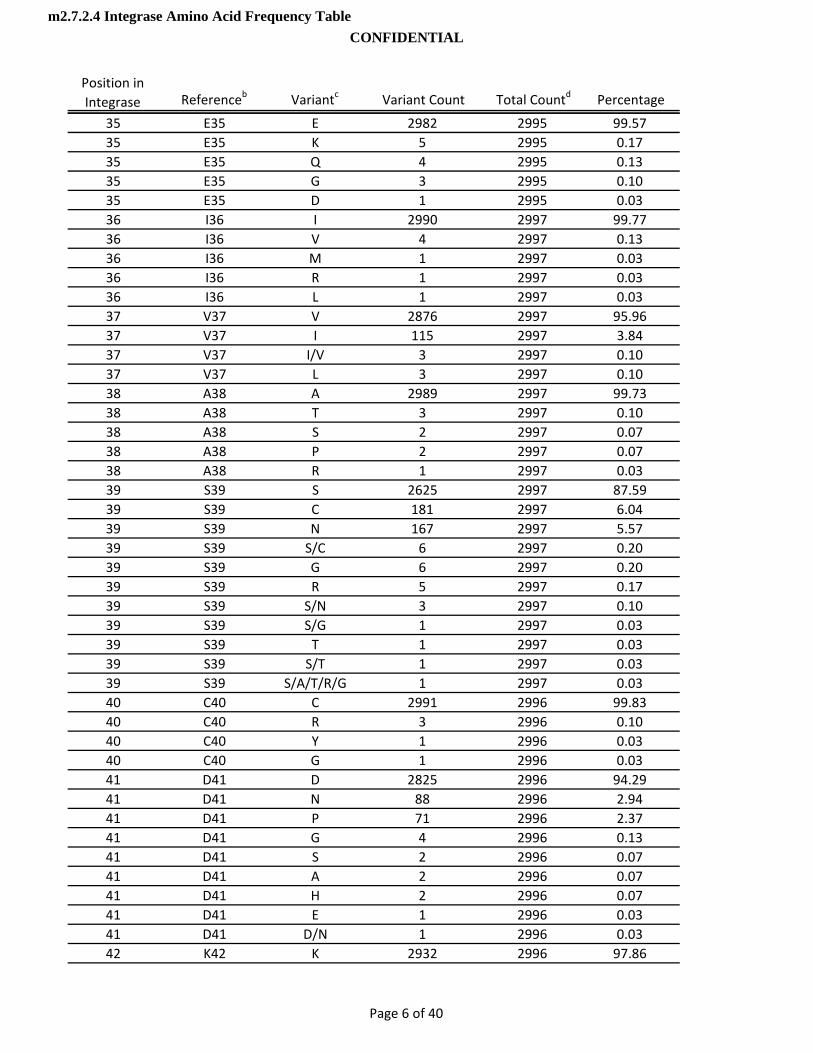
Position in Integrase Referenceb Variantc Variant Count Total Countd Percentage
35 E35 E 2982 2995 99.5735 E35 K 5 2995 0.1735 E35 Q 4 2995 0.1335 E35 G 3 2995 0.1035 E35 D 1 2995 0.0336 I36 I 2990 2997 99.7736 I36 V 4 2997 0.1336 I36 M 1 2997 0.0336 I36 R 1 2997 0.0336 I36 L 1 2997 0.0337 V37 V 2876 2997 95.9637 V37 I 115 2997 3.8437 V37 I/V 3 2997 0.1037 V37 L 3 2997 0.1038 A38 A 2989 2997 99.7338 A38 T 3 2997 0.1038 A38 S 2 2997 0.0738 A38 P 2 2997 0.0738 A38 R 1 2997 0.0339 S39 S 2625 2997 87.5939 S39 C 181 2997 6.0439 S39 N 167 2997 5.5739 S39 S/C 6 2997 0.2039 S39 G 6 2997 0 2039 S39 G 6 2997 0.2039 S39 R 5 2997 0.1739 S39 S/N 3 2997 0.1039 S39 S/G 1 2997 0.0339 S39 T 1 2997 0.0339 S39 S/T 1 2997 0.0339 S39 S/A/T/R/G 1 2997 0.0340 C40 C 2991 2996 99.8340 C40 R 3 2996 0.1040 C40 Y 1 2996 0.0340 C40 G 1 2996 0.0341 D41 D 2825 2996 94.2941 D41 N 88 2996 2.9441 D41 P 71 2996 2.3741 D41 G 4 2996 0.1341 D41 S 2 2996 0.0741 D41 A 2 2996 0.0741 D41 H 2 2996 0.0741 D41 E 1 2996 0.0341 D41 D/N 1 2996 0.0342 K42 K 2932 2996 97.86
Page 6 of 40
m2.7.2.4 Integrase Amino Acid Frequency TableCONFIDENTIAL

Position in Integrase Referenceb Variantc Variant Count Total Countd Percentage
42 K42 Q 46 2996 1.5442 K42 R 9 2996 0.3042 K42 R/K 4 2996 0.1342 K42 G 2 2996 0.0742 K42 I/K 1 2996 0.0342 K42 E 1 2996 0.0342 K42 I 1 2996 0.0343 C43 C 2991 2997 99.8043 C43 R 3 2997 0.1043 C43 F 1 2997 0.0343 C43 I 1 2997 0.0343 C43 G 1 2997 0.0344 Q44 Q 2919 2996 97.4344 Q44 H 72 2996 2.4044 Q44 L 3 2996 0.1044 Q44 P 1 2996 0.0344 Q44 R 1 2996 0.0345 L45 L 2742 2996 91.5245 L45 I 108 2996 3.6045 L45 Q 74 2996 2.4745 L45 V 46 2996 1.5445 L45 T 8 2996 0.2745 L45 S 7 2996 0.2345 L45 I/L 3 2996 0 1045 L45 I/L 3 2996 0.1045 L45 L/V 3 2996 0.1045 L45 M 2 2996 0.0745 L45 P 1 2996 0.0345 L45 T/I 1 2996 0.0345 L45 E 1 2996 0.0346 K46 K 2972 2995 99.2346 K46 R 17 2995 0.5746 K46 N 2 2995 0.0746 K46 Q 2 2995 0.0746 K46 Q/K 1 2995 0.0346 K46 R/K 1 2995 0.0347 G47 G 2986 2994 99.7347 G47 R 4 2994 0.1347 G47 E 3 2994 0.1047 G47 R/G 1 2994 0.0348 E48 E 2956 2995 98.7048 E48 Q 24 2995 0.8048 E48 K 11 2995 0.3748 E48 G 2 2995 0.0748 E48 V 1 2995 0.03
Page 7 of 40
m2.7.2.4 Integrase Amino Acid Frequency TableCONFIDENTIAL

Position in Integrase Referenceb Variantc Variant Count Total Countd Percentage
48 E48 K/E 1 2995 0.0349 A49 A 2980 2996 99.4749 A49 P 12 2996 0.4049 A49 T 4 2996 0.1350 M50 M 2084 2993 69.6350 M50 I 703 2993 23.4950 M50 T 87 2993 2.9150 M50 L 83 2993 2.7750 M50 V 14 2993 0.4750 M50 M/I 11 2993 0.3750 M50 R 5 2993 0.1750 M50 T/I 2 2993 0.0750 M50 K 1 2993 0.0350 M50 M/T 1 2993 0.0350 M50 I/R 1 2993 0.0350 M50 R/K 1 2993 0.0351 H51 H 2988 2997 99.7051 H51 Q 3 2997 0.1051 H51 S 2 2997 0.0751 H51 Y 2 2997 0.0751 H51 P 1 2997 0.0351 H51 R 1 2997 0.0352 G52 G 2990 2996 99.8052 G52 R 4 2996 0 1352 G52 R 4 2996 0.1352 G52 S/G 1 2996 0.0352 G52 G/E 1 2996 0.0353 Q53 Q 2985 2996 99.6353 Q53 R 5 2996 0.1753 Q53 H 3 2996 0.1053 Q53 K 1 2996 0.0353 Q53 * 1 2996 0.0353 Q53 L 1 2996 0.0354 V54 V 2981 2997 99.4754 V54 I 12 2997 0.4054 V54 A 2 2997 0.0754 V54 I/V 1 2997 0.0354 V54 E/V 1 2997 0.0355 D55 D 2974 2997 99.2355 D55 N 13 2997 0.4355 D55 G 5 2997 0.1755 D55 A 2 2997 0.0755 D55 Y 1 2997 0.0355 D55 H 1 2997 0.0355 D55 D/N 1 2997 0.03
Page 8 of 40
m2.7.2.4 Integrase Amino Acid Frequency TableCONFIDENTIAL

Position in Integrase Referenceb Variantc Variant Count Total Countd Percentage
56 C56 C 2966 2996 99.0056 C56 Y 17 2996 0.5756 C56 S 8 2996 0.2756 C56 R 4 2996 0.1356 C56 F 1 2996 0.0357 S57 S 2865 2995 95.6657 S57 G 110 2995 3.6757 S57 N 9 2995 0.3057 S57 S/G 6 2995 0.2057 S57 R 2 2995 0.0757 S57 D 1 2995 0.0357 S57 C 1 2995 0.0357 S57 I 1 2995 0.0358 P58 P 2992 2997 99.8358 P58 T 4 2997 0.1358 P58 P/L 1 2997 0.0359 G59 G 2913 2995 97.2659 G59 E 75 2995 2.5059 G59 R 3 2995 0.1059 G59 A 2 2995 0.0759 G59 G/E 1 2995 0.0359 G59 K/E 1 2995 0.0360 I60 I 2841 2997 94.7960 I60 V 89 2997 2 9760 I60 V 89 2997 2.9760 I60 M 57 2997 1.9060 I60 L 4 2997 0.1360 I60 T 2 2997 0.0760 I60 M/I/V 1 2997 0.0360 I60 K 1 2997 0.0360 I60 I/V 1 2997 0.0360 I60 M/I 1 2997 0.0361 W61 W 2995 2997 99.9361 W61 * 1 2997 0.0361 W61 R 1 2997 0.0362 Q62 Q 2991 2997 99.8062 Q62 H/Q 2 2997 0.0762 Q62 K 1 2997 0.0362 Q62 * 1 2997 0.0362 Q62 R 1 2997 0.0362 Q62 L 1 2997 0.0363 L63 L 2882 2996 96.1963 L63 I 58 2996 1.9463 L63 M 43 2996 1.4463 L63 V 10 2996 0.33
Page 9 of 40
m2.7.2.4 Integrase Amino Acid Frequency TableCONFIDENTIAL

Position in Integrase Referenceb Variantc Variant Count Total Countd Percentage
63 L63 S/L 1 2996 0.0363 L63 I/L 1 2996 0.0363 L63 I/V 1 2996 0.0364 D64 D 2986 2996 99.6764 D64 N 4 2996 0.1364 D64 G 3 2996 0.1064 D64 D/Y 1 2996 0.0364 D64 E 1 2996 0.0364 D64 H 1 2996 0.0365 C65 C 2994 2996 99.9365 C65 R 1 2996 0.0365 C65 G 1 2996 0.0366 T66 T 2984 2996 99.6066 T66 A 8 2996 0.2766 T66 P 2 2996 0.0766 T66 S 1 2996 0.0366 T66 T/P 1 2996 0.0367 H67 H 2993 2994 99.9767 H67 L 1 2994 0.0368 L68 L 2949 2993 98.5368 L68 V 20 2993 0.6768 L68 T 9 2993 0.3068 L68 I 7 2993 0.2368 L68 A 5 2993 0 1768 L68 A 5 2993 0.1768 L68 I/L 1 2993 0.0368 L68 A/T 1 2993 0.0368 L68 M 1 2993 0.0369 E69 E 2990 2994 99.8769 E69 K 1 2994 0.0369 E69 G/E 1 2994 0.0369 E69 D 1 2994 0.0369 E69 G 1 2994 0.0370 G70 G 2977 2993 99.4770 G70 E 11 2993 0.3770 G70 R 3 2993 0.1070 G70 N 1 2993 0.0370 G70 D 1 2993 0.0371 K71 K 2971 2995 99.2071 K71 Q 11 2995 0.3771 K71 R 7 2995 0.2371 K71 N 3 2995 0.1071 K71 E 2 2995 0.0771 K71 Q/K 1 2995 0.0372 V72 I 1524 2994 50.90
Page 10 of 40
m2.7.2.4 Integrase Amino Acid Frequency TableCONFIDENTIAL

Position in Integrase Referenceb Variantc Variant Count Total Countd Percentage
72 V72 V 1420 2994 47.4372 V72 I/V 25 2994 0.8472 V72 T 22 2994 0.7372 V72 S 1 2994 0.0372 V72 T/I 1 2994 0.0372 V72 G 1 2994 0.0373 I73 I 2986 2995 99.7073 I73 V 6 2995 0.2073 I73 T 1 2995 0.0373 I73 I/L 1 2995 0.0373 I73 L 1 2995 0.0374 L74 L 2584 2994 86.3174 L74 I 311 2994 10.3974 L74 M 77 2994 2.5774 L74 M/I 7 2994 0.2374 L74 V 5 2994 0.1774 L74 P 3 2994 0.1074 L74 M/L 2 2994 0.0774 L74 I/L 2 2994 0.0774 L74 M/I/L 2 2994 0.0774 L74 L/V 1 2994 0.0375 V75 V 2992 2997 99.8375 V75 A 3 2997 0.1075 V75 A/V 1 2997 0 0375 V75 A/V 1 2997 0.0375 V75 I 1 2997 0.0376 A76 A 2991 2996 99.8376 A76 T 2 2996 0.0776 A76 A/P 1 2996 0.0376 A76 P 1 2996 0.0376 A76 V 1 2996 0.0377 V77 V 2977 2996 99.3777 V77 A 11 2996 0.3777 V77 I 5 2996 0.1777 V77 A/V 1 2996 0.0377 V77 I/V 1 2996 0.0377 V77 G 1 2996 0.0378 H78 H 2988 2997 99.7078 H78 R 8 2997 0.2778 H78 H/N 1 2997 0.0379 V79 V 2983 2997 99.5379 V79 A 6 2997 0.2079 V79 I 4 2997 0.1379 V79 L 3 2997 0.1079 V79 E/V 1 2997 0.03
Page 11 of 40
m2.7.2.4 Integrase Amino Acid Frequency TableCONFIDENTIAL

Position in Integrase Referenceb Variantc Variant Count Total Countd Percentage
80 A80 A 2991 2997 99.8080 A80 S 3 2997 0.1080 A80 T 2 2997 0.0780 A80 P 1 2997 0.0381 S81 S 2988 2997 99.7081 S81 G 6 2997 0.2081 S81 T 1 2997 0.0381 S81 N 1 2997 0.0381 S81 R 1 2997 0.0382 G82 G 2984 2991 99.7782 G82 S 2 2991 0.0782 G82 R 2 2991 0.0782 G82 G/E 1 2991 0.0382 G82 E 1 2991 0.0382 G82 D 1 2991 0.0383 Y83 Y 2922 2994 97.6083 Y83 F 71 2994 2.3783 Y83 F/Y 1 2994 0.0384 I84 I 2688 2997 89.6984 I84 M 171 2997 5.7184 I84 L 101 2997 3.3784 I84 V 30 2997 1.0084 I84 M/I 6 2997 0.2084 I84 M/L 1 2997 0 0384 I84 M/L 1 2997 0.0385 E85 E 2993 2997 99.8785 E85 Q/E 1 2997 0.0385 E85 K 1 2997 0.0385 E85 Q 1 2997 0.0385 E85 D 1 2997 0.0386 A86 A 2994 2997 99.9086 A86 T 2 2997 0.0786 A86 P 1 2997 0.0387 E87 E 2994 2997 99.9087 E87 A 1 2997 0.0387 E87 K 1 2997 0.0387 E87 K/E 1 2997 0.0388 V88 V 2979 2995 99.4788 V88 I 15 2995 0.5088 V88 L 1 2995 0.0389 I89 I 2985 2997 99.6089 I89 T 4 2997 0.1389 I89 V 4 2997 0.1389 I89 L 2 2997 0.0789 I89 F/I 1 2997 0.03
Page 12 of 40
m2.7.2.4 Integrase Amino Acid Frequency TableCONFIDENTIAL

Position in Integrase Referenceb Variantc Variant Count Total Countd Percentage
89 I89 I/V 1 2997 0.0390 P90 P 2955 2997 98.6090 P90 S 26 2997 0.8790 P90 T 8 2997 0.2790 P90 A 7 2997 0.2390 P90 Q 1 2997 0.0391 A91 A 2909 2997 97.0691 A91 T 39 2997 1.3091 A91 E 21 2997 0.7091 A91 G 18 2997 0.6091 A91 S 6 2997 0.2091 A91 V 2 2997 0.0791 A91 P 1 2997 0.0391 A91 A/T 1 2997 0.0392 E92 E 2989 2997 99.7392 E92 K 3 2997 0.1092 E92 D 2 2997 0.0792 E92 G 2 2997 0.0792 E92 A 1 2997 0.0393 T93 T 2980 2997 99.4393 T93 S 7 2997 0.2393 T93 A 3 2997 0.1093 T93 I 3 2997 0.1093 T93 N 2 2997 0 0793 T93 N 2 2997 0.0793 T93 K 1 2997 0.0393 T93 T/P 1 2997 0.0394 G94 G 2992 2997 99.8394 G94 R 4 2997 0.1394 G94 A 1 2997 0.0395 Q95 Q 2954 2997 98.5795 Q95 S 11 2997 0.3795 Q95 H 8 2997 0.2795 Q95 P 7 2997 0.2395 Q95 R 6 2997 0.2095 Q95 Q/P 3 2997 0.1095 Q95 K 3 2997 0.1095 Q95 H/Q 2 2997 0.0795 Q95 N 1 2997 0.0395 Q95 * 1 2997 0.0395 Q95 S/H/Q/N/R/K 1 2997 0.0396 E96 E 2906 2997 96.9696 E96 D 79 2997 2.6496 E96 G 6 2997 0.2096 E96 D/E 4 2997 0.13
Page 13 of 40
m2.7.2.4 Integrase Amino Acid Frequency TableCONFIDENTIAL
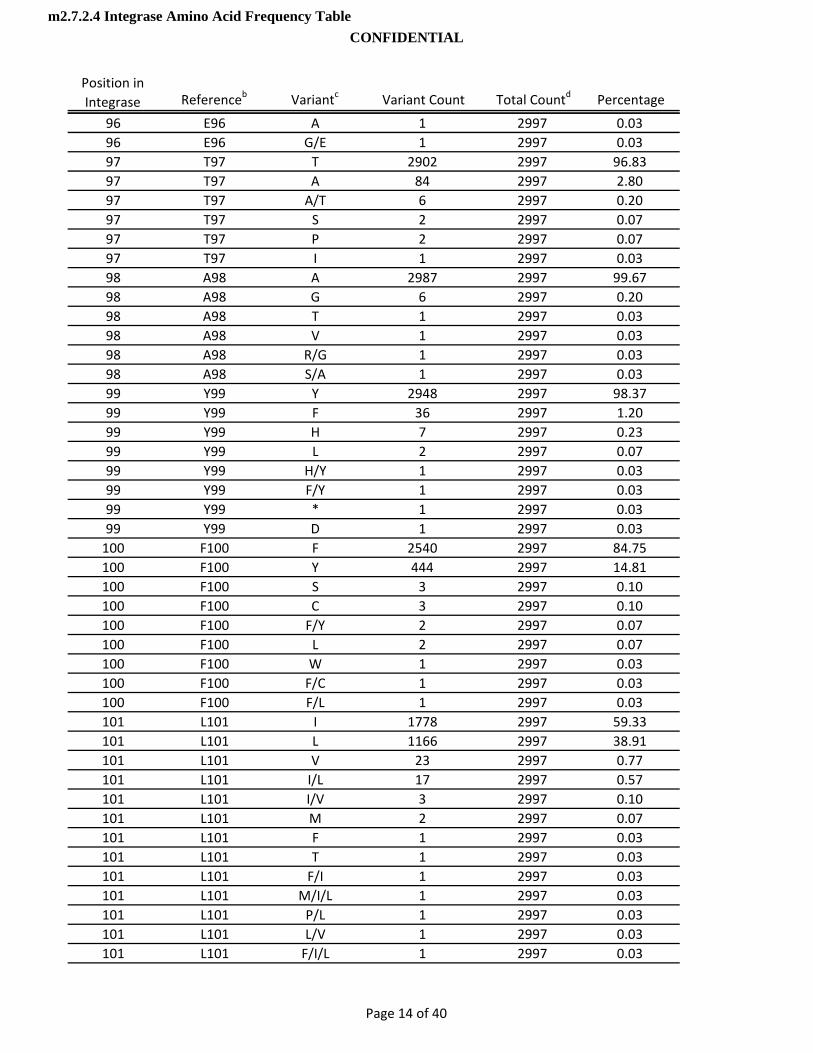
Position in Integrase Referenceb Variantc Variant Count Total Countd Percentage
96 E96 A 1 2997 0.0396 E96 G/E 1 2997 0.0397 T97 T 2902 2997 96.8397 T97 A 84 2997 2.8097 T97 A/T 6 2997 0.2097 T97 S 2 2997 0.0797 T97 P 2 2997 0.0797 T97 I 1 2997 0.0398 A98 A 2987 2997 99.6798 A98 G 6 2997 0.2098 A98 T 1 2997 0.0398 A98 V 1 2997 0.0398 A98 R/G 1 2997 0.0398 A98 S/A 1 2997 0.0399 Y99 Y 2948 2997 98.3799 Y99 F 36 2997 1.2099 Y99 H 7 2997 0.2399 Y99 L 2 2997 0.0799 Y99 H/Y 1 2997 0.0399 Y99 F/Y 1 2997 0.0399 Y99 * 1 2997 0.0399 Y99 D 1 2997 0.03100 F100 F 2540 2997 84.75100 F100 Y 444 2997 14 81100 F100 Y 444 2997 14.81100 F100 S 3 2997 0.10100 F100 C 3 2997 0.10100 F100 F/Y 2 2997 0.07100 F100 L 2 2997 0.07100 F100 W 1 2997 0.03100 F100 F/C 1 2997 0.03100 F100 F/L 1 2997 0.03101 L101 I 1778 2997 59.33101 L101 L 1166 2997 38.91101 L101 V 23 2997 0.77101 L101 I/L 17 2997 0.57101 L101 I/V 3 2997 0.10101 L101 M 2 2997 0.07101 L101 F 1 2997 0.03101 L101 T 1 2997 0.03101 L101 F/I 1 2997 0.03101 L101 M/I/L 1 2997 0.03101 L101 P/L 1 2997 0.03101 L101 L/V 1 2997 0.03101 L101 F/I/L 1 2997 0.03
Page 14 of 40
m2.7.2.4 Integrase Amino Acid Frequency TableCONFIDENTIAL
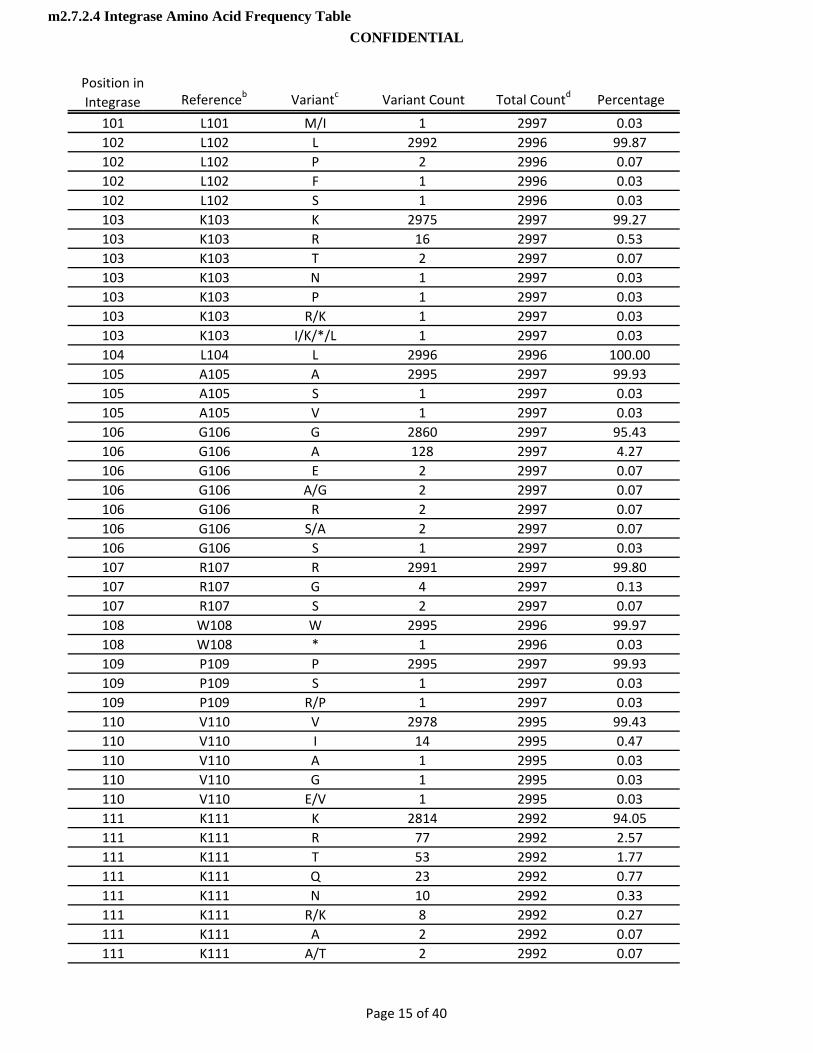
Position in Integrase Referenceb Variantc Variant Count Total Countd Percentage
101 L101 M/I 1 2997 0.03102 L102 L 2992 2996 99.87102 L102 P 2 2996 0.07102 L102 F 1 2996 0.03102 L102 S 1 2996 0.03103 K103 K 2975 2997 99.27103 K103 R 16 2997 0.53103 K103 T 2 2997 0.07103 K103 N 1 2997 0.03103 K103 P 1 2997 0.03103 K103 R/K 1 2997 0.03103 K103 I/K/*/L 1 2997 0.03104 L104 L 2996 2996 100.00105 A105 A 2995 2997 99.93105 A105 S 1 2997 0.03105 A105 V 1 2997 0.03106 G106 G 2860 2997 95.43106 G106 A 128 2997 4.27106 G106 E 2 2997 0.07106 G106 A/G 2 2997 0.07106 G106 R 2 2997 0.07106 G106 S/A 2 2997 0.07106 G106 S 1 2997 0.03107 R107 R 2991 2997 99 80107 R107 R 2991 2997 99.80107 R107 G 4 2997 0.13107 R107 S 2 2997 0.07108 W108 W 2995 2996 99.97108 W108 * 1 2996 0.03109 P109 P 2995 2997 99.93109 P109 S 1 2997 0.03109 P109 R/P 1 2997 0.03110 V110 V 2978 2995 99.43110 V110 I 14 2995 0.47110 V110 A 1 2995 0.03110 V110 G 1 2995 0.03110 V110 E/V 1 2995 0.03111 K111 K 2814 2992 94.05111 K111 R 77 2992 2.57111 K111 T 53 2992 1.77111 K111 Q 23 2992 0.77111 K111 N 10 2992 0.33111 K111 R/K 8 2992 0.27111 K111 A 2 2992 0.07111 K111 A/T 2 2992 0.07
Page 15 of 40
m2.7.2.4 Integrase Amino Acid Frequency TableCONFIDENTIAL
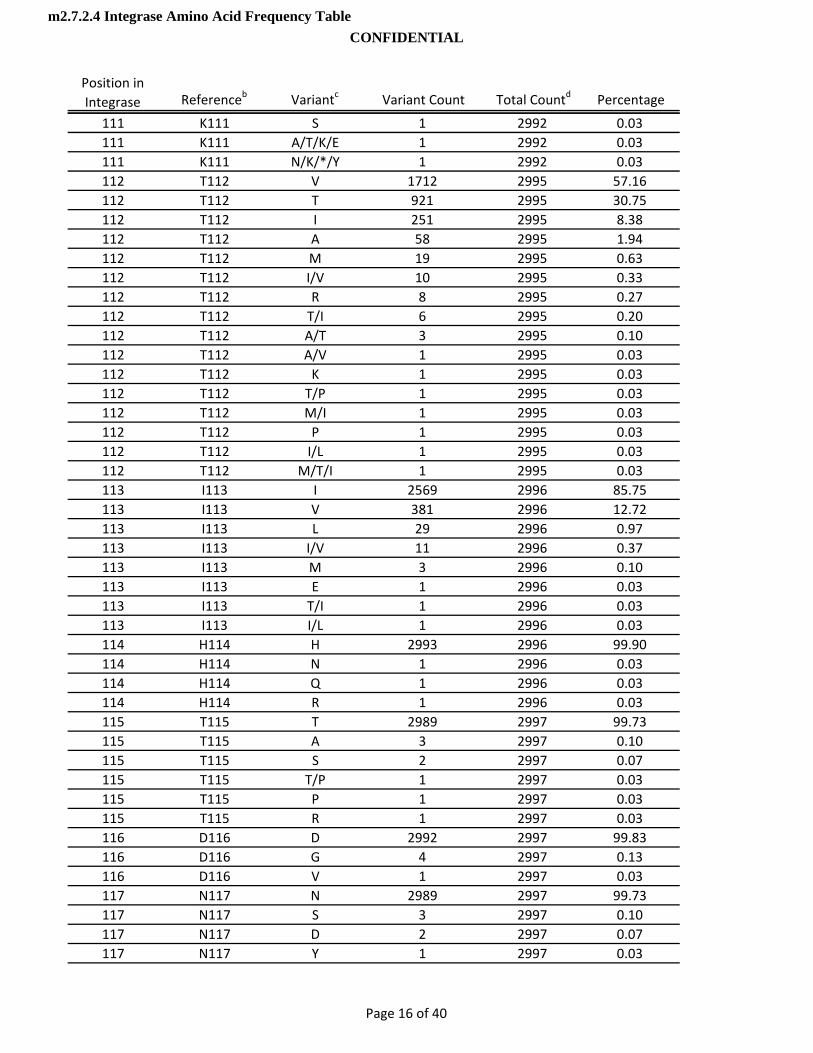
Position in Integrase Referenceb Variantc Variant Count Total Countd Percentage
111 K111 S 1 2992 0.03111 K111 A/T/K/E 1 2992 0.03111 K111 N/K/*/Y 1 2992 0.03112 T112 V 1712 2995 57.16112 T112 T 921 2995 30.75112 T112 I 251 2995 8.38112 T112 A 58 2995 1.94112 T112 M 19 2995 0.63112 T112 I/V 10 2995 0.33112 T112 R 8 2995 0.27112 T112 T/I 6 2995 0.20112 T112 A/T 3 2995 0.10112 T112 A/V 1 2995 0.03112 T112 K 1 2995 0.03112 T112 T/P 1 2995 0.03112 T112 M/I 1 2995 0.03112 T112 P 1 2995 0.03112 T112 I/L 1 2995 0.03112 T112 M/T/I 1 2995 0.03113 I113 I 2569 2996 85.75113 I113 V 381 2996 12.72113 I113 L 29 2996 0.97113 I113 I/V 11 2996 0.37113 I113 M 3 2996 0 10113 I113 M 3 2996 0.10113 I113 E 1 2996 0.03113 I113 T/I 1 2996 0.03113 I113 I/L 1 2996 0.03114 H114 H 2993 2996 99.90114 H114 N 1 2996 0.03114 H114 Q 1 2996 0.03114 H114 R 1 2996 0.03115 T115 T 2989 2997 99.73115 T115 A 3 2997 0.10115 T115 S 2 2997 0.07115 T115 T/P 1 2997 0.03115 T115 P 1 2997 0.03115 T115 R 1 2997 0.03116 D116 D 2992 2997 99.83116 D116 G 4 2997 0.13116 D116 V 1 2997 0.03117 N117 N 2989 2997 99.73117 N117 S 3 2997 0.10117 N117 D 2 2997 0.07117 N117 Y 1 2997 0.03
Page 16 of 40
m2.7.2.4 Integrase Amino Acid Frequency TableCONFIDENTIAL
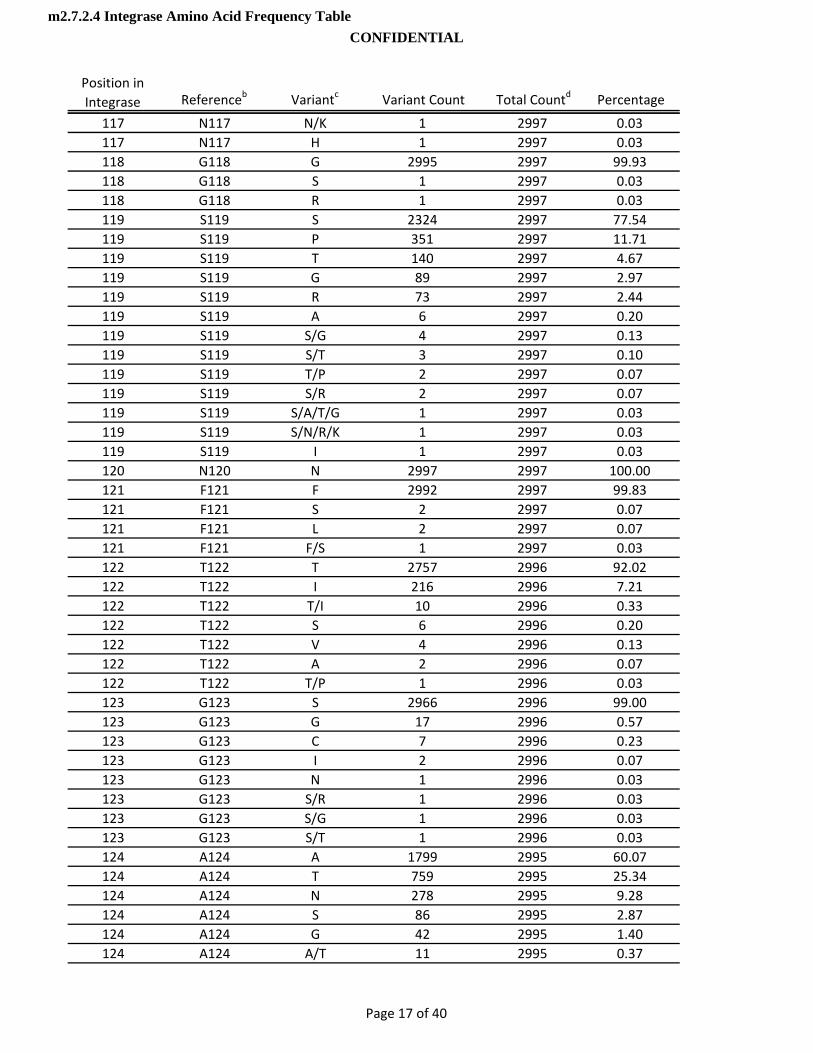
Position in Integrase Referenceb Variantc Variant Count Total Countd Percentage
117 N117 N/K 1 2997 0.03117 N117 H 1 2997 0.03118 G118 G 2995 2997 99.93118 G118 S 1 2997 0.03118 G118 R 1 2997 0.03119 S119 S 2324 2997 77.54119 S119 P 351 2997 11.71119 S119 T 140 2997 4.67119 S119 G 89 2997 2.97119 S119 R 73 2997 2.44119 S119 A 6 2997 0.20119 S119 S/G 4 2997 0.13119 S119 S/T 3 2997 0.10119 S119 T/P 2 2997 0.07119 S119 S/R 2 2997 0.07119 S119 S/A/T/G 1 2997 0.03119 S119 S/N/R/K 1 2997 0.03119 S119 I 1 2997 0.03120 N120 N 2997 2997 100.00121 F121 F 2992 2997 99.83121 F121 S 2 2997 0.07121 F121 L 2 2997 0.07121 F121 F/S 1 2997 0.03122 T122 T 2757 2996 92 02122 T122 T 2757 2996 92.02122 T122 I 216 2996 7.21122 T122 T/I 10 2996 0.33122 T122 S 6 2996 0.20122 T122 V 4 2996 0.13122 T122 A 2 2996 0.07122 T122 T/P 1 2996 0.03123 G123 S 2966 2996 99.00123 G123 G 17 2996 0.57123 G123 C 7 2996 0.23123 G123 I 2 2996 0.07123 G123 N 1 2996 0.03123 G123 S/R 1 2996 0.03123 G123 S/G 1 2996 0.03123 G123 S/T 1 2996 0.03124 A124 A 1799 2995 60.07124 A124 T 759 2995 25.34124 A124 N 278 2995 9.28124 A124 S 86 2995 2.87124 A124 G 42 2995 1.40124 A124 A/T 11 2995 0.37
Page 17 of 40
m2.7.2.4 Integrase Amino Acid Frequency TableCONFIDENTIAL
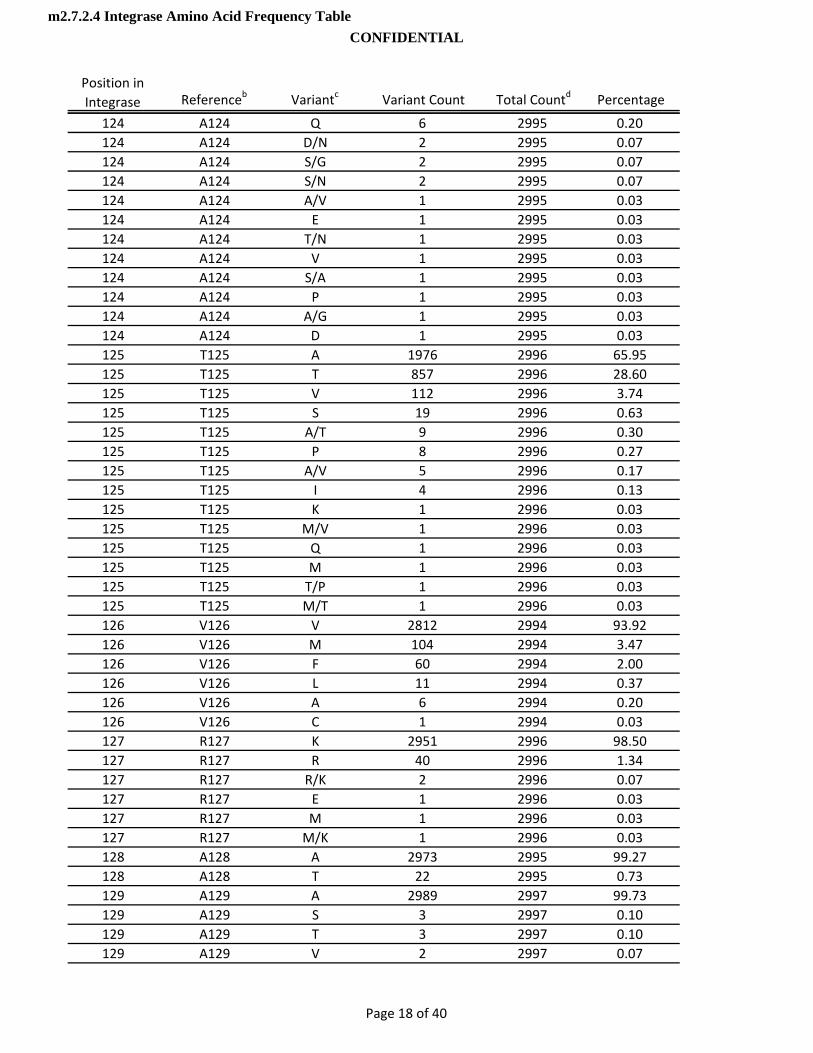
Position in Integrase Referenceb Variantc Variant Count Total Countd Percentage
124 A124 Q 6 2995 0.20124 A124 D/N 2 2995 0.07124 A124 S/G 2 2995 0.07124 A124 S/N 2 2995 0.07124 A124 A/V 1 2995 0.03124 A124 E 1 2995 0.03124 A124 T/N 1 2995 0.03124 A124 V 1 2995 0.03124 A124 S/A 1 2995 0.03124 A124 P 1 2995 0.03124 A124 A/G 1 2995 0.03124 A124 D 1 2995 0.03125 T125 A 1976 2996 65.95125 T125 T 857 2996 28.60125 T125 V 112 2996 3.74125 T125 S 19 2996 0.63125 T125 A/T 9 2996 0.30125 T125 P 8 2996 0.27125 T125 A/V 5 2996 0.17125 T125 I 4 2996 0.13125 T125 K 1 2996 0.03125 T125 M/V 1 2996 0.03125 T125 Q 1 2996 0.03125 T125 M 1 2996 0 03125 T125 M 1 2996 0.03125 T125 T/P 1 2996 0.03125 T125 M/T 1 2996 0.03126 V126 V 2812 2994 93.92126 V126 M 104 2994 3.47126 V126 F 60 2994 2.00126 V126 L 11 2994 0.37126 V126 A 6 2994 0.20126 V126 C 1 2994 0.03127 R127 K 2951 2996 98.50127 R127 R 40 2996 1.34127 R127 R/K 2 2996 0.07127 R127 E 1 2996 0.03127 R127 M 1 2996 0.03127 R127 M/K 1 2996 0.03128 A128 A 2973 2995 99.27128 A128 T 22 2995 0.73129 A129 A 2989 2997 99.73129 A129 S 3 2997 0.10129 A129 T 3 2997 0.10129 A129 V 2 2997 0.07
Page 18 of 40
m2.7.2.4 Integrase Amino Acid Frequency TableCONFIDENTIAL

Position in Integrase Referenceb Variantc Variant Count Total Countd Percentage
130 C130 C 2995 2997 99.93130 C130 F/C 1 2997 0.03130 C130 W 1 2997 0.03131 W131 W 2993 2997 99.87131 W131 W/* 2 2997 0.07131 W131 R 1 2997 0.03131 W131 G 1 2997 0.03132 W132 W 2991 2997 99.80132 W132 * 4 2997 0.13132 W132 W/G 1 2997 0.03132 W132 C 1 2997 0.03133 A133 A 2939 2997 98.06133 A133 T 55 2997 1.84133 A133 S 2 2997 0.07133 A133 V 1 2997 0.03134 G134 G 1932 2996 64.49134 G134 N 866 2996 28.91134 G134 D 137 2996 4.57134 G134 S 41 2996 1.37134 G134 E 6 2996 0.20134 G134 D/N 5 2996 0.17134 G134 S/D/N/G 3 2996 0.10134 G134 S/N 3 2996 0.10134 G134 R 2 2996 0 07134 G134 R 2 2996 0.07134 G134 K 1 2996 0.03135 I135 I 2291 2997 76.44135 I135 V 690 2997 23.02135 I135 I/V 12 2997 0.40135 I135 T 2 2997 0.07135 I135 A/V 1 2997 0.03135 I135 L 1 2997 0.03136 K136 K 1212 2995 40.47136 K136 Q 1049 2995 35.03136 K136 T 585 2995 19.53136 K136 R 102 2995 3.41136 K136 H 14 2995 0.47136 K136 N 13 2995 0.43136 K136 Q/K 2 2995 0.07136 K136 L 2 2995 0.07136 K136 K/* 2 2995 0.07136 K136 I 2 2995 0.07136 K136 Q/R/K 1 2995 0.03136 K136 * 1 2995 0.03136 K136 H/Q 1 2995 0.03
Page 19 of 40
m2.7.2.4 Integrase Amino Acid Frequency TableCONFIDENTIAL
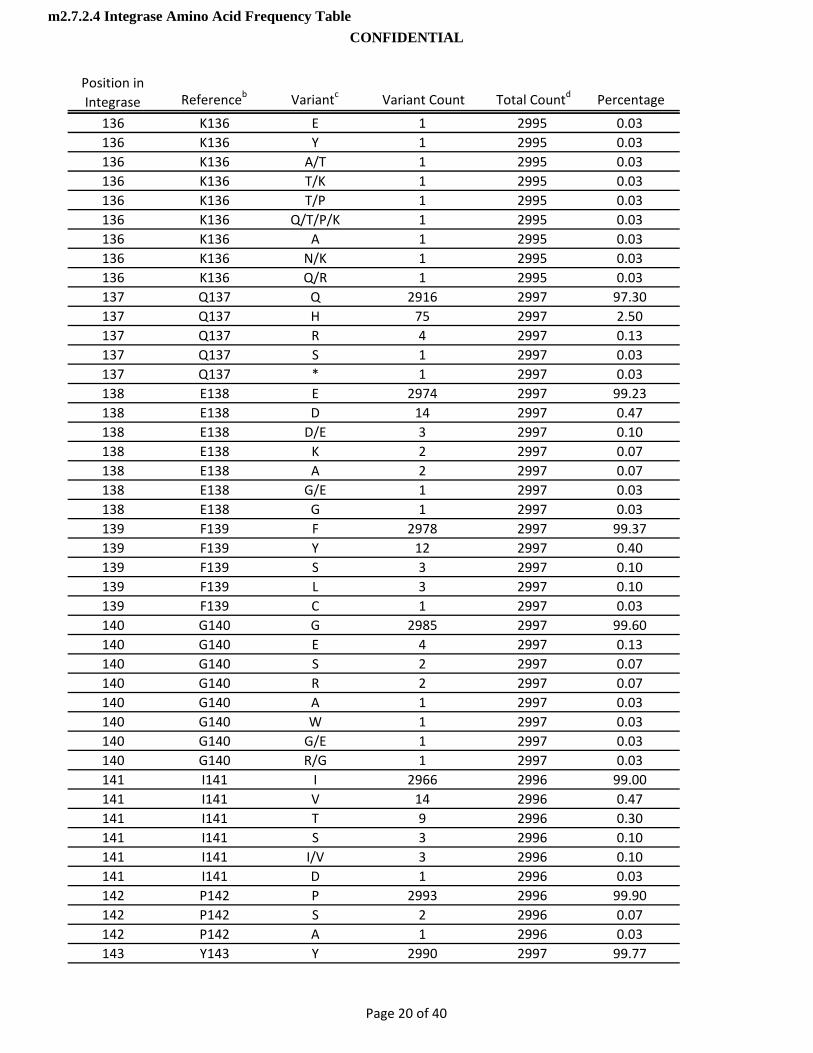
Position in Integrase Referenceb Variantc Variant Count Total Countd Percentage
136 K136 E 1 2995 0.03136 K136 Y 1 2995 0.03136 K136 A/T 1 2995 0.03136 K136 T/K 1 2995 0.03136 K136 T/P 1 2995 0.03136 K136 Q/T/P/K 1 2995 0.03136 K136 A 1 2995 0.03136 K136 N/K 1 2995 0.03136 K136 Q/R 1 2995 0.03137 Q137 Q 2916 2997 97.30137 Q137 H 75 2997 2.50137 Q137 R 4 2997 0.13137 Q137 S 1 2997 0.03137 Q137 * 1 2997 0.03138 E138 E 2974 2997 99.23138 E138 D 14 2997 0.47138 E138 D/E 3 2997 0.10138 E138 K 2 2997 0.07138 E138 A 2 2997 0.07138 E138 G/E 1 2997 0.03138 E138 G 1 2997 0.03139 F139 F 2978 2997 99.37139 F139 Y 12 2997 0.40139 F139 S 3 2997 0 10139 F139 S 3 2997 0.10139 F139 L 3 2997 0.10139 F139 C 1 2997 0.03140 G140 G 2985 2997 99.60140 G140 E 4 2997 0.13140 G140 S 2 2997 0.07140 G140 R 2 2997 0.07140 G140 A 1 2997 0.03140 G140 W 1 2997 0.03140 G140 G/E 1 2997 0.03140 G140 R/G 1 2997 0.03141 I141 I 2966 2996 99.00141 I141 V 14 2996 0.47141 I141 T 9 2996 0.30141 I141 S 3 2996 0.10141 I141 I/V 3 2996 0.10141 I141 D 1 2996 0.03142 P142 P 2993 2996 99.90142 P142 S 2 2996 0.07142 P142 A 1 2996 0.03143 Y143 Y 2990 2997 99.77
Page 20 of 40
m2.7.2.4 Integrase Amino Acid Frequency TableCONFIDENTIAL

Position in Integrase Referenceb Variantc Variant Count Total Countd Percentage
143 Y143 H 6 2997 0.20143 Y143 S/Y 1 2997 0.03144 N144 N 2986 2996 99.67144 N144 S 7 2996 0.23144 N144 N/Y 1 2996 0.03144 N144 H/Y 1 2996 0.03144 N144 D 1 2996 0.03145 P145 P 2994 2997 99.90145 P145 S 1 2997 0.03145 P145 T 1 2997 0.03145 P145 L 1 2997 0.03146 Q146 Q 2995 2997 99.93146 Q146 H/Q 1 2997 0.03146 Q146 P 1 2997 0.03147 S147 S 2993 2997 99.87147 S147 G 4 2997 0.13148 Q148 Q 2995 2997 99.93148 Q148 P 1 2997 0.03148 Q148 H 1 2997 0.03149 G149 G 2992 2996 99.87149 G149 G/E 2 2996 0.07149 G149 E 1 2996 0.03149 G149 R 1 2996 0.03150 V150 V 2984 2997 99 57150 V150 V 2984 2997 99.57150 V150 A 10 2997 0.33150 V150 I 2 2997 0.07150 V150 I/V 1 2997 0.03151 V151 V 2914 2996 97.26151 V151 I 74 2996 2.47151 V151 I/V 4 2996 0.13151 V151 L 2 2996 0.07151 V151 M 1 2996 0.03151 V151 L/V 1 2996 0.03152 E152 E 2969 2996 99.10152 E152 K 14 2996 0.47152 E152 Q 3 2996 0.10152 E152 V 2 2996 0.07152 E152 K/E 2 2996 0.07152 E152 D 2 2996 0.07152 E152 G 2 2996 0.07152 E152 A 1 2996 0.03152 E152 G/E 1 2996 0.03153 S153 S 2908 2995 97.10153 S153 A 83 2995 2.77
Page 21 of 40
m2.7.2.4 Integrase Amino Acid Frequency TableCONFIDENTIAL

Position in Integrase Referenceb Variantc Variant Count Total Countd Percentage
153 S153 P 2 2995 0.07153 S153 T 1 2995 0.03153 S153 Y 1 2995 0.03154 M154 M 2890 2995 96.49154 M154 I 86 2995 2.87154 M154 L 11 2995 0.37154 M154 T 4 2995 0.13154 M154 V 2 2995 0.07154 M154 M/I 2 2995 0.07155 N155 N 2991 2996 99.83155 N155 H 2 2996 0.07155 N155 S 1 2996 0.03155 N155 T 1 2996 0.03155 N155 K 1 2996 0.03156 K156 K 2902 2996 96.86156 K156 N 82 2996 2.74156 K156 R 9 2996 0.30156 K156 T 1 2996 0.03156 K156 H 1 2996 0.03156 K156 I 1 2996 0.03157 E157 E 2908 2996 97.06157 E157 Q 60 2996 2.00157 E157 K 12 2996 0.40157 E157 D 5 2996 0 17157 E157 D 5 2996 0.17157 E157 N 4 2996 0.13157 E157 K/E 2 2996 0.07157 E157 Q/E 1 2996 0.03157 E157 H/Q 1 2996 0.03157 E157 A 1 2996 0.03157 E157 G/E 1 2996 0.03157 E157 G 1 2996 0.03158 L158 L 2995 2996 99.97158 L158 V 1 2996 0.03159 K159 K 2987 2997 99.67159 K159 R 6 2997 0.20159 K159 E 2 2997 0.07159 K159 Q 2 2997 0.07160 K160 K 2845 2994 95.02160 K160 S 70 2994 2.34160 K160 Q 33 2994 1.10160 K160 R 24 2994 0.80160 K160 T 10 2994 0.33160 K160 N 6 2994 0.20160 K160 E 3 2994 0.10
Page 22 of 40
m2.7.2.4 Integrase Amino Acid Frequency TableCONFIDENTIAL

Position in Integrase Referenceb Variantc Variant Count Total Countd Percentage
160 K160 N/K 2 2994 0.07160 K160 R/K 1 2994 0.03161 I161 I 2978 2996 99.40161 I161 V 7 2996 0.23161 I161 T 5 2996 0.17161 I161 L 5 2996 0.17161 I161 S 1 2996 0.03162 I162 I 2981 2996 99.50162 I162 V 12 2996 0.40162 I162 T 1 2996 0.03162 I162 Q 1 2996 0.03162 I162 M 1 2996 0.03163 G163 G 2743 2996 91.56163 G163 E 88 2996 2.94163 G163 Q 68 2996 2.27163 G163 K 19 2996 0.63163 G163 R 15 2996 0.50163 G163 T 14 2996 0.47163 G163 V 14 2996 0.47163 G163 A 12 2996 0.40163 G163 S 9 2996 0.30163 G163 N 5 2996 0.17163 G163 Q/E 1 2996 0.03163 G163 A/T 1 2996 0 03163 G163 A/T 1 2996 0.03163 G163 M 1 2996 0.03163 G163 G/E 1 2996 0.03163 G163 H 1 2996 0.03163 G163 A/G 1 2996 0.03163 G163 I 1 2996 0.03163 G163 R/G 1 2996 0.03163 G163 Q/R 1 2996 0.03164 Q164 Q 2995 2997 99.93164 Q164 K 1 2997 0.03164 Q164 R 1 2997 0.03165 V165 V 2839 2996 94.76165 V165 I 152 2996 5.07165 V165 I/V 4 2996 0.13165 V165 A 1 2996 0.03166 R166 R 2981 2997 99.47166 R166 K 8 2997 0.27166 R166 G 6 2997 0.20166 R166 S 1 2997 0.03166 R166 T 1 2997 0.03167 D167 D 2446 2997 81.61
Page 23 of 40
m2.7.2.4 Integrase Amino Acid Frequency TableCONFIDENTIAL
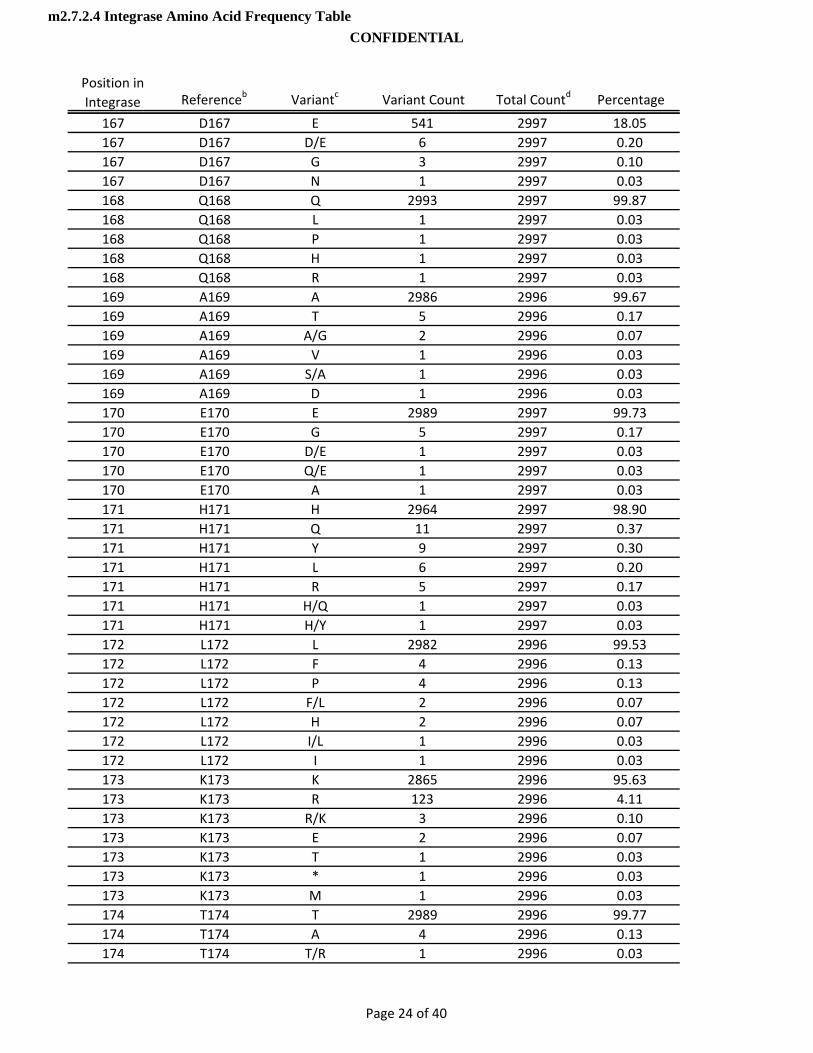
Position in Integrase Referenceb Variantc Variant Count Total Countd Percentage
167 D167 E 541 2997 18.05167 D167 D/E 6 2997 0.20167 D167 G 3 2997 0.10167 D167 N 1 2997 0.03168 Q168 Q 2993 2997 99.87168 Q168 L 1 2997 0.03168 Q168 P 1 2997 0.03168 Q168 H 1 2997 0.03168 Q168 R 1 2997 0.03169 A169 A 2986 2996 99.67169 A169 T 5 2996 0.17169 A169 A/G 2 2996 0.07169 A169 V 1 2996 0.03169 A169 S/A 1 2996 0.03169 A169 D 1 2996 0.03170 E170 E 2989 2997 99.73170 E170 G 5 2997 0.17170 E170 D/E 1 2997 0.03170 E170 Q/E 1 2997 0.03170 E170 A 1 2997 0.03171 H171 H 2964 2997 98.90171 H171 Q 11 2997 0.37171 H171 Y 9 2997 0.30171 H171 L 6 2997 0 20171 H171 L 6 2997 0.20171 H171 R 5 2997 0.17171 H171 H/Q 1 2997 0.03171 H171 H/Y 1 2997 0.03172 L172 L 2982 2996 99.53172 L172 F 4 2996 0.13172 L172 P 4 2996 0.13172 L172 F/L 2 2996 0.07172 L172 H 2 2996 0.07172 L172 I/L 1 2996 0.03172 L172 I 1 2996 0.03173 K173 K 2865 2996 95.63173 K173 R 123 2996 4.11173 K173 R/K 3 2996 0.10173 K173 E 2 2996 0.07173 K173 T 1 2996 0.03173 K173 * 1 2996 0.03173 K173 M 1 2996 0.03174 T174 T 2989 2996 99.77174 T174 A 4 2996 0.13174 T174 T/R 1 2996 0.03
Page 24 of 40
m2.7.2.4 Integrase Amino Acid Frequency TableCONFIDENTIAL

Position in Integrase Referenceb Variantc Variant Count Total Countd Percentage
174 T174 A/T 1 2996 0.03174 T174 R 1 2996 0.03175 A175 A 2995 2997 99.93175 A175 T 1 2997 0.03175 A175 V 1 2997 0.03176 V176 V 2986 2997 99.63176 V176 L 5 2997 0.17176 V176 F 1 2997 0.03176 V176 A/V 1 2997 0.03176 V176 I/V 1 2997 0.03176 V176 A 1 2997 0.03176 V176 I 1 2997 0.03176 V176 G 1 2997 0.03177 Q177 Q 2978 2995 99.43177 Q177 L 13 2995 0.43177 Q177 H 2 2995 0.07177 Q177 Q/L 1 2995 0.03177 Q177 P 1 2995 0.03178 M178 M 2991 2996 99.83178 M178 V 3 2996 0.10178 M178 T 1 2996 0.03178 M178 M/R 1 2996 0.03179 A179 A 2993 2996 99.90179 A179 S 1 2996 0 03179 A179 S 1 2996 0.03179 A179 T 1 2996 0.03179 A179 V 1 2996 0.03180 V180 V 2989 2995 99.80180 V180 A 4 2995 0.13180 V180 I 2 2995 0.07181 F181 F 2925 2996 97.63181 F181 L 54 2996 1.80181 F181 Y 11 2996 0.37181 F181 F/L 4 2996 0.13181 F181 S 1 2996 0.03181 F181 H 1 2996 0.03182 I182 I 2913 2996 97.23182 I182 V 79 2996 2.64182 I182 I/V 2 2996 0.07182 I182 F 1 2996 0.03182 I182 T 1 2996 0.03183 H183 H 2988 2995 99.77183 H183 R 3 2995 0.10183 H183 Y 2 2995 0.07183 H183 H/R 1 2995 0.03
Page 25 of 40
m2.7.2.4 Integrase Amino Acid Frequency TableCONFIDENTIAL
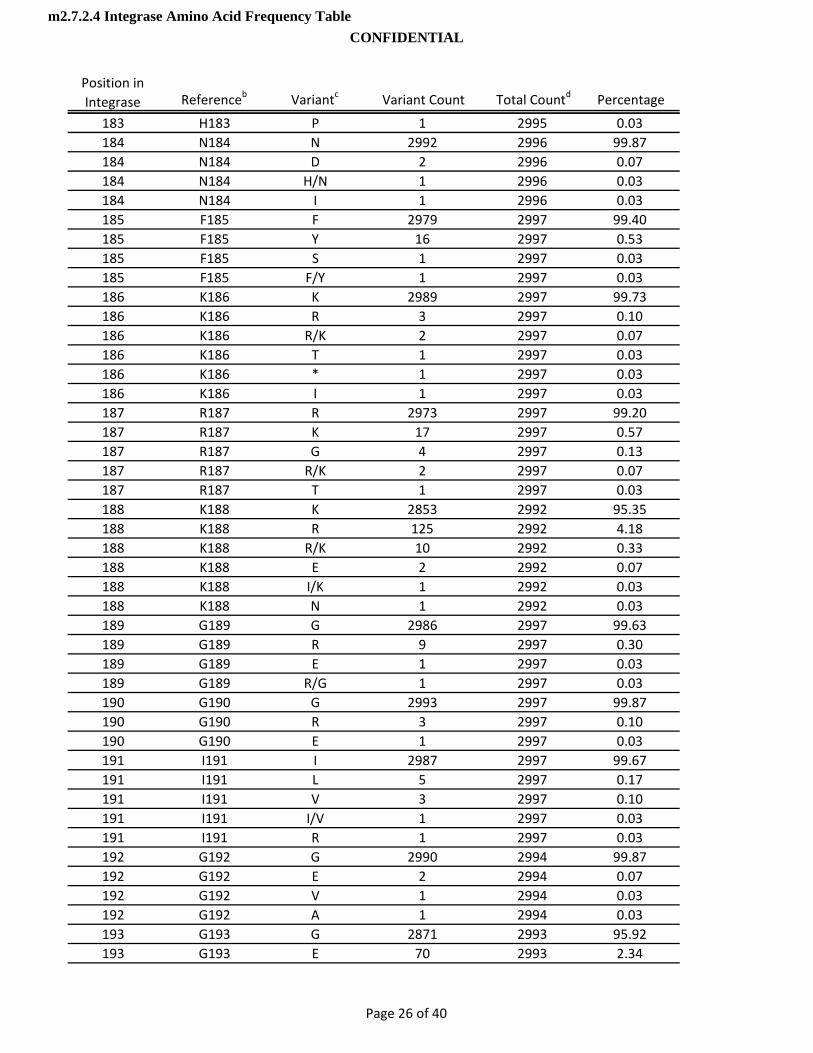
Position in Integrase Referenceb Variantc Variant Count Total Countd Percentage
183 H183 P 1 2995 0.03184 N184 N 2992 2996 99.87184 N184 D 2 2996 0.07184 N184 H/N 1 2996 0.03184 N184 I 1 2996 0.03185 F185 F 2979 2997 99.40185 F185 Y 16 2997 0.53185 F185 S 1 2997 0.03185 F185 F/Y 1 2997 0.03186 K186 K 2989 2997 99.73186 K186 R 3 2997 0.10186 K186 R/K 2 2997 0.07186 K186 T 1 2997 0.03186 K186 * 1 2997 0.03186 K186 I 1 2997 0.03187 R187 R 2973 2997 99.20187 R187 K 17 2997 0.57187 R187 G 4 2997 0.13187 R187 R/K 2 2997 0.07187 R187 T 1 2997 0.03188 K188 K 2853 2992 95.35188 K188 R 125 2992 4.18188 K188 R/K 10 2992 0.33188 K188 E 2 2992 0 07188 K188 E 2 2992 0.07188 K188 I/K 1 2992 0.03188 K188 N 1 2992 0.03189 G189 G 2986 2997 99.63189 G189 R 9 2997 0.30189 G189 E 1 2997 0.03189 G189 R/G 1 2997 0.03190 G190 G 2993 2997 99.87190 G190 R 3 2997 0.10190 G190 E 1 2997 0.03191 I191 I 2987 2997 99.67191 I191 L 5 2997 0.17191 I191 V 3 2997 0.10191 I191 I/V 1 2997 0.03191 I191 R 1 2997 0.03192 G192 G 2990 2994 99.87192 G192 E 2 2994 0.07192 G192 V 1 2994 0.03192 G192 A 1 2994 0.03193 G193 G 2871 2993 95.92193 G193 E 70 2993 2.34
Page 26 of 40
m2.7.2.4 Integrase Amino Acid Frequency TableCONFIDENTIAL

Position in Integrase Referenceb Variantc Variant Count Total Countd Percentage
193 G193 D 28 2993 0.94193 G193 R 17 2993 0.57193 G193 G/E 4 2993 0.13193 G193 R/G 3 2993 0.10193_1 _193_1 N 1 1 100.00194 Y194 Y 2976 2997 99.30194 Y194 C 13 2997 0.43194 Y194 T 2 2997 0.07194 Y194 C/Y 2 2997 0.07194 Y194 H 2 2997 0.07194 Y194 S 1 2997 0.03194 Y194 */Y 1 2997 0.03195 S195 S 2877 2997 96.00195 S195 T 97 2997 3.24195 S195 C 20 2997 0.67195 S195 G 2 2997 0.07195 S195 S/N 1 2997 0.03196 A196 A 2985 2997 99.60196 A196 P 7 2997 0.23196 A196 V 3 2997 0.10196 A196 S 1 2997 0.03196 A196 T 1 2997 0.03197 G197 G 2993 2996 99.90197 G197 R 3 2996 0 10197 G197 R 3 2996 0.10198 E198 E 2988 2997 99.70198 E198 D 5 2997 0.17198 E198 G 3 2997 0.10198 E198 K 1 2997 0.03199 R199 R 2987 2994 99.77199 R199 G 5 2994 0.17199 R199 K 1 2994 0.03199 R199 R/K 1 2994 0.03200 I200 I 2927 2994 97.76200 I200 L 36 2994 1.20200 I200 M 24 2994 0.80200 I200 V 4 2994 0.13200 I200 T 2 2994 0.07200 I200 D 1 2994 0.03201 V201 I 2288 2994 76.42201 V201 V 687 2994 22.95201 V201 I/V 9 2994 0.30201 V201 L 7 2994 0.23201 V201 M 2 2994 0.07201 V201 T 1 2994 0.03
Page 27 of 40
m2.7.2.4 Integrase Amino Acid Frequency TableCONFIDENTIAL

Position in Integrase Referenceb Variantc Variant Count Total Countd Percentage
202 D202 D 2987 2992 99.83202 D202 H 2 2992 0.07202 D202 D/Y 1 2992 0.03202 D202 Y 1 2992 0.03202 D202 G 1 2992 0.03203 I203 I 2901 2995 96.86203 I203 M 87 2995 2.90203 I203 M/I 3 2995 0.10203 I203 L 3 2995 0.10203 I203 T/I 1 2995 0.03204 I204 I 2906 2997 96.96204 I204 L 78 2997 2.60204 I204 V 7 2997 0.23204 I204 I/V 4 2997 0.13204 I204 M 1 2997 0.03204 I204 R 1 2997 0.03205 A205 A 2910 2997 97.10205 A205 S 80 2997 2.67205 A205 T 3 2997 0.10205 A205 P 2 2997 0.07205 A205 V 1 2997 0.03205 A205 A/T 1 2997 0.03206 T206 T 2132 2996 71.16206 T206 S 849 2996 28 34206 T206 S 849 2996 28.34206 T206 A 6 2996 0.20206 T206 S/T 6 2996 0.20206 T206 P 2 2996 0.07206 T206 T/P 1 2996 0.03207 D207 D 2870 2997 95.76207 D207 Q 57 2997 1.90207 D207 E 36 2997 1.20207 D207 H 15 2997 0.50207 D207 D/E 8 2997 0.27207 D207 G 5 2997 0.17207 D207 N 4 2997 0.13207 D207 D/G 1 2997 0.03207 D207 V 1 2997 0.03208 I208 I 2832 2997 94.49208 I208 L 115 2997 3.84208 I208 M 37 2997 1.23208 I208 M/I 6 2997 0.20208 I208 I/L 6 2997 0.20208 I208 M/I/L 1 2997 0.03209 Q209 Q 2987 2996 99.70
Page 28 of 40
m2.7.2.4 Integrase Amino Acid Frequency TableCONFIDENTIAL

Position in Integrase Referenceb Variantc Variant Count Total Countd Percentage
209 Q209 P 4 2996 0.13209 Q209 R 3 2996 0.10209 Q209 H 1 2996 0.03209 Q209 Q/R 1 2996 0.03210 T210 T 2975 2996 99.30210 T210 I 7 2996 0.23210 T210 T/I 4 2996 0.13210 T210 S 3 2996 0.10210 T210 A 3 2996 0.10210 T210 V 1 2996 0.03210 T210 A/T 1 2996 0.03210 T210 T/P 1 2996 0.03210 T210 S/T 1 2996 0.03211 K211 K 2553 2994 85.27211 K211 R 283 2994 9.45211 K211 T 114 2994 3.81211 K211 Q 23 2994 0.77211 K211 R/K 13 2994 0.43211 K211 N 4 2994 0.13211 K211 E 2 2994 0.07211 K211 Q/P 1 2994 0.03211 K211 Q/K/* 1 2994 0.03212 E212 E 2941 2994 98.23212 E212 A 22 2994 0 73212 E212 A 22 2994 0.73212 E212 Q 13 2994 0.43212 E212 K 7 2994 0.23212 E212 A/V 3 2994 0.10212 E212 V 3 2994 0.10212 E212 D/E 1 2994 0.03212 E212 N 1 2994 0.03212 E212 A/Q/P/E 1 2994 0.03212 E212 I 1 2994 0.03212 E212 G 1 2994 0.03213 L213 L 2986 2993 99.77213 L213 F 3 2993 0.10213 L213 S 2 2993 0.07213 L213 S/L 1 2993 0.03213 L213 P/L 1 2993 0.03214 Q214 Q 2986 2995 99.70214 Q214 E 2 2995 0.07214 Q214 P 2 2995 0.07214 Q214 H 2 2995 0.07214 Q214 H/Q 1 2995 0.03214 Q214 R 1 2995 0.03
Page 29 of 40
m2.7.2.4 Integrase Amino Acid Frequency TableCONFIDENTIAL

Position in Integrase Referenceb Variantc Variant Count Total Countd Percentage
214 Q214 Q/R 1 2995 0.03215 K215 K 2864 2995 95.63215 K215 N 95 2995 3.17215 K215 R 20 2995 0.67215 K215 T 8 2995 0.27215 K215 Q 3 2995 0.10215 K215 N/K 2 2995 0.07215 K215 R/K 1 2995 0.03215 K215 L 1 2995 0.03215 K215 K/* 1 2995 0.03216 Q216 Q 2895 2996 96.63216 Q216 H 62 2996 2.07216 Q216 R 18 2996 0.60216 Q216 N 13 2996 0.43216 Q216 H/Q 3 2996 0.10216 Q216 P 2 2996 0.07216 Q216 Q/P 1 2996 0.03216 Q216 K 1 2996 0.03216 Q216 Q/R 1 2996 0.03217 I217 I 2976 2995 99.37217 I217 V 15 2995 0.50217 I217 M 2 2995 0.07217 I217 F 1 2995 0.03217 I217 F/I 1 2995 0 03217 I217 F/I 1 2995 0.03218 T218 T 1918 2996 64.02218 T218 I 834 2996 27.84218 T218 L 107 2996 3.57218 T218 S 75 2996 2.50218 T218 T/I 23 2996 0.77218 T218 F 18 2996 0.60218 T218 M 14 2996 0.47218 T218 S/T 2 2996 0.07218 T218 N 1 2996 0.03218 T218 M/I 1 2996 0.03218 T218 A 1 2996 0.03218 T218 M/T 1 2996 0.03218 T218 R 1 2996 0.03219 K219 K 2870 2995 95.83219 K219 N 54 2995 1.80219 K219 Q 52 2995 1.74219 K219 R 8 2995 0.27219 K219 Q/K 4 2995 0.13219 K219 E 3 2995 0.10219 K219 R/K 2 2995 0.07
Page 30 of 40
m2.7.2.4 Integrase Amino Acid Frequency TableCONFIDENTIAL

Position in Integrase Referenceb Variantc Variant Count Total Countd Percentage
219 K219 N/K 1 2995 0.03219 K219 I 1 2995 0.03220 I220 I 2897 2994 96.76220 I220 V 41 2994 1.37220 I220 L 36 2994 1.20220 I220 M 9 2994 0.30220 I220 I/V 5 2994 0.17220 I220 F 2 2994 0.07220 I220 F/I 2 2994 0.07220 I220 I/L 1 2994 0.03220 I220 D 1 2994 0.03221 Q221 Q 2926 2997 97.63221 Q221 R 16 2997 0.53221 Q221 S 12 2997 0.40221 Q221 H 11 2997 0.37221 Q221 T 8 2997 0.27221 Q221 P 5 2997 0.17221 Q221 K 4 2997 0.13221 Q221 Q/R/K 2 2997 0.07221 Q221 N 2 2997 0.07221 Q221 Q/K 2 2997 0.07221 Q221 H/Q 2 2997 0.07221 Q221 E 2 2997 0.07221 Q221 Q/P 1 2997 0 03221 Q221 Q/P 1 2997 0.03221 Q221 * 1 2997 0.03221 Q221 Q/R/* 1 2997 0.03221 Q221 Q/R 1 2997 0.03221 Q221 G 1 2997 0.03222 N222 N 2842 2995 94.89222 N222 K 120 2995 4.01222 N222 H 14 2995 0.47222 N222 H/N 5 2995 0.17222 N222 T 3 2995 0.10222 N222 N/K 3 2995 0.10222 N222 S 2 2995 0.07222 N222 T/N 2 2995 0.07222 N222 D 2 2995 0.07222 N222 I 2 2995 0.07223 F223 F 2990 2995 99.83223 F223 C 2 2995 0.07223 F223 Y 1 2995 0.03223 F223 F/S 1 2995 0.03223 F223 L 1 2995 0.03224 R224 R 2956 2995 98.70
Page 31 of 40
m2.7.2.4 Integrase Amino Acid Frequency TableCONFIDENTIAL

Position in Integrase Referenceb Variantc Variant Count Total Countd Percentage
224 R224 Q 34 2995 1.14224 R224 W 3 2995 0.10224 R224 W/R 1 2995 0.03224 R224 Q/R 1 2995 0.03225 V225 V 2991 2995 99.87225 V225 A 3 2995 0.10225 V225 C 1 2995 0.03226 Y226 Y 2990 2995 99.83226 Y226 F 2 2995 0.07226 Y226 C 2 2995 0.07226 Y226 * 1 2995 0.03227 Y227 Y 2834 2995 94.62227 Y227 F 154 2995 5.14227 Y227 F/Y 4 2995 0.13227 Y227 S 1 2995 0.03227 Y227 C/Y 1 2995 0.03227 Y227 H 1 2995 0.03228 R228 R 2990 2995 99.83228 R228 G 4 2995 0.13228 R228 K 1 2995 0.03229 D229 D 2990 2997 99.77229 D229 E 5 2997 0.17229 D229 D/N 1 2997 0.03229 D229 G 1 2997 0 03229 D229 G 1 2997 0.03230 S230 S 2894 2997 96.56230 S230 N 98 2997 3.27230 S230 S/N 3 2997 0.10230 S230 R 1 2997 0.03230 S230 G 1 2997 0.03231 R231 R 2974 2997 99.23231 R231 K 16 2997 0.53231 R231 G 4 2997 0.13231 R231 S 1 2997 0.03231 R231 T/R 1 2997 0.03231 R231 I 1 2997 0.03232 N232 D 2920 2996 97.46232 N232 E 38 2996 1.27232 N232 N 31 2996 1.03232 N232 G 5 2996 0.17232 N232 D/E 2 2996 0.07233 P233 P 2986 2997 99.63233 P233 S 9 2997 0.30233 P233 P/L 1 2997 0.03233 P233 R/P 1 2997 0.03
Page 32 of 40
m2.7.2.4 Integrase Amino Acid Frequency TableCONFIDENTIAL

Position in Integrase Referenceb Variantc Variant Count Total Countd Percentage
234 L234 I 1896 2996 63.28234 L234 L 889 2996 29.67234 L234 V 181 2996 6.04234 L234 S 13 2996 0.43234 L234 F 5 2996 0.17234 L234 T 4 2996 0.13234 L234 H 3 2996 0.10234 L234 I/V 2 2996 0.07234 L234 M 1 2996 0.03234 L234 P 1 2996 0.03234 L234 R 1 2996 0.03235 W235 W 2993 2997 99.87235 W235 R 2 2997 0.07235 W235 W/G 1 2997 0.03235 W235 W/* 1 2997 0.03236 K236 K 2995 2997 99.93236 K236 R 2 2997 0.07237 G237 G 2995 2997 99.93237 G237 R 2 2997 0.07238 P238 P 2992 2996 99.87238 P238 L 2 2996 0.07238 P238 S 1 2996 0.03238 P238 H 1 2996 0.03239 A239 A 2995 2996 99 97239 A239 A 2995 2996 99.97239 A239 T 1 2996 0.03240 K240 K 2903 2994 96.96240 K240 Q 70 2994 2.34240 K240 R 14 2994 0.47240 K240 E 6 2994 0.20240 K240 I 1 2994 0.03241 L241 L 2993 2996 99.90241 L241 V 1 2996 0.03241 L241 Q 1 2996 0.03241 L241 P 1 2996 0.03242 L242 L 2992 2996 99.87242 L242 I 2 2996 0.07242 L242 F 1 2996 0.03242 L242 P 1 2996 0.03243 W243 W 2988 2994 99.80243 W243 R 2 2994 0.07243 W243 * 1 2994 0.03243 W243 W/* 1 2994 0.03243 W243 W/L 1 2994 0.03243 W243 G 1 2994 0.03
Page 33 of 40
m2.7.2.4 Integrase Amino Acid Frequency TableCONFIDENTIAL
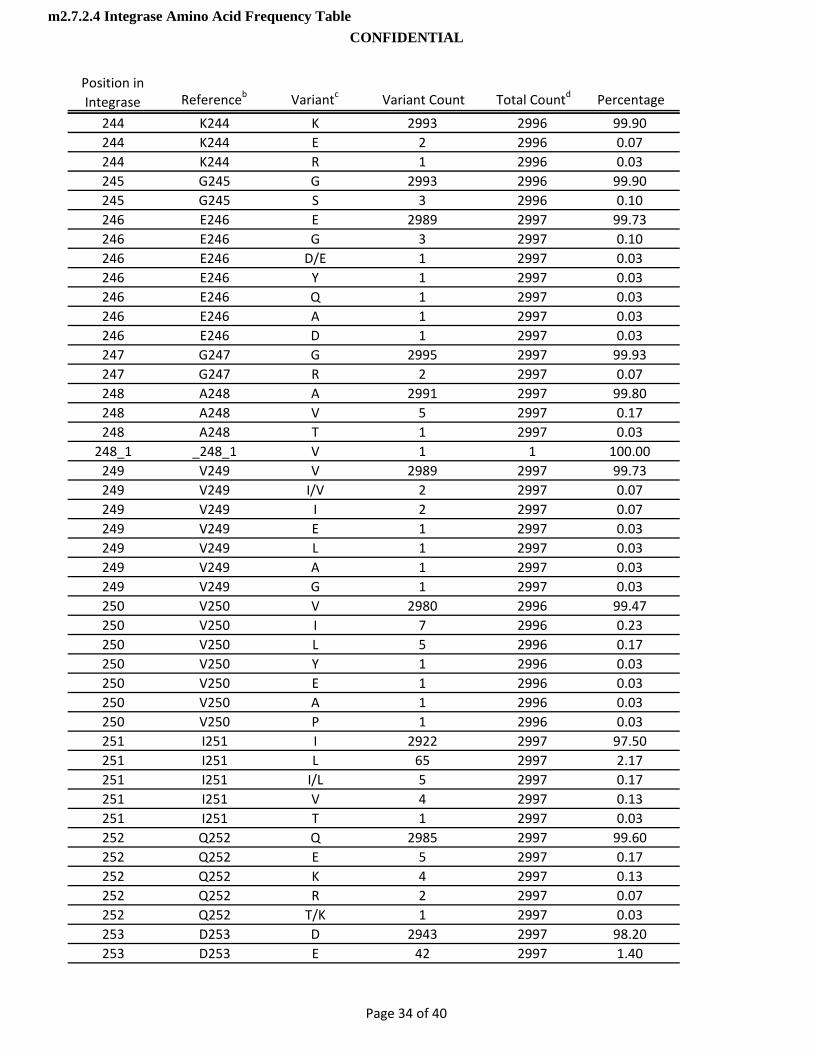
Position in Integrase Referenceb Variantc Variant Count Total Countd Percentage
244 K244 K 2993 2996 99.90244 K244 E 2 2996 0.07244 K244 R 1 2996 0.03245 G245 G 2993 2996 99.90245 G245 S 3 2996 0.10246 E246 E 2989 2997 99.73246 E246 G 3 2997 0.10246 E246 D/E 1 2997 0.03246 E246 Y 1 2997 0.03246 E246 Q 1 2997 0.03246 E246 A 1 2997 0.03246 E246 D 1 2997 0.03247 G247 G 2995 2997 99.93247 G247 R 2 2997 0.07248 A248 A 2991 2997 99.80248 A248 V 5 2997 0.17248 A248 T 1 2997 0.03248_1 _248_1 V 1 1 100.00249 V249 V 2989 2997 99.73249 V249 I/V 2 2997 0.07249 V249 I 2 2997 0.07249 V249 E 1 2997 0.03249 V249 L 1 2997 0.03249 V249 A 1 2997 0 03249 V249 A 1 2997 0.03249 V249 G 1 2997 0.03250 V250 V 2980 2996 99.47250 V250 I 7 2996 0.23250 V250 L 5 2996 0.17250 V250 Y 1 2996 0.03250 V250 E 1 2996 0.03250 V250 A 1 2996 0.03250 V250 P 1 2996 0.03251 I251 I 2922 2997 97.50251 I251 L 65 2997 2.17251 I251 I/L 5 2997 0.17251 I251 V 4 2997 0.13251 I251 T 1 2997 0.03252 Q252 Q 2985 2997 99.60252 Q252 E 5 2997 0.17252 Q252 K 4 2997 0.13252 Q252 R 2 2997 0.07252 Q252 T/K 1 2997 0.03253 D253 D 2943 2997 98.20253 D253 E 42 2997 1.40
Page 34 of 40
m2.7.2.4 Integrase Amino Acid Frequency TableCONFIDENTIAL

Position in Integrase Referenceb Variantc Variant Count Total Countd Percentage
253 D253 H 5 2997 0.17253 D253 D/E 2 2997 0.07253 D253 Y 2 2997 0.07253 D253 D/N 1 2997 0.03253 D253 H/Y 1 2997 0.03253 D253 G 1 2997 0.03254 N254 N 2841 2992 94.95254 N254 K 109 2992 3.64254 N254 S 12 2992 0.40254 N254 Q 12 2992 0.40254 N254 H 4 2992 0.13254 N254 D 3 2992 0.10254 N254 T 2 2992 0.07254 N254 N/I 2 2992 0.07254 N254 N/K 2 2992 0.07254 N254 G 2 2992 0.07254 N254 N/Y 1 2992 0.03254 N254 D/N 1 2992 0.03254 N254 S/N 1 2992 0.03255 S255 S 2620 2992 87.57255 S255 N 213 2992 7.12255 S255 G 131 2992 4.38255 S255 T 9 2992 0.30255 S255 K 8 2992 0 27255 S255 K 8 2992 0.27255 S255 D 3 2992 0.10255 S255 R 3 2992 0.10255 S255 D/N 1 2992 0.03255 S255 C 1 2992 0.03255 S255 S/G 1 2992 0.03255 S255 N/I 1 2992 0.03255 S255 S/N 1 2992 0.03255_1 _255_1 G 1 1 100.00256 D256 D 2354 2991 78.70256 D256 E 614 2991 20.53256 D256 G 13 2991 0.43256 D256 D/E 3 2991 0.10256 D256 A 3 2991 0.10256 D256 Y 1 2991 0.03256 D256 V 1 2991 0.03256 D256 D/N 1 2991 0.03256 D256 K/E 1 2991 0.03257 I257 I 2987 2996 99.70257 I257 V 5 2996 0.17257 I257 T 2 2996 0.07
Page 35 of 40
m2.7.2.4 Integrase Amino Acid Frequency TableCONFIDENTIAL
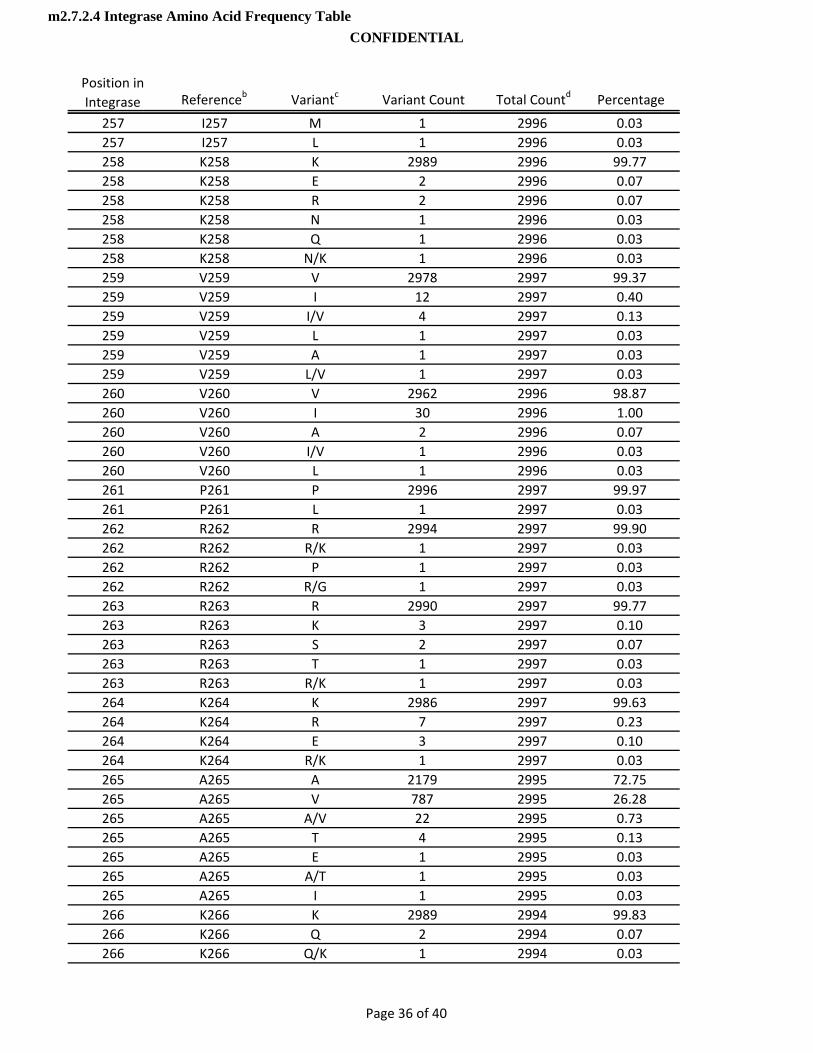
Position in Integrase Referenceb Variantc Variant Count Total Countd Percentage
257 I257 M 1 2996 0.03257 I257 L 1 2996 0.03258 K258 K 2989 2996 99.77258 K258 E 2 2996 0.07258 K258 R 2 2996 0.07258 K258 N 1 2996 0.03258 K258 Q 1 2996 0.03258 K258 N/K 1 2996 0.03259 V259 V 2978 2997 99.37259 V259 I 12 2997 0.40259 V259 I/V 4 2997 0.13259 V259 L 1 2997 0.03259 V259 A 1 2997 0.03259 V259 L/V 1 2997 0.03260 V260 V 2962 2996 98.87260 V260 I 30 2996 1.00260 V260 A 2 2996 0.07260 V260 I/V 1 2996 0.03260 V260 L 1 2996 0.03261 P261 P 2996 2997 99.97261 P261 L 1 2997 0.03262 R262 R 2994 2997 99.90262 R262 R/K 1 2997 0.03262 R262 P 1 2997 0 03262 R262 P 1 2997 0.03262 R262 R/G 1 2997 0.03263 R263 R 2990 2997 99.77263 R263 K 3 2997 0.10263 R263 S 2 2997 0.07263 R263 T 1 2997 0.03263 R263 R/K 1 2997 0.03264 K264 K 2986 2997 99.63264 K264 R 7 2997 0.23264 K264 E 3 2997 0.10264 K264 R/K 1 2997 0.03265 A265 A 2179 2995 72.75265 A265 V 787 2995 26.28265 A265 A/V 22 2995 0.73265 A265 T 4 2995 0.13265 A265 E 1 2995 0.03265 A265 A/T 1 2995 0.03265 A265 I 1 2995 0.03266 K266 K 2989 2994 99.83266 K266 Q 2 2994 0.07266 K266 Q/K 1 2994 0.03
Page 36 of 40
m2.7.2.4 Integrase Amino Acid Frequency TableCONFIDENTIAL

Position in Integrase Referenceb Variantc Variant Count Total Countd Percentage
266 K266 T/K 1 2994 0.03266 K266 R 1 2994 0.03267 I267 I 2988 2995 99.77267 I267 V 3 2995 0.10267 I267 T 2 2995 0.07267 I267 I/V 2 2995 0.07268 I268 I 2926 2993 97.76268 I268 L 52 2993 1.74268 I268 V 8 2993 0.27268 I268 I/L 5 2993 0.17268 I268 T 1 2993 0.03268 I268 P 1 2993 0.03269 R269 R 2309 2991 77.20269 R269 K 665 2991 22.23269 R269 R/K 15 2991 0.50269 R269 T 1 2991 0.03269 R269 G 1 2991 0.03270 D270 D 2884 2988 96.52270 D270 H 54 2988 1.81270 D270 N 24 2988 0.80270 D270 E 15 2988 0.50270 D270 G 6 2988 0.20270 D270 C 2 2988 0.07270 D270 D/E 1 2988 0 03270 D270 D/E 1 2988 0.03270 D270 D/N 1 2988 0.03270 D270 H/D 1 2988 0.03271 Y271 Y 2960 2967 99.76271 Y271 H 5 2967 0.17271 Y271 C 1 2967 0.03271 Y271 F/Y 1 2967 0.03272 G272 G 2969 2970 99.97272 G272 G/E 1 2970 0.03273 K273 K 2954 2970 99.46273 K273 Q 7 2970 0.24273 K273 N 2 2970 0.07273 K273 E 2 2970 0.07273 K273 R 2 2970 0.07273 K273 T 1 2970 0.03273 K273 Q/K 1 2970 0.03273 K273 I 1 2970 0.03274 Q274 Q 2967 2969 99.93274 Q274 P 1 2969 0.03274 Q274 R 1 2969 0.03275 M275 M 2927 2967 98.65
Page 37 of 40
m2.7.2.4 Integrase Amino Acid Frequency TableCONFIDENTIAL
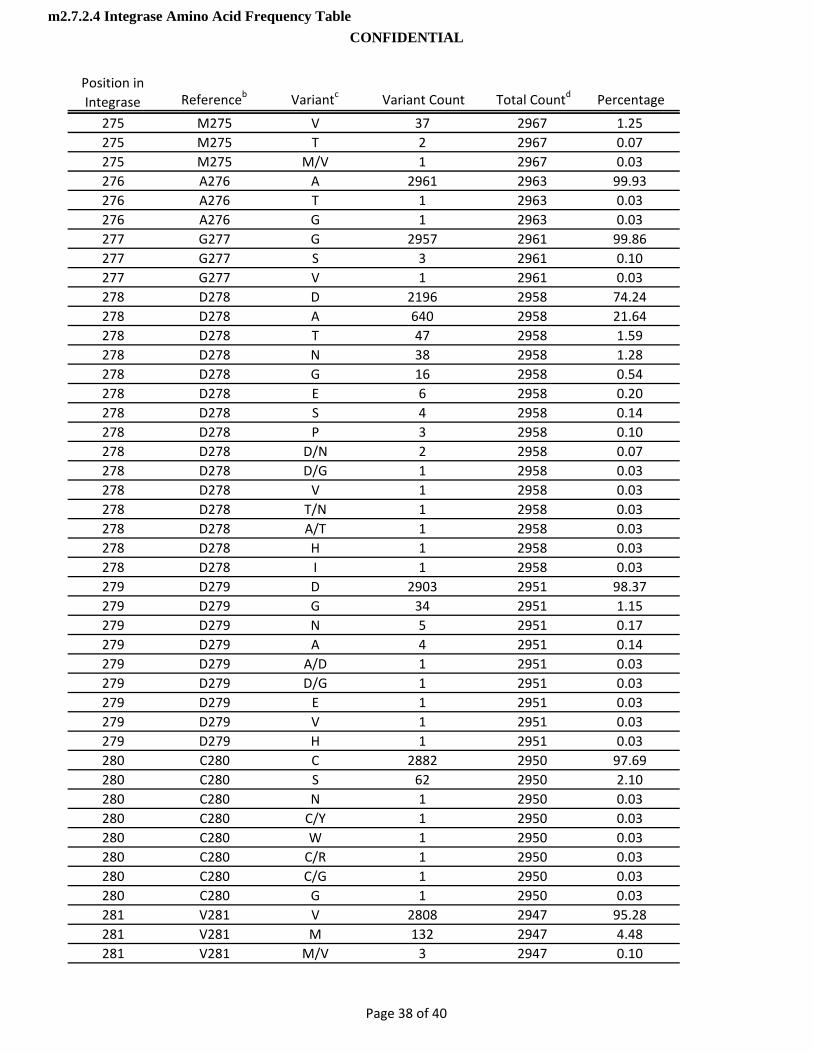
Position in Integrase Referenceb Variantc Variant Count Total Countd Percentage
275 M275 V 37 2967 1.25275 M275 T 2 2967 0.07275 M275 M/V 1 2967 0.03276 A276 A 2961 2963 99.93276 A276 T 1 2963 0.03276 A276 G 1 2963 0.03277 G277 G 2957 2961 99.86277 G277 S 3 2961 0.10277 G277 V 1 2961 0.03278 D278 D 2196 2958 74.24278 D278 A 640 2958 21.64278 D278 T 47 2958 1.59278 D278 N 38 2958 1.28278 D278 G 16 2958 0.54278 D278 E 6 2958 0.20278 D278 S 4 2958 0.14278 D278 P 3 2958 0.10278 D278 D/N 2 2958 0.07278 D278 D/G 1 2958 0.03278 D278 V 1 2958 0.03278 D278 T/N 1 2958 0.03278 D278 A/T 1 2958 0.03278 D278 H 1 2958 0.03278 D278 I 1 2958 0 03278 D278 I 1 2958 0.03279 D279 D 2903 2951 98.37279 D279 G 34 2951 1.15279 D279 N 5 2951 0.17279 D279 A 4 2951 0.14279 D279 A/D 1 2951 0.03279 D279 D/G 1 2951 0.03279 D279 E 1 2951 0.03279 D279 V 1 2951 0.03279 D279 H 1 2951 0.03280 C280 C 2882 2950 97.69280 C280 S 62 2950 2.10280 C280 N 1 2950 0.03280 C280 C/Y 1 2950 0.03280 C280 W 1 2950 0.03280 C280 C/R 1 2950 0.03280 C280 C/G 1 2950 0.03280 C280 G 1 2950 0.03281 V281 V 2808 2947 95.28281 V281 M 132 2947 4.48281 V281 M/V 3 2947 0.10
Page 38 of 40
m2.7.2.4 Integrase Amino Acid Frequency TableCONFIDENTIAL
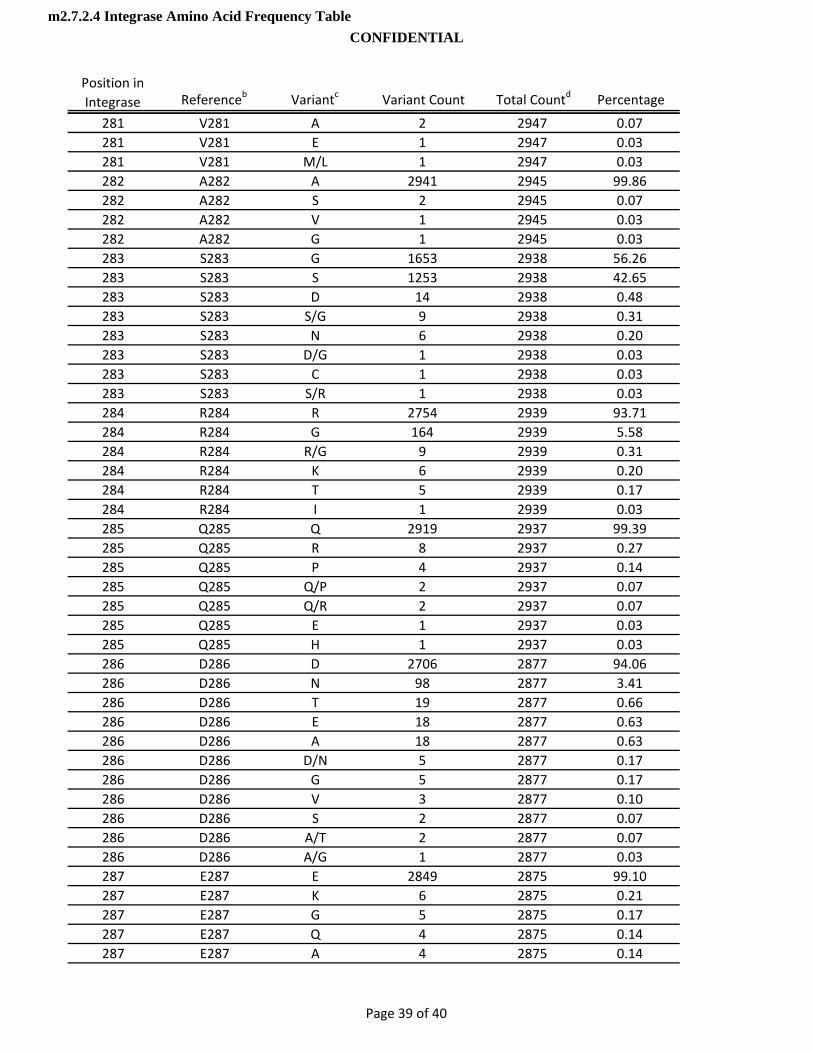
Position in Integrase Referenceb Variantc Variant Count Total Countd Percentage
281 V281 A 2 2947 0.07281 V281 E 1 2947 0.03281 V281 M/L 1 2947 0.03282 A282 A 2941 2945 99.86282 A282 S 2 2945 0.07282 A282 V 1 2945 0.03282 A282 G 1 2945 0.03283 S283 G 1653 2938 56.26283 S283 S 1253 2938 42.65283 S283 D 14 2938 0.48283 S283 S/G 9 2938 0.31283 S283 N 6 2938 0.20283 S283 D/G 1 2938 0.03283 S283 C 1 2938 0.03283 S283 S/R 1 2938 0.03284 R284 R 2754 2939 93.71284 R284 G 164 2939 5.58284 R284 R/G 9 2939 0.31284 R284 K 6 2939 0.20284 R284 T 5 2939 0.17284 R284 I 1 2939 0.03285 Q285 Q 2919 2937 99.39285 Q285 R 8 2937 0.27285 Q285 P 4 2937 0 14285 Q285 P 4 2937 0.14285 Q285 Q/P 2 2937 0.07285 Q285 Q/R 2 2937 0.07285 Q285 E 1 2937 0.03285 Q285 H 1 2937 0.03286 D286 D 2706 2877 94.06286 D286 N 98 2877 3.41286 D286 T 19 2877 0.66286 D286 E 18 2877 0.63286 D286 A 18 2877 0.63286 D286 D/N 5 2877 0.17286 D286 G 5 2877 0.17286 D286 V 3 2877 0.10286 D286 S 2 2877 0.07286 D286 A/T 2 2877 0.07286 D286 A/G 1 2877 0.03287 E287 E 2849 2875 99.10287 E287 K 6 2875 0.21287 E287 G 5 2875 0.17287 E287 Q 4 2875 0.14287 E287 A 4 2875 0.14
Page 39 of 40
m2.7.2.4 Integrase Amino Acid Frequency TableCONFIDENTIAL

Position in Integrase Referenceb Variantc Variant Count Total Countd Percentage
287 E287 D 3 2875 0.10287 E287 A/E 1 2875 0.03287 E287 T 1 2875 0.03287 E287 * 1 2875 0.03287 E287 K/E 1 2875 0.03288 D288 D 2650 2867 92.43288 D288 N 182 2867 6.35288 D288 S 22 2867 0.77288 D288 G 9 2867 0.31288 D288 D/N 2 2867 0.07288 D288 D/G 1 2867 0.03288 D288 I 1 2867 0.03a Los Alamos National Laboratory. 2010. HIV Sequence Database. www.hiv.lanl.gov
Accessed November 1, 2011
Stanford Resistance Database. http://hivdb.stanford.edu/b HIV HXB2 Genbank # K03455c Mixtures counted as unique variants. Variant * = stop codon.
Insertions are annotated as ref position underscore 1. Occur at 193_1 , 248_1, 255_1
d Total Count: The count of sequences at reference position. Sequences containing incomplete or missing codon sequence are not considered in count.
Page 40 of 40
m2.7.2.4 Integrase Amino Acid Frequency TableCONFIDENTIAL

CONFIDENTIALModule 2.7.3 Summary of Clinical Efficacy
1
Module 2.7.3
Summary of Clinical Efficacy
Copyright 2012 ViiV Healthcare and the GlaxoSmithKline group of companies. All rights reserved. Unauthorized copying or use of this information is prohibited.

CONFIDENTIALModule 2.7.3 Summary of Clinical Efficacy
2
TABLE OF CONTENTS
PAGE
ABBREVIATIONS ...........................................................................................................5
1. BACKGROUND AND OVERVIEW OF CLINICAL EFFICACY..................................81.1. HIV Infection .................................................................................................81.2. Current Therapies and its Unmet Clinical Need ............................................81.3. Summary of Dolutegravir Efficacy...............................................................101.4. Overview of the Dolutegravir Clinical Development Program ......................10
1.4.1. Overall Clinical Strategy and Objectives ......................................111.4.2. Dolutegravir Clinical Development Program.................................121.4.3. Organization of Data Presentations in the Summary of
Clinical Efficacy............................................................................161.5. Patient Population.......................................................................................171.6. Rationale for Dose Selection in Clinical Development.................................18
1.6.1. ART-Naive/-Experienced (INI-Naive) ...........................................181.6.2. ART-Experienced (INI-Resistant).................................................19
1.7. Design of Efficacy Studies ..........................................................................201.7.1. Pivotal Efficacy Studies................................................................20
1.7.1.1. Study ING113086.......................................................201.7.1.2. Study ING114467.......................................................211.7.1.3. Study ING111762.......................................................221.7.1.4. Study ING112574.......................................................24
1.7.2. Supportive Efficacy Studies .........................................................251.7.2.1. Study ING111521 (PoC).............................................261.7.2.2. Study ING112276.......................................................261.7.2.3. Study ING112961.......................................................27
1.8. Efficacy Endpoints ......................................................................................281.8.1. Primary Efficacy Endpoints ..........................................................291.8.2. Secondary Efficacy Endpoints .....................................................30
1.9. Statistical Considerations............................................................................311.9.1. Sample Size and Randomization .................................................31
1.9.1.1. Pivotal Efficacy Studies ..............................................311.9.1.1.1. Study ING113086 ...................................311.9.1.1.2. Study ING114467 ...................................321.9.1.1.3. Study ING111762 ...................................321.9.1.1.4. Study ING112574 ...................................33
1.9.1.2. Supportive Efficacy Studies ........................................331.9.1.2.1. Study ING111521 ...................................331.9.1.2.2. Study ING112276 ...................................331.9.1.2.3. Study ING112961 ...................................33
1.9.2. Analysis Populations....................................................................341.9.3. Statistical Methods.......................................................................361.9.4. Missing Data................................................................................39
1.9.4.1. Missing, Switch or Discontinuation = Failure (Snapshot)..................................................................39
1.9.4.2. Last Observation Carried Forward Discontinuation = Baseline (LOCFDB)........................39
1.9.4.3. Time to Loss of Virologic Response (TLOVR) ............391.9.5. Subgroup Analysis.......................................................................39

CONFIDENTIALModule 2.7.3 Summary of Clinical Efficacy
3
1.9.6. Sensitivity Analyses .....................................................................421.9.7. Antiviral Activity of DTG by Baseline Resistance in an INI-
resistant population in ING112574...............................................43
2. SUMMARY OF RESULTS OF INDIVIDUAL STUDIES...........................................432.1. Pivotal Efficacy Studies...............................................................................44
2.1.1. Study ING113086 ........................................................................442.1.2. Study ING114467 ........................................................................452.1.3. Study ING111762 ........................................................................452.1.4. Study ING112574 ........................................................................46
2.2. Supportive Efficacy Studies ........................................................................472.2.1. Study ING111521 ........................................................................472.2.2. Study ING112276 ........................................................................492.2.3. Study ING112961 ........................................................................51
3. COMPARISON AND ANALYSES OF RESULTS ACROSS STUDIES ...................533.1. Study Populations.......................................................................................54
3.1.1. ART-Naïve subjects.....................................................................543.1.2. ART-Experienced, INI-Naïve Subjects .........................................593.1.3. ART-Experienced, INI-Resistant Subjects....................................65
3.2. Comparison of Efficacy Results of all Studies .............................................703.2.1. ART-Naïve subjects.....................................................................70
3.2.1.1. Primary Efficacy Results.............................................703.2.1.2. Secondary Efficacy Results ........................................72
3.2.2. ART-Experienced, INI-Naïve Subjects .........................................773.2.2.1. Principal Efficacy Results ...........................................773.2.2.2. Secondary Efficacy Results ........................................79
3.2.3. Treatment Emergent Resistance in INI-Naïve Subjects (ART-Naïve and ART-Experienced Subjects) ..............................81
3.2.4. Studies in ART-Experienced, INI-Resistant Subjects ...................833.2.4.1. Primary Efficacy Results.............................................833.2.4.2. Secondary Efficacy Results ........................................863.2.4.3. Treatment Emergent Resistance ................................88
3.3. Comparison of Results in Sub-Populations .................................................903.3.1. ART-Naïve Subjects ....................................................................90
3.3.1.1. Primary Efficacy by Age, Gender and Race................903.3.1.2. Primary Efficacy by Stratification Factors
(Baseline HIV-1 RNA/CD4+ cell count, Background NNRTI) ...................................................91
3.3.2. ART-Experienced, INI-Naïve Subjects .........................................943.3.2.1. Principal Efficacy by Age, Gender and Race ..............943.3.2.2. Plasma HIV-1 RNA <50 c/mL at Week 24 by
Strata Related to Randomization ................................953.3.2.3. Plasma HIV-1 RNA <50 c/mL at Week 24 by
Selected Baseline Background Regimen and Resistance Subgroups ...............................................96
3.3.3. Studies in ART-Experienced, INI-resistant Subjects ....................973.3.3.1. Functional Monotherapy Phase ..................................973.3.3.2. Optimized Phase ......................................................1003.3.3.3. Antiviral Activity of DTG by Baseline
Resistance in INI-resistant Subjects in ING112574...............................................................103

CONFIDENTIALModule 2.7.3 Summary of Clinical Efficacy
4
3.3.4. Virologic Response Rates in Historical Studies..........................104
4. ANALYSIS OF CLINICAL INFORMATION RELEVANT TO DOSING RECOMMENDATIONS ........................................................................................1064.1. Dose Selection for ART-Naïve Adult Subjects ..........................................106
4.1.1. Phase IIb Study ING112276 ......................................................1064.1.2. Pivotal Phase III ART-Naive Studies..........................................1064.1.3. ART-Naïve Pharmacokinetic and
Pharmacokinetic/Pharmacodynamic Analysis ............................1074.1.3.1. Supportive Study ING111521 ...................................108
4.2. Dose Selection for ART-Experienced, INI-Naive Adult Subjects ...............1084.2.1. Principle of Dose Selection ........................................................108
4.2.1.1. Impact of Background Therapy and Predicted Durability of DTG on Selected Dose .........................108
4.2.2. Pivotal Phase III Study ING111762 (ART-Experienced, INI-Naive) ..................................................................................1094.2.2.1. Comparison to Historical Studies..............................1094.2.2.2. ING111762 Pharmacokinetics and
Pharmacokinetics/ Pharmacodynamics ....................1104.3. Dose Selection for ART-Experienced, INI-Resistant Adult Subjects..........111
4.3.1. Pivotal Phase III Study ING112574............................................1114.3.1.1. Correlation between Baseline Factors and
Efficacy.....................................................................1114.3.1.2. Comparison to Historical Studies..............................1124.3.1.3. Pharmacokinetics .....................................................112
4.3.2. Supportive Phase II Study ING112961 ......................................1134.4. Dose Selection for Adolescent Subjects ...................................................114
5. PERSISTENCE OF EFFICACY AND/OR TOLERANCE EFFECTS .....................1145.1. Treatment-Naïve Subjects ........................................................................1145.2. Treatment-Experienced, INI-Naïve Subjects .............................................1165.3. Treatment-Experienced, INI-Resistant Subjects........................................116
6. EFFICACY SUMMARY ........................................................................................1176.1. Efficacy Conclusions.................................................................................118
7. REFERENCES.....................................................................................................119
8. APPENDIX...........................................................................................................123
CONFIDENTIALModule 2.7.3 Summary of Clinical Efficacy
5
ABBREVIATIONS
3TC lamivudineABC abacavirAE Adverse eventAIDS Acquired immunodeficiency syndromeALT Alanine aminotransferaseAST Aspartate aminotransferaseART Antiretroviral therapyARV AntiretroviralAUC Area under the curveBID Twice dailyBL BaselineC0 Pre-dose concentrationC0_avg Average of concentrations at time 0C Concentration at the end of the dosing periodc/mL copies per milliliterCavg Average of concentrationsCDC Centers for Disease Control and PreventionCFB Change from BaselineCHMP Committee for Medical Products for Human UseCI Confidence IntervalCMH Cochran-Mantel-HaenszelCOBI cobicistatCPSR Clinical Pharmacology Study ReportCSR Clinical Study ReportCYP Cytochrome P450DHHS Department of Health and Human ServicesDRV darunavirDTG dolutegravir, S/GSK1349572EACS European AIDS Clinical SocietyEFV efavirenzEMA European Medicines AgencyEmax Maximum effectEPAR European Public Assessment ReportETR etravirineEVG elvitegravirFC Fold changeFDA (US) Food and Drug AdministrationFDC Fixed dose combinationFPV fosamprenavirFTC emtricitabineGCP Good Clinical PracticeGSK GlaxoSmithKlineGSS Genotypic susceptibility scoreHBsAG Hepatitis B Surface AntigenHBV Hepatitis B VirusHCV Hepatitis C Virus

CONFIDENTIALModule 2.7.3 Summary of Clinical Efficacy
6
HIV Human Immunodeficiency VirusHIV-1 Human Immunodeficiency Virus Type 1HIV-2 Human Immunodeficiency Virus Type 2IAS International AIDS SocietyIC50 Half-maximal inhibitory concentrationICH International Conference on Harmonisation of Technical
Requirements for Registration of Pharmaceuticals for Human Use
IN IntegraseIND Investigational New DrugINI Integrase inhibitorIP Investigational productIQR Interquartile rangeITT-E Intent-to-Treat ExposedLOCFDB Last observation carried forward (discontinuation equals
Baseline)MAA Marketing Authorization Applicationmg MilligrammITT-E Modified Intent-to-Treat Exposedmm3 Cubic millimeterMDF Missing or Discontinuation = FailureMSDF Missing, Switch or Discontinuation = FailureNDA New Drug ApplicationNDS New Drug Submissionng NanogramNI Non-inferiorityNRTI Nucleoside reverse transcriptase inhibitorNNRTI Non-nucleoside reverse transcriptase inhibitorOBR Optimized background regimenOSS Overall susceptibility scorePDVF Protocol defined virologic failurePI Protease inhibitorPIQ Phenotypic inhibitory quotientPIQ_C0 Phenotypic inhibitory quotient for predose concentrationPIQ_Cavg Phenotypic inhibitory quotient for average concentrationPK PharmacokineticPK/PD Pharmacokinetic/pharmacodynamicPML Progressive multifocal leucoencephalopathyPP Per-protocol PSS Phenotypic susceptibility scoreRAL raltegravirRAM Resistance associated mutationRAP Reporting and analysis planRNA Ribonucleic acidRTV ritonavirSPC Summary of Product CharacteristicsTLOVR Time to Loss of Virologic ResponseTDF tenofovir disoproxil fumarate
CONFIDENTIALModule 2.7.3 Summary of Clinical Efficacy
7
TPV tipranavirUNAIDS Joint United Nations Programme on HIV/AIDSUS United StatesVL Viral loadVO Virological outcome by Baseline genotype or phenotypeWMA World Medical AssociationWT Wild type
Trademark Information
Trademarks of ViiV Healthcare Trademarks not owned by ViiV Healthcare
COMBIVIR AtriplaEPZICOM Truvada

CONFIDENTIALModule 2.7.3 Summary of Clinical Efficacy
8
1. BACKGROUND AND OVERVIEW OF CLINICAL EFFICACY
1.1. HIV Infection
An estimated 34.2 million adults and children worldwide, were living with Human Immunodeficiency Virus (HIV)/Acquired Immunodeficiency Syndrome (AIDS) in 2011 [UNAIDS, 2012a].
In 2011, the global adult (15 to 49 years) HIV prevalence rate was 0.8% [UNAIDS,2012b]. During that year, 2.5 million people were newly infected with HIV, and there were 1.7 million deaths due to HIV/AIDS. Of newly infected people, an estimated 1.2 million were women and girls, and 330,000 were children. As well, 3.4 million children younger than 15 years were living with HIV in 2011 [UNAIDS, 2012a]. In 2009, an estimated 370,000 children contracted HIV during the perinatal and breastfeeding period. Overall, the epidemic appears to have stabilized in most regions, although prevalence continues to increase in Eastern Europe and Central Asia and in other parts of Asia due to a high rate of new HIV infections [UNAIDS, 2010]. In 2011, Sub-Saharan Africa remained the most heavily affected region, accounting for 68% (1.7 million) of all new HIV infections among adults and children [UNAIDS, 2012b].
1.2. Current Therapies and its Unmet Clinical Need
Combination antiviral therapy with HIV type-1 (HIV-1) protease and reverse transcriptase inhibitors has significantly reduced AIDS-related morbidity and mortality. However, emerging multi-class drug-resistant HIV strains and long-term toxicities warrant development of new classes of antiretroviral therapies. Integrase inhibitors (INIs) are a newer class of antiretroviral drugs designed to block the action of the integrase (IN) viral enzyme, which catalyzes two key steps in the HIV life cycle and is responsible for insertion of the viral genome into the deoxyribonucleic acid (DNA) of the host cell. Since genome integration is a vital step in retroviral replication, it is an attractive target for HIV therapy.
Dolutegravir (DTG, GSK1349572) is an INI owned by ViiV Healthcare, which isworking with GlaxoSmithKline to develop the asset.
Raltegravir, the first marketed INI, and elvitegravir (EVG), which recently gained United States (US) Food and Drug Administration (FDA) approval (in August 2012 in a combination product), have demonstrated good antiviral activity in clinical trials, confirming the INI class as a new option for constructing effective HIV-1 treatment regimens. In the STARTMRK study, raltegravir (RAL) demonstrated excellent antiviral activity as first-line treatment and was shown to be non-inferior to an efavirenz (EFV)-containing standard of care regimen [Lennox, 2010]. In this trial, a similar proportion of subjects randomized to RAL versus EFV (both in combination with tenofovir disoproxil fumarate/emtricitabine [TDF/FTC]) achieved undetectable HIV-1 ribonucleic acid (RNA) (<50 copies/milliliter [c/mL]) at Week 48 (86% vs. 82%) and Week 96 (81% vs. 79%). Additionally, the time to achieve viral suppression was shorter for subjects on RAL than on EFV (log rank test P<0.001).
CONFIDENTIALModule 2.7.3 Summary of Clinical Efficacy
9
Similarly, in the GS-US-236-0102 study, EVG co-formulated with the cytochrome P450(CYP) 3A4 inhibitor cobicistat (COBI), TDF, and FTC (now approved in the US as Stribild), was shown to be non-inferior to the co-formulated standard of care regimen EFV/TDF/FTC as a first-line treatment, with 87.6% versus 84.1% of patients, respectively, achieving <50 c/mL HIV RNA at Week 48 [Sax, 2012].
Integrase inhibitors have also shown potent antiviral activity in treatment-experienced patient populations. In the BENCHMRK study, patients with three-class antiretroviral resistance (naïve to INIs) received RAL or placebo plus optimized background therapy; 62% of RAL subjects (versus 33% of placebo subjects) had HIV RNA <50 c/mL at Week 48 [Steigbigel, 2008]. In Study 145, a study in treatment-experienced subjects with at least two-class resistance, but naïve to INIs, EVG once daily was non-inferior to RAL twice daily (BID), each administered with a background regimen that included a ritonavir-boosted protease inhibitor and a second antiretroviral agent. At Week 48 of Study 145, 59% of the EVG group versus 58% of the RAL group achieved virologic response (<50 c/mL) [Molina, 2012].
In addition to providing good virologic suppression in treatment-naïve and treatment-experienced patients, the INIs have been well-tolerated in clinical trials. InSTARTMRK, there were fewer drug-related adverse events (AEs) reported for the RAL group compared with the EFV group, and fewer subjects randomized to RAL discontinued from the study due to adverse events. In GS-US-236-0102, adverse events were similar between the EVG and EFV groups, with the exception of nausea (significantly higher in the EVG group), and dizziness, abnormal dreams, and rash (significantly higher in the EFV group); similar numbers of subjects in the two groups discontinued treatment because of adverse events (4% versus 5%).
While these trials highlight the potent antiviral efficacy and promise of better long-term tolerability with INI-based therapy, clinical resistance to both RAL and EVG has been reported from Phase II studies in treatment-experienced subjects [Hazuda, 2007; McColl,2007], and also from Phase III studies in both treatment-experienced [Cooper, 2008; Molina, 2012] and treatment-naïve subjects [Lennox, 2010; Sax, 2012; DeJesus, 2012]. In Study 145, comparing EVG- versus RAL-based therapy in treatment-experienced subjects, among subjects who failed therapy, 16/60 (27%) and 15/72 (21%) of patientswho had integrase genotype data available at the time of virologic failure developed INI resistance mutations. In addition, phenotypic cross-resistance to both drugs was typical, preventing sequencing from one drug to the other [Molina, 2012]. Therefore, the development of new INIs with different resistance profiles is desirable, and in the case of many treatment-experienced patients with clinical resistance to RAL and EVG, is essential for providing HIV-infected individuals an option for constructing an effective antiretroviral regimen.
Along with a low barrier to resistance for RAL and EVG, there are other disadvantages for these two INIs compared to DTG. RAL requires twice daily (BID) dosing and is currently not available in a fixed dose combination regimen. EVG requires co-administration with a pharmacokinetic booster, such as ritonavir or cobicistat [German, 2010], and therefore, has the potential for clinically-significant drug-drug interactions with drugs that depend on CYP3A4 for clearance. Additionally, EVG-containing

CONFIDENTIALModule 2.7.3 Summary of Clinical Efficacy
10
regimens had higher rates of gastrointestinal (GI) AEs than a RAL-containing regimen and Atripla in treatment-experienced and treatment-naïve patients, respectively [Molina,2012; Sax, 2012]; Stribild is also not recommended for patients with creatinine clearance under 70 mL/min.
Finally, both ritonavir and cobicistat (one of which is required in conjunction with EVG; cobicistat is a component of the fixed dose combination tablet that contains EVG/cobicistat/TDF/FTC) boost TDF concentrations, which may increase TDF proximal tubular toxicity [FDA, 2012].
Dolutegravir is a potent, low nanomolar inhibitor of HIV integrase, which demonstrates the excellent antiviral activity and tolerability demonstrated for the INI class, and also offers once-daily dosing without the requirement for pharmacokinetics boosters. Based on in vitro and clinical data, DTG has the potential for a higher barrier to resistance. Finally, most HIV isolates with resistance to RAL and EVG remain susceptible to DTG, making DTG an important option for many treatment-experienced patients with multi-class drug resistance.
1.3. Summary of Dolutegravir Efficacy
Data presented in this Summary of Clinical Efficacy (m2.7.3) will demonstrate that:
DTG 50 milligrams (mg) once daily is effective for the treatment of HIV-infection in combination with other antiretroviral therapy (ART) in treatment-naïve adults;
DTG 50 mg once daily is effective for the treatment of HIV-infection in combination with other antiretroviral therapy in INI-naïve, treatment-experienced adults;
DTG 50 mg twice daily is effective for the treatment HIV-infection in combination with other antiretroviral therapy in INI-resistant (current and historical) treatment-experienced adults (and more effective than DTG 50 mg once daily in this population);
DTG-based regimens had a higher barrier to resistance in INI-naïve patients, as demonstrated in ING111762 where significantly fewer virologic failures with INI resistance were observed when compared with RAL. Data from ING113086 and ING114467 were also supportive, as no subjects on the DTG regimen developed resistance to either the INI or the background NRTIs, whereas resistance to both the third agent and the background NRTIs was observed in both the RAL and EFV-based comparator arms;
DTG-containing regimens across all patient populations evaluated resulted in increases in CD4+ cell counts;
DTG was efficacious across a broad range of Clades and against both HIV-1 and HIV type 2 (HIV-2) (m2.7.2.4).
1.4. Overview of the Dolutegravir Clinical Development Program
The clinical program investigating DTG involves: 31 Phase I studies (1 remains ongoing), 4 Phase IIa/b studies (1 completed Phase IIa study, 3 ongoing), and 7 ongoing Phase III/IIIb studies. In addition, there is an active compassionate use program designed

CONFIDENTIALModule 2.7.3 Summary of Clinical Efficacy
11
for patients who are unable to participate in Phase III studies, who have documented RAL or EVG resistance, limited treatment options and who require DTG to construct a viable antiretroviral (ARV) regimen for therapy. A description of all clinical efficacy and safety studies in the DTG clinical program is provided in Appendix Table 1.
Descriptions of all the clinical studies in subjects with HIV that support the Summary of Efficacy data are presented in Table 1. This New Drug Application (NDA)/Marketing Authorization Application (MAA)/New Drug Submission (NDS) for the DTG submission includes long-term clinical safety data for approximately 1400 subjects receiving DTG for 24 weeks or longer.
The clinical development program for DTG has been conducted in accordance with available regulatory guidance on the clinical investigation of medicinal products in the treatment of HIV-1 infection [EMA, 2009; FDA, 2002] and has further benefited from advice received from Regulators in both the United States and Europe, where feedback on study design features was obtained on the primary efficacy studies.
1.4.1. Overall Clinical Strategy and Objectives
The Sponsor’s strategy for the development of DTG is to file for a NDA/MAA/NDS by demonstrating improvements over the first marketed INI RAL, and the preferred fixed dose combination single tablet regimen Atripla (EFV/TDF/FTC). The clinical program for DTG was also designed in order to demonstrate its activity against HIV that is resistant to either RAL or EVG.
The clinical development program has been designed to achieve a broad indication for the treatment of HIV-1 infection in combination with other antiretroviral agents in adults and children over 12 years of age.
To support this proposed indication, the submission includes a Clinical Pharmacology package describing the pharmacokinetics and the pharmacokinetic/pharmacodynamic (PK/PD) relationship of DTG across a broad range of studies in both healthy volunteersand HIV-infected subjects. This package is described in detail in module 2.7.2.
Early Phase I and IIa studies were designed to obtain initial pharmacokinetic, safety and tolerability information, and define the dose regimen to be utilized in the dose ranging and pivotal efficacy studies in patients with HIV. Phase I studies utilized either an oral tablet or oral suspension formulation and the Phase II and Phase III studies utilized an oral tablet formulation.
The Phase II package (Studies ING111521, ING112276 and ING112961) includes initial efficacy data as well as enabling dose-ranging data and longer-term efficacy and safety data in antiretroviral therapy-naive, -experienced and integrase inhibitor-resistantsubjects. In these supportive efficacy studies, patients were treated with doses of dolutegravir from 2 mg daily up to 100 mg daily, administered via once daily or BID dosing.
The Phase III Studies ING113086, ING111762, ING114467, and ING112574 assessed DTG across a broad range of treatment experience in HIV-infected patients and support
CONFIDENTIALModule 2.7.3 Summary of Clinical Efficacy
12
an unrestricted indication for the treatment of HIV-infected patients. All pivotal efficacy studies with more than one arm were international, multi-center, randomized, double-blind studies and each have the characteristics of “adequate and well-controlled clinical trials” as described in Title 21 of the US Code of Federal Regulations, Section 314.126and ICH Topic E8, General Considerations for Clinical Trials. Study ING112574 is a single arm study, reflecting ethical difficulties in randomizing subjects with multi-drug resistance and INI resistance to a control arm.
ING112578 (P1093) is a Phase I/II, multi-centre, open-label study assessing the PK, safety, tolerability and antiviral activity of DTG in HIV-1 infected infants, children and adolescents (6 weeks to <18 years). Cohort I, ages 12 to <18 years, is fully enrolled and Cohort II, ages 6 to <12 years, is currently enrolling. The protocol is in the process of being amended to lower the inclusion age to 4 weeks. The final amended protocol will not be available before the submission.
1.4.2. Dolutegravir Clinical Development Program
The pivotal efficacy populations included 2553 subjects from:
1655 ART-naïve subjects from ING113086 (n=822) and ING114467 (n=833) with data at least to 48 weeks,
715 ART-experienced, INI-naïve subjects from ING111762 with data at least to 24 weeks,
183 ART-experienced, INI-resistant subjects from ING112574 with data at least to day 8 and 114/183 subjects with data at least to 24 weeks.
Studies ING113086, ING111762, ING114467, and ING112574 are ongoing and will continue pending the outcome of regulatory evaluation of the marketing applications.
Longer term efficacy data are available from Studies ING112276 (150 ART-naïve subjects with data up to 96 weeks) and ING112961 (183 ART-experienced, INI-resistant subjects with Cohort I 96 weeks, Cohort II 48 weeks).
Furthermore, clinical pharmacology provided PK data to support the Phase III efficacy studies.
The following is a list of other ongoing studies that will not contribute to this summary of efficacy with a rationale for their exclusion:
ING112578 (P1093): efficacy was a secondary endpoint;
ING116070 (CSF study) was conducted in a limited number of subjects and will include a limited dataset (i.e. Week 2) for this submission;
ING114915 (FLAMINGO) and ING116529 (VIKING-4): at the time of data cut off for this ISE, studies ING114915 and ING116529 will not have reached a planned interim or primary endpoint analysis.
ING114916 (Expanded Access Program) and ING115502 (Named Patient Program)are only collecting safety data.

CONFIDENTIALModule 2.7.3 Summary of Clinical Efficacy
13
Table 1 Summary of Studies Supporting Clinical Efficacy of Dolutegravir in the Treatment of HIV-1 Infection
Study Number Phase Study Design Primary Objectives Durationa Regimens
Number of Patientsb
Pivotal Efficacy StudiesING113086(SPRING-2)
III Multicenter randomized, double blind, double-dummy, active-controlled, parallel group, fully-powered non-inferiority study
To assess safety and efficacy of DTG 50 mg once dailycompared to RAL 400 mg BID both administered with fixed-dose dual NRTI therapy
48 weeks DTG 50 mg once daily; oral tablet orRAL 400 mg once daily; oral tablet+ abacavir (ABC)/lamivudine (3TC) 600 mg/ 300 mg once daily; oral tabletor+ TDF/ FTC 300 mg/ 200 mg once daily; oral tablet
DTG:413 Randomized364 Ongoing0 Completed
RAL:414 Randomized355 Ongoing0 Completed
ING114467(SINGLE)
III Randomized, double-blind, double-dummy, active-controlled, multicenter, parallel group, fully-powered non-inferiority study
To assess safety and efficacy of DTG plus ABC/3TC fixed-dose combination therapy administered once daily compared to Atripla
48 weeks DTG 50 mg once daily; oral tablet + ABC/3TC 600/300 mg once daily; oral tablet
EFV/TDF/FTC 600/200/300 mg once daily; oral tablet
DTG + ABC/3TC:422 Randomized363 Ongoing0 Completed
EFV/TDF/FTC:422 Randomized363 Ongoing0 Completed
ING111762(SAILING)
III Multicenter randomized, double-blind, active-controlled, parallel group, non-inferiority study
To evaluate safety and efficacy of DTG 50 mg once daily vs. RAL 400 mg BID, both administered with an investigator-selected background regimen
24 weeks DTG 50 mg once daily; oral tabletRAL 400 mg BID; oral tablet
+ Investigator-selected background regimen
DTG354 Randomized305 Ongoing1 Completedc
RAL361 Randomized189 Ongoing111 Completed

CONFIDENTIALModule 2.7.3 Summary of Clinical Efficacy
14
Study Number Phase Study Design Primary Objectives Durationa Regimens
Number of Patientsb
ING112574(VIKING-3)
III Multicenter, open-label, single arm
To assess the antiviral activity of DTG administered with failing background therapy to Day 8 and thereafter with optimized background ART
24 weeks DTG 50 mg BID; oral tablet DTG 183 Enrolled155 Ongoing0 Completed
Supportive Efficacy StudiesING111521 IIa Dose-ranging, 10-day,
repeat dose, placebo-controlled monotherapy study
To assess the safety, tolerability and efficacy of repeat dose DTG
10 days DTG 2, 10, 50 mg once daily for 10 days; oral tablet; fasted
35 (including 7 placebo) Randomized35 Completed

CONFIDENTIALModule 2.7.3 Summary of Clinical Efficacy
15
Study Number Phase Study Design Primary Objectives Durationa Regimens
Number of Patientsb
ING112276(SPRING-1)
IIb Randomized, multicenter, parallel group, dose-ranging
To select a once daily oral dose of DTG administered with either ABC/3TC or TDF/FTC and to evaluate antiviral activity, safety and PK over time
96 weeks DTG 10 mg once daily; oral tabletDTG 25 mg once daily; oral tabletDTG 50 mg once daily; oral tabletEFV 600 mg once daily; oral tablet
+ ABC/3TC 600 mg/ 300 mg once daily; oral tablet
or
+ TDF/ FTC 300 mg/ 200 mg once daily; oral tablet [At the Week 96 visit, all DTG subjects were switched to the selected dose of 50 mg once daily]
DTG 10 mg53 Randomized47 Ongoingd
DTG 25 mg51 Randomized45 Ongoingd
DTG 50 mg51 Randomized46 Ongoing
EFV50 Randomized41 Completed
ING112961(VIKING)
IIb Multicenter, open-label, single arm, sequential cohort, pilot study
To assess the antiviral activity of DTG containing regimen
Cohort I 96 weeksCohort II 48 weeks
DTG 50 mg once daily; oral tabletDTG 50 mg BID; oral tablet
DTG 50 mg once daily27 Enrolled13 Ongoing0 Completed
DTG 50 mg BID24 Enrolled19 Ongoing0 Completed
a. Weeks for evaluation of efficacy reported in this ISEb. Number of subjects “Ongoing” as of data cut off in respective Clinical Study Reportsc. One subject who completed the DTG decided they did not want to participate in the open label phase. d. DTG 10 mg and 25 mg subjects are currently ongoing on DTG 50 mg.

CONFIDENTIALModule 2.7.3 Summary of Clinical Efficacy
16
Estimated timings for the completion of study reports following submission are presented in Table 2.
Table 2 Data Availability for Ongoing Studies
Study Identifier
Length of StudyData Available at Initial
SubmissionEstimated Completion
of Study Report
ING112578 48 weeks, with up to 3-year follow-up
10 subjects (Stage 1) from Cohort 1 through 24 weeks
/ Week 24 Analysis (Cohort 1, Stages 1 & 2)
ING116070 96 weeks (primary endpoint at Week 16)
All subjects through 2 weeks / Week 16 Analysis
ING113086 96 weeks All subjects through 48 weeks / Week 96 Analysis
ING112574 24 and 48 weeksAll subjects through Day 8, 114/183 subjects through 24 weeks
/ Week 24 (all)/ Week 48 (first 114 subjects) Analysis
ING116529 7 days double-blind phase and 48 weeks open-label phase.
No efficacy data / Day 8 Analysis
ING111762 48 weeks All subjects through 24 weeks / Week 48 AnalysisING114915 96 weeks No efficacy data / Week 48 AnalysisING114467 96 weeks All subjects through 48 weeks / Week 96 Analysis
1.4.3. Organization of Data Presentations in the Summary of Clinical Efficacy
In this summary there are references to four types of presentations for tables and figures:
in-text tables and figures;
appendix tables;
statistical source tables and figures from individual clinical study reports (CSR).
The original electronic format, location and reference format for these various presentations are summarized in Table 3.
Table 3 Table and Figure Types and Descriptions
Table/Figure Type
Tool Used to Generate Table
Location How Referenced
In-text WORD In body of summary document Consecutive integers (e.g., Table 1, Table 2, Figure 1, Figure 2 )
Appendix WORD Precedes SAS Tables, Figures & Listings in appendix of
summary document
Consecutive integers (e.g., Appendix Table 1, Appendix
Table 2…)Statistical Source Tables
WORD Individual CSRs in m5 Clinical Study Report number followed by statistical source tables (e.g., CSR
ING113086, Table 6.1).
In this summary, the efficacy data from pivotal and supportive studies were not integrated due to significant variations in study designs and comparator arms (Section 1.7);

CONFIDENTIALModule 2.7.3 Summary of Clinical Efficacy
17
therefore, efficacy data are presented in a side-by-side format for comparative purposes(Section 3). Studies are organized as follows:
ART-Naive Population (ING113086, ING114467):
The data from these two Phase III studies provide supportive evidence of the efficacy of DTG for the primary and secondary endpoints in an ART-naive population.These studies use two different comparators, RAL and Atripla, respectively; therefore, the data from these studies were not integrated.
ART-Experienced, INI-Naive Population (ING111762):
Study ING112762 provides supportive evidence of the efficacy of DTG in an ART-experienced population.
ART-Experienced, INI-Resistant Population (ING112574, ING112961).
Similarities in study design for the Phase III study ING112574 and the Phase IIb study ING112961 Cohort II (DTG 50 mg BID) facilitated the presentation of data side by side. The data from these two studies provide supportive evidence of the efficacy of DTG for the primary and secondary endpoints in an INI-resistant population. Data from Cohort I DTG 50 mg once daily are not presented side by side with data from DTG 50 mg BID, as the 50 mg once daily dose was not selected for Phase III assessment in this patient population.
The data from these studies provide supportive evidence of the efficacy of DTG for the primary endpoints in ART-naive, ART-experienced (INI-naive) and ART-experienced (INI-resistant) populations. The data also provide supportive evidence of the efficacy of DTG on secondary endpoints that were observed in the individual studies (Section 2) and for specific subgroups. Side-by-side presentation of ART-naive, ART-experienced (INI-naive) and ART-experienced (INI-resistant) studies can be found in Section 3.
1.5. Patient Population
The studies in adults supporting this submission recruited HIV-1 infected subjects 18years who were able to provide written informed consent. Women of child-bearing potential were eligible for enrolment if using a reliable method of contraception. Subjects were excluded on the basis of medical history (e.g. active Centers for Disease Control and Prevention [CDC] Category C disease with certain exceptions, moderate to severe hepatic impairment, gastrointestinal bleeding, allergy to study drugs, history of malignancies), concomitant or recent medical therapy (e.g. HIV-1 vaccines, treatments with activity against HIV-1 that are not licensed for that purpose, radiation therapy, immunomodulators, cytotoxic chemotherapeutic agents or recent use of experimental drugs) or screening laboratory values (e.g. any verified Grade 4 lab abnormalities, or liver chemistries above specified thresholds). The specific criteria during each phase of development reflected the data on dolutegravir that were available at that time and are therefore slightly different for (e.g.) the Phase IIb studies compared to the Phase IIIstudies. Notwithstanding the minimum inclusion and exclusion criteria defined in each protocol, investigators were also required to follow any existing country specific guidelines when making decisions about subjects who are eligible for study participation.
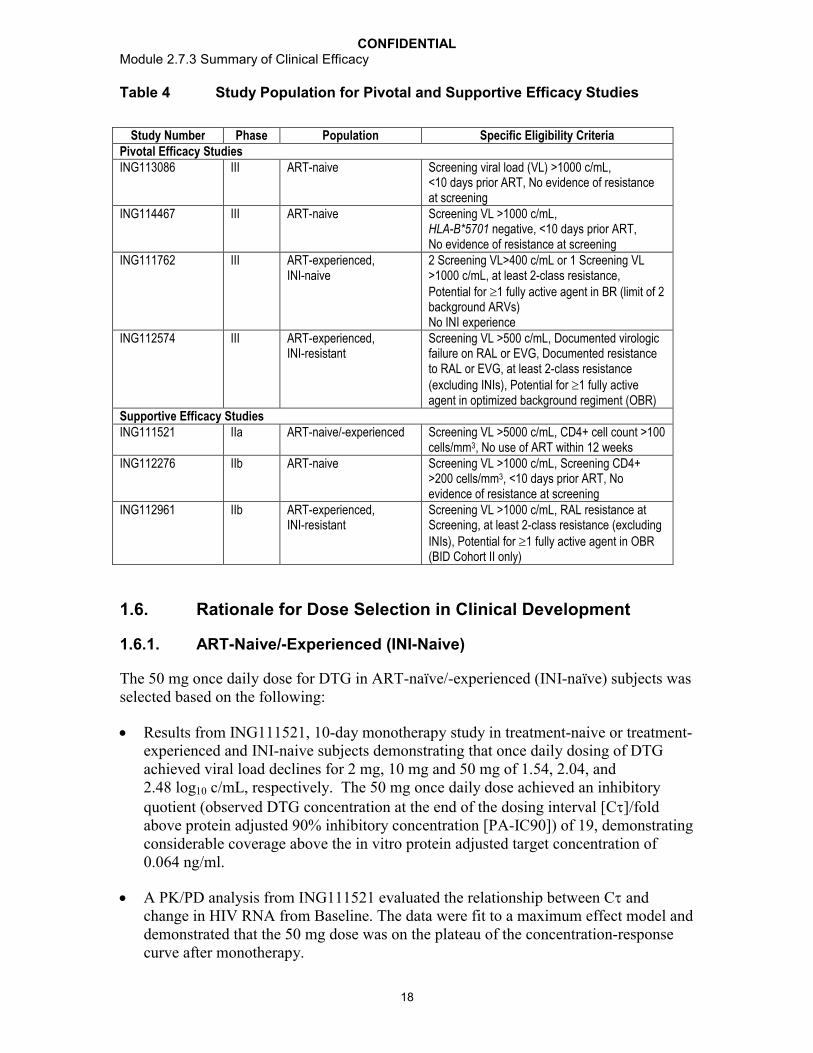
CONFIDENTIALModule 2.7.3 Summary of Clinical Efficacy
18
Table 4 Study Population for Pivotal and Supportive Efficacy Studies
Study Number Phase Population Specific Eligibility CriteriaPivotal Efficacy StudiesING113086 III ART-naive Screening viral load (VL) >1000 c/mL,
<10 days prior ART, No evidence of resistance at screening
ING114467 III ART-naive Screening VL >1000 c/mL,HLA-B*5701 negative, <10 days prior ART,No evidence of resistance at screening
ING111762 III ART-experienced, INI-naive
2 Screening VL>400 c/mL or 1 Screening VL >1000 c/mL, at least 2-class resistance,Potential for 1 fully active agent in BR (limit of 2 background ARVs)No INI experience
ING112574 III ART-experienced,INI-resistant
Screening VL >500 c/mL, Documented virologic failure on RAL or EVG, Documented resistance to RAL or EVG, at least 2-class resistance (excluding INIs), Potential for 1 fully active agent in optimized background regiment (OBR)
Supportive Efficacy StudiesING111521 IIa ART-naive/-experienced Screening VL >5000 c/mL, CD4+ cell count >100
cells/mm3, No use of ART within 12 weeksING112276 IIb ART-naive Screening VL >1000 c/mL, Screening CD4+
>200 cells/mm3, <10 days prior ART, No evidence of resistance at screening
ING112961 IIb ART-experienced, INI-resistant
Screening VL >1000 c/mL, RAL resistance at Screening, at least 2-class resistance (excluding INIs), Potential for 1 fully active agent in OBR (BID Cohort II only)
1.6. Rationale for Dose Selection in Clinical Development
1.6.1. ART-Naive/-Experienced (INI-Naive)
The 50 mg once daily dose for DTG in ART-naïve/-experienced (INI-naïve) subjects was selected based on the following:
Results from ING111521, 10-day monotherapy study in treatment-naive or treatment-experienced and INI-naive subjects demonstrating that once daily dosing of DTG achieved viral load declines for 2 mg, 10 mg and 50 mg of 1.54, 2.04, and 2.48 log10 c/mL, respectively. The 50 mg once daily dose achieved an inhibitory quotient (observed DTG concentration at the end of the dosing interval [C]/fold above protein adjusted 90% inhibitory concentration [PA-IC90]) of 19, demonstrating considerable coverage above the in vitro protein adjusted target concentration of 0.064 ng/ml.
A PK/PD analysis from ING111521 evaluated the relationship between C and change in HIV RNA from Baseline. The data were fit to a maximum effect model and demonstrated that the 50 mg dose was on the plateau of the concentration-response curve after monotherapy.

CONFIDENTIALModule 2.7.3 Summary of Clinical Efficacy
19
ING112276, a Phase IIb dose-ranging study in treatment-naive subjects that evaluatedDTG at doses of 10 mg, 25 mg and 50 mg once daily with 2 NRTIs compared to EFV plus 2 NRTIs. DTG was well tolerated across all doses studied. A good safety and tolerability profile with a low discontinuation rate due to AEs was observed in all three arms with no significant dose-dependent trends in safety parameters. All three doses showed similar robust antiviral responses and no apparent dose-response relationship was observed, suggesting DTG doses from 10 mg to 50 mg once daily in combination with 2 NRTIs achieved maximum virologic suppression. Therefore, the maximal tolerated and highest dose, DTG 50 mg once daily, was selected as the dose for the Phase III studies in INI-naive population. Selection of 50 mg once daily dose was also to accommodate decreases in DTG in light of drug interactions, poor absorption, imperfect adherence, or other causes.
The metabolic inducers darunavir/ritonavir (DRV/RTV), etravirine(ETR)/DRV/RTV, EFV, fosamprenavir (FPV)/RTV, and tipranavir (TPV)/RTV decreased DTG exposure to various degrees; however DTG exposures in the face of these interactions are still comparable to or higher than those demonstrated with 10 mg once daily dosing in ING112276.
In summary, a dose of 50 mg once daily demonstrated safety and efficacy while providing a significant coverage in plasma exposure to account for reductions due to drug interactions or other events that could decrease concentrations. This dose was selected for Phase III studies in ART-naive/-experienced, INI-naive adult subjects.
1.6.2. ART-Experienced (INI-Resistant)
The 50 mg BID dose selection for DTG in ART-experienced, INI-resistant subjects was based on the following:
ING112961 Cohort I evaluated 50 mg once daily in subjects with resistance to raltegravir, but a sub-optimal anti-viral response observed in some subjects harboringvirus with higher fold change (FC) to DTG prompted the evaluation of an increased dose of DTG in a second cohort of subjects.
PK/PD modeling predicted that increasing the DTG dosage from 50 mg once daily to 100 mg total daily dose in populations of raltegravir-resistant subjects would yield substantive improvements in treatment response.
A dose of 100 mg once daily was initially considered for evaluation, however data from healthy subjects in ING114005 demonstrated that plasma DTG exposures increase less-than-dose-proportionally from 50 mg to 100 mg. In addition, one-third of subjects did not have an appreciable increase in C between 50 mg and 100 mg doses. These data demonstrated that a 50 mg twice daily dose would provide more consistent exposures than a dose of 100 mg once daily.
ING112961 Cohort II evaluated DTG 50 mg twice daily in a similar population of subjects as Cohort I, but with more limited high-level resistance to DTG. Comparison of the primary endpoint (proportion of subjects with Day 11 plasma HIV-1 RNA <400 c/mL or at least 0.7 log10 c/mL below their Baseline values)
CONFIDENTIALModule 2.7.3 Summary of Clinical Efficacy
20
between Cohort I and Cohort II suggested a higher response rate may be achieved with 50 mg twice daily of DTG.
Analyses of data through Week 24 for Cohort II (and Week 72 for Cohort I) confirmed the continued benefit of the 50 mg DTG twice daily regimen without clinically significant differences in tolerability compared to the 50 mg once daily regimen.
In summary, the short term antiviral response rates, pharmacokinetics, and data through Week 24 of Cohort II (and Week 72 in Cohort I) of ING112961 suggested additional benefit would be realized with DTG 50 mg twice daily compared to the DTG 50 mg once daily dose in this population harboring INI-resistant virus. Therefore the DTG 50 mg twice daily dose was selected for Phase III evaluation in this population.
1.7. Design of Efficacy Studies
All efficacy studies were multicenter, international studies conducted in accordance with the Declaration of Helsinki and amendments [WMA, 2008]. All studies followed local laws and local guidelines including guidelines on Good Clinical Practice (GCP) for Trials on Medicinal Products in the European Community [GCP, 1996]. In addition, studies were all conducted under Investigational New Drug (IND) Application 75,382 and in accordance with FDA legal requirements.
1.7.1. Pivotal Efficacy Studies
1.7.1.1. Study ING113086
ING113086 is designed as a Phase III, randomized, double blind study to compare the safety and efficacy of 50 mg DTG once daily to 400 mg RAL BID, both administered with fixed-dose dual NRTI therapy over 96 weeks in HIV-1 infected, ART- naïve adults.The primary objective was to demonstrate the antiviral activity of DTG 50 mg administered once daily compared to RAL 400 mg BID over 48 weeks using the Missing, Switch or Discontinuation = Failure (MSDF), or FDA “Snapshot” algorithm. Secondary objectives included antiviral and immunological responses over time (including through Week 96); incidence, severity and changes over time in laboratory and clinical safety parameters, assessment of population-based PK and PK/PD relationship and changes in virologic genotype and phenotype.
A total of 827 subjects were randomized (1:1) and treated with either 50 mg DTG once daily, or RAL 400 mg twice daily. Subjects also received a dual NRTI backbone (TDF/FTC or ABC/3TC) chosen by the investigator. Subjects were stratified on Baseline HIV-1 RNA (100,000 c/mL or >100,000 c/mL) and choice of NRTI. To be considered eligible for this study, potential subjects must have received no more than 10 days of prior antiretroviral therapy, have no evidence of viral resistance and have screening laboratory values within protocol-defined ranges.
Subjects will be followed until the Week 96 visit at which time subjects originally randomized to RAL will discontinue from the study. Subjects originally randomized to DTG will be given the opportunity to continue to receive DTG and be followed in the

CONFIDENTIALModule 2.7.3 Summary of Clinical Efficacy
21
study until DTG is locally approved and commercially available, they no longer derive clinical benefit, they meet a protocol-defined reason for discontinuation, or until development of DTG is terminated.
Figure 1 ING113086 Study Design
1.7.1.2. Study ING114467
ING114467 is a Phase III randomized, stratified, double-blind, double-dummy, active-controlled, multicenter, parallel group, fully-powered non-inferiority study. The study was conducted in approximately 800 HIV-1 infected ART-naïve subjects. Subjects wererandomized 1:1 to receive DTG 50 mg plus ABC/3TC fixed dose combination (FDC)therapy once daily (approximately 400 subjects) or Atripla once daily (approximately 400 subjects). Subjects were stratified by screening HIV-1 RNA and CD4+ cell count. The primary analysis took place after the last subject completed 48 weeks on therapy; an additional analysis will be conducted after the last subject completes Week 96 on study. Due to the use of fixed dose formulations in both treatment arms, no dose reductions, modifications in dosage, or changes in the frequency of dosing were allowed in this study.
The primary objective of this study is to demonstrate the antiviral activity of DTG plus ABC/3TC FDC once daily therapy compared to Atripla over 48 weeks in HIV-1 infected ART-naïve subjects.
Secondary objectives include antiviral and immunological responses over time; incidence, severity and changes over time in laboratory and clinical safety parameters, and changes in virologic genotype and phenotype.
Subjects randomized to receive DTG plus ABC/3TC FDC once daily therapy and who successfully completed 96 weeks of treatment were given the opportunity to continue to receive these agents until either DTG is locally approved and commercially available, they no longer derive clinical benefit, they meet a protocol-defined reason for discontinuation, or until development of DTG is terminated. Subjects randomized to the Atripla arm will receive Atripla through their Week 96 visit, after which they will be discontinued from the study and will need to make alternative arrangements to access antiretroviral medication. The study has since been modified to continue the randomized

CONFIDENTIALModule 2.7.3 Summary of Clinical Efficacy
22
comparative phase to Week 144 (open label from Week 96 to 144) in order to further characterize the long-term safety of the DTG + ABC/3TC regimen (Figure 2).
The use of Atripla from the outset of treatment was not consistent with the European labeling at the time of study initiation; however this regimen is approved for initial use in treatment-naïve patients in other markets (e.g. US). An initial ART regimen comprising co-formulated EFV, FTC, and TDF has been established as a preferred regimen in treatment guidelines for therapy-naïve, HIV infected subjects [EACS, 2012; DHHS, 2012].
The efficacy of Atripla was established in a large 96 week clinical study (GS-934) in which EFV and the FDC of TDF/FTC were utilized and shown to be effective. The safety and resistance/cross resistance profiles of individual components have been well characterized in the regulatory submissions for each agent. Of particular note, the components of Atripla were also utilized as the comparator arm in the STARTMRK trial, which served as a RAL pivotal study for treatment-naive patients, and the Atripla FDC was used as comparator in one of the pivotal registrational studies for the recently approved Stribild (EVG/cobicistat/TDF/FTC) fixed dose combination [Sax, 2012].
As ING114467 is intended to support the global regulatory filing for the second integrase-containing three-drug FDC tablet, consisting of DTG/ABC/3TC, the use of Atripla in this study as a comparator is viewed as necessary by the Sponsor. As outlined below, the results from ING114467 provide further clinical data that address the clinical relevance of the conditions under which tenofovir is dosed from study initiation. In particular, the low rate of protocol defined virologic failure in ING114467 (4% on TDF/FTC/EFV and 4% on DTG + ABC/3TC) suggests that both combinations are efficacious.
Figure 2 ING114467 Study Design
GSK1349572 + ABC/3TC + Atriplaplacebo (n=~400)
GSK1349572 placebo + ABC/3TC placebo + Atripla (n=~400)
GSK1349572 + ABC/3TC open label HIV ART-Naïve subjects
HLA-B*5701 negativeHIV-1 RNA ≥ 1,000 c/mL
1:1 Randomization
Screening Visit~ Day -21
RandomizationDay 1
Week 48 Analysis
Week 96Analysis
Screening Period
Week 144 Analysis
AtriplaOpen Label
Double-Blind Phase Open-Label PhaseGSK1349572 Plus ABC/3TC
Continuation Phase
GSK1349572 + ABC/3TC open label
1.7.1.3. Study ING111762
ING111762 is designed as a Phase III randomized, double-blind, double dummy study to compare the safety and efficacy of the selected dose of DTG once daily to RAL 400 mg BID, both administered with an investigator-selected background regimen over 48
CONFIDENTIALModule 2.7.3 Summary of Clinical Efficacy
23
Weeks. Subjects enrolled in the study were HIV-1 infected, INI-naïve, ART-experienced adults. The primary objective of the study is to assess the non-inferiority (NI margin=12%) of DTG to RAL using the proportion of subjects with HIV-1 RNA <50 c/mL (Snapshot [MSD=F]) through Week 48 as the primary endpoint. Secondary objectives include antiviral and immunological response over time; incidence, severity and changes over time in laboratory and clinical safety parameters, assessment of population based PK and PK/PD parameters and changes in virologic genotype and phenotype.
The primary analysis will take place after the last subject completes 48 weeks on therapy. An additional data cut and analysis was conducted after the last subject completed 24 weeks on therapy. Data from this Week 24 pre-specified interim analysis is included with this initial registration package.
Approximately 688 subjects were randomized 1:1 to receive either DTG 50 mg once daily or RAL 400 mg BID each added to an investigator selected background regimen consisting of one fully active single agent plus no more than one second single agent which may or may not be active. Recruitment of subjects with highly potent regimens containing DRV/RTV was capped in order to ensure that the contribution of DTG to successful suppression could be satisfactorily demonstrated in a patient population similar to BENCHMRK-1 and 2 [Steigbigel, 2008].
Therefore, in line with the guidelines and the most recent approach of conducting clinical trials in moderately treatment-experienced subjects, this study was designed to evaluate DTG vs. the only approved in-class comparator, RAL, in subjects able to construct a background regimen consisting of at least one fully active agent and no more than one single second agent which may or may not be active, and used the primary endpoint of proportion of subjects with plasma HIV-1 RNA <50 c/mL (Snapshot [MSDF]).
In order to achieve balance across the two treatment groups of the study, randomization was stratified by:
Screening plasma HIV-1 RNA: 50,000 c/mL versus >50,000 c/mL;
DRV/RTV use without primary PI resistance (as defined by presence of primary mutations based on current International AIDS Society [IAS, 2009] guidelines): subjects who use DRV/RTV in their background regimen and whose Screening genotype shows no primary PI mutations versus subjects who either do not use DRV/RTV or whose Screening genotype shows primary PI mutations.The total number of subjects in the first category was restricted to 170.
Number of fully active drugs in investigator selected background regimen (study background regimen): 2 versus <2.
Subjects will be followed until the Week 48 visit at which time subjects originally randomized to RAL will discontinue from the study. Subjects originally randomized to DTG will be given the opportunity to continue to receive DTG and be followed in the study until DTG is locally approved and commercially available, they no longer derive clinical benefit, they meet a protocol-defined reason for discontinuation, or until development of DTG is terminated.

CONFIDENTIALModule 2.7.3 Summary of Clinical Efficacy
24
Figure 3 ING111762 Study Design
Screening Period Randomized Phase
HIV-1 treatment experienced, INI-naive Subjects• HIV-1 RNA >400 copies/mLa
• Resistance to 2 different ART classes
GSK1349572 + Raltegravir PCB + background regimenb
Raltegravir + GSK1349572 PCB + background regimenb
Screening Visit~Day -35
RandomizationDay 1
AnalysisWeek 24c
AnalysisWeek 48c
GSK1349572 (open-label) + background regimen
Non-Randomized Phase
a. At Screening and a second consecutive test >400 c/mL within four months prior to Screening (unless the Screening HIV-1 RNA >1000 c/mL where no additional plasma HIV-1 RNA assessment is needed). (If an additional HIV-1 RNA within four months prior to Screening was not available, a second HIV-1 RNA must havebeen performed during the Screening period [after the first result is available] to serve as a confirmatory sample.)
b. Subjects randomized to the RAL arm will discontinue study after Week 48, but subjects randomized to DTG will continue into Open-Label Phase. If a subject successfully completes Week 48 and RAL is not approved and commercially available within the country, GSK will continue to supply RAL in the Open-Label Phase until it is commercially available.
c. An interim analysis of Week 48 data was planned once 60% of subjects completed that assessment, using group-sequential statistical rules. However, with protocol amendment 6, a decision was made that this group-sequential interim analysis would not be conducted.
1.7.1.4. Study ING112574
Study ING112574 is a multicenter, single arm, open-label study to assess the antiviral activity and safety of a DTG containing regimen in HIV-1 infected, ART-experienced adults who had experienced virological failure on an INI containing regimen with historical or current evidence of genotypic and/or phenotypic resistance to RAL or EVG.Initially, a minimum of 100 subjects were enrolled to receive DTG 50 mg BID with the current failing regimen for 7 days but with optimized background regimen (OBR) from Day 8. Subjects must also have had documented genotypic and/or phenotypic resistance to at least one compound in two or more of the other approved classes of ART but must also have been able to include at least one fully active drug in the OBR to be commenced at Day 8. The first data cut took place after the 100th subject enrolled completed the Week 24 assessment visit and as agreed with regulatory agencies, this will be used to support initial regulatory filings.
All subjects who successfully completed 24 weeks of treatment will continue to have access to DTG until it is locally approved and commercially available, they no longer derive clinical benefit, they meet a protocol-defined reason for discontinuation or until the development of DTG is terminated.
Once the initial 100 subjects were enrolled, enrolment to the study continued until a further 50 to 100 subjects were recruited to a total study enrolment of 150 to 200
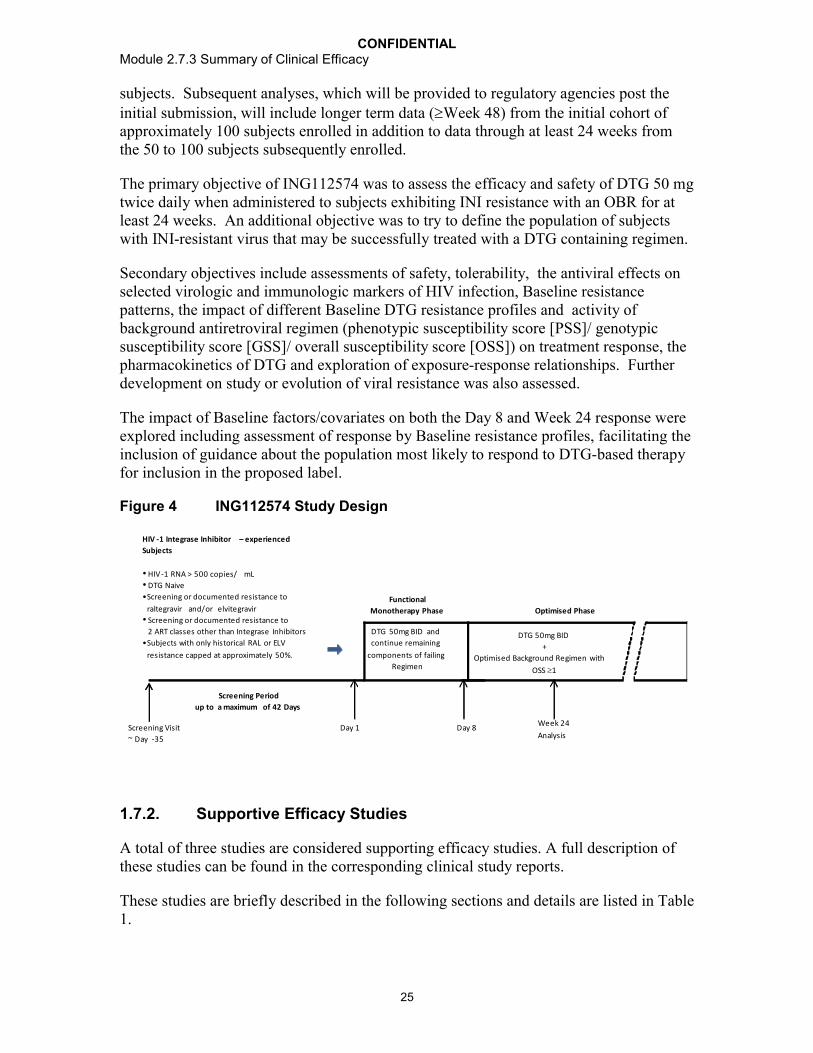
CONFIDENTIALModule 2.7.3 Summary of Clinical Efficacy
25
subjects. Subsequent analyses, which will be provided to regulatory agencies post the initial submission, will include longer term data (Week 48) from the initial cohort of approximately 100 subjects enrolled in addition to data through at least 24 weeks from the 50 to 100 subjects subsequently enrolled.
The primary objective of ING112574 was to assess the efficacy and safety of DTG 50 mg twice daily when administered to subjects exhibiting INI resistance with an OBR for at least 24 weeks. An additional objective was to try to define the population of subjects with INI-resistant virus that may be successfully treated with a DTG containing regimen.
Secondary objectives include assessments of safety, tolerability, the antiviral effects on selected virologic and immunologic markers of HIV infection, Baseline resistance patterns, the impact of different Baseline DTG resistance profiles and activity of background antiretroviral regimen (phenotypic susceptibility score [PSS]/ genotypic susceptibility score [GSS]/ overall susceptibility score [OSS]) on treatment response, the pharmacokinetics of DTG and exploration of exposure-response relationships. Further development on study or evolution of viral resistance was also assessed.
The impact of Baseline factors/covariates on both the Day 8 and Week 24 response wereexplored including assessment of response by Baseline resistance profiles, facilitating the inclusion of guidance about the population most likely to respond to DTG-based therapy for inclusion in the proposed label.
Figure 4 ING112574 Study Design
Screening Period
up to a maximum of 42 Days
Functional
Monotherapy Phase
HIV -1 Integrase Inhibitor – experienced
Subjects
• HIV-1 RNA > 500 copies/ mL• DTG Naive
•Screening or documented resistance to
raltegravir and/or elvitegravir• Screening or documented resistance to
2 ART classes other than Integrase Inhibitors
•Subjects with only historical RAL or ELV
resistance capped at approximately 50%.
Screening Visit
~ Day -35
Day 1 Day 8Week 24
Analysis
Optimised Phase
DTG 50mg BID
+
Optimised Background Regimen with
OSS 1
DTG 50mg BID and
continue remaining
components of failing
Regimen
1.7.2. Supportive Efficacy Studies
A total of three studies are considered supporting efficacy studies. A full description of these studies can be found in the corresponding clinical study reports.
These studies are briefly described in the following sections and details are listed in Table 1.

CONFIDENTIALModule 2.7.3 Summary of Clinical Efficacy
26
1.7.2.1. Study ING111521 (PoC)
ING111521 was a Phase IIa, multicenter, randomized, parallel, double-blind, dose ranging, placebo-controlled study to compare antiviral effect, safety, tolerability, and PK of DTG monotherapy versus placebo over 10 days in ART-naïve and experienced (integrase inhibitor-naïve) HIV-1 infected adults who were not currently receiving antiretroviral therapy. This study consisted of a Screening visit, a 10 day treatment period, and follow-up evaluations for 11 days following last dose.
Subjects were assigned to DTG or placebo in accordance with the randomization schedule. A description of each dose is provided below:
1. Treatment A: DTG 2 mg every 24 hours (q24h, n=8) or Placebo q24 h (n=2)
2. Treatment B: DTG 10 mg q24 h (n=8) or Placebo q24 h (n=2)
3. Treatment C: DTG 50 mg q24 h (n=8) or Placebo q24 h (n=2)
Each active treatment (8 subjects) with matching placebo (2 subjects) was dosed in the same frequency and with matching number of tablets to achieve the double-blind.
The primary objective of this study was to evaluate antiviral activity of DTG vs. placebo in HIV-1 infected patients during 10 days of monotherapy.
Secondary objectives include PK of DTG, safety and tolerability when administered as monotherapy over 10 days, and the relationship between DTG exposure and change in plasma HIV-1 RNA.
1.7.2.2. Study ING112276
ING112276 was designed to select the optimal once daily dose of DTG for Phase IIIstudies in integrase-naive subjects and to provide an early assessment of antiviral activity and durability of DTG as a component of ART. EFV-based ART served as the control arm. All subjects also received investigator-selected dual NRTI combination i.e., once daily ABC/3TC or TDF/FTC fixed dose combination (FDC) tablets. This study was conducted in HIV-1 infected ART-naïve adult subjects with 10 days of previous antiretroviral therapy, HIV-1 RNA 1000 c/mL, CD4+ cells 200 cells/mm3 and no primary resistance mutations at Screening.
The primary objective of the ING112276 trial was to select a DTG once daily dose for further evaluation in Phase III based on a comparison of the Week 16 antiviral activity and tolerability of a range of oral doses of DTG in HIV-1 infected therapy-naïve adult subjects. Secondary objectives included assessment of various DTG doses on selected virological and immunological markers of HIV infection over time, assessment of the safety and tolerability of DTG, characterization of the PK parameters and the PK/PD relationship of DTG and assessment of the development of viral resistance to DTG and other on-study ART in subjects experiencing virological failure.
Eligible subjects were randomized 1:1:1:1 to one of three doses of DTG (10 mg, 25 mg or 50 mg once daily) or to the EFV control in accordance with the randomization schedule. A description of each dose is provided below:

CONFIDENTIALModule 2.7.3 Summary of Clinical Efficacy
27
1. DTG 10 mg once daily +dual NRTI once daily
2. DTG 25 mg once daily +dual NRTI once daily
3. DTG 50 mg once daily +dual NRTI once daily
4. EFV 600 mg once daily +dual NRTI once daily
Figure 5 ING112276 Study Design
1.7.2.3. Study ING112961
Study ING112961 (VIKING) is a Phase IIb, multicenter, open-label, single arm pilot study to assess the antiviral activity of DTG containing regimen in HIV-1 infected, ART-experienced adults with RAL resistance. The study was originally designed to include approximately 30 ART-experienced subjects with either current or past virologic failure to RAL. As specified in the protocol, as some subjects with higher level of DTG resistant had an inadequate response to DTG 50 mg once daily, an additional cohort exploring a higher dose of DTG (50 mg BID) was initiated.
All subjects were required to harbor viral isolates with RAL resistance mutations at Screening. Subjects were also required to have documented genotypic and/or phenotypic resistance to at least one compound from each of three or more of the approved classes of ART including integrase inhibitors.
The screening genotype was used to assign subjects to one of two genotypic groups: Genotypic Group A comprised those with virus exhibiting the mutation Q148H/K/R plus one or more Q148 associated secondary resistance mutations, whilst genotypic Group B comprised those with virus exhibiting alternative genotypes conferring RAL resistance (N155H and Y143H pathways with or without secondary mutations or Q148H/K/R single mutants without secondary mutations). The groups were capped at approximately 15

CONFIDENTIALModule 2.7.3 Summary of Clinical Efficacy
28
subjects per group (Cohort I) and 10 subjects per group (Cohort II) to ensure enrolment of subjects harboring virus with a broad range of sensitivity to DTG.
Subjects with current RAL virologic failure substituted RAL with DTG 50 mg once daily (Cohort I) or 50 mg BID (Cohort II) and continue the remaining components of their failing regimen through Day 10. Subjects with historical RAL virologic failure were required to add DTG 50 mg once daily (Cohort I) or BID (Cohort II) to their failing regimen through Day 10. On Day 11 all subjects continued DTG and for Cohort I optimized, where feasible, their background therapy. With Cohort II, all subjects were required to have a PSS1 for their optimized background therapy.
Antiviral activity, safety and tolerability of DTG were evaluated at Day 11 and over time through at least Week 24.
The primary objective of Study ING112961 was to assess the short term anti-viral activity of DTG plus failing background regimen. Secondary objectives include the impact of Baseline resistance to DTG on treatment response, the relationship between PK measures and response (antiviral activity and safety) and PK/PD assessment. Antiviral activity and safety over the longer term (when DTG is administered with the OBR) was also to be determined and variables correlated with response explored. Further development on study or evolution of viral resistance was also to be assessed.
Figure 6 ING112961 Study Design
1.8. Efficacy Endpoints
The primary endpoint for pivotal studies ING113086, ING114467, ING111762, and ING112574 (Week 24 endpoint) was analyzed using a Missing, Switch or Discontinuation = Failure (MSDF) algorithm as codified by the FDA’s “snapshot” algorithm.
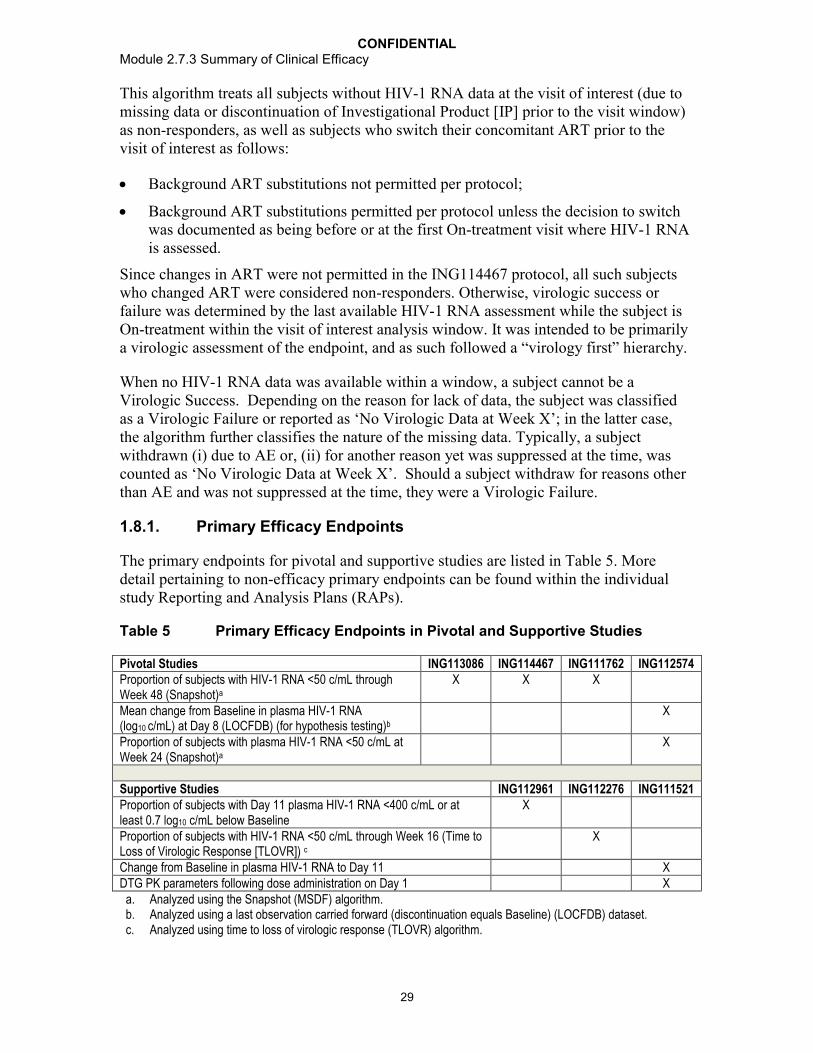
CONFIDENTIALModule 2.7.3 Summary of Clinical Efficacy
29
This algorithm treats all subjects without HIV-1 RNA data at the visit of interest (due to missing data or discontinuation of Investigational Product [IP] prior to the visit window) as non-responders, as well as subjects who switch their concomitant ART prior to the visit of interest as follows:
Background ART substitutions not permitted per protocol;
Background ART substitutions permitted per protocol unless the decision to switch was documented as being before or at the first On-treatment visit where HIV-1 RNA is assessed.
Since changes in ART were not permitted in the ING114467 protocol, all such subjects who changed ART were considered non-responders. Otherwise, virologic success or failure was determined by the last available HIV-1 RNA assessment while the subject is On-treatment within the visit of interest analysis window. It was intended to be primarily a virologic assessment of the endpoint, and as such followed a “virology first” hierarchy.
When no HIV-1 RNA data was available within a window, a subject cannot be a Virologic Success. Depending on the reason for lack of data, the subject was classified as a Virologic Failure or reported as ‘No Virologic Data at Week X’; in the latter case, the algorithm further classifies the nature of the missing data. Typically, a subject withdrawn (i) due to AE or, (ii) for another reason yet was suppressed at the time, was counted as ‘No Virologic Data at Week X’. Should a subject withdraw for reasons other than AE and was not suppressed at the time, they were a Virologic Failure.
1.8.1. Primary Efficacy Endpoints
The primary endpoints for pivotal and supportive studies are listed in Table 5. More detail pertaining to non-efficacy primary endpoints can be found within the individual study Reporting and Analysis Plans (RAPs).
Table 5 Primary Efficacy Endpoints in Pivotal and Supportive Studies
Pivotal Studies ING113086 ING114467 ING111762 ING112574Proportion of subjects with HIV-1 RNA <50 c/mL through Week 48 (Snapshot)a
X X X
Mean change from Baseline in plasma HIV-1 RNA (log10 c/mL) at Day 8 (LOCFDB) (for hypothesis testing)b
X
Proportion of subjects with plasma HIV-1 RNA <50 c/mL at Week 24 (Snapshot)a
X
Supportive Studies ING112961 ING112276 ING111521Proportion of subjects with Day 11 plasma HIV-1 RNA <400 c/mL or at least 0.7 log10 c/mL below Baseline
X
Proportion of subjects with HIV-1 RNA <50 c/mL through Week 16 (Time to Loss of Virologic Response [TLOVR]) c
X
Change from Baseline in plasma HIV-1 RNA to Day 11 XDTG PK parameters following dose administration on Day 1 X
a. Analyzed using the Snapshot (MSDF) algorithm.b. Analyzed using a last observation carried forward (discontinuation equals Baseline) (LOCFDB) dataset.c. Analyzed using time to loss of virologic response (TLOVR) algorithm.
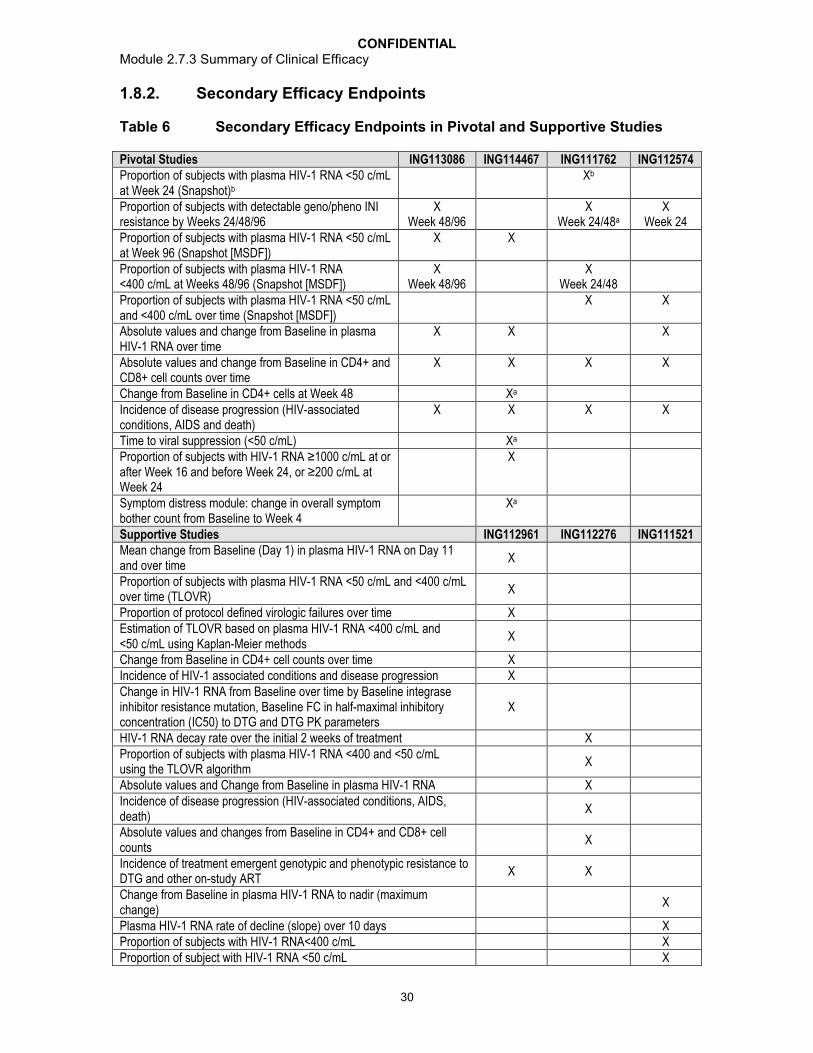
CONFIDENTIALModule 2.7.3 Summary of Clinical Efficacy
30
1.8.2. Secondary Efficacy Endpoints
Table 6 Secondary Efficacy Endpoints in Pivotal and Supportive Studies
Pivotal Studies ING113086 ING114467 ING111762 ING112574Proportion of subjects with plasma HIV-1 RNA <50 c/mL at Week 24 (Snapshot)b
Xb
Proportion of subjects with detectable geno/pheno INI resistance by Weeks 24/48/96
X Week 48/96
X Week 24/48a
X Week 24
Proportion of subjects with plasma HIV-1 RNA <50 c/mL at Week 96 (Snapshot [MSDF])
X X
Proportion of subjects with plasma HIV-1 RNA <400 c/mL at Weeks 48/96 (Snapshot [MSDF])
X Week 48/96
X Week 24/48
Proportion of subjects with plasma HIV-1 RNA <50 c/mL and <400 c/mL over time (Snapshot [MSDF])
X X
Absolute values and change from Baseline in plasma HIV-1 RNA over time
X X X
Absolute values and change from Baseline in CD4+ and CD8+ cell counts over time
X X X X
Change from Baseline in CD4+ cells at Week 48 Xa
Incidence of disease progression (HIV-associated conditions, AIDS and death)
X X X X
Time to viral suppression (<50 c/mL) Xa
Proportion of subjects with HIV-1 RNA ≥1000 c/mL at or after Week 16 and before Week 24, or ≥200 c/mL at Week 24
X
Symptom distress module: change in overall symptom bother count from Baseline to Week 4
Xa
Supportive Studies ING112961 ING112276 ING111521Mean change from Baseline (Day 1) in plasma HIV-1 RNA on Day 11 and over time
X
Proportion of subjects with plasma HIV-1 RNA <50 c/mL and <400 c/mL over time (TLOVR)
X
Proportion of protocol defined virologic failures over time XEstimation of TLOVR based on plasma HIV-1 RNA <400 c/mL and<50 c/mL using Kaplan-Meier methods
X
Change from Baseline in CD4+ cell counts over time XIncidence of HIV-1 associated conditions and disease progression XChange in HIV-1 RNA from Baseline over time by Baseline integrase inhibitor resistance mutation, Baseline FC in half-maximal inhibitory concentration (IC50) to DTG and DTG PK parameters
X
HIV-1 RNA decay rate over the initial 2 weeks of treatment XProportion of subjects with plasma HIV-1 RNA <400 and <50 c/mL using the TLOVR algorithm
X
Absolute values and Change from Baseline in plasma HIV-1 RNA XIncidence of disease progression (HIV-associated conditions, AIDS, death)
X
Absolute values and changes from Baseline in CD4+ and CD8+ cell counts
X
Incidence of treatment emergent genotypic and phenotypic resistance toDTG and other on-study ART
X X
Change from Baseline in plasma HIV-1 RNA to nadir (maximum change)
X
Plasma HIV-1 RNA rate of decline (slope) over 10 days XProportion of subjects with HIV-1 RNA<400 c/mL XProportion of subject with HIV-1 RNA <50 c/mL X
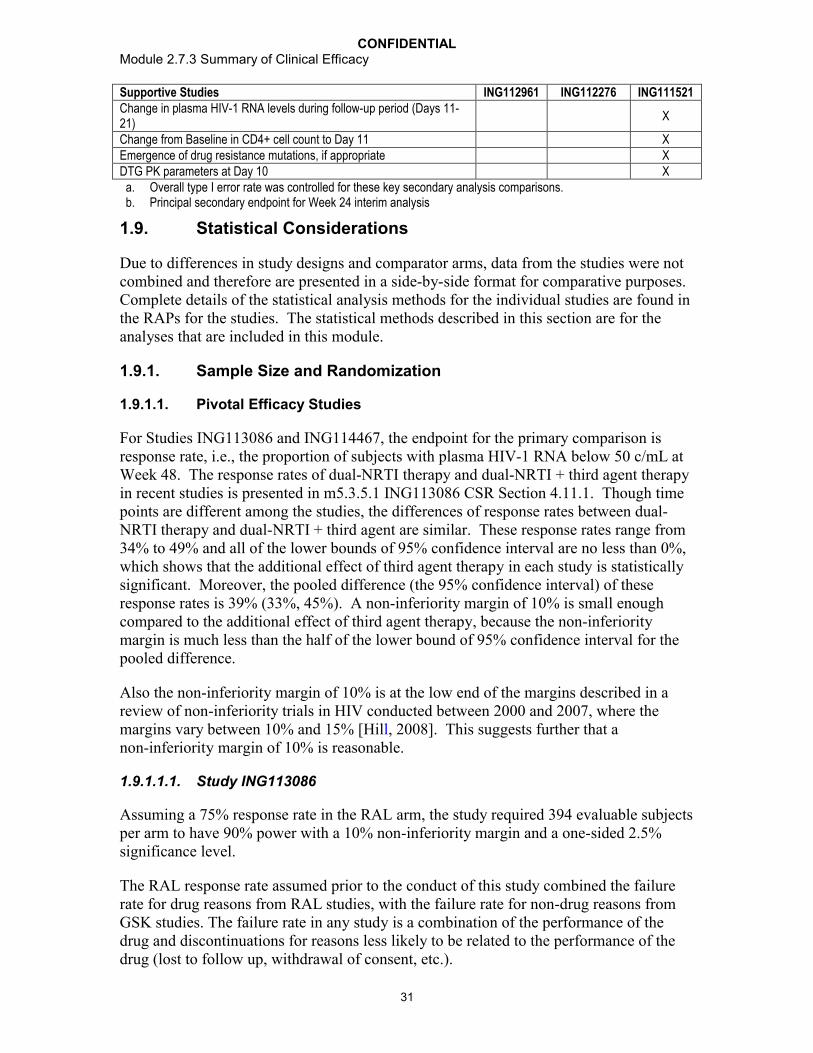
CONFIDENTIALModule 2.7.3 Summary of Clinical Efficacy
31
Supportive Studies ING112961 ING112276 ING111521Change in plasma HIV-1 RNA levels during follow-up period (Days 11-21)
X
Change from Baseline in CD4+ cell count to Day 11 XEmergence of drug resistance mutations, if appropriate XDTG PK parameters at Day 10 X
a. Overall type I error rate was controlled for these key secondary analysis comparisons.b. Principal secondary endpoint for Week 24 interim analysis
1.9. Statistical Considerations
Due to differences in study designs and comparator arms, data from the studies were not combined and therefore are presented in a side-by-side format for comparative purposes. Complete details of the statistical analysis methods for the individual studies are found in the RAPs for the studies. The statistical methods described in this section are for the analyses that are included in this module.
1.9.1. Sample Size and Randomization
1.9.1.1. Pivotal Efficacy Studies
For Studies ING113086 and ING114467, the endpoint for the primary comparison is response rate, i.e., the proportion of subjects with plasma HIV-1 RNA below 50 c/mL at Week 48. The response rates of dual-NRTI therapy and dual-NRTI + third agent therapy in recent studies is presented in m5.3.5.1 ING113086 CSR Section 4.11.1. Though time points are different among the studies, the differences of response rates between dual-NRTI therapy and dual-NRTI + third agent are similar. These response rates range from 34% to 49% and all of the lower bounds of 95% confidence interval are no less than 0%, which shows that the additional effect of third agent therapy in each study is statistically significant. Moreover, the pooled difference (the 95% confidence interval) of these response rates is 39% (33%, 45%). A non-inferiority margin of 10% is small enough compared to the additional effect of third agent therapy, because the non-inferiority margin is much less than the half of the lower bound of 95% confidence interval for the pooled difference.
Also the non-inferiority margin of 10% is at the low end of the margins described in a review of non-inferiority trials in HIV conducted between 2000 and 2007, where the margins vary between 10% and 15% [Hill, 2008]. This suggests further that a non-inferiority margin of 10% is reasonable.
1.9.1.1.1. Study ING113086
Assuming a 75% response rate in the RAL arm, the study required 394 evaluable subjects per arm to have 90% power with a 10% non-inferiority margin and a one-sided 2.5% significance level.
The RAL response rate assumed prior to the conduct of this study combined the failure rate for drug reasons from RAL studies, with the failure rate for non-drug reasons from GSK studies. The failure rate in any study is a combination of the performance of the drug and discontinuations for reasons less likely to be related to the performance of the drug (lost to follow up, withdrawal of consent, etc.).

CONFIDENTIALModule 2.7.3 Summary of Clinical Efficacy
32
Data on RAL from studies in treatment-naïve HIV-1 infected subjects showed response rates of approximately 86% at Week 48 and 81% to 83% at Week 96. The rate of discontinuations for non-drug reasons historically has been higher for GSK studies than for the studies of RAL (GSK Data on File). This gave response rates of approximately 80% at Week 48 and 75% at Week 96. Using the lower of the two response rates for the power calculation yielded 90% power at each time point.
1.9.1.1.2. Study ING114467
Assuming a 75% response rate in the TDF/FTC/EFV arm, the study required 394 evaluable subjects per arm to have 90% power with a 10% non-inferiority margin and a one-sided 2.5% significance level.
The power of this study is based on a response rate of 75% which is in the mid-range of response rates observed in EFV arms in recent large clinical studies ranges from 71% to 82%.
1.9.1.1.3. Study ING111762
Assuming a 65% response rate in the RAL arm, the study required 333 subjects per arm to have 90% power with a 12% non-inferiority margin and a one-sided 2.5% significance level.
Data on RAL from studies in treatment-experienced, INI-naïve HIV-1 infected subjects with either one or two active background antiretroviral agents have shown response rates of approximately 66% at Week 48 [Cooper, 2008]. The appropriate control response rate to assume for this study combines the failure rate for drug reasons from the RAL studies with the failure rate for non-drug reasons from GSK studies. This gives an estimated response rate between 60 and 65% at Week 48, (25-30% drug-related failure rate plus 5-10% failure for non-drug reasons).
The 12% NI margin was chosen based on prior studies with consistent evidence of sensitivity to drug effects, with consideration for the difficulty in recruiting a treatment-experienced yet RAL naïve population.
Specifically, the non-inferiority margin was chosen based on the observed benefit of raltegravir vs. placebo in INI-naïve patients in the BENCHMRK studies within the population of subjects with Phenotypic Susceptibility Score (PSS)=1-2.
The treatment difference in HIV-1 RNA <50 c/mL at Week 48 of raltegravir versus placebo in the BENCHMRK studies was almost exactly the same in PSS=1 and PSS=2 populations (PSS=1: 32%, 95% CI 18% to 45%; and PSS=2: 33%, 95% CI 18% to 47%); benefit for pooled PSS 1-2 population 32%, CI 22% to 42%. These confidence intervals and observed treatment differences were far enough from zero to justify a NI margin of 12% in subjects with PSS=1, PSS=2 or PSS 1-2 [Cooper, 2008].
The non-inferiority design used is in alignment with applicable HIV-specific guidelines [EMA, 2009] and statistical guidelines [ICH, 2001]. The active control has reproducible and well-defined clinical activity shown in the placebo-controlled BENCHMRK studies

CONFIDENTIALModule 2.7.3 Summary of Clinical Efficacy
33
[Steigbigel, 2008] and the non-inferiority margin has been chosen based on statistical considerations and clinical judgment in line with applicable guidelines [EMA, 2009].
1.9.1.1.4. Study ING112574
Assuming a standard deviation of 0.5 log10 c/mL for the change from Baseline in plasma HIV-1 RNA at Day 8, this study required fewer than twenty subjects to be powered at 90% on the primary hypothesis test. However, the minimal sample size was expanded to 150 to 200 subjects to allow a comprehensive assessment of the safety, antiviral activity and PK of DTG in this study, acknowledging constraints on the availability of the study patient population.
1.9.1.2. Supportive Efficacy Studies
1.9.1.2.1. Study ING111521
The sample size for this study was based primarily on feasibility to provide adequate precision for the estimations.
After successfully completing screening evaluations, approximately 30 eligible HIV-1 infected subjects were randomized to one of three active treatments or placebo, 8 subjects in each active dose and 6 in placebo.
1.9.1.2.2. Study ING112276
The endpoint for the primary efficacy comparison was the proportion of subjects with plasma HIV-1 RNA below 50 c/mL at Week 16. The sample size (50 subjects per arm) was chosen to ensure a high probability (more than 95%) that a dosage regimen with truly poor response (i.e., at least 10% worse than on another dose) was not selected for further study on the basis of the analysis of the primary endpoint.
1.9.1.2.3. Study ING112961
There was no formal calculation of power or sample size for this pilot study.

CONFIDENTIALModule 2.7.3 Summary of Clinical Efficacy
34
1.9.2. Analysis Populations
Table 7 Analysis Populations Discussed in ISE
Population Name Population Definition Pivotal Efficacy Studies
Supportive Efficacy Studies
All Subjects Screened Population
The All Subjects Screened population will consist of all subjects screened for inclusion in the study.
ING113086, ING114467,ING111762,ING112574
ING112961, ING112276
Intent-to-Treat Exposed (ITT-E) Population
The Intent-to-Treat Exposed population will consist of all randomized subjects who receive at least one dose of investigational product. For studies ING112961, ING111521, subjects had to have at least one post-Baseline measure of plasma HIV-1 RNA. The ITT-E population will be the primary population used for efficacy analyses.In randomized studies, subjects will be analyzed according to their randomized treatment, regardless of the treatment they actually received.Note for ING111762 the modified ITT-E Population is described below (Modified Intent-to-Treat Exposed (mITT-E) Population).
ING113086, ING114467,ING112574:(single arm)
ING112961, ING112276,ING111521
Per-Protocol (PP) Population
Per-Protocol population will consist of subjects in the ITT-E Population (mITT-e for ING111762) with the exception of those with a protocol deviation before a specified analysis time point. PP Population will be used for a supporting analysis of the primary endpoint analysis only.
ING113086, ING114467,ING111762, ING112574
ING112961, ING112276,ING111521
On-treatment Genotypic and Phenotypic Resistance Populations
The On-treatment Genotypic and Phenotypic Resistance populations will consist of all subjects in the ITT-E population with available On-treatment genotypic and phenotypic resistance data, respectively, excluding subjects who are not protocol-defined virologic failures. These populations will be used for analysis of On-treatment and treatment-emergent genotype and phenotype.
ING113086ING114467
ING112276
The following analysis populations are specific to ING111762:
Modified Intent-to-Treat Exposed (mITT-E) Population
The Modified Intent-to-Treat Exposed population consists of all randomized subjects who receive at least one dose of investigational product, and who were not at one study site (Site 083523, Investigator ID=096536) in Russia (enrolled 4 subjects in ING111762) that was closed early after the sponsor became aware of GCP noncompliance issues in another ViiV Healthcare-sponsored study. Further details will be provided in the clinical study report.

CONFIDENTIALModule 2.7.3 Summary of Clinical Efficacy
35
Week 24 Protocol Defined Virologic Failure (PDVF) Genotypic and Phenotypic Populations
The Week 24 PDVF Genotypic and Phenotypic populations consists of all subjects in the mITT-E population with protocol defined virologic failure occurring by Week 24 and available On-treatment genotypic and phenotypic resistance data, respectively, at time of protocol defined virologic failure. These populations were used for selected analysis of genotype/phenotype data for the Week 24 clinical study report.
The following analysis populations are specific to ING112574:
Week 24 ITT-E Population
The Week 24 ITT-E population will consist of the initial 100 (approximate) subjects recruited in the ITT-E population who have completed the analysis timepoint (e.g. Week 24) at the data cut of the Week 24/48 interim analysis or withdrawn. The exact number of subjects included in this population will depend on the timing of the interim analysis.
For the Week 24 interim analysis, this population is the main population for assessing efficacy.
Day 8/Week 24 Per-Protocol (PP) Populations
Day 8/Week 24 Per-Protocol populations will consist of subjects in the ITT-E /Week 24 ITT-E Population with the exception of those with a protocol deviation, before a specified analysis timepoint, which may directly or indirectly impact the efficacy endpoint of HIV-1 RNA. Week 24 PP Population was used for a supporting analysis of the primary endpoint analysis at Week 24. Day 8 PP population was used for a supporting analysis of the primary efficacy endpoint analysis at Day 8.
Virologic Outcome By Baseline Genotype or Phenotype (VO) Population
Virologic Outcome by Baseline Genotype or Phenotype Population at a time-point of interest (e.g. Day 8, Week 24) included all subjects in the ITT-E /Week 24 ITT-E Population, excluding
Subjects who received incorrect IP, had IP interruption, or received prohibited medication prior to a time-point of interest.(i.e. consistent with the criteria for defining Per-protocol population),
Subjects who discontinued IP (before confirmed protocol defined virologic failure) at any time up to a time-point of interest (e.g. Day 8, Week 24) for reasons other than lack of efficacy.
VO Populations were used for analyzing the association between the virologic response (Day 8 and Week 24) and Baseline characteristics (e.g. Baseline resistance).

CONFIDENTIALModule 2.7.3 Summary of Clinical Efficacy
36
1.9.3. Statistical Methods
An overview of the statistical methods used to analyze efficacy variables in the individual pivotal and supporting studies is shown in Table 8. A more detailed review of statistical methodology can be found in the RAP for each study.

CONFIDENTIALModule 2.7.3 Summary of Clinical Efficacy
37
Table 8 Overview of Statistical Methods Used to Analyze Efficacy Variables
Study Comparisons of Interest
Statistical Tests Phase(s) of interest
Primary Endpoints
Methods of Analysis
Pivotal Efficacy StudiesING113086 Non-inferiority
of the DTG treatment Armvs. the RAL treatment Arm
The lower end of a two-sided 95% confidence interval for the difference between the two groups in response rates lies above -10%.
Week 48 Section 1.8.1
Adjusted estimates of the difference in the proportion of responders between each treatment group will be presented along with two-sided 95% CIs based on a stratified analysis using Cochran-Mantel-Haenszel (CMH) weights.
Four strata (subgroups) will be formed according to the combinations of levels of the following categorical variables: Baseline plasma HIV-1 RNA (≤ vs. >100,000 c/mL) and background dual NRTI therapy (ABC/3TC vs. TDF/FTC).
ING114467 Non-inferiority of the DTG plus ABC/3TC treatment Armvs. the Atripla treatment Arm
The lower end of a two-sided 95% confidence interval for the difference between the two groups in response rates lies above -10%.
Week 48 Section 1.8.1
Adjusted estimates of the difference in the proportion of responders between each treatment group will be presented along with two-sided 95% CIs based on a stratified analysis using Cochran-Mantel-Haenszel (CMH) weights.
For the statistical analysis, four strata (subgroups) will be formed according to the combinations of levels of the following categorical variables: Baseline plasma HIV-1 RNA ( vs. >100,000 c/mL) and Baseline CD4+ cell count ( vs. >200 cells/mm3).
ING111762 Non-inferiority of the DTG treatment Armvs. the RAL treatment Arm
The lower end of a two-sided 95% confidence interval for the difference between the two groups in response rates at Week 24 (and Week 48 for primary analysis) lies above -12%.
Week 24 for ISE (Note Week 48 is the primary endpoint)
Section 1.8.1
Adjusted estimates of the difference in the proportion of responders between each treatment group will be presented along with two-sided 95% CIs based on a stratified analysis using Cochran-Mantel-Haenszel (CMH) weights.
For the statistical analysis, eight strata (subgroups) will be formed according to the combinations of levels of the following categorical variables: • Baseline plasma HIV-1 RNA ( vs. >50,000 c/mL); • DRV/RTV use in background ART regimen without primary PI mutations at Baseline: (yes vs. either no DRV/RTV use or presence of primary PI mutations at Baseline); • Baseline PSSf (<2 vs. 2) to background regimen.
ING112574 As this is a single arm study there will be no treatment comparisons
The hypothesis of no change from Baseline will be tested at the two-sided five per cent significance level using a single sample t- test (Day 8).
Day 8Week 24
Section 1.8.1
The p value and the Day 8 mean change from Baseline with 95% confidence interval will be displayed.
The proportion of subjects with viral load <50 c/mL at week 24 by Snapshot (MSDF) algorithm will be reported

CONFIDENTIALModule 2.7.3 Summary of Clinical Efficacy
38
Study Comparisons of Interest
Statistical Tests Phase(s) of interest
Primary Endpoints
Methods of Analysis
Supportive Efficacy StudiesING111521 DTG 2, 10,
50 mg once daily for 10 days vs. placebo
No hypothesis testing will be performed.
Day 11 Section 1.8.1
Change from Baseline to will be calculated for each subject and summarized for each treatment.
ING112276 DTG 10, 25, 50 mg vs. EFV treatment arm
No hypothesis testing will be performed. Dose selection will be based primarily on pre-specified go/no go thresholds for antiviral activity and tolerability endpointsin conjunction with immunologic, safety, and PK data secondary endpoint.
Week 16 Section 1.8.1
A dose of DTG on which four more patients are failures than on the next highest dose will not be considered for further study unless safety or tolerability concerns rule out the higher dose.
ING112961 Sequential Cohort study
No hypothesis testing was planned, however the mean change from Baseline in plasma HIV-1 RNA was compared between the two cohorts to provide further information for the Phase III dose selection.
Day 11 Section 1.8.1
The proportion of subjects achieving ≤0.7 log10c/mL reduction of viral load or <400 c/mL at Day 11 (i.e. primary endpoint) will be presented for Cohort II.
CONFIDENTIALModule 2.7.3 Summary of Clinical Efficacy
39
1.9.4. Missing Data
1.9.4.1. Missing, Switch or Discontinuation = Failure (Snapshot)
Subjects’ responses (e.g., <50 c/mL) were calculated according to a Missing, Switch or Discontinuation = Failure (MSDF) algorithm – as codified by the FDA’s “snapshot”algorithm (ING113086, ING114467, ING111762 and ING112574).
Full details of the MSDF algorithm are in Section 1.8.
1.9.4.2. Last Observation Carried Forward Discontinuation = Baseline (LOCFDB)
The algorithm for the LOCFDB imputation, specific to ING112961 and ING112574, wasdescribed as follows: If an assessment is missing at an on-treatment visit, then the last non-missing on-treatment result from a prior visit was carried forward and analyzed. However, if subjects have missing values due to premature withdrawal, these missing values were set to their Baseline values.
1.9.4.3. Time to Loss of Virologic Response (TLOVR)
In each assessment window, a subject was defined as a responder if their treatment hadnot yet failed according to the TLOVR algorithm (ING112276 Week 96 CSR Section 4.8 and ING112961 Cohort I Week 96/Cohort II Week 48 CSR Section 4.6). That is, a responder had confirmed plasma HIV-1 RNA response at a certain threshold (e.g., <50 c/mL), but none of the events that define TLOVR treatment failure before the end of the window of interest. A non-responder was defined as a subject whose treatment has failed according to the TLOVR algorithm.
A subject was a failure in the time window of interest if they reached any of the eventsdescribed in the algorithm in that or any previous window. A subject will only have amissing visit imputed as a treatment failure if they met the TLOVR definition oftreatment failure in the subsequent visit.
1.9.5. Subgroup Analysis
Subgroups summarized within this report are listed below. Refer to individual study RAPs for a full listing of subgroups.

CONFIDENTIALModule 2.7.3 Summary of Clinical Efficacy
40
Table 9 Subgroups in Efficacy Studies
Subgroup Levels StudiesBaseline plasma HIV-1 RNA ≤100,000 c/mL
>100,000 c/mLING113086 ING114467 ING112276
<1000 c /mL1000 to <10,00010,000 to <50,00050,000 to <100,000100,000 to 500,000>500,000
ING112574
≤50, 000 c/mL >50,000 c/mL
ING111762
Background dual NRTI at Day 1 (for ING113086) and Week 16 or discontinuation (ING112276)
ABC/3TC TDF/FTC
ING113086 ING112276
Baseline CD4+ cell count <200 cells/mm3
≥200 cells/mm3
ING114467
<5050 to <200200 to <350350 to <500 ≥500 cells/mm3
ING113086ING114467ING111762ING112276ING112574
Cutoff using study median
ING111762
Baseline Centers for Disease Control and Prevention (CDC) category
CDC Category ACDC Category BCDC Category C
ING113086ING114467ING111762ING112276ING112574
Race white non-white
ING113086ING114467ING111762ING112574
Gender femalemale
ING113086ING114467ING111762ING112574
Age <50 years 50 years
ING114467ING113086ING111762
<36 years36 years
ING114467ING113086
<65 years65 years
ING112574

CONFIDENTIALModule 2.7.3 Summary of Clinical Efficacy
41
Table 10 Subgroups in ING111762
Susceptibility scores:a. PSSf:
Baseline PSSf to background regimen: <2, 2; 1 vs. 2;
Maximum Baseline potential PSSf : 2 vs. >2;b. PSSp:
Baseline PSSp to background regimen: <2, 2; 1 vs. >1;c. GSS:
Baseline GSS to background regimen: <2, 2; <2 vs. 2 Baseline resistance: three class resistance vs. two class resistance;Subjects receiving recently approved ART in background regimen (i.e. darunavir, etravirine, enfuvirtide or maraviroc): (yes/no);Use of DRV/RTV in background regimen: (yes/no); Use of T20 in background regimen: (yes/no); Use of etravirine in background regimen: (yes/no)Number of fully active PIs in background regimen (based on phenotypic susceptibility): (yes/no)
Screening plasma HIV-1 RNA 1,000 c/mLSubjects utilizing historical drug class resistance to establish eligibility: (yes/no)DRV/RTV use without primary PI mutations at Baseline: (yes vs. either no DRV/RTV use or presence of primary PI mutations);Taking prohibited medications potentially reducing DTG concentration (yes/no);Clades (Clade B, Clade C, Other)
Adherence rate based on pill counts (with imputation): <70%, 70 to <80%, 80 to <90%, 90 to <95%, 95%
Table 11 Subgroups in ING112574
RAL/EVG treatment status: Discontinued prior to Screening; On-going at Screening
Duration of prior INI use: Missing, 6 months, >6 months to 24 months, >24 monthsFC in IC50 to RAL: 0 to 1.5, >1.5 to 4, >4 to 8, >8 to 10, >10 to 20, >20 to Max, >Max, MissingFC in IC50 to DTG: 0 to 2.5, >2.5 to 4, >4 to 8, >8 to 10, >10 to 15, >15 to 20, >20 to 25, >25, MissingEvidence at Baseline of Primary genotypic IN resistance: Detected, Not detected
Number of pre-specified (primary or secondary) IN mutations: 0, 1, 2, 3, 4, 5
Baseline IN mutation categories: Q148+2 secondary mutations, Q148+1 secondary mutation, N155, Y143, T66, 2 primary mutations, Primary not detectedPSS of failing background regimen: 0, 1, 2, >2OSS of failing background therapy: 0, 1, 2, >2Baseline PSSf to OBR at Day 8: 0, 1, 2, >2Baseline OSS to OBR at Day 8: 0, 1, 2, >2Baseline GSS to OBR at Day 8: >0 to 1, >1 to 2, >2Taking prohibited medications potentially reducing DTG concentration: Yes, No

CONFIDENTIALModule 2.7.3 Summary of Clinical Efficacy
42
In the analyses of the antiviral activity at Day 8 and Week 24, the association betweenvirologic responses and the factors described below were explored.
Table 12 Covariates Explored in Statistical Regression Modeling in ING112574
Day 8 Week 24Age b XGender XRace XCountry XDuration of prior INIb XStatus of RAL/EVG Treatment X XHIV risk factor XBaseline viral load b X XBaseline CD4+ cell countb X X
Baseline IN resistant mutation category X XNumber of IN pre-specified resistance mutation at Baselineb X XBaseline FC in IC50 relative to wild type (WT) virus for RALb X XBaseline FC in IC50 relative to WT virus for DTGb X XEvidence of genotypic IN resistance at Baseline X XBaseline phenotypic and overall sensitivity score (full sensitivity only – PSS and OSS) to Day 1 background ART regimen
X
Baseline PSS, GSS, and OSS to OBR used at Day 8 XTaking prohibited medications potentially reducing DTG concentration X XDTG PK Exposure (i.e. pre-dose concentration [C0] and phenotypic inhibitory quotient for predose concentration [PIQ_C0] at Day 8)a,b
X
DTG PK Exposure (average of concentrations at time 0 [C0_avg] and phenotypic inhibitory quotient for average concentration [PIQ_Cavg])a,b
X
a. Only C0 and PIQ_C0 will be included as a covariate for the multivariate analyses of the association between factors and virologic response in this document. The multivariate PK/PD analyses using PK parameters estimated based on population PK analysis will be described in a separate Population PK and PK/PD reporting and analysis plan.
b. The continuous data of these factors rather than subgroups will be included in the multivariate analysis
1.9.6. Sensitivity Analyses
To assess the impact of major protocol deviations, the primary analyses described above were performed using the Per-protocol population and the results were compared for consistency with the results from the ITT-E (or mITT-E) population in ING113086, ING114467, ING111762, ING112574, and ING112961. Refer to individual study RAPs for a full listing of sensitivity analyses.
Phase II studies were designed and implemented according to the TLOVR algorithm, which was the accepted regulatory analysis at the time. Prior to the start of the Phase III program, FDA’s Division of Antiviral Products adopted the Snapshot (MSDF) algorithm; subsequently, this analysis method was employed in Phase III. The Missing or Discontinuation=Failure (MDF) analysis was an additional pre-planned analysis performed for the Phase II studies, which closely approximates the Snapshot analysis. A key difference is the lack of penalty for switching of background regimen in the MDF analysis, therefore, a brief summary of background regimen switches in the Phase II

CONFIDENTIALModule 2.7.3 Summary of Clinical Efficacy
43
studies is presented along with the MDF analysis. The MDF analysis is shown in this ISE to allow for a comparison with Snapshot response rates in the Phase III studies.
1.9.7. Antiviral Activity of DTG by Baseline Resistance in an INI-resistant population in ING112574
The Committee for Medical Products for Human Use (CHMP) Guideline on the clinical development of medicinal products for the treatment of HIV infection provides a template in Annex B for how to present information on efficacy by Baseline resistance for inclusion in Section 5.1 of the Summary of Product Characteristics (SPC) and the European Public Assessment Report (EPAR) [EMA, 2009].
Pre-specified IN resistance associated mutations that are listed in Table 13 were included in the analysis of response by Baseline DTG resistance to determine the genotypic correlates to virologic response.
Table 13 Pre-specified IN-resistance Associated Mutations
H51Y, T66A, T66I, T66K, L68V, L68I, L74I, L74M, L74R, E92Q, E92V, Q95K, T97A, G118R, E138A, E138K, E138T, G140A, G140C, G140S, Y143C, Y143H, Y143R, P145S, S147G, Q148H, Q148K, Q148R, V151I, V151L, S153F, S153Y, N155H, E157Q, G163R, G163K, G193E, R263K
Note: IN substitutions listed above were defined from http://hivdb.stanford.edu/ with a score of >45. All other mutations were detected during INI clinical investigation or during in vitro studies with DTG. The mutations bolded are referred to ‘primary’ mutations, and those unbolded are referred to ‘secondary’ mutations for this analysis.
The association between change from Baseline in plasma HIV-1 RNA (log10 c/mL) at Day 8 and Baseline IN resistance associated mutations was explored through linear regression analysis by adjusting for other potential confounding factors (i.e. susceptibility to failing regimen and Baseline viral load). The Baseline IN resistance associated mutations that significantly affect the Day 8 response were identified. Baseline IN resistance mutations were categorized based on results from this analysis in predicting Day 8 virologic response.
The virologic response at both Day 8 and Week 24 were summarized by the Baseline IN resistance mutation groups derived from the Day 8 analysis, as per the requirement of table template from Annex B Section 5.1 [EMA, 2009].
2. SUMMARY OF RESULTS OF INDIVIDUAL STUDIES
This section provides summaries of key results from pivotal and supportive studies in INI-naïve and INI-resistant populations:
Pivotal Efficacy Phase III studies include:
ING113086 (ART-naive),
ING114467 (ART-naive),
ING111762 (ART-experienced, INI-naive),
ING112574 (INI-resistant).

CONFIDENTIALModule 2.7.3 Summary of Clinical Efficacy
44
Supportive Efficacy Phase II studies include:
ING111521 (ART-naive or experienced, but INI-naive).
ING112276 (ART-naive),
ING112961 (INI-resistant),
A complete listing of all studies included in this marketing application is included in Appendix Table 1.
2.1. Pivotal Efficacy Studies
The Phase III Studies ING113086, ING114467, ING111762, and ING112574 assessed DTG across a broad range of treatment experience in HIV-infected patients and support the indication for the treatment of HIV-infected patients.
2.1.1. Study ING113086
Refer to ING113086 CSR for a full presentation and discussion of Week 48 results (m5.3.5.1 ING113086 Week 48 CSR).
In this multicenter, double-dummy-blinded, Phase III, non-inferiority study, HIV-1 infected ART-naive adults with HIV-1 RNA 1000 c/mL and no evidence of viral resistance were randomized 1:1 to receive DTG 50 mg once daily or RAL 400 mg BID, in addition to investigator-selected backbone NRTIs of either TDF/FTC or ABC/3TC. Subjects were stratified by screening HIV-1 RNA ( and >100,000 c/mL) and backbone NRTI selection. The primary endpoint was proportion of subjects with HIV-1 RNA <50 c/mL through Week 48 (FDA “snapshot” algorithm).
Eight hundred twenty-seven subjects were randomized (DTG n=413, RAL n=414). At Baseline the median age was 36 years, 14% were female, 15% non-white, 28% had HIV-1 RNA >100,000 c/mL, and 41% used ABC/3TC as their background dual NRTI. Proportion of subjects achieving the primary endpoint was 88% for DTG and 85% for RAL; difference (2.5%; 95% CI: -2.2% to 7.1%) met 10% non-inferiority criteria. For subjects with HIV-1 RNA >100,000 c/mL, response rate was 82% for DTG vs 75% for RAL. Secondary analyses supported non-inferiority: HIV-1 RNA < 50 c/mL per-protocol (DTG 90% vs RAL 88%), treatment-related discontinuation=failure (93% vs 92%) and virologic non-response (5% vs 8%). Median CD4+ cell count increases were similar (230 cells/mm3 each). At virologic failure, there was no genotypic integrase or NRTI resistance in the DTG group vs 1 subject and 4 subjects, respectively, in the RAL group.
At Week 48, once-daily DTG was non-inferior to twice daily RAL in treatment-naïveHIV-1 infected subjects, with no evidence of emergent resistance to DTG in virologic failure. DTG has shown rapid and durable antiviral responses and could be an option for first-line HIV treatment.

CONFIDENTIALModule 2.7.3 Summary of Clinical Efficacy
45
2.1.2. Study ING114467
Refer to ING114467 CSR for a full presentation and discussion of Week 48 results (m5.3.5.1 ING114467 Week 48 CSR).
ING114467 is a double-blind, double-dummy, non-inferiority Phase III study in therapy-naïve adults with HIV-1 RNA ≥1000 c/mL, randomized subjects to DTG 50 mg + ABC/3TC once daily or EFV/TDF/FTC once daily.
Eight hundred thirty-three subjects enrolled in the study (DTG + ABC/3TC n=414, Atripla n=419); 16% were females and 32% were non-white. At Week 48, 88% of DTG + ABC/3TC and 81% of EFV/TDF/FTC subjects had HIV-1 RNA <50 c/mL confirming non-inferiority (Table 14). Using pre-specified testing procedures, statistical superiority was concluded (p=0.003). The statistically significant difference in response rates noted in ING114467 was primarily due to lower discontinuations due to AEs on the DTG regimen. Both time to virologic suppression and change from Baseline in CD4+ favoredthe DTG arm and were significant. Protocol defined virological failure was 4% in each arm. No INI or NRTI resistance was observed in the DTG arm vs. 1 NRTI resistance associated mutation (RAM) and 4 NNRTI RAMs on EFV/TDF/FTC. DTG + ABC/3TC was highly effective and better tolerated through 48 weeks than EFV/TDF/FTC single-tablet regimen. DTG has shown rapid and durable antiviral responses.
Table 14 ING114467 Week 48 Study Data
DTG 50 mg +ABC/3TConce daily
(N=414)
EFV/TDF/FTC once daily
(N=419)
Difference[95% CI](P value)
Proportion <50 c/mL (Snapshot [MSDF]) 364 / 414 (88%) 338 / 419 (81%) 7.4%[2.5, 12.3]P=0.003
Proportion <50 c/mL (Per protocol) 362 / 403 (90%) 335 / 412 (81%) 8.7%[3.9, 13.4]
Median time to <50 c/mL and hazard ratio 28 days 84 days 2.3[2.0; 2.7]P<0.0001
Change from Baseline in CD4+ cells/mm3 267 208 59[33, 84]P<0.001
Data Source: ING114467 Week 48 CSR Table 7.1, Table 7.2, Table 7.11, Table 7.14
2.1.3. Study ING111762
Refer to ING111762 CSR for a full presentation and discussion of Week 24 results (m5.3.5.1 ING111762 CSR).
ING111762 is a double-dummy-blinded, Phase III, non-inferiority study, in HIV-1 infected ART-experienced, integrase inhibitor naive adults with 2 consecutive HIV-1 RNA values >400 c/mL (or 1 value >1000 c/mL). Subjects were required to have at least 2 class resistance, and have one fully active agent available to construct the background therapy (no more than 2 ARTs total). Subjects were randomized 1:1 to receive DTG
CONFIDENTIALModule 2.7.3 Summary of Clinical Efficacy
46
50 mg once daily or RAL 400 mg BID, in addition to this investigator-selected resistance test guided background regimen. Subjects were stratified by screening HIV-1 RNA (50,000 or >50,000 c/mL), investigator specified number of fully active agents in the background regimen (2, <2), and DRV use (No DRV/RTV use or DRV/RTV with primary PI mutations vs. DRV/RTV use without primary PI mutations). The primary endpoint is the proportion of subjects with HIV-1 RNA <50 c/mL through Week 48 (Snapshot [MSDF]). The proportion of subjects with HIV-1 RNA <50 c/mL is a secondary study endpoint and is the principal analysis for the Week 24 study report.
Seven hundred and nineteen subjects were randomized (DTG n=357, RAL n=362) into the study and received at least one dose of investigational product. Four additional subjects were excluded from the ITT analyses for GCP issues at one site in Russia. Therefore, the modified ITT population for the primary efficacy analysis included 715 subjects. At Baseline the median age was 43 years, 32% were female, 42% were African American/African Heritage, and 49% of subjects had at least 3 class resistance.
Virologic suppression (HIV-1 RNA <50 c/mL) in the DTG arm (79%) was statistically superior to the RAL arm (70%), based on the Week 24 prespecified analysis of outcomes of the FDA Snapshot (MSDF) algorithm with the mITT-E Population (adjusted treatment difference and 95% CI 9.7 [3.4, 15.9], p=0.003). This finding demonstrates a statistically significant difference in favor of DTG and was supported by additional analyses including: Per-Protocol (DTG: 81%, RAL: 72%), and treatment-related discontinuation=failure (DTG: 86%, RAL: 78%).
Median CD4+ cell count increases were similar (DTG: 99.0 cells/mm3; RAL: 93.0 cells/mm3) (ING111762 Week 24, Section 6.2.2). There were fewer virologic nonresponders using the Snapshot (MSDF) algorithm through Week 24 in the DTG group compared to the RAL group (DTG: 15%; RAL: 24%). This result was driven by data within the window for HIV-1 RNA not being <50 c/mL (DTG: 11%; RAL: 18%). At virologic failure, there was also a statistically significant difference in favor of DTG for the proportion of subjects harboring virus with evidence of INI Resistance by Week 24 (DTG 2/354 [0.6%]; RAL 10/361 [2.8%]; p=0.016).
2.1.4. Study ING112574
Refer to ING112574 CSR for a full presentation and discussion of Week 24 results (m5.3.5.2 ING112574 Week 24 CSR).
ING1122574 examined the efficacy of DTG 50 mg BID in patients with resistance to multiple ARV classes, including INIs.
RAL and/or EVG-resistant (current or historical) adult subjects with screening plasma HIV-1 RNA 500 c/mL and resistance to 2 other ART classes received open-label DTG 50 mg BID while continuing their failing regimen (without RAL/EVG). At Day 8 the background regimen was optimized and DTG continued. Activity of the OBR was determined by Monogram Net Assessment. Primary endpoints were antiviral efficacy at Day 8 and Week 24.

CONFIDENTIALModule 2.7.3 Summary of Clinical Efficacy
47
One hundred eighty-three subjects enrolled, 124 with INI-resistance at Screening and 59 with historical resistance (but no resistance at Screening). The population enrolled was advanced: at Baseline median CD4+ was 140 cells/mm3, median prior ART was 13 years, 56% were CDC Class C, 79% had 2 NRTI, 75% 1 NNRTI, and 70% 2 PI resistance-associated mutations, and 62% had non-R5 HIV detected (Data Source: ING112574 Week 24 CSR, Section 5, Table 12.11 and Table 12.45).
Of the 114 subjects who had the opportunity to complete 24 weeks on study before data cutoff, 72 (63%) had <50 c/mL RNA at Week 24 (Snapshot [MSDF]). Mean HIV-1RNA declined by 1.4 log10 c/mL (95% CI: 1.3, 1.5; p<0.001) at Day 8; response differed by genotype pathway (Table 15).
Table 15 Response by Primary INI Mutations at Baseline
Primary INI mutations at Baseline (BL)
n Mean HIV RNA (log10) Change from BL (SD) at Day 8
% >1 log10 HIV RNA decline or <50 c/mL at Day 8
TOTAL 182 -1.4 (0.61) 82%T66 1 -1.9 100%Y143 28 -1.7 (0.42) 96%N155 33 -1.4 (0.51) 82%
Q148 + 1 secondary mutationa 32 -1.1 (0.51) 69%
Q148 + 2 secondary mutationsa 20 -1.0 (0.81) 48%
2 primary mutations 8 -1.4 (0.76) 75%
No primary mutations 60 -1.6 (0.55) 95%Data Source: ING112574 Week 24 CSR Table 7.6, Table 7.42 and Table 12.112
a. Key secondary mutations comprised G140A/C/S, L74I, E138A/K/T
In subjects with Q148 pathway mutations, virologic response decreased with increasing number of secondary mutations. Assessing all subjects who had the opportunity to reach Week 24 before the data cut-off, 63% of this Week 24 ITT-E population (N=114) achieved viral suppression to <50 c/mL based on the Snapshot (MSDF) algorithm (Data Source: ING112574 Week 24 CSR Table 7.21). Background overall susceptibility score (OSS) was not associated with Week 24 response: percentage of subjects <50 c/mL were 83%, 63%, 59% and 69% for OSS 0, 1, 2 and >2, respectively (ING112574 Week 24 CSR, Table 7.31).
A majority of the highly treatment-experienced subjects in ING112574 achieved suppression with DTG-based therapy. Responses were associated with Baseline IN genotype but not OSS, highlighting the importance and independence of DTG antiviral activity.
2.2. Supportive Efficacy Studies
2.2.1. Study ING111521
Refer to ING111521 Clinical Pharmacology Study Report (CPSR) for a full presentation and discussion of results (m5.3.4.2 ING111521 CPSR).
CONFIDENTIALModule 2.7.3 Summary of Clinical Efficacy
48
The objective of this study was to evaluate the antiviral activity, safety, pharmacokinetics, and pharmacokinetics/ pharmacodynamics of DTG, a next-generation HIV integrase inhibitor (INI), as short-term monotherapy.
Study ING111521 was a Phase IIa, randomized, double-blind, dose-ranging study.
In this study, INI-naive, HIV-1-infected adults currently off antiretroviral therapy were randomized to receive DTG (2, 10, or 50 mg) or placebo once daily for 10 days in an eight active and two placebo randomization scheme per DTG dose. Placebo patients were pooled for the purpose of analysis.
Thirty-five patients (n=9 for DTG 2 mg, n=9 for DTG 10 mg, n=10 for DTG 50 mg, and n=7 for placebo) were enrolled. Baseline characteristics were similar across dose groups. Significant reductions in plasma HIV-1 RNA from Baseline to Day 11 were observed for all DTG dose groups compared with placebo (p <0.001), with a mean decrease of 1.51 to 2.46 log10 c/mL. In addition, a well characterized dose-response relationship was observed for viral load decrease. Most patients (7/10, 70%) receiving DTG 50 mg achieved plasma HIV-1 RNA less than 50 c/mL.
The pharmacokinetic variability was low (coefficient of variation, range 25 to 50%). Plasma HIV-1 RNA reduction was best predicted by Cτ using an Emax model (Figure 7).
Based on this model, EC90 was estimated at 0.32 g/mL. The range of C values for subjects receiving 50 mg once daily was 0.60 to 1.17 g/mL which were on the plateau of the concentration-response curve. These data indicate the 50 mg dose achieves plasma concentrations in excess of those required for maximal antiviral activity.
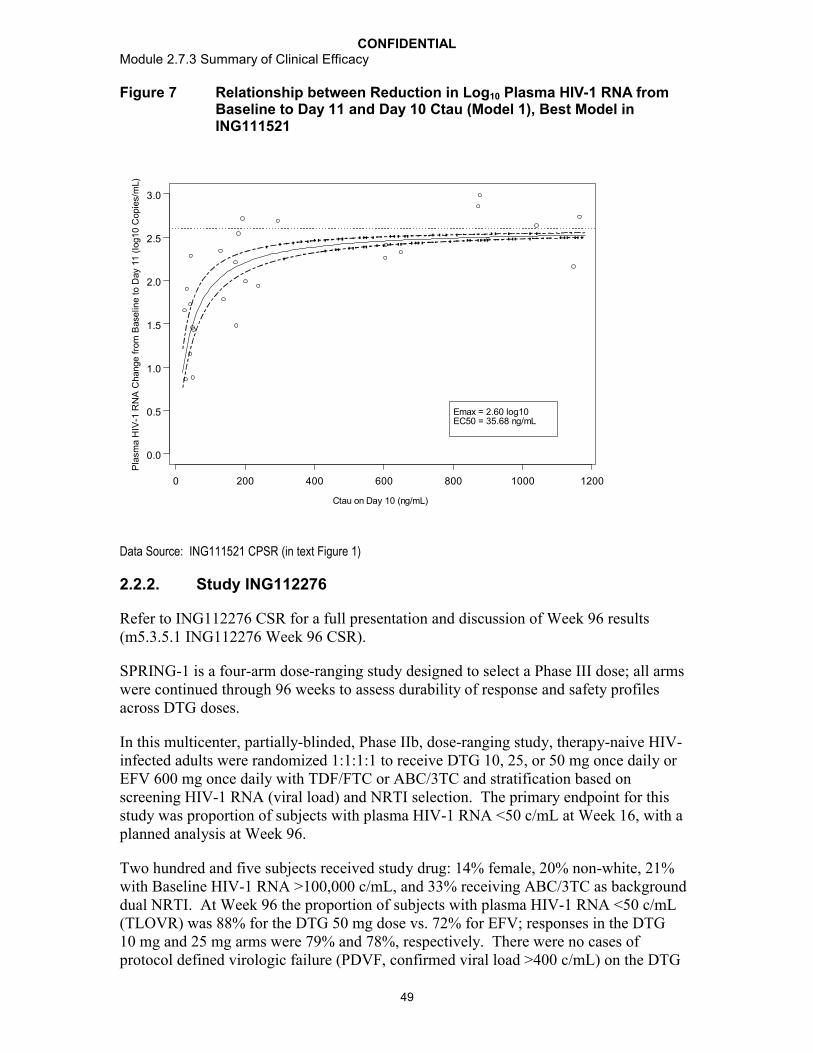
CONFIDENTIALModule 2.7.3 Summary of Clinical Efficacy
49
Figure 7 Relationship between Reduction in Log10 Plasma HIV-1 RNA from Baseline to Day 11 and Day 10 Ctau (Model 1), Best Model in ING111521
Ctau on Day 10 (ng/mL)
Pla
sm
a H
IV-1
RN
A C
hange f
rom
Base
line t
o D
ay
11 (
log10 C
opie
s/m
L)
0 200 400 600 800 1000 1200
0.0
0.5
1.0
1.5
2.0
2.5
3.0
Emax = 2.60 log10EC50 = 35.68 ng/mL
Data Source: ING111521 CPSR (in text Figure 1)
2.2.2. Study ING112276
Refer to ING112276 CSR for a full presentation and discussion of Week 96 results (m5.3.5.1 ING112276 Week 96 CSR).
SPRING-1 is a four-arm dose-ranging study designed to select a Phase III dose; all arms were continued through 96 weeks to assess durability of response and safety profiles across DTG doses.
In this multicenter, partially-blinded, Phase IIb, dose-ranging study, therapy-naive HIV-infected adults were randomized 1:1:1:1 to receive DTG 10, 25, or 50 mg once daily or EFV 600 mg once daily with TDF/FTC or ABC/3TC and stratification based on screening HIV-1 RNA (viral load) and NRTI selection. The primary endpoint for this study was proportion of subjects with plasma HIV-1 RNA <50 c/mL at Week 16, with a planned analysis at Week 96.
Two hundred and five subjects received study drug: 14% female, 20% non-white, 21% with Baseline HIV-1 RNA >100,000 c/mL, and 33% receiving ABC/3TC as background dual NRTI. At Week 96 the proportion of subjects with plasma HIV-1 RNA <50 c/mL (TLOVR) was 88% for the DTG 50 mg dose vs. 72% for EFV; responses in the DTG 10 mg and 25 mg arms were 79% and 78%, respectively. There were no cases of protocol defined virologic failure (PDVF, confirmed viral load >400 c/mL) on the DTG
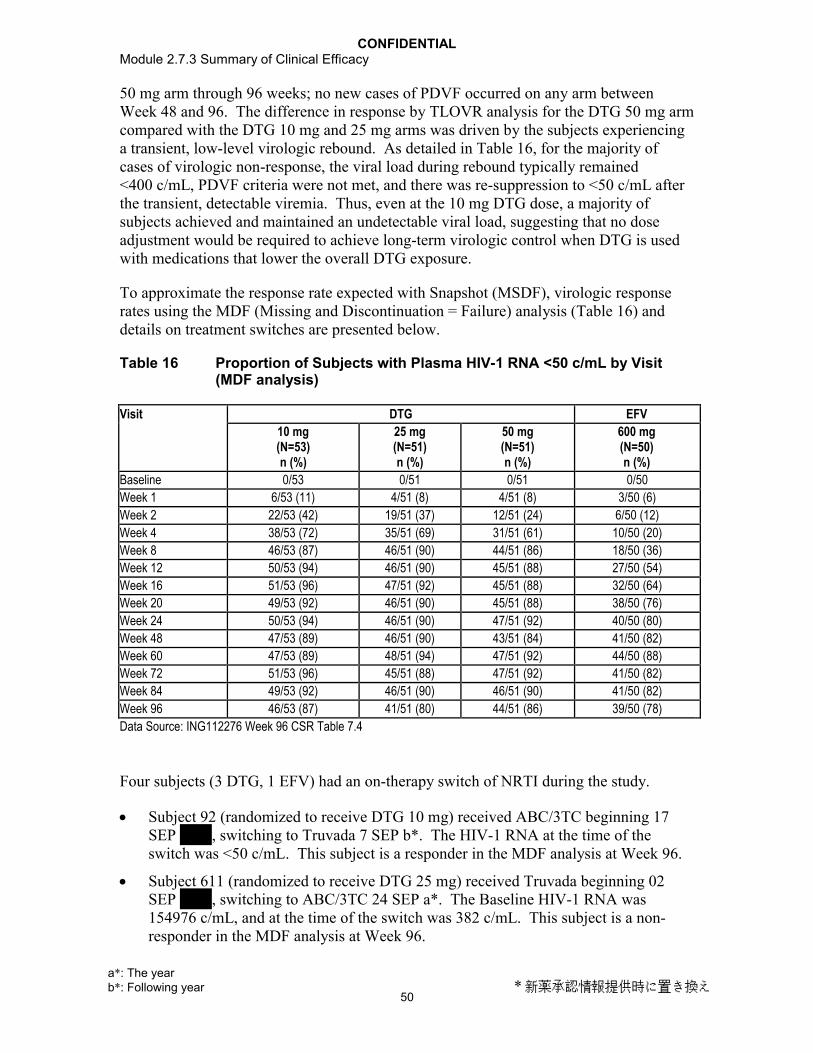
CONFIDENTIALModule 2.7.3 Summary of Clinical Efficacy
50
50 mg arm through 96 weeks; no new cases of PDVF occurred on any arm between Week 48 and 96. The difference in response by TLOVR analysis for the DTG 50 mg arm compared with the DTG 10 mg and 25 mg arms was driven by the subjects experiencing a transient, low-level virologic rebound. As detailed in Table 16, for the majority of cases of virologic non-response, the viral load during rebound typically remained <400 c/mL, PDVF criteria were not met, and there was re-suppression to <50 c/mL after the transient, detectable viremia. Thus, even at the 10 mg DTG dose, a majority of subjects achieved and maintained an undetectable viral load, suggesting that no dose adjustment would be required to achieve long-term virologic control when DTG is used with medications that lower the overall DTG exposure.
To approximate the response rate expected with Snapshot (MSDF), virologic response rates using the MDF (Missing and Discontinuation = Failure) analysis (Table 16) and details on treatment switches are presented below.
Table 16 Proportion of Subjects with Plasma HIV-1 RNA <50 c/mL by Visit (MDF analysis)
Visit DTG EFV
10 mg(N=53)n (%)
25 mg(N=51)n (%)
50 mg(N=51)n (%)
600 mg(N=50)n (%)
Baseline 0/53 0/51 0/51 0/50
Week 1 6/53 (11) 4/51 (8) 4/51 (8) 3/50 (6)
Week 2 22/53 (42) 19/51 (37) 12/51 (24) 6/50 (12)
Week 4 38/53 (72) 35/51 (69) 31/51 (61) 10/50 (20)
Week 8 46/53 (87) 46/51 (90) 44/51 (86) 18/50 (36)
Week 12 50/53 (94) 46/51 (90) 45/51 (88) 27/50 (54)
Week 16 51/53 (96) 47/51 (92) 45/51 (88) 32/50 (64)
Week 20 49/53 (92) 46/51 (90) 45/51 (88) 38/50 (76)
Week 24 50/53 (94) 46/51 (90) 47/51 (92) 40/50 (80)
Week 48 47/53 (89) 46/51 (90) 43/51 (84) 41/50 (82)
Week 60 47/53 (89) 48/51 (94) 47/51 (92) 44/50 (88)
Week 72 51/53 (96) 45/51 (88) 47/51 (92) 41/50 (82)
Week 84 49/53 (92) 46/51 (90) 46/51 (90) 41/50 (82)
Week 96 46/53 (87) 41/51 (80) 44/51 (86) 39/50 (78)
Data Source: ING112276 Week 96 CSR Table 7.4
Four subjects (3 DTG, 1 EFV) had an on-therapy switch of NRTI during the study.
Subject 92 (randomized to receive DTG 10 mg) received ABC/3TC beginning 17 SEP , switching to Truvada 7 SEP b*. The HIV-1 RNA at the time of the switch was <50 c/mL. This subject is a responder in the MDF analysis at Week 96.
Subject 611 (randomized to receive DTG 25 mg) received Truvada beginning 02 SEP , switching to ABC/3TC 24 SEP a*. The Baseline HIV-1 RNA was 154976 c/mL, and at the time of the switch was 382 c/mL. This subject is a non-responder in the MDF analysis at Week 96.
a*: The year b*: Following year * 新薬承認情報提供時に置き換え

CONFIDENTIALModule 2.7.3 Summary of Clinical Efficacy
51
Subject 60 (randomized to receive DTG 25 mg) received ABC/3TC beginning 03 NOV . On 17 FEB b*, Truvada was dispensed to the subject in error. Once the error was discovered, the subject was switched back to ABC/3TC on 21 MAR b*. The HIV-1 RNA at the time of both switches was <50 c/mL. This subject is a responder in the MDF analysis at Week 96.
Subject 821 (randomized to receive EFV) received ABC/3TV beginning 06 OCT . The subject developed symptoms on 21 OCT a* which the investigator
thought were associated with a possible hypersensitivity reaction to abacavir so both EFV and ABC/3TC were stopped. The subject was switched to COMBIVIR™ on 27 OCT a* and EFV was also resumed at that time. The symptoms returned, and the investigator diagnosed an allergy to EFV, so the subject was withdrawn. The Baseline HIV-1 RNA was 26584 c/mL, and at the time of the switch was 209 c/mL.This subject is a non-responder in the MDF analysis at all timepoints through Week 96.
Three other subjects (Subjects 46, 101 and 927) were placed on short-term commercial supplies of EFV and/or ABC/3TC/Truvada due to shipping delays of study supplied IP and NRTIs. These subjects appear on the listing of subjects with changes in antiretroviral therapy to record the temporary change in medication source, but their actual NRTI treatment was not switched during the study.
No genotypic or phenotypic evidence of INI or NNRTI resistance was observed through Week 96 in any of the treatment arms; no NRTI mutations were observed through 96 weeks at the selected DTG 50 mg dose. The median change from Baseline in CD4+ cells in the combined DTG arms trended higher for DTG (combined) (+338.5 cells/mm3) versus EFV (+301 cells/mm3) (p=0.155).
Once daily, unboosted DTG demonstrated durable antiviral activity for all dosing arms with 88% responders through 96 weeks at the selected 50 mg once daily dose.
2.2.3. Study ING112961
Refer to ING112961 CSR for a full presentation and discussion of Cohort I Week 96/Cohort II Week 48 results (m5.3.5.2 ING112961 Cohort I Week 96/Cohort II Week 48 CSR).
Study ING112961 aimed to assess the antiviral activity through Week 48 of DTG given to HIV-infected subjects with RAL resistance.
Two sequential cohorts of HIV+ adults with genotypic resistance to RAL and to ≥2 other ARV classes at Baseline received DTG 50 mg once daily (Cohort I) or twice daily (Cohort II). All continued failing background therapy through to Day 11 which was then to be optimized. The inclusion of at least one fully active drug in the OBR was required for Cohort II.
The Baseline characteristics of the 51 subjects enrolled and antiviral responses at Day 11
and Week 48 are provided below.
a*: The year b*: Following year * 新薬承認情報提供時に置き換え

CONFIDENTIALModule 2.7.3 Summary of Clinical Efficacy
52
Table 17 Key Baseline Characteristics
Baseline Characteristics ING112961Cohort I (n=27)
DTG 50 mg once daily + BRCohort II (n=24)
DTG 50 mg BID + BRMedian CD4+cells/mm3 (range) 114 (19,729) 202 (19, 528)Median HIV-1 RNA log10c/mL (range) 4.48 (2.64, 6.06) 4.26 (3.32, 5.84)Q148 + ≥1 9 (33%) 11 (46%)N155 or Y143 or other 18 (67%) 13 (54%)Median RAL FC (range) 161 (0.57, 165) 128 (0.78, 183)Median DTG FC (range) 1.5 (0.6, 35) 2.7 (0.9, 9.5)Median years prior ARV (range) 14 (4, 21) 15 (3, 22)PSS of OBR =0/1/≥2 12/7/8 1/9/14Data Source: ING112961 Cohort I Week 96/Cohort II Week 48 CSR Table 6.21, Table 6.23, Table 6.30, Table 12.25, Table 12.26 and Table 12.48
Table 18 Antiviral Response to DTG
ING112961Cohort I (n=27)
DTG 50 mg once daily + BRCohort II (n=24)
DTG 50 mg BID + BRMean Plasma HIV-1 RNA log10c/mL reduction at Day 11a
-1.45 (S.D=0.77) -1.76 (S.D=0.54)
<50 c/mL (TLOVR) at Week 48 9/27 (33%) 17/24 (71%)<400 c/mL (TLOVR) at Week 48 13/27 (48%) 18/24 (75%)Data Source: ING112961 Cohort I Week 96/Cohort II Week 48 CSR Table 7.31, Table 7.11, and Table 7.14
a. p=0.017 for treatment difference was derived using multivariate linear regression model (F-test) by adjusting for Baseline viral load, DTG FC, IN genotypic pathway, PSS of failing background regimen.
To approximate the response rate expected with Snapshot (MSDF), virologic response rates using the MDF (Missing and Discontinuation = Failure) analysis (Table 19) and details on treatment switches are presented below.

CONFIDENTIALModule 2.7.3 Summary of Clinical Efficacy
53
Table 19 Proportion of Subjects with Plasma HIV-1 RNA <50 c/mL by Visit (MDF Analysis)
Visit ING112961
Cohort I (n=27)DTG 50 mg once daily + BR
n (%)
Cohort II (n=24)DTG 50 mg BID + BR
n (%)
Baseline 0 0
Day 6-8 1 (4) 1 (4)
Day 11 3 (11) 4 (17)
Day 21 5 (19) 6 (25)
Week 4 10 (37) 12 (50)
Week 8 10 (37) 15 (63)
Week 12 12 (44) 16 (67)
Week 16 12 (44) 18 (75)
Week 20 9 (33) 18 (75)
Week 24 12 (44) 17 (71)
Week 32 10 (37) 20 (83)
Week 40 10 (37) 16 (67)
Week 48 9 (33) 16 (67)
Week 60 9 (33)
Week 72 9 (33)
Week 84 8 (30)
Week 96 7 (26)
Data Source: ING112961 Cohort I Week 96/Cohort II Week 48 CSR Table 7.26
Two subjects had an on-therapy switch of ART prior to Week 48.
Subject 1811 from Cohort I (DTG 50 mg once daily) on ABC and TDF switched to Truvada and DRV/RTV on Day 24. This subject never achieved plasma HIV-1 RNA suppression to <50 c/mL prior to withdrawal for PDVF and is therefore an non-responder in the MDF and snapshot analyses.
Subjects 2415 from Cohort II (DTG 50 mg BID) added MVC on Day 65. This subject achieved a plasma HIV-1 RNA <400 c/mL at Week 48 and has continued on study, but never achieved plasma HIV-1 RNA suppression to <50 c/mL and is therefore an non-responder in the MDF and snapshot analyses.
DTG exerted potent antiviral activity in highly treatment-experienced, RAL-resistant subjects. An improved Week 48 response rate was observed in Cohort II. The Cohort II efficacy and safety supported the higher potency of DTG 50 mg BID in this highly treatment experienced, INI resistant patient population.
3. COMPARISON AND ANALYSES OF RESULTS ACROSS STUDIES
Data from these studies provide evidence of the efficacy of DTG for the treatment of HIV infection in ART-naive, ART-experienced and INI-resistant adult populations. In this section, efficacy data are not integrated due to significant variations in study designs,

CONFIDENTIALModule 2.7.3 Summary of Clinical Efficacy
54
patient populations, background therapy, and comparator arms (Section 1.7); therefore, efficacy data are presented in a side-by-side format for comparative purposes.
Data summarized include study population, primary and secondary efficacy endpoints, and efficacy data for specific subgroups.
Studies in INI-naive subjects:
ART-naive: ING113086 (DTG 50 mg once daily), and ING114467(DTG 50 mg+ABC/3TC),
ART-experienced: ING111762 (DTG 50 mg once daily + BR).
Studies in INI-resistant subjects:
ING112961 Cohort II DTG 50 mg BID and ING112574 (DTG 50 mg BID).
3.1. Study Populations
3.1.1. ART-Naïve subjects
In ING113086 and ING114467, the percentages of subjects from the DTG treatment arms who prematurely withdrew for any reason were 11% and 12%, respectively. Specifically, with respect to DTG treatment arms, withdrawals due to an adverse event, lack of efficacy and protocol deviation were not common (4% of subjects for each reason) (Table 20).

CONFIDENTIALModule 2.7.3 Summary of Clinical Efficacy
55
Table 20 Subject Accountability
Population ING113086 ING114467Week 48 Week 48
DTG 50 mg once daily+ 2 NRTI
RAL 400 mg BID
+ 2 NRTI
DTG 50 mg + ABC/3TC once daily
EFV/TDF/FTC once daily
All subjects screened, N 413 414 422 422Randomized, N 413 414 422 422Completion Status, n (%) Completed 0 0 0 0 Withdrawal 47 (11) 56 (14) 51 (12) 84 (20) Ongoing 364 (89) 355 (86) 363 (88) 335 (80)Premature Withdrawal, n (%) 47 (11) 56 (14) 51 (12) 84 (20)Adverse Event 8 (2) 6 (1) 10 (2) 42 (10)Lack of Efficacy 16 (4) 24 (6) 14 (3) 13 (3)Protocol Deviation 13 (3) 11 (3) 7 (2) 7 (2)Lost to Follow-Up 4 (<1) 7 (2) 14 (3) 9 (2)Subject Reached Protocol-defined
stopping criteria2 (<1) 1 (<1) 0 0
Withdrew consenta 4 (<1) 7 (2) 5 (1) 11 (3) Subject relocated 2 (<1) 1 (<1) 2 (<1) 2 (<1) Burden of/lack of access to travel 1 (<1) 0 0 0Data Source: ING113086 Week 48 CSR Table 6.1 and Table 6.3; ING114467 Week 48 CSR Table 6.1 and Table 6.4.Notes: EFV/TDF/FTC = EFV 600 mg, TDF 300 mg, FTC 200 mg in the form of Atripla. N = Number of subjects in each treatment group.
a. Sub-reasons provided where known
Overall, the percentage of protocol deviations was 6% (Table 21). The number of protocol deviations was deemed not to have significantly interfered with theinterpretation of the results. See individual CSRs for additional details on protocol deviations (ING113086 Week 48 CSR, Section 5.2, and ING114467 Week 48 CSR, Section 5.2).
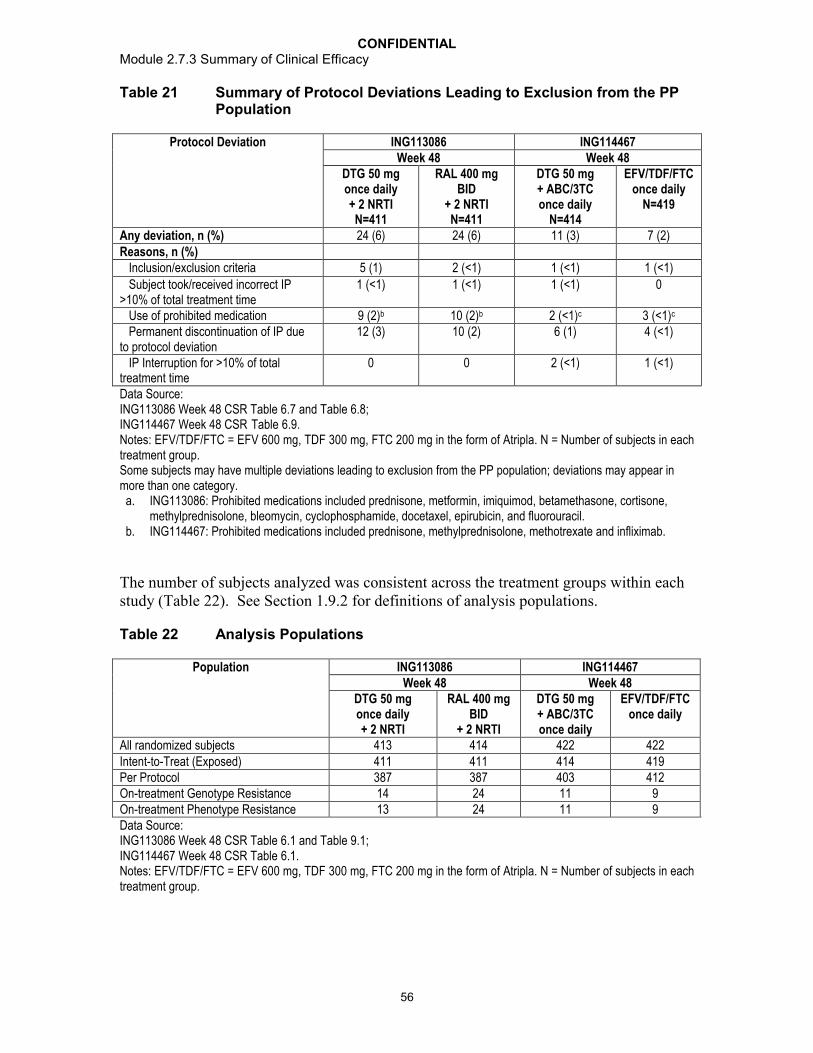
CONFIDENTIALModule 2.7.3 Summary of Clinical Efficacy
56
Table 21 Summary of Protocol Deviations Leading to Exclusion from the PP Population
Protocol Deviation ING113086 ING114467Week 48 Week 48
DTG 50 mg once daily+ 2 NRTIN=411
RAL 400 mg BID
+ 2 NRTIN=411
DTG 50 mg + ABC/3TC once daily
N=414
EFV/TDF/FTC once daily
N=419
Any deviation, n (%) 24 (6) 24 (6) 11 (3) 7 (2)Reasons, n (%) Inclusion/exclusion criteria 5 (1) 2 (<1) 1 (<1) 1 (<1)
Subject took/received incorrect IP >10% of total treatment time
1 (<1) 1 (<1) 1 (<1) 0
Use of prohibited medication 9 (2)b 10 (2)b 2 (<1)c 3 (<1)c
Permanent discontinuation of IP due to protocol deviation
12 (3) 10 (2) 6 (1) 4 (<1)
IP Interruption for >10% of total treatment time
0 0 2 (<1) 1 (<1)
Data Source: ING113086 Week 48 CSR Table 6.7 and Table 6.8; ING114467 Week 48 CSR Table 6.9.Notes: EFV/TDF/FTC = EFV 600 mg, TDF 300 mg, FTC 200 mg in the form of Atripla. N = Number of subjects in each treatment group.Some subjects may have multiple deviations leading to exclusion from the PP population; deviations may appear in more than one category.
a. ING113086: Prohibited medications included prednisone, metformin, imiquimod, betamethasone, cortisone, methylprednisolone, bleomycin, cyclophosphamide, docetaxel, epirubicin, and fluorouracil.
b. ING114467: Prohibited medications included prednisone, methylprednisolone, methotrexate and infliximab.
The number of subjects analyzed was consistent across the treatment groups within each study (Table 22). See Section 1.9.2 for definitions of analysis populations.
Table 22 Analysis Populations
Population ING113086 ING114467Week 48 Week 48
DTG 50 mg once daily+ 2 NRTI
RAL 400 mg BID
+ 2 NRTI
DTG 50 mg + ABC/3TC once daily
EFV/TDF/FTC once daily
All randomized subjects 413 414 422 422Intent-to-Treat (Exposed) 411 411 414 419Per Protocol 387 387 403 412On-treatment Genotype Resistance 14 24 11 9On-treatment Phenotype Resistance 13 24 11 9Data Source: ING113086 Week 48 CSR Table 6.1 and Table 9.1; ING114467 Week 48 CSR Table 6.1.Notes: EFV/TDF/FTC = EFV 600 mg, TDF 300 mg, FTC 200 mg in the form of Atripla. N = Number of subjects in each treatment group.

CONFIDENTIALModule 2.7.3 Summary of Clinical Efficacy
57
Overall, enrolment into each trial reflects the demographic characteristic of the general population with HIV (Table 23). There were no meaningful differences among treatment groups with respect to gender or age; median age was 35 years. The majority of subjects in both studies were male and White/Caucasian. Study ING114467 included a greater percentage of Black and Other race subjects than Study ING113086.
Table 23 Summary of Demographic Characteristics (ITT-E population)
Demographic Characteristic ING113086 ING114467DTG 50 mg once daily+ 2 NRTIN=411
RAL 400 mg BID
+ 2 NRTIN=411
DTG 50 mg + ABC/3TC once daily
N=414
EFV/TDF/FTC once daily
N=419
Age (years) Median (Range) 37
(18, 68)35
(18, 75)36
(18, 68)35
(18, 85)Sex, n (%) Male 348 (85) 355 (86) 347 (84) 356 (85)Ethnicity, n (%) Hispanic/Latino 43 (10) 52 (13) 56 (14) 56 (13)Race, n (%) African American/ African Heritage 49 (12) 39 (9) 98 (24) 99 (24) American Indian or Alaska Native 7 (2) 9 (2) 13 (3) 17 (4) Asian - 6 (1) 10 (2) 9 (2) 9 (2) Central/ South Asian Heritage 2 (<1) 0 2 (<1) 3 (<1) Japanese/ East Asian/ Southeast Asian 4 (<1) 10 (2) 7 (2) 6 (1) Native Hawaiian or other Pacific Islander 2 (<1) 0 0 0 White – White/Caucasian/ European Heritage 346 (84) 352 (86) 284 (69) 285 (68)Other 1 (<1) 1 (<1) 10 (2) 6 (1)
Data Source: ING113086 Week 48 CSR Table 6.9 and Table 6.10; ING114467 Week 48 CSR Table 6.10 and Table 6.11.Notes: EFV/TDF/FTC = EFV 600 mg, TDF 300 mg, FTC 200 mg in the form of Atripla. N = Number of subjects in each treatment group.
Other Baseline characteristics were well distributed across the studies and treatment arms(Table 24). Median Baseline HIV-1 RNA ranged from 4.52 to 4.70 log10 c/mL, and median Baseline CD4+ cell count ranged from 332 to 362 cells/mm3. Overall, most subjects had negative test results at screening for hepatitis B virus (HBV) and hepatitis C virus (HCV) infection (87% to 93%), and were in CDC Class A (83% to 87%).

CONFIDENTIALModule 2.7.3 Summary of Clinical Efficacy
58
Table 24 Summary of Baseline Characteristics (ITT-E population)
Baseline Characteristic ING113086 ING114467DTG 50 mg once daily+ 2 NRTIN=411
RAL 400 mg BID
+ 2 NRTI N=411
DTG 50 mg+ ABC/3TC once daily
N=414
EFV/TDF/FTC once daily
N=419Baseline HIV-1 RNA (log10 c/mL)
Median (range) 4.52(1.59, 6.61)
4.58(2.67,6.70)
4.67(3.06, 6.46)
4.70(2.48, 6.35)
Baseline HIV-1 RNA (c/mL), n (%)
100,000 297 (72) 295 (72) 280 (68) 288 (69)
>100,000 114 (28) 116 (28) 134 (32) 131 (31)Baseline CD4+ cellcounts cells/mm3
Median CD4+ (range) 359.0(19, 1119)
362.0(19, 1033)
331.5(19, 1022)
339.0(19, 1320)
Baseline CD4+ (cells/mm3), n (%) <50 8 (2) 6 (1) 13 (3) 14 (3) 50 to <200 47 (11) 44 (11) 44 (11) 48 (11) 200 to <350 144 (35) 139 (34) 163 (39) 159 (38) 350 to <500 126 (31) 136 (33) 131 (32) 128 (31)
500 86 (21) 86 (21) 63 (15) 70 (17)
<300 - - - -
300 - - - -
Hepatitis B & C test results, n (%)a
B only 7 (2) 8 (2) 1 (<1) 1 (<1) C only 41 (10) 35 (9) 27 (7) 29 (7) B and C 1 (<1) 0 0 0 Neither 359 (87) 363 (89) 385 (93) 385 (92) Missing 3 (<1) 4 (<1) 1 (<1) 4 (<1)CDC Category, n (%) A: Asymptomatic or lymphadenopathy or acute HIV
359 (87) 347 (84) 343 (83) 350 (84)
B: Symptomatic, not AIDS 43 (10) 55 (13) 53 (13) 52 (12) C: AIDS 9 (2) 9 (2) 18 (4) 17 (4)NRTI backbone TDF/FTC 242 (59) 247 (60) - 419 ABC/3TC 169 (41) 164 (40) 414 -Data Source: ING113086 Week 48 CSR Table 6.12, Table 6.13, Table 6.20, Table 6.21, and Table 6.26; ING114467 Week 48 CSR Table 6.13, Table 6.14, Table 6.21, and Table 6.22.Notes: EFV/TDF/FTC = EFV 600 mg, TDF 300 mg, FTC 200 mg in the form of Atripla. N = Number of subjects in eachtreatment group.a. ING113086: Denominator reflects subjects with result for Hepatitis B or Hepatitis C (RAL N=410).

CONFIDENTIALModule 2.7.3 Summary of Clinical Efficacy
59
3.1.2. ART-Experienced, INI-Naïve Subjects
In ING111762, the percentage of subjects from the DTG treatment arm who prematurely withdrew for any reason was 14%. Specifically, withdrawal due to an adverse event, lack of efficacy and protocol deviation was not common (4% of subjects for each reason in the DTG Arm) (Table 25).
Due to the challenge of finding this patient population, enrollment occurred over a 15 month period (November 2010 – January 2012). Therefore, by the time of this Week 24 analysis, a total of 111 subjects (31%) in the RAL group had completed theWeek 48 visit and were discontinued from the study as planned. Additionally 137 subjects (42%) in the DTG arm had completed the Week 48 visit and continued in the Open Label Phase of the study (ING111762 Week 24 CSR Table 6.5).
Table 25 Subject Accountability (mITT-E Population)
Population ING111762DTG 50 mg
once daily +BRn (%)
RAL 400 mg BID +BR
n (%)
Total
n (%)Completion Status
Completed, n (%)a 1 (<1) 111 (31) 112 (16)Ongoing at time of analysis, n (%)b 305 (86) 189 (52) 494 (69)Withdrawal, n (%) 48 (14) 61 (17) 109 (15)
Primary Reason for WithdrawalAdverse Event 3 (<1) 12 (3) 15 (2)Lack of Efficacy (Virologic Failure) 15 (4) 26 (7) 41 (6)Protocol Deviationc 10 (3) 6 (2) 16 (2)
Prohibited medication use 2 (<1) 2 (<1) 4 (<1)Non-compliance with IP treatment 3 (<1) 1 (<1) 4 (<1)Prohibited ART 5 (1) 1 (<1) 6 (<1)Non-compliance with protocol procedures 0 1 (<1) 1 (<1)
Subject met the GSK defined Liver Chemistry Stopping Criteriad
5 (1) 1 (<1) 6 (<1)
Lost to Follow-Upc 5 (1) 10 (3) 15 (2)Subject was incarcerated 0 1 (<1) 1 (<1)
Investigator discretion 1 (<1) 2 (<1) 3 (<1)Withdrew Consentc 9 (3) 4 (1) 13 (2)
Subject relocated 1 (<1) 2 (<1) 3 (<1)Burden of time / travel 1 (<1) 1 (<1) 2 (<1)
Data Source: ING111762 Week 24 CSR Table 6.3 a. Based on subjects completing study: defined as 1) completing the Randomized Phase and not enrolling in the
Open-label Phase or 2) completing the Randomized Phase, continuing into and completing the Open-label Phase
b. Includes subjects still in the Randomized Phase or participating in the Open-label Phase c. Sub-reasons provided where known.d. Subjects who were withdrawn from the study due to meeting GSK-defined liver chemistry stopping criteria are
discussed in ING111762 Week 24 Section 8.7.2.
A total of 53 (7%) subjects had protocol deviations leading to exclusion from the per protocol analyses (DTG: 31; RAL: 22) (Table 26). The number of protocol deviations was deemed not to have significantly interfered with the interpretation of the results. See

CONFIDENTIALModule 2.7.3 Summary of Clinical Efficacy
60
CSR for additional details on protocol deviations (ING111762 Week 24 CSR, Section 5.2).
Table 26 Summary of Protocol Deviations (mITT-E Population) Leading to Exclusion from the Per Protocol Population
Protocol Deviationsa ING111762DTG 50 mg
once daily +BRN=354n (%)
RAL 400 mgBID + BR
N=361n (%)
Total
N=715n (%)
Any deviation 31 (9) 22 (6) 53 (7)Other incorrect ART regimensb 15 (4) 4 (1) 19 (3)Permanent discontinuation of IP due to protocol deviationc 10 (3) 6 (2) 16 (2)Inclusion/Exclusion Criteria 6 (2) 3 (<1) 9 (1)Use of prohibited non-ART medication potentially impacting IP exposure
1 (<1) 5(1) 6 (<1)
Non-permitted change of ARTd 1 (<1) 4 (1) 5 (<1)
IP interruption for >10% of total treatment time 2 (<1) 2 (<1) 4 (<1)
Use of prohibited ART combinations potentially impacting IP exposure
1 (<1) 2 (<1) 3 (<1)
Data Source: ING111762 Week 24 CSR Table 6.9a. Some subjects may have multiple deviations leading to exclusion from the PP population; deviations may
appear in more than one category.b. Includes subjects with Screening PSSf to BR of 0 (DTG: 8, RAL: 2) (or results unable to be obtained) and
subjects receiving more than 2 ART in their BR (DTG: 7, RAL: 2).c. Primarily for non-compliance with IP or use of prohibited ARTd. Includes but is not limited to switches to correct the number of BR components and switches to correct
improperly administered etravirine (incorrectly administered in the absence of a boosted PI)
The number of subjects analyzed was consistent across the treatment groups with the exception of the PDVF populations where there were higher percentages of subjects in the RAL treatment group contributing to these populations (Table 27). See Section 1.9.2for definitions of analysis populations.
Table 27 Populations Analyzed
Populations ING111762DTG 50 mg
once daily + BRN (%)
RAL 400 mg BID + BR
N (%)
Total
All Subjects Screeneda 360 (50) 364 (50) 1441Randomized 360 (50) 364 (50) 724Intent-to-Treat Exposed 357 (50) 362 (50) 719Modified Intent-to-Treat Exposedb 354 (50) 361 (50) 715Per-Protocol at Week 24 323 (49) 339 (51) 662Week 24 PDVF Genotypic 11 (26) 31 (74) 42Week 24 PDVF Phenotypic 11 (27) 30 (73) 41Data Source: ING111762 Week 24 CSR Table 6.1a. 717 (50%) subjects were screened and not randomizedb. Four subjects (DTG: 3; RAL: 1) from one site in Russia (Site 083523, Investigator 096536) were removed from
the ITT-E Population following site closure due to GCP non-compliance on another ViiV sponsored study.

CONFIDENTIALModule 2.7.3 Summary of Clinical Efficacy
61
The study population was very diverse in both race and gender, with 42% African American / African heritage and 32% female subjects. Of the 230 women entered in the study, 138 (60%) were enrolled in countries outside of North America and Europe (Data Source: ING111762 Week 24 CSR Table 6.23). The majority of non-white subjects were enrolled in North America (44%) and non-European countries (52%). The median age of the mITT-E population was 43.0 years (Table 28). Twelve (2%) subjects (DTG: 6; RAL: 6) were 65 years of age (Data Source: ING111762 Week 24 CSR Table 7.8).
Table 28 Summary of Demographic Characteristics (mITT-E population)
Demographic Characteristic ING111762DTG 50 mg
once daily + BRN=354
RAL 400 mgBID + BR
N=361
Total
N=715Age In Years, median (range) 42.0 (21-69) 43.0 (18-73) 43.0 (18-73)Sex, n (%)
Male 247 (70) 238 (66) 485 (68)Female 107 (30) 123 (34) 230 (32)
Ethnicity, n (%)Hispanic/Latino 135 (38) 119 (33) 254 (36)Not Hispanic/Latino 219 (62) 242(67) 461(64)
Race, n (%) African American/African Heritage 143 (41) 160 (44) 303 (42)American Indian or Alaska Native 10 (3) 17 (5) 27 (4)Asian 9 (3) 6 (2) 15 (2)
Central/South Asian Heritage 2 (<1) 2 (<1) 4 (<1)Japanese/East Asian Heritage/Southeast Asian Heritage
7 (2) 4 (1) 11 (2)
Native Hawaiian or other Pacific Islander 1 (<1) 0 1 (<1)White – White/Caucasian/European Heritage 175 (50) 172(48) 347(49) Other/Mixed Race 12 (3) 2 (<1) 14 (2)
Data Source: ING111762 Week 24 Table 6.10, Table 6.11 and Table 6.12
Baseline characteristics were well balanced across the treatment groups (Table 29). Study subjects had relatively advanced HIV-1 disease with a median Baseline CD4+ cell count of 200 cells/mm3 and almost half of the study population having CDC Category C Classification at entry. Subjects predominantly had HIV-1 subtype B (68%) and C (14%). In other subjects, a variety of subtypes were seen in small numbers, including A1, AB, AE, AG, BF, CD, complex, F, F1, and G (Data Source: ING111762 Week 24 CSR, Section 5.4).

CONFIDENTIALModule 2.7.3 Summary of Clinical Efficacy
62
Table 29 Summary of Baseline Characteristics (mITT-E population)
Baseline Characteristic ING111762DTG 50 mg
once daily + BRN=354
RAL 400 mgBID + BR
N=361
Total
N=715Baseline HIV-1 RNA (log10 c/mL)Median plasma HIV-1 RNA (range) 4.17 (1.59, 6.79) 4.21 (1.59, 6.54) 4.18 (1.59, 6.79)HIV-1 RNA c/mL, n (%)
<1,000 45 (13) 50 (14) 95 (13)1,000 to <10,000 111 (31) 103 (29) 214 (30)10,000 to <50,000 93 (26) 101 (28) 194 (27)50,000 to 100,000 38 (11) 34 (9) 72 (10)>100,000 67 (19) 73 (20) 140 (20)
Baseline CD4+ (cells/mm3)Median CD4+ (range) 204.5 (19.0, 1017.0) 193.0 (19.0, 1219.0) 200.0 (19.0, 1219.0)CD4+ (cells/mm3), n (%)
<50 62 (18) 59 (16) 121 (17)50 to <200 111 (31) 125 (35) 236 (33)200 to <350 82 (23) 79 (22) 161 (23)350 to <500 56 (16) 59 (16) 115 (16)
500 43 (12) 39 (11) 82 (11)
Hepatitis B & C test results, n (%)B only 17 (5) 16 (4) 33 (5)C only 31 (9) 48 (13) 79 (11)B and C 1 (<1) 1 (<1) 2 (<1)Neither 288 (81) 271 (75) 559 (78)Missing 17 (5) 25 (7) 42 (6)
CDC Category, n (%)A: Asymptomatic or lymphadenopathy or acute HIV
111 (31) 114 (32) 225 (31)
B: Symptomatic, not AIDS 70 (20) 89 (25) 159 (22)C: AIDS 173 (49) 158 (44) 331 (46)
HIV-1 Cladea, n (%)B 241 (68) 245 (68) 486 (68)C 55 (16) 48 (13) 103 (14)Other 57 (16) 68 (19) 125 (17)
Data Source: ING111762 Week 24 CSR Table 6.13, Table 6.14, Table 6.21, Table 6.22, and Table 6.52a. Clades are at PR/RT mutation region, and there were no assessments of clades at IN mutation region at
Baseline.
Prior ART
Of the 715 subjects in the mITT-E Population, 714 subjects had received any ART prior to entering the study (Table 30). One ART-naive subject was randomized based on transmitted resistance and thus had no prior ART listed. This subject enrolled in the study prior to protocol amendment 1, where inclusion criteria were updated to clarify that only ART-experienced subjects could enter the study.
Overall, subjects enrolled in this study had prior treatment with a broad range of ART (Table 30). In line with this high use of various ART, 47% of subjects had previously been exposed to drugs in three or more ART classes (ING111762 Week 24 CSR Table 6.32).

CONFIDENTIALModule 2.7.3 Summary of Clinical Efficacy
63
See ING111762 Week 24 CSR Section 5.6.1 for detail.
Table 30 Summary of Prior ART (mITT-E Population)
DTG 50 mg once daily + BR
N=354
RAL 400 mgBID + BR
N=361
Total
N=715Median Duration in Weeks, (range)
Any ART in All Subjects n= 354
345.2 (17.3, 1657.6)n=360
309.6 (15.9, 1396.1)n=714
331.6 (15.9, 1657.6)Any ART Subjects with 2-Class Resistance at BL
n=185283.4 (23.0, 1657.6)
n=179262.1 (17.7, 1256.4)
n=364276.6 (17.7, 1657.6)
Any ART Subjects with 3-Class or More resistance at BL
n=169432.3 (17.3, 1416.1)
n=181358.7 (15.9, 1396.1)
n=350387.7 (15.9, 1416.1)
Number of Prior ART taken, No. (%) SubjectsNo. of Any ART takenAny ARTI 354 (100) 360 (>99) 714 (>99)
1 0 1 (<1) 1 (<1)2 7 (2) 7 (2) 14 (2)3 116 (33) 103 (29) 219 (31)4 43 (12) 49 (14) 92 (13)5 37 (10) 44 (12) 81 (11)6 151 (43) 156 (43) 307 (43)
No. of NRTIs takenAny NRTI 354 (100) 360 (>99) 714 (>99)
1 11 (3) 12 (3) 23 (3)2 138 (39) 134 (37) 272 (38)3 56 (16) 53 (15) 109 (15)4 149 (42) 161 (45) 310 (43)
No. of NNRTIs takenAny NNRTI 295 (83) 309 (86) 604 (84)
1 238 (67) 245 (68) 483 (68)2 57 (16) 64 (18) 121 (17)
No. of PIs takenAny PI 204 (58) 222 (61) 426 (60)
1 82 (23) 94 (26) 176 (25)2 56 (16) 56 (16) 112 (16)3 32 (9) 26 (7) 58 (8)4 34 (10) 46 (13) 80 (11)
No. of Fusion Inhibitors takenAny Fusion inhibitor 17 (5) 12 (3) 29 (4)
1 17 (5) 12 (3) 29 (4)No. of CCR5 antagonist takenAny CCR5 antagonist 4 (1) 10 (3) 14 (2)
1 4 (1) 10 (3) 14 (2)No. of Other ART takenAny Other ART 4 (1) 5 (1) 9 (1)
1 4 (1) 4 (1) 8 (1)2 0 1 (<1) 1 (<1)
No. of INIs takenAny INI 0 1 (<1) 1 (<1)
1 0 1 (<1) 1 (<1)Data Source: ING111762 Week 24 CSR Table 6.28, Table 6.29, Table 6.30 and Table 6.31

CONFIDENTIALModule 2.7.3 Summary of Clinical Efficacy
64
Baseline Genotypic and Phenotypic Resistance
Baseline resistance testing indicated that overall, similar proportions of subjects had 2-class resistance (364/715; 51%) versus 3-class resistance or more (351/715; 49%) (Table 31).
Table 31 Summary of Baseline Resistance: Number of Drug Classes to which Subjects are Resistant (mITT-E Population)
ING111762
Baseline Resistance DTG 50 mg once daily + BR
N=354n (%)
RAL 400 mg BID + BR
N=361n (%)
Total
N=715n (%)
2 Class Resistance 185 (52) 179 (50) 364 (51)
3 Class Resistance 125 (35) 149 (41) 274 (38)
4 Class Resistance 40 (11) 30 (8) 70 (10)
5 Class Resistance 4 (1) 3 (<1) 7 (<1)
Data Source: ING111762 Week 24 CSR Table 6.33
Background Regimen
Background regimens received during the treatment phase of the study were diverse with over 60 different individual regimens being prescribed (Table 32). Eight-five percent (n=605) of subjects were on a boosted PI regimen (Data Source: ING111762 Week 24 CSR Table 6.35). Darunavir/ritonavir (DRV/RTV) was the most commonly administered ART in Europe and North America (74% and 60% respectively), but was only administered to 16% of subjects in the Rest of World region including no use in the Russian Federation or South Africa (Data Source: ING111762 Week 24 CSR Table 6.36), likely reflecting lower levels of access to more recently approved ART in these countries.
Table 32 Summary of Background Antiretroviral Regimen (>=5% in any treatment arm) – mITT-E Population
Background Regimen DTG 50 mgonce daily + BR
N=354n (%)
RAL 400 mgBID + BR
N=361n (%)
Total
N=715n (%)
darunavir/ritonavir, tenofovir 62 (18) 73 (20) 135 (19)lopinavir/ritonavir. tenofovir 40 (11) 40 (11) 80 (11)darunavir/ritonavir, etravirine 33 (9) 40 (11) 73 (10)lopinavir/ritonavir 36 (10) 35 (10) 71 (10)atazanavir/ritonavir, tenofovir 36 (10) 33 (9) 69 (10)darunavir/ritonavir, maraviroc 23 (6) 19 (5) 42 (6)Data Source: ING111762 Week 24 CSR Table 6.35
The study design presented a risk that recruitment of many subjects with resistance to only two classes of ART (most likely to NRTIs and NNRTIs but not PIs) may have highly potent background therapy available to them (i.e. DRV/RTV) such that the

CONFIDENTIALModule 2.7.3 Summary of Clinical Efficacy
65
contribution to virologic success by DTG would be difficult to assess. When enrolment was complete, similar numbers of subjects received DRV/RTV in both the presence and the absence of primary PI mutations and the cap of 170 for DRV/RTV in the absence of primary PI mutations was not reached (Table 33).
Table 33 Summary of Darunavir Use in Background ART Regimen
DRV/RTV Use DTG 50 mg once daily + BR
N=354n (%)
RAL 400 mg BID + BR
N=361n (%)
Total
N=715n (%)
No 214 (60) 209 (58) 423 (59)Yes, with Primary PI Mutations 69 (19) 74 (20) 143 (20)Yes, without Primary PI Mutations 71 (20) 78 (22) 149 (21)Data Source: ING111762 Week 24 CSR Table 6.38
3.1.3. ART-Experienced, INI-Resistant Subjects
In the studies with INI-resistant subjects, ING112961 and ING112574, the percentages of subjects from the DTG treatment arms who prematurely withdrew for any reason ranged from 15% to 21%. The primary reason for withdrawal across both studies was lack of efficacy (8% to 10%) with few subjects withdrawing for AE (2% to 8%) (Table 34).
Table 34 Summary of Subject Disposition in ART-Experienced, INI-Resistant Studies
ING112961 ING112574Week 48 Cohort II ITT-E Week 24 ITT-E
DTG 50 mg BID + BR
N=24
DTG 50 mg BID + BR
N=183
DTG 50 mg BID + BR
N=114All subjects screened, N 30 323Completion Status, n (%)Completed 0 0 0Withdrawal 5 (21) 28 (15) 24 (21)Ongoing 19 (79) 155 (85) 90 (79)Primary reason for Withdrawal, n (%)Adverse Event 2 (8) 4 (2) 4 (4)Lack of Efficacy 2 (8) 19 (10) 15 (13) Insufficient viral load response 2 (8) 0 0
Disease progressed/progression 0 1 (<1) 0Insufficient CD4+ cell response 0 1 (<1) 1 (<1)Virological failure 0 18 (10) 15 (13)
Protocol deviation 1 (4) 2 (1) 2 (2)Non-compliance with IP treatment 1 (4) 2 (1) 2 (2)
Subject reached protocol-defined stopping criteria 0 1 (<1) 1 (<1)Subject met the GSK defined Liver Chemistry Stopping Criteria
0 1 (<1) 1 (<1)
Lost to follow-up 0 2 (1) 2 (2)Data Source: ING112961 Cohort II Week 48 CSR Table 6.5; ING112574 Week 24 CSR Table 6.3 and Table 6.4.Note: Subjects could have more than one Sub-reason or no sub-reason indicated for withdrawal. No subject withdrew for fatal AE, one subject died of progressive multifocal leucoencephalopathy (PML) post-study discontinuation.
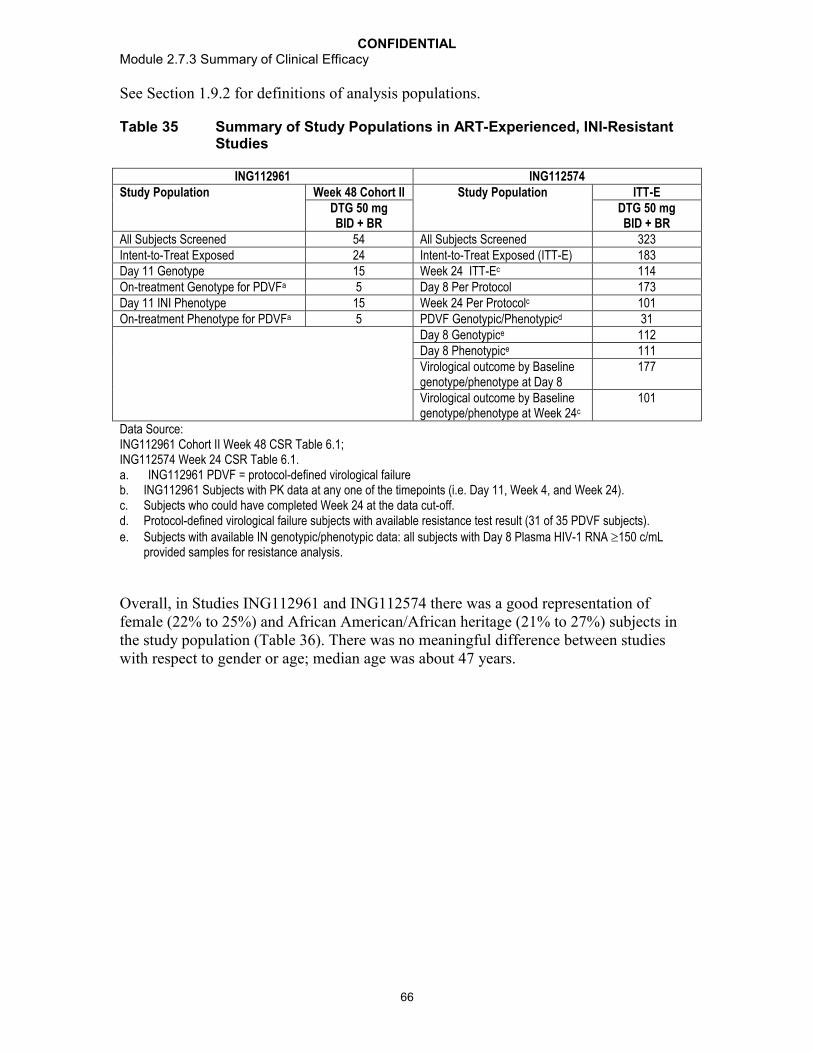
CONFIDENTIALModule 2.7.3 Summary of Clinical Efficacy
66
See Section 1.9.2 for definitions of analysis populations.
Table 35 Summary of Study Populations in ART-Experienced, INI-Resistant Studies
ING112961 ING112574Study Population Week 48 Cohort II Study Population ITT-E
DTG 50 mg BID + BR
DTG 50 mg BID + BR
All Subjects Screened 54 All Subjects Screened 323Intent-to-Treat Exposed 24 Intent-to-Treat Exposed (ITT-E) 183Day 11 Genotype 15 Week 24 ITT-Ec 114On-treatment Genotype for PDVFa 5 Day 8 Per Protocol 173Day 11 INI Phenotype 15 Week 24 Per Protocolc 101On-treatment Phenotype for PDVFa 5 PDVF Genotypic/Phenotypicd 31
Day 8 Genotypice 112Day 8 Phenotypice 111Virological outcome by Baselinegenotype/phenotype at Day 8
177
Virological outcome by Baselinegenotype/phenotype at Week 24c
101
Data Source: ING112961 Cohort II Week 48 CSR Table 6.1; ING112574 Week 24 CSR Table 6.1.a. ING112961 PDVF = protocol-defined virological failureb. ING112961 Subjects with PK data at any one of the timepoints (i.e. Day 11, Week 4, and Week 24).c. Subjects who could have completed Week 24 at the data cut-off.d. Protocol-defined virological failure subjects with available resistance test result (31 of 35 PDVF subjects).e. Subjects with available IN genotypic/phenotypic data: all subjects with Day 8 Plasma HIV-1 RNA 150 c/mL
provided samples for resistance analysis.
Overall, in Studies ING112961 and ING112574 there was a good representation of female (22% to 25%) and African American/African heritage (21% to 27%) subjects in the study population (Table 36). There was no meaningful difference between studieswith respect to gender or age; median age was about 47 years.
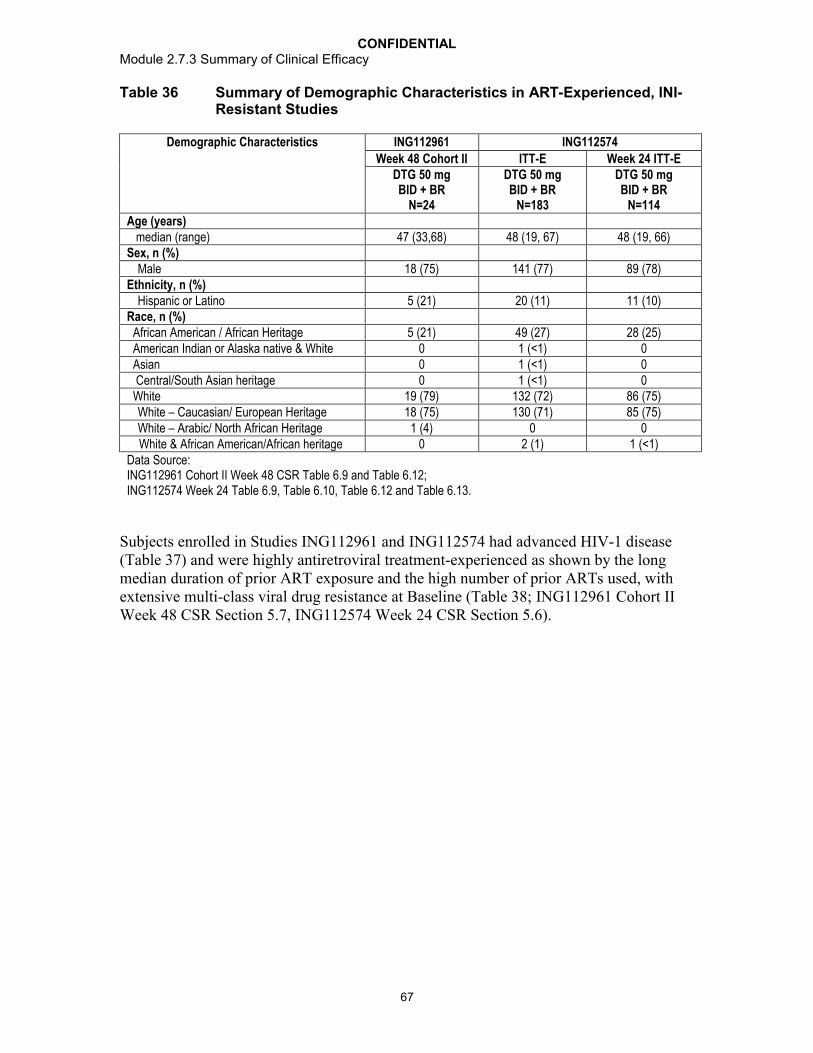
CONFIDENTIALModule 2.7.3 Summary of Clinical Efficacy
67
Table 36 Summary of Demographic Characteristics in ART-Experienced, INI-Resistant Studies
Demographic Characteristics ING112961 ING112574
Week 48 Cohort II ITT-E Week 24 ITT-EDTG 50 mg BID + BR
N=24
DTG 50 mg BID + BR
N=183
DTG 50 mg BID + BR
N=114Age (years) median (range) 47 (33,68) 48 (19, 67) 48 (19, 66)Sex, n (%)
Male 18 (75) 141 (77) 89 (78)Ethnicity, n (%)
Hispanic or Latino 5 (21) 20 (11) 11 (10)Race, n (%) African American / African Heritage 5 (21) 49 (27) 28 (25) American Indian or Alaska native & White 0 1 (<1) 0 Asian 0 1 (<1) 0 Central/South Asian heritage 0 1 (<1) 0 White 19 (79) 132 (72) 86 (75)
White – Caucasian/ European Heritage 18 (75) 130 (71) 85 (75)White – Arabic/ North African Heritage 1 (4) 0 0
White & African American/African heritage 0 2 (1) 1 (<1)Data Source: ING112961 Cohort II Week 48 CSR Table 6.9 and Table 6.12; ING112574 Week 24 Table 6.9, Table 6.10, Table 6.12 and Table 6.13.
Subjects enrolled in Studies ING112961 and ING112574 had advanced HIV-1 disease (Table 37) and were highly antiretroviral treatment-experienced as shown by the long median duration of prior ART exposure and the high number of prior ARTs used, with extensive multi-class viral drug resistance at Baseline (Table 38; ING112961 Cohort II Week 48 CSR Section 5.7, ING112574 Week 24 CSR Section 5.6).

CONFIDENTIALModule 2.7.3 Summary of Clinical Efficacy
68
Table 37 Summary of Baseline Characteristics in ART-experienced, INI-resistant Studies
Baseline Characteristics ING112961 ING112574Week 24 Cohort II ITT-E Week 24 ITT-E
DTG 50 mg BID + BR
N=24
DTG 50 mg BID + BR
N=183
DTG 50 mg BID + BR
N=114CDC Classification, n (%)A: Asymptomatic or lymphadenopathy or acute HIV
10 (42) 44 (24) 21 (18)
B: Symptomatic, not AIDS 6 (25) 37 (20) 26 (23)C: AIDS 8 (33) 102 (56) 67 (59)Median plasma HIV-1 RNA (range) 4.26 (3.32, 5.84) 4.384 (1.59, 7.37) 4.443 (2.20, 7.37)Median CD4+ cell count (range) 202 (19, 528) 140.0 (19, 1100) 120.0 (19, 720)Hepatitis Status, n (%)Hepatitis B Surface Antigen (HBsAg) positive 2 (9) 10 (5) 5 (4)HCV antibody positive 6 (26) 26 (14) 18 (16)HBV or HCV status missing 2 (9) 0 0HBsAg and HCV antibody positive 0 2 (1) 1 (<1)Data Source: ING112961 Cohort II Week 48 CSR Table 6.13, Table 6.14, Table 6.21, and Table 6.23;ING112574 Week 24 CSR Table 6.15, Table 6.16, Table 6.17, Table 6.18, Table 6.26, Table 6.27, Table 6.28, and Table 6.29.
Table 38 Number and Duration of Prior ART in ART-experienced, INI-resistant Studies
ING112961 ING112574Week 24Cohort II ITT-E Week 24 ITT-E
DTG 50 mg BID + BR
N=24
DTG 50 mg BID + BR
N=183
DTG 50 mg BID + BR
N=114Median Number of prior ART (range) 15 (6, 19) 14 (3, 23) 14 (3, 23)Median Duration (years) of prior ART (range) 15 (3, 22) 13 (4, 25) 13 (7, 25)Prior use of ART by class: n (%)
3 PIs 21 (88) 135 (74) 83 (73)
2 NNRTIs 12 (62) 108 (59) 71 (62)
3 NRTIs 24 (100) 164 (90) 103 (90)
Prior ART used in later lines of therapy: n (%)ETR 11 (46) 103 (56) 70 (61)DRV/RTV 14 (58) 133 (76) 85 (78)enfuvirtide 13 (54) 88 (49) 59 (53)maraviroc 9 (38) 58 (32) 41 (36)Data Source: ING112961 Week Cohort II Week 48 CSR Table 6.28, and Table 6.30; ING112574 Week 24 CSR Table 6.34, Table 6.35, Table 6.37, and Table 6.38.
Prior INI and Baseline IN Resistance
There was a good representation of all major integrase resistance pathways at Baseline (Table 39). Limited cross resistance between DTG and RAL was seen in the study population with a much lower median DTG FC compared to RAL.

CONFIDENTIALModule 2.7.3 Summary of Clinical Efficacy
69
Table 39 Prior INI and Baseline IN Resistance in ART-experienced, INI-resistant Studies
Baseline Characteristics ING112961 ING112574Week 24 Cohort II ITT-E Week 24 ITT-E
DTG 50 mg BID + BR
N=24
DTG 50 mg BIDBID + BR
N=183
DTG 50 mg BID BID + BR
N=114Raltegravir or EVG Treatment status, n (%)Ongoing at screening 20 (83) 101 (55) 58 (51)Discontinued prior to screening 4 (17) 82 (45) 56 (49)Median Duration (months) of prior RAL (range) 29.44 (10.3, 62.5) 29 (2, 132) 25 (2, 132)Median Duration (months) of prior EVG (range) 3.78
(only one subject)17 (11, 26) 17 (13, 26)
Evidence of genotypic primary IN resistance at Baseline, n (%)Primary IN resistance detected 24 (100) 123 (67) 74 (65)Q148+1 8 (33) 32 (17) 20 (18)Q148+2 2 (8) 21 (11) 12 (11)N155 6 (25) 33 (18) 21 (18)Y143 6 (25) 28 (15) 15 (13)T66 - 1 (<1) 1 (<1)
2 Primary mutations 1 (4) 8 (4) 5 (4)
Primary not detected 1 (4) 60 (33) 40 (35)Evidence of phenotypic IN resistance at BaselineDTG Median (range) 2.72 (0.87, 9.48) 1.29 (0.45, 37.00) 1.29 (0.47, 37.00)RAL Median (range) 128 (0.78, 183) 47.50 (0.49, 127.00) 40.50 (0.49, 127.00)Data Source: ING112961 Cohort II Week 48 CSR Table 6.30, Table 12.26 and Table 12.47; ING112574 Week 24 CSR Table 6.09, Table 6.10, Table 6.37, Table 6.38, Table 7.31, Table 12.9, Table 12.41, Table 12.42, Table 12.60, and Table 12.64.
a. No EVG failures
In ING112574, in viruses with the Y143 and N155 mutational pathways, the median fold change to DTG and diversity in fold change to DTG was low in comparison to the higher median and diversity in DTG FC observed with viruses with the Q148 mutational pathway (Table 40). ING112574 enrolled sufficient range and diversity with respect to DTG FC and IN resistance patterns (respectively) allowing for an appropriate evaluation of DTG in the HIV-1 INI-resistant population.

CONFIDENTIALModule 2.7.3 Summary of Clinical Efficacy
70
Table 40 Summary of Phenotypic Susceptibility to DTG and RAL at Baselineby IN Resistant Mutation Category
DTG FCMutation Category Median IQR Range
Q148+2, n=21 10.0 4.5 ,13.0 2.56, 37.0
Q148+1, n=31 4.6 3.4, 6.3 0.47, 12.0N155, n=30 1.50 1.3 , 1.8 0.82, ,3.9Y143, n=28 1.1 0.9, 1.2 0.78, 2.0
2 primary mutations, n=7 4.6 1.7, 20.0 1.46, 27.0
Primary Not Detected n=59 0.8 1.0, 1.0 0.45, 4.0RAL FC
Mutation Category Median IQR Range
Q148+2 n=21 109.8 109.8, 109.8 11.0, 109.8
Q148+1, n=31 109.8 109.8, 109.8 1.0, 127.0N155, n=30 31.0 16.0, 59.0 0.9, 109.8Y143, n=28 109.8 109.8, 109.8 14.0, 109.8
2 primary mutations, n=7 109.8 35.0, 109.8 33.0, 109.8
Primary Not Detected, n=59 0.9 0.84, 1.2 0.49, 109.8Data Source: ING112574 Week 24 CSR Table 12.66; IQR, Interquartile RangeNote: Six subjects had missing DTG FC at Baseline
3.2. Comparison of Efficacy Results of all Studies
3.2.1. ART-Naïve subjects
3.2.1.1. Primary Efficacy Results
In treatment-naïve subjects, DTG administered once daily with two NRTIs demonstrated non-inferiority to RAL at Week 48 (ING113086) and co-administered with ABC/3TC demonstrated superiority compared to Atripla (ING114467) also at Week 48 (Table 41). Consistent response rates (i.e., HIV-1 RNA <50 c/mL; 88% for both studies) were observed across the two studies for the DTG treatment regimens. Per protocol and other sensitivity analyses in both studies supported the primary endpoint in each study.

CONFIDENTIALModule 2.7.3 Summary of Clinical Efficacy
71
Table 41 Proportion of Subjects Responding based on Plasma HIV-1 RNA <50 c/mL by Visit in ART-Naïve Studies (ITT-E Population)
Visit ING113086 ING114467Week 48/ Snapshot (MSDF) Week 48/ Snapshot (MSDF)
DTG 50 mg once daily+ 2 NRTIN=411n/N (%)
RAL 400 mg BID + 2 NRTI
N=411n/N (%)
DTG 50 mg + ABC/3TC
once dailyN=414n/N (%)
EFV/TDF/FTC once daily
N=419n/N (%)
Baseline 2 (<1) 0 0 0Week 1 - - 106 (26) 24 (6)Week 2 - - 261 (63) 59 (14)Week 4 295 (72) 266 (65) 321 (78) 146 (35)Week 8 350 (85) 323 (79) 347 (84) 227 (54)Week 12 357 (87) 340 (83) 354 (86) 288 (69)Week 16 367 (89) 342 (83) - -Week 20 - - - -Week 24 384 (93) 369 (90) 379 (92) 350 (84)Week 32 373 (91) 363 (88) 368 (89) 343 (82)Week 40 362 (88) 349 (85) 358 (86) 333 (79)Week 48 361 (88)a 351 (85) 364 (88)b 338 (81)Data Source: ING113086 Week 48 CSR Table 7.18; ING114467 Week 48 CSR Table 7.26.Notes: EFV/TDF/FTC = EFV 600 mg, TDF 300 mg, FTC 200 mg in the form of Atripla. N = Number of subjects in each treatment group.
a. 2.5 (-2.2, 7.1) Adjusted Difference (95% CI) based on Cochran-Mantel Haenszel stratified analysis adjusting for the Baseline stratification factors: Baseline HIV-1 RNA and backbone dual NRTI [Data Source: ING113086 Table 7.1]
b. 7.4 (2.5, 12.3) Adjusted Difference (95% CI) based on Cochran-Mantel Haenszel stratified analysis adjusting for the following Baseline stratification factors: Baseline plasma HIV-1 RNA ( vs >100,000 c/mL) and Baseline CD4+ cell count ( vs >200 cells/mm3). Test for superiority: p = 0.003. [Data Source: ING114467 Table 7.1].
The statistically significant difference in response rates noted in ING114467 was primarily due to lower discontinuations due to AEs on the DTG regimen. Additionally, in both ING113086 and ING114467, there were numerically fewer virologic non-responders in the DTG treatment arms compared to RAL and Atripla, respectively (Table 42).

CONFIDENTIALModule 2.7.3 Summary of Clinical Efficacy
72
Table 42 Summary of Study Outcomes <50 c/mL at Week 48 in ART-Naives –Snapshot (MSDF) Analysis (ITT-E Population)
ING113086 ING114467DTG 50 mg once daily+ 2 NRTIN=411
RAL 400 mg BID
+ 2 NRTIN=411
DTG 50 mg + ABC/3TC
once dailyN=414
EFV/TDF/FTC once daily
N=419HIV-1 RNA <50 c/mL, n (%) 361 (88) a 351 (85) 364 (88)b 338 (81)Virologic failurec 20 (5) 31 (8) 21 (5) 26 (6) Data in window not <50 c/mL 8 (2) 5 (1) 6 (1) 5 (1) Discontinued for lack of efficacy 5 (1) 13 (3) 7 (2) 9 (2) Discontinued for other reason while not <50 c/mL
2 (<1) 11 (3) 8 (2) 12 (3)
Change in ART 5 (1) 2 (<1) - -No virologic data at Week 48 window Reasons
30 (7) 29 (7) 29 (7) 55 (13)
Discontinued study/study drug due to adverse event or deathd
9 (2) 6 (1) 9 (2) 40 (10)
Discontinued study/study drug for other reasonse
21 (5) 23 (6) 20 (5) 14 (3)
Missing data during window but on study
0 0 0 1 (<1)
Data Source: ING113086 Week 48 CSR Table 7.4; ING114467 Week 48 CSR Table 7.3.
a. 2.5 (-2.2, 7.1) Adjusted Difference (95% CI) based on Cochran-Mantel Haenszel stratified analysis adjusting for the Baseline stratification factors: Baseline HIV-1 RNA and backbone dual NRTI [Data Source: ING113086 Table 7.1]
b. 7.4 (2.5, 12.3) Adjusted Difference (95% CI) based on Cochran-Mantel Haenszel stratified analysis adjusting for the following Baseline stratification factors: Baseline plasma HIV-1 RNA ( vs >100,000 c/mL) and Baseline CD4+ cell count ( vs >200 cells/mm3). Test for superiority: p = 0.003. [Data Source: ING114467 Table 7.1]
c. Includes subjects who changed BR to new class or changed BR not permitted per protocol or due to lack of efficacy prior to Week 48 (for ING113086 only), subjects who discontinued prior to Week 48 for lack or loss of efficacy and subjects who are 50 c/mL in the 48 week window.
d. Includes subjects who discontinued due to an adverse event or death at any time point from Day 1 through the Week 48 window if this resulted in no virologic data on treatment during the Week 48 window.
e. Other includes: withdrew consent, loss to follow-up, moved, etc. Notes: EFV/TDF/FTC = EFV 600 mg, TDF 300 mg, FTC 200 mg in the form of Atripla. N = Number of subjects in each treatment group
Sustained virological response was demonstrated in ING112276, in which 88% of patients receiving DTG 50 mg (n=51) once daily had HIV-1 RNA <50 c/mL, compared to 72% of patients in the EFV group (n=50) at 96 weeks. No INI-resistant mutations or treatment emergent resistance in NRTI background therapy were isolated with DTG 50 mg once daily through 96 weeks.
3.2.1.2. Secondary Efficacy Results
Time to Viral Suppression (<50 c/mL) in ART-Naïve Studies
In ING113086, subjects achieved rapid viral suppression with DTG (comparable to RAL) and once suppressed, remain suppressed through to Week 48 in treatment-naive
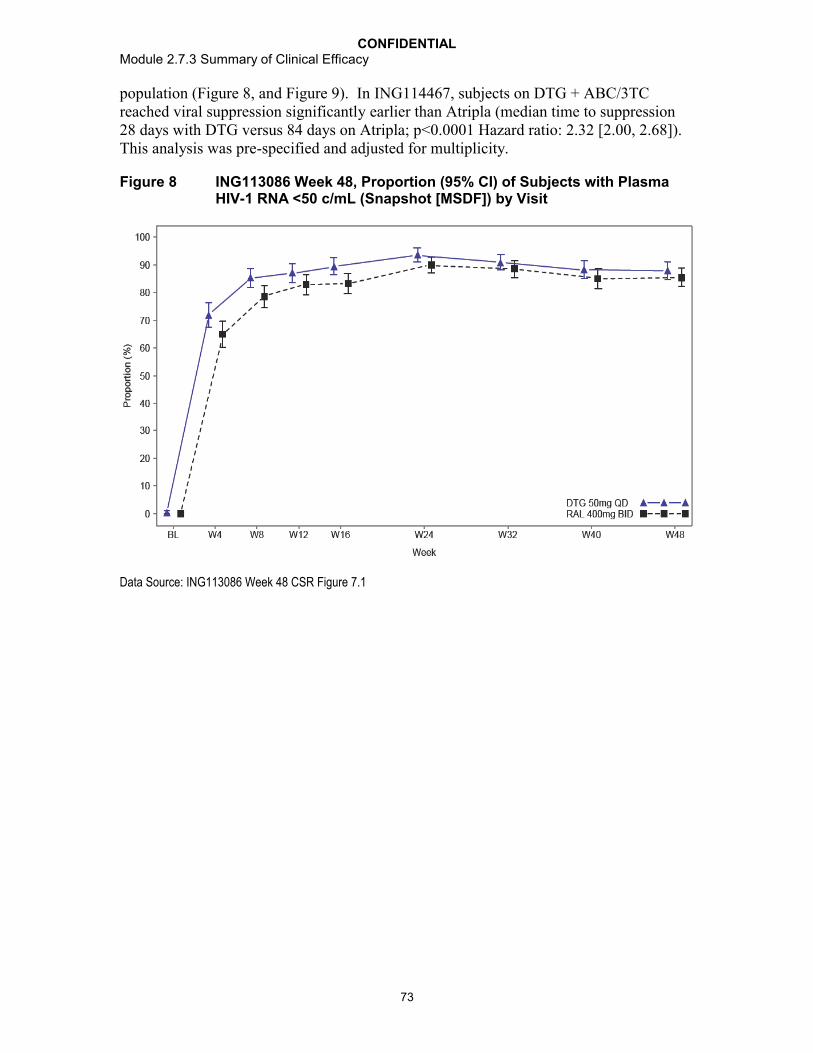
CONFIDENTIALModule 2.7.3 Summary of Clinical Efficacy
73
population (Figure 8, and Figure 9). In ING114467, subjects on DTG + ABC/3TC reached viral suppression significantly earlier than Atripla (median time to suppression 28 days with DTG versus 84 days on Atripla; p<0.0001 Hazard ratio: 2.32 [2.00, 2.68]). This analysis was pre-specified and adjusted for multiplicity.
Figure 8 ING113086 Week 48, Proportion (95% CI) of Subjects with Plasma HIV-1 RNA <50 c/mL (Snapshot [MSDF]) by Visit
Data Source: ING113086 Week 48 CSR Figure 7.1

CONFIDENTIALModule 2.7.3 Summary of Clinical Efficacy
74
Figure 9 ING114467 Week 48, Kaplan-Meier Plot of Time to Viral Suppression (Viral Load <50 c/mL)
Data Source: ING114467 Week 48 CSR Figure 7.5
CD4+ cell Counts over Time in ART-Naïve Studies
Immunologic activity over time was compared using summaries of CD4+ values and changes from Baseline at each visit. The rapid and significant viral load reductions seen with DTG containing regimens are associated with substantial and sustained CD4+ cellsincreases over 4 to 48 weeks. The median change from Baseline to Week 48 in CD4+ cells in the DTG group was +224 to +230 cells/mm3 (Table 43).
These CD4+ cell count increases were comparable with RAL (ING113086) and greater than that seen with Atripla (ING114467) (Table 43).

CONFIDENTIALModule 2.7.3 Summary of Clinical Efficacy
75
Table 43 Median (IQR)[Range] Change from Baseline in CD4+ Cell Counts (cells/mm3) by Visit in ART-Naïve Studies
Visit ING113086 ING114467Week 48 Week 48
DTG 50 mg once daily +
2 NRTIN=411
RAL 400 mg BID + 2 NRTI
N=411
DTG 50 mg + ABC/3TC
once dailyN=414
EFV/TDF/FTC once daily
N=419Baseline 359.0
(276.0, 470.0)[19, 1119]
362.0 (267.0, 469.0)
[19, 1033]
334.5 (248.0, 434.0)
[19, 1027]
339.0 (243.0, 439.0)
[19, 1123]Week 4 87.0
(26.0, 149.0)[-633, 612]
88.0 (32.0, 163.0)[-567, 710]
107.0 (46.0, 176.0)[-327, 684]
72.0 (0.0, 139.0)[-314, 830]
Week 8 107.0 (48.0, 190.0)[-282, 932]
117.5 (46.0, 204.0)[-348, 692]
144.0 (72.0, 228.0)[-262, 892]
100 (21.0, 188.0)[-274, 755]
Week 16 147.0 (69.0, 222.0)[-481, 742]
154.0 (73.5, 248.0)[-210, 990]
179.5 (86.0, 279.0) [-474, 1078]
140.0 (49.0, 226.0) [-169, 641]
Week 24 183.0 (99.5, 295)[-437, 854]
182.0 (94.0, 296.0)[-330, 896]
194.5 (101.0, 294.0)
[-396, 816]
133.0 (44.0, 233.0)[-220, 932]
Week 48 229.5 (128.0, 338.0)
[-343, 927]
230.0 (139.0, 354.0)[-148, 1046]
223.5 (103.0, 332.0)b
[-430, 1180]
152.0 (16.0, 280.0)b
[-518 748]Data Source: ING113086 Week 48 CSR Table 7.14;ING114467 Week 48 CSR Table 7.18a. ING113086: Mean change: DTG 239 cells/mm3 (SD 171.81); RAL 258 cells/mm3 (SD 178.69).b. ING114467: Mean change: DTG + ABC/3TC 238 cell/mm3 (SD 199.6); EFV/TDF/FTC 172.0 (SD 169.22).Notes: EFV/TDF/FTC = EFV 600 mg, TDF 300 mg, FTC 200 mg in the form of Atripla. N = Number of subjects in each treatment group.
In Study ING114467, using the Repeated Measures Mixed Model Analysis, DTG+ABC/3TC was statistically superior to Atripla with respect to change from Baseline in CD4+ cell count at Week 48 (Adjusted mean change from Baseline: DTG+ ABC/3TC 267 cells/mm3 and Atripla 208 cells/mm3, [33.4, 84.4] p <0.001). This analysis was pre-specified and adjusted for multiplicity.

CONFIDENTIALModule 2.7.3 Summary of Clinical Efficacy
76
Figure 10 ING114467 Adjusted Mean (95% CI) Change from Baseline in CD4+ Cell Counts (cells/mm3) Over Time
Data Source: ING114467 Week 48 CSR Figure 7.7
Incidence of disease progression (HIV-associated conditions, AIDS and death) in ART-Naïve Studies
HIV-associated conditions in subjects treated with DTG compared to RAL and Atripla were assessed over time by summaries of the incidence of post-Baseline HIV conditions, and by the proportion of subjects with disease progression. Across treatment-naïve studies, there was a similar low incidence of HIV associated conditions (1 to 3% across all treatment-naive studies; Data Source: ING113086 Week 48 CSR, Section 6.3.4 and ING114467 Week 48 CSR, Section 6.3.5), and in the number of subjects with HIV disease progression (Table 44).

CONFIDENTIALModule 2.7.3 Summary of Clinical Efficacy
77
Table 44 Summary of Post-Baseline HIV-1 Disease Progressions (ITT-E Population) in ART-Naïve Studies
Visit ING113086 ING114467Week 48 Week 48
DTG 50 mg once daily+ 2 NRTIN=411n (%)
RAL 400 mg BID
+ 2 NRTIN=411n (%)
DTG 50 mg + ABC/3TC
once dailyN=414n (%)
EFV/TDF/FTC once daily
N=419n (%)
Number of subjects progressing to Class C or Death
4 (1) 4 (1) 5 (1) 6 (1)
Class A to Class C 2 (<1) 2 (<1) 4 (<1) 2 (<1) Class B to Class C 1 (<1) 1 (<1) 0 0 Class C to new Class C 0 0 1 (<1) 2 (<1) Class A, B, or C to Death 1 (<1) 1 (<1) 0 2 (<1)Data Source: ING113086 Week 48 CSR Table 7.17; ING114467 Week 48 CSR Table 7.25.Notes: EFV/TDF/FTC = EFV 600 mg, TDF 300 mg, FTC 200 mg in the form of Atripla.
3.2.2. ART-Experienced, INI-Naïve Subjects
3.2.2.1. Principal Efficacy Results
The definitive primary endpoint for ING111762 is Week 48. The results presented here are for Week 24, which is a secondary endpoint for the study. This Week 24 interim analysis was done to support regulatory submissions globally.
The virologic suppression (HIV-1 RNA <50 c/mL) in the DTG arm (79%) was statistically superior to the RAL arm (70%), based on the Week 24 prespecified analysis of outcomes of the FDA Snapshot (MSDF) algorithm with the mITT-E Population (adjusted treatment difference and 95% CI 9.7 [3.4, 15.9], p=0.003) (Table 45).
This result is supported by the Per-Protocol analysis where 81% and 72% of DTG and RAL subjects, respectively, achieved plasma HIV-1 RNA <50 c/mL at Week 24 (treatment difference and 95% CI 9.3 [3.0, 15.7], Data Source: ING111762 Week 24 CSR Table 7.2). An analysis using an alternate variance formula for the CI gave results matching those of the main Week 24 analysis (Data Source: ING111762 Week 24 CSRTable 7.3).

CONFIDENTIALModule 2.7.3 Summary of Clinical Efficacy
78
Table 45 Proportion of Subjects with Plasma HIV-1 RNA <50 c/mL by Visit -Snapshot (MSDF) Analysis (mITT-E Population)
ING111762
DTG 50 mg once daily + BR
N=354n/N (%)
RAL 400 mg BID + BR
N=361n/N (%)
Baseline 2 / 354 (<1) 4 / 361 (1)
Week 4 210 / 354 (59) 194 / 361 (54)
Week 8 259 / 354 (73) 239 / 361 (66)
Week 12 257 / 354 (73) 251 / 361 (70)
Week 16 257 / 354 (73) 249 / 361 (69)
Week 24a,b,c 281 / 354 (79) 252 / 361 (70)
Data Source: ING111762 Week 24 CSR Table 7.23 and Table 7.1 a. Difference: Proportion on DTG - Proportion on RAL: 9.6 (3.2, 15.9)b. Based on Cochran-Mantel Haenszel stratified analysis adjusting for the following baseline stratification factors:
baseline HIV-1 RNA, DRV/RTV use without primary PI mutations, and baseline PSSf: Difference 9.7 (3.4, 15.9). c. P-value 0.003
There were fewer virologic nonresponders using the Snapshot (MSDF) algorithm through Week 24 in the DTG group compared to the RAL group (DTG: 15%; RAL: 24%) (Table 46). This result was driven by data within the window for HIV-1 RNA not being <50 c/mL (DTG: 11%; RAL: 18%). Very few subjects in both groups were discontinued from the study due to lack of efficacy (DTG: <1%; RAL: 1).
Table 46 Study Outcomes (<50 c/mL) at Week 24 - Snapshot (MSDF) Analysis (mITT-E Population)
Outcome at Week 24 DTG 50 mg once daily + BR
N=354n (%)
RAL 400 mg BID + BR
N=361n (%)
Virologic Success 281 (79) 252 (70)
Virologic Non-Responsea 53 (15) 86 (24)
Data in window not below threshold 40 (11) 66 (18)
Data in window not <50 c/mL 40 (11) 66 (18)
Discontinued for lack of efficacy 2 (<1) 4 (1)
Discontinued for other reason while not below threshold
7 (2) 6 (2)
Change in ART 4 (1) 10 (3)
No Virologic Data at Week 24 20 (6) 23 (6)
Discontinued due to Adverse Event or Death 6 (2) 9 (2)
Discontinued for Other Reasons 12 (3) 11 (3)
Missing data during window but on study 2 (<1) 3 (<1)
Data Source: ING111762 Week 24 CSR Table 7.4a. Virologic failure

CONFIDENTIALModule 2.7.3 Summary of Clinical Efficacy
79
3.2.2.2. Secondary Efficacy Results
Time to Viral Suppression (<50 c/mL) in ART-Experienced, INI-Naïve Subjects
The proportion of subjects with plasma HIV-1 RNA <50 c/mL using Snapshot (MSDF)analysis for the mITT-E Population increased steeply in both treatment groups from Baseline to Week 4, then tended to plateau starting at Week 8 through Week 24 (Figure 11). Both treatment groups followed a similar pattern, but higher values were noted for DTG compared to RAL at all time points assessed.
Figure 11 Proportion (95% CI) of Subjects with Plasma HIV-1 RNA <50 c/mL by Visit – Snapshot (MSDF) Analysis (mITT-E Population)
Data Source: ING111762 Week 24 CSR Figure 7.1Note: confidence intervals are derived using the normal approximation.
CD4+ cell Counts over Time in ART-Experienced, INI-Naïve Subjects
Immunologic activity over time was compared using summaries of CD4+ values (Data Source: ING111762 Week 24 CSR Table 7.18) and changes from Baseline at each visit (Table 47). Median CD4+ cell counts increased from Baseline to Week 24 in the DTG and RAL groups. The median changes in CD4+ cell count from Baseline were +99 cells/mm3 in the DTG group and +93 cells/mm3 in the RAL group at 24 weeks.

CONFIDENTIALModule 2.7.3 Summary of Clinical Efficacy
80
Table 47 Median (IQR)[Range] Change from Baseline in CD4+ Cell Counts (cells/mm3) by Visit in an ART-Experience Study (mITT-E Population)
ING111762
DTG 50 mg once daily + BRN=354
RAL 400 mg BID + BRN=361
Baseline 204.5 (88.0, 368.0)
[19, 1017]
193.0 (96.0, 365.0)
[19, 1219]
Week 4 53.0 (0.0, 109.0)[-383, 718]
45.0 (5.0, 99.0)[-382, 735]
Week 8 60.5 (15.0 117.0)[-295, 665]
59.0 (12.0, 124.0)[-209, 520]
Week 12 74.0 (25.0, 135.0)[-250, 621]
75.0 (22.0, 141.0)[-470, 533]
Week 16 76.0 (20.0, 156.0)[-310, 578]
79.5 (28.0, 158.0)[-374, 710]
Week 24 99.0 (34.0, 184.0)[-422, 619]
93.0 (46.0, 166.0)[-349, 682]
Data Source: ING111762 Week 24 CSR Table 7.19
Incidence of Disease Progression (HIV-associated conditions, AIDS and death) in ART-Experienced, INI-Naïve Subjects
HIV-associated conditions in subjects treated with DTG compared to RAL were assessed over time by summaries of the incidence of post-Baseline HIV conditions, and by the proportion of subjects with disease progression. There was a similar low incidence of HIV associated conditions, excluding recurrences (DTG: 3%; RAL: 5%; Data Source: ING111762 Week 24 CSR, Section 6.4) and number of subjects with HIV disease progression to class C or death (2% in both treatment groups; Table 48).

CONFIDENTIALModule 2.7.3 Summary of Clinical Efficacy
81
Table 48 Summary of Post-Baseline HIV-1 Disease Progressions (mITT-E Population)
Category
DTG 50 mg once daily + BR
N=354n (%)
RAL 400 mg BID + BR
N=361n (%)
Progressed to CDC Class C or death, n (%) 8 (2) 8 (2)Class A to Class C 0 1 (13)Class B to Class C 0 2 (25)Class C to New Class C 8 (100) 3 (38)Class A, B, or C to Death 0 2 (25)Data Source: ING111762 Week 24 CSR Table 7.22Note: Subjects may have had more than one HIV associated condition. Each condition was counted only once per
subject, regardless of recurrence.Note: Excludes uncategorized condition of 'Anal Carcinoma, in situ' (n=1, RAL 400 mg BID). The condition was
considered 'Class B' by GSK based on blinded medical review (categorization was not databased).
3.2.3. Treatment Emergent Resistance in INI-Naïve Subjects (ART-Naïve and ART-Experienced Subjects)
A low rate of confirmed virological failure with development of resistance mutations or decreased susceptibility to any drugs in the regimen was observed in the DTG treatment arms compared to EFV in ING114467 and RAL in ING113086 and ING111762.
Protocol defined virologic failure rates in ING113086 and ING114467 were low and consistent for the DTG-containing regimens (5% and 4%, respectively), despite stringent PDVF criteria (confirmed HIV-1 RNA 50 c/mL at or after Week 24).
In the ING111762 Week 24 analysis, treatment-experienced (INI-naive) subjects receiving DTG were less likely to have genotypic or phenotypic evidence of treatment-emergent resistance at PDVF (confirmed plasma HIV-1 RNA levels ≥400 c/mL on or after Week 24; full definition in ING111762 Week 24 CSR, Section 7.1). In a pre-specified analysis, there was a statistically significant difference in favor of DTG for the proportion of mITT-E subjects harboring virus with evidence of INI Resistance by Week 24 (DTG: 2/354 (0.6%); RAL: 10/361(2.8%); p=0.016).
Across the treatment-naive studies, no subjects on DTG treatment arms developed clinically relevant INI resistance mutations, but subjects on comparator agents (RAL, EFV) developed clinically relevant resistance mutations to these third agents. In ING111762, there were two subjects in the DTG arm with emergent integrase-defined substitutions. Both had experienced virologic rebound instead of non-response, had no defined integrase resistance substitutions at Baseline, and acquired a substitution at R263 in the integrase open reading frame. In each case the DTG fold change was <2, as was the maximum RAL fold change. Neither of these subjects with emergent substitutions at R263 had RAL-associated secondary mutations at Baseline.
Furthermore, no mutations were noted to background NRTI (ART-naive studies) with 50 mg DTG-based regimens in comparison to Atripla or RAL-based regimens in treatment-naïve subjects (Table 49). There were few examples of emergent resistance to

CONFIDENTIALModule 2.7.3 Summary of Clinical Efficacy
82
the background regimen at PDVF in the RAL arm (6/351) versus the DTG arm (3/354) in ART-experienced subjects (m2.7.2.4).
Table 49 Number of Protocol-Defined Virologic Failures (+/- Resistance to integrase, NNRTI, BR) in ART-Naïve and ART-experienced Subjects
ART-Naïve Adults
ING113086 ING114467
Week 48 Week 48
DTG 50 mg once daily
+ 2 NRTIN=411
RAL 400 mg BID
+ 2 NRTIN=411
DTG 50 mg + ABC/3TC once daily
N=414
EFV/TDF/FTC once daily
N=419
Protocol-defined Virologic Failure, n (%) 20 (5) 28 (7) 18 (4) 17 (4)
Genotype/phenotype Determinable, n (%)
INI-r Mutations Present 0 1/18 (6)a 0c 0
NNRTI-r Mutations Present - - 0 4 (24)d
NRTI-r Mutations Present 0 4/19 (21)b 0 1 (6)e
ART-Experienced Adults
ING111762
Week 24
DTG 50 mg once daily + BR
N=354
RAL 400 mg BID + BR
N=361
Protocol-defined Virologic Failure 14 (4) 34 (9)
Genotype/phenotype Determinable
INI Mutations Present 2/9 (22)f 9/27 (33)
Data Source: ING113086 Week 48 CSR Table 7.22, Table 12.2, Table 12.4, and Listing 43; ING114467 Week 48 CSR Table 7.7, Table 12.2, Table 12.4, and Listing 47; ING111762 Week 24 CSR Table 12.2 and Table 7.10. R=resistance to integrase, NNRTI and BRa. T97T/A, E138E/D, V151V/I, N155Hb. A62A/V (n=2), K65K/R, K70K/E, M184M/I, M184M/V, M184Vc. IN Substitution (n=1) E157Q/P at Week 24. DTG FC = 1.13; RAL FC = 1.26d. K101E, K101K/N, K103N, G190G/A (2)e. K65K/Rf. DTG (n=2): R263R/K FC=1.12 and R263K FC=1.93.
Supporting the Phase III finding in treatment-naïve subjects, in ING112276, no subjects receiving the Phase III selected dose of DTG 50 mg once daily had a confirmed PDVF (400 c/mL) through Week 96, and no virologic resistance was observed in this treatment group. A low rate of confirmed PDVF was observed in the DTG 10 mg and 25 mg treatment groups and the EFV treatment group. No subjects demonstrated integrase ornon-nucleoside reverse transcriptase inhibitor (NNRTI) resistance at PDVF. The only demonstrated virologic resistance mutations were a M184V, consistent with 3TC/FTCresistance, in a subject receiving TDF/FTC and DTG 10 mg once daily (m2.7.2.4).

CONFIDENTIALModule 2.7.3 Summary of Clinical Efficacy
83
3.2.4. Studies in ART-Experienced, INI-Resistant Subjects
3.2.4.1. Primary Efficacy Results
The primary endpoint in ING112961 was the proportion of subjects with Day 11 plasma HIV-1 RNA <400 c/mL or reduced by at least 0.7 log10 c/mL compared to Baseline. Twenty-three of 24 (96%, CI: 79%, 100%) subjects in Cohort II receiving DTG 50 mg BID achieved the primary endpoint (Data Source: ING112961 Cohort II Week 48 CSRTable 7.1).
The primary efficacy endpoint in ING112574 included the change from Baseline in plasma HIV-1 RNA at Day 8 and an assessment of the proportion of subjects with <50 c/mL HIV-1 RNA at Week 24. Assessing all subjects who had the opportunity to reach Week 24 before the data cut-off, 63% of this Week 24 ITT-E population (N=114) achieved viral suppression to <50 c/mL based on the Snapshot (MSDF) algorithm (Data Source: ING112574 Week 24 CSR Table 7.21). A comparable proportion (66/101, 65%) was observed in this analysis for the Per Protocol population (Data Source: ING112574 Week 24 CSR Table 7.4). Additionally, a statistically significant mean reduction of 1.43 log10 c/mL HIV-1 RNA at Day 8 compared to Baseline was observed for the ITT-E population with an equivalent reduction observed for the Per Protocol population based on LOCDBF in sensitivity analyses (Table 50).
Table 50 ING112574: Mean Change from Baseline in Plasma HIV-1 RNA log10c/mL at Day 8
(LOCFDB, ITT-E)
N Mean (SD) 95% CI p-value a
Baseline 183 4.26 (0.93)
Change from Baseline (CFB)Day 8
182 -1.43 (0.61) (-1.52,-1.34) <0.001
(LOCFDB, Day 8 PP population)
N Mean (SD) 95% CI p-value a
Baseline 173 4.26 (0.93)
Change from Baseline Day 8 173 -1.43 (0.60) (-1.52,-1.34) <0.001
Data Source: ING112574 Week 24 CSR Table 7.1 and Table 7.2a. p-value is derived by testing the hypothesis of no change from Baseline at the two-sided 5%significance level using Student's t-test. Note: Proportion of CFB 0.5 log10 c/mL or <400 c/mL at Day 8: 169/183 (92%).
Change from Baseline in HIV-1 RNA
Across both studies with INI-resistant subjects, the mean change from Baseline in plasma HIV RNA was similar (~1.40 log10 c/mL reduction from Baseline) during the Functional Monotherapy Phase (Day 6 to 8 and Day 8 for ING112961 and ING112574, respectively). At Week 24 the mean change from Baseline ranged from -2.21 log10 c/mL in ING112574 to -2.50 log10 c/mL in ING112961.

CONFIDENTIALModule 2.7.3 Summary of Clinical Efficacy
84
Table 51 Plasma HIV-1 RNA Mean (SD) Change from Baseline (log10 c/mL) by Visit in ART-Experienced, INI-resistant Subjects
Visit ING112961 ING112574Cohort II Week 24 ITT-E
DTG 50 mg BID + BRN=24
DTG 50 mg BID + BRN=114
n Mean [SD] Plasma HIV-1 RNA (log10 c/mL)
n Mean [SD] Plasma HIV-1 RNA (log10 c/mL)
Baseline 24 4.38 [0.74] 114 4.34 [0.95]Day 8 24 -1.40 [0.43]a 113 -1.44 [0.60]Day 11 24 -1.76 [0.53] - -Week 4 24 -2.06 [0.78] 112 -2.12 [0.86]Week 12 24 -2.30 [0.93] 109 -2.13 [1.08]Week 24 22 -2.50 [0.81] 101 -2.21 [1.05]Week 48 20 -2.63 [0.78] 12 -2.11 [0.83]Data Source: ING112961 Cohort II Week 48 CSR Table 7.2; ING112574 Week 24 CSR Table 7.26.
a. Day 6 to 8
Proportion of Subjects with HIV-1 RNA <50 and <400 c/mL Over Time
Assessing the longer-term effect of the DTG-containing regimen, the proportion of subjects responding based on plasma HIV RNA <50 c/mL at Week 24 was 63% for ING112574 and 79% ING112961 (Table 52). Differences in response rates at Week 24 in subjects in ING112961 Cohort II as compared to ING112574 were likely due to the less advanced treatment population and the more limited number of subjects with higher levels of resistance to DTG enrolled in ING112961 Cohort II (Table 37 and Table 39).

CONFIDENTIALModule 2.7.3 Summary of Clinical Efficacy
85
Table 52 Proportion of Subjects Responding Based on Plasma HIV-1 RNA <50 and <400 c/mL by Visit in ART-Experienced, INI-Resistant Subjects (ITT-E Population)
Visit ING112961 ING112574
Week 48/TLOVR Week 24/Snapshot (MSDF)
Cohort IIDTG 50 mg BID + BR
N=24n (%)
Week 24 ITTEDTG 50 mg BID + BR
N=114n (%)
<50 c/mL <400 c/mL <50 c/mL <400 c/mL
Baseline 0 0 0 3 (3)
Day 8 1 (4)a 8 (33)a 16 (14) 48 (42)
Day 11 4 (17) 13 (54) - -
Week 4 12 (50) 17 (71) 59 (52) 86 (75)
Week 8 15 (63) 19 (79) 66 (58) 89 (78)
Week 12 16 (67) 20 (83) 70 (61) 86 (75)
Week 16 17 (71) 20 (83) 73 (64) 83 (73)
Week 24 19 (79) 20 (83) 72 (63) 79 (69)
Week 48 17 (71) 18 (75) - -
Data Source: ING112961 Cohort II Week 48 CSR Table 7.11 and Table 7.14; ING112574 Week 24 CSR Table 7.21 and Table 7.22.Note: ING112961 and ING112574 are non-comparative studies
a. Day 6 to 8
Study Outcomes in ART-Experienced, INI-Resistant Subjects
The proportion of subjects considered to be responders based on <50 c/mL was 17/24 (71%) in ING112961 Cohort II at Week 48 and 72/114 (63%) in ING112574 at Week 24. The study outcomes at Week 48 and Week 24 for the analyses of subjects with <50 c/mL by TLOVR and Snapshot (MSDF) are provided in Table 53 below for each study, respectively.
Between ING112961 and ING112574, there were fewer virologic non-responders in the ING112961 Cohort II by Week 48 compared to ING112574 at Week 24, respectively.
In ING112574 the study outcomes for the Week 24 ITT-E population (Table 53) indicated a lack of virological suppression to <50 c/mL as the primary sub-reason for virological failure. Six subjects had implemented a non-permitted change of background ART and two subjects had been withdrawn for reasons of protocol deviation and loss to follow up. Of the 5 subjects who had discontinued study drug due to AEs, one died from progressive multifocal leucoencephalopathy (PML) post study withdrawal.
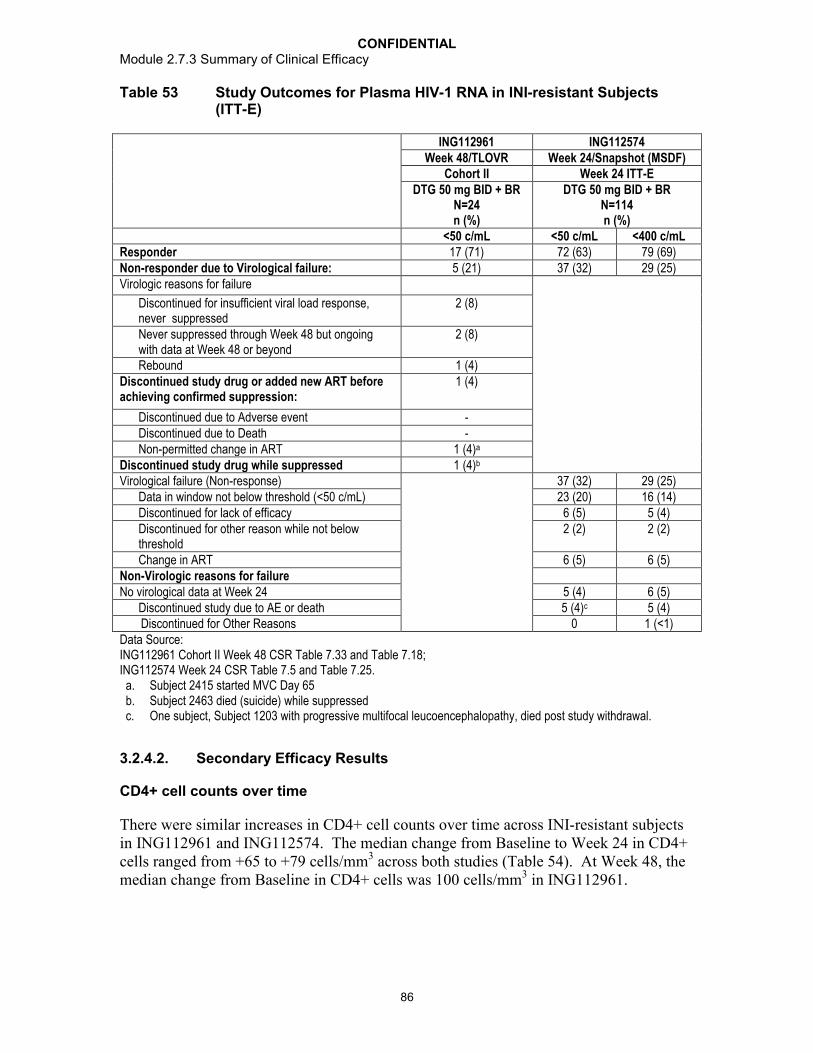
CONFIDENTIALModule 2.7.3 Summary of Clinical Efficacy
86
Table 53 Study Outcomes for Plasma HIV-1 RNA in INI-resistant Subjects (ITT-E)
ING112961 ING112574Week 48/TLOVR Week 24/Snapshot (MSDF)
Cohort II Week 24 ITT-EDTG 50 mg BID + BR
N=24n (%)
DTG 50 mg BID + BRN=114n (%)
<50 c/mL <50 c/mL <400 c/mLResponder 17 (71) 72 (63) 79 (69)Non-responder due to Virological failure: 5 (21) 37 (32) 29 (25)Virologic reasons for failure
Discontinued for insufficient viral load response, never suppressed
2 (8)
Never suppressed through Week 48 but ongoing with data at Week 48 or beyond
2 (8)
Rebound 1 (4)Discontinued study drug or added new ART before achieving confirmed suppression:
1 (4)
Discontinued due to Adverse event -Discontinued due to Death -Non-permitted change in ART 1 (4)a
Discontinued study drug while suppressed 1 (4)b
Virological failure (Non-response) 37 (32) 29 (25)Data in window not below threshold (<50 c/mL) 23 (20) 16 (14)Discontinued for lack of efficacy 6 (5) 5 (4)Discontinued for other reason while not below threshold
2 (2) 2 (2)
Change in ART 6 (5) 6 (5)Non-Virologic reasons for failureNo virological data at Week 24 5 (4) 6 (5)
Discontinued study due to AE or death 5 (4)c 5 (4) Discontinued for Other Reasons 0 1 (<1)Data Source: ING112961 Cohort II Week 48 CSR Table 7.33 and Table 7.18; ING112574 Week 24 CSR Table 7.5 and Table 7.25.
a. Subject 2415 started MVC Day 65b. Subject 2463 died (suicide) while suppressedc. One subject, Subject 1203 with progressive multifocal leucoencephalopathy, died post study withdrawal.
3.2.4.2. Secondary Efficacy Results
CD4+ cell counts over time
There were similar increases in CD4+ cell counts over time across INI-resistant subjects in ING112961 and ING112574. The median change from Baseline to Week 24 in CD4+ cells ranged from +65 to +79 cells/mm3 across both studies (Table 54). At Week 48, the median change from Baseline in CD4+ cells was 100 cells/mm3 in ING112961.

CONFIDENTIALModule 2.7.3 Summary of Clinical Efficacy
87
Table 54 Median [IQR] Change from Baseline in CD4+ Cell Count (cells/mm3) by Visit in ART-Experienced, INI-resistant Subjects (Observed)
Week ING112961 ING112574Week 48 Cohort II Week 24 ITT-E
DTG 50 mg BID + BRN=24
DTG 50 mg BID + BRN=114
n Median [IQR] CD4+ Cell Count (cells/mm3)
n Median [IQR] CD4+ Cell Count (cells/mm3)
Baseline 24 202 [19, 384] 114 120 [20, 310)Day 11 24 14 [0, 69] - -Week 4 24 35 [8, 69] 110 31 [0, 90]Week 8 24 50 [-2, 106] 111 50 [0, 90]Week 12 24 57 [8,103] 106 60 [11, 110]Week 16 23 49 [-10, 134] 102 60 [30, 130]Week 24 22 79 [17, 147] 100 65 [30, 146]Week 48 20 106 [45, 245] - -Data Source: ING112961 Cohort II Week 48 CSR Table 7.22; ING112574 Week 24 CSR Table 7.11.IQR: interquartile range: between 25 and 75 percentile
Incidence of Disease Progression (HIV-associated conditions, AIDS and death)
Across the INI-resistant subjects in ING112961 and ING112574, there was a similar low incidence of HIV-associated condition (5% to 8% [Data Source: ING112961 Cohort II Week 48 CSR, Section 6.5: ING112574 Week 24 CSR, Section 6.5]) and the lack of disease progression to CDC category C or death in this salvage population aligned with the overall immune recovery (Table 55).
Table 55 Summary of Post-Baseline HIV-1 Disease Progressions in ART-Experienced, INI-resistant Subjects (ITT-E)
Disease Progression by CDC Class ING112961 ING112574Week 48 Week 24Cohort II
DTG 50 mg BID + BR
N=24n (%)
ITT-EDTG 50 mg BID + BR
N=183n (%)
Number of subjects progressing to Class C or Death 1 (4) 8 (4)
From CDC Class A To CDC Class C 0 0From CDC Class B To CDC Class C 0 2 (1)From CDC Class C To New CDC Class C 0 5 (3)From CDC Class A, B, or C To Death 1 (4) 1 (<1)
Data Source: ING112961 Cohort II Week 48 CSR Table 7.25; ING112574 Week 24 CSR Table 7.20.
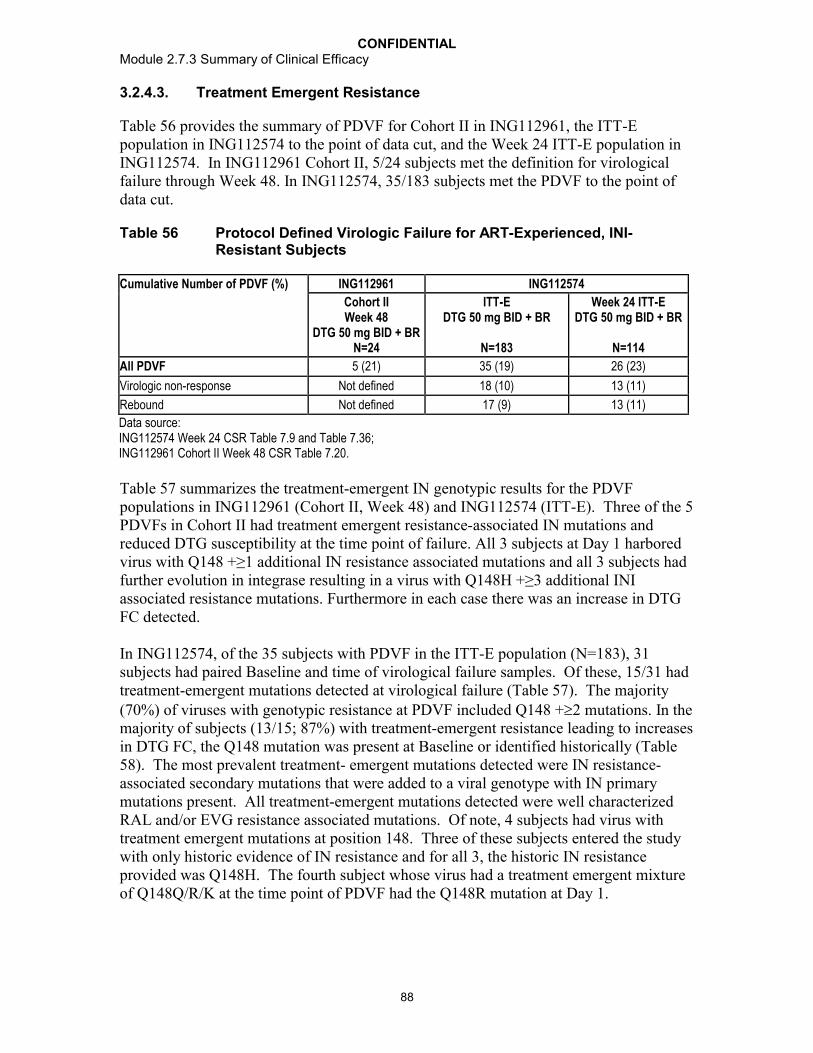
CONFIDENTIALModule 2.7.3 Summary of Clinical Efficacy
88
3.2.4.3. Treatment Emergent Resistance
Table 56 provides the summary of PDVF for Cohort II in ING112961, the ITT-E population in ING112574 to the point of data cut, and the Week 24 ITT-E population in ING112574. In ING112961 Cohort II, 5/24 subjects met the definition for virological failure through Week 48. In ING112574, 35/183 subjects met the PDVF to the point of data cut.
Table 56 Protocol Defined Virologic Failure for ART-Experienced, INI-Resistant Subjects
Cumulative Number of PDVF (%) ING112961 ING112574
Cohort IIWeek 48
DTG 50 mg BID + BRN=24
ITT-E DTG 50 mg BID + BR
N=183
Week 24 ITT-EDTG 50 mg BID + BR
N=114
All PDVF 5 (21) 35 (19) 26 (23)
Virologic non-response Not defined 18 (10) 13 (11)
Rebound Not defined 17 (9) 13 (11)
Data source: ING112574 Week 24 CSR Table 7.9 and Table 7.36; ING112961 Cohort II Week 48 CSR Table 7.20.
Table 57 summarizes the treatment-emergent IN genotypic results for the PDVF populations in ING112961 (Cohort II, Week 48) and ING112574 (ITT-E). Three of the 5 PDVFs in Cohort II had treatment emergent resistance-associated IN mutations and reduced DTG susceptibility at the time point of failure. All 3 subjects at Day 1 harbored virus with Q148 +≥1 additional IN resistance associated mutations and all 3 subjects had further evolution in integrase resulting in a virus with Q148H +≥3 additional INI associated resistance mutations. Furthermore in each case there was an increase in DTG FC detected.
In ING112574, of the 35 subjects with PDVF in the ITT-E population (N=183), 31 subjects had paired Baseline and time of virological failure samples. Of these, 15/31 had treatment-emergent mutations detected at virological failure (Table 57). The majority (70%) of viruses with genotypic resistance at PDVF included Q148 +2 mutations. In the majority of subjects (13/15; 87%) with treatment-emergent resistance leading to increases in DTG FC, the Q148 mutation was present at Baseline or identified historically (Table 58). The most prevalent treatment- emergent mutations detected were IN resistance-associated secondary mutations that were added to a viral genotype with IN primary mutations present. All treatment-emergent mutations detected were well characterized RAL and/or EVG resistance associated mutations. Of note, 4 subjects had virus with treatment emergent mutations at position 148. Three of these subjects entered the study with only historic evidence of IN resistance and for all 3, the historic IN resistance provided was Q148H. The fourth subject whose virus had a treatment emergent mixture of Q148Q/R/K at the time point of PDVF had the Q148R mutation at Day 1.
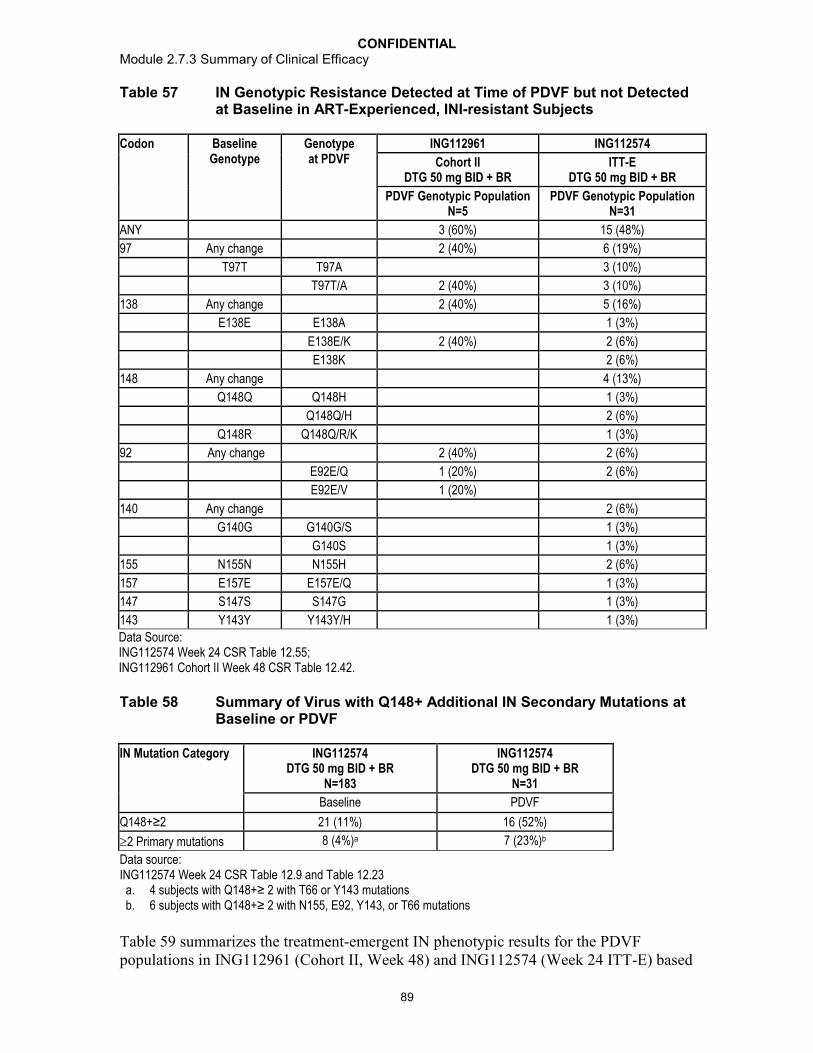
CONFIDENTIALModule 2.7.3 Summary of Clinical Efficacy
89
Table 57 IN Genotypic Resistance Detected at Time of PDVF but not Detected at Baseline in ART-Experienced, INI-resistant Subjects
Codon Baseline Genotype
Genotype at PDVF
ING112961 ING112574
Cohort IIDTG 50 mg BID + BR
ITT-EDTG 50 mg BID + BR
PDVF Genotypic Population N=5
PDVF Genotypic Population N=31
ANY 3 (60%) 15 (48%)
97 Any change 2 (40%) 6 (19%)
T97T T97A 3 (10%)
T97T/A 2 (40%) 3 (10%)
138 Any change 2 (40%) 5 (16%)
E138E E138A 1 (3%)
E138E/K 2 (40%) 2 (6%)
E138K 2 (6%)
148 Any change 4 (13%)
Q148Q Q148H 1 (3%)
Q148Q/H 2 (6%)
Q148R Q148Q/R/K 1 (3%)
92 Any change 2 (40%) 2 (6%)
E92E/Q 1 (20%) 2 (6%)
E92E/V 1 (20%)
140 Any change 2 (6%)
G140G G140G/S 1 (3%)
G140S 1 (3%)
155 N155N N155H 2 (6%)
157 E157E E157E/Q 1 (3%)
147 S147S S147G 1 (3%)
143 Y143Y Y143Y/H 1 (3%)
Data Source: ING112574 Week 24 CSR Table 12.55; ING112961 Cohort II Week 48 CSR Table 12.42.
Table 58 Summary of Virus with Q148+ Additional IN Secondary Mutations at Baseline or PDVF
IN Mutation Category ING112574DTG 50 mg BID + BR
N=183
ING112574DTG 50 mg BID + BR
N=31
Baseline PDVF
Q148+≥2 21 (11%) 16 (52%)
2 Primary mutations 8 (4%)a 7 (23%)b
Data source: ING112574 Week 24 CSR Table 12.9 and Table 12.23
a. 4 subjects with Q148+≥ 2 with T66 or Y143 mutationsb. 6 subjects with Q148+≥ 2 with N155, E92, Y143, or T66 mutations
Table 59 summarizes the treatment-emergent IN phenotypic results for the PDVF populations in ING112961 (Cohort II, Week 48) and ING112574 (Week 24 ITT-E) based
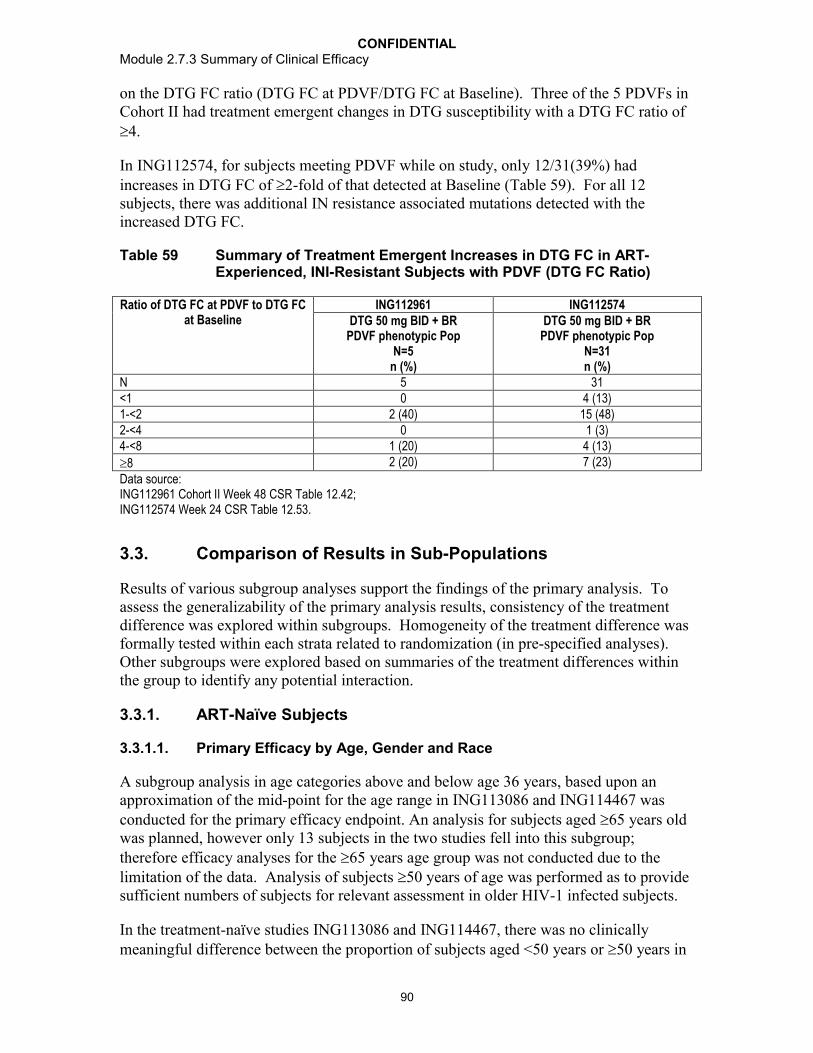
CONFIDENTIALModule 2.7.3 Summary of Clinical Efficacy
90
on the DTG FC ratio (DTG FC at PDVF/DTG FC at Baseline). Three of the 5 PDVFs in Cohort II had treatment emergent changes in DTG susceptibility with a DTG FC ratio of 4.
In ING112574, for subjects meeting PDVF while on study, only 12/31(39%) had increases in DTG FC of 2-fold of that detected at Baseline (Table 59). For all 12 subjects, there was additional IN resistance associated mutations detected with the increased DTG FC.
Table 59 Summary of Treatment Emergent Increases in DTG FC in ART-Experienced, INI-Resistant Subjects with PDVF (DTG FC Ratio)
Ratio of DTG FC at PDVF to DTG FC at Baseline
ING112961 ING112574DTG 50 mg BID + BR
PDVF phenotypic PopN=5
n (%)
DTG 50 mg BID + BRPDVF phenotypic Pop
N=31n (%)
N 5 31<1 0 4 (13)1-<2 2 (40) 15 (48)2-<4 0 1 (3)4-<8 1 (20) 4 (13)
8 2 (20) 7 (23)
Data source: ING112961 Cohort II Week 48 CSR Table 12.42; ING112574 Week 24 CSR Table 12.53.
3.3. Comparison of Results in Sub-Populations
Results of various subgroup analyses support the findings of the primary analysis. To assess the generalizability of the primary analysis results, consistency of the treatment difference was explored within subgroups. Homogeneity of the treatment difference was formally tested within each strata related to randomization (in pre-specified analyses). Other subgroups were explored based on summaries of the treatment differences within the group to identify any potential interaction.
3.3.1. ART-Naïve Subjects
3.3.1.1. Primary Efficacy by Age, Gender and Race
A subgroup analysis in age categories above and below age 36 years, based upon an approximation of the mid-point for the age range in ING113086 and ING114467 was conducted for the primary efficacy endpoint. An analysis for subjects aged 65 years old was planned, however only 13 subjects in the two studies fell into this subgroup; therefore efficacy analyses for the 65 years age group was not conducted due to the limitation of the data. Analysis of subjects 50 years of age was performed as to provide sufficient numbers of subjects for relevant assessment in older HIV-1 infected subjects.
In the treatment-naïve studies ING113086 and ING114467, there was no clinically meaningful difference between the proportion of subjects aged <50 years or 50 years in

CONFIDENTIALModule 2.7.3 Summary of Clinical Efficacy
91
the DTG treatment groups who achieved HIV-1 RNA <50 c/mL by Week 48. In addition, the studies showed similar responses in the DTG treatment groups for the primary efficacy endpoint in other categories including gender and race (Table 60). In support of these conclusions, approximately 150 subjects or more were represented in each of theseBaseline demographic variables across the two studies.
In ING113086 DTG performed as well as RAL across demographic subgroups including age (<36 years vs. 36), gender, and race (White vs. non-white). Furthermore, in ING114467 the treatment differences between DTG+ ABC/3TC and Atripla were maintained across these demographic subgroups.
Table 60 Primary Efficacy by Age, Gender, and Race in ING113086 and ING114467 at Week 48 (ITT-E, Snapshot [MSDF])
Subgroup of Interest ING113086 ING114467DTG 50 mgonce daily+ 2 NRTIN=411n (%)
RAL 400 mgBID
+ 2 NRTIN=411n (%)
DTG 50 mg+ ABC/3TConce daily
N=414n (%)
EFV/TDF/FTConce daily
N=419n (%)
Age <36 162 / 186 (87) 181/219 (83) 175/202 (87) 171/215 (80)
36 199 / 225 (88) 170 / 192 (89) 189/212 (89) 167/204 (82)
Age <50 years 324/370 (88) 312/365 (85) 319/361 (88) 302/375 (81)
50 years 37/41 (90) 39/46 (85) 45/53 (85) 36/44 (82)Gender Females 53/63 (84) 46/56 (82) 57/67 (85) 47/63 (75) Males 308/348 (89) 305/355 (86) 307/347 (88) 291/356 (82)Race White 306/346 (88) 301/352 (86) 255/284 (90) 238 285 (84) Non-White 55/65 (85) 50/59 (85) 109/130 (84) 99/133 (74)Data Source: ING113086 Week 48 CSR Table 7.6 and ISE Table 1.1ING114467 Week 48 CSR Table 7.8 and ISE Table 1.2
3.3.1.2. Primary Efficacy by Stratification Factors (Baseline HIV-1 RNA/CD4+ cell count, Background NNRTI)
Baseline HIV-1 RNA
Response rates were summarized for Baseline HIV-1 RNA ( and >100,000 c/mL). Across treatment-naive studies, the DTG response rate was comparable to or better than comparator for subjects whose Baseline HIV-1 RNA was >100,000 c/mL and for subjects whose Baseline HIV-RNA was <100,000 c/mL (Table 61). As seen in prior studies, responses in general were higher in subjects with HIV-1 RNA 100,000 c/mL (90% across studies) when compared to subjects whose Baseline HIV-1 RNA was >100,000 c/mL (82% to 83% across studies) (Table 61).

CONFIDENTIALModule 2.7.3 Summary of Clinical Efficacy
92
Analyses according to Baseline HIV-1 RNA level support the conclusion that treatment effects are not heterogeneous across the predefined strata in ING113086 and ING114467, respectively.
Baseline CD4+ Cell Count
Across treatment-naive studies, a similar DTG response was observed across mostBaseline CD4+ cell count categories (Table 61).
In ING113086, DTG showed a more favorable numerical treatment response compared to RAL among subjects with CD4+ cell count <350 cells/mm3 (DTG 86%, RAL 80%) (Table 61).
In addition, in ING114467, higher response rates were observed in the DTG + ABC/3TC treatment group across all Baseline CD4+ cell count subgroups, with the exception of the CD4+ cell count <50 cells/mm3 subgroup (69% for DTG + ABC/3TC and 86% for Atripla), though this finding should be interpreted in view of the very small sample size in this subgroup (Table 61).
In ING114467, CD4+ categories (<200, 200) were stratification variables. The treatment differences across the stratified levels of Baseline CD4+ supported non-inferiority of DTG+ABC/3TC vs. Atripla (ING114467 Week 48 CSR Section 6.2.2.2). In the >200 subgroup, the response rates were consistent with that of the overall study population (DTG +ABC/3TC 89%, Atripla 81%). In the <200 subgroup, the response rates were DTG +ABC/3TC 79% and Atripla 77%, with difference and 95% CI: 1.5% [-13.3%, 16.4%]. The numbers in the <200 subgroup were low (DTG +ABC/3TC n=57, Atripla n=62). However, the point estimate for the treatment difference was above 0, the CI of the treatment difference in that subgroup included the overall treatment difference point estimate, and the estimated difference overlapped the CD4+ >200 subgroup entirely (Data Source: ING114467 Week 48 CSR Table 7.10). These findings are furthersupported by heterogeneity of the treatment difference, which showed that treatment difference between the high and low Baseline CD4+ were not statistically significant.
Background NRTI
Treatment differences across NRTI backbones support non-inferiority of DTG vs. RAL. Response rates summarized by backbone NRTI were similar across the treatment groups in subjects receiving ABC/3TC, (DTG 86%, RAL 87%), and in subjects receiving TDF/FTC (DTG 89%, RAL 85%) (Table 61).
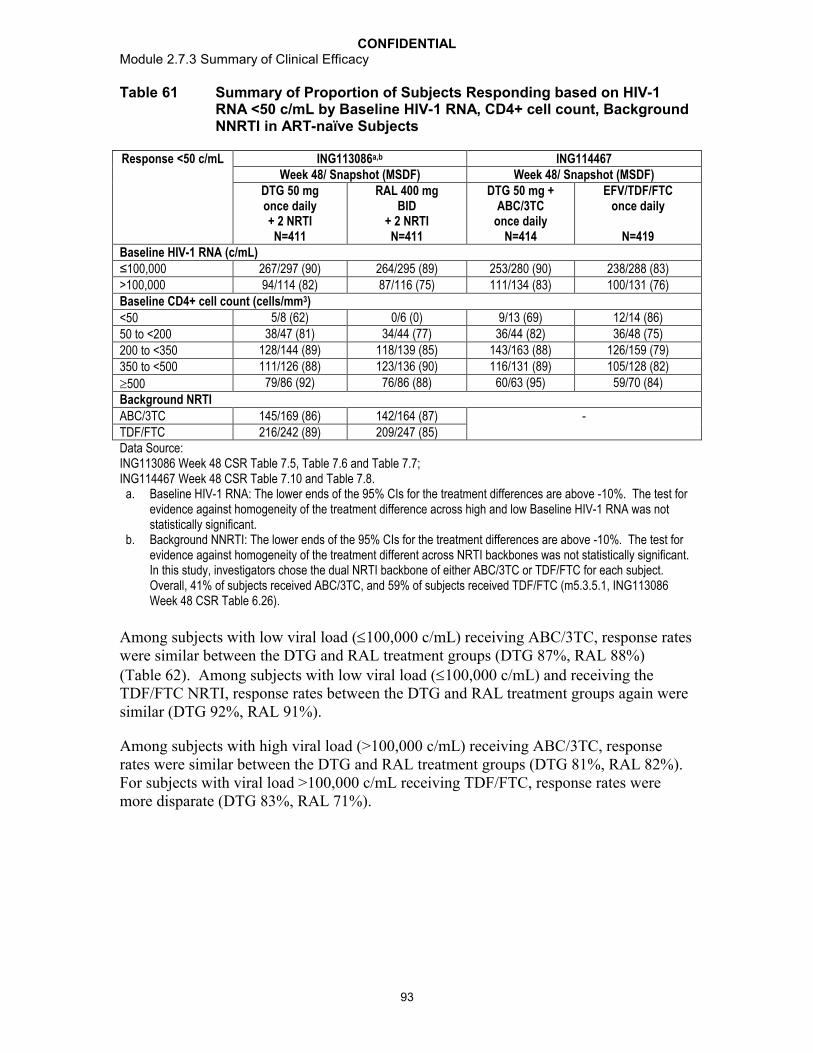
CONFIDENTIALModule 2.7.3 Summary of Clinical Efficacy
93
Table 61 Summary of Proportion of Subjects Responding based on HIV-1 RNA <50 c/mL by Baseline HIV-1 RNA, CD4+ cell count, Background NNRTI in ART-naïve Subjects
Response <50 c/mL ING113086a,b ING114467Week 48/ Snapshot (MSDF) Week 48/ Snapshot (MSDF)
DTG 50 mg once daily+ 2 NRTIN=411
RAL 400 mg BID
+ 2 NRTIN=411
DTG 50 mg + ABC/3TC
once dailyN=414
EFV/TDF/FTC once daily
N=419Baseline HIV-1 RNA (c/mL)≤100,000 267/297 (90) 264/295 (89) 253/280 (90) 238/288 (83)>100,000 94/114 (82) 87/116 (75) 111/134 (83) 100/131 (76)Baseline CD4+ cell count (cells/mm3)
<50 5/8 (62) 0/6 (0) 9/13 (69) 12/14 (86)
50 to <200 38/47 (81) 34/44 (77) 36/44 (82) 36/48 (75)
200 to <350 128/144 (89) 118/139 (85) 143/163 (88) 126/159 (79)
350 to <500 111/126 (88) 123/136 (90) 116/131 (89) 105/128 (82)
500 79/86 (92) 76/86 (88) 60/63 (95) 59/70 (84)
Background NRTIABC/3TC 145/169 (86) 142/164 (87) -TDF/FTC 216/242 (89) 209/247 (85)Data Source: ING113086 Week 48 CSR Table 7.5, Table 7.6 and Table 7.7; ING114467 Week 48 CSR Table 7.10 and Table 7.8.
a. Baseline HIV-1 RNA: The lower ends of the 95% CIs for the treatment differences are above -10%. The test for evidence against homogeneity of the treatment difference across high and low Baseline HIV-1 RNA was not statistically significant.
b. Background NNRTI: The lower ends of the 95% CIs for the treatment differences are above -10%. The test for evidence against homogeneity of the treatment different across NRTI backbones was not statistically significant. In this study, investigators chose the dual NRTI backbone of either ABC/3TC or TDF/FTC for each subject. Overall, 41% of subjects received ABC/3TC, and 59% of subjects received TDF/FTC (m5.3.5.1, ING113086 Week 48 CSR Table 6.26).
Among subjects with low viral load (100,000 c/mL) receiving ABC/3TC, response rates were similar between the DTG and RAL treatment groups (DTG 87%, RAL 88%) (Table 62). Among subjects with low viral load (100,000 c/mL) and receiving the TDF/FTC NRTI, response rates between the DTG and RAL treatment groups again were similar (DTG 92%, RAL 91%).
Among subjects with high viral load (>100,000 c/mL) receiving ABC/3TC, response rates were similar between the DTG and RAL treatment groups (DTG 81%, RAL 82%). For subjects with viral load >100,000 c/mL receiving TDF/FTC, response rates were more disparate (DTG 83%, RAL 71%).
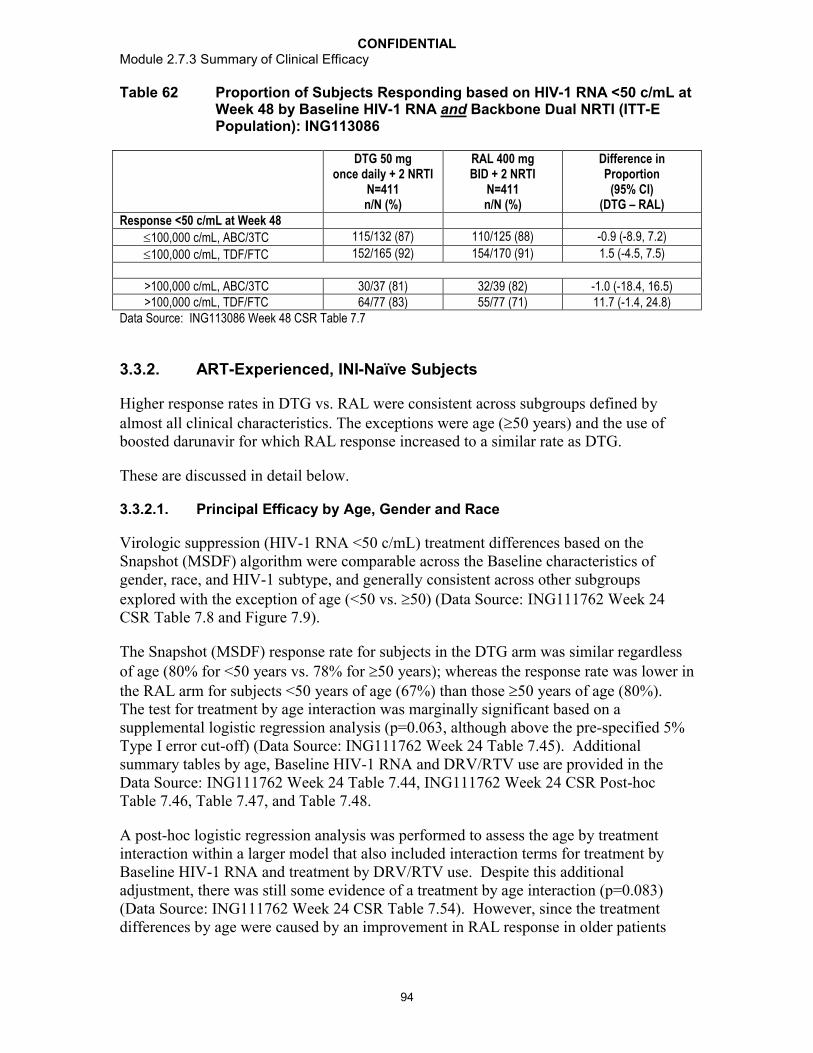
CONFIDENTIALModule 2.7.3 Summary of Clinical Efficacy
94
Table 62 Proportion of Subjects Responding based on HIV-1 RNA <50 c/mL at Week 48 by Baseline HIV-1 RNA and Backbone Dual NRTI (ITT-E Population): ING113086
DTG 50 mg once daily + 2 NRTI
N=411n/N (%)
RAL 400 mg BID + 2 NRTI
N=411 n/N (%)
Difference in Proportion
(95% CI) (DTG – RAL)
Response <50 c/mL at Week 48
100,000 c/mL, ABC/3TC 115/132 (87) 110/125 (88) -0.9 (-8.9, 7.2)
100,000 c/mL, TDF/FTC 152/165 (92) 154/170 (91) 1.5 (-4.5, 7.5)
>100,000 c/mL, ABC/3TC 30/37 (81) 32/39 (82) -1.0 (-18.4, 16.5)>100,000 c/mL, TDF/FTC 64/77 (83) 55/77 (71) 11.7 (-1.4, 24.8)
Data Source: ING113086 Week 48 CSR Table 7.7
3.3.2. ART-Experienced, INI-Naïve Subjects
Higher response rates in DTG vs. RAL were consistent across subgroups defined by almost all clinical characteristics. The exceptions were age (50 years) and the use of boosted darunavir for which RAL response increased to a similar rate as DTG.
These are discussed in detail below.
3.3.2.1. Principal Efficacy by Age, Gender and Race
Virologic suppression (HIV-1 RNA <50 c/mL) treatment differences based on the Snapshot (MSDF) algorithm were comparable across the Baseline characteristics of gender, race, and HIV-1 subtype, and generally consistent across other subgroups explored with the exception of age (<50 vs. 50) (Data Source: ING111762 Week 24 CSR Table 7.8 and Figure 7.9).
The Snapshot (MSDF) response rate for subjects in the DTG arm was similar regardless of age (80% for <50 years vs. 78% for 50 years); whereas the response rate was lower in the RAL arm for subjects <50 years of age (67%) than those 50 years of age (80%). The test for treatment by age interaction was marginally significant based on a supplemental logistic regression analysis (p=0.063, although above the pre-specified 5% Type I error cut-off) (Data Source: ING111762 Week 24 Table 7.45). Additional summary tables by age, Baseline HIV-1 RNA and DRV/RTV use are provided in the Data Source: ING111762 Week 24 Table 7.44, ING111762 Week 24 CSR Post-hoc Table 7.46, Table 7.47, and Table 7.48.
A post-hoc logistic regression analysis was performed to assess the age by treatment interaction within a larger model that also included interaction terms for treatment by Baseline HIV-1 RNA and treatment by DRV/RTV use. Despite this additional adjustment, there was still some evidence of a treatment by age interaction (p=0.083) (Data Source: ING111762 Week 24 CSR Table 7.54). However, since the treatment differences by age were caused by an improvement in RAL response in older patients
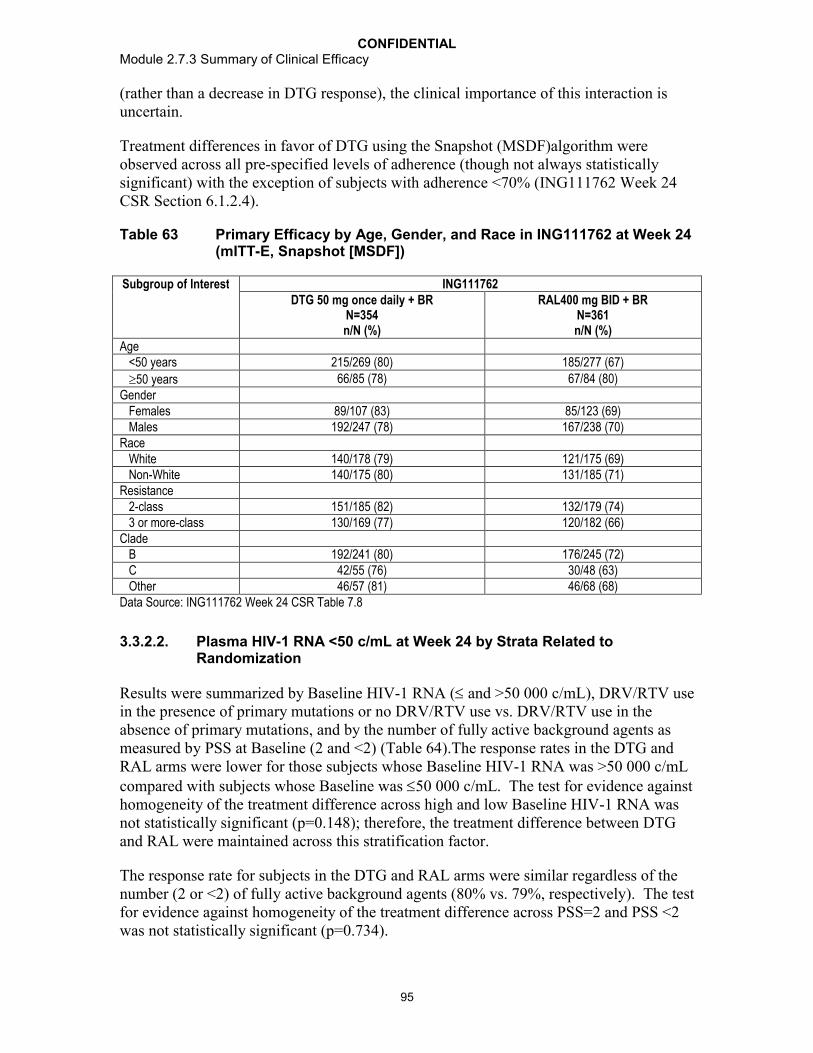
CONFIDENTIALModule 2.7.3 Summary of Clinical Efficacy
95
(rather than a decrease in DTG response), the clinical importance of this interaction is uncertain.
Treatment differences in favor of DTG using the Snapshot (MSDF)algorithm were observed across all pre-specified levels of adherence (though not always statistically significant) with the exception of subjects with adherence <70% (ING111762 Week 24 CSR Section 6.1.2.4).
Table 63 Primary Efficacy by Age, Gender, and Race in ING111762 at Week 24(mITT-E, Snapshot [MSDF])
Subgroup of Interest ING111762DTG 50 mg once daily + BR
N=354n/N (%)
RAL400 mg BID + BRN=361n/N (%)
Age <50 years 215/269 (80) 185/277 (67)
50 years 66/85 (78) 67/84 (80)Gender Females 89/107 (83) 85/123 (69) Males 192/247 (78) 167/238 (70)Race White 140/178 (79) 121/175 (69) Non-White 140/175 (80) 131/185 (71)Resistance 2-class 151/185 (82) 132/179 (74) 3 or more-class 130/169 (77) 120/182 (66)Clade B 192/241 (80) 176/245 (72) C 42/55 (76) 30/48 (63) Other 46/57 (81) 46/68 (68)Data Source: ING111762 Week 24 CSR Table 7.8
3.3.2.2. Plasma HIV-1 RNA <50 c/mL at Week 24 by Strata Related to Randomization
Results were summarized by Baseline HIV-1 RNA ( and >50 000 c/mL), DRV/RTV use in the presence of primary mutations or no DRV/RTV use vs. DRV/RTV use in the absence of primary mutations, and by the number of fully active background agents as measured by PSS at Baseline (2 and <2) (Table 64).The response rates in the DTG and RAL arms were lower for those subjects whose Baseline HIV-1 RNA was >50 000 c/mLcompared with subjects whose Baseline was 50 000 c/mL. The test for evidence against homogeneity of the treatment difference across high and low Baseline HIV-1 RNA was not statistically significant (p=0.148); therefore, the treatment difference between DTG and RAL were maintained across this stratification factor.
The response rate for subjects in the DTG and RAL arms were similar regardless of the number (2 or <2) of fully active background agents (80% vs. 79%, respectively). The test for evidence against homogeneity of the treatment difference across PSS=2 and PSS <2 was not statistically significant (p=0.734).

CONFIDENTIALModule 2.7.3 Summary of Clinical Efficacy
96
The response rate for subjects in the DTG arm was similar for subjects who used DRV/RTV with no primary PI mutations compared to subjects who did not use DRV/RTV or used DRV/RTV but had primary PI mutations (Table 64). In the RAL arm, response rates were higher in subjects who used DRV/RTV without primary PI mutations than in those who either did not use DRV/RTV or did use DRV/RTV, but had primary PI mutations. The test for evidence against homogeneity of the treatment difference across the strata for DRV/RTV use without primary PI mutations (yes/no) was statistically significant (p=0.087) according to the pre-specified 10% type I error cut-off. The treatment difference was not statistically significant from 0 for subjects receiving DRV/RTV without primary PI mutations, but was statistically different in favor of DTG in subjects either not receiving DRV/RTV or receiving DRV/RTV with primary PI mutations. An additional pre-specified analysis within this latter group is described in ING111762 Week 24 CSR Section 6.1.2.2.1.
Table 64 Proportion of Subjects Responding Based on Plasma HIV-1 RNA <50 c/mL at Week 24 by Strata - Snapshot (MSDF) Analysis (mITT-E Population)
ING111762
DTG 50 mg once daily + BR
N=354n/N (%)
RAL 400 mgBID + BR
N=361n/N (%)
Difference in Proportion
(95% CI)(DTG-RAL)a
Response <50 c/mL at Week 24
Baseline Plasma HIV-1 RNA
50,000 c/mL 207 / 249 (83) 195 / 254 (77) 6.4 (-0.6, 13.3)
>50,000 c/mL 74 / 105 (70) 57 / 107 (53) 17.2 (4.3, 30.1)
p-valueb -- -- 0.148
PSS = 2 198 / 249 (80) 185 / 267 (69) 10.2 (2.8, 17.7)
PSS <2 83 / 105 (79) 67 / 94 (71) 7.8 (-4.2, 19.8)
p-valueb -- -- 0.734
DRV/RTV with no primary PI Mutations
Yes 57 / 71 (80) 63 / 78 (81) -0.5 (-13.2, 12.2)
No 224 / 283 (79) 189 / 283 (67) 12.4 (5.1, 19.6)
p-valueb -- -- 0.087
Data Source: ING111762 Week 24 CSR Table 7.5a. Difference: Proportion on DTG - Proportion on RAL (unadjusted).b. One-sided p-value from weighted least squares chi-squared statistic. A p-value 0.10 will be used to indicate
statistically significant evidence of heterogeneity in the difference in proportions across levels of each analysis strata.
3.3.2.3. Plasma HIV-1 RNA <50 c/mL at Week 24 by Selected Baseline Background Regimen and Resistance Subgroups
The proportion of subjects with plasma HIV-1 RNA <50 c/mL was consistently higher in subjects receiving DTG compared to subjects receiving RAL (Table 65), although the difference was not always statistically significant.
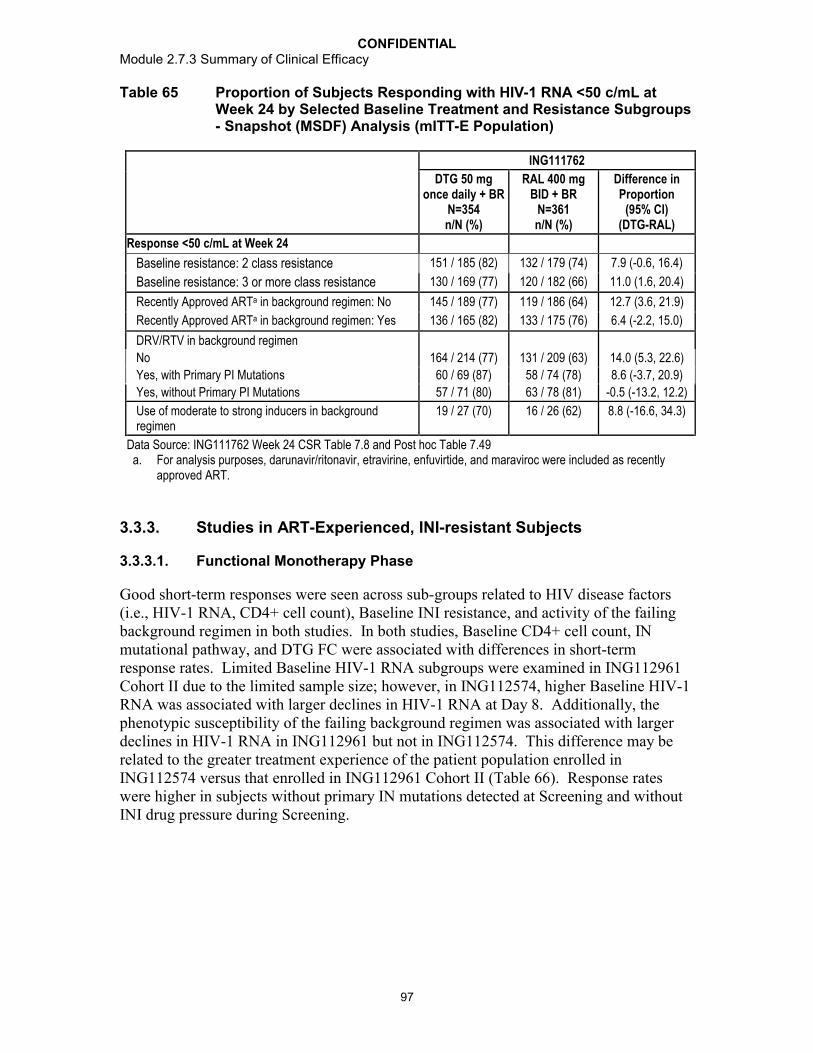
CONFIDENTIALModule 2.7.3 Summary of Clinical Efficacy
97
Table 65 Proportion of Subjects Responding with HIV-1 RNA <50 c/mL at Week 24 by Selected Baseline Treatment and Resistance Subgroups - Snapshot (MSDF) Analysis (mITT-E Population)
ING111762
DTG 50 mgonce daily + BR
N=354n/N (%)
RAL 400 mgBID + BR
N=361n/N (%)
Difference in Proportion
(95% CI)(DTG-RAL)
Response <50 c/mL at Week 24
Baseline resistance: 2 class resistance 151 / 185 (82) 132 / 179 (74) 7.9 (-0.6, 16.4)
Baseline resistance: 3 or more class resistance 130 / 169 (77) 120 / 182 (66) 11.0 (1.6, 20.4)
Recently Approved ARTa in background regimen: No 145 / 189 (77) 119 / 186 (64) 12.7 (3.6, 21.9)
Recently Approved ARTa in background regimen: Yes 136 / 165 (82) 133 / 175 (76) 6.4 (-2.2, 15.0)
DRV/RTV in background regimen
No 164 / 214 (77) 131 / 209 (63) 14.0 (5.3, 22.6)
Yes, with Primary PI Mutations 60 / 69 (87) 58 / 74 (78) 8.6 (-3.7, 20.9)
Yes, without Primary PI Mutations 57 / 71 (80) 63 / 78 (81) -0.5 (-13.2, 12.2)
Use of moderate to strong inducers in background regimen
19 / 27 (70) 16 / 26 (62) 8.8 (-16.6, 34.3)
Data Source: ING111762 Week 24 CSR Table 7.8 and Post hoc Table 7.49a. For analysis purposes, darunavir/ritonavir, etravirine, enfuvirtide, and maraviroc were included as recently
approved ART.
3.3.3. Studies in ART-Experienced, INI-resistant Subjects
3.3.3.1. Functional Monotherapy Phase
Good short-term responses were seen across sub-groups related to HIV disease factors (i.e., HIV-1 RNA, CD4+ cell count), Baseline INI resistance, and activity of the failing background regimen in both studies. In both studies, Baseline CD4+ cell count, IN mutational pathway, and DTG FC were associated with differences in short-term response rates. Limited Baseline HIV-1 RNA subgroups were examined in ING112961 Cohort II due to the limited sample size; however, in ING112574, higher Baseline HIV-1 RNA was associated with larger declines in HIV-1 RNA at Day 8. Additionally, the phenotypic susceptibility of the failing background regimen was associated with larger declines in HIV-1 RNA in ING112961 but not in ING112574. This difference may be related to the greater treatment experience of the patient population enrolled in ING112574 versus that enrolled in ING112961 Cohort II (Table 66). Response rates were higher in subjects without primary IN mutations detected at Screening and without INI drug pressure during Screening.

CONFIDENTIALModule 2.7.3 Summary of Clinical Efficacy
98
Table 66 Change from Baseline in Plasma HIV-1 RNA log10 c/mL at Day 11 and Day 8: Subgroup Analysis in INI-resistant Subjects (LOCDBF, ITT-E)
Factorsa ING112961 ING112574Cohort II
DTG 50 mg BIDN=24
ITT-EDTG 50 mg BID
N=183n Mean [SD] n Mean [SD]
Baseline viral load (c/mL) <10,000 c/mL 7 -1.71 [0.21] - -
10,000 c/mL 17 -1.77 [0.63] - -
<1000 - 21 -0.92 [0.32]1000 to <10,000 - 49 -1.51 [0.49]10,000 to <50,000 - 52 -1.47 [0.66]50,000 to <100,000 - 20 -1.41 [0.59]100,000 to 500,000 - 34 -1.63 [0.65]>500,000 - 6 -1.17 [0.75]Baseline CD4+ cell count <50 cells/mm3 7 -1.58 [0.65]
50 cells/mm3 17 -1.83 [0.48]
<50 - 49 -1.26 [0.68]50 to <200 - 60 -1.53 [0.67]200 to <350 - 34 -1.55 [0.38]350 to <500 - 24 -1.52 [0.43]
500 - 15 -1.20 [0.62]
Baseline IN Mutation pathway Q148 + 2d 2 -1.34 [0.63] 20 -0.98 [0.81] Q148 + 1 8 -1.65 [0.49] 32 -1.13 [0.51] Mixturea or ≥2 primary mutations 1 -1.35 [0] 8 -1.45 [0.76] N155 6 -1.57 [0.56] 33 -1.43 [0.51] Y143 6 -2.10 [0.14] 28 -1.70 [0.42] Otherb IN mutations 1 -2.92 [0] 1 -1.85 [0]Primary integrase mutation detected - 122 -1.34 [0.62]Primary not detected - 60 -1.62 [0.55]Baseline PSSf to failing regimen 0 15 -1.57 [0.50] 96 -1.44 [0.52] 1 6 -1.89 [0.35] 67 -1.47 [0.71] 2 3 -2.43 [0.47] 11 -1.22 [0.50] >2 0 8 -1.26 [0.73]Receipt of prohibited medication(s) in functional monotherapy phasec
No 22 -1.77 [0.55] 176 -1.44 [0.60] Yes 2 -1.64 [0.47] 6 -1.31 [0.74]RAL/EVG treatmentOngoing at Screening - 100 -1.35 [0.63]Discontinued prior to Screening - 82 -1.54 [0.57]Data Source: ING112961 Cohort II Week 48 CSR Table 7.7, Table 7.31, Table 7.100 and Table 7.101;ING112574 Week 24 CSR Table 7.6.a. Mixtures: Q148H + G140S/Y143H (n=1); Q148H,+ E138A+G140S/Y143H (n=2)b. Others: ING112961 E92Q (n=1); none (screen; G140G/S, Q148H/Q) (n=1); ING112574 T66 (n=1)c. Receipt of ETR without DRV/RTV or LPV/RTV (n=2), FPV plus RAL (n=1),TPV/RTV (n=1), EFV (n=1) and
glucocorticoid (n=1) potentially impacting DTG exposure.d. Q148+2

CONFIDENTIALModule 2.7.3 Summary of Clinical Efficacy
99
Within the category of Primary Integrase mutations detected, there was no difference in viral response at Day 8 based on whether or not drug pressure from RAL/EVG was present before DTG was started. Additionally, for subjects with historical integrase inhibitor resistance, viral responses at Day 8 were comparable based on whether or not RAL/EVG was ongoing during screening.
Table 67 ING112574: Primary IN Mutations and INI Drug Pressure at Baseline
Primary IN mutation at Baseline RAL/EVG Status n Mean SD
Detected Discontinued prior to Screening 32 -1.39 0.509
Ongoing at Screening 90a -1.33 0.653
Not detected Discontinued prior to Screening 50 -1.63 0.583
Ongoing at Screening 10 -1.52 0.305
Data Source: ING112574 Week 24 CSR Table 7.100 and Table 7.101a. 91 subjects had primary IN mutation with RAL/EVG ongoing at Screening, but only 90 subjects with Day 8
viral load data
Linear Regression Analyses for Functional Monotherapy
A key secondary objective in ING112574 was to explore the impact of Day 1 covariates (e.g. demographics, HIV RNA, resistance to DTG, overall susceptibility score of background ART) and PK on treatment response (e.g. antiviral activity, development of resistance, and/or AEs) using multivariate analysis.
A number of factors were included in the model building in Step 1 that would be considered highly correlated: IN genotypic pathway and/or number of IN mutations with FC in half-maximal inhibitory concentration (IC50); DTG pre-dose concentration (C0)and FC with phenotypic inhibitory quotient (PIQ); OSS/PSS and GSS. As the initial results indicated Baseline DTG resistance (represented by DTG FC in susceptibility) to have the strongest impact on the Day 8 HIV-1 RNA change from Baseline, further regression analyses were conducted to determine which of the Baseline resistance factors would be individually impactful when assessed in separate linear regression models adjusting for other factors identified from the model building process.
Of all factors examined, Baseline IN resistance and Baseline HIV-1 RNA were strongly associated with the Day 8 response (ING112574 Week 24 CSR Section 6.2.1.2). Table 68 shows the effects of each parameter, with Baseline resistance represented by genotypic resistance pathway.

CONFIDENTIALModule 2.7.3 Summary of Clinical Efficacy
100
Table 68 ING112574: Summary Results of Multivariate Linear Regression Analyses for Change from Baseline in Plasma HIV-1 RNA (log
10 c/mL) at Day 8 against Baseline Characteristics (LOCFDB, VO) including IN Mutation Category
When compared to the response with the Y143 pathway virus (-1.7 log10 c/mL reduction; Data Source: ING112574 Week 24 CSR Section 6.2.1.1) subjects with virus exhibiting the mutation category Q148+2 showed a reduced response, with a 0.72 log10c/mL lower response compared to that of the Y143 genotypic category. Other representations of Baseline resistance are explored in the CSR (Data Source: ING112574 Week 24 CSR, Section 9).
3.3.3.2. Optimized Phase
Table 68 summarizes the longer term response rates in INI-resistant subjects based on subgroups, including Baseline HIV-1 RNA, CD4+ cell count, activity of the OBR (PSS), and IN mutational pathway. There was no multivariate analysis of predictors conducted based on Cohort II data due to the small number of subjects. Factors that impact virologic response in ING112574 from multivariate analyses included Baseline HIV-1 RNA, CD4+ cell count, DTG FC and IN categories(Data Source: ING112574 Week 24 CSR, Table 7.34). Increasing activity of the OBR had no impact on response at Week 24 in ING112574. This may be due, in part, to the weaker activity of the additional active agents (beyond 1) in ING112574; in many instances, these 2nd and 3rd active agents were NRTIs (Data Source: ING112574 Week 24 CSR, Section 6.3.2.2). DTG is efficacious (sustained viral load suppression) in a population of patients with current or historicalclinically-relevant integrase mutations and DTG FC.
Baseline factors N Effect of Estimated effect
S.E. 95% CI for estimated
effect
P-value
IN mutation category: 143 vs Y143
Q148+2 0.72 0.155 (0.41 ,1.02) <0.0001
Q148+1 0.48 0.147 (0.19, 0.77) 0.0014N155 0.10 0.149 (-0.19, 0.04) 0.4952Primary not detected 0.06 0.130 (-0.20, 0.32) 0.6451
Baseline HIV-1 RNA (c/mL) 10-fold increase
-0.12 0.050 (-0.22, -0.02) 0.0164
DTG PK exposure – Day 8 C0g/mL
1 unit increase
-0.05 0.023 (-0.09,- 0.00) 0.0355
PSSf of Day 1 to 8 ART vs 0>2 0.53 0.246 (0.05, 1.02) 0.03232 0.43 0.199 (0.04, 0.83) 0.03061 -0.05 0.093 (-0.24, 0.13) 0.5680Data Source: ING112574 Week 24 CSR Table 7.37

CONFIDENTIALModule 2.7.3 Summary of Clinical Efficacy
101
Table 69 Proportion of Subjects with Plasma HIV-1 RNA <50 c/mL: Subgroup Analysis for INI-Resistant Subjects
Baseline factors ING112961 ING112574Week 48/TLOVR Week 24/Snapshot (MSDF)
Cohort IIDTG 50 mg BID + BR
N=24
Week 24 ITT-EDTG 50 mg BID + BR
N=114Viral load, n (%)<10,000 c/mL 6/7 (86) N/A
10,000 c/mL 11/17 (65) N/A
<1000 c/mL - 11/12 (92)1000 to <10,000 c/mL - 23/30 (77)10,000 to <50,000 c/mL - 21/ 29 (72)50,000 to <100,000 c/mL - 8/ 13 (62)100,000 to 500,000 c/mL - 8/ 24 (33)
>500,000 c/mL - 1/ 6 (17)CD4+ cell count, n (%) <50 cells/mm3 4/7 (57) 11/ 36 (31)
50 cells/mm3 13/17 (76) 61/78 (78)
PSSf to OBR at Day 11/8a, n (%) 0 1/1 (100) 4/ 5 (80) 1 6/9 (67) 27/ 41 (66) 2 8/11 (73) 29/ 47 (62) >2 2/3 (67) 12/ 21 (57)IN Mutation, n (%)
Q 148+2 1/2 (50) 0/ 12
Q148+1 4/8 (50) 10/ 20 (50)
Mixture or 2 Primary Mutations 1/1 (100) 3/5 (60)
N155 6/6 (100) 18/ 21 (86)Y143 4/6 (67) 10/ 15 (67)Other 1/1 (100) N/AFC in IC50 to DTG
Missing - 4/ 4 (100)0 to 2.5 - 58/ 78 (74)>2.5 to 4 - 2/ 8 (25)>4 to 8 - 5/ 11 (45)>8 to 10 - 1/ 4 (25)>10 to 15 - 1/ 5 (20)>15 to 20 - 1/ 3 (33)
>20 to 25 - 0/0>25 - 0/ 1<2 7/9 (78) -≥2 10/15 (67) -Data Source: ING112961 Cohort II Week 48 Table 7.16; ING112574 Week 24 CSR Table 7.31Note: PSSf: Phenotypic susceptibility score on fully active agents.
a. Day 11 for ING112961 and Day 8 for ING112574

CONFIDENTIALModule 2.7.3 Summary of Clinical Efficacy
102
Regression Analyses for Week 24
Aligned with the objective to explore the impact of Day 1 covariates (e.g. demographics, HIV RNA, resistance to DTG, overall susceptibility score of background ART) and PK on treatment response, logistic regression analyses were conducted for predictive factors for the Week 24 response.
As with the multivariate analyses conducted on Day 8 response, a number of factors were included that would be considered highly correlated: IN genotypic pathway and/or number of IN mutations with FC in IC50; DTG C0 and FC with PIQ; OSS/PSS and GSS. Similar to the Day 8 analyses, further models were conducted to determine whether genotypic and phenotypic resistance were individually significant predictors of response adjusting for potential confounding factors identified from the model building process(Data Source: ING112574 Week 24 CSR, Section 6.3.2.2).
As both DTG FC and the number of IN resistance mutations remained in the second step of the regression analyses (Data Source: ING112574 Week 24 Table 7.34) three additional models were conducted to evaluate the individual contributions of FC, mutation category and number of IN mutations (Data Source: ING112574 Week 24 CSR Table 7.39, Table 70, and Table 7.41).
In these further analyses, similar to Baseline FC in susceptibility to DTG, Baseline IN mutation category was strongly predictive of outcome (p<0.001). After adjusting for the covariates Baseline HIV-1 RNA and CD4+cell count, DTG exposure, OBR susceptibility (full PSS score), subjects with a higher Baseline DTG FC, or whose virus exhibited the Q148+2 or Q148+1 pathways or who had a larger number of IN resistance mutations at Baseline were all less likely to respond at Week 24 with their HIV-1 RNA suppressed to <50 c/mL. The Odds Ratio for response was particularly low at 0.005 for those harbouring virus with Q148+2 secondary mutations at Baseline when compared to the response rate in those with Y143 virus.

CONFIDENTIALModule 2.7.3 Summary of Clinical Efficacy
103
Table 70 ING1112574: Summary Results of Multivariate Logistic Regression Analyses for Proportion of Subjects with Plasma HIV-1 RNA <50 c/mL at Week 24 against Baseline Factors (Snapshot [MSDF], VO) including IN Mutation Category
Baseline Factors n Effect of Odds Ratio 95% CI for Odds Ratio
P-value
IN mutation category: 100 vs Y143
Q148+2 0.005 (0.000, 0.130) 0.001
Q148+1 0.124 (0.014, 1.084) 0.059N155 0.524 (0.054, 5.119) 0.579Primary not detected 1.600 (0.276, 9.266) 0.600
HIV-1 RNA (c/mL) 10-fold increase
0.195 (0.057, 0.662) 0.009
CD4+ (cell/mm3) 50-unit increase
1.619 (1.098, 2.386) 0.015
DTG exposure: C0-average (g/mL)
1 unit increase
1.049 (0.681, 1.616) 0.829
PSSf to OBR: vs 1>2 0.785 (0.175, 3.516) 0.7512 0.512 (0.084, 3.122) 0.468Data Source: ING112574 Week 24 CSR Table 7.40
3.3.3.3. Antiviral Activity of DTG by Baseline Resistance in INI-resistant Subjects in ING112574
As per the FDA Guidance for Industry and the European Medicines Agency (EMA) guideline, analyses of antiviral activity of DTG observed in Study ING112574 were conducted according to genotypic and/or phenotypic resistance [FDA, 2007; EMA, 2009]. In this analysis no precise phenotypic FC cut-off could be defined to effectively predict antiviral activity at both Day 8 and Week 24. Three integrase mutation groups could be derived and were found to correlate with antiviral response: ‘No Q148 mutation’ (Y143, N155H, T66, and E92Q mutations or historical evidence of INI resistance), ‘Q148+1’ (Q148H/K/R with one mutation [G140A/C/S, L74I, E138A/K/T]), and ‘Q148+2’ (Q148H/K/R with two or three mutations [G140A/C/S, L74I, E138A/K/T]).
More than 90% of subjects achieved full response (>1 log10 c/mL decline or <50 c/mLplasma HIV-1 RNA) at Day 8 in the group of subjects with 155/143/66/92/no primary mutation detected. In subjects with Q148 mutations, virologic response at Day 8 decreased with increasing number of secondary mutations, however approximately half of subjects with Q148+2 still achieved full response at Day 8 (Table 71).

CONFIDENTIALModule 2.7.3 Summary of Clinical Efficacy
104
Table 71 ING112574: Virologic Response (Plasma HIV-1 RNA) at Day 8 by Derived Baseline IN Resistance Mutation Group (Day 8 Virologic Outcome Population, N=177)
INI Mutations at Baseline Number of Subjects
Mean CFB (SD)c at Day 8 % >1 log10 Decline or <50 c/mL at Day 8
No Q148H/K/R mutationsa 122 -1.59 (0.51) 92%
Q148 + 1 secondary mutationb 35 -1.18 (0.52) 71%
Q148 + 2 secondary mutationsb 20 -0.92 (0.81) 45%Data Source: m5.3.5.4 ING112574 Annex B Virology Report Table 12.106 and Table 12.110a. CFB: Change from Baseline; SD: Standard deviation.b. Includes Baseline primary IN resistance mutations N155H, Y143C/H/R, T66A, E92Q and primary mutation
not detected at Baseline. c. G140A/C/S, E138A/K/T, L74I.
After the monotherapy phase (i.e., Day 8 visit), subjects were to optimize their background regimen. Of the 114 subjects who completed 24 weeks on study or discontinued before data cutoff, 72 (63%) had <50 c/mL RNA at Week 24 (Snapshot[MSDF]). In subjects with Q148 mutations, virologic response at Week 24 decreased with increasing number of secondary mutations (Table 72). Background overall susceptibility score (OSS) was not associated with Week 24 response (Table 72), highlighting the independent activity of DTG in driving sustained virologic responses in this INI-resistant population.
Table 72 Number and % of Subjects with HIV-1 RNA <50 c/mL at Week 24 by OSS of OBR and Derived IN Resistance Mutation Group (Snapshot[MSDF]) (Week 24 Virologic Outcome Population, N=101)
Derived IN Mutation Group OSS=0 OSS=1 OSS=2 OSS>2 Total
No Q148H/K/R mutationsa 2/2 (100%) 24/29 (83%) 21/28 (75%) 10/13 (77%) 57 (79%)
Q148 + 1 secondary mutationb 2/2 (100%) 3/7 (43%) 4/11 (36%) - 9 (45%)
Q148 + 2 secondary mutationsb 1/2 (50%) 0/7 - - 1 (11%)
Data Source: ING112574 Annex B Virology Report Table 12.107a. Includes Baseline primary IN resistance mutations N155H, Y143C/H/R, T66A, and primary mutation not
detected.b. G140A/C/S, E138A/K/T, L74I.
3.3.4. Virologic Response Rates in Historical Studies
As ING112574 did not include a comparator agent in the study design, a summary of virologic outcomes from historical studies for antiretroviral agents addressing in-class resistance is presented below. As ING112574 required use of at least 1 fully active drug in the background regimen, the most relevant comparison is to response rates for regimens including investigational agent and an OBR with PSS 1. Week 24 DTG virologic response rates in ING112574 are comparable or better than those observed in these historical studies, keeping in mind the limitations of cross-study comparisons and different analyses applied to the virologic endpoints.

CONFIDENTIALModule 2.7.3 Summary of Clinical Efficacy
105
Table 73 Studies of Agents Addressing In-class Resistance
StudyComparison Incl. Criteria
Endpoint / Time point
OBR ActivityActive
responsen/N (%)
Comparator responsen/N (%)
Reference
DUET-1 ETR vs. PBOFailing ART, ≥1 NNRTI and ≥3 PI mutations
<50 c/mL at Week 24
0 (# active) 21/45 (47) 4/46 (9)
Madruga, 2007
1 62/105 (59) 23/95 (24)
2 45/66 (68) 57/93 (61)
3+ 40/61 (66) 32/49 (65)
Any 170/304 (56) 119/308 (39)
DUET-2 ETR vs. PBOFailing ART, ≥1 NNRTI and ≥3 PI mutations
<50 c/mL at Week 24
0 (# active) 19/43 (44) 3/45 (7)
Lazzarin, 2007
1 58/94 (62) 40/116 (34)
2 67/82 (82) 45/64 (70)
3+ 39/49 (80) 37/51 (73)
Any 183/295 (62) 129/296 (44)
POWER-1 and -2 DRV vs. CPI3 class experience, ≥1 primary PI mutation
<50 c/mL at Week 48
0 (#active) 5/25 (20) 0/18
Clotet, 20071 17/34 (50) 1/ 40 (3)
2+ 27/ 48 (56) 10/ 60 (17)
Any 50/110 (45) 12/120 (10)
POWER-3DRV (no comparator)
3 class experience, ≥1 primary PI mutation
<50 c/mL at Week 24
ENF-naïve 24/53 (45) N/A
Molina, 2007ENF reused 13/49 (27) N/A
ENF not used 61/144 (42) N/A
Any 98/246 (40) N/A
RESIST-1 and -2 TPV vs. CPI
3+ mos 3 class experience, incl ≥2 PI regimens , ≥1 primary PI mutation
<50 c/mL at Week 24 Any 139/582 (24) 54/577 (9)
Gathe, 2006; Cahn, 2006>1 log10 c/mL drop
at Week 24
0 (# GT susc) 11.6-21.1% 0-13.2%
3+ 54.7-57.6% 29.8-41%
Any 240/582 (41) 109/577 (19)
CPI, control protease inhibitor; DRV, darunavir; EFN, enfuvirtide; ETR, etravirine; PBO, placebo; TPV, tipranavir

CONFIDENTIALModule 2.7.3 Summary of Clinical Efficacy
106
4. ANALYSIS OF CLINICAL INFORMATION RELEVANT TO DOSING RECOMMENDATIONS
This section describes the data relevant to dose selection decisions made with DTG, and concludes with the data and subsequent decisions regarding the selected dose in treatment-naive adults, treatment-experienced and INI-naive adults and adolescents (of 12 to <18 years old and at least 40 kg of weight), and INI-resistant adults with HIV-1 infection.
Clinical pharmacology data to support dose recommendations in various patient populations and with concomitant medications are detailed in m2.7.2.
4.1. Dose Selection for ART-Naïve Adult Subjects
Dolutegravir 50 mg once daily in combination with other ART is recommended for treatment-naive adults with HIV-1 infection. The selection of the 50 mg once daily dose for evaluation in the Phase III program was based upon data from the Phase IIb dose-ranging study ING112276 comparing DTG 10 mg, 25 mg, and 50 mg once daily dose in treatment-naive adults. Two Phase III studies, ING113086 and ING114467, were performed to demonstrate the non-inferiority of DTG 50 mg once daily against the selected comparator drug in combination with NRTIs in ART-naive adult subjects. An additional large ongoing Phase IIb study, ING114915, in treatment-naive subjects is also administering DTG 50 mg once daily.
4.1.1. Phase IIb Study ING112276
Study ING112276 assessed durability of response (through 96 weeks) and safety profiles across DTG doses at 10 mg, 25 mg, and 50 mg once daily in combination with NRTIs in HIV-1infected, treatment-naïve adult subjects (Section 1.7.2.2 for study design). A fourth cohort of subjects received EFV with NRTIs as a control arm. A sustained antiviral response without genotypic or phenotypic evidence of INI or NRTI resistance through Week 96 was observed at the 50 mg DTG dose and no apparent relationship between DTG dose and antiviral response was observed (Section 2.2.2; ING112276 Week 96 CSR). DTG was well tolerated at all doses evaluated. The maximum tested dose, 50 mg once daily, was selected for the evaluation in Phase III program in treatment-naive adult subjects and treatment-experienced (INI-naive) adult subjects to accommodate potential reductions in DTG exposure by intrinsic or extrinsic factors, e.g. drug-drug interaction, imperfect adherence, or other causes (Section 1.6.1).
4.1.2. Pivotal Phase III ART-Naive Studies
In the pivotal Phase III Study ING113086, the efficacy of DTG 50 mg once daily + 2 NRTIs for the management of HIV-1 infection in ART-naive adult subjects was demonstrated to be non-inferior to RAL 400 mg BID + 2 NRTIs through Week 48 based on the 10% non-inferiority margin (see Section 2.1.1). Few subjects experienced protocol-defined virologic failure (5% on DTG arm and 7% on RAL arm), and while one and four subjects on RAL had INI and/or NRTI mutations at failure, respectively, there

CONFIDENTIALModule 2.7.3 Summary of Clinical Efficacy
107
were no subjects on DTG who had INI or NRTI mutations detected (See Section 3.2.3). The safety profile for DTG was similar to RAL (m2.7.4).
In the pivotal Phase III study ING114467, the efficacy of DTG +ABC/3TC 50 mg/600 mg/300 mg once daily was demonstrated to be superior to Atripla (See Section 2.1.2). Subjects receiving the DTG-containing regimen had fewer withdrawals due to AEs when compared to the EFV-containing regimen, which led to greater overall treatment success with the DTG-containing regimen (See Section 2.1.2). As observed in ING113086, no subjects who received DTG+ ABC/3TC had primary INI or NRTI mutations; in contrast, four subjects treated with EFV/TDF/FTC developed primary NNRTI mutations, and one developed primary mutations to the NRTI backbone (See Section 3.2.3). The DTG-containing regimen (DTG+ABC/3TC) in ING114467 had a safety profile that was generally favourable when compared with the EFV-containing regimen (EFV/TDF/3TC) (See m2.7.4 for details).
In ING113086 and ING114467, virologic response rate differences between DTG and RAL and DTG/ABC/3TC and Atripla, respectively, were maintained across demographic subgroups including age, gender and race (See Section 3.3.1.1), with comparable and adequate response rates noted for each treatment group within each sub-group. Therefore the same dose of DTG may be administered regardless of demographic characteristic.
The Week 48 response rates for subjects receiving DTG 50 mg once daily in combination with backbone NRTI was consistent with the Week 48 response rate for RAL 400 mg twice daily (86%) and EFV 600 mg once daily (82%) observed in the STARTMRK study, and with the Week 48 response rates observed for tenofovir/emtricitabine/ cobicistat/elvitegravir and Atripla (88% and 84%, respectively) in naive subjects [Lennox, 2009; Sax, 2012]. Therefore, the DTG response rates (HIV-1 RNA <50 c/mL) assessed at Week 48 in both studies were similar to those observed with standard of care third agents in contemporary studies in treatment-naive populations.
The antiviral efficacy of the DTG 50 mg once daily dose has thus been demonstrated in two well-controlled studies against standard of care comparators and has shown comparable efficacy across key demographic sub-groups. Thus, DTG 50 mg once daily is the recommended dose for all treatment-naive, HIV-infected adults.
4.1.3. ART-Naïve Pharmacokinetic and Pharmacokinetic/Pharmacodynamic Analysis
DTG C0 was estimated at 1.18 g/mL (geometric mean), which is 18 times higher than the in vitro PA-IC90 (0.064 g/mL), based on sparse PK sampling in Study ING113086 (see m2.7.2 for details). Based on a population PK analysis using pooled data (ING111521, ING112276, and ING113086), neither demographic characteristics (e.g., gender, race, age, weight), co-infection status (e.g., hepatitis C), smoking status, nor other lab parameters (e.g., bilirubin, alanine aminotransferase [ALT], aspartate aminotransferase [AST], creatinine clearance [CRCL]) were determined to cause clinically significant differences in DTG exposure requiring dose adjustment (see m2.7.2 for details).

CONFIDENTIALModule 2.7.3 Summary of Clinical Efficacy
108
In Study ING112276, no exposure-response relationship was identified for efficacy endpoints (See m2.7.2, Section 2.3.4). The lack of DTG exposure-antiviral activity and DTG exposure-immunologic response relationship was consistent with the high response rates and low virologic failure rate observed in this study, as would be expected given that all three doses achieved exposures on the plateau of the dose-response curve defined in Study ING111521.
4.1.3.1. Supportive Study ING111521
Study ING111521 was a Phase IIa, randomized, double-blind, dose-ranging study. In this study, INI-naive, HIV-1-infected adults currently off antiretroviral therapy were randomized to receive DTG (2, 10, or 50 mg) or placebo once daily for 10 days in an eight active and two placebo randomization scheme per DTG dose. Placebo patients were pooled for the purpose of analysis.
Significant reductions in plasma HIV-1 RNA from Baseline to Day 11 were observed for all DTG dose groups compared with placebo (p<0.001), with a mean decrease of 1.51 to 2.46 log10 c/mL. In addition, a well characterized dose-response relationship was observed for viral load decrease. Most patients (7/10, 70%) receiving DTG 50 mg achieved plasma HIV-1 RNA less than 50 c/mL. The pharmacokinetic variability was low (coefficient of variation, range 25 to 50%). Plasma HIV-1 RNA reduction was best predicted by Cτ using an Emax model (Figure 7; see m2.7.2, Section 2.3.3). Based on data from this study, doses were selected for evaluation in ING112276, the Phase IIb, dose-ranging, therapeutic study in treatment-naïve, HIV-infected subjects.
4.2. Dose Selection for ART-Experienced, INI-Naive Adult Subjects
Dolutegravir 50 mg once daily is recommended for treatment-experienced, INI-naive adults with HIV-1 infection. The selection of the 50 mg once daily dose for evaluation in the Phase III program was based upon data from ING112276. One Phase III study, ING111762, was performed to demonstrate the non-inferiority of DTG 50 mg once daily against the selected comparator drug, RAL, both in combination with an investigatorselected background regimen in treatment-experienced, INI-naive adult subjects.
4.2.1. Principle of Dose Selection
In addition to the dose selection strategy discussed in Section 4, special consideration of dose selection was given for Study ING111762 in terms of effect of background therapy and potential impact of drug-drug interactions between DTG with concomitant antiviral therapy.
4.2.1.1. Impact of Background Therapy and Predicted Durability of DTG on Selected Dose
As subjects evaluated in ING111762 have various background antiviral therapy components with variable activity and Baseline resistance, the selected dose of DTG needed to deliver high drug pressure (e.g., exposure), especially in patients with less than 2 fully active anti-retroviral agents in their background therapy in order to achieve long-

CONFIDENTIALModule 2.7.3 Summary of Clinical Efficacy
109
term durability. To ensure durability of response in the setting of a treatment-experienced subject, the highest once daily (50 mg) dose of DTG assessed in ING112276 was also evaluated in ING111762. Similar to the rationale for ART-naïve subjects, the 50 mg dose provides high exposures that compensate, in part, for any deficiencies of partially active background therapy and for any drug interactions decreasing DTG exposures.
4.2.2. Pivotal Phase III Study ING111762 (ART-Experienced, INI-Naive)
The efficacy of DTG once daily in ART-experienced, INI-naive subjects was confirmed by the Week 24 results of Study ING111762. At Week 24, virologic suppression (HIV-1 RNA <50 c/mL) in the DTG arm (79%) was statistically significantly greater than in the RAL arm (70%) based on the pre-specified analysis of outcomes of the FDA Snapshot (MSDF) algorithm (adjusted treatment difference and 95% CI 9.7 [3.4, 12.3], p=0.003). This result was supported by the Per-Protocol analysis, where 81% and 72% of DTG and RAL subjects, respectively, achieved plasma HIV 1 RNA <50 c/mL at Week 24 adjusted treatment difference and 95% CI: 9.3 [3.0, 15.7]. Other pre-specified sensitivity analyses confirmed these results. Virologic response rate treatment differences were comparable across key subgroups including gender, race and HIV-1 subtype. Virologic response rate treatment differences were also consistent across the number of active agents in the background regimen and Baseline resistance. More subjects on DTG than on RAL achieved virologic suppression with a Baseline background regimen of <2 active agents (PSSf<2, DTG: 79%; RAL: 71%; PSSp=1, DTG: 77%; RAL: 64%; GSS<2, DTG: 79%; RAL 68%) and with 2-class (DTG: 82%; RAL: 74%) and 3-class (DTG: 77%; RAL: 66%) resistance.
4.2.2.1. Comparison to Historical Studies
In the BENCHMRK studies in a treatment-experienced, INI-naïve patient population, RAL subjects who suppressed had done so by Week 4, remained suppressed at Week 16 and 24, and in general, had durable suppression at Week 48 [Steigbigel, 2008].
Therefore, the Week 24 response was a good predictor of longer term response at Week 48 (HIV-1 RNA <50 c/mL: 60% (BENCHMRK-1) and 65% (BENCHMRK-2) at Week 24 with a combined response rate of 63% at Week 48) [Steigbigel, 2008].
The performance of RAL in ING111762 is comparable to historical studies with RAL in this patient population. As the BENCHMRK studies included subjects with 3 active and <1 active background agent, consideration should be given for the sub-group analysis for phenotypic susceptibility score (PSS) and a similar population to that enrolled in ING111762. Using an observed-failure approach, response rates for RAL in BENCHMRK-1 and -2 were 61% and 71% for PSS of 1 and 2, respectively, at Week 48 [Cooper, 2008]. RAL response rates in ING111762 were comparable to the response rates observed in BENCHMRK-1 and -2 for PSS of 1-2. In a more recent study in treatment-experienced, integrase-naïve subjects, response rates for EVG versus RAL were 59% and 58% of subjects, respectively, for HIV-1 RNA <50 c/mL (TLOVR algorithm) at Week 48 [Molina, 2012]. The RAL response rate at Week 24 in ING111762 was numerically higher than the response rate for RAL at Week 24 seen in this study versus EVG with a similar design and patient population.
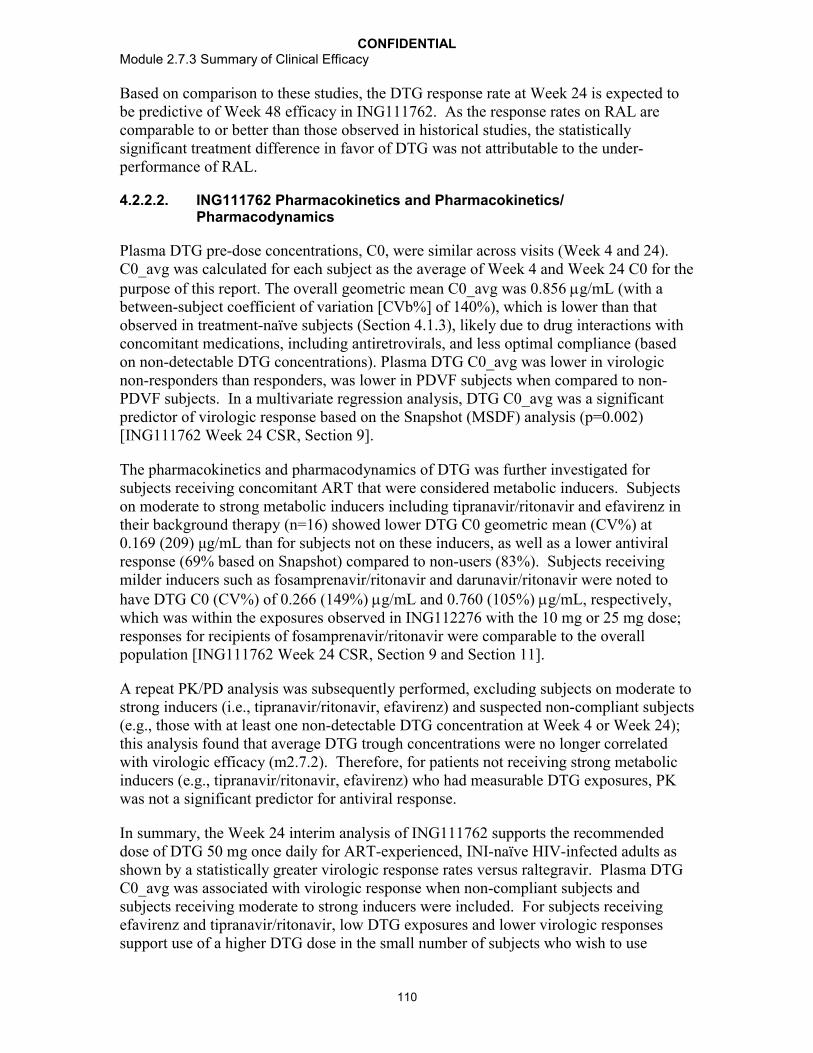
CONFIDENTIALModule 2.7.3 Summary of Clinical Efficacy
110
Based on comparison to these studies, the DTG response rate at Week 24 is expected to be predictive of Week 48 efficacy in ING111762. As the response rates on RAL are comparable to or better than those observed in historical studies, the statistically significant treatment difference in favor of DTG was not attributable to the under-performance of RAL.
4.2.2.2. ING111762 Pharmacokinetics and Pharmacokinetics/ Pharmacodynamics
Plasma DTG pre-dose concentrations, C0, were similar across visits (Week 4 and 24). C0_avg was calculated for each subject as the average of Week 4 and Week 24 C0 for the purpose of this report. The overall geometric mean C0_avg was 0.856 g/mL (with a between-subject coefficient of variation [CVb%] of 140%), which is lower than that observed in treatment-naïve subjects (Section 4.1.3), likely due to drug interactions with concomitant medications, including antiretrovirals, and less optimal compliance (based on non-detectable DTG concentrations). Plasma DTG C0_avg was lower in virologic non-responders than responders, was lower in PDVF subjects when compared to non-PDVF subjects. In a multivariate regression analysis, DTG C0_avg was a significant predictor of virologic response based on the Snapshot (MSDF) analysis (p=0.002) [ING111762 Week 24 CSR, Section 9].
The pharmacokinetics and pharmacodynamics of DTG was further investigated for subjects receiving concomitant ART that were considered metabolic inducers. Subjects on moderate to strong metabolic inducers including tipranavir/ritonavir and efavirenz in their background therapy (n=16) showed lower DTG C0 geometric mean (CV%) at 0.169 (209) μg/mL than for subjects not on these inducers, as well as a lower antiviral response (69% based on Snapshot) compared to non-users (83%). Subjects receiving milder inducers such as fosamprenavir/ritonavir and darunavir/ritonavir were noted to have DTG C0 (CV%) of 0.266 (149%) g/mL and 0.760 (105%) g/mL, respectively, which was within the exposures observed in ING112276 with the 10 mg or 25 mg dose; responses for recipients of fosamprenavir/ritonavir were comparable to the overall population [ING111762 Week 24 CSR, Section 9 and Section 11].
A repeat PK/PD analysis was subsequently performed, excluding subjects on moderate to strong inducers (i.e., tipranavir/ritonavir, efavirenz) and suspected non-compliant subjects (e.g., those with at least one non-detectable DTG concentration at Week 4 or Week 24); this analysis found that average DTG trough concentrations were no longer correlated with virologic efficacy (m2.7.2). Therefore, for patients not receiving strong metabolic inducers (e.g., tipranavir/ritonavir, efavirenz) who had measurable DTG exposures, PK was not a significant predictor for antiviral response.
In summary, the Week 24 interim analysis of ING111762 supports the recommended dose of DTG 50 mg once daily for ART-experienced, INI-naïve HIV-infected adults as shown by a statistically greater virologic response rates versus raltegravir. Plasma DTG C0_avg was associated with virologic response when non-compliant subjects and subjects receiving moderate to strong inducers were included. For subjects receiving efavirenz and tipranavir/ritonavir, low DTG exposures and lower virologic responses support use of a higher DTG dose in the small number of subjects who wish to use

CONFIDENTIALModule 2.7.3 Summary of Clinical Efficacy
111
tipranavir/ritonavir or efavirenz together with DTG. Additionally, etravirine, as currently advised in all clinical studies, should be co-administered with a boosted protease inhibitor (e.g., darunavir/ritonavir, lopinavir/ritonavir or atazanavir/ritonavir) with DTG 50mg once daily. When excluding these subjects receiving efavirenz, tipranavir/ritonavir and etravirine alone (no PI) along with non-compliant subjects, the effect of DTG PK on virologic endpoints was no longer present, suggesting that a sufficiently high DTG exposure was achieved for robust virologic responses for the rest of the population. Therefore, the recommended DTG dose for ART-experienced, INI-naïve HIV-infected adults is 50 mg once daily.
4.3. Dose Selection for ART-Experienced, INI-Resistant Adult Subjects
Dolutegravir 50 mg twice daily is recommended for treatment-experienced, INI-resistant adults with HIV-1 infection. The selection of the 50 mg twice daily dose for evaluation in the Phase III program was based upon data from the Phase IIb dose-ranging study ING112961, with sequential cohorts receiving DTG 50 mg once daily and 50 mg twice daily doses in RAL-resistant adults (Section 1.6.2). One Phase III study, ING112574, was performed to demonstrate the efficacy and safety of DTG 50 mg twice daily dose in combination with OBR in treatment-experienced, INI-resistant adult subjects.
4.3.1. Pivotal Phase III Study ING112574
The efficacy of DTG BID in ART-experienced subjects with INI resistance was confirmed by the Day 8 and Week 24 results of Study ING112574 (Section 1.7.1.4 and Section 2.1.4). The majority of subjects with RAL and/or EVG resistance (historic or current) showed a good and rapid response to DTG 50 mg BID administered with failingbackground therapy to Day 8 and with an optimized background thereafter. At Day 8, 82% (150/183) of subjects in the ITT-E population had greater than 1 log10 c/mL decline in HIV-1 RNA (See Section 2.1.4, Table 15). At Week 24, 63% (72/114) of subjects had plasma HIV-1 RNA <50 c/mL (See Section 2.1.4). When considering subjects without Q148 plus two or more secondary mutations in IN (who represent the majority of the INI-resistant patient population), 66/92 (72%) of subjects in the virologic outcome population were fully suppressed at Week 24 (See Section 3.3.3.2, Table 69).
4.3.1.1. Correlation between Baseline Factors and Efficacy
In analyses of Day 8 antiviral response adjusting for Baseline covariates, Baselineresistance (reflected by either DTG FC or Baseline IN mutation pathway) was the majordriver of response. The presence of the Q148+2 and Q148+1 mutations reduced the Day 8 response by 0.72 log10 c/mL (p<0.0001) and 0.48 log10 c/mL, (p=0.0014) respectively, compared to that of the Y143 mutation category. A doubling of the DTG FC reduced the response by 0.18 log10 c/mL (p<0.001). DTG exposure (Day 8 C0 g/mL) was also associated with Day 8 response in one of the 3 models, but the estimated effect was very small in all models: for every 1g/mL increase in DTG Day 8 C0, a further decrease in plasma HIV-1 RNA at Day 8 of 0.05 log10 c/mL was observed (See Section 3.3.3).

CONFIDENTIALModule 2.7.3 Summary of Clinical Efficacy
112
Multivariate analyses of factors impacting response indicated Baseline resistance to be the strongest predictor of response at Week 24, with higher FC in susceptibility to DTG, and the presence of virus with Q148+ 2 secondary integrase inhibitor resistance mutations reducing the proportion of subjects with HIV RNA <50 c/mL. However, HIV-1 infected adults harboring viruses with Q148+ 2 secondary integrase inhibitor resistance mutations and/or high level of DTG FC in IC50 represent a very small sub-population of adults with HIV-1 INI-resistant virus. In the Screening population of ING112574, 26/269 (10%) of subjects harbored viruses with Q148+ 2 secondary integrase inhibitor resistance mutations, and 15/274 (5.5%) had DTG FC in excess of 10 (ING112574 Week 24 CSR, Table 96 and Table 97). In a separate analysis of approximately 700 unrelated clinical isolates with raltegravir resistance, viruses with Q148+ 2 secondary integrase inhibitor resistance mutations represented only 13% of the population and those with DTG FC >10 represented only 6% of the population (m2.7.2.4, Section 4.1.12.3.2). Considering the strong influence of Baseline resistance on response and the relatively narrow range of exposures, DTG exposure was not associated with Week 24 response.
Finally, the activity of the OBR co-administered with DTG from Day 8 was not clearly associated with Week 24 response, indicating that the longterm antiviral activity was predominantly driven by DTG.
4.3.1.2. Comparison to Historical Studies
Recognizing the limitations of cross-study comparisons, it is notable that the study population enrolled in ING112574 had similarly advanced disease but higher-treatment experience and Baseline resistance when compared to the study population enrolled in the Phase III ETR DUET studies [Madruga, 2007; Lazzarin, 2007]; the ING112574 population also had more advanced disease and was more highly treatment-experienced with more Baseline resistance than the study populations in prior Phase III studies in ART-experienced subjects for DRV/RTV in the POWER studies [Clotet, 2007], RAL in the BENCHMRK studies [Steigbigel, 2008] and EVG in the GS-US-183-0145 Study [Molina, 2012]. A combined analysis of the POWER 1 and 2 study data showed DRV/RTV to induce HIV-1 RNA suppression to <50 c/mL at Week 24 (ITT-TLOVR) in 45% of subjects with 3-class ART experience [Clotet, 2007]. A similar analysis of the combined BENCHMRK studies, where first-in-class RAL was used in INI-naïve subjects, showed approximately 60% of subjects had plasma HIV-1 RNA <50 c/mL at Week 24 [Steigbigel, 2008]. Thus, DTG responses in INI-resistant subjects in ING112574 were similar in magnitude to responses achieved by RAL in integrase naïve subjects.
4.3.1.3. Pharmacokinetics
The overall geometric mean plasma DTG pre-dose concentration (C0_avg) for 50 mg BID was 2.35 g/mL. Despite the fact that subjects in ING112574 were receiving multiple ART and non-ART co-medication, the exposure of DTG 50 mg BID was approximately twice that observed with 50 mg once daily in ART-naive subjects. In the multivariate analyses, plasma DTG C0_average was not statistically predictive of Day 8 or Week 24 antiviral response (See m2.7.2 for details).

CONFIDENTIALModule 2.7.3 Summary of Clinical Efficacy
113
A small sub-set of subjects harbouring viruses with higher levels of resistance to DTG (such as those with more advanced genotypes in the Q148 pathway) could theoretically benefit from a higher dose such as DTG 100 mg BID. However, overall efficacy in this population is robust and better than 2nd generation protease inhibitors (tipranavir, darunavir) or NNRTIs (etravirine) that were designed to overcome in-class resistance (See Section 3.3.3). There was no correlation between DTG exposure and Week 24 efficacy in ING112574, suggesting that higher exposures may not be able to overcome some viruses with higher Baseline resistance. Finally, data from healthy subjects in ING114005 demonstrated that plasma DTG area under the curve (AUC) increased less than dose proportionally from 50 mg to 100 mg. Indeed, one-third of subjects did not have any appreciable increase in C between 50 mg and 100 mg doses. Therefore,increases in exposures with increasing dose are not predictable (See m5.3.3.4 ING114005CPSR). Accordingly, the 50 mg twice daily dose appears to be appropriate for the vast majority of ART-experienced, INI-resistant patients.
In summary the Day 8 and Week 24 primary analysis of ING112574 supports the recommended dose of DTG 50 mg BID for ART-experienced, INI-resistant HIV-infected adults as shown by the high short term and sustained antiviral activity through 24 weeks in this heavily pre-treated population. Baseline resistance is the strongest predictor of response at both Day 8 and Week 24, whereas OBR activity was not clearly associated with Week 24 response indicating that the antiviral activity was predominantly driven by DTG. Plasma DTG C0_avg was not associated with Day 8 or Week 24 antiviral response, suggesting that a sufficiently high exposure was achieved for the population as a whole. The efficacy of DTG 50 mg twice daily is favorable, and thus, DTG 50 mg twice daily is the recommended dose for treatment-experienced, INI-resistant patients.
4.3.2. Supportive Phase II Study ING112961
The dose of DTG 50 mg twice daily was selected for study in ING112574 based on data from the Phase IIb study, ING112961. Virologic responses from functional monotherapy (Day 11), Week 24 and Week 48 data from this study demonstrated better efficacy with 50 mg BID than with 50 mg once daily dosing (Table 18), in addition to comparable safety of the twice daily dose compared to DTG 50 mg once daily. A high response rate was observed at Week 48 in subjects treated with 50 mg BID with 71% (17/24) of subjects having suppression of HIV-1 RNA to <50 c/mL by TLOVR algorithm (See Section 2.2.3
The higher efficacy of DTG 50 mg BID compared to once daily is consistent with the higher DTG exposure achieved with the BID dose. The DTG PK data from Cohort I and II demonstrated that DTG 50 mg BID geometric means of C and AUC(0-) were 2 to 3 times higher than that for DTG 50 mg once daily (See m2.7.2 for details).
In light of the efficacy, safety, and PK data, DTG 50 mg BID was selected as the dose to be assessed in ING112574.

CONFIDENTIALModule 2.7.3 Summary of Clinical Efficacy
114
4.4. Dose Selection for Adolescent Subjects
Dolutegravir 50 mg once daily is recommended for INI-naïve adolescents (12 to <18 years old and weighing at least 40 kg of weight) with HIV-1 infection. The selection of the 50 mg once daily dose was based upon PK and safety data from the Phase I/II dose-finding study, ING112578 (P1093). Based on the data from 10 adolescent subjects enrolled and providing intensive PK samples, DTG 50 mg once daily dose provided similar drug exposure in adolescents to adults (see m2.7.2 for details) and was well tolerated in combination with OBT through Week 24 (see m2.7.4 for details).
Although HIV-infected children are different from adults in some aspects of the natural history of the disease due to acute HIV infection occurring in an immature immune system, the virological and immunological principles underlying the use of ART are similar. With the use of antiretroviral agents, the course of HIV infection is similar in children compared to adults [Gortmaker, 2001; Doerholt, 2006] with similar therapeutic outcomes sought. Therefore, efficacy data and exposure-response relationship from adult studies should be relevant for the prediction of antiviral response in HIV infected children. Additionally as HIV integrase is a viral target, not a host target, it is expected that the PK/PD relationship between DTG drug exposure and antiviral activity is similar between adults and pediatric populations. The guiding principles of disease management in children is similar to adults with the same goals of therapy, i.e., complete suppression of viral replication as measured by plasma HIV-1 RNA and restoration of the immune system.
Therefore, the PK data from ING112578 in adolescents aged 12 to <18 years are sufficiently similar to adults to permit extrapolation of efficacy data from pharmacokinetic correlation, which is in line with the International Conference on Harmonization guidance for medicinal products in the pediatric population [EMA, 2011].
5. PERSISTENCE OF EFFICACY AND/OR TOLERANCEEFFECTS
5.1. Treatment-Naïve Subjects
Although Week 48 efficacy data (ITT-E, Snapshot [MSDF]) are available for pivotal studies, ING113086 and ING114467, ING112276 is the first study to have long-term (96-week) data with DTG in treatment-naive subjects with HIV-1. Through 96 weeks, high response rates for all three DTG arms were generally well sustained. The proportion of subjects with HIV-1 RNA <50 c/mL at 96 weeks was 88% with DTG 50 mg, the dose selected for Phase III evaluation. For the other DTG doses (10 mg and 25 mg once daily) the response rates at Week 96 were 79% and 78%, respectively, and remained numerically better and statistically similar to the response rate for EFV (72%). The response rate in the EFV arm was consistent with previously published response rates[Lennox, 2010].
In ING112276, no subjects receiving the Phase III selected dose of DTG 50 mg once daily had a confirmed protocol-defined virologic failure (PDVF, 400 c/mL), and no virologic resistance was observed in this treatment group. A low rate of confirmed protocol-defined virologic failure was observed in the DTG 10 mg and 25 mg treatment
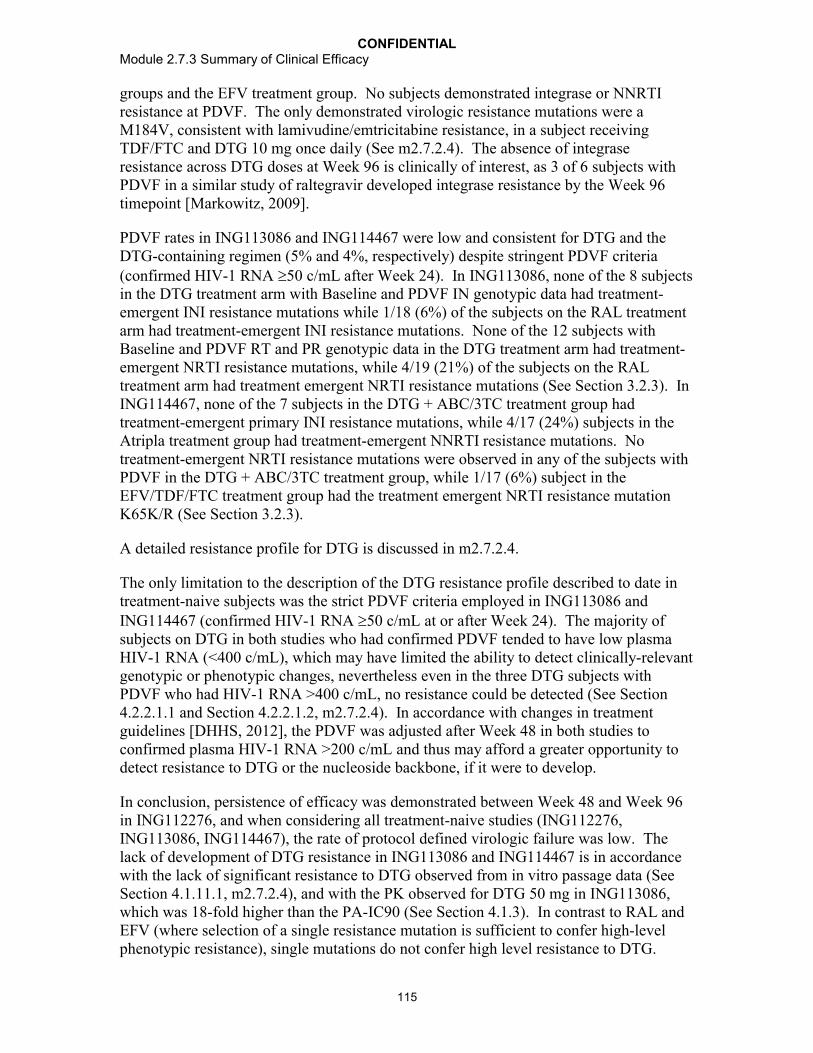
CONFIDENTIALModule 2.7.3 Summary of Clinical Efficacy
115
groups and the EFV treatment group. No subjects demonstrated integrase or NNRTI resistance at PDVF. The only demonstrated virologic resistance mutations were a M184V, consistent with lamivudine/emtricitabine resistance, in a subject receiving TDF/FTC and DTG 10 mg once daily (See m2.7.2.4). The absence of integrase resistance across DTG doses at Week 96 is clinically of interest, as 3 of 6 subjects with PDVF in a similar study of raltegravir developed integrase resistance by the Week 96 timepoint [Markowitz, 2009].
PDVF rates in ING113086 and ING114467 were low and consistent for DTG and the DTG-containing regimen (5% and 4%, respectively) despite stringent PDVF criteria (confirmed HIV-1 RNA 50 c/mL after Week 24). In ING113086, none of the 8 subjects in the DTG treatment arm with Baseline and PDVF IN genotypic data had treatment-emergent INI resistance mutations while 1/18 (6%) of the subjects on the RAL treatment arm had treatment-emergent INI resistance mutations. None of the 12 subjects with Baseline and PDVF RT and PR genotypic data in the DTG treatment arm had treatment-emergent NRTI resistance mutations, while 4/19 (21%) of the subjects on the RAL treatment arm had treatment emergent NRTI resistance mutations (See Section 3.2.3). In ING114467, none of the 7 subjects in the DTG + ABC/3TC treatment group had treatment-emergent primary INI resistance mutations, while 4/17 (24%) subjects in the Atripla treatment group had treatment-emergent NNRTI resistance mutations. No treatment-emergent NRTI resistance mutations were observed in any of the subjects with PDVF in the DTG + ABC/3TC treatment group, while 1/17 (6%) subject in the EFV/TDF/FTC treatment group had the treatment emergent NRTI resistance mutation K65K/R (See Section 3.2.3).
A detailed resistance profile for DTG is discussed in m2.7.2.4.
The only limitation to the description of the DTG resistance profile described to date in treatment-naive subjects was the strict PDVF criteria employed in ING113086 and ING114467 (confirmed HIV-1 RNA 50 c/mL at or after Week 24). The majority of subjects on DTG in both studies who had confirmed PDVF tended to have low plasma HIV-1 RNA (<400 c/mL), which may have limited the ability to detect clinically-relevant genotypic or phenotypic changes, nevertheless even in the three DTG subjects with PDVF who had HIV-1 RNA >400 c/mL, no resistance could be detected (See Section4.2.2.1.1 and Section 4.2.2.1.2, m2.7.2.4). In accordance with changes in treatment guidelines [DHHS, 2012], the PDVF was adjusted after Week 48 in both studies to confirmed plasma HIV-1 RNA >200 c/mL and thus may afford a greater opportunity to detect resistance to DTG or the nucleoside backbone, if it were to develop.
In conclusion, persistence of efficacy was demonstrated between Week 48 and Week 96 in ING112276, and when considering all treatment-naive studies (ING112276, ING113086, ING114467), the rate of protocol defined virologic failure was low. The lack of development of DTG resistance in ING113086 and ING114467 is in accordance with the lack of significant resistance to DTG observed from in vitro passage data (See Section 4.1.11.1, m2.7.2.4), and with the PK observed for DTG 50 mg in ING113086, which was 18-fold higher than the PA-IC90 (See Section 4.1.3). In contrast to RAL and EFV (where selection of a single resistance mutation is sufficient to confer high-level phenotypic resistance), single mutations do not confer high level resistance to DTG.
CONFIDENTIALModule 2.7.3 Summary of Clinical Efficacy
116
Clinical data suggest that DTG has a higher barrier to resistance in vivo, which suggests a high likelihood for persistence of efficacy over time.
5.2. Treatment-Experienced, INI-Naïve Subjects
Twenty-four week data is available in treatment-experienced, INI-naïve subjects from ING111762, and at Week 24, there was a statistically significant difference in favor of DTG using the Snapshot (MSDF) algorithm of the proportion of subjects with plasma HIV-1 RNA <50 c/mL. As described in Section 4.2.2.1, based on historical studies with INIs, the Week 24 response is likely predictive of longer term responses (e.g., Week 48) in this patient population. Therefore, DTG 50 mg once daily is an appropriate dose for the treatment-experienced (integrase naïve) population for longer term use. These interim findings will be assessed definitively in the primary Week 48 analysis.
Subjects receiving DTG were also less likely to develop virologic failure with resistance. Virologic failure through Week 24 occurred earlier and more frequently in the RAL arm (m2.7.2.4, Section 4.2.1.2.1). At Week 16 there were 10 (3%) confirmed virologic failures for the DTG arm and 21 (6%) for the RAL arm. At Week 24 there were 14 (4%) and 34 (9%) virologic failures for DTG and RAL, respectively. The difference through Week 24 was driven by a greater proportion of virologic non-response in the RAL arm (13/21 PDVFs) compared with greater proportion of virologic rebound in the DTG arm (13/14 PDVFs). In a pre-specified analysis, there was a statistically significant difference in favor of DTG for the proportion of subjects who failed therapy with evidence of INI Resistance through Week 24 (DTG 2/354 (0.6%); RAL 10/361(2.8%); p=0.016). In addition, few cases of emergent resistance to the background regimen were seen in both treatment arms (RAL [6/351] vs. DTG [3/354]).
Unlike the studies in treatment-naïve subjects and consistent with clinical practice in treatment-experienced patients, the protocol-defined virologic failure criteria in ING111762 was set with a higher HIV viral load (400 c/mL), thus allowing sufficient ability at failure to detect resistance if present.
In conclusion, DTG may be more efficacious than current standard of care in treatment-experienced patients (INI-naïve), and persistence of efficacy in this patient population is expected based on prior experience with other INIs. In addition, subjects receiving DTG were less likely than those on RAL to develop virologic failure with INI resistance in ING111762. The integrase substitution that was observed for DTG subjects conferredmaximum fold change of <2 in susceptibility to DTG and RAL. The infrequent occurrence and small shift in DTG susceptibility in ING111762 is in accordance with the low level resistance to DTG observed from in vitro passage data (m2.7.2.4).
5.3. Treatment-Experienced, INI-Resistant Subjects
Within Study ING112961, at Day 11 the proportion of subjects receiving DTG 50 mg twice daily (Cohort II) achieving plasma HIV-1 RNA <400 c/mL was 54% (13/24). The proportions at Week 24 and Week 48 were 83% (20/24) and 75% (18/24), respectively.
In Cohort II, 5/24 subjects met the definition for protocol defined virological failure (PDVF) through Week 24, no new PDVFs were identified through Week 48, except for
CONFIDENTIALModule 2.7.3 Summary of Clinical Efficacy
117
one subject with unconfirmed suspected failure at Week 40 (after having been <50 c/mL through Week 32) who subsequently withdrew from the study . One additional subject was classified as a non-responder between Week 24 and Week 48 for death (unrelated to study drug) while virologically suppressed. Of the 5 subjects with PDVF, no subjects harboring viruses with the Y143 (n=1) or N155 (n=1) pathway at baseline had treatment-emergent resistance or development of phenotypic resistance to DTG. The remaining 3 subjects harboring virus with Q148 +1 additional IN resistance associated mutations at Baseline had treatment emergent mutation resistance at PDVF.
Within Study ING112574, the PDVF rate through Week 24 was similar to ING112961 (26/114, 23%). For these 26 subjects, 16 (62%) had Q148 plus associated mutations detected in the Baseline IN genotype. Of the remaining 10 subjects, 2 subjects had N155H and 8 subjects did not have primary resistance detected at Baseline. Twenty-five of the 26 subjects with PDVF had paired Baseline and PDVF genotypic data, and 13/25 (52%) had treatment-emergent IN resistance at the time point of virological failure. For 11/13 subjects with treatment-emergent IN resistance detected at PDVF, a mutation at Q148, along with associated mutations, was seen at Baseline or was present on historical testing. The only mutations that were detected have been previously described for the integrase class and viruses at PDVF had multiple INI resistance-associated mutationsupporting the high barrier to resistance of DTG (m2.7.2.4).
Persistence of efficacy was demonstrated between Week 24 and Week 48 in ING112961 and when considering both studies (ING112961 and ING112574) conducted in this highly treatment-experienced INI-resistant subjects, the rate of protocol defined virologic failure was relatively low. Treatment-emergent mutations further reducing DTG susceptibility occurred in viruses with multiple IN resistance associated mutations already present at Baseline, supporting DTG high barrier to resistance.
6. EFFICACY SUMMARY
The results from four pivotal studies (Studies ING113086, ING112574, ING111762, and ING114467) provide substantial evidence of effectiveness for dolutegravir as a treatment for HIV-1 infection in combination with other antiretroviral agents.
DTG with two NRTIs was highly effective in ART-naïve subjects. High rates of virologic suppression [HIV-1 RNA <50 c/mL]) were observed in both studies of ART-naïve subjects; consistent responses were demonstrated in important subgroups as defined by Baseline HIV-1 RNA, NRTI backbone, CD4+ cell count, gender, race, and age. DTG + NRTI backbone demonstrated comparable efficacy to RAL + NRTI backbone at Week 48. DTG + ABC/3TC achieved a statistically superior response through 48 weeks against a preferred fixed dose combination tablet Atripla (tenofovir/emtricitabine/ efavirenz), a result that was driven in large part by improved tolerability of the DTG-containing regimen.
Interim results from ING111762 showed that a significantly higher proportion of treatment-experienced patients treated with DTG plus BR achieved virologic suppression when compared to RAL plus BR; these differences were driven by better overall virologic efficacy with DTG.

CONFIDENTIALModule 2.7.3 Summary of Clinical Efficacy
118
DTG 50 mg twice daily was effective for patients with resistance to INIs and associated extensive antiretroviral resistance to other agents, with efficacy rates comparable to or better than other antiretroviral agents utilized for treatment of within class resistant virus in historical studies. Virologic responses in ING112574 were not clearly associated with the activity of the background antiviral agents but were best correlated with baseline DTG resistance (as determined by baseline genotype).
DTG-based regimens had a higher barrier to resistance in INI-naïve patients, as demonstrated in ING111762 where significantly fewer virologic failures with INI resistance were observed when compared with RAL. Data from ING113086 and ING114467 were also supportive, as no subjects on the DTG regimen developed resistance to either the INI or the background NRTIs, whereas resistance to both the third agent and the background NRTIs was observed in both the RAL and EFV-based comparator arms.
In the setting of INI-resistance, DTG had efficacy across a broad range of mutational patterns, with virologic responses across the viral populations which represent the majority of INI-resistant viruses. Additionally, the most prevalent treatment- emergent mutations detected were IN resistance-associated secondary mutations that were added to a viral genotype with IN primary mutations present. All treatment-emergent mutations detected in the setting of previous INI resistance were well characterized RAL and/or EVG resistance associated mutations.
Dolutegravir offers once-daily dosing in patients without INI resistance, no requirement for pharmacokinetic boosters and few dose adjustments for drug interactions. DTG can also be dosed without regard to meals, as there is no significant food effect. DTG also exhibits less PK variability, with more predictable exposures and lower risk of achieving inadequate or toxic exposures.
Finally, DTG represents a new option for therapy of adolescents with HIV infection. The PK data from ING112578 in adolescents aged 12 to <18 years are sufficiently similar to adults to permit extrapolation of efficacy data from pharmacokinetic correlation. Therefore, INI-naïve pediatric subjects can take the adult dose of 50 mg once daily.
6.1. Efficacy Conclusions
Data support the use of DTG 50 mg once daily for the treatment of HIV infection in combination with other antiretroviral therapy in treatment-naïve adults;
Data support the use of DTG 50 mg once daily for the treatment of HIV infection in combination with other antiretroviral therapy in INI-naïve, treatment-experienced adults;
Data support the use of DTG 50 mg twice daily for the treatment HIV infection in combination with other antiretroviral therapy in INI-resistant (current and historical) treatment-experienced adults;
DTG-based regimens had a higher barrier to resistance in INI-naïve patients, as demonstrated in ING111762 where significantly fewer virologic failures with INI resistance were observed when compared with RAL. Data from ING113086 and
CONFIDENTIALModule 2.7.3 Summary of Clinical Efficacy
119
ING114467 were also supportive, as no subjects on the DTG regimen developed resistance to either the INI or the background NRTIs, whereas resistance to both the third agent and the background NRTIs was observed in both the RAL and EFV-based comparator arms;
Increases in CD4+ cell counts were observed for subjects receiving DTG-containing regimens across all patient populations evaluated;
Data support the use of DTG 50 mg once daily for INI-naïve adolescents (12 to <18 years old and weighing at least 40 kg of weight) with HIV infection (m2.7.2);
Data support the efficacy of DTG across a broad range of Clades and against both HIV-1 and HIV-2 (m2.7.2.4).
7. REFERENCES
Cahn P, Villacian J, Lazzarin A, et al. Ritonavir-Boosted Tipranavir Demonstrates Superior Efficacy to Ritonavir-Boosted Protease Inhibitors in Treatment-Experienced HIV-Infected Patients: 24-Week Results of the RESIST-2 Trial. Clin Infect Dis 2006; 43:1347–56.
Clotet B, Bellos N, Molina JM, et al. Efficacy and safety of darunavir-ritonavir at week 48 in treatment-experienced patients with HIV-1 infection in POWER 1 and 2: a pooled subgroup analysis of data from two randomised trials. Lancet 2007; 369(9568): 1169-78.*
Cooper DA, Steigbigel RT, Gatell JM, et al. Subgroup and resistance analyses of raltegravir for resistant HIV-1 Infection. N Engl J Med 2008; 359:355-65.*
DeJesus E, Rockstroh JK, Henry K, et al. Co-formulated elvitegravir, cobicistat, emtricitabine, and tenofovir disoproxil fumarate versus ritonavir-boosted atazanavir plus co-formulated emtricitabine and tenofovir disoproxil fumarate for initial treatment of HIV-1 infection: a randomized, double-blind, phase 3, non-inferiority trial. Lancet2012;379(9835):2429–2438.
Department of Health and Human Services (DHHS), Panel on Antiretroviral Guidelines for Adults and Adolescents. Guidelines for the use of antiretroviral agents in HIV-1-infected adults and adolescents. Updated 27 March 2012. Available online at: http://aidsinfo.nih.gov/guidelines. Date accessed: April 1, 2012.
Doerholt K, Duong T, Tookey P, Butler K, Lyall H, Sharland M, Novelli V, Riordan A, Dunn D, Walker AS, Gibb DM. Outcomes for human immunodeficiency virus-1-infected infants in the United Kingdom and Republic of Ireland in the era of effective antiretroviral therapy. Ped Infect Dis J 2006; 25:420-426.*
European AIDS Clinical Society (EACS). Guidelines version 6.1. Available at: http://www.europeanaidsclinicalsociety.org/images/stories/EACS-Pdf/EACSGuidelines-v6.1-English-Nov2012.pdf. Date Accessed: November 8, 2012.

CONFIDENTIALModule 2.7.3 Summary of Clinical Efficacy
120
European Medicines Agency (EMA), Committee for Medicinal Products for Human Use (CHMP). Guideline on the clinical development of medicinal products for the treatment of HIV infection, Doc. Ref. EMEA/CHMP/EWP/9147/2008-corr*. London, adopted 22 October 2009. Available at: http://www.ema.europa.eu/docs/en_GB/document_library/Scientific_guideline/2009/12/WC500017055.pdf. Date accessed: October 30, 2012.
European Medicines Agency (EMA ICH Topic E 11Clinical Investigation of Medicinal Products in the Paediatric Population, Doc. Ref. CPMP/ICH/2711/99*. January 2011. Available at: http://www.emea.europa.eu/docs/en_GB/document_library/Scientific_guideline/2009/09/WC500002926.pdf. Date Accessed: September 9, 2012.
Food and Drug Administration (FDA). Antiretroviral Drugs Using Plasma HIV RNA Measurements — Clinical Considerations for Accelerated and Traditional Approval. Maryland, 2002. Available at: http://www.fda.gov/downloads/Drugs/GuidanceComplianceRegulatoryInformation/Guidances/ucm070968.pdf. Date accessed: September 9, 2012.
FDA Guidance for Industry: Role of HIV Resistance Testing in Antiretroviral Drug Development, October 2007, available at: http://www.fda.gov/downloads/Drugs/GuidanceComplianceRegulatoryInformation/Guidances/UCM071173.pdf. Date accessed: August 18, 2012.
FDA ad comm. Briefing Information for the Antiviral Drugs Advisory Committee (AVDAC) Meeting, May 11, 2012 available at: http://www.fda.gov/AdvisoryCommittees/CommitteesMeetingMaterials/Drugs/AntiviralDrugsAdvisoryCommittee/ucm303394.htm. Date accessed: September 9, 2012.
Gathe J, Cooper DA, Farthing C, et al. Efficacy of the Protease Inhibitors Tipranavir plus Ritonavir in Treatment-Experienced Patients: 24-Week Analysis from the RESIST-1 Trial. Clin Infect Dis 2006; 43:1337–46.*
German P, Warren D, West S, Hui J, Kearney B. Pharmacokinetics and Bioavailability of an Integrase and Novel Pharmacoenhancer-Containing Single-Tablet Fixed-Dose Combination Regimen for the Treatment of HIV. J Acquir Immune Defic Syndr2010:55:323–329.
Good Clinical Practice (GCP) for Trials on Medicinal Products in the European Community (1996). Found at http://ec.europa.eu/health/files/eudralex/vol-10/3cc1aen_en.pdf. Date accessed: September 9, 2012.
Gortmaker SL, Hughes M, Cervia J et al. Effect of combination therapy including protease inhibitors on mortality among children and adolescents infected with HIV-1. N Engl J Med 2001; 345(21):1522-1528.*
Hazuda DJ, Miller MD, Nguyen BY, and Zhao J. Resistance to the HIV-Integrase Inhibitor Raltegravir: Analysis of Protocol 005, a Phase 2 Study in Patients with Triple-

CONFIDENTIALModule 2.7.3 Summary of Clinical Efficacy
121
Class Resistant HIV-1 Infection. XVI International HIV Drug Resistance Workshop, Abstract #8. Antiviral Therapy 2007:12:S10.
Hill A and Sabin, C. Designing and Interpreting Noninferiority Trials in Naïve and Experienced Patients. AIDS 2008;22(8):913-921.*
International AIDS Society (IAS) Guidelines – Update of the Drug Resistance Mutations in HIV-1: Topics in HIV Medicine. December 2009; 17(5). Available at: https://www.iasusa.org/sites/default/files/tam/17-5-138.pdf. Date accessed: November 8, 2012.
International Conference on Harmonisation of Technical Requirements for Registration of Pharmaceuticals for Human Use (ICH) Guidance for Industry: E 10 Choice of Control Group and Related Issues in Clinical Trials. U.S. Department of Health and Human Services Food and Drug Administration, Center for Drug Evaluation and Research (CDER), Center for Biologics Evaluation and Research (CBER), May 2001. Available at: http://www.fda.gov/downloads/Drugs/GuidanceComplianceRegulatoryInformation/Guidances/UCM073139.pdf. Date Accessed: September 9, 2012.
Lazzarin A, Campbell T, Clotet B, Johnson M, et al. Efficacy and Safety Of Tmc125 (Etravirine) In Treatment-Experienced HIV-1-Infected Patients In DUET-2: 24-Week Results From a Randomized, Double-Blind, Placebo-Controlled Trial. Lancet 2007 Jul 7; 370(9581):39-48.*
Lennox J, DeJesus E, Lazzarin A, et. al. Safety and efficacy of raltegravir-based versus efavirenz-based combination therapy in treatment-naïve patients with HIV-1 infection: a multi-centre, double-blind randomised controlled trial. Lancet 2009;374:796-806.*
Lennox JL, DeJesus E, Berger DS, et al. Raltegravir Versus Efavirenz Regimens in Treatment-Naive HIV-1–Infected Patients: 96-Week Efficacy, Durability, Subgroup, Safety, and Metabolic Analyses. JAIDS 2010;55(1):39-48.*
Madruga JV, Cahn P, Grinsztejn B, Haubrich R, et al. Efficacy and safety of TMC125 (etravirine) in treatment-experienced HIV-1-infected patients in DUET-1: 24-week results from a randomised, double-blind, placebo-controlled trial. Lancet 2007;370 (9581):29 - 38.*
Markowitz M, Nguyen B, Gotuzzo E, Mendo F, et al. Sustained Antiretroviral Effect of Raltegravir After 96 Weeks of Combination Therapy in Treatment-Naïve Patients With HIV-1 Infection. J Acquir Immune Defic Syndr 2009; 52(3):350-356.*
McColl DJ, Fransen S, Gupta S, et al. Resistance and cross-resistance to first-generation integrase inhibitors: insights from a Phase II study of elvitegravir (GS-9137). Program and abstracts of the 16th International HIV Drug Resistance Workshop; June 12-16, 2007; Barbados, West Indies. 2007. Abstract 9.
Molina J, Cohen C, Katlama C, et al. Safety and Efficacy of Darunavir (TMC114) With Low-Dose Ritonavir in Treatment-Experienced Patients : 24-Week Results of POWER 3. JAIDS 2007;46:24–31.*

CONFIDENTIALModule 2.7.3 Summary of Clinical Efficacy
122
Molina J, LaMarca A, Andrade-Villanueva J, Clotet B, et al. Efficacy and safety of once daily elvitegravir versus twice daily raltegravir in treatment-experienced patients with HIV-1 receiving a ritonavir-boosted protease inhibitor: randomised, double-blind, phase 3, non-inferiority study. Lancet Infect Dis 2012;12: 27–35.
Sax PE, DeJesus E, Mills A, et al. Co-formulated elvitegravir, cobicistat, emtricitabine, and tenofovir versus co-formulated efavirenz, emtricitabine, and tenofovir for initial treatment of HIV-1 infection: a randomised, double-blind, Phase 3 trial, analysis of results after 48 weeks. Lancet 2012;379(9835):2439–2448.
Steigbigel RT, Cooper DA, Kumar PN et al. Raltegravir with Optimized Background Therapy for Resistant HIV-1 infection. N Engl J Med 2008; 359(4):339-354.*
UNAIDS (Joint United Nations Programme on HIV/AIDS). Report on the global AIDS epidemic. December 2010. Available at: http://www.unaids.org/globalreport/. Date accessed: September 9, 2012.
UNAIDS 2012a. Fact Sheet: The Global AIDS Epidemic; 2012. Available at: http://www.unaids.org/en/media/unaids/contentassets/documents/epidemiology/2012/201207_FactSheet_Global_en.pdf. Date Accessed: September 9, 2012.
UNAIDS 2012b. Core Slides: Global Summary of the AIDS Epidemic; July 2012. Available at: http://www.unaids.org/en/media/unaids/contentassets/documents/epidemiology/2012/201207_epi_core_en.pdf. Date Accessed: September 9, 2012.
World Medical Association (WMA). The Declaration of Helsinki: ethical principles for medical research involving human subjects. 7th revision, adopted by the 59th WMA General Assembly, Seoul, Korea, October, 2008. Available at: http://www.wma.net/en/30publications/10policies/b3/. Date Accessed: September 9, 2012.

CONFIDENTIALModule 2.7.3 Summary of Clinical Efficacy
123
8. APPENDIX
Appendix Table 1 Description of Clinical Efficacy and Safety Studies
Protocol No./Sponsor
No. Study Centres Location(s)
Study Start; Enrolments Status and Date; Total Enrolment /Target Enrolment
Study Objectives
Study Design Diagnosis; Key Inclusion Criteria
Treatment Details (Drug; Dose; Form; Route; Frequency; Duration)
No. of Subjects by Group Entered/ Completed
Gender M/F; Mean Age (Range)
Primary Endpoint(S)
Study Reporting Status (Type of Report) / Location of Report
Biopharmaceutic StudiesING113674 ViiV Healthcare
1 US Start 13 Apr 2010;Completed06 Jul 2010; Part A: 24/24,Part B: 18/18
To evaluate relative bioavailability study of three different tablet formulations of dolutegravir (DTG) 50 mg and effect of food on the selected formulation
Randomized, open-label, single dose, two part, three-period crossover
18-65yrs, Healthy subjects, male / female
Part A:DTG 50 mg using current formulation;25 mg; tablet; oral; single dose; fasting
DTG 50 mg using 25 mg/150 mg compression;25 mg; tablet;oral; single dose; fasting
DTG 50 mg using 25 mg/200 mg compression;25 mg; tablet; oral; single
Part A: 24 Enrolled, 21 Completed
Part B: 18 Enrolled,18 Completed
Part A:10/14;38.6yrs (20-61)
Part B: 9/9;41.8yrs (20-61)
Plasma DTG AUC(0-), AUC(0-t), and Cmax
Completed Clinical Pharmacology Study Report (CPSR)5.3.1.2

CONFIDENTIALModule 2.7.3 Summary of Clinical Efficacy
124
Protocol No./Sponsor
No. Study Centres Location(s)
Study Start; Enrolments Status and Date; Total Enrolment /Target Enrolment
Study Objectives
Study Design Diagnosis; Key Inclusion Criteria
Treatment Details (Drug; Dose; Form; Route; Frequency; Duration)
No. of Subjects by Group Entered/ Completed
Gender M/F; Mean Age (Range)
Primary Endpoint(S)
Study Reporting Status (Type of Report) / Location of Report
dose; fasting
Part B:DTG 50 mg using 25 mg/150 mg compression;25 mg; tablet; oral; single dose; low fat meal
DTG 50 mgusing 25 mg/150 mg compression;25 mg; tablet;oral; single dose; moderate fat meal
DTG 50 mg using 25 mg/150 mg compression;25 mg; tablet; oral; single

CONFIDENTIALModule 2.7.3 Summary of Clinical Efficacy
125
Protocol No./Sponsor
No. Study Centres Location(s)
Study Start; Enrolments Status and Date; Total Enrolment /Target Enrolment
Study Objectives
Study Design Diagnosis; Key Inclusion Criteria
Treatment Details (Drug; Dose; Form; Route; Frequency; Duration)
No. of Subjects by Group Entered/ Completed
Gender M/F; Mean Age (Range)
Primary Endpoint(S)
Study Reporting Status (Type of Report) / Location of Report
dose; high fat meal
ING114556ViiV Healthcare
1 US Start 21 Jun 2011;Completed 22 Aug 2011;20/20
To evaluate the relative bioavailability and safety of a DTG granule formulation in healthy subjects
Randomized,open-label, single dose, five-period crossover
18-65yrs, Healthy subjects, male / female
DTG 50 mg; tablet; oral;single dose
DTG 50 mg;granule; direct to mouth; single dose
DTG 50 mg;granule with purified water; oral; single dose
DTG 50 mg;granule with mineral water; oral; single dose
DTG 50 mg; granule with baby formula; oral; single dose
20 Enrolled, 20 Completed
10/10; 41.9yrs(21-61)
Plasma DTG AUC(0-), AUC(0-t), and Cmax
Completed CPSR5.3.1.2

CONFIDENTIALModule 2.7.3 Summary of Clinical Efficacy
126
Protocol No./Sponsor
No. Study Centres Location(s)
Study Start; Enrolments Status and Date; Total Enrolment /Target Enrolment
Study Objectives
Study Design Diagnosis; Key Inclusion Criteria
Treatment Details (Drug; Dose; Form; Route; Frequency; Duration)
No. of Subjects by Group Entered/ Completed
Gender M/F; Mean Age (Range)
Primary Endpoint(S)
Study Reporting Status (Type of Report) / Location of Report
ING114581ViiV Healthcare
1 US Start 06 Jun 2011; Completed09 Aug 2011;18/18
To evaluate relative bioavailability of DTG, abacavir (ABC) and lamivudine (3TC) of single dose administration of two experimental FDC tablet formulations
Open-label, single dose, randomized, 3-period, crossover study
18-65yrs, Healthy subjects, male / female
Treatment A: DTG 50 mg/ABC 600 mg/3TC 300 mg Formulation 1; tablet; oral; single dose
Treatment B: DTG 50 mg/ABC 600 mg/3TC 300 mg Formulation 2; tablet; oral; single dose
Treatment C: DTG 50 mg; (formulation code BC) plus EPZICOM™;tablet; oral; single dose
18 Enrolled,18 Completed
10/8;29.8yrs(19-45)
Plasma DTG, ABC and 3TC AUC(0-∞), AUC(0-t), and Cmax
Completed CPSR 5.3.1.2

CONFIDENTIALModule 2.7.3 Summary of Clinical Efficacy
127
Protocol No./Sponsor
No. Study Centres Location(s)
Study Start; Enrolments Status and Date; Total Enrolment /Target Enrolment
Study Objectives
Study Design Diagnosis; Key Inclusion Criteria
Treatment Details (Drug; Dose; Form; Route; Frequency; Duration)
No. of Subjects by Group Entered/ Completed
Gender M/F; Mean Age (Range)
Primary Endpoint(S)
Study Reporting Status (Type of Report) / Location of Report
Pharmacokinetic StudiesING111207 GSK 1 US Start 13
Nov 2007;Completed18 Feb 2008;25/20
To assess safety, tolerability and PK of single doses of DTG
Double-Blind, Randomized, Placebo-Controlled
18-55yrs, Healthysubjects, male/ female
DTG 2 to100 mg; oral suspension; single dose; fasted
25 Enrolled, 13Completed
20/5;31.8yrs (19-54)
DTG safety parameters
AUC(0-t), AUC(0-), Cmax, tmax, C24, and t½following single doseadministration
Completed CPSR 5.3.3.1
ING111322 GSK 1 US Start 27 Feb 2008;Completed12 Jun 2008; Part 1: 32/32,Part 2: 12/12
Part 1: To assess safety, tolerability and Pharmacokinetics (PK) of repeat doses of DTG
Part 2: To assess safety, tolerability and PK of single doses of DTG suspension and single doses of
Part 1: Double-Blind, Randomized, Placebo-Controlled
Part 2: Randomized, 3-Period, Balanced, Crossover
18-50yrs, Healthysubjects, male/female
Part 1: DTG 10 to 50 mg; oral suspension; once daily; 10 days; fasted
Part 2: DTG 20 mg;oral suspension; singe dose; fasted
DTG 10 mg x2(20 mg); tablet; oral;
Part 1: 32* (includes5 placebo) Enrolled, 31 Completed
Part 2: 12 Enrolled,12 Completed
*1 subject assigned to placebo received a single dose of DTG in
Part 1: 27/5; 31.7yrs (18-50)
Part 2: 12/0; 30.8yrs (18-50)
Part 1: DTG safety parameters from predose values
DTG PK parameters following single dose administration on Day 1:AUC(0-) and AUC(0-24), Cmax, tmax, C24, t1/2, tlag, and CL/F; and
Completed CPSR 5.3.3.1
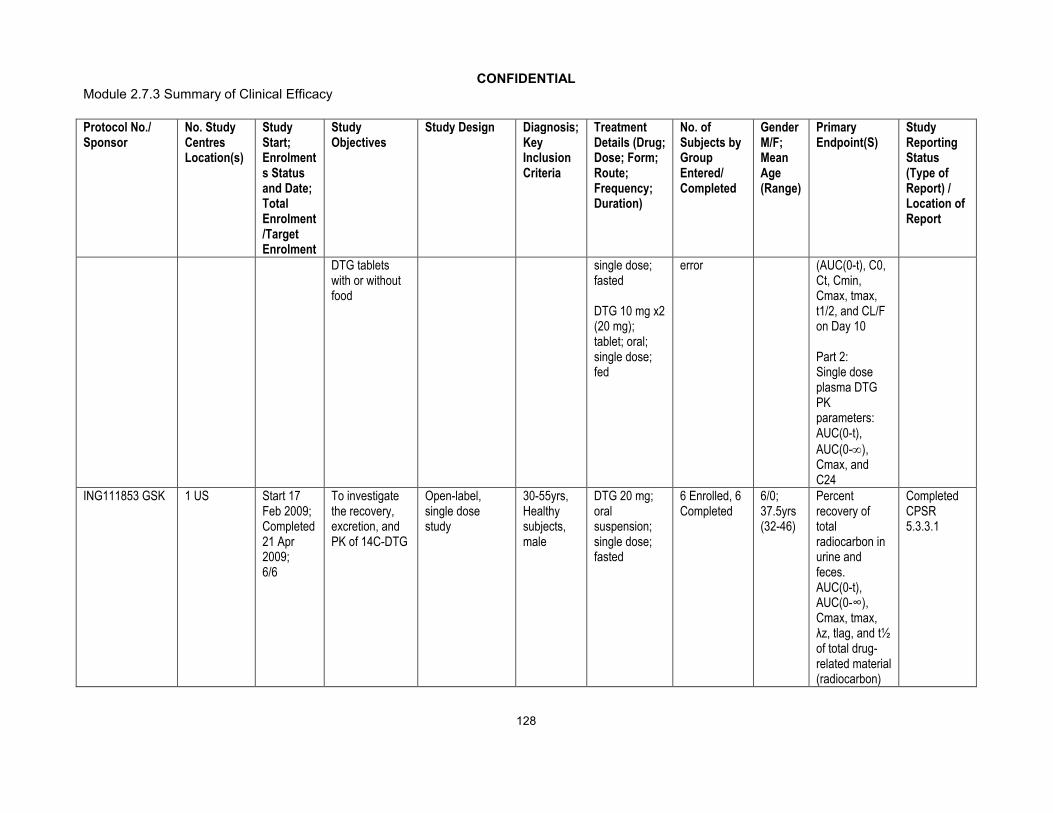
CONFIDENTIALModule 2.7.3 Summary of Clinical Efficacy
128
Protocol No./Sponsor
No. Study Centres Location(s)
Study Start; Enrolments Status and Date; Total Enrolment /Target Enrolment
Study Objectives
Study Design Diagnosis; Key Inclusion Criteria
Treatment Details (Drug; Dose; Form; Route; Frequency; Duration)
No. of Subjects by Group Entered/ Completed
Gender M/F; Mean Age (Range)
Primary Endpoint(S)
Study Reporting Status (Type of Report) / Location of Report
DTG tablets with or without food
single dose;fasted
DTG 10 mg x2(20 mg); tablet; oral;single dose; fed
error (AUC(0-t), C0, Ct, Cmin, Cmax, tmax, t1/2, and CL/F on Day 10
Part 2:Single dose plasma DTG PK parameters: AUC(0-t), AUC(0-), Cmax, and C24
ING111853 GSK 1 US Start 17 Feb 2009;Completed 21 Apr 2009;6/6
To investigate the recovery, excretion, and PK of 14C-DTG
Open-label, single dose study
30-55yrs, Healthysubjects,male
DTG 20 mg;oral suspension;single dose; fasted
6 Enrolled, 6Completed
6/0;37.5yrs (32-46)
Percent recovery of total radiocarbon in urine and feces. AUC(0-t), AUC(0-∞), Cmax, tmax, λz, tlag, and t½of total drug-related material (radiocarbon)
Completed CPSR5.3.3.1

CONFIDENTIALModule 2.7.3 Summary of Clinical Efficacy
129
Protocol No./Sponsor
No. Study Centres Location(s)
Study Start; Enrolments Status and Date; Total Enrolment /Target Enrolment
Study Objectives
Study Design Diagnosis; Key Inclusion Criteria
Treatment Details (Drug; Dose; Form; Route; Frequency; Duration)
No. of Subjects by Group Entered/ Completed
Gender M/F; Mean Age (Range)
Primary Endpoint(S)
Study Reporting Status (Type of Report) / Location of Report
in blood and plasma following oral suspension [14C]-DTG dosing
AUC(0-t), AUC(0-∞), Cmax, tmax, λz, tlag, CL/F, Vz/F, and t½ of DTG in plasmafollowing oral suspension [14C]-DTG dosing
Collection of samples for use in a separate study for characterization and quantification of DTG-related metabolites in

CONFIDENTIALModule 2.7.3 Summary of Clinical Efficacy
130
Protocol No./Sponsor
No. Study Centres Location(s)
Study Start; Enrolments Status and Date; Total Enrolment /Target Enrolment
Study Objectives
Study Design Diagnosis; Key Inclusion Criteria
Treatment Details (Drug; Dose; Form; Route; Frequency; Duration)
No. of Subjects by Group Entered/ Completed
Gender M/F; Mean Age (Range)
Primary Endpoint(S)
Study Reporting Status (Type of Report) / Location of Report
plasma, urine and fecal homogenates
ING115465
1 US Start 30 Aug 2011;Completed16 Apr 2012;11/8
To describeDTG exposure in cervicovaginal fluid, cervical and vaginal tissue
Open-label, repeat dose study
18-35yrs, Healthy subjects, female
DTG 50 mg; tablet; oral; once daily; 5-7 days
11 Enrolled, 8 Completed
ITT-E: 0/8;*21yrs (18-27)
*Median age
AUC(0-24), AUClast, AUCinf, Clast, Cmax, Tmax, and t½ for blood plasma (BP), cervicovaginal fluid (CVF), cervical tissue (CT), and vaginal tissue (VT) after dosing of DTG 50-mg tablet on the first dosing day (Day 1) and at steady-state after 5-7 days of treatment Accumulation ratio of DTG in BP, CVF, CT, and VT
Completed CPSR5.3.3.1

CONFIDENTIALModule 2.7.3 Summary of Clinical Efficacy
131
Protocol No./Sponsor
No. Study Centres Location(s)
Study Start; Enrolments Status and Date; Total Enrolment /Target Enrolment
Study Objectives
Study Design Diagnosis; Key Inclusion Criteria
Treatment Details (Drug; Dose; Form; Route; Frequency; Duration)
No. of Subjects by Group Entered/ Completed
Gender M/F; Mean Age (Range)
Primary Endpoint(S)
Study Reporting Status (Type of Report) / Location of Report
CVF:BP, CT:BP, VT:BP, CT:CVF, and VT:CVF DTG AUC ratios
ING116195
1 US Start 14 Dec 2011; Completed 22 May 2012; 14/12
To describe DTG exposure in semen and rectal tissue
Open-label, repeat dose study
18-49yrs, Healthy subjects, male
DTG 50 mg; tablet; oral;once daily; 8 days
14 Enrolled, 12 Completed
ITT-E: 12/0; *25.5yrs (21-44)
*Median age
AUC(0-24), AUClast, AUCinf, Clast, Cmax, tmax for blood plasma (BP), seminal fluid (SF), rectal mucosal fluid (RF), and rectal mucosal tissue (RT) after dosing of DTG 50mg tablet on the first dosing day (Day1; PK) and at a steady-state 7 and 8 days later
Accumulation of ratio of DTG in BP, SF, RF,
Completed CPSR5.3.3.1
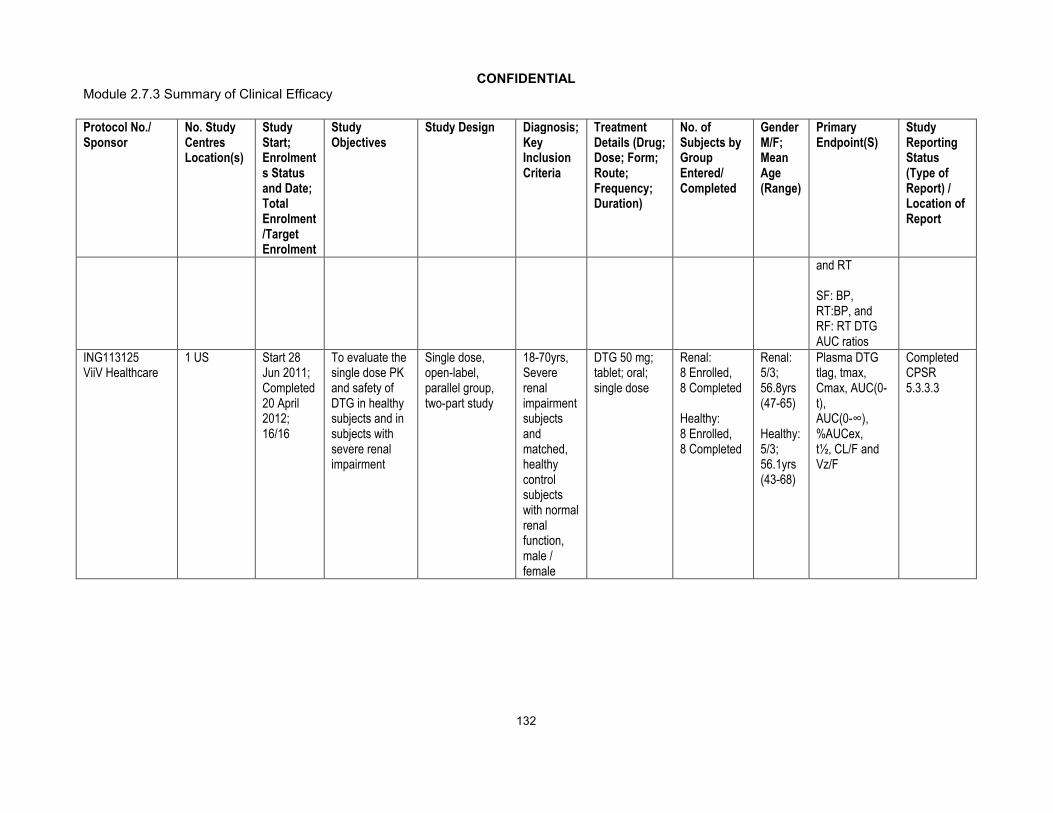
CONFIDENTIALModule 2.7.3 Summary of Clinical Efficacy
132
Protocol No./Sponsor
No. Study Centres Location(s)
Study Start; Enrolments Status and Date; Total Enrolment /Target Enrolment
Study Objectives
Study Design Diagnosis; Key Inclusion Criteria
Treatment Details (Drug; Dose; Form; Route; Frequency; Duration)
No. of Subjects by Group Entered/ Completed
Gender M/F; Mean Age (Range)
Primary Endpoint(S)
Study Reporting Status (Type of Report) / Location of Report
and RT
SF: BP, RT:BP, and RF: RT DTG AUC ratios
ING113125ViiV Healthcare
1 US Start 28 Jun 2011;Completed20 April 2012;16/16
To evaluate the single dose PK and safety of DTG in healthy subjects and in subjects with severe renal impairment
Single dose, open-label, parallel group, two-part study
18-70yrs, Severe renalimpairment subjects and matched, healthy control subjects with normal renal function, male / female
DTG 50 mg;tablet; oral;single dose
Renal: 8 Enrolled, 8 Completed
Healthy:8 Enrolled, 8 Completed
Renal:5/3; 56.8yrs(47-65)
Healthy:5/3;56.1yrs (43-68)
Plasma DTG tlag, tmax, Cmax, AUC(0-t), AUC(0-∞), %AUCex,t½, CL/F and Vz/F
Completed CPSR5.3.3.3

CONFIDENTIALModule 2.7.3 Summary of Clinical Efficacy
133
Protocol No./Sponsor
No. Study Centres Location(s)
Study Start; Enrolments Status and Date; Total Enrolment /Target Enrolment
Study Objectives
Study Design Diagnosis; Key Inclusion Criteria
Treatment Details (Drug; Dose; Form; Route; Frequency; Duration)
No. of Subjects by Group Entered/ Completed
Gender M/F; Mean Age (Range)
Primary Endpoint(S)
Study Reporting Status (Type of Report) / Location of Report
ING113097 ViiV Healthcare
1 US Start 19 Nov 2010;Completed04 Jun 2011;16/16
To evaluate the single dose PK and safety of DTG in healthy subjects and in subjects with mild or moderate hepatic impairmentbased on Child-Pugh category
Single dose, open-label, parallel group, two-part, adaptive study
18-70yrs, Subjects with mild or moderate hepatic impairment and matched, healthy control subjects with normal hepatic function, male / female
DTG 50 mg; tablet; oral;single dose
Hepatic Impaired:8 Enrolled, 8 Completed
Healthy Controls: 8 Enrolled, 8 Completed
Hepatic Impaired: 5/3; 55.5yrs(50-61)
Healthy Controls: 5/3; 57.0yrs(42-67)
Plasma DTG AUC(0-t), AUC(0-∞), Cmax, C24, apparentt½, apparent clearance (CL/F), and Vz/F
Completed CPSR5.3.3.3
ING115381 ViiV Healthcare
1 US Start 20 Apr 2011; Completed 27 May 2011;10/10
To assess safety, tolerability and PK of single doses of DTG in healthy Japanese subjects
Open label, single dose study
20-55yrs, Healthy Japanese subjects, male / female
DTG 50 mg; tablet; oral; single dose
10 Enrolled, 10 Completed
6/4;33.4yrs (22-52)
Plasma DTG following single dose administration: AUC(0-t), AUC(0-∞), Cmax, and C24
Completed CPSR5.3.3.3

CONFIDENTIALModule 2.7.3 Summary of Clinical Efficacy
134
Protocol No./Sponsor
No. Study Centres Location(s)
Study Start; Enrolments Status and Date; Total Enrolment /Target Enrolment
Study Objectives
Study Design Diagnosis; Key Inclusion Criteria
Treatment Details (Drug; Dose; Form; Route; Frequency; Duration)
No. of Subjects by Group Entered/ Completed
Gender M/F; Mean Age (Range)
Primary Endpoint(S)
Study Reporting Status (Type of Report) / Location of Report
Extrinsic Factor PK Study ReportsING113099ViiVHealthcare
1 US Start 13 May 2011; Completed28 Nov 2011; 27/24
To assess the potential for a drug interaction between DTG and rifampin (RIF) andbetween DTG and rifabutin(RIFABUT)
Randomized, open-label, two-period, single-sequence, two cohort study
18-65yrs, Healthy subjects, male / female
DTG 50 mg; tablet; oral; once daily; 7 days.
DTG 50 mg; tablet; oral; BID; 7 days then DTG 50 mg; tablet; oral; BID + RIF 600 mg; capsule; oral; once daily; 14 days
DTG 50 mg; tablet; oral; once daily for 7 days then DTG 50 mg; tablet; oral BID+ RIFABUT 300 mg; capsule; oral; once daily; 14 days
Arm 1: 12 Enrolled, 11 Completed
Arm 2: 14 Enrolled, 9 Completed
ITT-E: 19/7;44.7yrs(26-59)
Plasma DTG Cτ, Cmax, and AUC(0-τ), and AUC(0-24) forcomparison between once daily and twice daily regimens only
Completed CPSR5.3.3.4
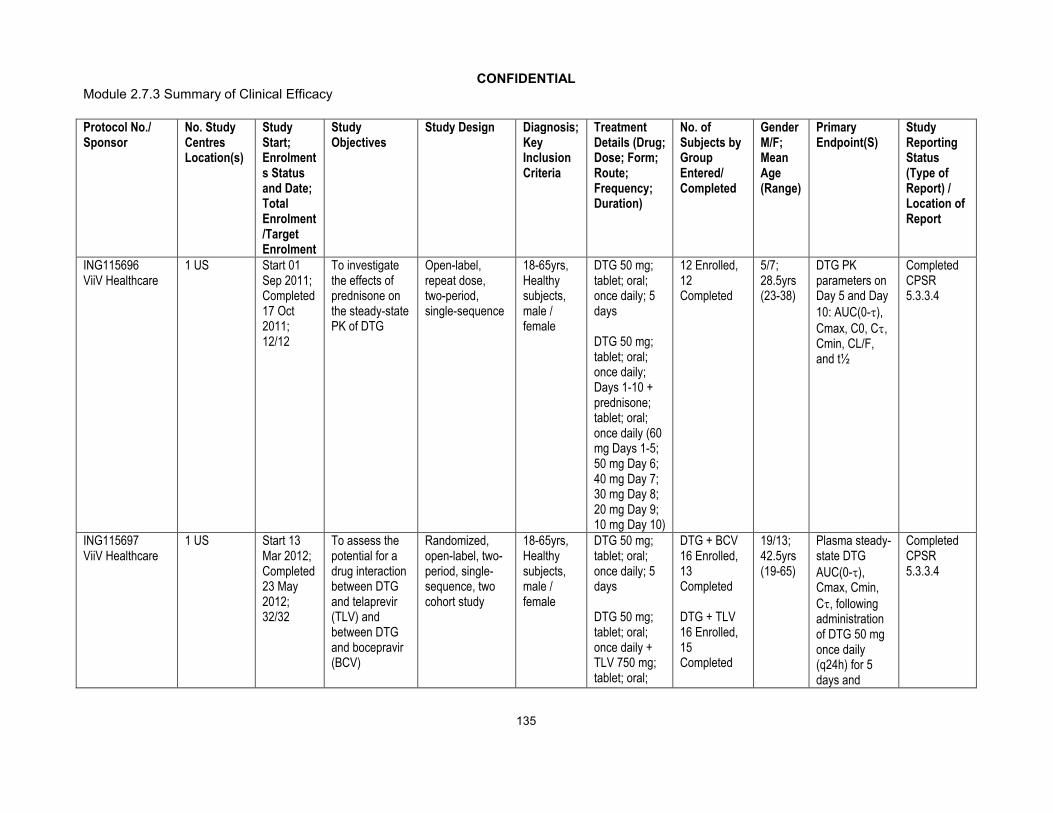
CONFIDENTIALModule 2.7.3 Summary of Clinical Efficacy
135
Protocol No./Sponsor
No. Study Centres Location(s)
Study Start; Enrolments Status and Date; Total Enrolment /Target Enrolment
Study Objectives
Study Design Diagnosis; Key Inclusion Criteria
Treatment Details (Drug; Dose; Form; Route; Frequency; Duration)
No. of Subjects by Group Entered/ Completed
Gender M/F; Mean Age (Range)
Primary Endpoint(S)
Study Reporting Status (Type of Report) / Location of Report
ING115696ViiV Healthcare
1 US Start 01 Sep 2011;Completed 17 Oct 2011;12/12
To investigate the effects of prednisone on the steady-state PK of DTG
Open-label, repeat dose,two-period, single-sequence
18-65yrs, Healthy subjects, male / female
DTG 50 mg; tablet; oral;once daily; 5 days
DTG 50 mg; tablet; oral;once daily; Days 1-10 + prednisone; tablet; oral; once daily (60 mg Days 1-5; 50 mg Day 6;40 mg Day 7;30 mg Day 8;20 mg Day 9; 10 mg Day 10)
12 Enrolled, 12 Completed
5/7;28.5yrs(23-38)
DTG PK parameters on Day 5 and Day 10: AUC(0-), Cmax, C0, C, Cmin, CL/F, and t½
Completed CPSR5.3.3.4
ING115697ViiV Healthcare
1 US Start 13 Mar 2012; Completed23 May 2012;32/32
To assess the potential for a drug interaction between DTG and telaprevir (TLV) and between DTG and bocepravir (BCV)
Randomized, open-label, two-period, single-sequence, two cohort study
18-65yrs, Healthy subjects, male / female
DTG 50 mg; tablet; oral; once daily; 5 days
DTG 50 mg; tablet; oral; once daily + TLV 750 mg; tablet; oral;
DTG + BCV16 Enrolled, 13 Completed
DTG + TLV16 Enrolled, 15 Completed
19/13;42.5yrs (19-65)
Plasma steady-state DTG AUC(0-), Cmax, Cmin, C, following administration of DTG 50 mg once daily (q24h) for 5 days and
Completed CPSR5.3.3.4

CONFIDENTIALModule 2.7.3 Summary of Clinical Efficacy
136
Protocol No./Sponsor
No. Study Centres Location(s)
Study Start; Enrolments Status and Date; Total Enrolment /Target Enrolment
Study Objectives
Study Design Diagnosis; Key Inclusion Criteria
Treatment Details (Drug; Dose; Form; Route; Frequency; Duration)
No. of Subjects by Group Entered/ Completed
Gender M/F; Mean Age (Range)
Primary Endpoint(S)
Study Reporting Status (Type of Report) / Location of Report
q8h; 10 days
DTG 50 mg; tablet; oral;once daily + BCV 800 mg; capsule; oral; q8h; 10 days
following co-administration with BCV 800 mg q8h for 10 days or TVR 750 mg q8h for 10 days
ING115698 ViiV Healthcare
1 Canada Start 02 Dec 2011;Completed30 Dec 2011;11/12
To assess the potential for a drug interaction between DTG and methadone
Open-label, repeat dose,two-period, single-sequence
18-65yrs, Healthy subjects enrolled in a methadone maintenance program, male / female
Stable methadone dose; oral solution; once daily; 3 days
Stable methadone dose; oral solution + DTG 50 mg; tablet; oral; BID; 5 days
11 Enrolled, 10 Completed
6/5;34.5yrs(24-44)
Steady-state total and R-Methadone PK parameters: AUC(0-τ), Cmax, and Cτ
Completed CPSR5.3.3.4
ING111405 GSK 1 US Start 09 Oct 2008; Completed 12 Dec 2008;31/30
To assess the potential for a drug interaction between DTG and lopinavir (LPV)/ ritonavir (RTV) and
Randomized, open-label, two-period, single-sequence, two cohort study
18-50yrs, Healthysubjects, male / female
DTG 30 mg; tablet; oral;once daily; 5 days
DTG 30 mg; tablet; oral;
31 Enrolled, 30 Completed
31/0; 29.4yrs (18-50)
Plasma DTG steady-state AUC(0-τ), Cmax, Cτ, Cmin, CL/F, t½ and t1/2 following
Completed CPSR5.3.3.4

CONFIDENTIALModule 2.7.3 Summary of Clinical Efficacy
137
Protocol No./Sponsor
No. Study Centres Location(s)
Study Start; Enrolments Status and Date; Total Enrolment /Target Enrolment
Study Objectives
Study Design Diagnosis; Key Inclusion Criteria
Treatment Details (Drug; Dose; Form; Route; Frequency; Duration)
No. of Subjects by Group Entered/ Completed
Gender M/F; Mean Age (Range)
Primary Endpoint(S)
Study Reporting Status (Type of Report) / Location of Report
between DTG and darunavir (DRV)/ RTV
once daily + LPV/RTV 400/100 mg; tablet; oral; q12h; 14 days
DTG 30 mg; tablet; oral;once daily + DRV (tablet) /RTV (capsule) 600/100 mg; oral; q12h; 14 days
administration of DTG 30mg q24h for 5 days and following co-administration with LPV/RTV 400/100 mg q12h or DRV/RTV 600/100 mg q12h for 14 days

CONFIDENTIALModule 2.7.3 Summary of Clinical Efficacy
138
Protocol No./Sponsor
No. Study Centres Location(s)
Study Start; Enrolments Status and Date; Total Enrolment /Target Enrolment
Study Objectives
Study Design Diagnosis; Key Inclusion Criteria
Treatment Details (Drug; Dose; Form; Route; Frequency; Duration)
No. of Subjects by Group Entered/ Completed
Gender M/F; Mean Age (Range)
Primary Endpoint(S)
Study Reporting Status (Type of Report) / Location of Report
ING111602GSK
1 US Start 07 Jan 2009;Completed 05 Mar 2009;16/16
To assess the potential for a drug interaction between DTG and multivitamin and between DTG and Maalox
Open-label, single dose, randomized, four-period crossover study
18-65yrs, Healthysubjects, male/ female
DTG 50 mg; tablet; oral;single dose
DTG 50 mg; tablet; oral;single dose + multivitamin; tablet; oral;single dose
DTG 50 mg; tablet; oral; single dose + Maalox Advanced Maximum Strength; 20mL suspension; single dose
DTG 50 mg; tablet; oral; single dose 2 hrs prior to Maalox Advanced
16 Enrolled, 16 Completed
16/0; 30.8yrs (18-53)
Single dose plasma DTG AUC(0-∞), Cmax, and C24
Completed CPSR5.3.3.4

CONFIDENTIALModule 2.7.3 Summary of Clinical Efficacy
139
Protocol No./Sponsor
No. Study Centres Location(s)
Study Start; Enrolments Status and Date; Total Enrolment /Target Enrolment
Study Objectives
Study Design Diagnosis; Key Inclusion Criteria
Treatment Details (Drug; Dose; Form; Route; Frequency; Duration)
No. of Subjects by Group Entered/ Completed
Gender M/F; Mean Age (Range)
Primary Endpoint(S)
Study Reporting Status (Type of Report) / Location of Report
Maximum Strength20mL; suspension; single dose
ING111603GSK
1 US Start 16 Oct 2008;Completed12 Dec 2008;16/16
To assess the potential for a drug interaction between DTG and etravirine (ETR)
Open-label, repeat dose, two-period, single-sequence study
18-65yrs, Healthysubjects, male/ female
DTG 50 mg; tablet; oral; once daily; 5 days
DTG 50 mg; tablet; oral;once daily + ETR 200 mg; tablet; oral; q12h; 14 days
16 Enrolled, 15 Completed
16/0; 41.5yrs (19-64)
Plasma DTGsteady-state AUC(0-τ), Cmax, Cτ, Cmin, CL/F, t½ following administration of DTG 50mg q24h for 5 days and following co-administration with ETR200mg q12h for 14 days
Completed CPSR5.3.3.4
ING111604GSK
1 US Start 11 Aug 2008; Completed 01 Oct 2008; 16/16
To assess the potential for a drug interaction between DTG and tenofovir (TDF)
Open-label, repeat-dose, single-sequence, three-period study
18-65yrs, Healthysubjects,male/ female
DTG 50 mg; tablet; oral;once daily; 5 days
TDF 300 mg; tablet; oral;once daily; 7
16 Enrolled,15 Completed
15/1;38.6yrs
(20-58)
Plasma DTG steady-state AUC[0-], Cmax and Cfollowing administration of DTG 50 mg q24h for 5 days
Completed CPSR5.3.3.4

CONFIDENTIALModule 2.7.3 Summary of Clinical Efficacy
140
Protocol No./Sponsor
No. Study Centres Location(s)
Study Start; Enrolments Status and Date; Total Enrolment /Target Enrolment
Study Objectives
Study Design Diagnosis; Key Inclusion Criteria
Treatment Details (Drug; Dose; Form; Route; Frequency; Duration)
No. of Subjects by Group Entered/ Completed
Gender M/F; Mean Age (Range)
Primary Endpoint(S)
Study Reporting Status (Type of Report) / Location of Report
days
DTG 50 mg; tablet; oral;once daily + TDF 300 mg; tablet; oral;once daily; 5 days
and following co-administration with TDF 300 mg q24h for 5 days
ING111854GSK
1 US Start 07 Apr 2009;Completed09 Jun 2009;24/24
To assess the potential for a drug interaction between DTG and atazanavir (ATV) and between DTG and ATV/RTV
Randomized, open-label, repeat dose, two-period, single-sequence, two-cohort study
18-65yrs, Healthysubjects,male / female
Period 1:DTG 30 mg; tablet; oral;once daily; 5 days; fed
Period 2:DTG 30 mg; tablet; oral;once daily + ATV/RTV 300/100 mg; capsule; once daily; 14 days
DTG 30 mg; tablet; oral;once daily + ATV 400mg;
24 Enrolled,24 Completed
21/3; 37.2yrs (18-61)
Plasma DTG steady-state AUC(0-τ), Cmax, C0, Cτ, and Cmin following administrationof DTG 30mg q24h for 5 days and following co-administration with ATV/RTV 300/100mg q24h or ATV 400mg q24h for 14 days
Completed CPSR5.3.3.4
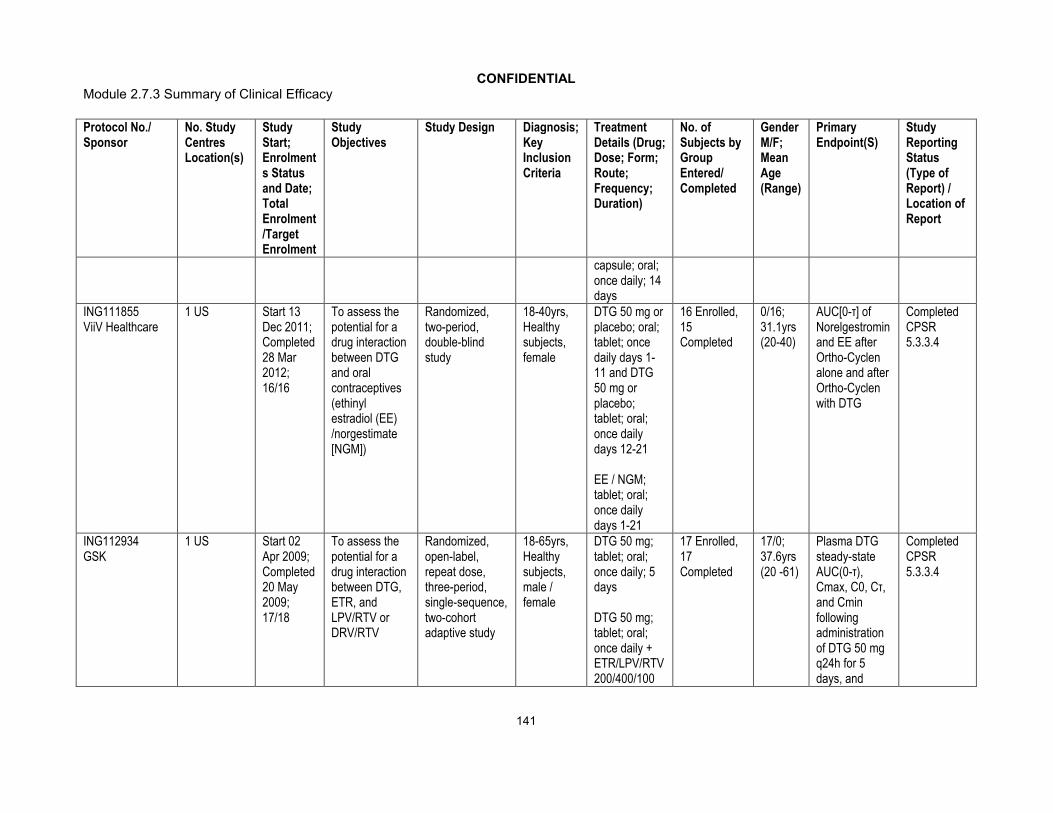
CONFIDENTIALModule 2.7.3 Summary of Clinical Efficacy
141
Protocol No./Sponsor
No. Study Centres Location(s)
Study Start; Enrolments Status and Date; Total Enrolment /Target Enrolment
Study Objectives
Study Design Diagnosis; Key Inclusion Criteria
Treatment Details (Drug; Dose; Form; Route; Frequency; Duration)
No. of Subjects by Group Entered/ Completed
Gender M/F; Mean Age (Range)
Primary Endpoint(S)
Study Reporting Status (Type of Report) / Location of Report
capsule; oral;once daily; 14 days
ING111855ViiV Healthcare
1 US Start 13 Dec 2011;Completed28 Mar 2012;16/16
To assess the potential for a drug interaction between DTG and oral contraceptives (ethinyl estradiol (EE) /norgestimate [NGM])
Randomized, two-period, double-blind study
18-40yrs,Healthy subjects, female
DTG 50 mg or placebo; oral; tablet; once daily days 1-11 and DTG 50 mg or placebo; tablet; oral; once daily days 12-21
EE / NGM; tablet; oral; once daily days 1-21
16 Enrolled, 15 Completed
0/16;31.1yrs(20-40)
AUC[0-τ] of Norelgestromin and EE after Ortho-Cyclen alone and afterOrtho-Cyclen with DTG
Completed CPSR5.3.3.4
ING112934GSK
1 US Start 02 Apr 2009;Completed20 May 2009;17/18
To assess the potential for a drug interaction between DTG, ETR, and LPV/RTV or DRV/RTV
Randomized, open-label, repeat dose, three-period, single-sequence, two-cohort adaptive study
18-65yrs, Healthy subjects, male / female
DTG 50 mg; tablet; oral;once daily; 5 days
DTG 50 mg; tablet; oral;once daily +ETR/LPV/RTV 200/400/100
17 Enrolled, 17 Completed
17/0;37.6yrs (20 -61)
Plasma DTG steady-state AUC(0-τ), Cmax, C0, Cτ, and Cmin following administration of DTG 50 mg q24h for 5 days, and
Completed CPSR5.3.3.4

CONFIDENTIALModule 2.7.3 Summary of Clinical Efficacy
142
Protocol No./Sponsor
No. Study Centres Location(s)
Study Start; Enrolments Status and Date; Total Enrolment /Target Enrolment
Study Objectives
Study Design Diagnosis; Key Inclusion Criteria
Treatment Details (Drug; Dose; Form; Route; Frequency; Duration)
No. of Subjects by Group Entered/ Completed
Gender M/F; Mean Age (Range)
Primary Endpoint(S)
Study Reporting Status (Type of Report) / Location of Report
mg; tablet; oral; q12h; 14 days
DTG 50 mg; tablet; oral; once daily + ETR (tablet) DRV (tablet) /RTV (capsule) 200/600/100 mg; oral; once daily; 14 days
following co-administration of DTG 50 mg q24h (and 50 mg q12h if appropriate) with ETR/LPV/RTV 200/400/100 mg q12h or ETR/DRV/RTV 200/600/100 mg q12h, each for 14 days
ING112941GSK
1 US Start 23 Jul 2009;Completed28 Sep 2009;Part 1: 14/14,Part 2: 10/10
To evaluate the effect of a high fat meal and omeprazole on DTG PK and to evaluate the safety and PK of a 250 mg dose of DTG
Part 1: Randomized, open-label, two sequence, three treatment crossover
Part 2: Randomized, double-blind, single dose PK study
18-65yrs, healthy subjects, male / female
Part 1: DTG 50 mg; tablet; oral; single dose; fasted
DTG 50 mg; tablet; oral;single dose; within 30 minutes after the start of a high fat meal
Part 1: 14 Enrolled, 12 Completed
Part 2: 10 Enrolled (includes 2 placebo),10 Completed
Part 1: 12/2;40.6yrs (23-55)
Part 2: 9/1;38.4yrs (21-54)
Plasma DTG following a single dose of 50 mg under fasted conditions with and without OMP 40 mg: AUC(0-t), AUC(0-∞), Cmax, tmax, C24, tlag
Plasma DTG
Completed CPSR5.3.3.4

CONFIDENTIALModule 2.7.3 Summary of Clinical Efficacy
143
Protocol No./Sponsor
No. Study Centres Location(s)
Study Start; Enrolments Status and Date; Total Enrolment /Target Enrolment
Study Objectives
Study Design Diagnosis; Key Inclusion Criteria
Treatment Details (Drug; Dose; Form; Route; Frequency; Duration)
No. of Subjects by Group Entered/ Completed
Gender M/F; Mean Age (Range)
Primary Endpoint(S)
Study Reporting Status (Type of Report) / Location of Report
DTG 50 mg; tablet; oral;single dose + omeprazole 40 mg; capsule; oral; once daily; 5 days
Part 2: DTG 250 mgor placebo; oral suspension, single dose; fasted
following a single dose of 50 mg under fasted conditions and with a high-fat meal: AUC(0-t), AUC(0-∞), Cmax, tmax, C24, and tlag
Plasma DTG following a single dose of 250 mg under fasted conditions: AUC(0-t), AUC(0-∞), Cmax, tmax, C24, and tlagSafety and tolerability parameters following a single dose of DTG 250 mg

CONFIDENTIALModule 2.7.3 Summary of Clinical Efficacy
144
Protocol No./Sponsor
No. Study Centres Location(s)
Study Start; Enrolments Status and Date; Total Enrolment /Target Enrolment
Study Objectives
Study Design Diagnosis; Key Inclusion Criteria
Treatment Details (Drug; Dose; Form; Route; Frequency; Duration)
No. of Subjects by Group Entered/ Completed
Gender M/F; Mean Age (Range)
Primary Endpoint(S)
Study Reporting Status (Type of Report) / Location of Report
ING113068ViiV Healthcare
1 US Start 09 Sep 2010;Completed04 Nov 2010;Part A: 12/12,Part B: 15/15
To investigate the effects of fosamprenavir (FPV)/ RTV on the steady-state PK of DTG and to evaluate relative bioavailability of tablets with varying particle size
Part A: Open-label, repeat dose, two-period, single-sequence
Part B: Open-label, single dose,randomized, three-period, cross over study
18-65yrs, Healthy subjects, male / female
Part A:DTG 50 mg; tablet; oral; once daily; 5 days
DTG 50 mg; tablet; oral; once daily + FPV 700 mg; tablet / RTV100 mg; capsule; oral; q12h; 10 days
Part B:DTG 50 mg using 25 mg tablets with micronized drug substance; oral; single dose
DTG 50 mg using 25 mg tablets with
Part A: 12 Enrolled12, Completed
Part B: 15 Enrolled, 15 Completed
Part A: 10/2; 33.4yrs(24-55)
Part B: 4/11; 34.7yrs(20-60)
Part A: Plasma DTG steady-state AUC(0-), Cmax, C0, C,and Cmin following administration of DTG 50 mg q24h for 5 days and following co-administration with FPV/RTV 700/100 mg q12h for 10 days
Part B: Plasma DTG AUC(0-), AUC(0-t), and Cmax following a single dose of DTG 50 mg
Completed CPSR5.3.3.4
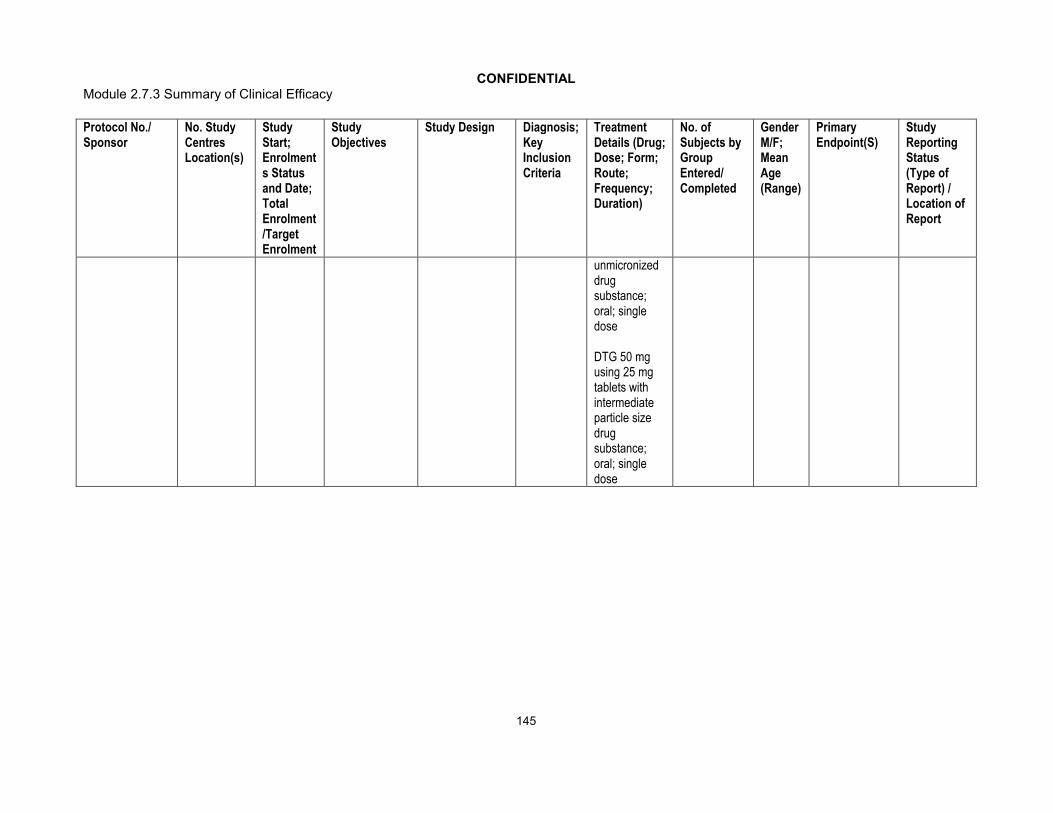
CONFIDENTIALModule 2.7.3 Summary of Clinical Efficacy
145
Protocol No./Sponsor
No. Study Centres Location(s)
Study Start; Enrolments Status and Date; Total Enrolment /Target Enrolment
Study Objectives
Study Design Diagnosis; Key Inclusion Criteria
Treatment Details (Drug; Dose; Form; Route; Frequency; Duration)
No. of Subjects by Group Entered/ Completed
Gender M/F; Mean Age (Range)
Primary Endpoint(S)
Study Reporting Status (Type of Report) / Location of Report
unmicronized drug substance; oral; single dose
DTG 50 mg using 25 mg tablets with intermediate particle size drug substance; oral; single dose

CONFIDENTIALModule 2.7.3 Summary of Clinical Efficacy
146
Protocol No./Sponsor
No. Study Centres Location(s)
Study Start; Enrolments Status and Date; Total Enrolment /Target Enrolment
Study Objectives
Study Design Diagnosis; Key Inclusion Criteria
Treatment Details (Drug; Dose; Form; Route; Frequency; Duration)
No. of Subjects by Group Entered/ Completed
Gender M/F; Mean Age (Range)
Primary Endpoint(S)
Study Reporting Status (Type of Report) / Location of Report
ING113096GSK
1 US Start 15 Feb 2010;Completed05 Apr 2010;18/18
To assess the safety, tolerability and PK of repeat dose co-administration of DTG alone, tipranavir (TPV)/RTV alone, and DTG in combination with TPV/RTV
Randomized, open-label, repeat dose, three-period single-sequence, study
18-55yrs, Healthy subjects, male / female
DTG 50 mg; tablet; oral;once daily; 5 days
TPV / RTV 500/200 mg; capsule; oral; BID; 7 days
DTG 50 mg; tablet; oral;once daily andTPV / RTV 500/200 mg; capsule; oral;BID; 5 days
18 Enrolled,13 Completed
14/4;29.3yrs (19-45)
Plasma DTGsteady-state AUC(0-), Cmax, C0, C, and Cmin following administration of DTG 50 mg once daily for 5 days and following co-administration with TPV/RTV 500/200 mg BID for 5 days
Completed CPSR5.3.3.4
ING114005ViiV Healthcare
1 US Start 16 Mar 2010;Completed 26 May 2010;12/12
To evaluate PK of DTG 100 mg versus 50 mg and the effect of efavirenz (EFV) on the PK, safety and tolerability of DTG 50 mg
Open label, repeat dose, three period single-sequence
18-65yrs, Healthysubjects, male / female
DTG 100 mg; tablet; oral; single dose
DTG 50 mg; tablet; oral;once daily; 5 days
DTG 50 mg; tablet; oral;
12 Enrolled,12 Completed
12/0; 38.7yrs (20-65)
Plasma DTG AUC(0-24), Cmax, and C24, and dose-normalized AUC(0-24), Cmax, and C24 following single dose administration of 100 mg and
Completed CPSR5.3.3.4

CONFIDENTIALModule 2.7.3 Summary of Clinical Efficacy
147
Protocol No./Sponsor
No. Study Centres Location(s)
Study Start; Enrolments Status and Date; Total Enrolment /Target Enrolment
Study Objectives
Study Design Diagnosis; Key Inclusion Criteria
Treatment Details (Drug; Dose; Form; Route; Frequency; Duration)
No. of Subjects by Group Entered/ Completed
Gender M/F; Mean Age (Range)
Primary Endpoint(S)
Study Reporting Status (Type of Report) / Location of Report
once daily in AM + EFV 600 mg; tablet; oral; once daily in PM; 14 days
50 mg
Plasma DTG steady-state AUC(0-), Cmax, C0, C, and Cmin following administration of DTG 50 mg q24h for 5 days and following co-administration with EFV 600 mg q24h for 14 days
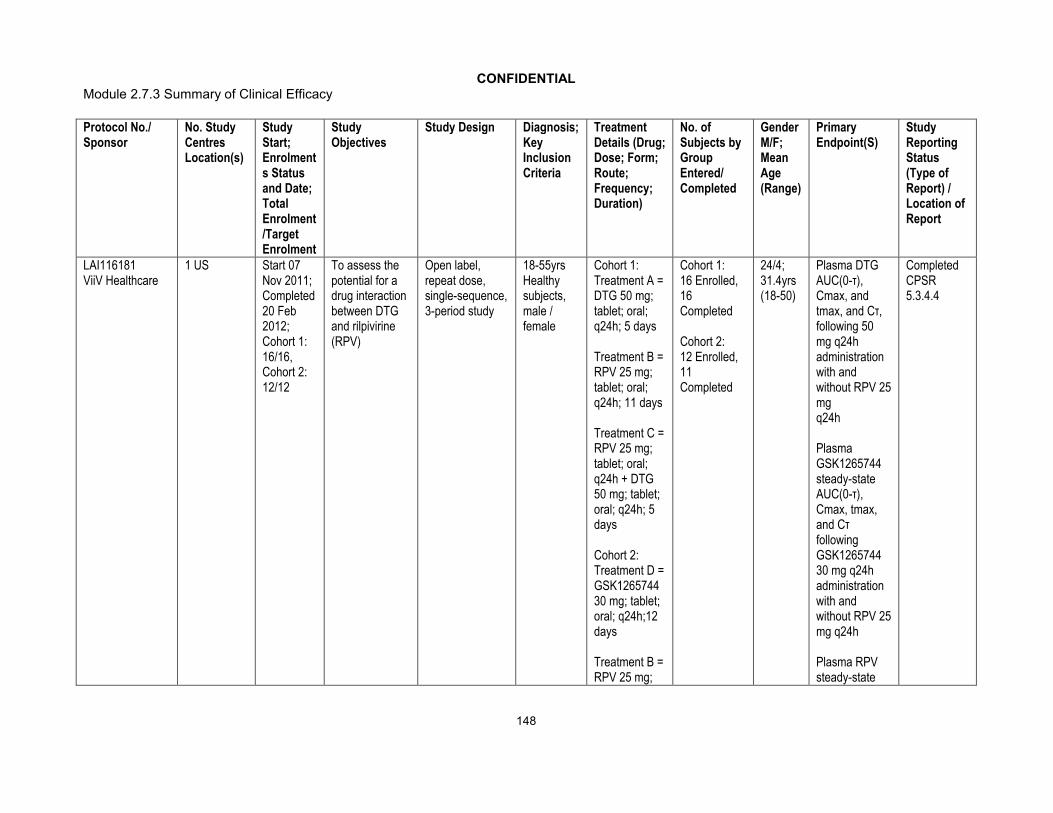
CONFIDENTIALModule 2.7.3 Summary of Clinical Efficacy
148
Protocol No./Sponsor
No. Study Centres Location(s)
Study Start; Enrolments Status and Date; Total Enrolment /Target Enrolment
Study Objectives
Study Design Diagnosis; Key Inclusion Criteria
Treatment Details (Drug; Dose; Form; Route; Frequency; Duration)
No. of Subjects by Group Entered/ Completed
Gender M/F; Mean Age (Range)
Primary Endpoint(S)
Study Reporting Status (Type of Report) / Location of Report
LAI116181 ViiV Healthcare
1 US Start 07 Nov 2011;Completed20 Feb2012;Cohort 1: 16/16,Cohort 2: 12/12
To assess the potential for a drug interaction between DTG and rilpivirine (RPV)
Open label, repeat dose, single-sequence, 3-period study
18-55yrs Healthysubjects, male / female
Cohort 1: Treatment A = DTG 50 mg; tablet; oral; q24h; 5 days
Treatment B = RPV 25 mg; tablet; oral; q24h; 11 days
Treatment C = RPV 25 mg; tablet; oral; q24h + DTG 50 mg; tablet;oral; q24h; 5 days
Cohort 2: Treatment D = GSK1265744 30 mg; tablet; oral; q24h;12 days
Treatment B = RPV 25 mg;
Cohort 1: 16 Enrolled, 16 Completed
Cohort 2: 12 Enrolled, 11 Completed
24/4; 31.4yrs (18-50)
Plasma DTG AUC(0-τ), Cmax, and tmax, and Cτ, following 50 mg q24h administration with and without RPV 25 mgq24h
Plasma GSK1265744 steady-state AUC(0-τ), Cmax, tmax, and Cτ followingGSK1265744 30 mg q24h administration with and without RPV 25 mg q24h
Plasma RPV steady-state
Completed CPSR5.3.4.4

CONFIDENTIALModule 2.7.3 Summary of Clinical Efficacy
149
Protocol No./Sponsor
No. Study Centres Location(s)
Study Start; Enrolments Status and Date; Total Enrolment /Target Enrolment
Study Objectives
Study Design Diagnosis; Key Inclusion Criteria
Treatment Details (Drug; Dose; Form; Route; Frequency; Duration)
No. of Subjects by Group Entered/ Completed
Gender M/F; Mean Age (Range)
Primary Endpoint(S)
Study Reporting Status (Type of Report) / Location of Report
tablet; oral; q24h; 12 days
Treatment E = RPV 25 mg; tablet; oral; q24h + GSK1265744 30 mg; tablet; oral; q24h; 12 days
AUC(0-τ), Cmax, tmax, and Cτ following RPV 25 mg q24hadministration with and without DTG 50 mg q24h or GSK1265744 30 mg q24h
Human Pharmacodynamic StudiesING111856GSK
1 US Start 28 Sep 2009;Completed29 Dec 2009;42/42
To evaluate the effect of DTG on cardiac conduction as assessed by 12-lead electrocardiogram compared to placebo and moxifloxacin (Thorough QTc study of DTG)
Randomized, partial-blind, single dose, three-period, cross-over study
18-55yrs, Healthy subjects, male / female
DTG 250 mg;oral suspension; single dose
Placebo; oral suspension; single dose
Moxifloxacin 400 mg; tablet; oral;single dose
42 Enrolled, 38 Completed
17/25;34.5yrs (18-55)
Change from Baseline in QTcF for DTG
Completed CPSR5.3.4.1
ING114819ViiV Healthcare
1 US Start 05 Oct 2010;Completed
To evaluate the effect of DTG on glomerular
Open-label, randomized, three-arm,
18-65yrs, Healthysubjects,
DTG 50 mg; tablet; oral;once daily; 14
38 Enrolled,34 Completed
28/10; 31.8yrs (19-59)
GFR as measured by iohexol plasma
Completed CPSR5.3.4.1
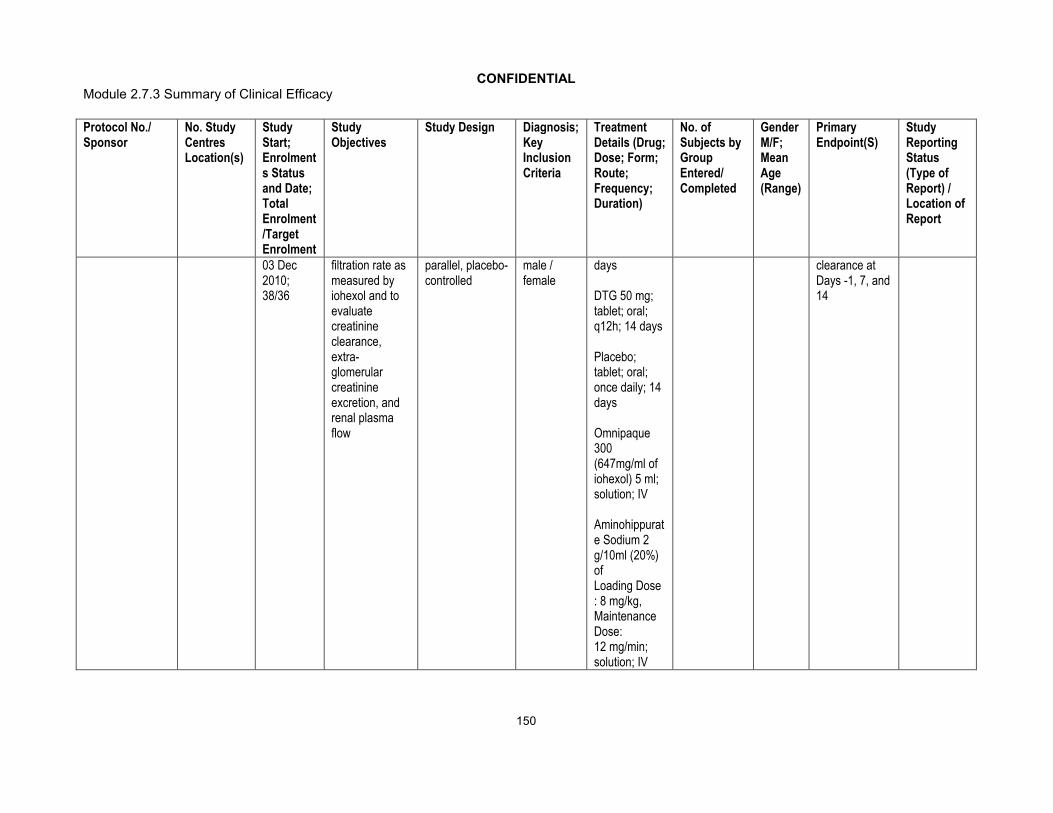
CONFIDENTIALModule 2.7.3 Summary of Clinical Efficacy
150
Protocol No./Sponsor
No. Study Centres Location(s)
Study Start; Enrolments Status and Date; Total Enrolment /Target Enrolment
Study Objectives
Study Design Diagnosis; Key Inclusion Criteria
Treatment Details (Drug; Dose; Form; Route; Frequency; Duration)
No. of Subjects by Group Entered/ Completed
Gender M/F; Mean Age (Range)
Primary Endpoint(S)
Study Reporting Status (Type of Report) / Location of Report
03 Dec 2010;38/36
filtration rate as measured by iohexol and to evaluatecreatinine clearance, extra-glomerular creatinine excretion, and renal plasma flow
parallel, placebo-controlled
male / female
days
DTG 50 mg; tablet; oral;q12h; 14 days
Placebo; tablet; oral;once daily; 14 days
Omnipaque 300 (647mg/ml ofiohexol) 5 ml;solution; IV
Aminohippurate Sodium 2 g/10ml (20%) ofLoading Dose : 8 mg/kg, Maintenance Dose:12 mg/min; solution; IV
clearance at Days -1, 7, and 14

CONFIDENTIALModule 2.7.3 Summary of Clinical Efficacy
151
Protocol No./Sponsor
No. Study Centres Location(s)
Study Start; Enrolments Status and Date; Total Enrolment /Target Enrolment
Study Objectives
Study Design Diagnosis; Key Inclusion Criteria
Treatment Details (Drug; Dose; Form; Route; Frequency; Duration)
No. of Subjects by Group Entered/ Completed
Gender M/F; Mean Age (Range)
Primary Endpoint(S)
Study Reporting Status (Type of Report) / Location of Report
Patient PD and PK/PD Study ReportsING111521GSK
14 US Start 25 Jun 2008;Completed 26 Aug 2008;35/30
To assess the safety, tolerability and efficacy of repeat dose DTG
Dose-ranging, 10-day, repeat dose, placebo-controlled monotherapy study
18-65yrs, HIV-infected subjects, male/female
DTG 2, 10,50 mg tablet;oral; once daily; 10 days; fasted
35 Enrolled (including 7 placebo) 35, Completed
35/0;38.4yrs (20-55)
Change from baseline in plasma HIV-1 RNA to Day 11DTG following dose on Day 1: AUC(0-), AUC(0-24), Cmax, tmax, C24, t½, tlag, and CL/F; and following last repeat dose on Day 10: AUC(0-), C0, C, Cmin, Cmax, tmax, t½, and CL/F, if data permit
Safety and tolerability parameters
Completed CPSR5.3.4.2
ING116070ViiV Healthcare
3 US Start 24 Jan 2012; Ongoing; 14/14
To determine plasma (total and unbound) DTG
Phase IIIb single-arm, open-label, multicenter study
18yrs, HIV-infected,ART-naïve
DTG 50 mg; tablet; oral;once daily + ABC/3TC
13 Enrolled, 12 Ongoing
ITT-E:13/0;40.2yrs (28-52)
Proportion of subjects with plasma HIV-1 RNA <50 c/mL
CompletedWeek 2 Synoptic Clinical

CONFIDENTIALModule 2.7.3 Summary of Clinical Efficacy
152
Protocol No./Sponsor
No. Study Centres Location(s)
Study Start; Enrolments Status and Date; Total Enrolment /Target Enrolment
Study Objectives
Study Design Diagnosis; Key Inclusion Criteria
Treatment Details (Drug; Dose; Form; Route; Frequency; Duration)
No. of Subjects by Group Entered/ Completed
Gender M/F; Mean Age (Range)
Primary Endpoint(S)
Study Reporting Status (Type of Report) / Location of Report
concentration and evaluate the relationship between DTG concentration in plasma and CSF
subjects, male / female
600/300 mg; tablet; oral;once daily; 96 weeks
over time;
Absolute values and change from Baseline in plasma HIV-1 RNA over time;Absolute values and changes from Baseline in CD4+ and CD8+ T cell counts overtime
Incidence of disease progression HIV-associated conditions, AIDS and death
Study Report (CSR)5.3.4.2

CONFIDENTIALModule 2.7.3 Summary of Clinical Efficacy
153
Protocol No./Sponsor
No. Study Centres Location(s)
Study Start; Enrolments Status and Date; Total Enrolment /Target Enrolment
Study Objectives
Study Design Diagnosis; Key Inclusion Criteria
Treatment Details (Drug; Dose; Form; Route; Frequency; Duration)
No. of Subjects by Group Entered/ Completed
Gender M/F; Mean Age (Range)
Primary Endpoint(S)
Study Reporting Status (Type of Report) / Location of Report
Efficacy and Safety Studies: Controlled Clinical Studies Pertinent to the Claimed IndicationING112276
ViiV Healthcare
34 centres:6 France, 4 Germany, 3 Russia, 4 Italy, 5 Spain, 12 US
Start 30 Jul 2009;Ongoing;205/200
To select a once daily oral dose of DTG administered with either ABC/3TC or TDF/ emtricitabine (FTC) and to evaluate antiviral activity, safety and PK over time
Phase IIb, Randomized, multicentre, parallel group, dose-ranging
18yrs, HIV-infected, ART-naïvesubjects, male / female
DTG 10 mg; tablet; oral + ABC/3TC 600mg/300 mg or TDF/FTC 300mg/200mg; tablet; oral; once daily; 96 weeks
DTG 25 mg; tablet; oral + ABC/3TC 600mg/300mg or TDF/FTC 300mg/200mg; oral; once daily; 96 weeks
DTG 50 mg; tablet; oral + ABC/3TC 600mg/300mg or TDF/FTC 300mg/200mg
DTG 10 mg: 53 Randomized, 47 Completed DTG 25 mg: 51 Randomized, 45 Completed
DTG 50 mg: 51 Randomized, 46 Completed
EFV 600 mg: 50 Randomized, 39 Completed
DTG 50 mg Open label: 138 Enrolled,
177/28; 37.2yrs (20-79)
Proportion of subjects with HIV-1 RNA <50 c/mL (c/mL) through Week 16 using the Time to Loss of Virological Response (TLOVR) algorithm. Dose selection will be based primarily on antiviral activity and tolerability in conjunction with immunologic, safety and PK measures will also be considered
Completed:
(Week 16 Synoptic CSR)
(Week 24 Full CSR)
(Week 48 Abbreviated CSR)
(Week 96 Full CSR)
5.3.5.1

CONFIDENTIALModule 2.7.3 Summary of Clinical Efficacy
154
Protocol No./Sponsor
No. Study Centres Location(s)
Study Start; Enrolments Status and Date; Total Enrolment /Target Enrolment
Study Objectives
Study Design Diagnosis; Key Inclusion Criteria
Treatment Details (Drug; Dose; Form; Route; Frequency; Duration)
No. of Subjects by Group Entered/ Completed
Gender M/F; Mean Age (Range)
Primary Endpoint(S)
Study Reporting Status (Type of Report) / Location of Report
; oral; once daily; 96 weeks
EFV 600 mg + ABC/3TC 600mg/300mg or TDF/FTC 300mg/200 mg; oral; once daily; 96 weeks
127 Ongoing
ING113086 ViiV Healthcare
100 centres: 27 Spain 19 US,12 France, 11 Russia, 10 Germany, 7 Canada,7 Italy,4 Australia,3 UK
Start 19 Oct 2010;Ongoing; 822/788
To assess safety and efficacy of DTG 50 mg once daily to RAL 400 mg BID both administered with fixed-dose dual nucleoside reverse transcriptase inhibitor therapy
Phase III, multicentre randomized, double blind, double-dummy, active-controlled, parallel group, fully-powered non-inferiority study
18yrs,HIV-infected, ART-naïvesubjects, male / female
DTG 50 mg; tablet; oral;once daily orRAL 400 mg; tablet; oral;once daily + ABC/3TC 600mg/300mg or TDF/ FTC 300mg/200mg; tablet; oral; once daily; 96 weeks
DTG: 411Randomized, 359 Ongoing.
RAL: 411 Randomized, 345 Ongoing
703/119; 37.0yrs (18-75)
The proportion of subjects with HIV-1 RNA <50 c/mL through Week 48 using a Missing, Switch or Discontinuation = Failure (MSDF) algorithm
Completed:Week 48Full CSR5.3.5.1
ING114467ViiV Healthcare
136 centres:4 Australia, 4 Belgium,
Start 01 Feb 2011; Ongoing;
To assess safety and efficacy of DTG
Phase III, randomized, double-blind,
18yrs,HIV-infected,
DTG 50 mg; tablet; oral;once daily +
DTG: 414 Randomized, 363 Ongoing.
703/130; 36.4yrs
The proportion of subjects with plasma HIV-1
Completed:Week 48Full CSR
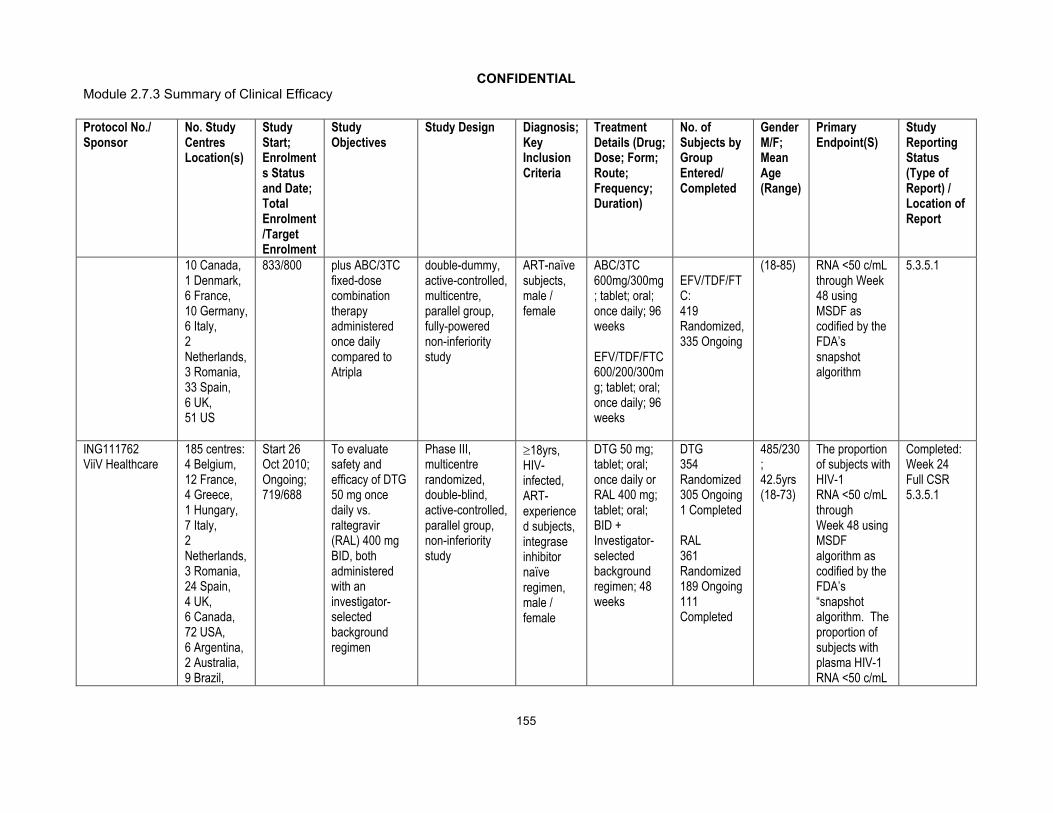
CONFIDENTIALModule 2.7.3 Summary of Clinical Efficacy
155
Protocol No./Sponsor
No. Study Centres Location(s)
Study Start; Enrolments Status and Date; Total Enrolment /Target Enrolment
Study Objectives
Study Design Diagnosis; Key Inclusion Criteria
Treatment Details (Drug; Dose; Form; Route; Frequency; Duration)
No. of Subjects by Group Entered/ Completed
Gender M/F; Mean Age (Range)
Primary Endpoint(S)
Study Reporting Status (Type of Report) / Location of Report
10 Canada, 1 Denmark,6 France,10 Germany, 6 Italy,2 Netherlands,3 Romania,33 Spain,6 UK,51 US
833/800 plus ABC/3TC fixed-dose combination therapy administered once daily compared to Atripla
double-dummy, active-controlled, multicentre, parallel group, fully-powered non-inferiority study
ART-naïvesubjects, male / female
ABC/3TC 600mg/300mg; tablet; oral;once daily; 96 weeks
EFV/TDF/FTC 600/200/300mg; tablet; oral;once daily; 96 weeks
EFV/TDF/FTC: 419 Randomized, 335 Ongoing
(18-85) RNA <50 c/mL through Week 48 using MSDF as codified by the FDA’s snapshot algorithm
5.3.5.1
ING111762 ViiV Healthcare
185 centres: 4 Belgium, 12 France,4 Greece,1 Hungary,7 Italy,2 Netherlands,3 Romania,24 Spain,4 UK,6 Canada,72 USA,6 Argentina,2 Australia,9 Brazil,
Start 26 Oct 2010; Ongoing;719/688
To evaluate safety and efficacy of DTG 50 mg once daily vs. raltegravir (RAL) 400 mg BID, both administered with an investigator-selected background regimen
Phase III, multicentre randomized, double-blind, active-controlled, parallel group, non-inferiority study
18yrs, HIV-infected, ART-experienced subjects, integrase inhibitornaïveregimen, male / female
DTG 50 mg; tablet; oral;once daily or RAL 400 mg; tablet; oral; BID + Investigator-selected background regimen; 48 weeks
DTG354Randomized305 Ongoing1 Completed
RAL361Randomized189 Ongoing111 Completed
485/230; 42.5yrs (18-73)
The proportion of subjects with HIV-1 RNA <50 c/mL through Week 48 using MSDF algorithm as codified by the FDA’s “snapshot algorithm. The proportion of subjects with plasma HIV-1 RNA <50 c/mL
Completed:Week 24 Full CSR5.3.5.1

CONFIDENTIALModule 2.7.3 Summary of Clinical Efficacy
156
Protocol No./Sponsor
No. Study Centres Location(s)
Study Start; Enrolments Status and Date; Total Enrolment /Target Enrolment
Study Objectives
Study Design Diagnosis; Key Inclusion Criteria
Treatment Details (Drug; Dose; Form; Route; Frequency; Duration)
No. of Subjects by Group Entered/ Completed
Gender M/F; Mean Age (Range)
Primary Endpoint(S)
Study Reporting Status (Type of Report) / Location of Report
5 Chile,4 Mexico,12 Russia,3 South Africa,5 Taiwan
will also be assessed at Week 24
ING112961ViiV Healthcare
16 centres:a 7 France,1 Italy, 1 Spain,6 US1 Canada
Start 31 Aug 2009; Ongoing; Cohort I: 27/30,Cohort II: 24/50
To assess the antiviral activity of DTG containing regimen
Phase IIb, multicentre, open-label, single-arm, sequential cohort, pilot study
18yrs,HIV-infected, ART-experienced subjects, raltegravir resistance,male / female
Cohort I: DTG 50 mg; tablet; oral;once daily; 96 weeks
Cohort II: DTG 50 mg; tablet; oral;BID; 48 weeks
Cohort I: 27 Randomized, 12 Ongoing
Cohort II: 24 Randomized,17 Ongoing
Cohort I: 25/2;46.7yrs (19-61)
Cohort II: 18/6;47.4yrs (33-68)
The proportion of subjects with Day 11 plasma HIV-1 RNA <400 c/mL or at least 0.7 log10 c/mL below their Baseline value (sample for evaluation of plasma HIV-1 RNA to be taken prior to Day 11 background treatment optimization)
Completed:
(Week 24 Cohort 1 Full CSR)
(Week 72 Cohort I/ Week 24 Cohort II Full CSR)
(Week 96 Cohort I/ Week 48 Cohort II Abbreviated CSR)
5.3.5.2ING112574 ViiV Healthcare
78 centres:1 Belgium,
Start 6 May 2011;
To assess the antiviral activity
Phase III,multicentre,
18yrs,HIV-
DTG 50 mg; tablet; oral;
183 Randomized,
141/42;47.0yrs
Mean change from baseline
Completed:Week 24

CONFIDENTIALModule 2.7.3 Summary of Clinical Efficacy
157
Protocol No./Sponsor
No. Study Centres Location(s)
Study Start; Enrolments Status and Date; Total Enrolment /Target Enrolment
Study Objectives
Study Design Diagnosis; Key Inclusion Criteria
Treatment Details (Drug; Dose; Form; Route; Frequency; Duration)
No. of Subjects by Group Entered/ Completed
Gender M/F; Mean Age (Range)
Primary Endpoint(S)
Study Reporting Status (Type of Report) / Location of Report
3 Canada, 15 France, 6 Italy, 4 Portugal, 8 Spain, 41 US
Ongoing; 183/175
of DTG administered with failing background therapy to Day 8 and thereafter with optimized background ART
single-arm, open-label study
infected, ART-experienced subjects, integrase inhibitor regimen, male / female
BID; 24 weeks 155 Ongoing (19- 67) in plasma HIV-1 RNA (log10
c/mL) at Day 8
Full CSR5.3.5.2
ING112578
1 US Start 16 March 2011;Ongoing;22/168
To select a DTG dose for chronic dosing in infants, children and adolescents that achieves similar exposure to the DTG adult dose selected from the Phase IIb clinical trial in ART-naïve adult subjects (ING112276), to evaluate safety, tolerability, and steady-state PK
Phase I/II, multicenter, open-label, non-comparative intensive PK and safety study
6wks-<18yrs, HIV-1 infected subjects, male / female
DTG once-a-day doses with target dose of ~1 mg/kg and with 4 weight bands, and maximum dose of 50 mg; 48 weeks
Cohort 1(Stage 1): 10 Enrolled, 10 Ongoing
Cohort 1 (Stage 2): 12 Enrolled, 12 Ongoing
Cohort 1: (Stage 1) 3/7;14.0yrs (12–17)
Cohort 1 (Stage 2): no dataavailable
Toxicity through week 24
All AEs or lab toxicities of Grade 3 or higher severity
Adverse events or lab toxicities of grade 3 or higher severity judged to be at least possibly attributable to the study medication
Completed: Week 24 Full CSR
(10 subjects [Stage 1] from Cohort 1 through 24 weeks)
5.3.5.2

CONFIDENTIALModule 2.7.3 Summary of Clinical Efficacy
158
Protocol No./Sponsor
No. Study Centres Location(s)
Study Start; Enrolments Status and Date; Total Enrolment /Target Enrolment
Study Objectives
Study Design Diagnosis; Key Inclusion Criteria
Treatment Details (Drug; Dose; Form; Route; Frequency; Duration)
No. of Subjects by Group Entered/ Completed
Gender M/F; Mean Age (Range)
Primary Endpoint(S)
Study Reporting Status (Type of Report) / Location of Report
of DTG in combination with other ARTs
Termination from treatment due to a suspected adverse drug reaction (SADR)Death
PK: AUC(0-24)
Reports of Analyses of Data from More Than One StudyING116265ViiV Healthcare
NA NA To evaluate the effects of UGT and CYP polymorphisms on the PK of DTG
Meta-analysis of PGx and PK data from 9 Phase II studies
Healthy adult subjects
DTG 50 mg; tablet; oral;once daily; 5 days
89 subjects included in the analysis
78/11; 36.9yrs (19-64)
NA Completed: Meta-analysis Report 5.3.5.3
Other Clinical StudiesING114915 ViiV Healthcare
65 centres: 32 US, 3 Puerto Rico, 6 France, 3 Germany, 5 Italy, 5 Spain, 3
Start 31 Oct 2011; Ongoing; 483/468
To demonstrate the non-inferior antiviral activity of DTG compared to DRV/RTV
Phase IIIb, randomized, open-label, multicenter study
18yrs,HIV-infected, ART-naïvesubjects, male / female
DTG 50 mg; tablet; oral;once daily; 96 weeks
DRV/RTV 800mg/100mg; tablet; oral; once daily; 96
DTG: 239 Randomized, 236 Ongoing
DRV/RTV: 244 Randomized,238 Ongoing
412/71; 36.0yrs (18-67)
The proportion of subjects with Day 11 plasma HIV-1 RNA <50 c/mL through Week 48 using the snapshot (MSDF)algorithm
Completed: Brief Study Summary5.3.5.4

CONFIDENTIALModule 2.7.3 Summary of Clinical Efficacy
159
Protocol No./Sponsor
No. Study Centres Location(s)
Study Start; Enrolments Status and Date; Total Enrolment /Target Enrolment
Study Objectives
Study Design Diagnosis; Key Inclusion Criteria
Treatment Details (Drug; Dose; Form; Route; Frequency; Duration)
No. of Subjects by Group Entered/ Completed
Gender M/F; Mean Age (Range)
Primary Endpoint(S)
Study Reporting Status (Type of Report) / Location of Report
Switzerland, 3 Romania, 5 Russia
weeks
ING114916 ViiV Healthcare
Centres in US, Canada
Planned Start 14 Jun 2012; Ongoing; 0/1000
To provide access to patients who have documented RAL or ELV resistance, who have limited treatment options and who require DTG to construct a viable ARV regimen for therapy
Open-label, multicentre, study
18yrs, HIV-infected subjects, male / female
DTG 50 mg; tablet; oral;BID
0/0 No data available
NA Completed: Brief Study Summary 5.3.5.4
ING115502ViiV Healthcare
37 centres: 6 US, 4 Australia, 3 Brazil, 2 Canada, 11 France, 3 Italy, 1 Netherlands,
Start 27 Jun 2011; Ongoing; 50/50
To provide a mechanism to supply DTG on an individual named patient basis for treatment of individuals with integrase
NA 18yrs,HIV-infected subjects, male / female
DTG 50 mg; tablet; oral;BID
50 Enrolled; 50 Ongoing
No dataavailable
NA Completed: Brief Study Summary 5.3.5.4

CONFIDENTIALModule 2.7.3 Summary of Clinical Efficacy
160
Protocol No./Sponsor
No. Study Centres Location(s)
Study Start; Enrolments Status and Date; Total Enrolment /Target Enrolment
Study Objectives
Study Design Diagnosis; Key Inclusion Criteria
Treatment Details (Drug; Dose; Form; Route; Frequency; Duration)
No. of Subjects by Group Entered/ Completed
Gender M/F; Mean Age (Range)
Primary Endpoint(S)
Study Reporting Status (Type of Report) / Location of Report
3 Spain, 4 UK
resistance who have no available treatment alternatives and/or limited treatment options
ING116529ViiV Healthcare
26 US Start 18 Apr 2012; Ongoing; 4/30
To quantify the antiviral activity of DTG compared to placebo (PCB)when administered with failing background therapy for 7 days
Phase III, randomized, multicentre, placebo-controlled, double-blind followed by an openlabel phase
18yrs,HIV-infected, ART-experienced subjects, integrase inhibitor regimen, male / female
DTG 50 mg; tablet; oral;BID orPlacebo; tablet oral; BID + current failing regimen; 7 days
4 Randomized; 4 Ongoing
No data available
The mean change from baseline in plasma HIV-1 RNA (log10
c/mL) at Day 8, using a last observation carried forward with discontinuation equals baseline
Completed: Brief Study Summary5.3.5.4
ING114580ViiV Healthcare
1 US Planned Start 19 Jun 2012; Ongoing; 0/66
To evaluate the bioequivalence between a single FDC tablet formulation of DTG 50mg,
Phase I, randomized, two part, open-label, crossover, single center study
18-65yrs, Healthy subjects, male / female
Part A:Treatment A = DTG 50 mg/ABC 600 mg/3TC 300 mg; FDCtablet; oral;
0/0 No data available
Plasma DTG, ABC and 3TC AUC(0-∞), AUC(0-t), and Cmax
Completed: Brief Study Summary5.3.5.4

CONFIDENTIALModule 2.7.3 Summary of Clinical Efficacy
161
Protocol No./Sponsor
No. Study Centres Location(s)
Study Start; Enrolments Status and Date; Total Enrolment /Target Enrolment
Study Objectives
Study Design Diagnosis; Key Inclusion Criteria
Treatment Details (Drug; Dose; Form; Route; Frequency; Duration)
No. of Subjects by Group Entered/ Completed
Gender M/F; Mean Age (Range)
Primary Endpoint(S)
Study Reporting Status (Type of Report) / Location of Report
ABC 600 mg and 3TC 300 mg versus co-administration of the separate tablet formulations of DTG 50 mg plus EPZICOM
single dose; fasted
Treatment B = DTG 50 mg +plus EPZICOM; tablet; oral; single dose;fasted
Part B:Treatment C = DTG 50 mg/ABC 600 mg/3TC 300mg; FDC tablet; oral; single dose; high fat meal
a. The total number of centres that enrolled subjects includes one Canadian site reflected here, which was added after publishing of m5.3.5.3 Integrated Summary of Efficacy.

CONFIDENTIALModule 2.7.3 Summary of Clinical Efficacy
162
Appendix Table 2 Results of Efficacy Studies
Study Treatment Arm No. Enrolled/ Completed
Primary Efficacy Variable Secondary Efficacy Endpoints
Other CommentsPlasma HIV-1
RNA (copies/mL)
Plasma HIV-1 RNA (log10 copies/mL)
<50 Baseline Change from Baseline
n/N (%) n Median[Range]
n Median[Range]
Pivotal Efficacy StudiesING113086
DTG 50 mg once daily + 2 NRTI
413 Rand.
364 Ongoing
361/411 (88) 411 4.516(1.59, 6.61)
374 -2.906(-4.82, 0.37)
DTG was not shown to be superior vs. RAL with respect to the proportion of subjects with detectable virus that had evidence of INI resistance by Week 48.
DTG was non-inferior to RAL for the primary endpoint at Week 48; adjusted difference for DTG vs. RAL is 2.5% (95% CI: -2.2%, 7.1%).
RAL 400 mg BID + 2 NRTI
414 Rand.
355 Ongoing
351/411 (85) 411 4.576(2.67, 6.70)
358 -2.949(-4.73, -1.08)
ING114467DTG 50 mg + ABC/3TC once daily
422 Rand.
363 Ongoing
364/414 (88) 414 4.670 (3.06, 6.46)
370 -3.035(-4.62, -0.12)
Median time to viral suppression (<50 c/mL) and 95% CI: 28 days [28, 29]Adjusted change from Baseline in CD4+ cell count at Week 48 and SE: 267 (9.05)
The study demonstrated superiority of DTG compared to Atripla. At 48 weeks, the difference in the primary endpoint and 95% CI was 7.4% (+2.5% to +12.3%). Statistical superiority was concluded as part of a subsequent, pre-specified testing procedure p=0.003.

CONFIDENTIALModule 2.7.3 Summary of Clinical Efficacy
163
Study Treatment Arm No. Enrolled/ Completed
Primary Efficacy Variable Secondary Efficacy Endpoints
Other CommentsPlasma HIV-1
RNA (copies/mL)
Plasma HIV-1 RNA (log10 copies/mL)
<50 Baseline Change from Baseline
n/N (%) n Median[Range]
n Median[Range]
EFV/TDF/FTC once daily
422 Rand.
363 Ongoing
338/419 (81) 419 4.696 (2.48, 6.35)
343 -3.093 (-4.66, 0.35)
Median time to viral suppression (<50 c/mL) and 95% CI: 84 days [83,84]Adjusted change from Baseline in CD4+ cell count at Week 48 and SE:208 (9.31)
Hazard ratio of time to viral suppression (<50c/mL) and 95% CI: 2.32 [2.00, 2.68] p<0.0001 significant at the pre-specified threshold of 0.01.Adjusted difference in change from Baseline in CD4+ cell count at Week 48 and 95% CI: 58.9 [33.4, 84.4] p<0.001 significant at the pre-specified threshold of 0.04.
ING111762d
DTG 50 mg once daily + BR
360 Rand.
305 Ongoing
281/354 (79) 354 4.171 (1.59,6.79)
325 -2.436 (-4.67,0.81)
Proportion of Subjects with Detectable Virus that has Treatment EmergentGenotypic or Phenotypic Evidence of INI Resistance by Week 24: 2/354 (0.6%)
In a predetermined analysis, there was a statistically significant difference in favor of DTG for the proportion of subjects who failed therapy with evidence of INI Resistance through Week 24.
Adjusted treatment difference and 95% CI: -2.3% (-4.2, -0.4); p=0.016.

CONFIDENTIALModule 2.7.3 Summary of Clinical Efficacy
164
Study Treatment Arm No. Enrolled/ Completed
Primary Efficacy Variable Secondary Efficacy Endpoints
Other CommentsPlasma HIV-1
RNA (copies/mL)
Plasma HIV-1 RNA (log10 copies/mL)
<50 Baseline Change from Baseline
n/N (%) n Median[Range]
n Median[Range]
RAL 400 mg BID + BR
364 Rand.
189 Ongoing
252/361 (70) 361 4.209 (1.59, 6.54)
326 -2.274 (-4.98,1.68)
Proportion of Subjects with Detectable Virus that has Treatment EmergentGenotypic or Phenotypic Evidence of INI Resistance by Week 24: 10/361 (2.8%)
ING112574DTG 50 mg Twice Daily
183 Rand.
155 Ongoing
114a
72 /114 (63) (Week 24)
183 4.384 (1.59, 7.37)
182 -1.502(-3.37, 0.44)
(Day 8)
Day 8 response by Baselinecharacteristics showed that the Q148+2 and Q148+1 mutations reduced the Day 8 response by 0.72 (p<0.0001) and 0.48 log10 c/mL(p=0.0014) respectively, vs. that of the Y143. A doubling of the FC to DTG reduced the response by 0.18 log10 c/mL (p<0.001) while for each additional IN mutation, the response was lowered by 0.09 log10 c/mL (p=0.0054). At Week 24, the Q148+2, doubling DTG FC, and increasing number of pre-specified mutations also significantly reduced Week 24 response.
The mean reduction at Day 8 was statistically significant versus the hypothesis of no change from Baseline. Suppression to <50 c/mL was rapid with 52% (59/114) already achieving this level of suppression by Week 4. At Week 24, 63% (72/114) of subjects had<50 c/mL by the Snapshot (MSDF) algorithm.

CONFIDENTIALModule 2.7.3 Summary of Clinical Efficacy
165
Study Treatment Arm No. Enrolled/ Completed
Primary Efficacy Variable Secondary Efficacy Endpoints
Other CommentsPlasma HIV-1
RNA (copies/mL)
Plasma HIV-1 RNA (log10 copies/mL)
<50 Baseline Change from Baseline
n/N (%) n Median[Range]
n Median[Range]
Supportive Efficacy StudiesING112961
Cohort I DTG 50 mg once daily
27 Enrolled13 Ongoing
9/27 (33)(Week 48)
27 4.475(2.64-6.06)
27 -1.614(-2.54, -0.13)
(Day 11)
The proportion of subjects with Day 11 plasma HIV-1 RNA <400 c/mL or at least 0.7 log10 c/mL below their Baseline value is the primary endpoint: Cohort II (96%) compared to Cohort I (78%). Adjusted mean difference of CFB in plasma HIV-1 RNA at Day 11 was -0.32 log10 c/mL (Cohort II-I).
More subjects in Cohort II compared to Cohort I achieved the primary endpoint at Day 11. In the linear regression model at Day 11, accounting for differences in Baseline factors, the mean change from Baseline in plasma HIV-1 RNA was significantly greater for Cohort II. At Week 48 a much greater proportion of subjects in Cohort II achieved <50 c/mL plasma HIV-1 RNA than Cohort I: 71% vs 33% by TLOVR for Cohort II and I, respectively.
Cohort II DTG 50 mg Twice Daily
24 Enrolled19 Ongoing
17/24 (71)(Week 48)
24 4.263(3.32-5.84)
24 -1.833(-2.92, -0.46)
(Day 11)
ING112276DTG 10 mg once daily + 2 NRTI
53 Rand.47 Ongoing
51/53 (96) 53 4.496(3.25, 6.17)
52 -2.190(-4.48, -1.56)
% <50 c/mL atWeek 24: 96%Week 48: 91%Week 96: 79%
Comparable efficacy and tolerability across all DTG doses; 50 mg selected for study in Phase III.
DTG 25 mg once daily + 2 NRTI
51 Rand.45 Ongoing
47/51 (92) 51 4.487(2.91, 5.59)
49 -2.235(-3.90, -1.22)
% <50 c/mL:Week 24: 90%Week 48: 88%Week 96: 78%

CONFIDENTIALModule 2.7.3 Summary of Clinical Efficacy
166
Study Treatment Arm No. Enrolled/ Completed
Primary Efficacy Variable Secondary Efficacy Endpoints
Other CommentsPlasma HIV-1
RNA (copies/mL)
Plasma HIV-1 RNA (log10 copies/mL)
<50 Baseline Change from Baseline
n/N (%) n Median[Range]
n Median[Range]
DTG 50 mg once daily + 2 NRTI
51 Rand. 46 Ongoing
46/51 (90) 51 4.640(2.93, 5.99)
49 -2.357(-4.30, -1.24)
% <50 c/mL:Week 24: 92%Week 48: 90%Week 96: 88%
EFV 600 mg once daily
50 Rand.
41 Completed
30/60 (60)
50 4.462(3.21, 6.00)
45 -2.109(-3.84, -1.30)
% <50 c/mL:Week 24: 78%Week 48: 82%Week 96: 72%
ING111521DTG 2 mg once daily
9 Rand.9Completed
1/9 (11)b 9 4.40 (0.27)c 9 -1.51 (0.58)c Median (range) change from Baseline to in CD4+ Cell (cells/mm3): 15 (-286, 222)
A clear dose response relationship was noted.
DTG 10 mg once daily
9 Rand.9Completed
0/9 9 4.58 (0.39) 9 -2.03 (0.49) Median (range) change from Baseline to in CD4+ Cell (cells/mm3) :106 (-39, 142)
DTG 50 mg once daily
10 Rand.10Completed
4/10 (40) 10 4.47 (0.42) 10 -2.46 (0.35) Median (range) change from Baseline to in CD4+ Cell (cells/mm3): 64 (-155, 523)
a. 114 subjects had the chance to complete the Week 24 visit.b. 10 day monotherapy, secondary endpointc. Mean (SD)d. The definitive primary endpoint for ING111762 is Week 48. The results presented here are for Week 24, which are secondary endpoints for the study. This Week 24 interim
analysis was done to support regulatory submissions globally.
![MedDev-brochure 2.7.1 R4 HI-RES 1 [復元]Title MedDev-brochure 2.7.1 R4 HI-RES_1 [復元] Created Date 9/20/2016 4:07:26 PM](https://img.pdfslide.us/doc/110x75/5fe75391ee6f5210730c1532/meddev-brochure-271-r4-hi-res-1-f-title-meddev-brochure-271-r4-hi-res1.jpg)