Embed Size (px)
Citation preview
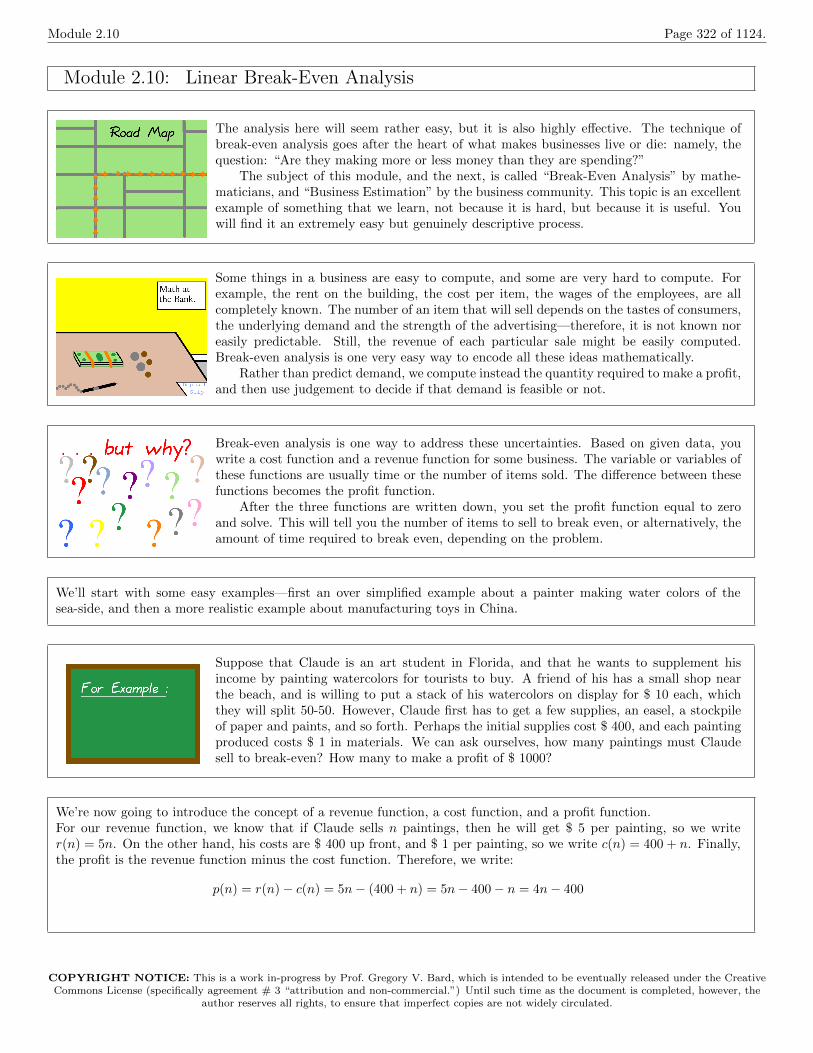
Module 2.10 Page 322 of 1124.
Module 2.10: Linear Break-Even Analysis
The analysis here will seem rather easy, but it is also highly e↵ective. The technique ofbreak-even analysis goes after the heart of what makes businesses live or die: namely, thequestion: “Are they making more or less money than they are spending?”
The subject of this module, and the next, is called “Break-Even Analysis” by mathe-maticians, and “Business Estimation” by the business community. This topic is an excellentexample of something that we learn, not because it is hard, but because it is useful. Youwill find it an extremely easy but genuinely descriptive process.
Some things in a business are easy to compute, and some are very hard to compute. Forexample, the rent on the building, the cost per item, the wages of the employees, are allcompletely known. The number of an item that will sell depends on the tastes of consumers,the underlying demand and the strength of the advertising—therefore, it is not known noreasily predictable. Still, the revenue of each particular sale might be easily computed.Break-even analysis is one very easy way to encode all these ideas mathematically.
Rather than predict demand, we compute instead the quantity required to make a profit,and then use judgement to decide if that demand is feasible or not.
Break-even analysis is one way to address these uncertainties. Based on given data, youwrite a cost function and a revenue function for some business. The variable or variables ofthese functions are usually time or the number of items sold. The di↵erence between thesefunctions becomes the profit function.
After the three functions are written down, you set the profit function equal to zeroand solve. This will tell you the number of items to sell to break even, or alternatively, theamount of time required to break even, depending on the problem.
We’ll start with some easy examples—first an over simplified example about a painter making water colors of thesea-side, and then a more realistic example about manufacturing toys in China.
Suppose that Claude is an art student in Florida, and that he wants to supplement hisincome by painting watercolors for tourists to buy. A friend of his has a small shop nearthe beach, and is willing to put a stack of his watercolors on display for $ 10 each, whichthey will split 50-50. However, Claude first has to get a few supplies, an easel, a stockpileof paper and paints, and so forth. Perhaps the initial supplies cost $ 400, and each paintingproduced costs $ 1 in materials. We can ask ourselves, how many paintings must Claudesell to break-even? How many to make a profit of $ 1000?
We’re now going to introduce the concept of a revenue function, a cost function, and a profit function.For our revenue function, we know that if Claude sells n paintings, then he will get $ 5 per painting, so we writer(n) = 5n. On the other hand, his costs are $ 400 up front, and $ 1 per painting, so we write c(n) = 400 + n. Finally,the profit is the revenue function minus the cost function. Therefore, we write:
p(n) = r(n)� c(n) = 5n� (400 + n) = 5n� 400� n = 4n� 400
COPYRIGHT NOTICE: This is a work in-progress by Prof. Gregory V. Bard, which is intended to be eventually released under the Creative
Commons License (specifically agreement # 3 “attribution and non-commercial.”) Until such time as the document is completed, however, the
author reserves all rights, to ensure that imperfect copies are not widely circulated.
Module 2.10 Page 323 of 1124.
# 2-10-1
Continuing with the problem of the last two boxes, now we can use those three functionsto answer Claude’s questions about his business venture. The term “breaking-even” meansthat the costs and revenues are equally matched, or that the profit is zero. Claude wantsto know how many paintings he must sell to break even, and how many to make a $ 1000profit.
• For what value of n does p(n) = 0? [Answer: n = 100.]
• For what value of n does p(n) = 1000? [Answer: n = 350.]
• If the shopkeeper thinks that Claude can expect to sell 10 paintings per day, then howmany days will it take for Claude to see $ 1000 profit? [Answer: 35 days.]
# 2-10-2
To better numerically understand what the revenue function, cost function, and profit func-tion are saying in the previous example, we should evaluate them at the break-even pointof n = 100.
• What is the total revenue at the break-even point of 100 paintings? In other words,what is r(100)? [Answer: r(100) = 5(100) = 500 dollars.]
• What is the total cost at the break-even point of 100 paintings? In other words, whatis c(100)? [Answer: c(100) = 400 + 100 = 500 dollars.]
• What is the profit at the break-even point of 100 paintings? In other words, what isp(100)? [Answer: p(100) = 4(100)� 400 = 0 dollars.]
A Pause for Reflection. . .It is informative to learn, in the previous box, that Claude must bring in $ 500 of revenueto break even. Much more important for Claude is the fact that he must sell 100 paintingsto break even. If he thinks that this will be easy, then the business plan is a good one;however, if he things this will be hard or unlikely, then the business plan should be rejected.What we are computing is a number that helps him make the decision of whether or not aparticular business plan will be a disaster for him, or a success for him.
Once we learn this, however, we are not surprised to learn that at this point of 100paintings and a total revenue of $ 500, that our total costs are $ 500 also. The very meaningof the words “break-even point” are that the revenue and the costs are equal. The incomeand the outgo of money are in balance, and the business is neither gaining nor losing money.
Likewise, we are not surprised at all to learn that the profit function returns 0 forn = 100 paintings. Indeed, the way we found the break-even point was to set the profitfunction to zero.
This pattern of a revenue function, a cost function, and a profit function forms the heart of“break-even analysis” or “business estimation” and will continue throughout this moduleand the next one, too.
Admittedly, Claude’s business plan for selling his paintings was very easy mathemati-cally. All the answers to the questions pertaining to Claude’s business are fairly straight-forward to compute. It wasn’t necessary for us to precisely note down the revenue function,the cost function, and the profit function.
While we did not (strictly speaking) need these tools to solve the above problem, thebusiness situations we analyze later in this module and in the following module are goingto slowly escalate in detail, realism, and complexity. Our three functions will be extremelyhandy tools when we tackle harder problems later.
COPYRIGHT NOTICE: This is a work in-progress by Prof. Gregory V. Bard, which is intended to be eventually released under the Creative
Commons License (specifically agreement # 3 “attribution and non-commercial.”) Until such time as the document is completed, however, the
author reserves all rights, to ensure that imperfect copies are not widely circulated.
Module 2.10 Page 324 of 1124.
Now let’s consider a realistic example: Perhaps some mechanical engineer has an idea for anew toy design. A manufacturer in China agrees to make the toys for an initial $ 400,000 toretool the factory, and then $ 2.99 per toy. The selling price of the toy is $ 9.99. The costof moving each toy from China to the distributor in the USA is 70 cents per toy. In termsof selling n toys, what is the cost function, the revenue function, and the profit function?How many toys must be sold to break even? To make a profit of $ 100,000?
The revenue function is clearly r(n) = 9.99n. The costs come in three types, start-upcost, manufacturing cost, and shipping cost:
c(n) = 400, 000.00| {z }
start-up
+ 2.99n| {z }
manuf.
+ 0.70n| {z }
shipping
= 400, 000.00 + 3.69n
Therefore the profit function is
p(n) = r(n)� c(n) = 9.99n� 400, 000.00� 3.69n = 6.30n� 400, 000
but to find the break-even point, we must set this function equal to zero.
Continuing with the previous box, we will now set p(n) = 0.
0 = p(n)
0 = 6.30n� 400, 000
400, 000 = 6.30n
63, 492.0 · · · = n
Then the break-even is at 63, 492 toys. Likewise, to find the point where the profit would be 100k, we just set the profitfunction to 100,000.
100, 000 = p(n)
100, 000 = 6.30n� 400, 000
500, 000 = 6.30n
79, 365.0 · · · = n
Therefore, 100k profit will occur at 79,365 toys.
One of the best ways to check this kind of calculation is to plug in various values, andsee what the cost, revenue, and profit functions come out to. Nearby input values shouldproduce nearby output values.# Toys Revenue Cost Revenue – Cost Profit Match?60,000 599,400.00 621,400.00 -22,000.00 -22,000.00 Yes!65,000 649,350.00 639,850.00 9500.00 9500.00 Yes!78,000 779,220.00 687,820.00 91,400.00 91,400.00 Yes!80,000 799,200.00 695,200.00 104,000.00 104,000.00 Yes!Note that the “revenue – cost” entry was calculated by taking the di↵erence between
the second and third column, whereas the “profit” entry was taken by plugging the numberof toys into the profit function. This is yet another check on our work.
COPYRIGHT NOTICE: This is a work in-progress by Prof. Gregory V. Bard, which is intended to be eventually released under the Creative
Commons License (specifically agreement # 3 “attribution and non-commercial.”) Until such time as the document is completed, however, the
author reserves all rights, to ensure that imperfect copies are not widely circulated.
Module 2.10 Page 325 of 1124.
Over the last few boxes, we discussed a problem related to manufacturing toys, and used theterm “retool the factory.” On the floor of every factory will be found many large machinesof various types, most of which are machine tools. These are devices which can create partsout of metal or plastic, often rapidly and with a high-degree of precision. If you’re curious,you can look up articles on the internet about the various types: lathes, grinders, bandsaws, jig saws, milling machines, boring machines, planing machines, extruders, injectionmolds, and others. Other machines found on the factory floor that are not machine toolsmight be related to quality control, climate control, or painting the product.
Most of these devices are computer-controlled, and can be reprogrammed without muche↵ort. If they are not computer-controlled, then they are human-controlled, often by a“master machinist” who is highly skilled. So when going from one product to anotherproduct, very rarely must one buy all new machinery. This is good because those machinetools can be phenomenally expensive. However, the cutting/stamping/grinding/milling bitsof those machines often are di↵erent for each product. So when converting a manufacturingline from one product to another, often new attachments need to be bought for severalmachines, or even one new machine might need to be purchased. Also, the programmerswho do the reprogramming are often highly paid.
Overall, this process of converting from one product to another is called “retooling thefactory” and can be significantly expensive.
A friend of yours is considering selling political buttons for some important cause. To make100 buttons costs $ 124.99, and to make 200 costs $ 214.99. Assume the cost function islinear. If the buttons are sold for $ 2.50 each, what is the revenue function? The costfunction? The profit function? How many must be sold to break even? To have a profit of$ 100?
Assuming that the cost of the buttons is a linear function (and we are told that it is),we can use the techniques of “Building a Linear Model” (see Page 289) to make a costfunction. We will have x be the number of co↵ee mugs and y be the price.
We will have to use the point-slope formula to find the line that connects the point(100, 124.99) to the point (200, 214.99). First, the slope is given by
214.99� 124.99
200� 100=
90.00
100= 0.9
and then the line is given by either
y � 214.99 = 0.9(x� 200) y � 124.99 = 0.9(x� 100)y � 214.99 = 0.9x� 180 y � 124.99 = 0.9x� 90
y = 0.9x+ 34.99 y = 0.9x+ 34.99
Note that you need only take one road or the other, not both. Either way, we canconclude that the cost function is
c(n) = 0.9n+ 34.99
and observe that the slope of this line represents the cost per button.The revenue function, happily, is much simpler as r(n) = 2.50n. Therefore the profit
function isp(n) = 2.50n� 0.9n� 34.99 = 1.6n� 34.99
Then, by finding the n such that p(n) = 0, we end up with a break-even point of21.8687 · · · or 22 buttons. Similarly, we’d find out how many buttons to sell for $ 100 profitby solving p(n) = 100 for n. In that case, we’d have 84.3687 · · · or 85 buttons.
COPYRIGHT NOTICE: This is a work in-progress by Prof. Gregory V. Bard, which is intended to be eventually released under the Creative
Commons License (specifically agreement # 3 “attribution and non-commercial.”) Until such time as the document is completed, however, the
author reserves all rights, to ensure that imperfect copies are not widely circulated.
Module 2.10 Page 326 of 1124.
# 2-10-3
Continuing with the previous box, how many political buttons must your friend sell toearn. . .
• . . . a profit of $ 250? [Answer: 178.118 · · · or 179 buttons.]
• . . . a profit of $ 500? [Answer: 334.368 · · · or 335 buttons.]
• . . . a profit of $ 750? [Answer: 490.618 · · · or 491 buttons.]
• . . . a profit of $ 1000? [Answer: 646.868 · · · or 647 buttons.]
It is very easy to check our work in a problem like that in the previous box. We just haveto plug a few values into the profit function.
p(446) = (1.6)(490)� 34.99 = $ 749.01
p(447) = (1.6)(491)� 34.99 = $ 750.61
p(603) = (1.6)(646)� 34.99 = $ 998.61
p(604) = (1.6)(647)� 34.99 = $ 1000.21
We can see from the previous box that the first time we cross the $ 750 profit goal wouldbe when we sell the 491st button. That’s why we round up to 491. It would not be okayto say 490, because when we sell the 490th button, we have (just slightly) less than $ 750.Likewise, we can see that until the 646th button, our profit is not yet $ 1000. For thisreason, we rounded the 646.868 · · · up to 647 and not down to 646, because we were $ 1.39short of the goal with 646 buttons.
I have been told by several friends in the business world that extra precision can make abusiness proposal “sound funny.” Therefore the proposal seems less trustworthy as a result.
To better understand the analysis of the last few boxes, Ithink it is helpful to look at graph of these functions. Inour first graph, shown at the left of this box, you can seethe revenue function (in green) and the cost function (inred). As you can see, the graphs are lines because theseare linear functions.
The graph clearly shows that the lines cross. The pointwhere they cross is some n-value where the cost and therevenue functions output the same number. This meansthat r(n) = c(n), and since the revenue and costs are equal,this is the break-even point. The break-even point on thegraph is clearly between 20 and 24, and that’s reassuringbecause we computed it to be n = 21.8687 · · · .
For all n below the break-even point, we can see thatthe red function is on top, and so that means our costsexceed our revenue. For this region, 0 < n < 21.8687 · · · ,the business is losing money. Likewise, for all n above thebreak-even point, we can see that the green function is ontop, and that means our revenues exceed our costs. Forthis region, n > 21.8687 · · · the business is profitable.
COPYRIGHT NOTICE: This is a work in-progress by Prof. Gregory V. Bard, which is intended to be eventually released under the Creative
Commons License (specifically agreement # 3 “attribution and non-commercial.”) Until such time as the document is completed, however, the
author reserves all rights, to ensure that imperfect copies are not widely circulated.

Module 2.10 Page 327 of 1124.
In this graph, we have the profit function (in black) and aprofit goal of $ 100 in blue. The profit goal is a constantfunction of y = 100, and so the graph is a horizontal line,like any constant function.
The point where the black line (or profit function)crosses the x-axis shows you where p(n) = 0. Again, thisis the break-even point, which we computed to be n =21.8687 · · · . We are reassured that it appears in the rightplace, between 20 and 25. As we saw in the previous box,the region to the left of the break-even point is a loss—hereshown by the profit function being negative; likewise, theregion to the right of the break-even point is a profit—hereshown by the profit function being positive.
The point where the black and blue lines cross wouldbe where p(n) = 100, or our goal of $ 100 profit. Asyou can see, this occurs between 80 and 85, as we wouldexpect it to. We calculated that point to be 84.3687 · · · ,so naturally the point is just to the left of the y = 85 line.
The graphs in the previous two boxes were made with Sage, the free open-source computer algebra package. If you arecurious, the commands in Sage to produce the previous graphs are
plot( 2.50*x, 0, 100, color=’green’, gridlines=’minor’) + plot(0.9*x + 34.99, 0, 100, color=’red’, gridlines=’minor’)
for the first graph and then
plot( 1.6*x - 34.99, 0, 100, gridlines=’minor’, color=’black’) + plot( 100, 0, 100, gridlines=’minor’, color=’blue’)
will produce the second graph.
Plotting graphs in Sage was first introduced on Page 1031. If you already know how toplot graphs in Sage, then you will see two new techniques here. The first is the use of thecolor=’green’ and related commands for red, blue, and black. As you might guess, thiswill change the color of the line that has been drawn.
The other new technique is that the plots have been added together. There is one properplot command that would produce the revenue function in green (in the first example)followed by a plus sign, and then another proper plot command that would produce thecost function in red. The plus sign commands Sage to draw the two plots superimposedupon each other. This is how you can show two functions plotted together, super-imposedupon the same graph.
COPYRIGHT NOTICE: This is a work in-progress by Prof. Gregory V. Bard, which is intended to be eventually released under the Creative
Commons License (specifically agreement # 3 “attribution and non-commercial.”) Until such time as the document is completed, however, the
author reserves all rights, to ensure that imperfect copies are not widely circulated.

Module 2.10 Page 328 of 1124.
Suppose your friend has a favorite band, and wishes to follow it around selling silk-screenedT-shirts. She made 70 T-shirts last year for $ 375. Each additional would have cost her$ 4. Assuming the cost of T-shirt production is linear, what is her cost function? What isher revenue function, if they sell for $ 10 each? What is the profit function? How manyT-shirts must sell to break even? How many must sell per week to make an annual profitof $ 1000 or higher?
Let n be the number of shirts. The words “assuming the cost of T-shirt production islinear” means that the cost function, c(n), will look like c(n) = mn+ b, and we need to findthe missing numbers, m and b. The words “each additional would have cost her $ 4” meansthat the slope is 4—after all, the slope of a linear function is its rate of increase. If onewanted to be formal, one could say four dollars per T-shirt, because dollars are the units onthe y-axis, and T-shirts are the unit on the x-axis. Then we can use point-slope form withthe given datum that 70 shirts cost $ 375. (See the module “Building a Linear Model” onPage 289 if the point-slope form is unfamiliar.) In any case, we get a point-slope form of
y � 375 = 4(x� 70)
which we will rewrite as a function, obtaining
c(n) = 4(n� 70) + 375 = 4n� 280 + 375 = 4n+ 95
The revenue function is much easier and we will continue with it in the next box.
Continuing with the previous box, since each T-shirt sells for $ 10, the revenue function is r(n) = 10n. Then, we havethe profit function:
p(n) = r(n)� c(n) = 10n� 4n� 95 = 6n� 95
Next, we were asked about the break-even point, and the number required to make the profit $ 1000 or higher. Wecan do these simultaneously by setting profit to $ 0 and to $ 1000.
1000 = p(n) 0 = p(n)1000 = 6n� 95 0 = 6n� 951095 = 6n 95 = 6n182.5 = n 15.833 = n
Therefore to earn a profit of $ 1000 or more, your friend needs to sell 183 or more, while to merely break even, shemust sell 16.
We were given the costs for 70 T-shirts, and so we will check 70 and 71, to make sure thatwe get what we expect. We’ll also check one above and below our 182.5 value, to ensure thatthey straddle $ 1000 profit, and likewise at 15 and 16, to ensure they straddle $ 0 profit.# T-Shirts Revenue Cost Revenue - Cost Profit Match
15 150.00 155.00 -5.00 -5.00 Yes!16 160.00 159.00 1.00 1.00 Yes!70 700.00 375.00 325.00 325.00 Yes!71 710.00 379.00 331.00 331.00 Yes!182 1820.00 823.00 997.00 997.00 Yes!183 1830.00 827.00 1003.00 1003.00 Yes!
COPYRIGHT NOTICE: This is a work in-progress by Prof. Gregory V. Bard, which is intended to be eventually released under the Creative
Commons License (specifically agreement # 3 “attribution and non-commercial.”) Until such time as the document is completed, however, the
author reserves all rights, to ensure that imperfect copies are not widely circulated.

Module 2.10 Page 329 of 1124.
Now we’re going to graph those three functions—the rev-enue, cost, and profit functions of the previous example.On the left, you have the cost function (in red) and rev-enue function (in green). The profit function can be foundin the next box.
First, we can see that the break-even point is where thecost function and revenue function cross. (That’s becauseyou break even when the revenues exactly equal the costs.)Second, l we can refer to the region where the green lineis on top is the profitable region, and the region with thered line on top is the loss region.
Of course, a business person should prefer the regionwhere the revenue function (in green) is on top, so thatthere is more revenue than cost.
This graph shows the profit function in black, along withthe goal profit of $ 1000 in blue.
First, observe that the break-even point is preciselywhere the profit function crosses the x-axis. (That’s be-cause you break even when the profit is equal to zero.) Infact, the break-even point and the $ 1000-profit point bothappear to be in their correct locations, in the sense thattheir coordinates seem to match the answers which we justcalculated.
Just to be clear, by “$ 1000-profit point,” I mean thesituation where the profit equals $ 1000. This means thatit is the point where the profit function crosses the hori-zontal line representing $ 1000—the goal, represented bythe blue line in the graph.
# 2-10-4
The “Future Business Women of America” club (or FBWA) wants to sell some promotionalco↵ee mugs to get some operating capital. Purchased in su�cient bulk, these are cheap—infact, one can get 80 for $ 350 and one can get 200 for $ 650. Assuming that the cost ofmugs is a linear function (and that’s a large assumption), we can again use the techniquesof “Building a Linear Model” (see Page 289) to make a cost function. We will have x bethe number of co↵ee mugs and y be the price.
• What is the slope of the line that connects the point (80, 350) and the point (200, 650)?[Answer: 2.5.]
• What is the equation of the line through those two points, in y = mx + b form?[Answer: y = 2.5x+ 150.]
• How would be write this as a cost function? [Answer: c(n) = 2.5n+ 150.]
COPYRIGHT NOTICE: This is a work in-progress by Prof. Gregory V. Bard, which is intended to be eventually released under the Creative
Commons License (specifically agreement # 3 “attribution and non-commercial.”) Until such time as the document is completed, however, the
author reserves all rights, to ensure that imperfect copies are not widely circulated.
Module 2.10 Page 330 of 1124.
# 2-10-5
Continuing with the previous box, we now have a cost function. If the FBWA sells thesemugs for $ 10 each,
• What is the profit function? [Answer: p(n) = 7.5n� 150.]
• How many must they sell to break even? [Answer: 20 mugs.]
• How many to make $ 300 in profit? [Answer: 60 mugs.]
• What is the revenue at the break-even point? [Answer: $ 200.]
Economists are accustomed to using certain symbols for many of the topics of this module.For example, p is price, ⇧ is profit, ⇡ marginal profit, L is labor, K is capital, TC totalcost, TR total revenue, and so forth. However, we do not use that notation here.
Of course, the symbol ⇡ in math has a special meaning
⇡ = 3.141592653589793 · · ·
which is no doubt familiar to you, as it occurs in the formulas for the area and the cir-cumference of a circle. Likewise, ⇧ has a specific meaning that comes up only rarely, whendiscussing the product (multiplication) of a large number or infinite number of items.
More over, we do not typically use two letters to represent one variable in mathematics.For example, TR looks to a mathematician to be the product of two variables, T times R.
Di↵erent subjects use symbols di↵erently, and this can be phenomenally frustrating. In this module, I choose to usethe symbols in use among mathematicians—not the symbols in use among economists—because it will match the restof the book and therefore be less confusing for you, my readership and students.
A good friend of yours, Chuck, wants to make a small business copying keys. The machinefor copying keys costs $ 3500. The metal key blanks for 500 keys cost $ 120. One can charge$ 3.99 per copied key. If Chuck sets up a booth in front of the local hardware superstore,the fee for the space is $ 100 per day. Assume that Chuck wants to work 6 days per week.
He tells you that he’s done a business plan, and since he knows that you are takingthis course, he asks you to look it over. In the financial part of the business plan, he has6 ⇥ 52 ⇥ $ 100 = $ 31, 200 for the space fee, and then $ 120/500 = $ 0.24 per key formaterials. Then he writes
c(n) = 3500|{z}
machine
+31, 200| {z }
space
+120
500n
| {z }
blanks
c(n) = 34, 700 + 0.24n
COPYRIGHT NOTICE: This is a work in-progress by Prof. Gregory V. Bard, which is intended to be eventually released under the Creative
Commons License (specifically agreement # 3 “attribution and non-commercial.”) Until such time as the document is completed, however, the
author reserves all rights, to ensure that imperfect copies are not widely circulated.
Module 2.10 Page 331 of 1124.
Continuing on with the previous problem, because the revenue function is r(n) = 3.99n, the profit function becomes
p(n) = r(n)� c(n)
p(n) = 3.99n� 34, 700� 0.24n
p(n) = 3.75n� 34, 700
Now it is time to set the profit function equal to zero to find the break-even point. He has:
0 = 3.75n� 34, 700
34, 700 = 3.75n
9253.33 = n
and that comes to 9253.33/52 = 177.948 · · · keys per week, and finally 29.6581 · · · keys per workday (for six days perweek.) Not easy, but definitely possible.
A Pause for Reflection. . .Is there something wrong with the analysis in the previous box? Has something beenforgotten? Before going onto the next box, reread the previous and see if you can find theoversight.
The problem is that Chuck forgot his own wages! If he just barely breaks even, how is hegoing to eat and pay his rent? We’re going to redo the problem now. If Chuck wants $ 160per day for his wages, how many keys must be sold in the first year to break even?
The trick to making this painless is to convert everything to the same time scale. I’mgoing to use years. The wages come to 160 ⇥ 6 ⇥ 52 = 49, 920 per year. The fee for spaceis 100⇥ 6⇥ 52 = 31, 200 per year. Dividing $ 120 by 500 keys we obtain 24 cents per key.Remembering the machine, we get a total cost function of
c(n) = 3500|{z}
machine
+49, 920| {z }
wages
+31, 200| {z }
space
+0.24n| {z }
blanks
= 84, 620 + 0.24n
and since the revenue is $ 3.99 per key, the revenue function is
r(n) = 3.99n
and therefore the profit function is
p(n) = 3.99n� 0.24n� 72, 100 = 3.75n� 84, 620
Setting that equal to zero and solving for n yields n = 22, 565.33 keys per year, whichis 433.948 · · · per week or 72.3247 · · · per workday. This does not seem so easy to achieveanymore! It is quite hard to believe that he will find more than 72 people, everyday, whowant to copy a key.
COPYRIGHT NOTICE: This is a work in-progress by Prof. Gregory V. Bard, which is intended to be eventually released under the Creative
Commons License (specifically agreement # 3 “attribution and non-commercial.”) Until such time as the document is completed, however, the
author reserves all rights, to ensure that imperfect copies are not widely circulated.
Module 2.10 Page 332 of 1124.
People often forget their own wages in these sorts of calculations! That can be very dan-gerous, as running a small business takes up an enormous number of hours per week, andso precludes a “day job” to pay the rent with. Many times this forgotten factor of salarieswill turn what otherwise looks like an assured-profit venture into a very dubious ventureindeed.
# 2-10-6
A friend of yours is considering opening a taco stand at a busy intersection near CentralPark. Your friend will sell the tacos for $ 2.50. The renting of the cart plus the permits is$ 100 per day. The supplies for 100 tacos costs about $ 80.
• What is the cost-per-day function if you sell n tacos? [Answer: c(n) = 100 + 0.8n.]
• What is the revenue-per-day function? [Answer: r(n) = 2.5n.]
• The profit-per-day function? [Answer: p(n) = 1.7n� 100.]
• How many do you need to break even each day? [Answer: n = 58.8235 · · · or 59tacos.]
• How many do you need to sell to make $ 100 profit per day? [Answer: n = 117.647 · · ·or 118 tacos.]
# 2-10-7
Now correct the problem from the previous box to reflect the wages required. Suppose yourfriend would be happy with $ 39,000 per year—that’s $ 750 per week, or if he/she works 6days per week, then $ 125 per day. Given this new cost,
• What is the new cost function? [Answer: c(n) = 225 + 0.8n.]
• What is the new profit function? [Answer: r(n) = 1.7n� 225.]
• Find the break even point each day. [Answer: n = 132.352 · · · , or 133 tacos.]
Continuing with the taco business of the last two boxes, we might ask ourselves, “Whatabout toppings?”
There are lots of possible toppings for a taco, and our formulas would be too complex ifwe tried to model all of them. The way businesses make issues of this sort work out is thatthey ensure that the “basic model” causes them to make at least a modest profit, and thenany of the “side business” will just generate pure profit. For example, at the Taco Stand,drinks and toppings would be the “side business.” At a hotel, the “side business” wouldbe room service, pay-per-view movies, and other chargeable amenities. For a computermanufacturer, it would be the peripheral devices, warranties, and the repair department.
COPYRIGHT NOTICE: This is a work in-progress by Prof. Gregory V. Bard, which is intended to be eventually released under the Creative
Commons License (specifically agreement # 3 “attribution and non-commercial.”) Until such time as the document is completed, however, the
author reserves all rights, to ensure that imperfect copies are not widely circulated.
Module 2.10 Page 333 of 1124.
The term per-unit cost is used to describe the total cost of things like the material for thekey blanks in the previous example, or shipping, and anything else which a business mustpay for each and every item. The term “per-day cost” means exactly what it sounds like,the total of any costs that are a fixed amount for each day (or each week, month, or yearafter adjustment). Finally, the term “fixed costs” are the total costs to start-up a business,including any one-time or long-term equipment purchases.
# 2-10-8
Suppose you are called to do some analysis for an unprofitable sand mine. They currentsell 133 tons per day, and anticipate that this is unlikely to change. (They supply a near-byglass factory, and that’s about it.) Currently, they sell the sand for $ 200 per ton—but thiscan fluctuate. Their current process requires $ 160 per ton (most of it labor) but a newautomated system is available that can cut the labor by half, costing $ 80 per ton. Theautomated equipment, however, costs two million dollars.
• What is their current revenue per day? [Answer: $ 26,600 per day.]
• After t days, what is their revenue r(t) going to be? [Answer: r(t) = 26, 600t.]
• Using the current methods, what is their cost per day? [Answer: $ 21,280 per day.]
• Using the new machinery, what would their cost per day become?[Answer: $ 10,640 per day.]
• After t days, what is their cost c(t), with the old equipment, going to be?[Answer: c(t) = 21, 280t.]
• After t days, what is their cost c(t), with the new equipment, going to be?[Answer: c(t) = 2, 000, 000 + 10, 640t.]
# 2-10-9
Continuing on with the previous problem, now we are equipped to analyze profits.
• What is the profit p(t) with the old equipment? [Answer: p(t) = 5320t.]
• What is the profit p(t) with the new equipment? [Answer: p(t) = 15, 960t�2, 000, 000.]
• What is the profit or loss after one quarter (90 days), with the new equipment?[Answer: $ -563,600, which is actually a loss.]
• What is the profit or loss after one quarter (90 days), with the old equipment?[Answer: $ 478,800.]
• Using a 360-day year, what is the profit after one year, with the new equipment?[Answer: $ 3,745,600.]
• Using a 360-day year, what is the profit after one year, with the old equipment?[Answer: $ 1,915,200.]
• Using a 360-day year, what is the profit after five years, with the new equipment?[Answer: $ 26,728,000.]
• Using a 360-day year, what is the profit after five years, with the old equipment?[Answer: $ 9,576,000.]
COPYRIGHT NOTICE: This is a work in-progress by Prof. Gregory V. Bard, which is intended to be eventually released under the Creative
Commons License (specifically agreement # 3 “attribution and non-commercial.”) Until such time as the document is completed, however, the
author reserves all rights, to ensure that imperfect copies are not widely circulated.
Module 2.10 Page 334 of 1124.
# 2-10-10
Continuing on with the problem of the previous two boxes, the di↵erence in “profit five-yearsout” makes management decide that the new equipment should be purchased. However,there are two problems. The first issue is that since the sand mine is not currently veryprofitable, they are not sure if they can get a medium-term loan from the bank, and so theyneed to know how long it will be until they break even on the new purchase. The secondissue is that the price of sand does fluctuate, and $ 200 per ton is only an estimate. Theycan probably secure a 180-day loan, but they want a picture of how much risk they reallyare taking. Assume the new equipment is purchased:
• If the price of sand remains $ 200, how long is it until the sand mine breaks even?[Answer: 125.313· · · days, or 126 days.]
• If the price of sand falls to $ 185 per ton, what will the revenue be per day? [Answer:$ 24,605 per day.]
• What would the revenue function become? [Answer: r(t) = 24, 605t. ]
• Of course the cost function is unchanged, but what will the profit function become?[Answer: p(t) = 13, 965t� 2, 000, 000.]
• How long until the sand mine breaks even, at that price? [Answer: 143.215 days.]
# 2-10-11
However, the price of sand might fall even further, to $ 170 per ton.
• If the price of sand falls to $ 170 per ton, what would the revenue be per day? [Answer:$ 22,610 per day.]
• What would the profit function become? [Answer: p(t) = 2, 000, 000� 11, 970t.]
• How long until the sand mine breaks even, at this price? [Answer: 167.084 days.]
• If this is as low as management imagines the price of sand can fall in the next year, isit safe to get a 180-day loan for the two million dollars? [Answer: Yes.]
This is realistic because if the price falls just a bit further, and the sand mine is a few tensof thousands of dollars short of repaying their short-term loan from one bank, then theycould get a 30-day loan from a di↵erent bank.
However, one still has to perform calculations of this kind because a large shortfallwould be very hard to cover on short notice. That’s because the sand mine would have toturn over quarterly earnings reports and other financial statements that would reveal theinternal circumstances of their business. If there was a large gap, the numbers would lookvery poor, the 30-day loan would be denied. That, in turn, would probably result in the180-day loan being declared in default, and the sand mine being repossessed.
Note, in this subject we tend to say per-unit cost and not per-item cost because of a di↵erencebetween purchases that are integer-valued versus real-valued. That might be confusing, butconsider this: while one can buy 2 cars, 3 cars, or 4 cars, one cannot buy a fraction of acar; however, one can buy 2.6 tons of sand, 3.51 tons, 4.678 tons, 591.382 tons, or any otherreal number up to the point of accuracy that can easily be measured. The phrase per-itemcost could be used for the cars but not for the sand—whereas the phrase per-unit cost canbe used either. A unit is either “a car” or “a ton of sand,” as in the previous example.
COPYRIGHT NOTICE: This is a work in-progress by Prof. Gregory V. Bard, which is intended to be eventually released under the Creative
Commons License (specifically agreement # 3 “attribution and non-commercial.”) Until such time as the document is completed, however, the
author reserves all rights, to ensure that imperfect copies are not widely circulated.
Module 2.10 Page 335 of 1124.
Did you notice a pattern in the revenue, cost, and profit functions in the previous fewproblems? All of them can be written in the form
f(n) = k1
n+ k2
where the ks are constants. This means that the functions are linear functions.Any function that cannot be written in the f(n) = k
1
n+k2
form is a non-linear function.The vast majority of functions are non-linear.
The linear model is over-simplified and is not descriptive of business as it actually occurs.Many of the major concepts you will study in economics courses: the point of diminishingreturns, elasticity of demand, economies of scale, the law of limited supply, just to name afew, are important pieces of any business model. However, each of those economic conceptsthat I just listed are totally and entirely absent from every linear model.
That is why it is imperative that we study non-linear revenue, cost, and profit functions.In fact, we will do so, on Page 952.
An editor at an academic publishing house decides to resign and form his own publishinghouse, publishing novels. The cost of proofreading and copy-editing a small novel is $ 750.Each novel costs about $ 3 per copy to print. The novels will sell for $ 11.99 per copy, andthe author gets a 20% royalty, the bookstore gets 40%, and the publishing house gets theremaining 40%. For a single novel, what is the cost function if it sells n copies? What is therevenue function? What is the profit function? How many copies must sell for the novel tobreak even? Just to be clear, we are performing the analysis from the point of view of thepublishing house.
The new publishing house will get 0.4 ⇥ 11.99 = 4.796 per book. Then the revenuefunction is r(n) = 4.796n. The cost function is
c(n) = 750 + 3n
The profit function isp(n) = 1.796n� 750
and so we set 1.796n� 750 = 0 to learn that each book must sell
n =750
1.796= 417.594 · · ·
or around 418 copies to recoup the cost of production.
There is an interesting point in the previous example. I think most financial professionalswould not round $ 4.796 to $ 4.80. The reason is that the figure is really not “4.796 dollars,”but rather a rate of “4.796 dollars per book.” Thus, 1000 books would be $ 4796.00, andsometimes one even sees quoted “4796.00 for each 1000 books, pro rata” or somethingsimilar.
The “pro rata” means pro-rated, and is the opposite of saying “each 1000 books orfraction thereof.” (This distinction was described on Page 151, in the module “Workingwith Functions.” Please feel free to flip back there if you have forgotten.)
Therefore, we do not round, because rounding up goes against our stated policy ofrounding all dollar amounts to the penny. Sometimes one must use judgement in rounding.Also, on an exam, the expectations for rounding should be clearly stated.
COPYRIGHT NOTICE: This is a work in-progress by Prof. Gregory V. Bard, which is intended to be eventually released under the Creative
Commons License (specifically agreement # 3 “attribution and non-commercial.”) Until such time as the document is completed, however, the
author reserves all rights, to ensure that imperfect copies are not widely circulated.

Module 2.10 Page 336 of 1124.
# 2-10-12
A gaming company estimates that it takes $ 180,000 in programmer wages to make a newcomputer game. The costs of making the box, the disk and shipping it to stores is $ 12each. If the game sells for $ 39.95 per copy, and g copies of the game are made. . .
• What is the cost function? [Answer: c(g) = 180, 000 + 12g.]
• What is the revenue function? [Answer: r(g) = 39.95g.]
• What is the profit function? [Answer: p(g) = 27.95g � 180, 000.]
• How many must be sold to break even? [Answer: g = 6440.07 · · · or 6441 copies.]
A question that prospective business-owners can ask is “when will my revenues exceeddouble my costs?” Let’s examine that for the gaming company of the previous box.
We’re going set r(g) > 2c(g) so that the revenue will be more than double the costs.
39.95g > 2(180, 000 + 12g)
39.95g > 360, 000 + 24g
15.95g > 360, 000
g > 360, 000/15.95
g > 22, 570.53 · · ·
As you can see, after and including the sale of the 22,571st game, the benchmark of“revenue exceeding double the costs” will be achieved. You could also say “after the sale ofthe 22,570th game,” which means the same thing.
# 2-10-13
Consider the problem of Claude’s paintings, which was the opening example of the module,from Page 322.
• When will the revenue exceed double the costs?[Answer: when Claude sells more than 266 paintings.]
• When will the revenue exceed triple the costs?[Answer: when Claude sells more than 600 paintings.]
To check our work from the previous box, we can plug in the value of n that we found, bothinto r(n) and into c(n). To save space, we’ll just check n = 600 here. Let’s see what we get
r(600) = 5(600) = 3000
c(600) = 400 + 600 = 1000
Indeed, 3⇥ 1000 = 3000 and so we can be sure that we have obtained the right answer.
COPYRIGHT NOTICE: This is a work in-progress by Prof. Gregory V. Bard, which is intended to be eventually released under the Creative
Commons License (specifically agreement # 3 “attribution and non-commercial.”) Until such time as the document is completed, however, the
author reserves all rights, to ensure that imperfect copies are not widely circulated.
Module 2.10 Page 337 of 1124.
# 2-10-14
Let’s calculate these benchmarks for the manufacture of toys in China, from Page 324.
• When will the revenue exceed double the costs? [Answer: after 306,513 toys are sold.]
• Something very strange is going to happen when you try to solve for the value of nwhere the revenue will exceed triple the costs. Solve it algebraically, and tell me whatinequality you end up with. [Answer: n < �1, 111, 111.]
A Pause for Reflection. . .Why do the inequalities in the previous box tell us that n < �1, 111, 111? Can we sell anegative number of toys?
Surely, there is no way to sell a negative number of toys. Therefore, it will never be thecase that n < �1, 111, 111. This means that it will never be the case that the revenue isequal to triple the costs.
One way to check this is to plug in “ten billion” for n, both into r(n) and c(n). Since theworld’s population is roughly seven billion people, then we know that we’ll never achievean n equal to ten billion, no matter how popular the product becomes.
r(10, 000, 000, 000) = 9.99(10, 000, 000, 000) = 99, 900, 000, 000
c(10, 000, 000, 000) = 400, 000 + 3.69(10, 000, 000, 000) = 36, 900, 400, 000
Triple the cost of 36.9004 billion would be 110.7012 billion, and we did not achieve thatrevenue goal. Because of the fact that even with this insanely large value of n (which cannever be achieved) we see that the revenue is still not more than triple the costs, we canmore easily trust our algebra. It is now easier to accept the conclusion that the revenue willnever exceed triple the costs.
# 2-10-15
Consider now the problem about the FBWA that appear on Page 329.
• For what values of n will the revenue be more than double the costs? [Answer: n > 60.]
• For what values of n will the revenue be more than triple the costs? [Answer: n > 180.]
# 2-10-16
Let’s reconsider the academic publisher from Page 335, who decided to open a new publish-ing house.
• At what value of n does r(n) = 3c(n)? [Answer: n = �535.204 · · · .]
• At what point will the revenue be triple the costs? [Answer: never.]
• At what value of n does r(n) = 2c(n)? [Answer: n = �1245.84 · · · .]
• At what point will the revenue be double the costs? [Answer: never.]
COPYRIGHT NOTICE: This is a work in-progress by Prof. Gregory V. Bard, which is intended to be eventually released under the Creative
Commons License (specifically agreement # 3 “attribution and non-commercial.”) Until such time as the document is completed, however, the
author reserves all rights, to ensure that imperfect copies are not widely circulated.

Module 2.10 Page 338 of 1124.
The results of the previous box might be surprising, but actually, this can happen in reallife. The book industry, as analyzed in the previous box, doesn’t have the revenue and coststructure to ever create a situation where the revenue is double the costs.
In our particular case, the additional revenue for each book is $ 4.796, and the additionalcost for each book is $ 3. That means that the additional profit for each book sold is $ 1.796,and that isn’t much.
This concept of “the profit for each additional book sold” is called the marginal profitby economists and the profit margin by business people. In later coursework, this conceptwill be tremendously important. We’ll explore it ourselves very shortly, on Page 343.
# 2-10-17
A minor manufacturer of laptops has a factory that costs $ 12,000 per day to operate andeach laptop is composed of $ 600 worth of parts and other materials. The laptops are soldto the distribution company for $ 850 each. (Presumably, these are then sold to retailersfor a bit over a thousand each, and on to the consumer for closer to two thousand.) Let nbe the number of laptops manufactured.
• What is the (per day) revenue function? [Answer: r(n) = 850n.]
• What is the (per day) cost function? [Answer: c(n) = 600n+ 12, 000.]
• What is the (per day) profit function? [Answer: p(n) = 250n� 12, 000.]
• What is the (per day) break-even point? [Answer: n = 48.]
• How many laptops must be made to earn $ 2000 per day profit? [Answer: n = 56laptops.]
# 2-10-18
Now we’re going to continue the problem in the previous box. We’re going to consider anexample of the kind of decision that senior management would have to make.
Perhaps manufacturing a few parts locally would cut the cost of the parts and othermaterials by 20%, but would require much more labor. In fact, the increased labor woulddouble the daily operating costs of the factory. How would this a↵ect the business, in termsof its cost and profit functions?
• What would the new cost function look like? [Answer: c(n) = 480n+ 24, 000.]
• What would the new profit function look like? [Answer: p(n) = 370n� 24, 000.]
• What is the new break-even point? [Answer: n = 64.8648 · · · , thus 65 laptops.]
• How many laptops must sell to make $ 2000 per day profit? [Answer: n = 70.270,thus 71 laptops.]
Re-examining the problem of the last two boxes, let us imagine that that the CEO has setthe profit goal of this factory to be $ 2000 per day (or more.) With this in mind, we canconclude that if the company can sell more than 70.270 · · · laptops per day, or more than(365)(70.270 · · · ) = 25, 648.5 · · · laptops per year, then the decision should be to switch,and manufacture some of the parts locally. However, if 25,648 or fewer laptops are sold peryear, then it would not be a good decision to switch to local manufacturing, because thefactory would fall short of the CEO’s expectations.
COPYRIGHT NOTICE: This is a work in-progress by Prof. Gregory V. Bard, which is intended to be eventually released under the Creative
Commons License (specifically agreement # 3 “attribution and non-commercial.”) Until such time as the document is completed, however, the
author reserves all rights, to ensure that imperfect copies are not widely circulated.
Module 2.10 Page 339 of 1124.
Your friend Chip, a computer engineer, has been making metal detectors for a side-businessfrom time to time, selling them on the internet for treasure hunters and archeologists. Hegets a large order, via email, of 25 for $ 100,000. So far, he’s had success selling them for$ 4995 each, so he decides to take the large order and make metal detectors his main sourceof income. Each metal detector requires $ 1000 of parts, and he must pay a 2% auction feeplus $ 10 listing fee for each sale—but not on the large order because it came via email.He wants to take home $ 1100 per week, and to produce metal detectors more quickly herequires an automated soldering system for the circuit boards and other equipment costing$ 35,000. He wishes to break even in half a year. How many metal detectors should he sellin that window of time (including the large order) to do that?
This is our first non-trivial revenue function. Chip has contracted 25 metal detectors for$ 100,000, but each additional will sell for $ 4995. First, we should correct for the auctionfee and the listing fee, and get 4995⇥ 0.98� 10 = 4885.10. Next, his revenue is now goingto be
r(n) = 100, 000 + 4885.10(n� 25)
where n � 25 is the number sold that are not in the large auction. We should probablymultiply that out. When we do, we have
r(n) = 100, 000 + 4885.10n� 122, 127.5 = 4885.10n� 22, 127.50
We now will continue the calculation of the previous box. First, we have the cost function of
c(n) = 1000n| {z }
parts
+(1100)(52)
2| {z }
salary
+ 35, 000| {z }
aut. sol. sys.
which can be simplified toc(n) = 1000n+ 28, 600 + 35, 000 = 1000n+ 63, 600
This gives a profit function of
p(n) = (4885.10n� 22, 127.50)� (1000n+ 63, 600)
= 4885.10n� 22, 127.50� 1000n� 63, 600
= 3885.10n� 85, 727.50
Therefore, the break even point is given by setting p(n) = 0 = 3885.10n� 85, 727.50, which we solve to obtain
n =85, 727.50
3885.10= 22.0657 · · ·
This tells us that Chip needs to sell 22 or 23 metal detectors to break even—but he already has an order for 25.Therefore, Chip can be confident as he tenders his resignation from his job and orders the new supplies and equipment.
COPYRIGHT NOTICE: This is a work in-progress by Prof. Gregory V. Bard, which is intended to be eventually released under the Creative
Commons License (specifically agreement # 3 “attribution and non-commercial.”) Until such time as the document is completed, however, the
author reserves all rights, to ensure that imperfect copies are not widely circulated.

Module 2.10 Page 340 of 1124.
# 2-10-19
How many metal detectors must Chip sell to earn. . .
• . . . a profit of $ 50,000? [Answer: 34.9353 · · · or 35 detectors.]
• . . . a profit of $ 100,000? [Answer: 47.8050 · · · or 48 detectors.]
# 2-10-20
Now we’re going to repeat the previous example (in detail) but suppose that pressure fromthe competition has forced the sales price down from $ 4995 to $ 3995. The large orderremains $ 100,000. Then how does that change
• The revenue function?
[Answer: Now r(n) = 3905.10(n� 25) + 100, 000 = 3905.10n+ 2372.50.]
• The cost function? [Answer: No change, it remains c(n) = 1000n+ 63, 600.]
• The profit function? [Answer: p(n) = 2905.10n� 61, 227.50. ]
• The break-even point? [Answer: Now n = 21.0758 · · · , or 22 detectors.]
• How many metal detectors must Chip sell to achieve a profit of 100,000?[Answer: n = 55.4980 · · · or 56 detectors.]
Let’s compare the graphs of the cost and revenue functionsof the previous box, before and after the price change.Again, revenue is green and cost is red. The steeper graphis “before” with a selling price of $ 4995, and the less steepgraph is “after” with a selling price of $ 3995.
The places where the red line crosses a green line repre-sent the break even points. As we can see, the two break-even points are fairly close together. That means thatthe di�culty of breaking-even didn’t change much. Thatmatches our computations from the previous boxes.
COPYRIGHT NOTICE: This is a work in-progress by Prof. Gregory V. Bard, which is intended to be eventually released under the Creative
Commons License (specifically agreement # 3 “attribution and non-commercial.”) Until such time as the document is completed, however, the
author reserves all rights, to ensure that imperfect copies are not widely circulated.
Module 2.10 Page 341 of 1124.
In the above graph, the y-axis is labelled in the form 2e4, 4e4, and so on. This is a computer’sway of indicating 2⇥ 104 or likewise 4⇥ 104. It is an example of scientific notation. If youneed to review scientific notation, see Page 922.
Also, it is important not to mistake 2e4 with 2e4. There is a very special number
e = 2.718281828 · · ·
which is very important in financial mathematics. You will learn more about it on Page 458.In any case,
2e4 = 2(2.71828 · · · )4 = 2(54.5981 · · · ) = 109.19629999252712 6= 104
and so it is very important to understand the di↵erence.Last but not least, I recommend that you never write 2e4 on an exam, when you intend
to write 2⇥ 104, because of this ambiguity.
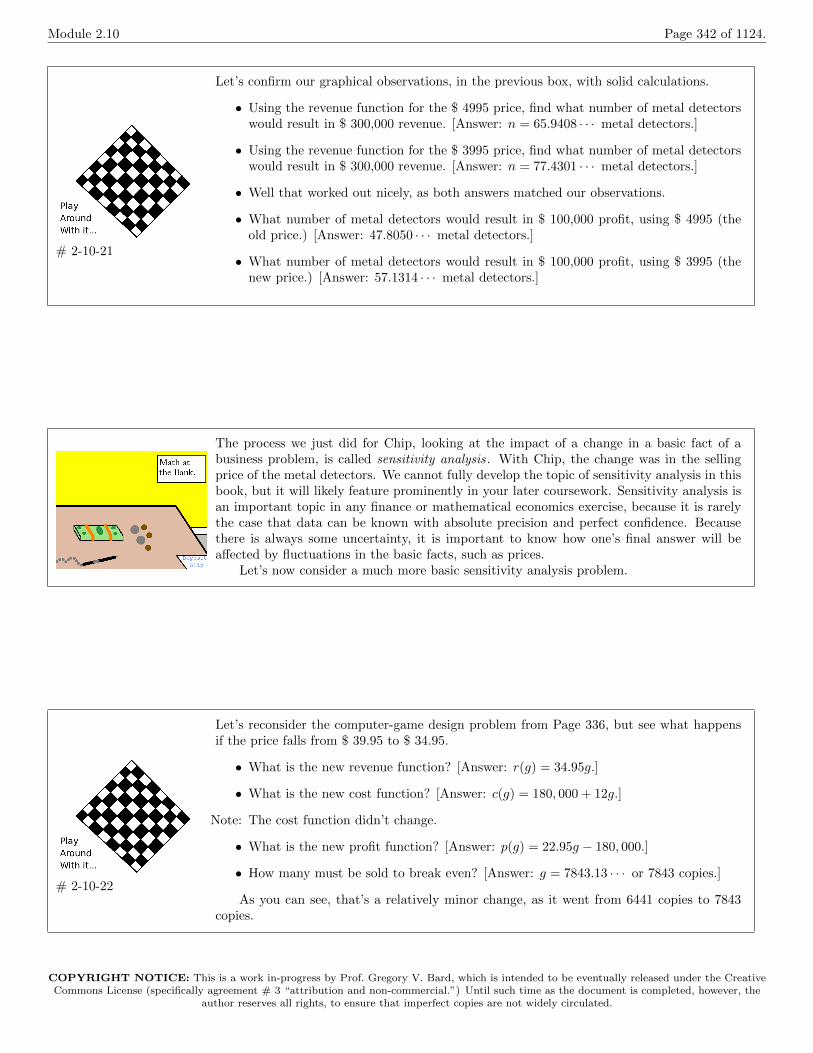
Now let’s consider the graphs of the profit functions. Theyare in black, and again the steeper slope represents the$ 4995 price while the less steep slope represents the $ 3995price. A goal of 100k of profit is represented by a horizontalblue line.
Just like in the actual problem itself, we see that thebreak-even point did not move much—the points wherethe two profit functions cross the x-axis are di↵erent, butonly slightly. However, the goal profit of $ 100,000 didmove a lot. The point we are talking about would bewhere the profit lines cross $ 100,000. As you can see,this changes from more than 40 metal detectors to over 50metal detectors.
Now let’s consider a revenue goal of $ 300,000. That 300kgoal is represented by a blue horizontal line. The revenuewill equal 300k when the green-line (the revenue function)hits the blue line (representing the goal.) Just as before,the steeper line represents the $ 4995 sales price, and theless steep line represents the $ 3995 sales price.
By the left graph, we learn that Chip must sell some-what over 60 metal detectors to obtain $ 300k in revenue,as that would be where the revenue line (green) crossesthe $ 300k mark. By the right graph, we learn that justunder 80 metal detectors must be sold in order to obtainthat same $ 300k in revenue. So here, we see that Chipwill have to work significantly harder to earn that 300k inrevenue.
COPYRIGHT NOTICE: This is a work in-progress by Prof. Gregory V. Bard, which is intended to be eventually released under the Creative
Commons License (specifically agreement # 3 “attribution and non-commercial.”) Until such time as the document is completed, however, the
author reserves all rights, to ensure that imperfect copies are not widely circulated.
Module 2.10 Page 342 of 1124.
# 2-10-21
Let’s confirm our graphical observations, in the previous box, with solid calculations.
• Using the revenue function for the $ 4995 price, find what number of metal detectorswould result in $ 300,000 revenue. [Answer: n = 65.9408 · · · metal detectors.]
• Using the revenue function for the $ 3995 price, find what number of metal detectorswould result in $ 300,000 revenue. [Answer: n = 77.4301 · · · metal detectors.]
• Well that worked out nicely, as both answers matched our observations.
• What number of metal detectors would result in $ 100,000 profit, using $ 4995 (theold price.) [Answer: 47.8050 · · · metal detectors.]
• What number of metal detectors would result in $ 100,000 profit, using $ 3995 (thenew price.) [Answer: 57.1314 · · · metal detectors.]
The process we just did for Chip, looking at the impact of a change in a basic fact of abusiness problem, is called sensitivity analysis. With Chip, the change was in the sellingprice of the metal detectors. We cannot fully develop the topic of sensitivity analysis in thisbook, but it will likely feature prominently in your later coursework. Sensitivity analysis isan important topic in any finance or mathematical economics exercise, because it is rarelythe case that data can be known with absolute precision and perfect confidence. Becausethere is always some uncertainty, it is important to know how one’s final answer will bea↵ected by fluctuations in the basic facts, such as prices.
Let’s now consider a much more basic sensitivity analysis problem.
# 2-10-22
Let’s reconsider the computer-game design problem from Page 336, but see what happensif the price falls from $ 39.95 to $ 34.95.
• What is the new revenue function? [Answer: r(g) = 34.95g.]
• What is the new cost function? [Answer: c(g) = 180, 000 + 12g.]
Note: The cost function didn’t change.
• What is the new profit function? [Answer: p(g) = 22.95g � 180, 000.]
• How many must be sold to break even? [Answer: g = 7843.13 · · · or 7843 copies.]
As you can see, that’s a relatively minor change, as it went from 6441 copies to 7843copies.
COPYRIGHT NOTICE: This is a work in-progress by Prof. Gregory V. Bard, which is intended to be eventually released under the Creative
Commons License (specifically agreement # 3 “attribution and non-commercial.”) Until such time as the document is completed, however, the
author reserves all rights, to ensure that imperfect copies are not widely circulated.
Module 2.10 Page 343 of 1124.
# 2-10-23
Consider the problem about manufacturing toys in China, from Page 324. There, we founda profit function of
p(n) = 6.30n� 400, 000
and let’s consider a few specific values of p for the moment. (This might seem pointless,but we’ll discuss “why” in the next box.)
• What is p(100, 000)? [Answer: $ 230,000.00.]
• What is p(100, 001)? [Answer: $ 230,006.30.]
• What is p(100, 002)? [Answer: $ 230,012.60.]
• What is p(100, 003)? [Answer: $ 230,018.90.]
• What is p(100, 004)? [Answer: $ 230,025.20.]
As you can see by examining the final answers from the previous box, every time we increasethe n by one, the profit goes up by $ 6.30. This dollar value, the profit garnered by makingone more item, is called the marginal profit . In our case, we see the 6.30 figure plainly whenwe look at p(n), as it is the slope of that linear function. For non-linear profit functions, itturns out that this will not be as easy to determine, but instead, it will require calculus. Ineconomics, the concept of the marginal profit comes up in many important topics.
# 2-10-24
A charity is hoping to raise a lot of money for a dinner, that will be $ 150 per plate. Hotel Xwants $ 4000 for the ballroom plus $ 100 per seat for the food, and Hotel Y wants $ 8000 forits ballroom but only $ 70 per seat. The entertainer will require a fee of $ 12,000, and about$ 2000 is needed for advertising. How many people are needed to break-even for Hotel X?Let n denote the number of guests.
• What is the revenue function, regardless of the hotel? [Answer: r(n) = 150n.]
• What is the cost function for Hotel X? [Answer: c(n) = 18, 000 + 100n.]
• What is the profit function for Hotel X? [Answer: p(n) = 50n� 18, 000.]
• What is the break even point with Hotel X? [Answer: n = 360 guests.]
# 2-10-25
Continuing with the previous box, how many people are needed to break-even for Hotel Y?
• What is the cost function for Hotel Y? [Answer: c(n) = 22, 000 + 70n.]
• What is the profit function for Hotel Y? [Answer: p(n) = 80n� 22, 000.]
• What is the break even point with Hotel Y? [Answer: n = 275 guests.]
COPYRIGHT NOTICE: This is a work in-progress by Prof. Gregory V. Bard, which is intended to be eventually released under the Creative
Commons License (specifically agreement # 3 “attribution and non-commercial.”) Until such time as the document is completed, however, the
author reserves all rights, to ensure that imperfect copies are not widely circulated.

Module 2.10 Page 344 of 1124.
A Pause for Reflection. . .The previous problem is very interesting because Hotel Y will break even with a smallernumber of guests, but each additional guest brings in $ 80 with Hotel Y, versus $ 50 withHotel X. So no matter how many guests there are, Hotel Y is always more profitable thanHotel X. This does not bode well for Hotel X’s future (but that is not the worry of the eventplanner of a charity event.)
It is by looking at the slope of the linear profit function that we saw the marginal profit,and realized that it is better to choose Hotel Y regardless of the situation.
Now we’re going to rewrite several of the profit functions from this module into x-intercept-slope form. That means instead of the slope-intercept form
p(n) = k1
n+ k2
where k1
was the slope and k2
was the y-intercept, we will write instead
p(n) = k1
(n� k3
)
where k1
is still the slope, but now k3
is the x-intercept.You can see that this is true, because if you plug n = k
3
into the second formula of thisbox, you would get the following:
p(k3
) = k1
(k3
� k3
) = k1
(0) = 0
In any case, it seems like this rewriting might appear to be a strange thing to do, butactually there is a good reason that we would want to do it. Be patient, and the reason willbe revealed to you in only a few moments.
First, I’m going to do this in a very symbolic way, to show you that the process involved ison solid algebraic ground. Most students would use a shortcut, which I’ll show you in thenext box.
p(n) = 6.30n� 400, 000
p(n) = 6.30n�✓
6.30
6.30
◆
400, 000
p(n) = 6.30n� 6.30
✓
400, 000
6.30
◆
p(n) = 6.30n� 6.30 (63, 492.0 · · · )p(n) = (6.30) (n� 63, 492.0 · · · )
COPYRIGHT NOTICE: This is a work in-progress by Prof. Gregory V. Bard, which is intended to be eventually released under the Creative
Commons License (specifically agreement # 3 “attribution and non-commercial.”) Until such time as the document is completed, however, the
author reserves all rights, to ensure that imperfect copies are not widely circulated.
Module 2.10 Page 345 of 1124.
Suppose we are asked to rewrite the profit function
p(n) = 6.30n� 400, 000
in x-intercept-slope form.First, most students would take their calculator and compute
400, 000÷ 6.30 = 63, 492.0 · · ·
and then knowing that(6.30)(63, 492.0 · · · ) = 400, 000
they could plug this into the profit function to obtain
p(n) = 6.30n� (6.30)(63, 492.0 · · · )
which can easily be factored into
p(n) = 6.30(n� 63, 492.0 · · · )
Now in the previous two boxes, we have seen how we can rewrite the profit function intox-intercept-slope form instead of slope-intercept form. However, we did not say why wewould want to rewrite the profit function into this form.
Does the number 63, 492.0 · · · look familiar? We saw that number many pages ago, soit is understandable if you do not recognize it. This number is the break-even point of thatproblem!
The reason that some micro-economists prefer the x-intercept-slope form when writingthe profit function is that it not only displays the marginal profit in front of your face likethe usual point-intercept form, but it also displays the break-even point as well. Therefore,when you read the profit function, you see two very important numbers which immediatelytell you a great deal about the business plan.
In this case, p(n) = 6.30(n�63, 492.0 · · · ) tells us that we must sell 63,492 toys in orderto break even, and then we make a profit of $ 6.30 per toy for each additional toy. This isa very economics-centered way of writing the profit function.
# 2-10-26
On Page 322, we saw that the profit function for Claude’s seaside watercolor business wasp(n) = 4n� 400.
• What is the profit function in x-intercept-slope form? [Answer: p(n) = 4(n� 100).]
• What is the marginal profit? [Answer: 4 dollars per painting.]
• What is the break-even point? [Answer: 100 paintings.]
COPYRIGHT NOTICE: This is a work in-progress by Prof. Gregory V. Bard, which is intended to be eventually released under the Creative
Commons License (specifically agreement # 3 “attribution and non-commercial.”) Until such time as the document is completed, however, the
author reserves all rights, to ensure that imperfect copies are not widely circulated.

Module 2.10 Page 346 of 1124.
# 2-10-27
On Page 328, we saw that the profit function for the silk-screened T-shirt business wasp(n) = 6n� 95.
• What is the profit function in x-intercept-slope form? [Answer: p(n) = 6(n�15.833).]
• What is the marginal profit? [Answer: 6 dollars per T-shirt.]
• What is the break-even point? [Answer: 15.833 or 16 T-shirts.]
# 2-10-28
On Page 329, we saw that the profit function for the FBWA mug-selling fundraiser wasp(n) = 7.5n� 150.
• What is the profit function in x-intercept-slope form? [Answer: p(n) = 7.5(n� 20).]
• What is the marginal profit? [Answer: 7.5 dollars per mug.]
• What is the break-even point? [Answer: 20 mugs.]
# 2-10-29
We saw on Page 336 and Page 342, that the computer-game design firm had profit functionsof p(g) = 27.95g�180, 000 and p(g) = 22.95g�180, 000, when the price changed from $ 39.95to $ 34.95. With this in mind, let’s rewrite the profit functions in x-intercept-slope form.
• What is the old profit function? [Answer: p(n) = 27.95(n� 6440.07 · · · ).]
• What is the new profit function? [Answer: p(n) = 22.95(n� 7843.13 · · · ).]
Naturally, it is reassuring that the marginal profit went from $ 27.95 to $ 22.95, adecrease of $ 5, because the sales price changed by $ 5 and the costs did not change. It isalso reassuring that we can see the two break-even points that we calculated earlier, exact,and in the right spot.
A Pause for Reflection. . .Our first module of “Break-Even Analysis” has come to an end. Before we continue withthe skills inventory, I’d like to take a moment to stress how this tool, sometimes called“Business Estimation,” circumvents a potentially damaging snare.
The demand for a product is notoriously hard to predict. We do not know how manypaintings Claude will sell, how many metal detectors Chip will sell, or how many toys theChinese toy manufacturer will sell. Other facts are concretely known, such as basic costs orthe sales price to be charged. What break-even analysis does, is that it permits the businessperson to avoid predicting demand.
Instead of predicting demand, we find instead that number of items which we must sellin order to break even, or to reach certain specific goals. Then a human can look at valueof n and decide “is this going to be easy?” or “is this going to be too risky?”
COPYRIGHT NOTICE: This is a work in-progress by Prof. Gregory V. Bard, which is intended to be eventually released under the Creative
Commons License (specifically agreement # 3 “attribution and non-commercial.”) Until such time as the document is completed, however, the
author reserves all rights, to ensure that imperfect copies are not widely circulated.