Embed Size (px)
Citation preview
D.G. Bonett (8/2018)
1
Module 2
Reliability
In the physical sciences, attributes such as weight or length can be measured with great
accuracy. When measuring the weight of a specific object, two laboratory-grade scales
will yield virtually the same value, two different technicians using the same scale will
obtain virtually the same value, or the same technician using the same scale will obtain
virtually the same value on two different occasions. In the behavioral sciences,
psychological attributes cannot be measured with high accuracy. For instance, if a
particular student takes two forms of the ACT, or takes the same form on two different
occasions, or if two expert graders both evaluate the student’s written essay, the two
scores could be substantially different.
The inconsistency of the two ACT scores described above is the result of measurement error
(and possibly a practice effect in the case of using the same form on two occasions).
Measurement error for person i is the difference between that person’s true score and an
observed measurement (𝑦𝑖) of the true score for that person. The reliability of a
measurement in some specified population can be defined as the squared Pearson
correlation between the true scores and the observed scores. The reliability of a
measurement is a value between 0 and 1 with a value of 1 indicating that there is no
measurement error in the observed scores.
The true scores for psychological attributes are unknown and it would seem that this
precludes the possibility of assessing the reliability of a psychological measurement.
However, a fundamental theorem of psychometrics shows that squared Pearson
correlation between the observed scores and true scores is equal to an intraclass
correlation between two observed scores (𝑦1 and 𝑦2) of the same attribute. An intraclass
correlation is defined as 𝜌𝑦 = 𝜎12/𝜎2 where 𝜎12 is the covariance between the two
measurements and 𝜎2 is the common variance of the two measurements (i.e., the
variances of 𝑦1 and 𝑦2 are assumed to be equal).
Unlike the Pearson correlation, which is defined as a measure of association between two
variables, the intraclass correlation can describe the association among r ≥ 2 variables

D.G. Bonett (8/2018)
2
that have equal population variances. For r > 2, the intraclass correlation is defined as the
average of all r(r – 1)/2 covariances divided by the average of all r variances.
The reliability of a measurement can be assessed in several different ways. If people are
measured using r different but equally reliable forms of a test or questionnaire, the
intraclass correlation of the r measurements is the alternate form reliability of a single form.
If people are measured using the same form on r = 2 occasions, the intraclass correlation
between the two measurements is a test-retest reliability of a single measurement. If people
are measured by r different but equally reliable raters, the intraclass correlation of the r
measurements is an inter-rater reliability of a single rater. If people are measured on r
equally reliable quantitative items of a questionnaire, the intraclass correlation of the r
items is an internal consistency reliability of a single item. If the r items of a questionnaire
can be split into two similar subscales with r/2 items, the intraclass correlation between
the two subscales is a split-half reliability of a single subscale.
The reliability of a sum (or average) of r equally reliable measurements is
𝜌𝑟 = 𝑟𝜌𝑦
1 + (𝑟 − 1)𝜌𝑦 (2.1)
where 𝜌𝑦 is the reliability of a single measurement. Equation 2.1 is the Spearman-Brown
formula. The following table illustrates how the reliability of a sum (or average) is related
to the number of r equally reliable measurements each having reliability 𝜌𝑦. Note that
when the reliability of a single measurement (𝜌𝑦) is small, increasing the number of
measures has a more dramatic effect on the reliability of the sum (or average) than if the
reliability of a single measurement is large.
𝜌𝑦 .3 .3 .3 .7 .7 .7 .9 .9 .9
____________________________________________________________________
r 2 5 10 2 5 10 2 5 10
𝜌𝑟 .46 .68 .81 .82 .92 .96 .95 .98 .99
Assuming the r measurements are equally reliable, the Spearman-Brown formula can be
rearranged to express 𝜌𝑦 as a function of 𝜌𝑟 as show below.
𝜌𝑦 = 𝜌𝑟
𝑟 − (𝑟 − 1)𝜌𝑟 (2.2)
Equation 2.2 can be used to determine the reliability of a single measurement when the
reliability of a sum (or average) or r measurements is known.

D.G. Bonett (8/2018)
3
Effect of Measurement Error on Statistical Methods
Suppose 𝑦𝑖 and 𝑥𝑖 are measurements of two different attributes with true scores 𝑇𝑦𝑖 and
𝑇𝑥𝑖 and reliabilities 𝜌𝑦 and 𝜌𝑥, respectively. The measurement error in 𝑦𝑖 is 𝜖𝑦𝑖 = 𝑦𝑖 – 𝑇𝑦𝑖
and the measurement error in 𝑥𝑖 is 𝜖𝑥𝑖 = 𝑥𝑖 − 𝑇𝑥𝑖. Measurement error has deleterious
effects on statistical methods. It can be shown that the Pearson correlation between y and
x is equal to 𝜌𝑇𝑥𝑇𝑦 √𝜌𝑦𝜌𝑥 where 𝜌𝑇𝑥𝑇𝑦 is the correlation between the true scores. Thus, the
Pearson correlation between observed scores is attenuated (moved closer to zero) by the
measurement errors in 𝑦𝑖 and 𝑥𝑖. The slope coefficient in a simple linear regression model
is attenuated by measurement error in 𝑥𝑖 but is unaffected by measurement error in 𝑦𝑖.
Specifically, if 𝛽1 is the slope of the line relating x to y, then the slope relating 𝑇𝑥 to 𝑇𝑦 is
𝛽1/√𝜌𝑥. Measurement error in 𝑦𝑖 will increase the width of the confidence interval for 𝛽1
and decrease the power of the statistical test of H0: 𝛽1 = 0.
The effect of predictor variable measurement error is complicated in a statistical model
with multiple predictor variables (e.g., GLM, MGLM, SUR, path model). The predictor
variable measurement error can increase or decrease slope coefficients and standardized
slope coefficients depending on the correlations among the predictor variables and the
amount of measurement error in each predictor variable. Even if only one predictor
variable in a GLM is measured with error, all of the slope coefficients and standardized
slope coefficients will be affected. Response variable measurement error in a GLM,
MGLM, or SUR model will increase the standard errors of the slope estimates which
results in wider confidence intervals and less powerful tests for the population slope
coefficients. If multiple measurements (from multiple forms, multiple raters, multiple
occasions, multiple items) of each predictor variable and each response can be obtained,
then the statistical methods described in Module 1 can be used to examine the relations
among the true score predictor variables and the true score response variables as will be
explained in Module 3.
Measurement Models
A measurement model for variable 𝑦1 has the same form as a simple linear regression
model: 𝑦1𝑖 = 𝛽0 + 𝜆1𝜂𝑖 + 𝜖1𝑖 where 𝑦1𝑖 is the observed measurement for a randomly
sampled participant, 𝜂𝑖 is an unobservable (or latent) common factor score for participant i,
𝜖𝑖 is an unobservable unique factor score for participant i, and 𝜆1 is a slope coefficient that

D.G. Bonett (8/2018)
4
describes the change in 𝑦1 associated with a 1-point increase in 𝜂 and is referred to as a
factor loading. It will be assumed that the common factor scores (𝜂𝑖) and unique factor
scores (𝜖1𝑖) are uncorrelated with each other and have means of 0. It is also convenient to
assume that the common factor scores have a variance equal to 1. The y-intercept (𝛽0) is
equal to the mean of 𝑦1 because 𝜂𝑖 has a mean of zero, and the measurement model could
also be expressed as 𝑦1𝑖 = 𝜇1 + 𝜆1𝜂𝑖 + 𝜖1𝑖. The unique factor variance for measurement j is
denoted as 𝜎𝜖𝑗
2 .
With r measurements of the same latent variable, the following set of r measurement
models can be specified.
𝑦1𝑖 = 𝜇1 + 𝜆1𝜂𝑖 + 𝜖1𝑖 𝑦2𝑖 = 𝜇2 + 𝜆2𝜂𝑖 + 𝜖2𝑖 … 𝑦𝑟𝑖 = 𝜇𝑦𝑟 + 𝜆𝑟𝜂𝑖 + 𝜖𝑟𝑖 (2.3a)
Note that there is only one predictor variable (𝜂) in this set of models. The r models can
be combined into the following 1-factor factor analysis model
Y = 𝟏𝝁 + 𝜼𝝀 + E (2.3b)
where Y is an n × r matrix of r observed measurements for a random sample of n
participants, 𝟏 is a n × 1 vector of ones, 𝝁 is a 1 × r vector of population means of the r
measurements, 𝜼 is an n × 1 vector of common factor scores for the n participants, 𝝀 is a
1 × r vector of factor loadings, and E is an n × r matrix of unique factor scores.
A path diagram of Equation 2.3 for r = 3 is shown below. It is traditional to represent
latent variables with circles and observable variables with rectangles.
𝜇1 𝜖1 (Model 1)
𝜆1
𝜇2
𝜖2
𝜆2 𝜇3
𝜆3
𝜖3
y1
y2
y3
𝜂
1

D.G. Bonett (8/2018)
5
Four different types of measurement models can be defined by imposing certain
constraints on the population y-intercepts (means), factor loadings, and unique factor
variances. If all r population means are assumed to be equal, all r population factor
loadings are assumed to be equal, and all r population unique factor variances are
assumed to be equal, Equation 2.3b is called a strictly parallel measurement model. If the r
population means are not assumed to be equal but all r factor loadings are assumed to be
equal and all r population unique factor variances are assumed to be equal, Equation 2.3b
is referred to as a parallel measurement model. If the r population means and the r
population unique factor variances are not assumed to be equal, but all r factor loadings
are assumed to be equal, Equation 2.3b is referred to as a tau-equivalent measurement model.
If no constraints are imposed on the means, factor loadings, or unique factor variances,
Equation 2.3b is referred to as a congeneric model (or a single-factor factor analysis model).
In strictly parallel, parallel, and tau-equivalent measurement models where all factor
loadings are assumed to be equal, the 𝜆𝑗𝜂𝑖 component of the models in Equation 2.3a
simplifies to λ𝜂𝑖. In these models, λ𝜂𝑖 is referred to as the true score for participant i, 𝜖𝑗𝑖 is
the measurement error for participant i and measurement j, and the unique factor variances
𝜎𝜖12 , 𝜎𝜖2
2 , … , 𝜎𝜖𝑟2 are referred to as measurement error variances.
Strictly parallel measurements are important in applications where the r measurements
represent alternative forms of a test and a person’s test score is used for selection
purposes. Test developers for the GRE, SAT, driver’s exams, and other licensing exams
attempt to develop strictly parallel forms of a particular test. Strictly parallel forms of a
test are also useful in multiple group pretest-posttest designs with one form used at
pretest and the other form used at posttest. Parallel and tau-equivalent measurements are
useful in ANCOVA models where one measurement is used as a covariate and a second
measurement is used as the response variable.
General Factor Analysis Models
In the measurement models described above, each of the r observed variables (𝑦1, 𝑦2,
… , 𝑦𝑟) is predicted by a single factor. Now consider r observed variables that are each
predicted by q factors. The linear model for each of the r observed variables are given
below.

D.G. Bonett (8/2018)
6
𝑦1𝑖 = 𝜇1 + 𝜆11𝜂1𝑖 + 𝜆21𝜂2𝑖 + ⋯ + 𝜆𝑞1𝜂𝑞𝑖 + 𝜖1𝑖 (2.4a)
𝑦2𝑖 = 𝜇2 + 𝜆12𝜂1𝑖 + 𝜆22𝜂2𝑖 + ⋯ + 𝜆𝑞2𝜂𝑞𝑖 + 𝜖2𝑖
⋮
𝑦𝑟𝑖 = 𝜇𝑦𝑟 + 𝜆1𝑟𝜂1𝑖 + 𝜆2𝑟𝜂2𝑖 + ⋯ + 𝜆𝑞𝑟𝜂𝑞𝑖 + 𝜖𝑟𝑖
The r models can be combined into the following factor analysis model
Y = 𝟏𝝁 + 𝜼𝚲 + E (2.4b)
where Y is an n × r matrix of r observed measurements for a random sample of n
participants, 𝟏 is a n × 1 vector of ones, 𝝁 is a 1 × r vector of population means of the r
measurements, 𝜼 is an n × q matrix of common factor scores for the n participants, 𝚲 is a
q × r matrix of factor loadings, and E is an n × r matrix of unique factor scores. The r
observed variables are also referred to as indicator variables.
The proportion of variance of 𝑦𝑗 that can be predicted by the q factors is
1 – 𝜎𝜖𝑗
2
𝜎𝑦𝑗2 (2.5)
and is called the communality of 𝑦𝑗. In strictly parallel, parallel, and tau-equivalent models
where 𝜎𝜖𝑗
2 represents measurement error variance, Equation 2.5 defines the reliability of
𝑦𝑗. Strictly parallel and parallel measurements are assumed to have equal measurement
error variances and hence they are equally reliable. Thus, the Spearman-Brown formulas
(2.1 and 2.2) apply only to strictly parallel and parallel measurements.
The factor loadings might be difficult to interpret if the variances of the r indicator
variables are not similar and the metrics of the indicator variables are not familiar to the
intended audience. When the variances of the indicators are unequal, the relative
magnitudes of the factor loadings do not describe the relative strengths of relations
between the factor and the indicator variables. A standardized factor loading is defined as
𝜆𝑗𝑘 = 𝜆𝑗𝑘(𝜎𝜂𝑗/𝜎𝑦𝑘
) which is analogous to how standardized slope coefficients are defined.
In factor analysis models with a single factor (i.e., measurement models) or with
uncorrelated factors, a standardized factor loading is equal to a Pearson correlation
between a factor and an indicator variable.

D.G. Bonett (8/2018)
7
The correlations among the q factors are usually important parameters to estimate. The
correlations among the unique factors are usually assumed to equal 0. In some
applications, there is a theoretical justification for correlated unique factors and these
correlations can be included in the model. For instance, if 𝑦1 and 𝑦2 are both self-report
measures and 𝑦3 and 𝑦4 are ratings from two different experts, we would expect a
positive correlation between 𝜖1 and 𝜖2 and a positive correlation between 𝜖3 and 𝜖4.
Not all of the parameters in a factor analysis model can be uniquely estimated and it is
necessary to impose some constraints on the model parameters to identify the model. A
factor analysis model in which some of its parameters are constrained is called a
confirmatory factor analysis (CFA) model. A necessary but not sufficient condition for the
parameters of a CFA to be identified is that that the number of estimated factor loadings,
factor variances, unique factor variances, unique factor correlations, and factor
correlations must be less than r(r + 1)/2. Sufficient conditions for CFA model identification
are more complicated. The following strategy will usually work: set all factor variances
to 1, set all unique factor correlations to 0, and set at least one path (factor loading) from
each factor to 0. Also, if a factor predicts only two observed variables, then those two
factor loadings should be equality constrained.
For certain models that will be considered in Module 3, some of the factors will be treated
as predictor variables and some will be treated as response variables. The variances of
the predictor variable factors can be set at 1, but the variances of the factors serving as
response variables must be estimated. If the variance of a factor is estimated (e.g., not set
to 1), then one factor loading can be set to 1 to identify the model. When one of the factor
loadings is set to 1, the variance of that factor will then equal the variance of the observed
variable that has the loading of 1. In strictly parallel, parallel, and tau-equivalent models,
all factor loadings would be set equal to 1 if the factor variance is to be estimated.
A path diagram (y-intercepts omitted) of a CFA model with r = 6 indicator variables and
q = 2 factors is shown below. This model assumes the two factors are correlated and
assumes that all six unique factors are uncorrelated. In this model, the variances of 𝜂1 and
𝜂2 are constrained to equal 1. A total of 13 parameters (𝜌12, the six factor loadings, and
the six unique factor variances) will be estimated in this CFA model which is less than
the 6(7)/2 = 21 maximum allowable. Note also that the three paths from 𝜂1 to 𝑦4, 𝑦5, and

D.G. Bonett (8/2018)
8
𝑦6 have been omitted and the three paths from 𝜂2 to 𝑦1, 𝑦2, and 𝑦3 have been omitted.
These six omitted paths indicate that the corresponding factor loading have been
constrained to equal zero. These constraints are more than sufficient to allow the unique
estimation of all 13 parameters.
E 𝜖1 (Model 2)
𝜆12
𝜆12
𝜖2
𝜆13
𝜖3
𝜌12
E 𝜖4
𝜆24
𝜆25
𝜖5
𝜆26
𝜖6
The lavaan code for a 2-factor CFA model with three congeneric indicators per factor is
given below. The std.lv = T option sets the variance of the factor to 1.
CFA.model <- '
factor1 =~ y1 + y2 + y3
factor2 =~ y4 + y5 + y6 '
fit <- sem(CFA.model, data = mydata, std.lv = T)
summary(fit, fit.measures = T, rsq = T)
𝜂2y5
y1
y3
y4
y6
𝜂1y2

D.G. Bonett (8/2018)
9
Exploratory Factor Analysis
A factor analysis model in which every factor predicts every observed variable and the
unique factors are all uncorrelated is called an exploratory factor analysis (EFA) model. The
EFA model is traditionally used in applications where the researcher is trying to discover
and understand the underlying factor structure of r observed variables. In an EFA model,
the factor loadings cannot be uniquely estimated. With an infinite number of possible
factor loading estimates, EFA programs allow the user to rotate the factor loadings to
make them more easily interpreted. The rotation algorithms search for a simple structure
in which each indicator variable ideally has a large path from only one factor and small
paths from all other factors. If the factors are assumed to be uncorrelated, orthogonal
rotation methods are used, and the varimax method is the most popular orthogonal
rotation method. With correlated factors assumed, oblique rotation methods are used. The
direct oblimin and promax methods are the popular oblique rotation methods. An oblique
rotation will usually produce a more interpretable simple structure of factor loadings
than an orthogonal rotation. However, it could be difficult to interpret the meaning of the
factors if they are highly correlated.
With an orthogonal rotation, EFA programs will produce an r x q structure matrix of
estimated Pearson correlations between the r observed variables and the q factors. With
an oblique rotation, EFA programs will produce a structure matrix and an r x q
standardized or unstandardized pattern matrix that contains estimated standardized or
unstandardized factor loadings. With an oblique rotation, some EFA programs provide
an option to compute a reference structure matrix which is a matrix of semipartial
correlations between each variable and each factor controlling for the other factors. With
oblique rotation, an examination of both the structure matrix and the pattern matrix (or
reference structure matrix) helps to better understand the nature of the factors.
EFA programs give the user an option to factor analyze either the correlations or the
covariances among the r variables, and an analysis of correlations is recommended in
most EFA applications. EFA programs allow the user to specify the number of factors,
but the researcher often does not know how many factors to specify. EFA programs can
produce a scree plot of the eigenvalues. The eigenvalue for each factor is equal to the sum
of the squared Pearson correlations between that factor and each of the r variables.

D.G. Bonett (8/2018)
10
The optimal number of factors is often at or to the left of the point where the scree plot
straightens out. The scree plot below suggests that q = 2 or q = 3 factors might be a good
choice. In scree plots that do not have a clear pattern, q can be set to the number of factors
that have an eigenvalue greater than 1. In the scree plot below, two factors have
eigenvalues greater than 1. The scree plot and eigenvalue greater than 1 rule can narrow
down the number of possible factors, but the value of q that provides the most
interpretable or theoretically defensible results should determine the final choice for q.
Estimating Factor Loadings and Unique Factor Variances
Estimating 𝝁 in Equation 2.4b is simple but estimating the r factor loadings and the r
unique factor variances in a CFA model is complicated. To estimate these parameters and
their standard errors, Equation 2.4b must first be converted into its covariance structure
form. The population covariance matrix (in a study population of size N) for the r
indicator variables is
S = (Y – 𝟏𝝁)′(𝐘 – 𝟏𝝁)/𝑁
= (𝜼𝚲 + E )′(𝜼𝚲 + E)/N
= 𝝀′ (𝜼′𝜼
𝑁) 𝝀 +
𝐄′𝐄
𝑁 .
Recall that 𝜼 is assumed to have a mean of 0 so that (𝜼′𝜼
𝑁) represents the covariance matrix
of the factors, denoted as 𝛟. If the variances of the factors are constrained to equal 1, then
𝛟 contains the q(q – 1) factor correlations. The r unique factors are traditionally (but not
necessarily) assumed to be uncorrelated and have means of 0 so that 𝐄′𝐄
𝑁 is a diagonal

D.G. Bonett (8/2018)
11
matrix, denoted as 𝝍, with 𝜎𝜖12 , 𝜎𝜖2
2 , … , 𝜎𝜖𝑟 2 along the diagonal. With these substitutions, the
covariance structure can be expressed as
S = 𝚲′𝛟𝚲 + 𝝍
and the goal is to find estimates of 𝚲 , 𝛟, and 𝝍, denoted as �̂�, �̂�, and �̂�, such that
�̂� = �̂�′�̂��̂� + �̂� is the closest possible approximation to the estimated covariance matrix
�̂� = (Y – 𝟏�̂�)′(𝐘 – 𝟏�̂�)/(𝑛 − 1).
The following goodness of fit function can be used to quantify how well �̂� approximates �̂�.
T = tr[{(�̂� – �̂�)𝐖}2](𝑛 − 1)/2 . (2.6)
The estimates of 𝝀, 𝛟 and 𝝍 that minimize T are called maximum likelihood (ML) estimates
if W is set to �̂�−𝟏. The estimates are called generalized least squares (GLS) estimates if W is
set to �̂�−𝟏 and unweighted least squares (ULS) estimates if W is set to I. With ML and GLS
estimation, T has an approximate chi-square distribution and can be used to test
hypotheses as will be explained later. ML estimation is the default in most latent variables
computer programs. If the model is not misspecified, ML estimates have smaller standard
errors than GLS or ULS estimates. If the model is badly misspecified (e.g., the population
factor loadings are highly unequal but have been equality constrained or large factor
loadings have been set to zero), GLS estimates have less small-sample bias than ML
estimates. Although T is not chi-squared distributed with ULS estimation, the ULS
estimates can be less biased and have sampling distributions that more closely
approximate a normal distribution than ML and GLS estimates in small samples.
Solving for the values of �̂� , �̂�, and �̂� that minimize Equation 2.6 is computationally
difficult. To minimize T, the fit function is first computed using starting values for �̂�,
�̂�, and �̂�, and then the values of �̂�, �̂�, and �̂� are systematically varied (subject to any
constraints on the parameter values) until the fit function appears to have reached a
minimum value. ML, GLS, and ULS estimates of 𝝀, 𝛟 and 𝝍 can be obtained using a
program such as lavaan. lavaan also will compute standard errors of the parameter
estimates that can be used to compute confidence intervals for the population factor
loadings, correlations among factors, and unique factor variances.
D.G. Bonett (8/2018)
12
In EFA models, parameter estimation is called “extraction”. The principal axis method of
extraction is a very old method that is still commonly used in EFA applications. The
principle axis method remains popular because it is faster than the ML method (especially
if r is large) and sometimes is able to produce parameter estimates in situations where
the fit function (Equation 2.6) will not converge to a minimum value.
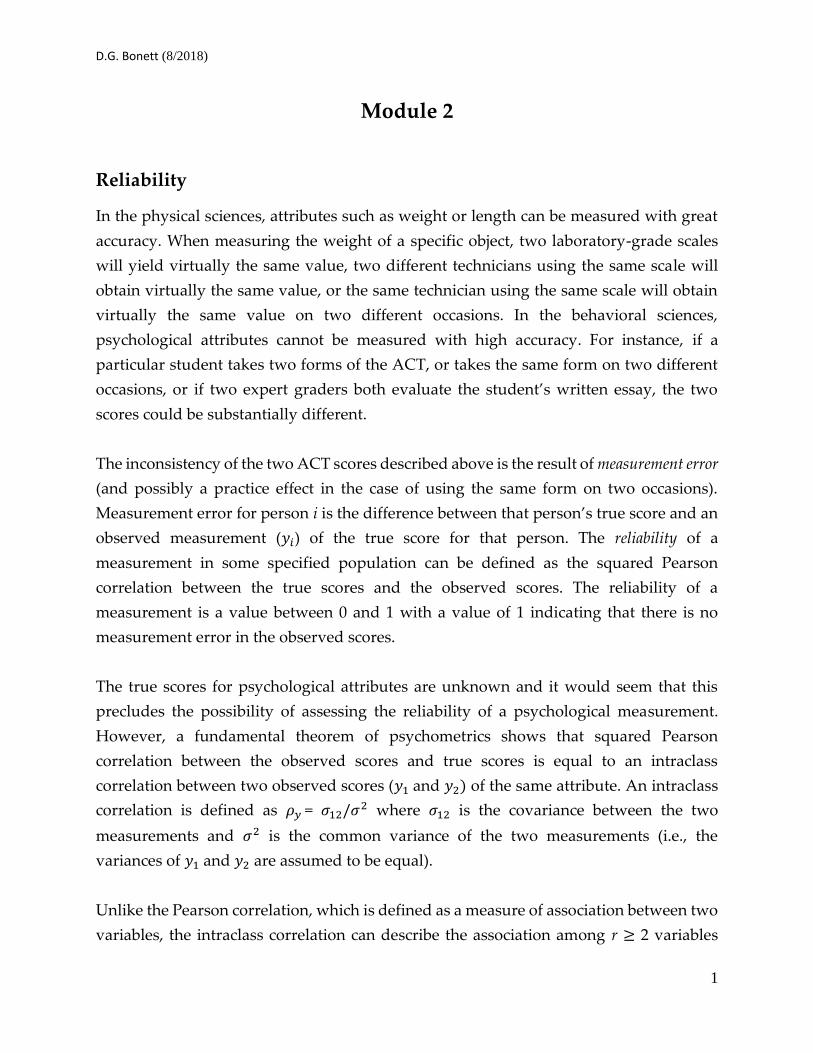
Reliability Estimates and Confidence Intervals
An estimate of 𝜌𝑟 (the reliability of a sum or average of r measurements) that assumes
parallel or strictly parallel measurements is
�̂�𝑟 = (𝑟�̂�)2/[(𝑟�̂�)2 + 𝑟�̂�𝜖2] (2.7)
where �̂� is a ML estimate of the common factor loading and �̂�𝜖2 is a ML estimate of the
common measurement error variance. An estimate of 𝜌𝑟 that assumes tau-equivalent
measurements is
�̂�𝑟 = (𝑟�̂�)2/[(𝑟�̂�)2 + ∑ �̂�𝜖𝑗
2𝑟𝑗=1 ] (2.8)
where �̂� is a ML estimate of the common factor loading and �̂�𝜖𝑗
2 is a ML estimate of the
measurement error variance for measurement j. Equation 2.8 is referred to as Cronbach’s
alpha coefficient. An estimate of 𝜌𝑟 that assumes only congeneric measurements is
�̂�𝑟 = (∑ �̂�𝑗𝑟𝑗=1 )2/[(∑ �̂�𝑗
𝑟𝑗=1 )2 + ∑ �̂�𝜖𝑗
2𝑟𝑗=1 ] (2.9)
where �̂�𝑗 is a ML estimate of the factor loading for measurement j and �̂�𝜖𝑗
2 is a ML estimate
of the measurement error variance for measurement j. Equation 2.9 is also referred to as
McDonald’s omega coefficient. Equations 2.8 and 2.9 give similar values unless the factor
loadings are highly dissimilar. If the factor loadings are highly dissimilar, McDonald's
omega is recommended and could be substantially larger than Cronbach's alpha.
The estimates of 𝜌𝑟 (Equations 2.7 - 2.9) contain sampling error of unknown magnitude
and direction and therefore it is necessary to report a confidence interval for 𝜌𝑟. Equation
2.8 (Cronbach’s alpha) is the most popular reliability estimate. An approximate
100(1 – 𝛼)% confidence interval for the population value of Cronbach’s alpha is
1 – exp[ln(1 – �̂�𝑟) – ln{n/(n – 1)} ± 𝑧𝛼/2√𝑣𝑎𝑟(�̂�𝑟)/(1 − �̂�𝑟)2 ] (2.10)

D.G. Bonett (8/2018)
13
where ln{n/(n – 1)} is a bias adjustment. For r strictly parallel or parallel measurements
𝑣𝑎𝑟(�̂�𝑟) = [2r(1 − �̂�𝑟)2]/[(r – 1)(n – 2)] (2.11)
and for r congeneric measurements
var(�̂�𝑟) = [2𝑟2
(𝑟 − 1)2(𝐣′�̂�𝐣)3] [(𝐣′�̂�𝐣)(𝑡𝑟�̂�2 + 𝑡𝑟2�̂�) − 2(𝑡𝑟�̂�)(𝐣′�̂�2𝐣)]/(𝑛 − 3) (2.12)
where 𝐣 is an r x 1 vector of ones. Equation 2.10 can also be used to compute an
approximate confidence interval for the population value of the omega coefficient by
setting �̂�𝑟 equal to Equation 2.9 and setting 𝑣𝑎𝑟(�̂�𝑟) equal to the variance the estimated
omega coefficient. The variance of the estimated omega coefficient has a complicated
formula but it can be obtained in lavaan.
Assuming strictly parallel or parallel measurements (i.e., equally reliable measurements
each having reliability 𝜌𝑦), a confidence interval for 𝜌𝑟 can be transformed into a
confidence interval for 𝜌𝑦 using the relation given in Equation 2.2. Replacing 𝜌𝑟 in
Equation 2.2 with �̂�𝑟 gives an estimate of 𝜌𝑦, and replacing 𝜌𝑟 in Equation 2.2 with the
lower and upper endpoints of Equation 2.10 gives an approximate 100(1 – 𝛼)% confidence
interval for 𝜌𝑦.
The parameters of a measurement model can be estimated using lavaan along with their
standard errors. In the following examples, the three measurements are rater1,
rater2, and rater3. The model specification for a strictly parallel measurement model
is given below. This code also includes the sem function and summary function.
strictpar.model <- '
true =~ lam*rater1 + lam*rater2 + lam*rater3
rater1 ~~ var*rater1
rater2 ~~ var*rater2
rater3 ~~ var*rater3
rater1 ~ mean*1
rater2 ~ mean*1
rater3 ~ mean*1
rel := (3*lam)^2/((3*lam)^2 + 3*var) '
fit <- sem(strictpar.model, data = mydata, std.lv = T)
summary(fit, fit.measures = T, rsq = T)

D.G. Bonett (8/2018)
14
Note that the optional parameter label lam is the same for all three factor loadings. This
is one way to indicate that the three factor loadings should be constrained to be equal.
The rater1 ~~ var*rater1 command defines the error variance for the rater1
measurement and gives it an optional label of var. All three error variances are assumed
to be equal in this model and so the error variance label is the same for all three variances.
The rater1 ~ mean*1 command specifies a y-intercept (mean) for the rater1 equation
which is given an optional label of mean. All three population means are assumed to be
equal in a strictly parallel model, and this constraint is imposed by using the same label
for all three y-intercepts. The rel := (3*lam)^2/((3*lam)^2 + 3*var) command defines
a new parameter that is the reliability of the sum (or average) of the r = 3 strictly parallel
measurements.
The sem command instructs lavaan to estimate all factor loadings and unique variances
along with their standard errors. The std.lv = T option sets the variance of the factor
equal to 1. The summary command prints the results produced by the sem command.
The model specification for a parallel measurement model, where the y-intercepts
(means) are not constrained to be equal, is given below.
par.model <- '
true =~ lam*rater1 + lam*rater2 + lam*rater3
rater1 ~~ var*rater1
rater2 ~~ var*rater2
rater3 ~~ var*rater3
rel := (3*lam)^2/((3*lam)^2 + 3*var) '
A tau-equivalent measurement model can be specified using the following code where
different labels are used for each error variance.
tau.model <- '
true =~ lam*rater1 + lam*rater2 + lam*rater3
rater1 ~~ var1*rater1
rater2 ~~ var2*rater2
rater3 ~~ var3*rater3
alpha := (3*lam)^2/((3*lam)^2 + var1+var2+var3) '
A congeneric measurement model is specified below by using different labels for the
factor loadings and different labels for the unique variances. Alternatively, the optional
parameters labels could be omitted and the parameters would be estimated without
equality constraints. cong.model <- '

D.G. Bonett (8/2018)
15
factor =~ lam1*rater1 + lam2*rater2 + lam3*rater3
rater1 ~~ var1*rater1
rater2 ~~ var2*rater2
rater3 ~~ var3*rater3
omega := (lam1+lam2+lam3)^2/((lam1+lam2+lam3)^2 + var1+var2+var3) '
Using the above code, lavaan will compute an estimate of the omega reliability coefficient
and its standard error. These estimates could be plugged into Equation 2.9 to obtain a
confidence interval for the population value of the omega reliability coefficient.
Confidence Intervals for Factor Loadings and Unique Factor Variances
An approximate 100(1 – 𝛼)% confidence interval for 𝜆𝑗𝑘 is
�̂�𝑗𝑘 ± 𝑧𝛼/2𝑆𝐸�̂�𝑗𝑘 (2.13)
and an approximate 100(1 – 𝛼)% confidence interval for a difference between any two
factor loadings (e.g., 𝜆11 and 𝜆21) is
�̂�11 − �̂�21 ± 𝑧𝛼/2√𝑣𝑎𝑟(�̂�11) + 𝑣𝑎𝑟(�̂�21) − 2𝑐𝑜𝑣(�̂�11, �̂�21) (2.14)
where √𝑣𝑎𝑟(�̂�11) + 𝑣𝑎𝑟(�̂�12) − 2𝑐𝑜𝑣(�̂�11, �̂�12) is the estimated standard error of �̂�1 − �̂�2.
lavaan can compute �̂�1 − �̂�2 and its estimated standard error. These estimates could then
be plugged into Equation 2.14. lavaan also can compute a difference in standardized
loadings and its standard error, and these value could be plugged into Equation 2.14.
An approximate confidence interval for 𝜎𝑒𝑗
2 is
exp[𝑙𝑛(�̂�𝜖𝑗
2 ) ± 𝑧𝛼/2𝑆𝐸�̂�𝜖𝑗2 /�̂�𝜖𝑗
2 ] (2.15)
and the following approximate 100(1 – 𝛼)% confidence interval for the ratio of any two
measurement error variances (e.g., 𝜎𝜖12 and 𝜎𝜖2
2 ) could be used to assess the feasibility of a
parallel or strictly parallel model
exp[𝑙𝑛 (�̂�𝜖1
2
�̂�𝜖22 ) ± 𝑧𝛼/2√
𝑣𝑎𝑟(�̂�𝜖12 )
�̂�𝜖14 +
𝑣𝑎𝑟(�̂�𝜖22 )
�̂�𝜖24 −
2𝑐𝑜𝑣(�̂�𝜖12 , �̂�𝜖2
2 )
�̂�𝜖12 �̂�𝜖2
2 ] (2.16)

D.G. Bonett (8/2018)
16
where √𝑣𝑎𝑟(�̂�𝜖1
2 )
�̂�𝜖14 +
𝑣𝑎𝑟(�̂�𝜖22 )
�̂�𝜖24 −
2𝑐𝑜𝑣(�̂�𝜖12 , �̂�𝜖2
2 )
�̂�𝜖12 �̂�𝜖2
2 is the estimated standard error of 𝑙𝑛 (�̂�𝜖1
2
�̂�𝜖22 ). When
examining all pairwise differences in factor loadings or all pairwise ratios of unique factor
variances in a congeneric model, replacing 𝛼 with 𝛼∗ = 𝛼/𝑣 in Equations 2.14 and 2.16,
where v = r(r – 1)/2, gives a set of simultaneous Bonferroni confidence intervals. The
square-roots of the endpoints of Equations 2.15 and 2.16 give confidence intervals for
unique factor standard deviations that are easier to interpret than variances. lavaan can
compute 𝑙𝑛(�̂�𝜖12 /�̂�𝜖2
2 ) and its estimated standard error. These estimates could then be
plugged into Equation 2.16.
If all pairwise comparisons of factor loadings suggest that the 𝜆𝑗 values are similar, that
would support the use of a tau-equivalent model; and additionally, if all pairwise
comparisons of measurement error variances suggest that the 𝜎𝑒𝑗
2 values are similar, that
would support the use of a parallel measurement model. If the parallel model
assumptions appear to be reasonable, confidence intervals for all pairwise differences in
means can be computed to determine if a strictly parallel model is reasonable. Unless r is
small, reporting all r(r – 1)/2 pairwise comparisons can become unwieldy. It may suffice
to simply report �̂�𝑚𝑎𝑥 − �̂�𝑚𝑖𝑛, √�̂�𝜖𝑚𝑎𝑥2 /�̂�𝜖𝑚𝑖𝑛
2 , and �̂�𝑚𝑎𝑥 − �̂�𝑚𝑖𝑛 along with their Bonferroni
confidence intervals. The following code defines all pairwise differences in factor
loadings, all pairwise differences in means, and all pairwise log-ratios of unique factor
variances.
cong.model <- '
factor =~ lam1*rater1 + lam2*rater2 + lam3*rater3
rater1 ~~ var1*rater1
rater2 ~~ var2*rater2
rater3 ~~ var3*rater3
rater1 ~ mean1*1
rater2 ~ mean2*1
rater3 ~ mean3*1
lamdiff12 := lam1-lam2
lamdiff13 := lam1-lam3
lamdiff23 := lam2-lam3
logvarratio12 := log(var1/var2)
logvarratio13 := log(var1/var3)
logvarratio23 := log(var2/var3)
meandiff12 := mean1 – mean2
meandiff13 := mean1 – mean3
meandiff23 := mean2 – mean3 '

D.G. Bonett (8/2018)
17
Confidence Intervals for Correlations
Let 𝜌 denote a population correlation between two factors or two unique factors. An
approximate confidence interval for 𝜌 is obtained in two steps. First, a 100(1 − 𝛼)%
confidence interval for a transformed correlation is computed
�̂�∗ ± 𝑧𝛼/2𝑆𝐸�̂�/√1 − �̂�2 (2.17)
where �̂�∗ = 𝑙𝑛 ([1 + �̂�
1 − �̂�])/2 is called the Fisher transformation of �̂� and 𝑆𝐸�̂� is the standard
error (standard or robust) of �̂�. Let 𝜌𝐿∗ and 𝜌𝑈
∗ denote the endpoints of Equation 2.17.
Reverse transforming the endpoints of Equation 2.17 gives the following lower
confidence limit for 𝜌
𝑒𝑥𝑝(2𝜌𝐿∗) − 1
𝑒𝑥𝑝(2𝜌𝐿∗) + 1
(2.18a)
and the following upper confidence limit for 𝜌
𝑒𝑥𝑝(2𝜌𝑈∗ ) − 1
𝑒𝑥𝑝(2𝜌𝑈∗ ) + 1
. (2.18b)
The sampling distribution of �̂� is not well approximated by a normal distribution unless
the sample size is very large or if 𝜌 is close to zero. Compared to the sampling distribution
of �̂�, the sampling distribution of �̂�∗ more closely approximates a normal distribution in
small samples for any value of 𝜌.
lavaan can be used to compute Equation 2.17 and then Equations 2.18a and 2.18b can be
hand computed. The following lavaan code illustrates the computation of the Fisher
transformed correlation between two factors in a 2-factor CFA model. The
parameterEstimates command computes Equation 2.17. Equations 218ab would then
be hand computed. With the std.lv = T option, covariances among factors become
correlations.
twofactor.model <- '
factor1 =~ y1 + y2 + y3
factor2 =~ y4 + y5 + y6
factor1 ~~ corr*factor2
fisher := (log(1 + corr) – log(1 - corr))/2 '
fit <- sem(twofactor.model, data = mydata, std.lv = T)
parameterEstimates(fit)

D.G. Bonett (8/2018)
18
CFA Model Assessment
The included factor loadings in a CFA model should describe meaningfully large
relations between the factors and the indicator variables. In CFA models with a single
factor or multiple uncorrelated factors, a standardized factor loading is a Pearson
correlation between the factor and the variable. Figure 1 (in Prerequisite Material)
suggests that a Pearson correlation less than .3 in absolute value represents a small and
possibly unimportant relation. As a general recommendation, the population
standardized factor loadings should all be at least .4 in absolute value (larger is better) in
models with a single factor or multiple uncorrelated factors. Ideally, 95% Bonferroni
confidence intervals for all standardized factor loadings will have lower limits above .4
or upper limits below -.4. Furthermore, the factor loadings that have been excluded from
the model (i.e., zero-constrained), should correspond to small or unimportant relations
between the factors and observed variables. As a general recommendation, all excluded
population standardized factor loadings should have values that are less than .4 in
absolute value (smaller is better). To determine if a zero-constrained factor loading is
acceptably small, that loading could be added to the model. If a 95% confidence interval
for that loading is completely contained within a -.4 to .4 range, this would be evidence
that the population factor loading is small or unimportant.
If a CFA model has many excluded factor loadings, it is not practical to include each
excluded factor loading one at a time to assess its magnitude. lavaan can compute a
modification index that can be used to identify zero-constrained factor loadings that might
not be small or unimportant. Using this approach, the zero-constrained factor loading
with the largest modification index can be added to the model. If a 95% confidence
interval for that standardized loading is completely contained within a -.4 to .4 range, this
is convincing evidence that the population standardized factor loading is small or
unimportant and that the other zero-constrained factor loadings with smaller
modification indices are also small or unimportant. Alternatively, if the confidence
interval for the standardized factor loading falls completely outside the -.4 to .4 range
when added to the model, this is evidence that the factor analysis model has been
misspecified and the researcher will need to decide if that loading should be added to the
model. If the factor loading with the largest modification index needs to be added to the
model, then the factor loading with the next largest modification index also should be
examined. Suppose .4 is the chosen cutoff value for a standardized factor loading. If a

D.G. Bonett (8/2018)
19
95% confidence interval for a standardized loading includes -.4 or .4, then the results for
that factor loading are inconclusive and a decision to include or exclude that path must
be made on the basis of non-statistical criteria.
The correlations among the factors will ideally be consistent with theoretical
expectations. However, highly correlated factors that serve as predictor variables in the
statistical models that are described in Module 3 will have path coefficients that may be
difficult to interpret as a result of high multicollinearity. Correlations between unique
factors are ideally included in the model only if they are theoretically justified.
Confidence intervals for factor correlations or unique factor correlations provide useful
information regarding their magnitude.
Goodness-of-fit Tests
Although pairwise comparisons using Equations 2.14 and 2.16 are effective for assessing
parallel and tau-equivalent models, it is common practice to evaluate these models using
a chi-square goodness-of-fit (GOF) test. The goodness of fit function (Equation 2.6) with ML
or GLS estimation has a chi-squared distribution with degrees of freedom equal to df =
r(r + 1)/2 – q where q is the number of uniquely estimated parameters. For instance, in a
tau-equivalent model, r measurement error variances and one factor loading are
estimated to give df = r(r + 1)/2 – r – 1.
In a chi-square GOF test, if the p-value for the chi-square statistic is less than 𝛼, the null
hypothesis (H0) is rejected and the alternative hypothesis (H1) is accepted. Most
researchers describe the null and alternative hypotheses in vague terms such as “H0:
model is correct” and “H1: model is incorrect”, but it important to understand what the
null hypothesis is stating in terms of population parameters. The null hypothesis states
that all constraints on the model parameters are correct, and the alternative hypothesis
states that at least one constraint is incorrect. For instance, in a tau-equivalent model with
r = 4 where df = 4(4 + 1)/2 – 5 = 5, three of the five constraints are needed to specify the
equality of the r factor loadings (i.e., 𝜆1 – 𝜆2 = 0, 𝜆1 – 𝜆3 = 0, and 𝜆1 – 𝜆4 = 0). The tau-
equivalent model also assumes that all r(r – 1)/2 covariances among the unique factor
errors equal zero, but only r(r + 1)/2 – 2r of these covariances are estimable and can be
constrained to equal zero under the null hypothesis. In our example where r = 4, only
4(5)/2 – 8 = 2 covariances are estimable and they are assumed to equal zero. Thus, in a

D.G. Bonett (8/2018)
20
tau-equivalent model with r = 4 where df = 5, the null hypothesis states that all four factors
loadings are equal and the two estimable error covariances are zero. A rejection of this
null hypothesis implies that at least one factor loading is not equal to the other loadings
or at least one estimable error covariance is nonzero.
GOF test results are routinely misinterpreted. Researchers typically interpret a failure to
reject the null hypothesis in a GOF test as evidence that the null hypothesis is true and
conclude that the “model is correct” or “the model fits”. However, if the sample size is
small, the GOF and test will often fail to reject the null hypothesis even though the model
is badly misspecified. Alternatively, with large samples the null hypothesis can be
rejected even if the model misspecification is trivial.
Fit Indices
A variety of fit indices have been proposed to provide a crude indication of model
misspecification. These fit indices were originally intended for use in complex latent
variables models with many constraints and before model modification indices were
available in latent variable computer programs.
One fit index is the normed fit index
NFI = 1 – 𝑇𝐹
𝑇𝑅 (2.19)
where 𝑇𝐹 is the ML goodness of fit value for the model of interest (sometime called the
“Full model”) and 𝑇𝑅 is usually the ML goodness of fit function value for a model that
assumes all observed variables are uncorrelated (sometimes called the “Reduced
model”). The NFI has a range of 0 to 1 with values close to 1 suggesting that the values of
all omitted paths in the model are small and the parameters for each set of equality
constrained parameters are approximately equal. The NFI is negatively biased in small
samples.
The following comparative fit index (CFI) and Tucker-Lewis index (TLI) have less negative
bias but greater sampling variability than the NFI in small samples
CFI = 1 – 𝑇𝐹 − 𝑑𝑓𝐹
𝑇𝑅 −𝑑𝑓𝑅 (2.20)

D.G. Bonett (8/2018)
21
TLI = 𝑇𝑅/𝑑𝑓𝑅 − 𝑇𝐹/𝑑𝑓𝐹
𝑇𝑅/𝑑𝑓𝑅 − 1 (2.21)
where 𝑑𝑓𝐹 and 𝑑𝑓𝑅 are the degrees of freedom for the full and reduced models,
respectively. The TLI and CFI also can obtain a value greater than 1 and are set to 1 in
those cases.
Another fit index is the root mean square error of approximation
RMSEA = √𝑇𝐹 − 𝑑𝑓𝐹
(𝑑𝑓𝐹)𝑛 (2.22)
where n is the sample size. RMSEA is set to 0 if 𝑇𝑚 − 𝑑𝑓𝑚 < 0. Values of RMSEA close to 0
suggest that the values of all omitted paths are small and all equality constrained
parameters are approximately equal. An approximate confidence interval for the
population RMSEA value is an option in lavaan and other packages.
The main problem with fit indices is that they can give a misleading impression of a
model’s adequacy. Specifically they can yield “good” values even when some of the
omitted paths are meaningfully large and they can yield "bad" values when there are
many omitted paths that are nonzero but are all small or unimportant. Despite these
limitations, most social science journals expect authors to report at least one fit index
value along with the p-value for a GOF test value. The recommendation here is to
supplement the p-value and fit index information with confidence interval results
showing that all included model parameters are meaningfully large and that the largest
omitted parameter is small or unimportant.
Model Comparison Tests
The difference in goodness of fit function values for two nested models with ML or GLS
estimation, assuming one model is a more restricted version of the other model, has a chi-
squared distribution with df equal to the difference in df values for each model. Model A
is said to be nested in Model B if Model A imposes constraints on the parameters of Model
B and does not remove any constraints in Model B. To illustrate, let TP, TTE, and TC
represent goodness of fit functions values and let dfP, dfTE, and dfC represent the degrees
of freedom for a parallel, tau-equivalent, and congeneric model, respectively. The parallel
model is nested in the tau-equivalent model, and the tau-equivalent model is nested in

D.G. Bonett (8/2018)
22
the congeneric model. Tests based on differences in goodness of fit functions are called
model comparison tests. With model comparison tests it is possible to evaluate hypotheses
that are more specific than GOF tests as illustrated below.
The difference TP – TTE is a chi-squared test statistic with df = dfP – dfTE = [r(r + 1)/2 – 2] –
[r(r + 1)/2 – r – 1] = r – 1 and provides a test of the following null hypothesis
H0: 𝜆1 = 𝜆2 = ⋯ = 𝜆𝑟
and the alternative hypothesis states that at least one 𝜆𝑗 value is not equal to the other
factor loadings. The difference TTE – TC is a chi-squared test statistic with df = dfT – dfC =
[r(r + 1)/2 – r – 1] – [r(r + 1)/2 – 2r] = r – 1 and provides a test of the following null hypothesis
H0: 𝜎𝜖12 = 𝜎𝜖2
2 = ⋯ = 𝜎𝜖𝑟2
and the alternative hypothesis states that at least one 𝜎𝜖𝑗
2 value is not equal to other unique
factor variances. The difference TP – TC is a chi-squared test statistic with df = dfP – dfC =
[r(r + 1)/2 – 2] – [r(r + 1)/2 – 2r – 1] = 2r – 2 and provides a test of the following null
hypothesis
H0: 𝜆1 = 𝜆2 = ⋯ = 𝜆𝑟 and 𝜎𝜖12 = 𝜎𝜖2
2 = ⋯ = 𝜎𝜖𝑟2 .
The alternative hypothesis states that at least one 𝜆𝑗 value is not equal to the other factor
loadings or at least one 𝜎𝜖𝑗
2 value is not equal to other unique factor variances.
Model comparison test results are routinely misinterpreted. Researchers typically
interpret a failure to reject the null hypothesis in a model comparison test (i.e., a p-value
greater than .05) as evidence that the null hypothesis is true and then conclude that the
more restricted model is correct. If the sample size is small, the model comparison test
will often fail to reject the null hypothesis even though the more restricted model is badly
misspecified. Alternatively, with large samples the null hypothesis can be rejected even
if misspecification in the more restricted model is trivial.

D.G. Bonett (8/2018)
23
Assumptions
GOF tests, model comparison tests, and confidence intervals for measurement models
and CFA models assume: 1) random sampling, 2) independence among the n
participants, and 3) the observed random variables (𝑦1, 𝑦2, …, 𝑦𝑟) have an approximate
multivariate normal distribution in the study population. Multivariate normality of the
observed variables implies that each observed variable has a normal distribution and that
all pairs of observed variables are linearly related. Scatterplots can be used to visually
assess the linearity assumption. The moments package in R will provide estimates of the
skewness and kurtosis coefficients and can also be used to request a test of the null
hypothesis that population skewness coefficient equals 0 and a test of the null hypothesis
that the population kurtosis coefficient equals 3. For example, to assess the normality of
a variable named scale in R, the following commands could be used.
library(moments)
agostino.test(scale)
anscombe.test(scale)
The agostino.test command requests an estimate of the population skewness
coefficient and a p-value for the test of the null hypothesis that the population skewness
coefficient is equal to 0. The anscombe.test command requests an estimate of the
population kurtosis coefficient (not excess kurtosis) and a p-value for the test of the null
hypothesis that the population kurtosis coefficient is equal to 3.
If the p-value for the skewness test is less than .05, the researcher can conclude that the
population normality assumption has been violated and that the population scores are
skewed to the left or to the right according to the sign of the sample skewness coefficient.
However, a p-value greater than .05 should not be interpreted as evidence that
approximate normality has been satisfied unless the sample size is large (n > 100). If the
p-value for the kurtosis test is less than .05, the researcher can conclude that the
population normality assumption has been violated and that the population scores are
either leptokurtic or platykurtic according the value of the sample kurtosis coefficient.
However, a p-value greater than .05 should not be interpreted as evidence that
approximate normality has been satisfied unless the sample size is large (n > 100).

D.G. Bonett (8/2018)
24
If the normality assumption for any particular observed variable has been violated, it
might be possible to reduce skewness and kurtosis by transforming that variable. The
square-root, logarithmic, and reciprocal transformation are often effective in reducing
skewness and leptokurtosis. If a multi-item scale exhibits high skewness and
leptokurtosis, the problem might be due to one or more items in which almost all
respondents are giving an extreme response (e.g., everyone answers “strongly disagree”
to a particular statement). Such items are not informative measures of the attribute being
assessed and should be removed from the scale.
Confidence intervals for standardized factor loadings, correlations, and unique variances
are very sensitive to the kurtosis of the observed variable. The standard errors will be too
small with leptokurtic distributions and too large with platykurtic distributions. Since
confidence interval results provide the best way to assess a model, leptokurtosis is more
serious than platykurtosis because the confidence intervals will be misleadingly narrow
with leptokurtic distributions. Tests and confidence intervals for y-intercepts (or means)
are most sensitive to skewness. Furthermore, the negative effects of skewness on tests
and confidence intervals for y-intercepts (or means) decrease as the sample size increases
and should be minor with a sample sizes 30 or more unless the population skewness is
extreme. However, the negative effects of kurtosis on confidence intervals for factor
loadings, correlations, and unique factors do not improve with large sample sizes and
kurtosis (especially leptokurtosis) must be taken much more seriously.
GOF and model comparison tests based on ML estimation, where the null hypothesis
specifies zero correlations or zero factor loadings, are not adversely affected by kurtosis.
However, GOF or model comparison tests where the null hypothesis specifies equal
factor loadings, equal correlations, or equal unique variances are affected by kurtosis.
Specifically, the p-values for the hypothesis tests tend to be too large with leptokurtic
distributions and too small for platykurtic distributions.
If missing data are MCAR or MAR, the FIML estimation method can be requested in
lavaan by including the missing = "fiml" command in the sem function. The FIML
method will use all available data without the need to perform listwise deletion.
However, the robustness of GOF and model comparison tests of null hypotheses that
specify zero correlations and/or factor loadings is lost when FIML estimation is used.

D.G. Bonett (8/2018)
25
Robust Methods
Given the serious consequences of kurtosis on confidence interval and some hypothesis
testing results, and given the fact that the degree of kurtosis is difficult to assess using
sample data, alternative test statistics and standard errors are recommended when
approximate multivariate normality cannot be assumed. The alternative methods are
referred to as robust methods. A popular adjustment to the GOF test is the mean adjusted
GOF chi-square computed from ML estimates (also known as the Satorra-Bentler scaled
chi-square) that adjusts the GOF test statistic by a quantity that reflects the degree of excess
kurtosis in the sample. Robust model comparison chi-square tests are also available. ML
estimates and standard errors that assume multivariate normality can be computed using
only a sample covariance matrix. However, the robust tests and standard errors must be
computed from the raw data.
The traditional standard errors that are computed with ML estimates assume
multivariate normality. These standard errors are too small with leptokurtic variables
and too large for platykurtic variables. Robust standard errors are computed using a
method that reflects the degree of excess kurtosis in the sample. However, these robust
methods require large sample sizes. Tests and confidence intervals based on robust
standard error should perform properly in sample sizes of at least 100 if the distributions
of all observed variables are platykurtic or at most mildly leptokurtic. Much larger
sample sizes are required if the distributions have more extreme leptokurtosis. Bootstrap
standard errors, which can be used to compute confidence intervals, are available in
lavaan and other packages. Bootstrap standard errors should perform properly with
platykurtic and mildly leptokurtic observed variables in sample sizes of at least 100 but
will require larger samples with more extreme leptokurtosis. Fortunately, extreme
leptokurtosis can be reliably detected with a sample size of about 100, and extreme
leptokurtosis can often be reduced by data transformations or removal of problem items
in multi-item scales. Increasing the number of good items in a multi-item scale should
also reduce the skewness and leptokurtosis of the scale scores.
The ULS estimates should have less small-sample bias and have sampling distributions
that more closely approximate a normal distribution than ML estimates when the sample
size is small. Programs like lavaan will compute ULS estimates with robust standard
errors or bootstrap standard errors. With leptokurtic distributions, confidence intervals

D.G. Bonett (8/2018)
26
based on ULS estimates with robust standard errors should perform better than
confidence intervals based on the traditional ML methods. However, the GOF test
statistic should be computed using ML estimates rather than ULS estimates.
Very little research has examined the small-sample properties of confidence intervals for
standardized slopes or standardized factor loadings, and theses confidence interval are
expected to require larger sample sizes than confidence intervals for unstandardized
slopes or factor loadings.
An example of lavaan code to obtain a mean adjusted GOF test statistic, ML estimates,
and robust standard errors is shown below for a CFA model.
model <- '
factor1 =~ lam11*y1 + lam12*y2 + lam13*y3
factor2 =~ lam21*y4 + lam22*y5 + lam23*y5 '
fit <- sem(model, data = mydata, std.lv = T, estimator = "MLM")
The estimator = "MLM" option requests ML estimates, robust standard errors, and a
mean adjusted (Satorra-Bentler) GOF test.
The confidence intervals for factor loadings (Equations 2.13 and 2.14), unique error
variances (Equations 2.15 and 2.16), and reliability coefficients (Equation 2.10) can all be
computed using robust or bootstrap standard errors. For example, the following code
computes an estimate of the omega reliability coefficient and a robust standard error
based on ULS estimates. The omega estimate and its squared standard error can then be
plugged into Equation 2.10 to obtain a robust confidence interval for the population value
of omega.
cong.model <- '
factor =~ lam1*rater1 + lam2*rater2 + lam3*rater3
rater1 ~~ var1*rater1
rater2 ~~ var2*rater2
rater3 ~~ var3*rater3
omega := (lam1+lam2+lam3)^2/((lam1+lam2+lam3)^2 + var1+var2+var3) '
fit <- sem(cong.model, data = mydata, std.lv = T, estimator = "ULS",
se = "robust")
To obtain ULS estimates with bootstrap standard errors, replace se = "robust" in the
above code with se = "boot".

D.G. Bonett (8/2018)
27
Ordinal Measurements
In some applications, the indicator variables in a factor model will be measured on an
ordinal scale (e.g., y = 1 for "strongly disagree", y = 2 for "disagree" y = 3 for "agree" and y
= 4 for "strongly agree"). We will assume that the attribute of interest is quantitative and
normally distributed but has been measured on an ordinal scale with two or more
categories. If there are only two categories (e.g., y = 1 for "disagree" and y = 2 for "agree")
the measurement is referred to as dichotomous. If two quantitative attributes have been
measured on an ordinal scale, it is possible to estimate the Pearson correlation between
the two underlying quantitative attributes using a polychoric correlation. If both
measurements are dichotomous, the polychoric correlation is called a tetrachoric
correlation. Ordinal variables can be analyzed in lavaan by declaring the ordinal or
dichotomous variables to be ordered. The following code illustrates the specification of
a single factor CFA model with five dichotomously scored (correct/incorrect) test items.
cong.model <- '
factor =~ I1 + I2 + I3 +I4 + I5
fit <- sem(cong.model, data = mydata, std.lv = T, ordered = c("I1", "I2",
"I3", "I4", "I5")
If the indicators in a CFA are individual test or questionnaire items, the analysis is
sometimes referred to as an item factor analysis. An older approach to analyzing
dichotomous or ordinal indicators of a single factor is called item response theory (IRT).
The 1-parameter IRT model (also called a Rasch model) and the 2-parameter IRT model
can be analyzed using item factor analysis with dichotomous or ordinal indicator
variables.


![[PPT]Green Business - UCSC Directory of individual web sitesrlipsch/migrated/EE80S/UCSC... · Web viewGreen Business UCSC November 30th 2007 What is “Green” Business? A business](https://img.pdfslide.us/doc/110x75/5ae4309c7f8b9ae74a8ec3df/pptgreen-business-ucsc-directory-of-individual-web-sites-rlipschmigratedee80sucscweb.jpg)