Embed Size (px)
Citation preview
Module 2: Preparing for Capital Venture FinancingFinancial Forecasting Methods
TABLE OF CONTENTS
1.0 FINANCIAL FORECASTING METHODS
1.01 Introduction
2.0 INCOME STATEMENTS
2.01 Revenue/Sales
2.02 Cost of Goods Sold
2.03 Gross Margin
2.04 Operating Expenses
2.05 Operating Profit
2.06 Non-operating Income / (Expenses)
2.07 Profit Before Tax
2.08 Income Taxes
2.09 Net Income
3.0 BALANCE SHEET
3.01 Cash
3.02 Accounts Receivable
3.03 Inventory
3.04 Property
3.05 Plant and Equipment
3.06 Total Assets
3.07 Accounts Payable
3.08 Short Term Debt
3.09 Income Taxes Payable
3.10 Current Portion of Long-Term Debt
3.11 Long-Term Debt
3.12 Shareholder’s Equity
4.0 STATEMENT OF CHANGES IN FINANCIAL POSITION (CASH FLOW)
4.01 Cash Flow for Operations
4.02 Cash Flow from Investing Activities
4.03 Cash Flow from Financing Activities
4.04 Cash Flow Summary
Module 2: Preparing for Capital Venture Financing Financial Forecasting Methods
file:///P|/TME Diploma/TME courses/online_courseware/FIN320_content(tme3113)/Forecast/forecast-01.htm [09/26/2001 11:37:58 AM]
1.0 Financial Forecasting Methods
1. 01 Introduction
A critical component of the venture capital investment process is the preparation of financial projections for the business seeking venture capitalfinancing. These projections normally include a balance sheet, income statement, and cash flow statement or statement of changes in financialposition and normally have a time horizon of 4-7 years, similar to the investment time horizon of most venture capitalists. Typically, theprojections are done on a monthly basis for at least one year so that any seasonal considerations are evident.
The following content will illustrate some commonly used methods for forecasting the typical accounts that appear on financial statements.
Module 2: Preparing for Venture Capital Financing Financial Forecasting Methods
file:///P|/TME Diploma/TME courses/online_courseware/FIN320_content(tme3113)/Forecast/forecast-02.htm [09/26/2001 11:37:59 AM]
2.0 Income Statements
The typical structure of and income statement is a follows:
Revenue
Less: Cost of Goods Sold
Equals: Gross Margin
Less: Operating Expenses
Equals: Operating Profit
Less: Non-operating income/(expenses)
Equals: Profit Before Tax
Less: Income Taxes
Equals: Profit After Tax
Some components of a projected income statement are simply calculated from other components (e.g. revenue less cost of goods sold equals grossmargin). However, other components require a forecasting methodology.
Module 2: Preparing for Venture Capital Financing Financial Forecasting Methods
file:///P|/TME Diploma/TME courses/online_courseware/FIN320_content(tme3113)/Forecast/forecast-03.htm [09/26/2001 11:37:59 AM]
2.01 Revenue/Sales
Forecasting revenue/sales might be as simple as multiplying estimated unit sales by expected unit price for each period. A more sophisticatedmethodology would involve forecasting the total market and the company’s market share in order to determine unit sales. An even more complexmethodology might involve the use of regression analysis to fit a trend line through historical data to forecast future unit sales.
Example
If the projected total market for a product is 1 million units, the expected market share is 20% and the price per unit is $10 theprojected sales for the period are:
Sales = 1.0 million x 0.20 x $10 = $2,000,000
Module 2: Preparing for Venture Capital Financing Financial Forecasting Methods
file:///P|/TME Diploma/TME courses/online_courseware/FIN320_content(tme3113)/Forecast/forecast-04.htm [09/26/2001 11:38:00 AM]
2.02 Cost of Goods Sold
Cost of goods sold is often projected as a percentage of sales based on historical experience and/or expected direct unit production costs.
Example
If 200,000 units are expected to be sold and the expected direct cost per unit is $5, projected cost of goods sold will be:
Cost of goods sold = 200,000 x $5 = $1,000,000
Similarly, if projected sales are $2,000,000 and cost of goods sold is expected to average 60% of sales, then projected cost of goodssold will be:
Cost of goods sold = $2,000,000 x 0.60 = $1,200,000
Module 2: Preparing for Venture Capital Financing Financial Forecasting Methods
file:///P|/TME Diploma/TME courses/online_courseware/FIN320_content(tme3113)/Forecast/forecast-05.htm [09/26/2001 11:38:00 AM]
2.03 Gross Margin
Gross margin is projected by subtracting projected cost of goods from projected sales.
Example
If projected sales are $2,000,000 and cost of goods sold is expected to average 60% of sales, then projected gross margin will be:
Gross Margin = $2,000,000 – ($2,000,000 x 0.60) = $800,000
Module 2: Preparing for Venture Capital Financing Financial Forecasting Methods
file:///P|/TME Diploma/TME courses/online_courseware/FIN320_content(tme3113)/Forecast/forecast-06.htm [09/26/2001 11:38:00 AM]
2.04 Operating Expenses
The first step in forecasting operating expenses is to identify the categories of expense that are relevant to the business (e.g. salaries, maintenance,depreciation, utilities, marketing, rent, etc.).
Some expense categories might be projected as a percentage of sales based on historical experience and or budget targets. Others, such as utilities,might be based on an annual percentage increase. Depreciation expenses can be determined from depreciation schedules for existing assets andassets to be acquired in the future. Future rental expenses might be projected based on existing rental or lease contracts.
Example
If sales are projected to be $2,000,000 and marketing expenses are budgeted to be 5% of sales, then marketing expenses are projectedto be $2,000,000 x 0.05 = $100,000.
If utility expenses last year were $50,000 and a 1% increase is expected each year, then projected utility expenses will be $50,500 nextyear and $51,005 the year after.
If depreciation expenses next year from depreciation schedules are $67,000 for plant and $23,000 for equipment, total depreciationexpense is projected to be $90,000.
Module 2: Preparing for Venture Capital Financing Financial Forecasting Methods
file:///P|/TME Diploma/TME courses/online_courseware/FIN320_content(tme3113)/Forecast/forecast-07.htm [09/26/2001 11:38:00 AM]
2.05 Operating Profit
Projected operating profit is calculated by subtracting projected operating expenses from projected gross margin.
Example
If the projected gross margin for the period is $800,000 and the sum of all categories of operating expense for the period is $570,000,then projected operating profit is $230,000.
Module 2: Preparing for Venture Capital Financing Financial Forecasting Methods
file:///P|/TME Diploma/TME courses/online_courseware/FIN320_content(tme3113)/Forecast/forecast-08.htm [09/26/2001 11:38:01 AM]
2.06 Non-operating Income / (Expenses)
Projected non-operating expenses might include interest on debt if the company has or plans to borrow money, interest income earned oninvestments and/or projected gains/(losses) that might arise from planned future disposal of assets.
Interest expense can be projected from loan amortization schedules for existing and future loans. It is often assumed that assets will be disposed ofin the future at their net book value. Under this simplifying assumption there will be no projected gains or losses on disposal of assets.
Example
If interest expense on existing long term debt will be $22,000 in the next twelve months (from loan amortization schedules) andinterest earned on short-term investments of surplus cash in the next year is expected to be $8,000, then projected non-operatingincome/(expense) will be ($14,000).
Module 2: Preparing for Venture Capital Financing Financial Forecasting Methods
file:///P|/TME Diploma/TME courses/online_courseware/FIN320_content(tme3113)/Forecast/forecast-09.htm [09/26/2001 11:38:01 AM]
2.07 Profit Before Tax
Projected profit before tax is calculated by subtracting non-operating income/(expenses) from projected operating profit.
Example
If the projected operating profit for next year is $230,000 and projected non-operating income/(expense) is ($14,000), then profitbefore tax will be $216,000.
Module 2: Preparing for Venture Capital Financing Financial Forecasting Methods
file:///P|/TME Diploma/TME courses/online_courseware/FIN320_content(tme3113)/Forecast/forecast-10.htm [09/26/2001 11:38:01 AM]
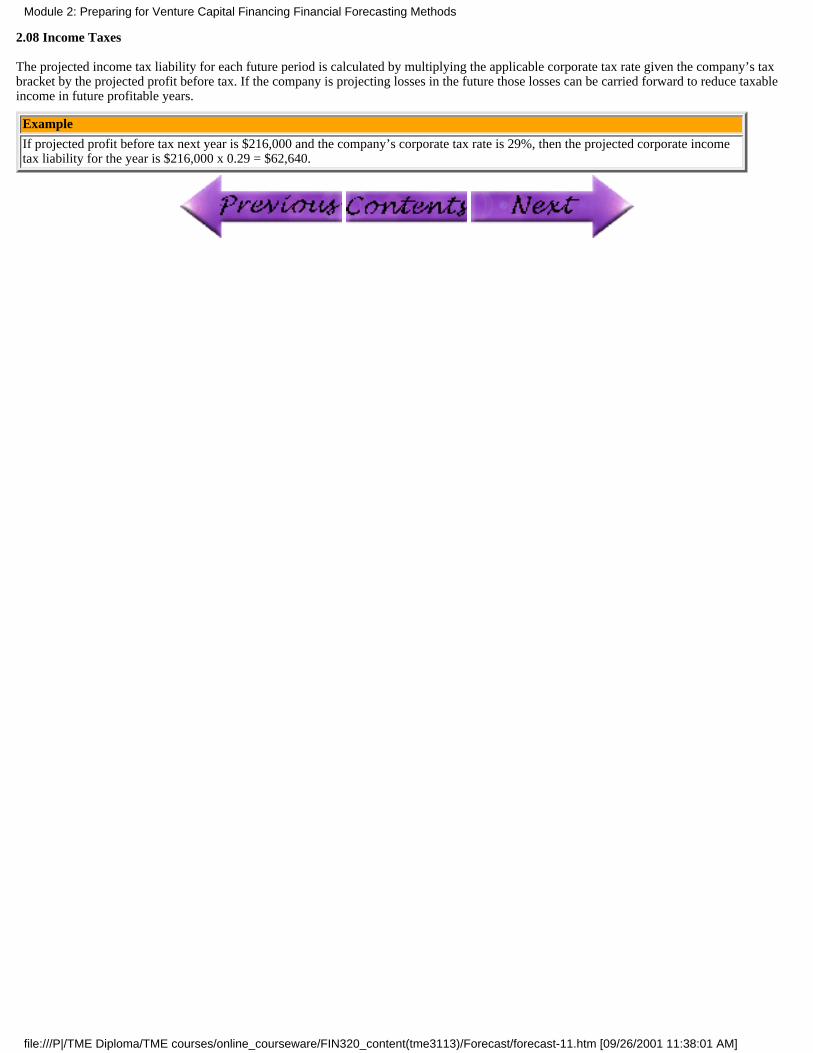
2.08 Income Taxes
The projected income tax liability for each future period is calculated by multiplying the applicable corporate tax rate given the company’s taxbracket by the projected profit before tax. If the company is projecting losses in the future those losses can be carried forward to reduce taxableincome in future profitable years.
Example
If projected profit before tax next year is $216,000 and the company’s corporate tax rate is 29%, then the projected corporate incometax liability for the year is $216,000 x 0.29 = $62,640.
Module 2: Preparing for Venture Capital Financing Financial Forecasting Methods
file:///P|/TME Diploma/TME courses/online_courseware/FIN320_content(tme3113)/Forecast/forecast-11.htm [09/26/2001 11:38:01 AM]
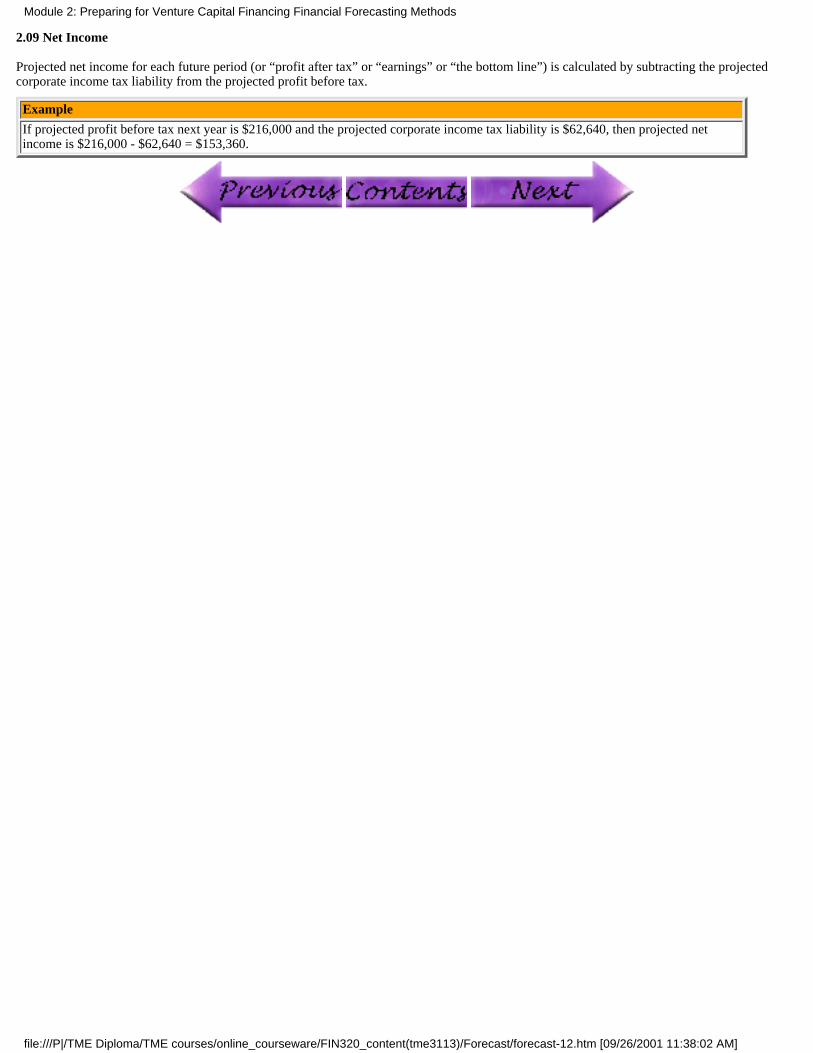
2.09 Net Income
Projected net income for each future period (or “profit after tax” or “earnings” or “the bottom line”) is calculated by subtracting the projectedcorporate income tax liability from the projected profit before tax.
Example
If projected profit before tax next year is $216,000 and the projected corporate income tax liability is $62,640, then projected netincome is $216,000 - $62,640 = $153,360.
Module 2: Preparing for Venture Capital Financing Financial Forecasting Methods
file:///P|/TME Diploma/TME courses/online_courseware/FIN320_content(tme3113)/Forecast/forecast-12.htm [09/26/2001 11:38:02 AM]
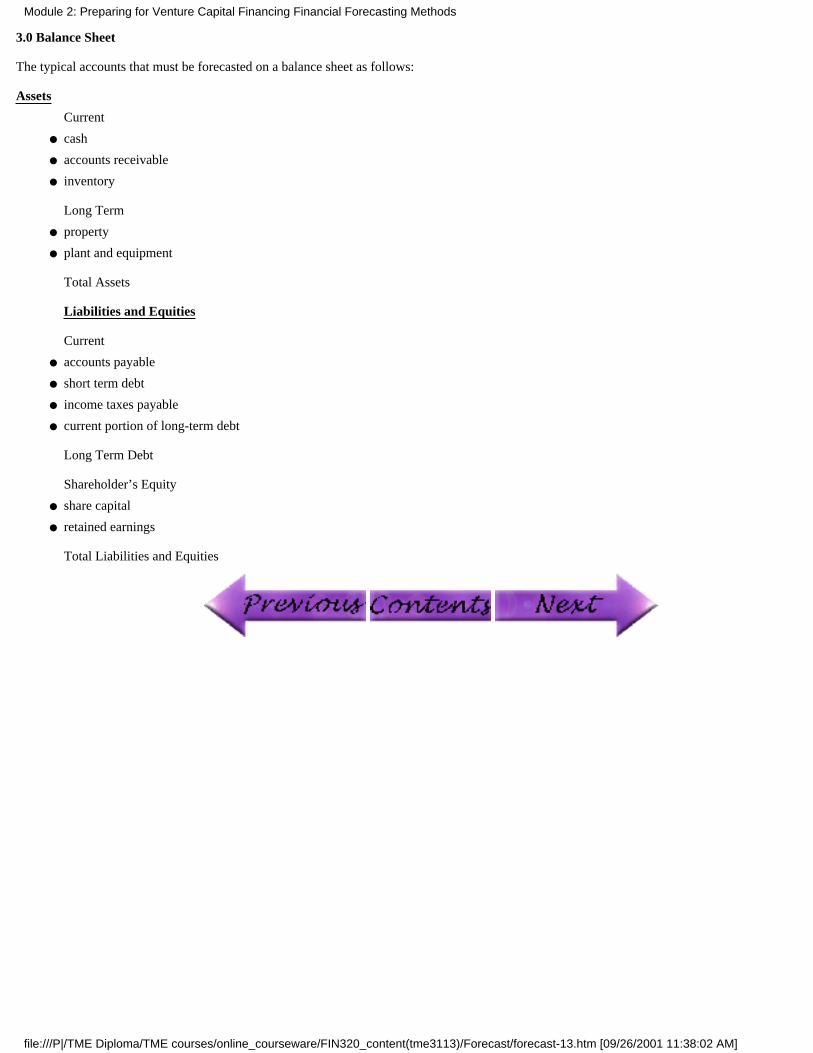
3.0 Balance Sheet
The typical accounts that must be forecasted on a balance sheet as follows:
Assets
Current
cash●
accounts receivable●
inventory
Long Term
●
property●
plant and equipment
Total Assets
Liabilities and Equities
Current
●
accounts payable●
short term debt●
income taxes payable●
current portion of long-term debt
Long Term Debt
Shareholder’s Equity
●
share capital●
retained earnings
Total Liabilities and Equities
●
Module 2: Preparing for Venture Capital Financing Financial Forecasting Methods
file:///P|/TME Diploma/TME courses/online_courseware/FIN320_content(tme3113)/Forecast/forecast-13.htm [09/26/2001 11:38:02 AM]
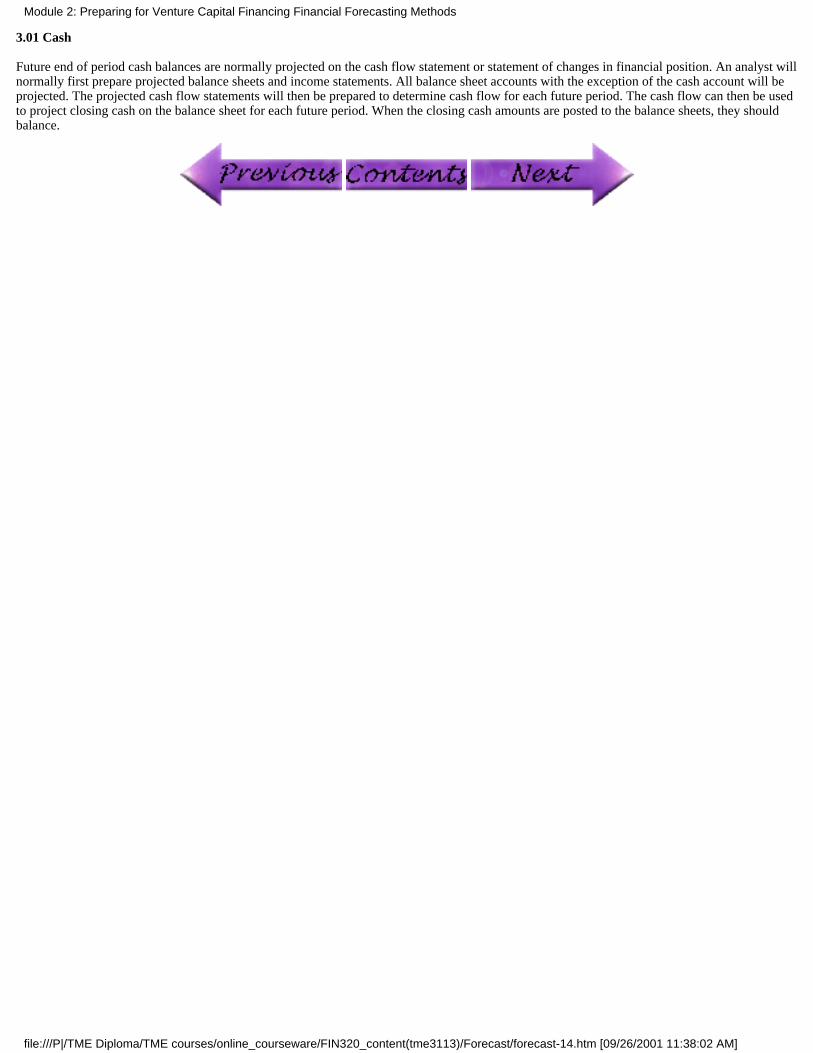
3.01 Cash
Future end of period cash balances are normally projected on the cash flow statement or statement of changes in financial position. An analyst willnormally first prepare projected balance sheets and income statements. All balance sheet accounts with the exception of the cash account will beprojected. The projected cash flow statements will then be prepared to determine cash flow for each future period. The cash flow can then be usedto project closing cash on the balance sheet for each future period. When the closing cash amounts are posted to the balance sheets, they shouldbalance.
Module 2: Preparing for Venture Capital Financing Financial Forecasting Methods
file:///P|/TME Diploma/TME courses/online_courseware/FIN320_content(tme3113)/Forecast/forecast-14.htm [09/26/2001 11:38:02 AM]
3.02 Accounts Receivable
Once the sales forecast has been prepared on the income statement, assumptions can be made about when each month’s sales will be collected. Forexample, if the business extends credit to its customers for up to 90 days, it might be assumed that 25% of sales are collected in the same monththat they occur, 50% are collected in the next month and the remaining 25% in the third month. The appropriate percentages for each business willvary depending upon such considerations as experience in collecting receivables and/or credit policy.
Module 2: Preparing for Venture Capital Financing Financial Forecasting Methods
file:///P|/TME Diploma/TME courses/online_courseware/FIN320_content(tme3113)/Forecast/forecast-15.htm [09/26/2001 11:38:02 AM]
3.03 Inventory
Closing or ending inventory for each future balance sheet date is normally projected using the following equation:
Closing Inventory = Opening Inventory + Additions to Inventory - Cost of Goods Sold
Opening Inventory is the closing inventory from the previous period.
Additions to inventory such as raw materials, work-in-progress and finished goods might be projected as a percentage of a future month’s salesdepending upon the lead time necessary from ordering raw material to final sale of finished goods.
Projected cost of goods sold can be obtained from the forecast income statements.
Example
Opening inventory at the beginning of the forecast period is $75,000. Additions to inventory during the first forecast month will be50% of projected sales for the third forecast month estimated to be $300,000. Cost of goods sold for the first forecast month isprojected to be $60,000. What is closing inventory at the end of the first forecast month?
Closing Inventory = Opening Inventory + Additions to Inventory - Cost of Goods Sold Closing Inventory = $75,000 + 0.5($300,000) -$60,000 Closing Inventory = $165,000
Module 2: Preparing for Venture Capital Financing Financial Forecasting Methods
file:///P|/TME Diploma/TME courses/online_courseware/FIN320_content(tme3113)/Forecast/forecast-16.htm [09/26/2001 11:38:03 AM]
3.04 Property
Any existing property owned by a company will be carried forward on projected future balance sheets at the historical cost of the land. If landacquisitions are planned in the future the future acquisition cost will have to be estimated and added to the value of any existing property from thatpoint forward.
Example
A company currently owns land that it purchased for $60,000 five years ago. It plans to sell this land soon for an estimated $90,000and acquire a new property within this fiscal year at an estimated cost of $150,000. What is the projected balance sheet value forproperty at the end of the next fiscal year?
The projected balance sheet value for property at the end of the next fiscal year is $150,000. The value showing for the originalproperty will be reduced to zero when it is sold. The new property will be added to the balance sheet at $150,000. The gain of $30,000on the sale ($90,000 - $60,000) will be recorded as extraordinary income on the projected income statement.
Module 2: Preparing for Venture Capital Financing Financial Forecasting Methods
file:///P|/TME Diploma/TME courses/online_courseware/FIN320_content(tme3113)/Forecast/forecast-17.htm [09/26/2001 11:38:03 AM]
3.05 Plant and Equipment
Similar to property, plant and equipment is added to the balance sheet at the cost paid to acquire it. However, unlike property, plant and equipmentis depreciated using an acceptable depreciation accounting method. Future depreciation expenses associated with existing assets can be obtainedfrom depreciation schedules for each asset. Depreciation schedules can also be prepared for planned future asset acquisitions using estimatedacquisition costs.
For each balance sheet date, the “net fixed assets” is calculated by subtracting accumulated depreciation for all assets owned at that point in time(from the depreciation schedules) from the aggregated actual (for existing assets) or estimated (for planned future asset acquisitions) costs ofacquisition.
Depreciation Methods
When preparing financial statements for management purposes, accountants are free to use the depreciation method that best approximates theactual rate of deterioration of the value of the asset.
However, when preparing financial statements for tax reporting purposes, accountants must use the depreciation methods set out in the ModifiedAccelerated Cost Recovery System (MACRS) of the Tax Reform Act of 1986.
The three methods allowed under MACRS are:
Straight-line method1.
200% Declining balance method2.
150% Declining balance method3.
The choice of method depends on the depreciable life of the asset. MACRS established a number of asset life categories with sample asset typesfor each category. The straight-line method may be used for all asset categories. For asset categories with lives of 10 years or less, the 200%declining balance method may be used instead of straight line. For 15 and 20-year depreciable life assets, the 150% declining method may be usedinstead of straight line.
For all depreciation methods, depreciation charges in the year of acquisition of an asset are calculated as if the asset were acquired on July 1(mid-year convention).
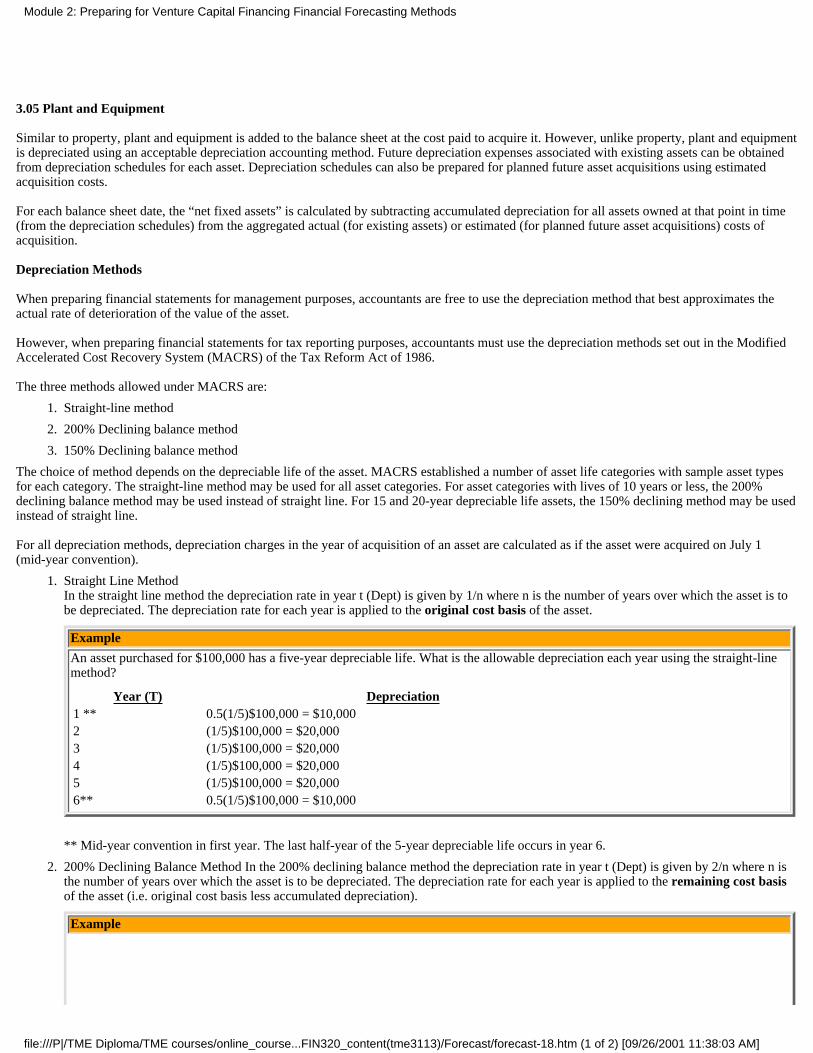
Straight Line MethodIn the straight line method the depreciation rate in year t (Dept) is given by 1/n where n is the number of years over which the asset is tobe depreciated. The depreciation rate for each year is applied to the original cost basis of the asset.
Example
An asset purchased for $100,000 has a five-year depreciable life. What is the allowable depreciation each year using the straight-linemethod?
Year (T) Depreciation1 ** 0.5(1/5)$100,000 = $10,0002 (1/5)$100,000 = $20,0003 (1/5)$100,000 = $20,0004 (1/5)$100,000 = $20,0005 (1/5)$100,000 = $20,0006** 0.5(1/5)$100,000 = $10,000
** Mid-year convention in first year. The last half-year of the 5-year depreciable life occurs in year 6.
1.
200% Declining Balance Method In the 200% declining balance method the depreciation rate in year t (Dept) is given by 2/n where n isthe number of years over which the asset is to be depreciated. The depreciation rate for each year is applied to the remaining cost basisof the asset (i.e. original cost basis less accumulated depreciation).
Example
2.
Module 2: Preparing for Venture Capital Financing Financial Forecasting Methods
file:///P|/TME Diploma/TME courses/online_course...FIN320_content(tme3113)/Forecast/forecast-18.htm (1 of 2) [09/26/2001 11:38:03 AM]
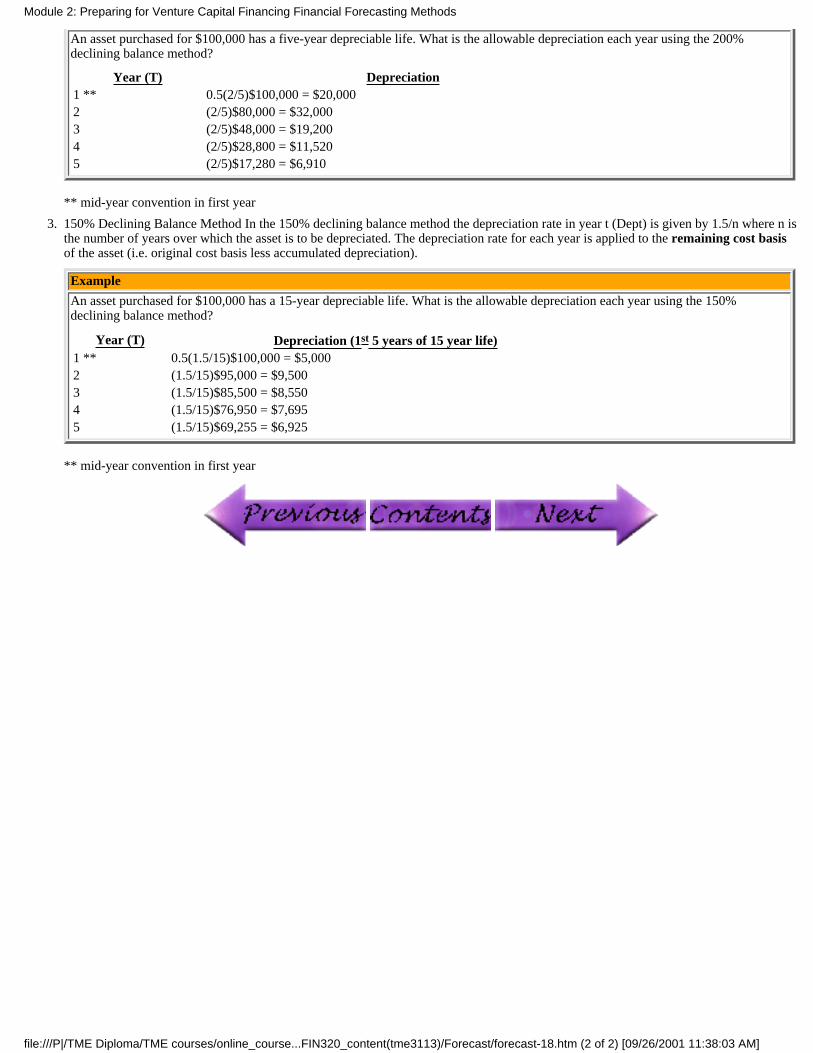
An asset purchased for $100,000 has a five-year depreciable life. What is the allowable depreciation each year using the 200%declining balance method?
Year (T) Depreciation1 ** 0.5(2/5)$100,000 = $20,0002 (2/5)$80,000 = $32,0003 (2/5)$48,000 = $19,2004 (2/5)$28,800 = $11,5205 (2/5)$17,280 = $6,910
** mid-year convention in first year
150% Declining Balance Method In the 150% declining balance method the depreciation rate in year t (Dept) is given by 1.5/n where n isthe number of years over which the asset is to be depreciated. The depreciation rate for each year is applied to the remaining cost basisof the asset (i.e. original cost basis less accumulated depreciation).
Example
An asset purchased for $100,000 has a 15-year depreciable life. What is the allowable depreciation each year using the 150%declining balance method?
Year (T) Depreciation (1st 5 years of 15 year life)1 ** 0.5(1.5/15)$100,000 = $5,0002 (1.5/15)$95,000 = $9,5003 (1.5/15)$85,500 = $8,5504 (1.5/15)$76,950 = $7,6955 (1.5/15)$69,255 = $6,925
** mid-year convention in first year
3.
Module 2: Preparing for Venture Capital Financing Financial Forecasting Methods
file:///P|/TME Diploma/TME courses/online_course...FIN320_content(tme3113)/Forecast/forecast-18.htm (2 of 2) [09/26/2001 11:38:03 AM]
3.06 Total Assets
Projected total assets are calculated by summing total current assets, property and net plant and equipment (acquisition cost less accumulateddepreciation).
This completes the asset side of the balance sheet.
Module 2: Preparing for Venture Capital Financing Financial Forecasting Methods
file:///P|/TME Diploma/TME courses/online_courseware/FIN320_content(tme3113)/Forecast/forecast-18a.htm [09/26/2001 11:38:03 AM]
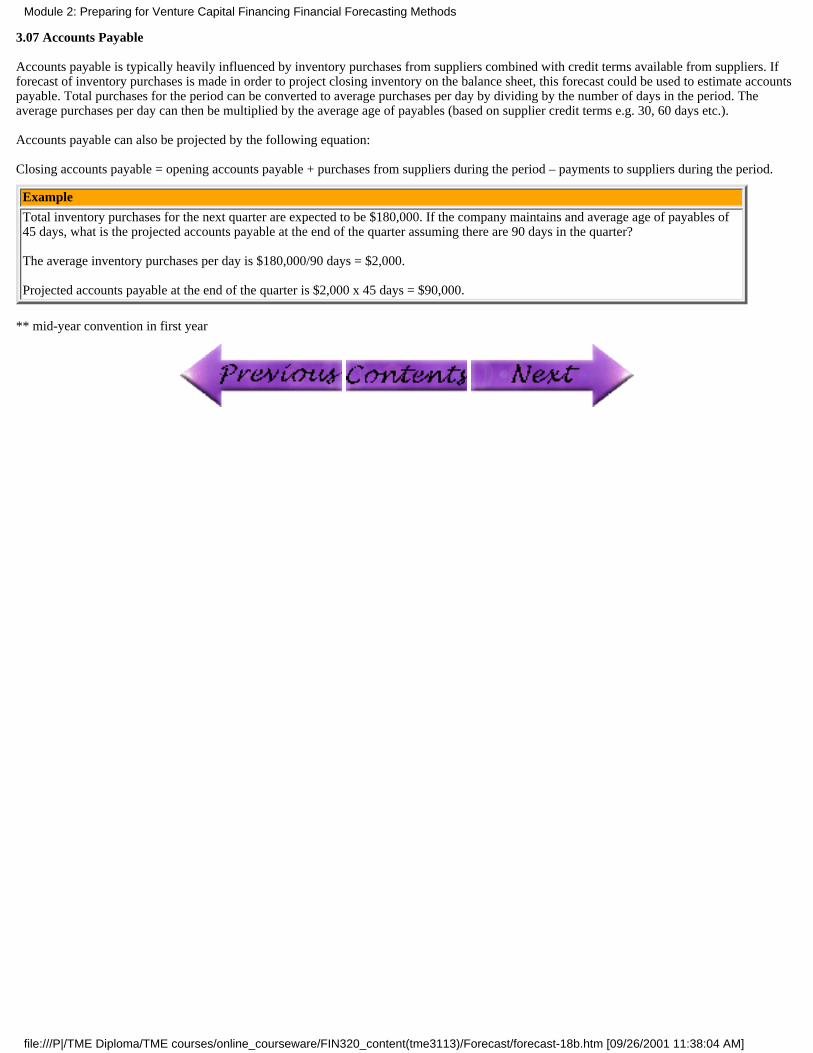
3.07 Accounts Payable
Accounts payable is typically heavily influenced by inventory purchases from suppliers combined with credit terms available from suppliers. Ifforecast of inventory purchases is made in order to project closing inventory on the balance sheet, this forecast could be used to estimate accountspayable. Total purchases for the period can be converted to average purchases per day by dividing by the number of days in the period. Theaverage purchases per day can then be multiplied by the average age of payables (based on supplier credit terms e.g. 30, 60 days etc.).
Accounts payable can also be projected by the following equation:
Closing accounts payable = opening accounts payable + purchases from suppliers during the period – payments to suppliers during the period.
Example
Total inventory purchases for the next quarter are expected to be $180,000. If the company maintains and average age of payables of45 days, what is the projected accounts payable at the end of the quarter assuming there are 90 days in the quarter?
The average inventory purchases per day is $180,000/90 days = $2,000.
Projected accounts payable at the end of the quarter is $2,000 x 45 days = $90,000.
** mid-year convention in first year
Module 2: Preparing for Venture Capital Financing Financial Forecasting Methods
file:///P|/TME Diploma/TME courses/online_courseware/FIN320_content(tme3113)/Forecast/forecast-18b.htm [09/26/2001 11:38:04 AM]
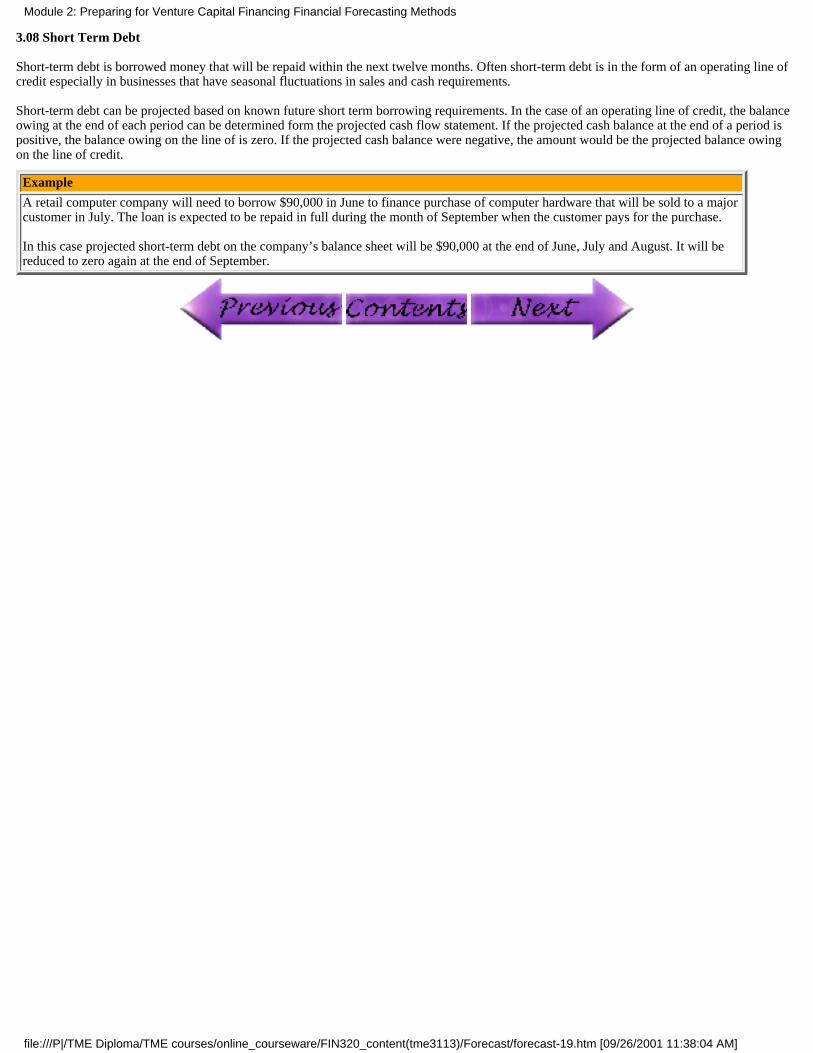
3.08 Short Term Debt
Short-term debt is borrowed money that will be repaid within the next twelve months. Often short-term debt is in the form of an operating line ofcredit especially in businesses that have seasonal fluctuations in sales and cash requirements.
Short-term debt can be projected based on known future short term borrowing requirements. In the case of an operating line of credit, the balanceowing at the end of each period can be determined form the projected cash flow statement. If the projected cash balance at the end of a period ispositive, the balance owing on the line of is zero. If the projected cash balance were negative, the amount would be the projected balance owingon the line of credit.
Example
A retail computer company will need to borrow $90,000 in June to finance purchase of computer hardware that will be sold to a majorcustomer in July. The loan is expected to be repaid in full during the month of September when the customer pays for the purchase.
In this case projected short-term debt on the company’s balance sheet will be $90,000 at the end of June, July and August. It will bereduced to zero again at the end of September.
Module 2: Preparing for Venture Capital Financing Financial Forecasting Methods
file:///P|/TME Diploma/TME courses/online_courseware/FIN320_content(tme3113)/Forecast/forecast-19.htm [09/26/2001 11:38:04 AM]
3.09 Income Taxes Payable
Projected income taxes payable can be determined from the projected income statement. It should be noted that the income taxes payable for afiscal year would remain on the balance sheet until the company files its tax return and pays the taxes owing. This could be as much as 6 monthsafter the end of the fiscal year.
Example
If a company has projected net income next year of $300,000, is in a 30% income tax bracket, has a fiscal year end of December31,and pays its income taxes in July of each year, then the projected income tax liability will be $90,000 on the December 31 balancesheet and remain the same until the end of June the following year.
Module 2: Preparing for Venture Capital Financing Financial Forecasting Methods
file:///P|/TME Diploma/TME courses/online_courseware/FIN320_content(tme3113)/Forecast/forecast-20.htm [09/26/2001 11:38:04 AM]
3.10 Current Portion of Long-Term Debt
Current portion of long term debt is the amount of principal that will be paid on long term debt (e.g. a mortgage) during the twelve monthsfollowing any give balance sheet date. This can be determined from loan amortization schedules for existing and future long-term debt. Theamortization schedules segregate loan payments into principal and interest portions.
Example
If a company is making constant principal payments of $2,000 per month on a 5-year $120,000 loan, the projected current portion ofloan term debt will be $24,000 on each monthly balance sheet until the last year of the loan where the projected liability will declineby $2,000 each month until it reaches zero when the loan is paid in full.
Module 2: Preparing for Venture Capital Financing Financial Forecasting Methods
file:///P|/TME Diploma/TME courses/online_courseware/FIN320_content(tme3113)/Forecast/forecast-21.htm [09/26/2001 11:38:05 AM]
3.11 Long-Term Debt
Long-term debt is principal owing on long-term loans that will be paid beyond the next twelve months after each balance sheet date. Again theprojected long-term debt liability can be determined from loan amortization schedules for existing and planned future borrowings.
Example
If a company is making constant principal payments of $2,000 per month on a 5 year $120,000 loan, the projected long term debt willbe $96,000 ($120,000 less $24,000 current portion) after the first payment, declining by $2,000 per month each month thereafter untilthe end of the of the fourth year where long term debt will be zero and all remaining principal will be current portion of long-termdebt.
Module 2: Preparing for Venture Capital Financing Financial Forecasting Methods
file:///P|/TME Diploma/TME courses/online_courseware/FIN320_content(tme3113)/Forecast/forecast-22.htm [09/26/2001 11:38:05 AM]
3.12 Shareholder’s Equity
Shareholder’s equity consists of share capital plus retained earnings.
Projected share capital will be based on any existing share capital that has been provided by investors in the company and any planned futureequity infusions.
Retained earnings can be projected using the following equation:
Closing retained earnings = opening retained earnings + net income for the period – dividends paid to shareholders
Projected net income can be obtained from the projected income statement. Projected dividend payments, if applicable, are often forecast as apercentage of net income.
Example
If a company has closing retained earnings this fiscal year of $375,000, has a projected net income next year of $500,000 and plans topay dividends to shareholders equivalent to 20% of annual earnings, then projected retained earnings at the end of next year will be:
Closing retained earnings = $375,000 + $500,000 - 0.20($500,000) = $775,000
Module 2: Preparing for Venture Capital Financing Financial Forecasting Methods
file:///P|/TME Diploma/TME courses/online_courseware/FIN320_content(tme3113)/Forecast/forecast-23.htm [09/26/2001 11:38:05 AM]
4.0 Statement of Changes in Financial Position (Cash Flow)
A projected statement of changes in financial position draws upon the projected income statement and balance sheet to produce a cash flowprojection.
Most cash flow statements are structured to display three components of cash flow:
cash flow from operations1.
cash flow from investing activities2.
cash flow from financing activities3.
Module 2: Preparing for Venture Capital Financing Financial Forecasting Methods
file:///P|/TME Diploma/TME courses/online_courseware/FIN320_content(tme3113)/Forecast/forecast-24.htm [09/26/2001 11:38:05 AM]
4.01 Cash Flow for Operations
A projection of cash flow from operations begins with the projection of net income for the forecast period, which can be obtained from the projectedincome statement.
In order to reconcile net income to cash, one of the first adjustments is to add back non-cash expenses such as depreciation. Depreciation expensesreduce income but they do not result in a cash outflow.
Projected changes in working capital accounts also affect cash flow. The projected changes in working capital accounts during the forecast period canbe obtained from the projected balance sheets.
If current asset accounts such as accounts receivable and inventory are projected to increase during the forecast period of the income statement, thenthis is a negative adjustment to cash flow and vice versa. Simply put, if the income statement is projecting an increase in sales of $100,000 for theperiod and accounts receivable is expected to increase by $25,000 during the same period, then cash flow would be $25,000 less than a scenariowhere all sales would be collected during the period.
If current liability accounts such as accounts payable, short term debt and income taxes payable are projected to increase during the period, this is apositive contribution to cash flow from operations and vice versa. To illustrate, if accounts payable is projected to increase, this means that cash flowwill be higher than a scenario where suppliers are paid in full. Conversely, if accounts payable is projected to decrease during the period this meansthat cash will be used to pay down trade credit.
To summarize, projected cash flow from operations is:
Projected net incomePlus: Projected non-cash expenses (depreciation)Less: Projected increases in current assets other than cashPlus: Projected decreases in current assets other than cashPlus: Projected increases in current liabilitiesLess: Projected decreases in current liabilities
Example
A company is projecting a net income next year of $275,000. Accounts receivable is expected to increase by $75,000 whereas accounts payable isexpected to decrease by $35,000. Inventory is projected to decrease by $40,000 and income taxes payable will increase by $60,000. Depreciationexpense during the year is projected to be $32,000. What is the projected cash flow from operations?
Cash Flow from Operation is $297,000:
Projected net income = $275,0000Plus: Projected non-cash expenses (depreciation) = $32,000Less: Projected increases in current assets other than cash = ($75,000)Plus: Projected decreases in current assets other than cash = $40,000Plus: Projected increases in current liabilities = $60,000Less: Projected decreases in current liabilities = ($35,000)
Module 2: Preparing for Venture Capital Financing Financial Forecasting Methods
file:///P|/TME Diploma/TME courses/online_courseware/FIN320_content(tme3113)/Forecast/forecast-25.htm [09/26/2001 11:38:06 AM]
4.02 Cash Flow from Investing Activities
Investing activities include acquisition or divestiture of fixed assets such as property plant and equipment and/or other long term assets.
Projected acquisitions of fixed assets represent a negative cash flow during the period in which they are expected to occur.
Conversely, projected divestitures of fixed assets represent a positive cash flow during the period in which they are expected to occur.
Projected acquisitions/divestitures of fixed assets can be obtained from projected balance sheets.
Example
The company plans to replace existing production equipment next year with modern equipment at an expected cost of $375,000. The existingequipment is expected to be sold for $35,000. What is projected cash flow from investing activities?
Cash flow from investing activities = ($375,000) + $35,000 = ($340,000)
Module 2: Preparing for Venture Capital Financing Financial Forecasting Methods
file:///P|/TME Diploma/TME courses/online_courseware/FIN320_content(tme3113)/Forecast/forecast-26.htm [09/26/2001 11:38:06 AM]
4.03 Cash Flow from Financing Activities
Financing activities include borrowing funds and subsequent re-payment of debt, raising share capital through the issue of shares and the payment ofdividends to shareholders. Projected increases in borrowing are a positive cash flow whereas the projected re-payment of debt is a negative cash flow.
A projected infusion of equity capital through the sale of shares to investors is a positive cash flow whereas when a company is projected tore-purchase shares from investors this is a negative cash flow.
Payment of dividends to shareholders is a negative cash flow.
Projected increases and decreases in debt and share capital can be obtained from the projected balance sheets.
Example
The company plans to borrow $200,000 at 7% annual interest to partially finance the $375,000 fixed asset acquisition. The loan will be paid backover 5 years with equal annual principal payments. The owners of the company will also invest a further $50,000 in the business to maintain astrong balance sheet. No dividends will be paid next year. What is projected cash flow from financing activities next year? Cash flow fromfinancing activities = $200,000 (borrowed funds) – ($40,000 ) (principal payment) + $50,000 (shareholder investment) = $210,000
Module 2: Preparing for Venture Capital Financing Financial Forecasting Methods
file:///P|/TME Diploma/TME courses/online_courseware/FIN320_content(tme3113)/Forecast/forecast-27.htm [09/26/2001 11:38:06 AM]
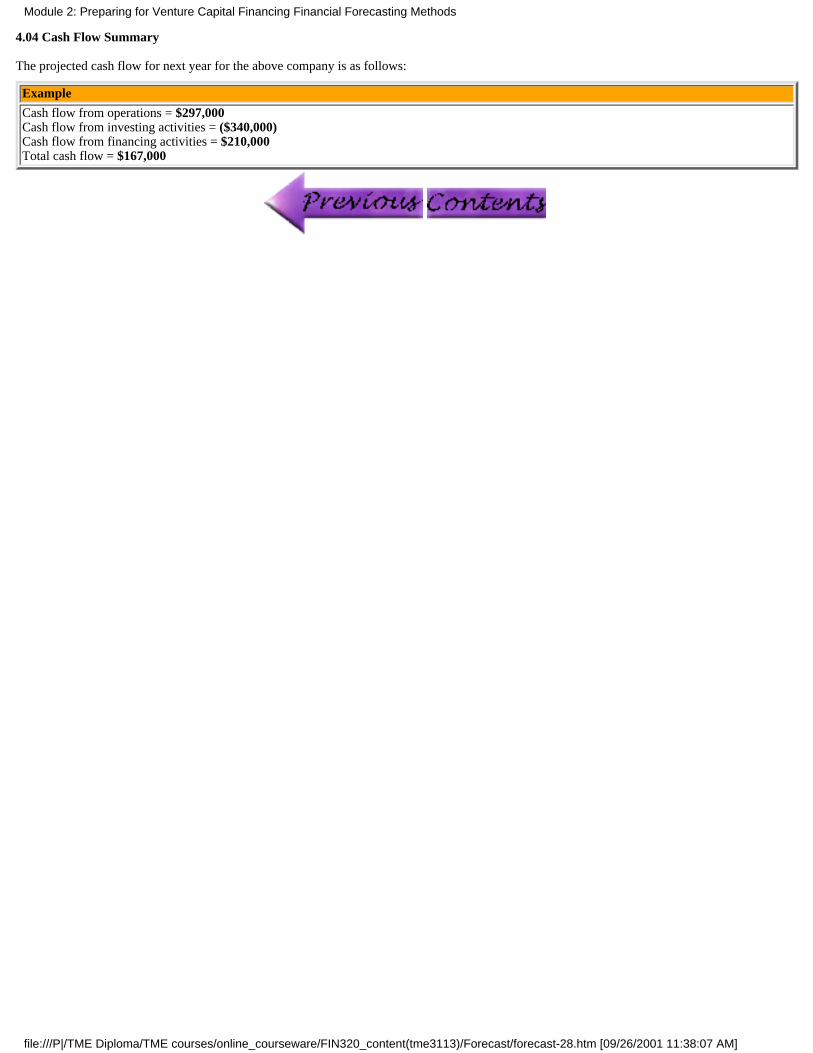
4.04 Cash Flow Summary
The projected cash flow for next year for the above company is as follows:
Example
Cash flow from operations = $297,000Cash flow from investing activities = ($340,000)Cash flow from financing activities = $210,000Total cash flow = $167,000
Module 2: Preparing for Venture Capital Financing Financial Forecasting Methods
file:///P|/TME Diploma/TME courses/online_courseware/FIN320_content(tme3113)/Forecast/forecast-28.htm [09/26/2001 11:38:07 AM]


![Venture Capital Financing (1) [Autosaved]](https://img.pdfslide.us/doc/110x75/55cf859b550346484b8fe792/venture-capital-financing-1-autosaved.jpg)


![Venture Capital Financing in India[1]](https://img.pdfslide.us/doc/110x75/577d25051a28ab4e1e9debf0/venture-capital-financing-in-india1.jpg)