Embed Size (px)
Citation preview

Module 15
Cost-Volume-Profit Analysis and Planning

Profitability Analysis
Involves examining the relationships among revenues, costs, and profits
Widely used in the economic evaluation of existing or proposed products or services
Performed before decisions are finalized • Selling prices
• Behavior of activity cost drivers
What you need to understand to
perform profitability analysis
What you need to understand to
perform profitability analysis

CVP Assumptions
1. All costs are classified as fixed or variable.
2. The total cost function is linear within the relevant range.
3. The total revenue function is linear within the relevant range.
4. The analysis is for a single product, or the sales mix of multiple products is constant.
5. There is only one activity cost driver: unit or dollar sales volume.
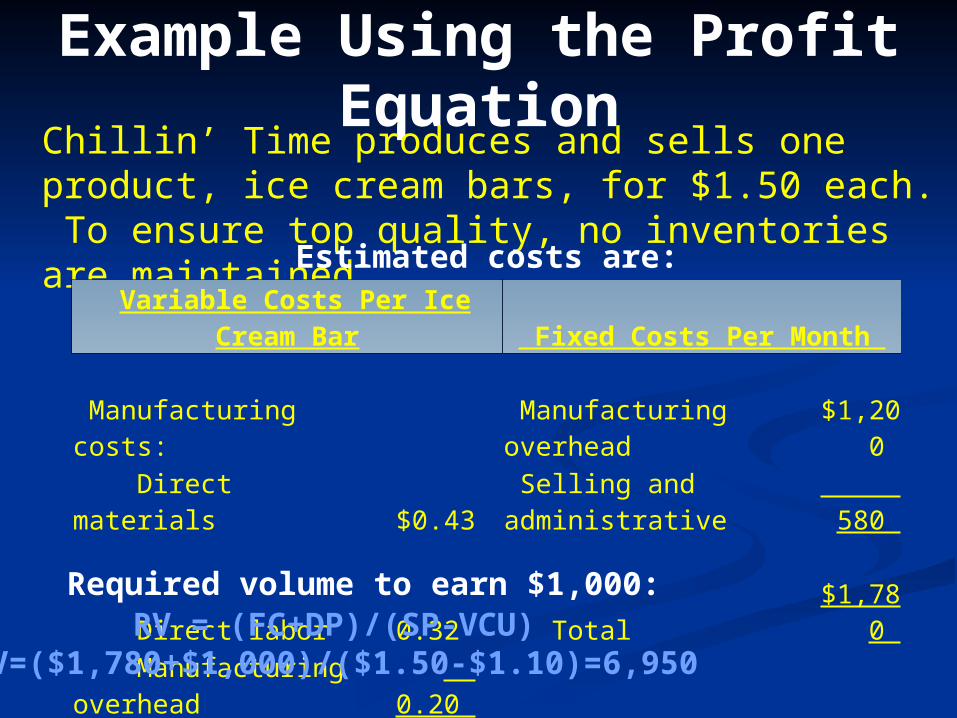
Example Using the Profit Equation
Chillin’ Time produces and sells one product, ice cream bars, for $1.50 each. To ensure top quality, no inventories are maintained.
Variable Costs Per Ice Cream Bar Fixed Costs Per Month Manufacturing costs: Manufacturing overhead $1,200 Direct materials $0.43 Selling and administrative 580 Direct labor 0.32 Total $1,780 Manufacturing overhead 0.20 $0.95 Selling and administrative 0.15 Total $1.10
RV = (FC+DP)/(SP-VCU)RV=($1,780+$1,000)/($1.50-$1.10)=6,950
Estimated costs are:
Required volume to earn $1,000:
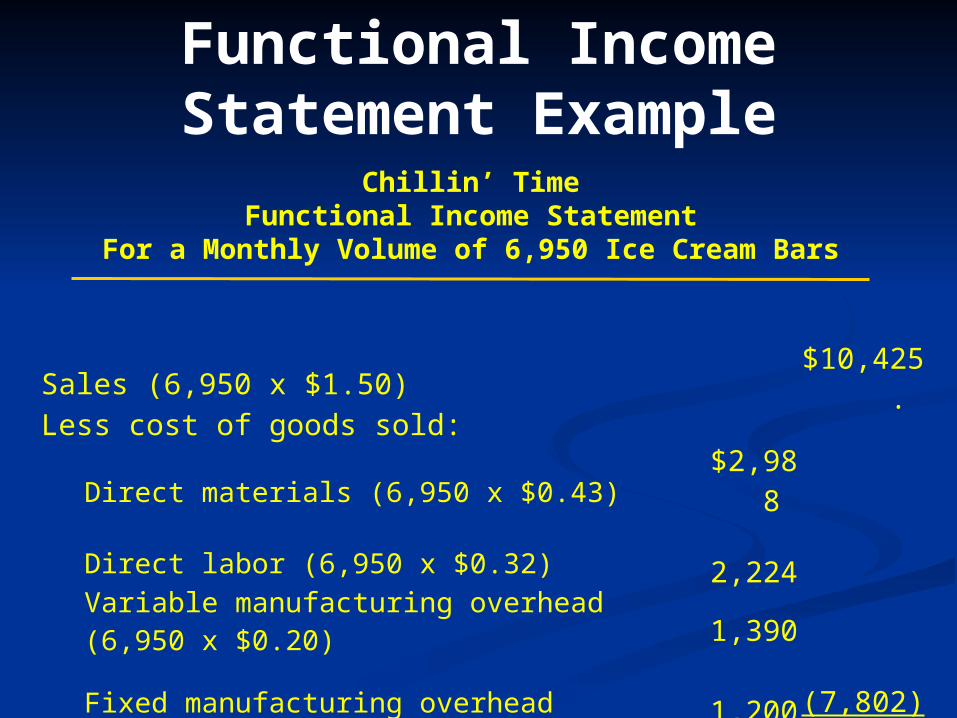
Functional Income Statement Example
Chillin’ TimeFunctional Income Statement
For a Monthly Volume of 6,950 Ice Cream Bars
Sales (6,950 x $1.50) $10,425. Less cost of goods sold:
Direct materials (6,950 x $0.43) $2,988 Direct labor (6,950 x $0.32) 2,224 Variable manufacturing overhead (6,950 x $0.20) 1,390 Fixed manufacturing overhead 1,200 (7,802)
Gross margin 2,623. Less other expenses:
Variable selling and administrative (6,950 x $0.15) 1,043 Fixed selling and administrative 580 (1,623)
Profit $ 1,000.
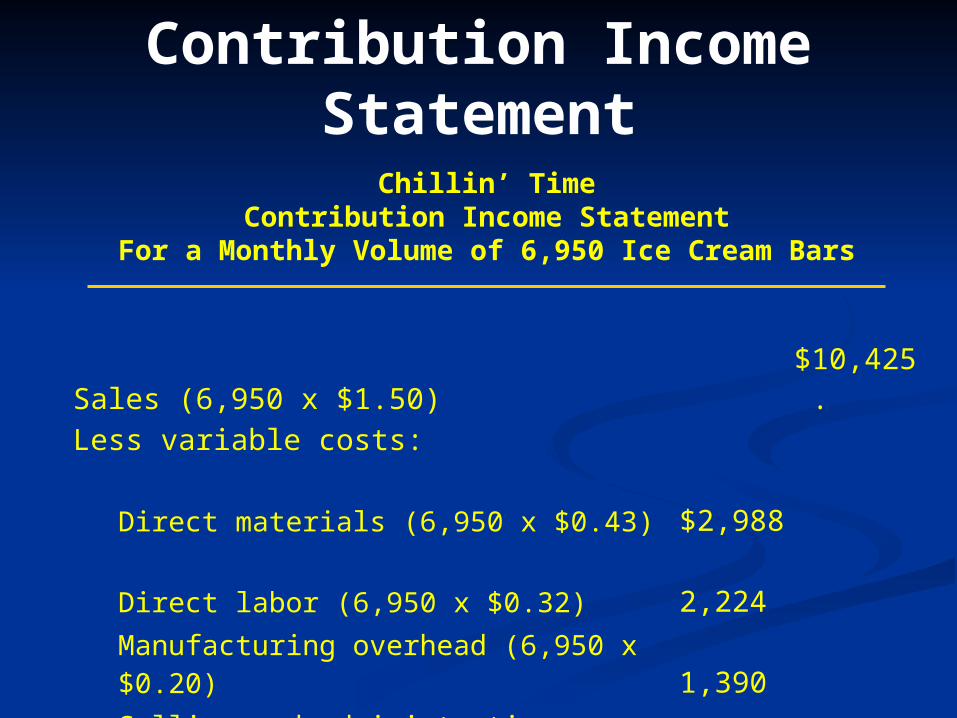
Contribution Income Statement
Sales (6,950 x $1.50) $10,425.
Less variable costs:
Direct materials (6,950 x $0.43) $2,988 Direct labor (6,950 x $0.32) 2,224 Manufacturing overhead (6,950 x $0.20) 1,390 Selling and administrative (6,950 x $0.15) 1,043 (7,645)
Contribution margin (6,950 x $0.40) 2,780.Less fixed costs:
Manufacturing 1,200 Selling and administrative 580 (1,780)
Profit $ 1,000.
Chillin’ TimeContribution Income Statement
For a Monthly Volume of 6,950 Ice Cream Bars
Analysis Using Contribution Margin Ratio
Unit contribution margin Indicates how sensitive an income
model is to a change in unit sales Contribution margin ratio
The portion of every sales dollar contributed toward covering fixed costs and earning a profit

Contribution Margin Example
$1.50 – $1.10 = $0.40
Total Per Unit
Sales (6,950 units) $ 10,425. $ 1.50 Variable costs (7,645) -1.10Contribution margin 2,780. $ 0.40 Fixed costs (1,780)Profit $ 1,000.
[$1.50 – $1.10] ÷ $1.50 = 0.2667
Contribution margin per unit:Contribution margin per unit:
Contribution margin ratio:Contribution margin ratio:
Chillin’ Time’s contribution income appears below:

Sensitivity Analysis
100 × $0.40 = $40
If sales increase by 100 ice cream bars per month, by how much will net income increase?
Total Per Unit Ratio to Sales Sales (6,950 units) $10,425. $ 1.50 1.000Variable costs (7,645) (1.10) (0.733)Contribution margin 2,780. $ 0.40 0.267 Fixed costs (1,780)Profit $ 1,000.
$1,050 × 0.2667= $280
If sales increase by $1,050 per month, by how much will net income increase?
EXAMPLE:

Break-Even Point Example
Chillin’ Time’s Break-Even Unit =
Sales Volume
= Fixed costsContribution margin per unit
$1,780$1.50 – $1.10 = 4,450 units
When Chillin’ Time sells 4,450 ice cream bars per month, it will break even.
Chillin’ Time sells ice cream bars with a $1.10 unit variable cost for $1.50 each.
How many bars must it sell to break even?
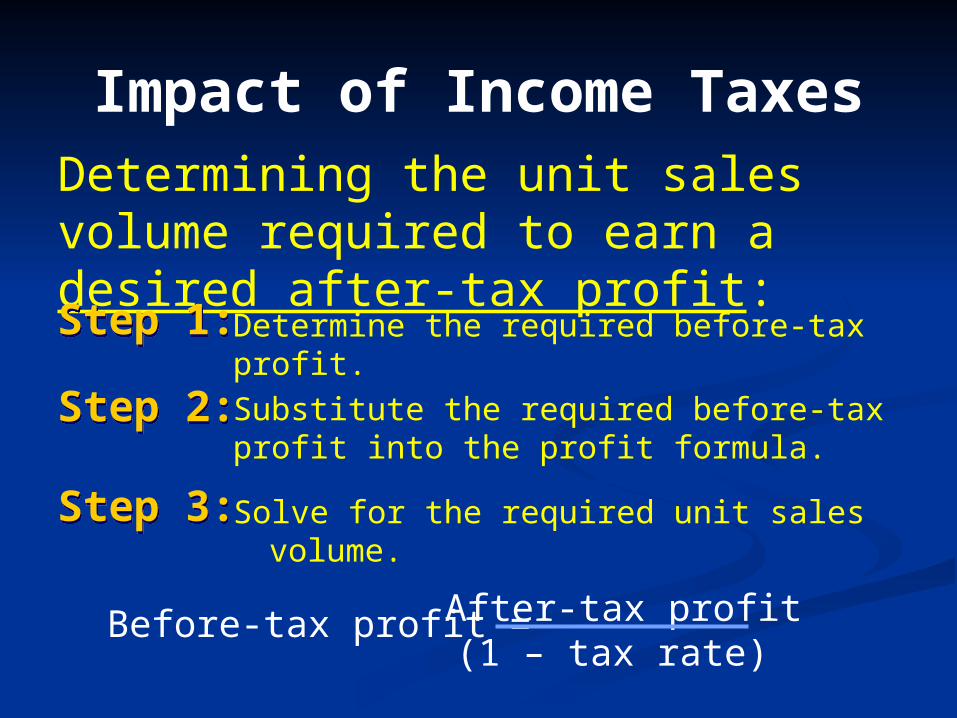
Impact of Income TaxesDetermining the unit sales volume required to earn a desired after-tax profit:
Solve for the required unit sales volume.
Step 1:Step 1: Determine the required before-tax profit.
Substitute the required before-tax profit into the profit formula.
Step 2:Step 2:
Step 3:Step 3:
Before-tax profit = After-tax profit(1 – tax rate)

Impact of Income Taxes Example
Before-tax profit = After-tax profit(1 – tax rate)
Chillin’ Time sells ice cream bars with a $1.10 unit variable cost for $1.50 each. It is subject to a 30 percent income tax rate. How many ice cream bars must Chillin’ Time sell to earn a desired monthly after-tax profit of $840?
$840(1 – 0.30) = = $1,200
Target unit sales volume = $1,780 + $1,200
$1.50 – $1.10
= 7,450 ice cream bars

Multiple Product Break-Even Point
Applicable when unit information is not available or when a company sells more
than one product.
= Fixed costs
Contribution margin ratio
= Fixed costs + Desired profit
Contribution margin ratio
Dollar break-even pointDollar break-even point
Target dollar sales volumeTarget dollar sales volume

Sales Mix Analysis
Sales mix The relative portion of unit or dollar
sales that are derived from each product
When sales mix is constant, the basic cost-volume-profit model can be used effectively
When sales mix is not constant, must determine average unit contribution margin or average contribution margin ratio for each alternative mix
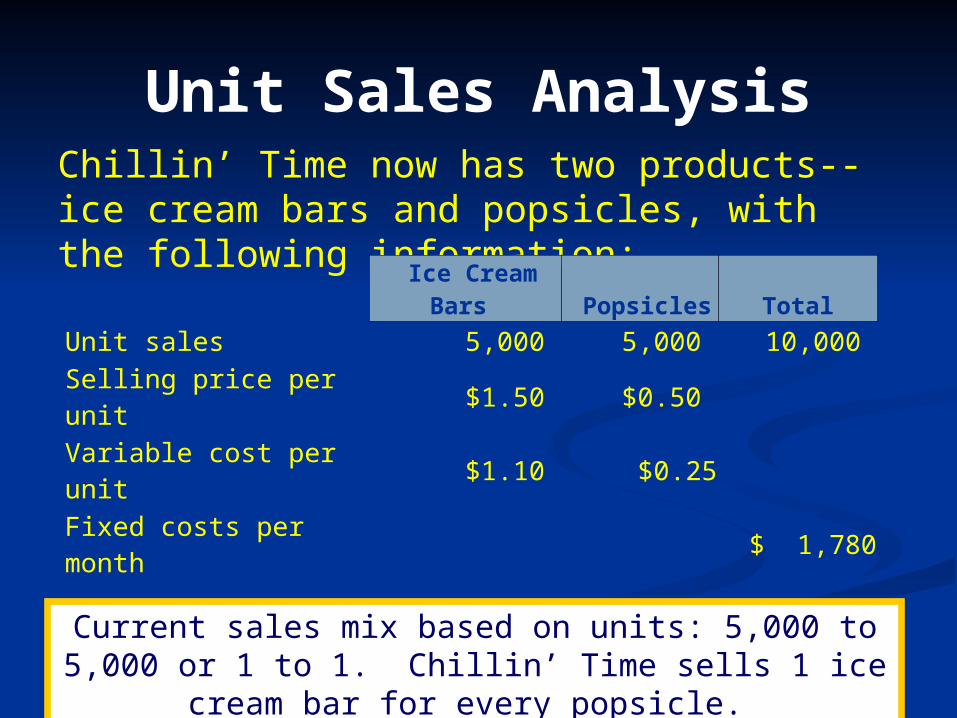
Unit Sales AnalysisChillin’ Time now has two products--ice cream bars and popsicles, with the following information: Ice Cream Bars Popsicles Total Unit sales 5,000 5,000 10,000 Selling price per unit $1.50 $0.50 Variable cost per unit $1.10 $0.25Fixed costs per month $ 1,780
Sales revenue $7,500 $2,500 $10,000 Variable costs 5,500 1,250 6,750 Contribution margin $ 2,000 $1,250 $ 3,250
Contribution margin ratio 0.267 0.500 0.325
Current sales mix based on units: 5,000 to 5,000 or 1 to 1. Chillin’ Time sells 1 ice cream bar for every popsicle.

Unit Multiproduct Break-Even Example
Average contribution margin per unit = [($0.40 × 1) + ($0.25 × 1)] ÷ 2 units= $0.325Average contribution margin per unit
= [($0.40 × 1) + ($0.25 × 1)] ÷ 2 units= $0.325
Unit break-even point =Fixed costs
Contribution margin per unit
Ice cream bars: 5,477 × 1/2 = 2,739* and
Popsicles: 5,477 × 1/2 = 2,739*
= 5,476.9 ≈ 5,477 units$1,780$0.325
=
Unit Multiproduct Break-Even Example
Average contribution margin per unit =
[($0.40 × 4) + ($0.25 × 1)] ÷ 5 units = $0.37
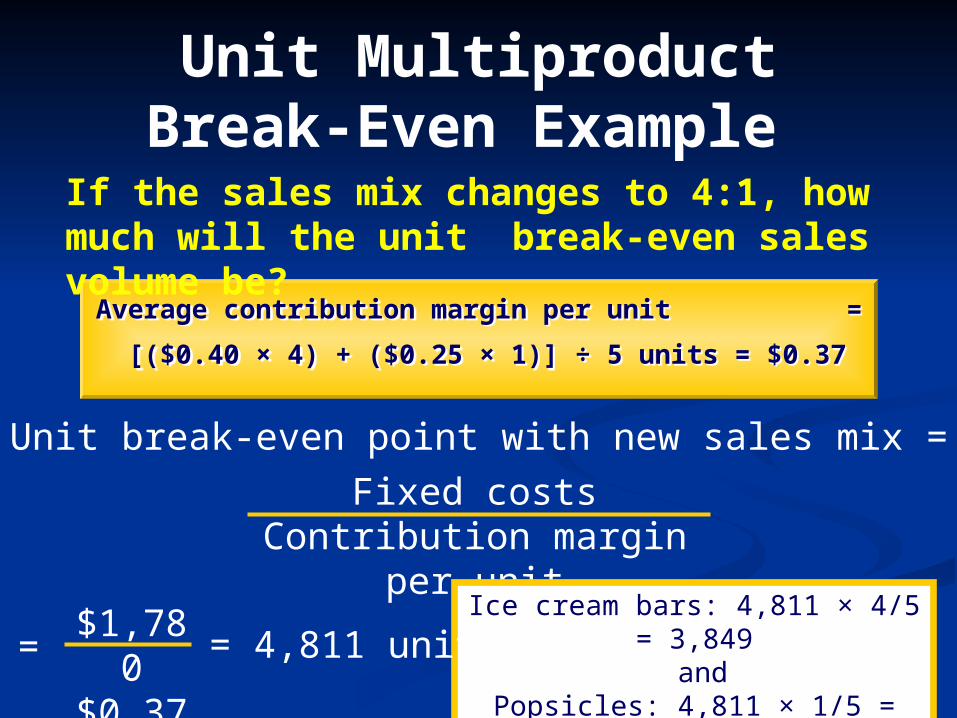
Average contribution margin per unit =
[($0.40 × 4) + ($0.25 × 1)] ÷ 5 units = $0.37
Unit break-even point with new sales mix =
Fixed costsContribution margin per unit
Ice cream bars: 4,811 × 4/5 = 3,849 and
Popsicles: 4,811 × 1/5 = 962= 4,811 units
$1,780$0.37
=
If the sales mix changes to 4:1, how much will the unit break-even sales volume be?

Comparing Break-Even Example
Sales mix 1 to 1
Sales mix 1 to 1
Ice cream bars: 5,477 × 1/2 = 2,739* and
Popsicles: 5,477 × 1/2 = 2739*
Ice cream bars: 4,811 × 4/5 = 3,849 and
Popsicles: 4,811 × 1/5 = 962
The change in sales mix causes the total number of units needed to break even to change because of the
different contribution margins for the two products.
Break-even unitsBreak-even units
Sales mix 4 to 1
Sales mix 4 to 1

Dollar Multiproduct Break-Even Example
Current sales mix in dollars is 7,500 to 2,500 or 75% to 25%. How much is the break-even sales volume in dollars?
=Fixed costs
Contribution margin per unit
$1,7800.325
= $5,477=
Ice cream bars:$5,477 × 0.75 =
$4,108 and
Popsicles: $5,477 × 0.25 =
$1,369
Dollar break-even point with new sales mix =
Average contribution margin ratio = $3,250 ÷ $10,000 = 0.325
Average contribution margin ratio = $3,250 ÷ $10,000 = 0.325

Operating Leverage
What is operating leverage? Extent to which income will change
with a change in sales High degree of operating leverage
Signals the existence of a high portion of fixed costs
Degree of operating leverage
Contribution margin
Income before taxes=

Measuring Expected Change in Profit
Taco King and Mexi Land are competitors and reported the same sales revenue and before-tax profit during May: Taco King Mexi Land
Sales $40,000 $40,000. Variable costs (22,000) (8,000) Contribution margin 18,000 32,000. Fixed costs (8,000) (22,000) Before-tax profit $10,000. $10,000.
If sales drop by 20% for both, which company suffers more?
Degree of operating leverage
Taco King Mexi Land
$18,000$10,000
= 1.8 $32,000$10,000 = 3.2
Decrease in profit
1.8 × 20% = 36%Decline in Profit
3.2 × 20% = 64%Decline in Profit
Mexi Land’s higher operating leverage results in a larger profit decline.

Margin of Safety
Margin of Safety: Revenues – Breakeven Revenues
Margin of Safety Ratio: (Sales – BE Sales)/Sales

Margin of SafetyTaco King and Mexi Land are competitors and reported the same sales revenue and before-tax profit during May: Taco King Mexi Land
Sales $40,000 $40,000. Variable costs (22,000) (8,000) Contribution margin 18,000 32,000. Fixed costs (8,000) (22,000) Before-tax profit $10,000. $10,000.
CM% $18,000/40,000=45%
$32,000/40,000=80% Taco King Mexi Land
Break-even sales $8,000/45%=$17,778 $22,000/80%=$27,500
Margin of Safety $40,000-$17,778=22,222 $40,000-$27,500=$12,500
Margin of Safety Ratio* $22,222/$40,000 = 55.6% $12,500/$40,000=31.3%*Note that MSR = 1/OL