Embed Size (px)
Citation preview
Welcome to the Orientation to the Office of Developmental Programs. This lesson is Part 2 of Quality Management Planning.
The information presented here was developed and reviewed by ODP leadership for you to begin to build your knowledge in your important role as a member of the ODP team.
Future lessons in this series will be made available, providing an overview of information related to the Office of Developmental Programs that focuses on core philosophies, operational components and business practices.
Course # 004-03-02 Rev 4-15-16 1
Module 103, Quality Management Planning - Part 2

Please adjust your computer volume so it is at a comfortable listening level for you.
While viewing this webcast, there is a pause and rewind button that can be used throughout the presentation.
Course # 004-03-02 Rev 4-15-16 2
Module 103, Quality Management Planning - Part 2

Hello, my name is Diana Ramirez I am one of ODP’s Quality Management Coordinators working to support ODP staff and stakeholders to implement quality management across ODP. In this role, I have participated in the development and writing of ODP’s Quality Improvement Strategy for the Consolidated and P/FDS Waivers, including performance measures, remediation and improvement strategies.
I will be presenting the first section of this webcast. Later in the presentation, Ann Ligi will be narrating.
Ann Ligi is a Quality Management Lead for ODP. She provides technical assistance and support for quality management practices implementation and provides a public health based approach for person‐centered risk management training and technical assistance.
Course # 004-03-02 Rev 4-15-16 3
Module 103, Quality Management Planning - Part 2
The objectives for Module 103 Part 2 include:
‐ Implementing and monitoring the QM Plan and
‐ Evaluation of the QM Plan
Course # 004-03-02 Rev 4-15-16 4
Module 103, Quality Management Planning - Part 2

After completing a QM Plan document in Module 103‐ Part 1, we asked the question “what happens next?” in the QM planning process.
The answer to that question is the development of action plans.
Action plans are an integral part in the QM planning process and include a sequence of steps or actions that must be performed for an improvement strategy to succeed. Action plans define:
‐ Action items
‐Who does what and
‐ By when
Failure to take due care in compiling an action plan can seriously affect the quality of an organization’s efforts toward improvement.
Course # 004-03-02 Rev 4-15-16 5
Module 103, Quality Management Planning - Part 2
An action item is a discrete unit within an action plan that describes an event, task, activity, or action.
Course # 004-03-02 Rev 4-15-16 6
Module 103, Quality Management Planning - Part 2

The number of action items found in an action plan depends entirely on the organization’s:
‐ Goals
‐ Outcomes and
‐ Target objectives
Course # 004-03-02 Rev 4-15-16 7
Module 103, Quality Management Planning - Part 2
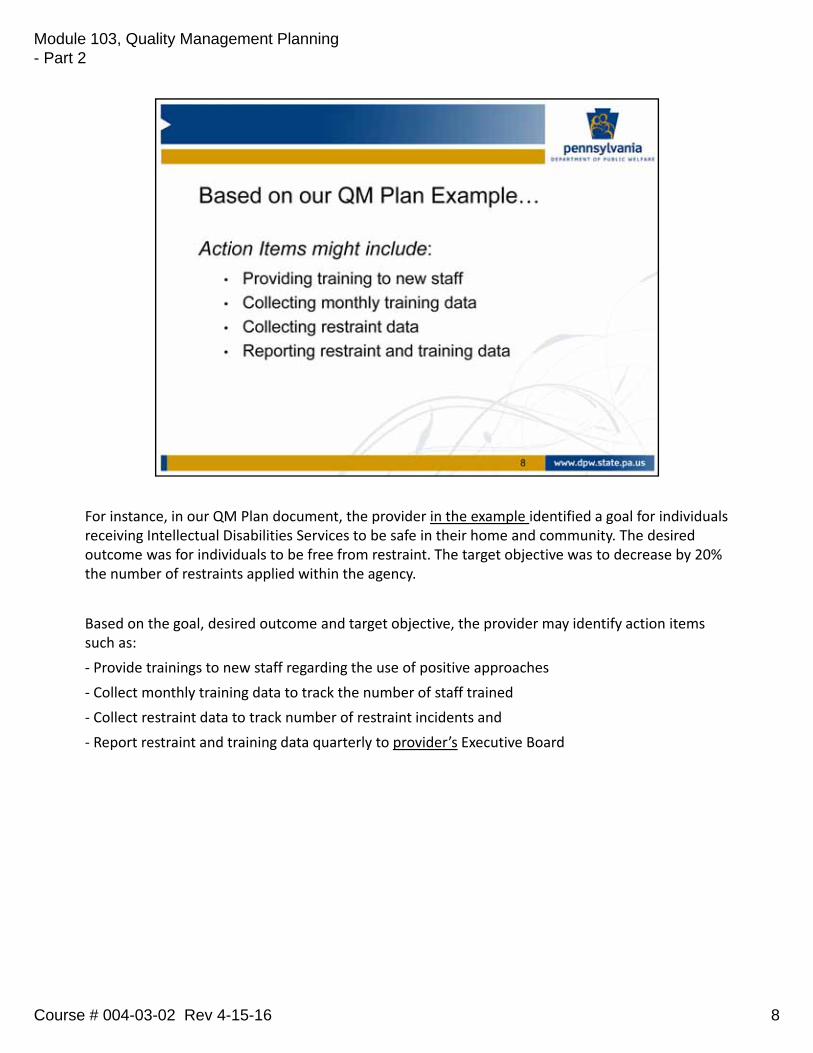
For instance, in our QM Plan document, the provider in the example identified a goal for individuals receiving Intellectual Disabilities Services to be safe in their home and community. The desired outcome was for individuals to be free from restraint. The target objective was to decrease by 20% the number of restraints applied within the agency.
Based on the goal, desired outcome and target objective, the provider may identify action items such as:
‐ Provide trainings to new staff regarding the use of positive approaches
‐ Collect monthly training data to track the number of staff trained
‐ Collect restraint data to track number of restraint incidents and
‐ Report restraint and training data quarterly to provider’s Executive Board
Course # 004-03-02 Rev 4-15-16 8
Module 103, Quality Management Planning - Part 2
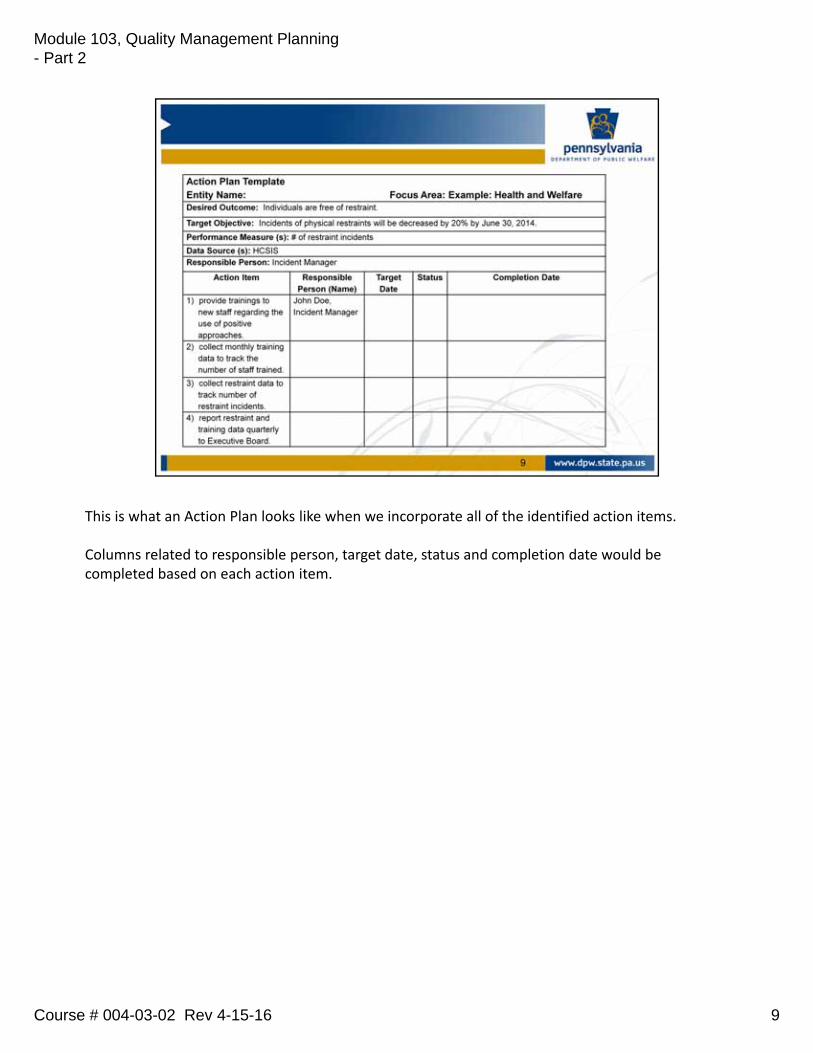
This is what an Action Plan looks like when we incorporate all of the identified action items.
Columns related to responsible person, target date, status and completion date would be completed based on each action item.
Course # 004-03-02 Rev 4-15-16 9
Module 103, Quality Management Planning - Part 2
For each action item, there needs to be a specific responsible person, a name identified, and a target date for completion of that action.
Course # 004-03-02 Rev 4-15-16 10
Module 103, Quality Management Planning - Part 2

Implementation of action plans should be monitored as often as necessary by an identified oversight body, or team, within an organization. By doing so, the oversight body will be able to determine if action items are being completed and whether or not desired outcomes and target objectives are being met.
Course # 004-03-02 Rev 4-15-16 11
Module 103, Quality Management Planning - Part 2
So as not to lose momentum of a quality improvement activity, the oversight body should:
‐ React quickly if action items are not being implemented according to the action plan or
‐ Be prepared to revise an action plan if it becomes clear that identified action items will not generate the desired outcome
Course # 004-03-02 Rev 4-15-16 12
Module 103, Quality Management Planning - Part 2
After much discussion, collaborative teamwork and training, your organization has developed its QM Plan and supporting Action Plans.
You are now faced with the task of determining if everything that has been put into motion will result in the achievement of identified target objectives and desired outcomes.
It’s now time to make things happen.
Ann will continue the discussion on the implementation and evaluation of the quality management plan. Specifically, the “check” and “act” steps of the Plan‐Do‐Check‐Act (PDCA) cycle.
Course # 004-03-02 Rev 4-15-16 13
Module 103, Quality Management Planning - Part 2

Thank you, Diana.
So far in our discussion, we have reviewed how to complete step number one in the Plan Do Check Act cycle—the “planning” step—by writing action plans that specify goals, measurable objectives, action items, responsible person (s) and evaluation, or monitoring whether targets are being met.
Step number two of the PDCA Cycle—the “doing” step—has also been accomplished with theimplementation of improvement or action plans, including education about the process change now underway in your organization.
Where do we go from here?
Course # 004-03-02 Rev 4-15-16 14
Module 103, Quality Management Planning - Part 2
We now move into step number three of the PDCA Cycle, that is, “checking” the effect of improvement steps by collecting data, analyzing data, and summarizing lessons learned through data reporting. In other words, you now want to determine the success or failure of the QM plan.
Course # 004-03-02 Rev 4-15-16 15
Module 103, Quality Management Planning - Part 2

Having developed performance measures for inclusion in your QM Plan, data must now be collected to assess performance with respect to each measure. Because information gathering is so vital to quality assessment and performance improvement, thought should be paid to procedures for data collection and organization.
Course # 004-03-02 Rev 4-15-16 16
Module 103, Quality Management Planning - Part 2

You need to remember that you are collecting data for the purpose of achieving a desired result that can be for a person or group, process or system. How frequently you collect data will depend on what you are choosing to measure, the availability of the data and consequences of decisions made on the basis of the data.
For instance, if you have chosen to measure performance of an internal process, you may want to collect small samples of data at regular intervals, for example: daily, weekly, or bi‐weekly.
More frequent collection of data in a case like this may help to facilitate implementation of corrective actions to improve the process you are measuring sooner rather than later.
Course # 004-03-02 Rev 4-15-16 17
Module 103, Quality Management Planning - Part 2
Once you collect or discover the data, you may need to scrub it as needed beforemoving ahead to data analysis activities. Data scrubbing, also called data cleansing, isthe process of amending or removing data in a database that is incorrect, incomplete, improperly formatted, or duplicated.
Scrubbing will enable you to be confident in the data results, as well as saving you time and effort if an error is discovered later in the process.
Course # 004-03-02 Rev 4-15-16 18
Module 103, Quality Management Planning - Part 2
Playing a key role in the data analysis process is data display. Displaying data serves multiple purposes, including such things as:
‐ Conveying data and information clearly and accurately
‐ Showing patterns and trends in data
‐Minimizing the likelihood of misrepresenting data and
‐ Helping people learn more effectively through visual images rather than just words
Course # 004-03-02 Rev 4-15-16 19
Module 103, Quality Management Planning - Part 2

How you choose to display your data depends on what you are trying to say. In Module 102 of our QM Certification Training series, you were introduced to a number of different data display methods. It may be helpful for you to refer back to that training for a more in‐depth discussion about the topic. For example, ODP uses a Balanced Scorecard method to display data in summary form at a high level. As we discussed, this data display shows viewers at a glance the relationship of the data to ODP’s overall purpose, its Mission, Vision, and major Strategic Themes of Delivering Quality Services and Supports, Ensuring Program Integrity, and Fostering Innovation.
The next step involves studying high level data in more depth. Let’s assume we are trying to organize our data in a way that will show trends over time. In this case, a column chart, line chart or data table may be just what you need. Whichever display method you select, remember to keep it simple and understandable for the audience.
Course # 004-03-02 Rev 4-15-16 20
Module 103, Quality Management Planning - Part 2

It cannot be emphasized enough that data analysis is not just about collecting numbers ‐ it’s about using them.
Organizing and thinking about the data is key to understanding whether your improvement activities are, in fact, helping your organization achieve desired outcomes.
Course # 004-03-02 Rev 4-15-16 21
Module 103, Quality Management Planning - Part 2
For this reason, it is important that your data collection, or discovery, and data display be paired with a written explanation that further helps the audience understand what the numbers they are looking at mean.
Written analysis should not only include a to‐the‐point explanation about what the data means , but also a description of any barriers or obstacles encountered that may adversely impact the achievement of target objectives.
Course # 004-03-02 Rev 4-15-16 22
Module 103, Quality Management Planning - Part 2

The best data in the world means little if you can’t put that data into a usable report. A “good” report is one that contains the data you need and facilitates making vital decisions based upon that data. A usable report contains the following key features: accuracy, completeness, relevance, visual interest and timeliness.
Course # 004-03-02 Rev 4-15-16 23
Module 103, Quality Management Planning - Part 2
In addition to these key features, a data report should also include key components such as:
‐ Data discovery, including data source; data elements such as identified numerators and denominators
‐ “Findings and Analysis” section. This is where your data display and data analysis belong, as well as, a description of identified barriers encountered and a
‐ “Follow‐up” section. In this section you should describe how barriers to achievement of your objective, if present, will be addressed
Course # 004-03-02 Rev 4-15-16 24
Module 103, Quality Management Planning - Part 2
As we stated earlier, the word frequency as it relates to quality management, refers to the cycle that will be used to report progress toward achieving goals and desired outcomes to a quality oversight group.
ODP’s Community Services Program staff, for instance, reports quarterly to an oversight group on a majority of the performance measures identified in the quality improvement strategy sections in Appendices A through I in the Consolidated and P/FDS Waivers.
Likewise, ODP expects AEs and Providers, including SCOs, to engage in the practice of quarterly data reporting.
Here’s a tip: There is a distinction between documenting data and reporting data. Be sure to document data monthly as it becomes available, or whatever the timeframe is for data collection. Trying to resurrect data after the fact can be problematic and potentially lead to errors; or misinterpreting the findings during the analysis.
Course # 004-03-02 Rev 4-15-16 25
Module 103, Quality Management Planning - Part 2
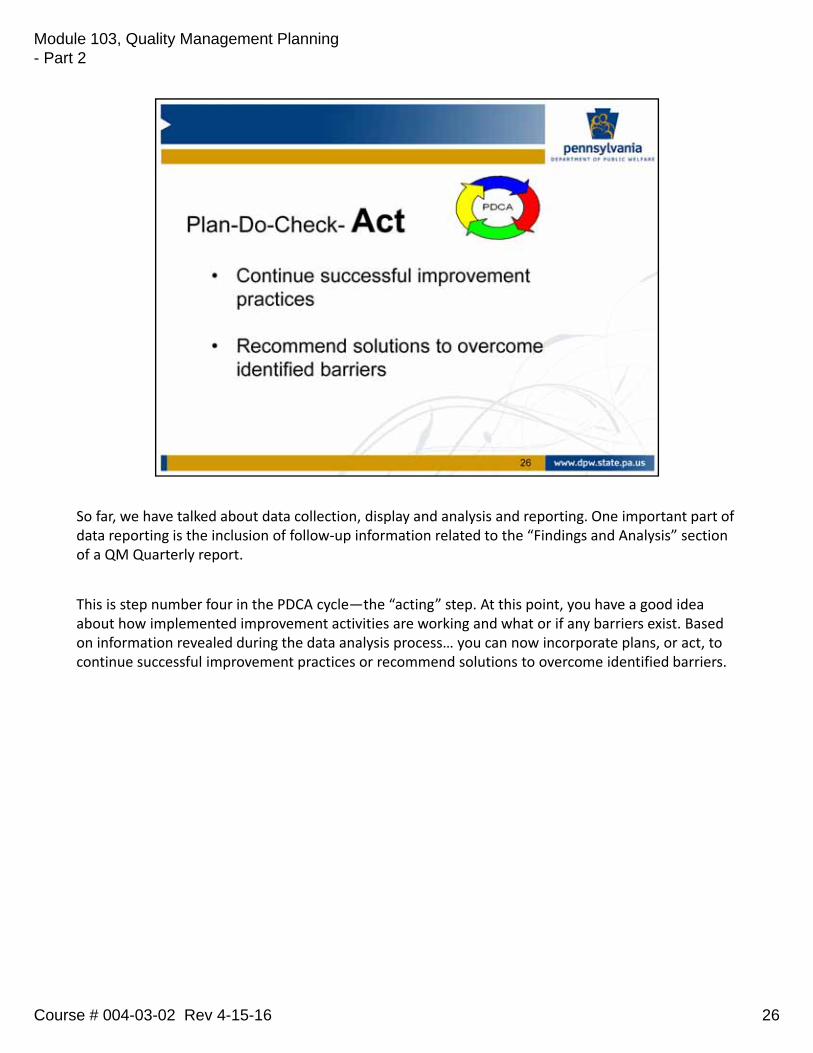
So far, we have talked about data collection, display and analysis and reporting. One important part of data reporting is the inclusion of follow‐up information related to the “Findings and Analysis” section of a QM Quarterly report.
This is step number four in the PDCA cycle—the “acting” step. At this point, you have a good idea about how implemented improvement activities are working and what or if any barriers exist. Based on information revealed during the data analysis process… you can now incorporate plans, or act, to continue successful improvement practices or recommend solutions to overcome identified barriers.
Course # 004-03-02 Rev 4-15-16 26
Module 103, Quality Management Planning - Part 2

On this slide we see an example QM Quarterly Report template.
In this report template, or one like it that includes all of the same components, you would place your:
‐ Identifying information in the top sections
‐ Data discovery
‐ Findings and analysis
‐ Follow‐up information or PDCA
‐ Description about stakeholder involvement and
‐ Reporting schedule to entity executive staff
The last two sections were incorporated into the document because of the importance of keeping parties with a stake in the development and implementation of the QM Plan well‐informed about progress being made or barriers being encountered in the QM Planning process.
Course # 004-03-02 Rev 4-15-16 27
Module 103, Quality Management Planning - Part 2

Let’s “break down” our QM Quarterly Report into sections, showing information in each section that might make the quarterly reporting process more clear.
In this slide, we see that identifying information has been entered in the top sections of the template. We have also included a performance measure and data source in the first column and data display using a line chart in the next column labeled, “Findings and Analysis.”
Course # 004-03-02 Rev 4-15-16 28
Module 103, Quality Management Planning - Part 2
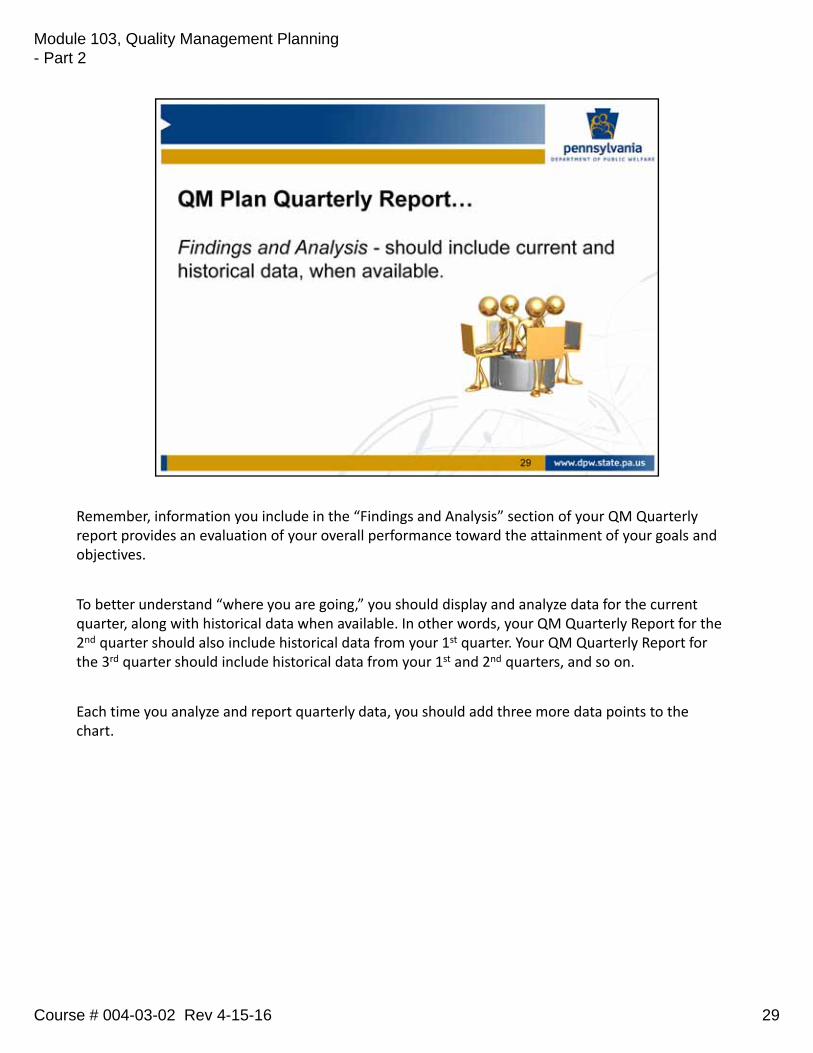
Remember, information you include in the “Findings and Analysis” section of your QM Quarterly report provides an evaluation of your overall performance toward the attainment of your goals and objectives.
To better understand “where you are going,” you should display and analyze data for the current quarter, along with historical data when available. In other words, your QM Quarterly Report for the 2nd quarter should also include historical data from your 1st quarter. Your QM Quarterly Report for the 3rd quarter should include historical data from your 1st and 2nd quarters, and so on.
Each time you analyze and report quarterly data, you should add three more data points to the chart.
Course # 004-03-02 Rev 4-15-16 29
Module 103, Quality Management Planning - Part 2
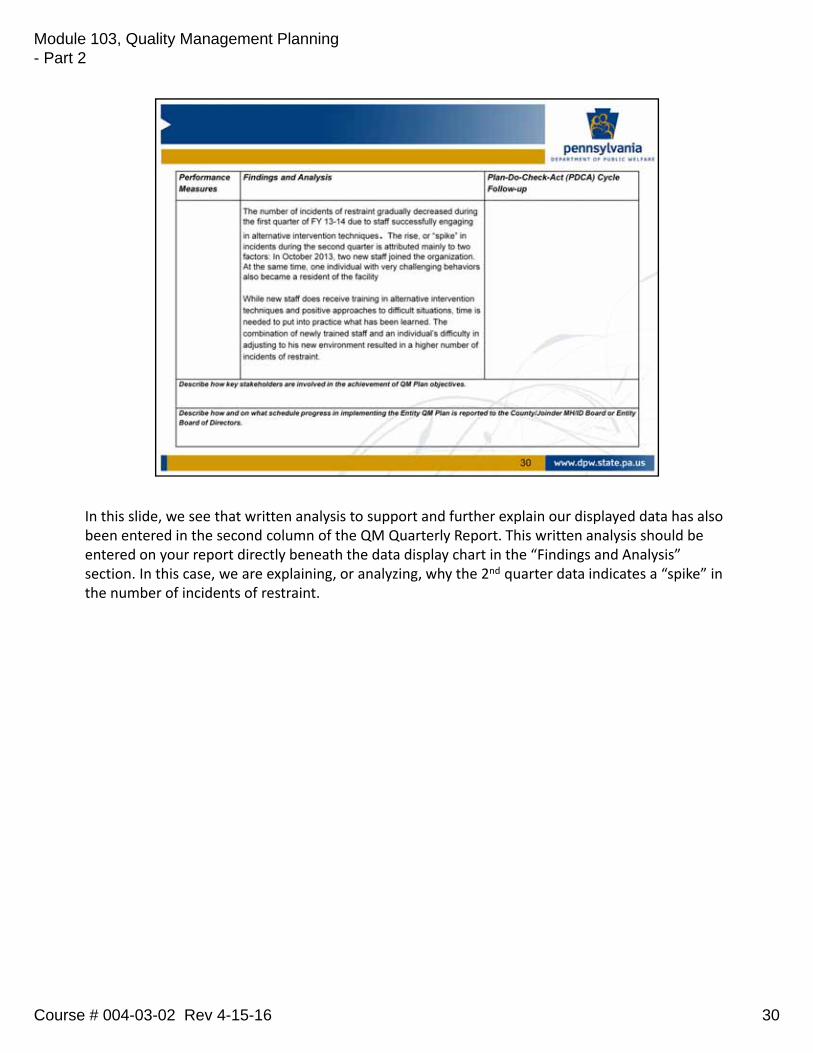
In this slide, we see that written analysis to support and further explain our displayed data has also been entered in the second column of the QM Quarterly Report. This written analysis should be entered on your report directly beneath the data display chart in the “Findings and Analysis” section. In this case, we are explaining, or analyzing, why the 2nd quarter data indicates a “spike” in the number of incidents of restraint.
Course # 004-03-02 Rev 4-15-16 30
Module 103, Quality Management Planning - Part 2
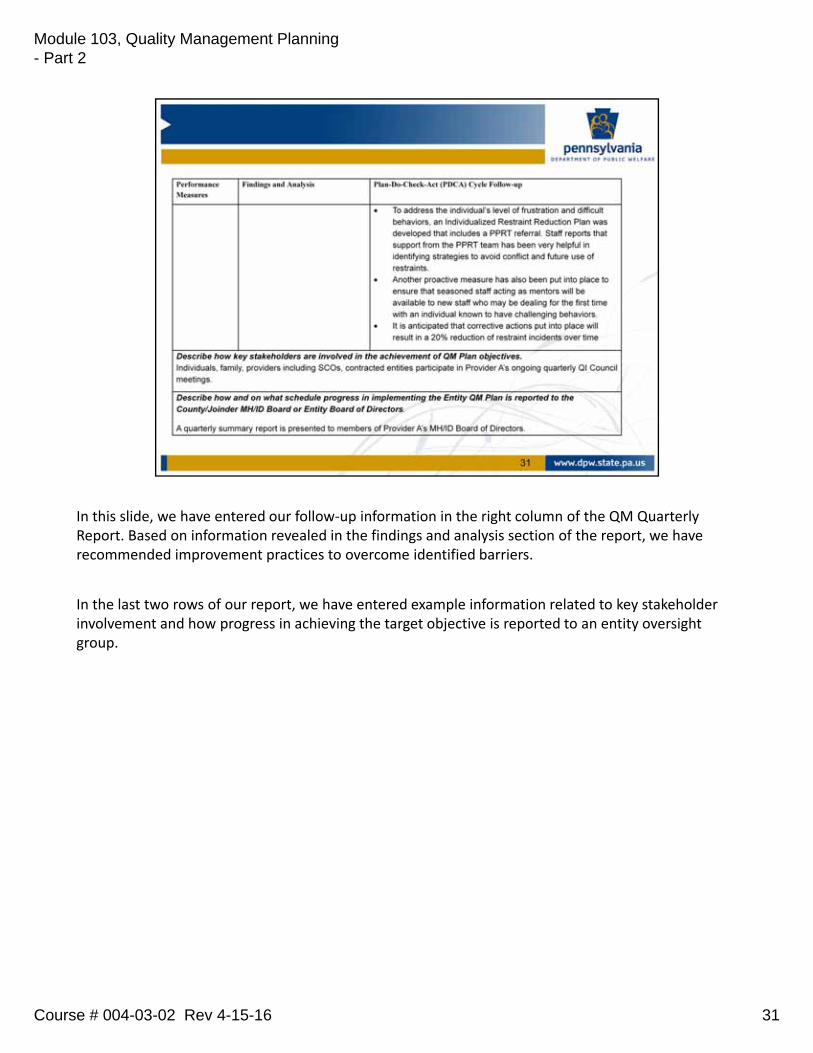
In this slide, we have entered our follow‐up information in the right column of the QM Quarterly Report. Based on information revealed in the findings and analysis section of the report, we have recommended improvement practices to overcome identified barriers.
In the last two rows of our report, we have entered example information related to key stakeholder involvement and how progress in achieving the target objective is reported to an entity oversight group.
Course # 004-03-02 Rev 4-15-16 31
Module 103, Quality Management Planning - Part 2
To assist you in developing a QM Plan Quarterly Report, an “Entity QM Plan Quarterly Report Evaluation Tool” has been made available by ODP and is posted on the ODP Consulting System website as described earlier. You may use this evaluation tool or develop a similar one of your own.
The evaluation tool, or checklist of sorts, includes guideline and comment sections that clearly describe to the reader specific criteria that should be incorporated into the QM Plan Quarterly Report.
Course # 004-03-02 Rev 4-15-16 32
Module 103, Quality Management Planning - Part 2

So far—in Module 103, Parts 1 and 2—we have discussed a tremendous amount of information. Let’s review our major accomplishments.
We have learned how to complete:
1. A QM Plan document that identifies a goal, desired outcome, target objective, performance measure with data source, responsible person and frequency of data reporting.
2. An Action Plan with specific action items designed to help us achieve an identified goal, desired outcome and target objective and
3. A QM Quarterly Report to help us organize data and analyze whether improvement activities put into place are helping us to achieve desired outcomes
What now?
Course # 004-03-02 Rev 4-15-16 33
Module 103, Quality Management Planning - Part 2
Well, simply stated, you would continue to monitor progress in achieving your QM Plan target objectives through ongoing implementation of the PDCA cycle.
That means … you continue to collect and analyze data at established intervals, monitor action plan activities as appropriate, and complete QM Quarterly reports as scheduled.
Course # 004-03-02 Rev 4-15-16 34
Module 103, Quality Management Planning - Part 2
As we mentioned at the beginning of training Module 103, ODP updated its requirement for stakeholders to complete QM Plans every two years, rather than annually.
Through ongoing review of QM Plan Quarterly Reports, you should be considering baseline data or target objectives that were incorporated into your current QM Plan to determine whether:
‐ Your organization’s target objectives are being achieved
‐ Target objectives should be continued, revised or discontinued in the next QM Plan cycle or
‐ New target objectives should be identified
Course # 004-03-02 Rev 4-15-16 35
Module 103, Quality Management Planning - Part 2

The decision to discontinue use of a particular target objective, should only be made after review and discussion of available performance data. If the level of expected performance has been successfully achieved, you will need to describe how you will monitor your program to ensure the level of performance is sustained for the long‐term.
Course # 004-03-02 Rev 4-15-16 36
Module 103, Quality Management Planning - Part 2

Other important aspects to consider as you move into the next QM Planning cycle are:
‐ Lessons learned from the implementation of ODP’s QM Strategy and
‐ Lessons learned from interactions with key stakeholders
What do we mean specifically?
Course # 004-03-02 Rev 4-15-16 37
Module 103, Quality Management Planning - Part 2

As you reflect on the current QM Plan cycle, ask yourself some of the following relevant questions ‐Does our organization:
‐ Ensure program alignment with ODP’s mission, vision, values and quality framework? How would they know?
‐ Collaborate with system partners in improving local services and supports?
‐ Share quality information with partners and stakeholders?
Course # 004-03-02 Rev 4-15-16 38
Module 103, Quality Management Planning - Part 2

To facilitate the QM Plan review and renewal process steps just described, ODP has posted on the ODP Consulting System Website the ”Entity Quality Management Plan End‐of‐Cycle Evaluation Form” and the “Entity Quality Management Plan Evaluation Tool.” You may use these documents as you review your current QM Plan and make decisions about QM planning for your organization going forward.
Course # 004-03-02 Rev 4-15-16 39
Module 103, Quality Management Planning - Part 2
Based on the assessment of your current QM Plan—reflecting on lessons learned and determining key target objectives moving forward, you are ready to embark on another two‐year QM planning cycle.
Remember, the QM Plan is the method you will use for measuring and influencing quality through the achievement of performance outcomes. The methodology includes a continuous improvement process, a cycle of assessment, analysis and action for improvement, known also as the PDCA cycle.
Course # 004-03-02 Rev 4-15-16 40
Module 103, Quality Management Planning - Part 2
This concludes Part 2 of the ODP Orientation lesson on Quality Management Planning.
Both QM Module 103, Parts 1 and 2 are third in our series of quality management modules for certification. The series is designed to serve as a resource for leaders in ODP and the service delivery system.
Now that you have viewed this presentation, we suggest that you meet with your supervisor to discuss in more detail the information provided in this webcast and your roles and responsibilities for quality management within your position.
Course # 004-03-02 Rev 4-15-16 41
Module 103, Quality Management Planning - Part 2