Embed Size (px)
Citation preview
Module 1 overview
lecture lab 1. Introduction to the module 1. Start-up protein eng. 2. Rational protein design 2. Site-directed mutagenesis 3. Fluorescence and sensors 3. DNA amplification
PRESIDENTʼS DAY 4. Review & gene analysis 4. Prepare expression system 5. Protein expression 5. Gene analysis & induction 6. Purification and protein analysis 6. Characterize expression 7. Binding & affinity measurements 7. Assay protein behavior 8. High throughput engineering 8. Data analysis
1
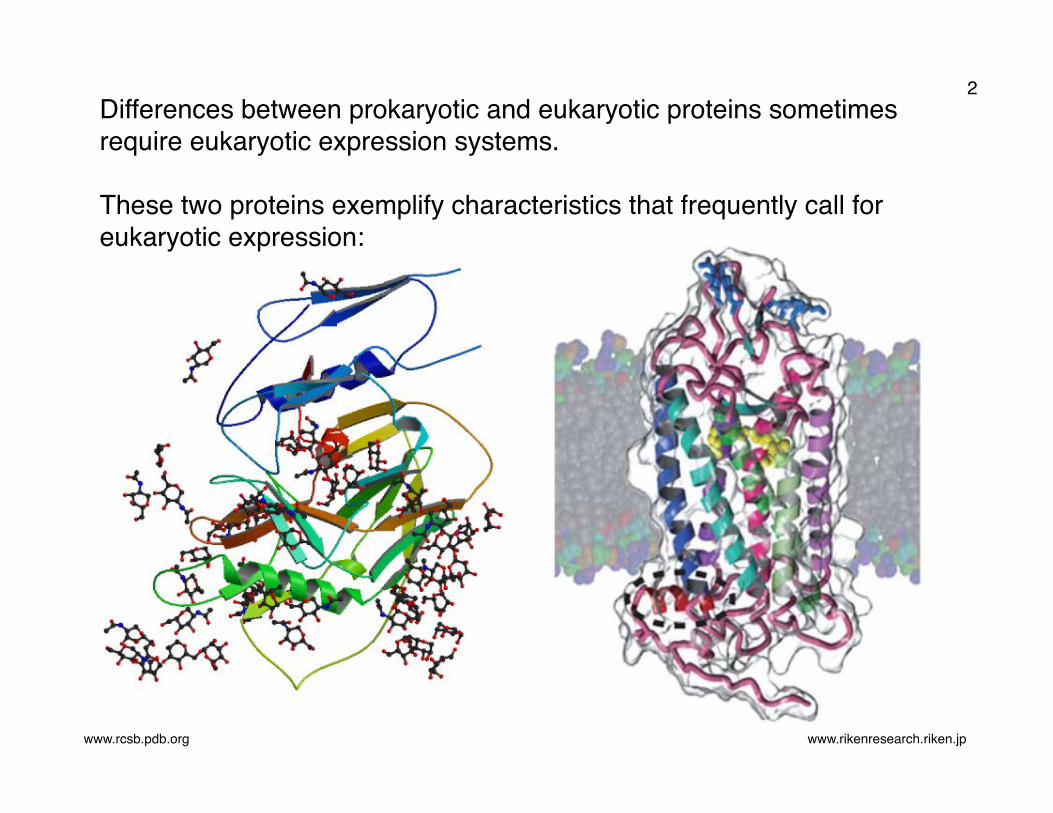
Differences between prokaryotic and eukaryotic proteins sometimes require eukaryotic expression systems.
These two proteins exemplify characteristics that frequently call for eukaryotic expression:
www.rcsb.pdb.org www.rikenresearch.riken.jp
2
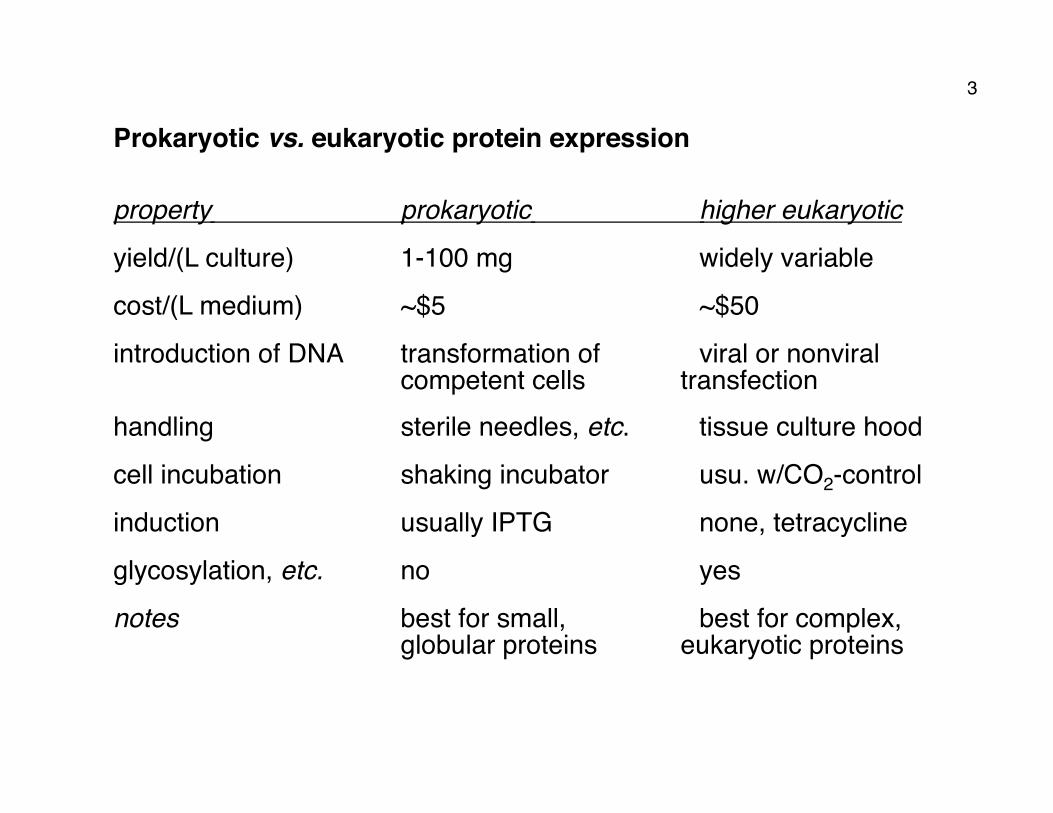
Prokaryotic vs. eukaryotic protein expression
property prokaryotic higher eukaryotic yield/(L culture) 1-100 mg widely variable cost/(L medium) ~$5 ~$50 introduction of DNA transformation of viral or nonviral
competent cells transfection handling sterile needles, etc. tissue culture hood cell incubation shaking incubator usu. w/CO2-control induction usually IPTG none, tetracycline glycosylation, etc. no yes notes best for small, best for complex,
globular proteins eukaryotic proteins
3

Lecture 6: Protein purification
I. Standard purification methods A. Harvesting and lysis B. Protein separation techniques
II. Assessing purified proteins A. Electrophoresis B. Mass spectrometry C. Protein sequencing and AA analysis
4

5

Once weʼve collected the cells, how do we get the proteins out?
clockwise from top left: lh6.ggpht.com www.biomembranes.nl bioinfo.bact.wisc.edu matcmadison.edu
6

www.biomedcentral.com
7

Separation techniques
GE Healthcare (2007) Recombinant Protein Purification Handbook
e.g. Ni-NTA most common, in addition to
affinity
8

9
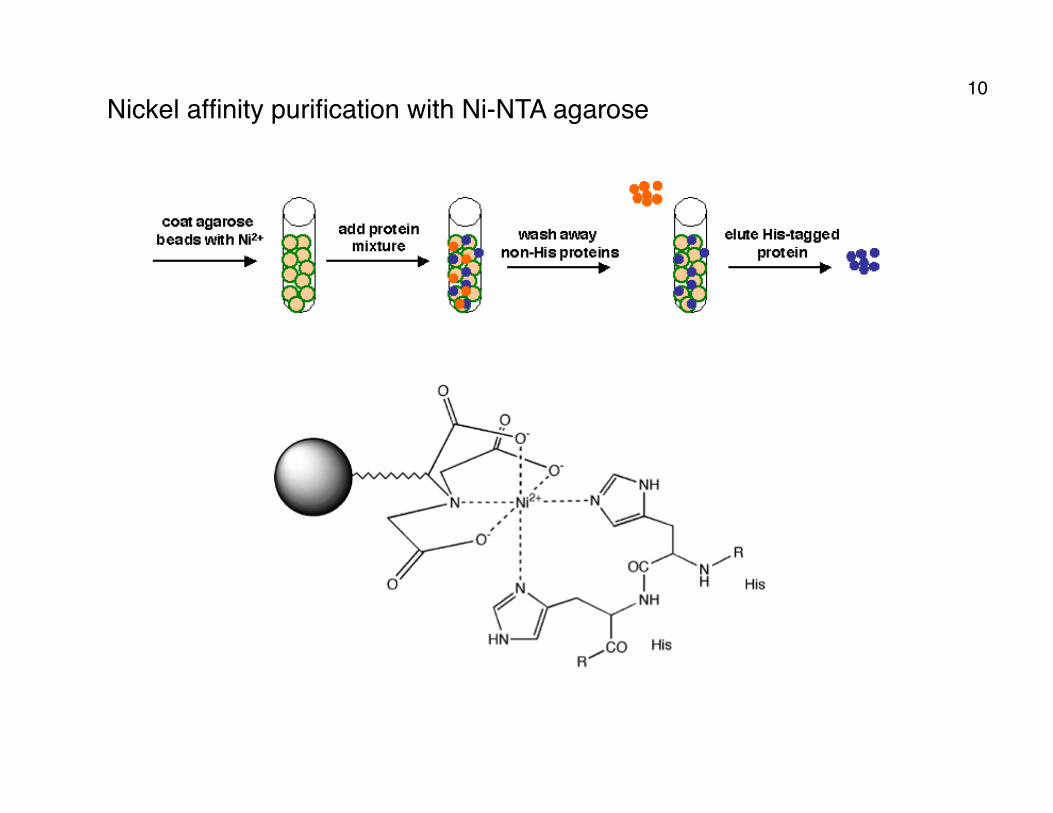
Nickel affinity purification with Ni-NTA agarose 10

tag residues matrix elution condition poly-His ~6 Ni-NTA imidazole, low pH FLAG 8 anti-FLAG antibody low pH, 2-5 mM EDTA c-myc 11 anti-myc antibody low pH strep-tag 8 modified streptavidin 2.5 mM desthiobiotin CBP 26 calmodulin EGTA, EDTA GST 211 glutathione reduced glutathione MBP 396 amylose 10 mM maltose
Many other tags can be used for protein purification:
Tags may be chosen because they • interfere minimally with protein structure/function • improve recombinant protein expression or solubility • offer most convenient purification methods
All tags may be cleaved from expressed proteins using specific proteases, if desired.
11

Gel filtration (size exclusion chromatography) principle
GE Healthcare (2007) Gel Filtration Principles & Methods
12

Quantification of purified proteins
use Beer-Lambert law: A280 = ε280cl
ε280 is the extinction coefficient; it can be determined rigorously, or estimated: ε280 ~ nW × 5500 + nY × 1490 + nC × 125
13

Assessing proteins for identity and purity
Most standard technique is sodium dodecylsulfate polyacrylamide gel electrophoresis (SDS-PAGE): • basis is the tendency of proteins to unfold in SDS and bind a fixed amount SDS per protein (1.4 g/g) • negative charge of SDS overwhelms protein charges • proteins have same charge to mass ratio, but are differentially retarded by the separation gel • stacking layer “focuses” proteins before separation layer
http://nationaldiagnostics.com/article_info.php/articles_id/10
glycine ions
chloride ions
pH 6.8
pH 8.8
14

Coomassie brilliant blue staining
• binds proteins primarily via aromatic residues and arginine
• undergoes absorbance shift from 465 nm (brownish) to 595 nm (blue)
• basis for Bradford Assay; can be used to quantify proteins over ~3 kD
www.eiroforum.org/press/media_embl.html
15
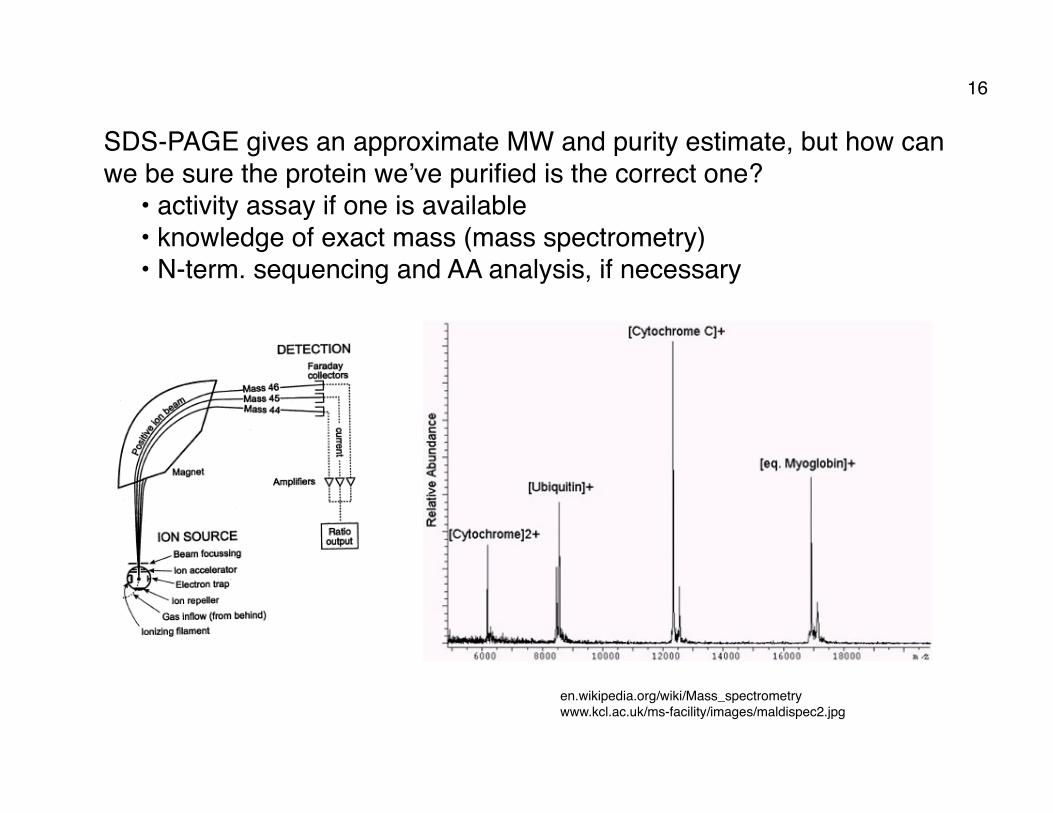
SDS-PAGE gives an approximate MW and purity estimate, but how can we be sure the protein weʼve purified is the correct one? • activity assay if one is available • knowledge of exact mass (mass spectrometry) • N-term. sequencing and AA analysis, if necessary
en.wikipedia.org/wiki/Mass_spectrometry www.kcl.ac.uk/ms-facility/images/maldispec2.jpg
16

N-terminal sequencing (Edman degradation)
en.wikipedia.org/wiki/Edman_degradation
• products identified by chroma- tography or electrophoresis • typically ~5 cycles practical for routine N-term. sequencing
Amino acid analysis
• HCl digestion to digest peptide bonds • HPLC to quantify AA components
17

![MODULE 2.6.4. PHARMACOKINETICSWRITTEN SUMMARY€¦ · inhibit multidrug resistance-associated protein 4 ... [Report 2013N161621]. A tabulated summary of this study is ... MODULE 2.6.5](https://img.pdfslide.us/doc/110x75/5b893b8d7f8b9a655f8bb8ac/module-264-pharmacokineticswritten-inhibit-multidrug-resistance-associated.jpg)


![Paper 6 Module 37 Production of Single Cell Protein [Year]](https://img.pdfslide.us/doc/110x75/625e4ad3479e0b7e264e111e/paper-6-module-37-production-of-single-cell-protein-year.jpg)