Embed Size (px)
Citation preview
Introduction to Block Diagrams Basics of Block Diagrams Examples of Block Diagram Simplifications
Module 04Block Diagrams and Graphical Representations
of Intertwined Dynamic Systems
Ahmad F. Taha
EE 3413: Analysis and Desgin of Control Systems
Email: [email protected]
Webpage: http://engineering.utsa.edu/˜taha
February 2, 2016
©Ahmad F. Taha Module 04 — Block Diagrams and Graphical Representations of Dynamic Systems 1 / 24
Introduction to Block Diagrams Basics of Block Diagrams Examples of Block Diagram Simplifications
Module 4 Outline
1 Introduction to block diagrams2 Physical meaning and importance3 Block diagram reduction4 Examples
– Reading material: Dorf & Bishop, Section 2.6
©Ahmad F. Taha Module 04 — Block Diagrams and Graphical Representations of Dynamic Systems 2 / 24
Introduction to Block Diagrams Basics of Block Diagrams Examples of Block Diagram Simplifications
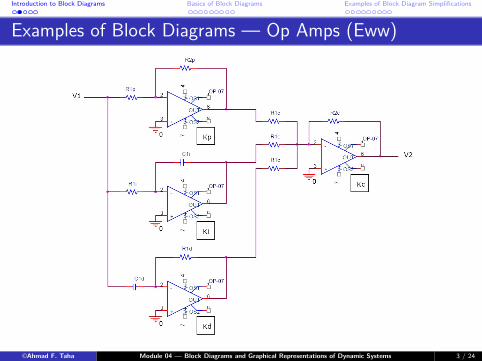
Examples of Block Diagrams — Op Amps (Eww)
©Ahmad F. Taha Module 04 — Block Diagrams and Graphical Representations of Dynamic Systems 3 / 24
Introduction to Block Diagrams Basics of Block Diagrams Examples of Block Diagram Simplifications
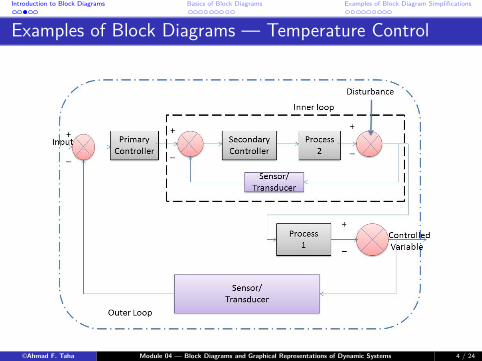
Examples of Block Diagrams — Temperature Control
©Ahmad F. Taha Module 04 — Block Diagrams and Graphical Representations of Dynamic Systems 4 / 24
Introduction to Block Diagrams Basics of Block Diagrams Examples of Block Diagram Simplifications
Importance of Block Diagrams
Graphical representation of interconnected systems are important
A system may consist of multiple subsystems: the output of onemay be the input to another, and so on
Each subsystem is represented by a functional block, labeled withthe corresponding transfer function
Blocks are connected by arrows to indicate signal flow directions
Advantages:
– Easy for visualization purpose
– Can represent a class of similar systems
– Most importantly: can infer overall relationship between inputsand outputs, and hence analyze the system stability andperformance
©Ahmad F. Taha Module 04 — Block Diagrams and Graphical Representations of Dynamic Systems 5 / 24
Introduction to Block Diagrams Basics of Block Diagrams Examples of Block Diagram Simplifications
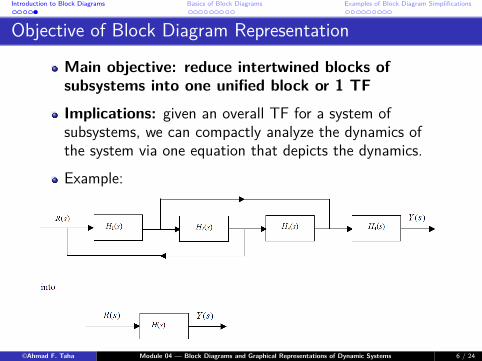
Objective of Block Diagram Representation
Main objective: reduce intertwined blocks ofsubsystems into one unified block or 1 TF
Implications: given an overall TF for a system ofsubsystems, we can compactly analyze the dynamics ofthe system via one equation that depicts the dynamics.
Example:
©Ahmad F. Taha Module 04 — Block Diagrams and Graphical Representations of Dynamic Systems 6 / 24
Introduction to Block Diagrams Basics of Block Diagrams Examples of Block Diagram Simplifications
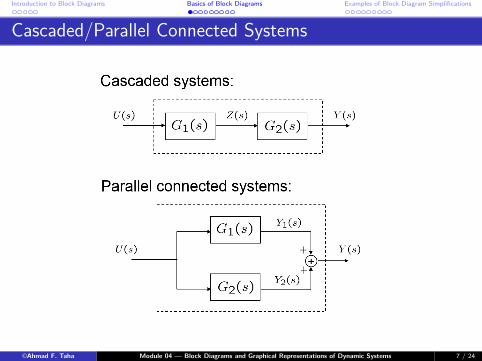
Cascaded/Parallel Connected Systems
©Ahmad F. Taha Module 04 — Block Diagrams and Graphical Representations of Dynamic Systems 7 / 24
Introduction to Block Diagrams Basics of Block Diagrams Examples of Block Diagram Simplifications
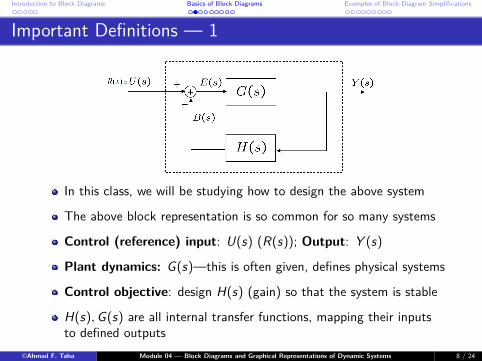
Important Definitions — 1
In this class, we will be studying how to design the above system
The above block representation is so common for so many systems
Control (reference) input: U(s) (R(s)); Output: Y (s)
Plant dynamics: G(s)—this is often given, defines physical systems
Control objective: design H(s) (gain) so that the system is stable
H(s), G(s) are all internal transfer functions, mapping their inputsto defined outputs
©Ahmad F. Taha Module 04 — Block Diagrams and Graphical Representations of Dynamic Systems 8 / 24
Introduction to Block Diagrams Basics of Block Diagrams Examples of Block Diagram Simplifications
(Negative) Feedback System1 — 1
Negative feedback occurs when some function of the output is fedback to reduce the output fluctuationsFluctuations often caused by changes in the input or disturbancesWell, why not +ve feedback? Who likes −ve feedback anyway?Hmm, in control systems the theme is differentIf someone’s applying -ve feedback, then they’re most likely helpingyou+ve feedback tends to lead to instability via exponential growth−ve feedback promotes stability and error minimization−ve feedback applications: electrical & mechanical systems,economics, nature, chemistry
1From Wikipedia...Oh and don’t ever let anyone lecture you when you get yourvery basic research from Wikipedia.
©Ahmad F. Taha Module 04 — Block Diagrams and Graphical Representations of Dynamic Systems 9 / 24
Introduction to Block Diagrams Basics of Block Diagrams Examples of Block Diagram Simplifications
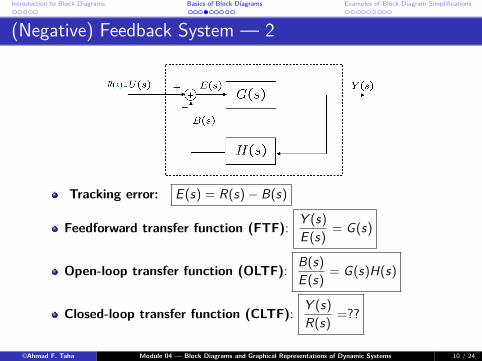
(Negative) Feedback System — 2
Tracking error: E (s) = R(s) − B(s)
Feedforward transfer function (FTF): Y (s)E (s) = G(s)
Open-loop transfer function (OLTF): B(s)E (s) = G(s)H(s)
Closed-loop transfer function (CLTF): Y (s)R(s) =??
©Ahmad F. Taha Module 04 — Block Diagrams and Graphical Representations of Dynamic Systems 10 / 24
Introduction to Block Diagrams Basics of Block Diagrams Examples of Block Diagram Simplifications
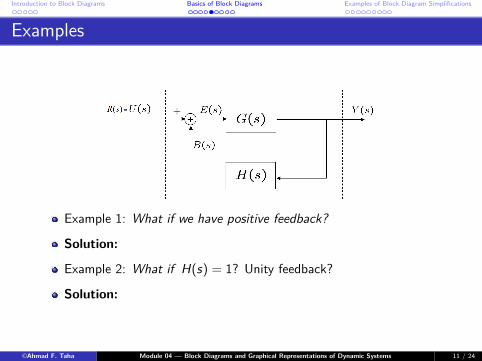
Examples
Example 1: What if we have positive feedback?
Solution:
Example 2: What if H(s) = 1? Unity feedback?
Solution:
©Ahmad F. Taha Module 04 — Block Diagrams and Graphical Representations of Dynamic Systems 11 / 24
Introduction to Block Diagrams Basics of Block Diagrams Examples of Block Diagram Simplifications
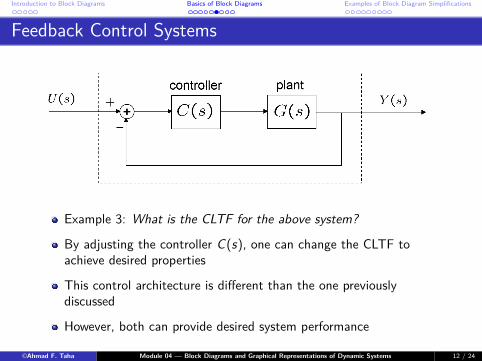
Feedback Control Systems
Example 3: What is the CLTF for the above system?
By adjusting the controller C(s), one can change the CLTF toachieve desired properties
This control architecture is different than the one previouslydiscussed
However, both can provide desired system performance
©Ahmad F. Taha Module 04 — Block Diagrams and Graphical Representations of Dynamic Systems 12 / 24
Introduction to Block Diagrams Basics of Block Diagrams Examples of Block Diagram Simplifications
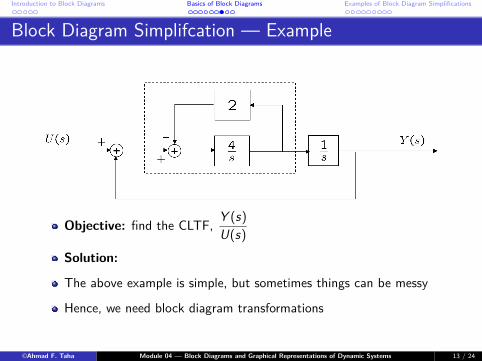
Block Diagram Simplifcation — Example
Objective: find the CLTF, Y (s)U(s)
Solution:
The above example is simple, but sometimes things can be messy
Hence, we need block diagram transformations
©Ahmad F. Taha Module 04 — Block Diagrams and Graphical Representations of Dynamic Systems 13 / 24
Introduction to Block Diagrams Basics of Block Diagrams Examples of Block Diagram Simplifications
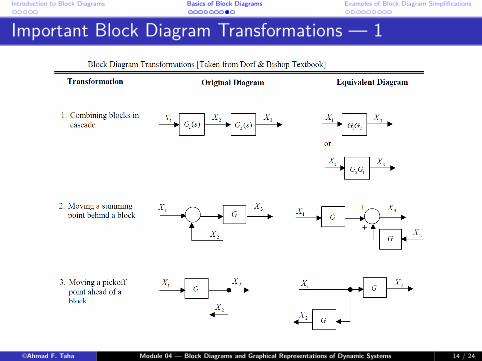
Important Block Diagram Transformations — 1
©Ahmad F. Taha Module 04 — Block Diagrams and Graphical Representations of Dynamic Systems 14 / 24
Introduction to Block Diagrams Basics of Block Diagrams Examples of Block Diagram Simplifications
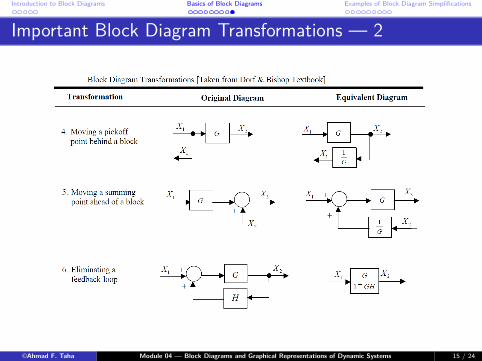
Important Block Diagram Transformations — 2
©Ahmad F. Taha Module 04 — Block Diagrams and Graphical Representations of Dynamic Systems 15 / 24
Introduction to Block Diagrams Basics of Block Diagrams Examples of Block Diagram Simplifications
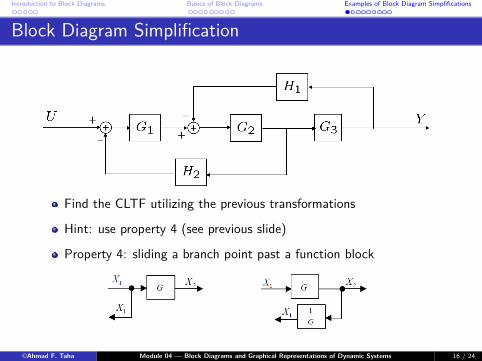
Block Diagram Simplification
Find the CLTF utilizing the previous transformations
Hint: use property 4 (see previous slide)
Property 4: sliding a branch point past a function block
©Ahmad F. Taha Module 04 — Block Diagrams and Graphical Representations of Dynamic Systems 16 / 24
Introduction to Block Diagrams Basics of Block Diagrams Examples of Block Diagram Simplifications
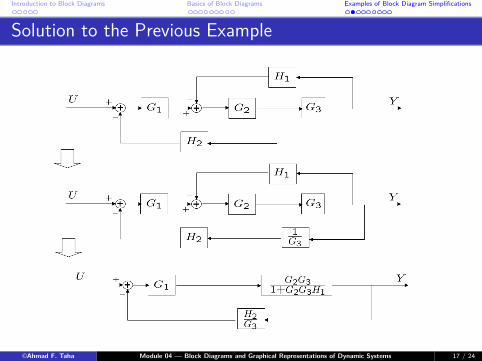
Solution to the Previous Example
©Ahmad F. Taha Module 04 — Block Diagrams and Graphical Representations of Dynamic Systems 17 / 24
Introduction to Block Diagrams Basics of Block Diagrams Examples of Block Diagram Simplifications
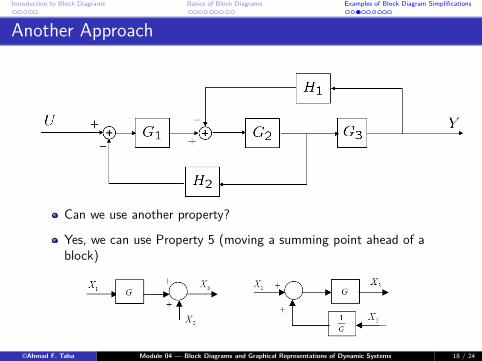
Another Approach
Can we use another property?
Yes, we can use Property 5 (moving a summing point ahead of ablock)
©Ahmad F. Taha Module 04 — Block Diagrams and Graphical Representations of Dynamic Systems 18 / 24
Introduction to Block Diagrams Basics of Block Diagrams Examples of Block Diagram Simplifications
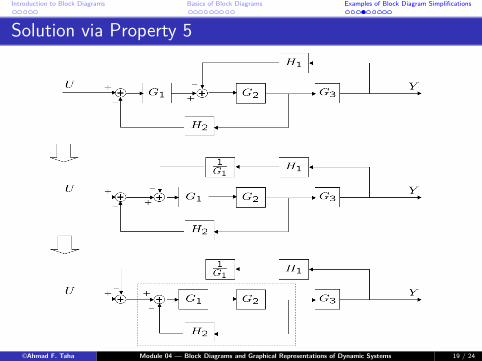
Solution via Property 5
©Ahmad F. Taha Module 04 — Block Diagrams and Graphical Representations of Dynamic Systems 19 / 24
Introduction to Block Diagrams Basics of Block Diagrams Examples of Block Diagram Simplifications
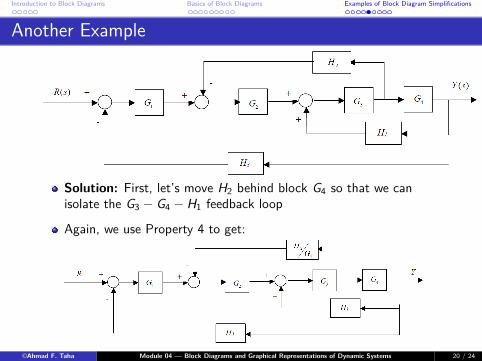
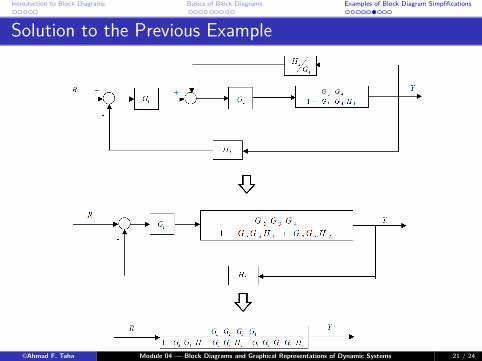
Another Example
Solution: First, let’s move H2 behind block G4 so that we canisolate the G3 − G4 − H1 feedback loop
Again, we use Property 4 to get:
©Ahmad F. Taha Module 04 — Block Diagrams and Graphical Representations of Dynamic Systems 20 / 24
Introduction to Block Diagrams Basics of Block Diagrams Examples of Block Diagram Simplifications
Solution to the Previous Example
©Ahmad F. Taha Module 04 — Block Diagrams and Graphical Representations of Dynamic Systems 21 / 24
Introduction to Block Diagrams Basics of Block Diagrams Examples of Block Diagram Simplifications
Mason’s Formula
The previous approach can be a bit tricky in some scenarios
It’s a great approach if you can see things easily
If you can’t or don’t want to, there’s a more algorithmic approach
Mason’s Formula:– A systematic way to compute TFs from any input to any output
– Based on an algorithmic method and signal flow graphs
– Not discussed in class, but you can read more about (Mason’s GainRule handout on Blackboard)
©Ahmad F. Taha Module 04 — Block Diagrams and Graphical Representations of Dynamic Systems 22 / 24
Introduction to Block Diagrams Basics of Block Diagrams Examples of Block Diagram Simplifications
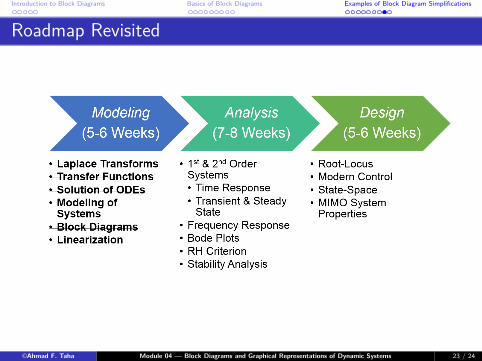
Roadmap Revisited
©Ahmad F. Taha Module 04 — Block Diagrams and Graphical Representations of Dynamic Systems 23 / 24

Introduction to Block Diagrams Basics of Block Diagrams Examples of Block Diagram Simplifications
Questions And Suggestions?
Thank You!Please visit
engineering.utsa.edu/˜tahaIFF you want to know more ,
©Ahmad F. Taha Module 04 — Block Diagrams and Graphical Representations of Dynamic Systems 24 / 24