Embed Size (px)
Citation preview
Modulation of RNA Cytosine-5 Methylation by Neuronal Activity
and Methyl-donor Folate
Xiguang Xu
Dissertation submitted to the faculty of the Virginia Polytechnic Institute and State University
in partial fulfillment of the requirements for the degree of
Doctor of Philosophy
In
Biological Sciences
Hehuang Xie, Chair
Liwu Li
Kenneth Oestreich
Michael Fox
May 12, 2020
Blacksburg, Virginia
Keywords: RNA cytosine-5 methylation, RNA bisulfite sequencing, neuronal activity, neural
stem cell, folic acid
Copyright© 2020, Xiguang Xu
Modulation of RNA Cytosine-5 Methylation by Neuronal Activity and Methyl-donor Folate
Xiguang Xu
ABSTRACT
RNA epigenetics or Epitranscriptomics has emerged as a new field for understanding the
post-transcriptional regulation of gene expression by RNA modifications. Among numerous types
of RNA modifications, RNA cytosine-5 methylation (5-mrC) is recognized as an important
epitranscriptomic mark that modulates mRNA transportation, stability and translation.
In chapter 1, we summarize the currently available approaches to detect 5-mrC
modification at global, transcriptome-wide and locus-specific levels, and compare the
corresponding advantages and disadvantages of the techniques. We further focus on the
bioinformatics data analysis of RNA bisulfite sequencing datasets by comparing existing packages
with respect to key parameters for alignment and methylation calling and filtering of potentially
false positive 5-mrC sites.
To investigate the dynamic regulation of 5-mrC modification, as described in chapter 2,
we adopt a widely used neuronal activity model, and perform RNA sequencing (RNA-seq) and
RNA bisulfite sequencing (RNA BS-seq) to profile gene expression as well as transcriptome-wide
5-mrC modification. We have identified distinct gene expression profiles and differentially
methylated 5-mrC sites (DMS) in neurons upon activation, and the genes with DMS sites are
enriched with mitochondrial and synaptic functions. Moreover, it reveals a negative correlation
between RNA methylation and mRNA expression in mouse cortical neurons during neuronal
activity. Thus, these findings identify the dynamic regulation of 5-mrC modification during
neuronal activity and reveal a potential link between RNA methylation and mRNA expression.
In chapter 3, we investigate the effect of folate, a methyl-donor, on RNA cytosine-5
methylation (5-mrC) modification in adult mouse neural stem cells (NSCs). Compared to the
control, NSCs cultured in folate deficiency or supplementation condition have shown no changes
in mRNA expression, but significant changes in mRNA translation efficiency. RNA bisulfite
sequencing of both total and polysome poly(A) RNA samples shows distinct 5-mrC profiles in
NSCs treated with different concentrations of folic acid. It also shows consistent hypermethylation

in polysome mRNAs than that in total mRNAs. This study presents the comprehensive influence
of folate deficiency and supplementation on RNA cytosine-5 methylation and mRNA translation.
Modulation of RNA Cytosine-5 Methylation by Neuronal Activity
and Methyl-donor Folate
Xiguang Xu
GENERAL AUDIENCE ABSTRACT
RNA epigenetics, a collection of RNA modifications, has recently emerged as an exciting,
new field for understanding post-transcriptional regulation of gene expression. RNA cytosine-5
methylation (5-mrC) is one of the most well-known RNA modifications that modulates mRNA
export, stability and translation.
In the first chapter, we summarize the currently available methods for the measurement of
5-mrC modification. We highlight one of the techniques, RNA bisulfite sequencing (RNA BS-seq)
and focus on the bioinformatics data analysis of RNA BS-seq datasets. We have compared several
existing tools in regard of the key parameters in data analysis.
In the second chapter, we adopt a widely used neuronal activity model to study the dynamic
regulation of RNA cytosine-5 methylation (5-mrC). We perform RNA-seq and RNA BS-seq in
neurons in response to stimulation. We have identified numerous differentially expressed genes
and differentially methylated 5-mrC sites in activated neurons and find that these DMS-related
genes are associated with mitochondrial and synaptic functions. Furthermore, we identify a
negative correlation between RNA methylation and mRNA expression, indicating a potential role
of 5-mrC modification in the regulation of mRNA expression.
In the third chapter, we investigate the influence of a nutrient supplement, folic acid, on 5-
mrC modification in adult mouse neural stem cells. Compared to the control, NSCs cultured in
folate deficiency or supplementation condition have shown no changes in mRNA expression, but
significant changes in mRNA translation efficiency. We perform RNA bisulfite sequencing of both
total poly(A) RNA samples and polysome poly(A) RNA samples. We identify distinct 5-mrC
profiles in NSCs treated with different concentrations of folic acid. It shows consistent
hypermethylation in polysome mRNAs than that in total mRNAs. This study presents the
comprehensive influence of folate deficiency and supplementation on RNA cytosine-5
methylation and mRNA translation.

v
ACKNOWLEDGMENTS
First and foremost, I thank my advisor, Dr. Hehuang David Xie, for his invaluable guidance
and support throughout my Ph.D. journey. I truly appreciate the opportunity to explore science in
the exciting field of epigenetics (DNA methylation) and the emerging field of epitranscriptomics
(RNA methylation) with the state-of-art Next Generation Sequencing (NGS) techniques. During
the training process, I have gained a lot of experience in library construction for high-throughput
sequencing. In addition to the essential technique of library construction, I have learned how to
develop critical thinking on biological questions, to learn leadership in the research group, to
transform from a dependent Ph.D. student to an independent researcher. I know there is still a long
way to go. Dr. Xie is leading me on that way. Thank you!
My special thanks go to my co-advisor, Dr. Liwu Li, who has been generously offering
help and support, giving me priceless advice on research, sharing his research experiences and
offering help in my defense. I thank my committee members, Dr. Michael Fox and Dr. Kenneth
Oestreich, for their insightful feedback, comments and suggestions on my research and writing.
I’m grateful to have such a dedicated committee that has been guiding me in each stage during my
entire Ph.D. program.
During the research, I have received a lot of help from our collaborators. I thank Dr. James
Smyth and his Ph.D. student Rachel Padget for their generous help in polysome fractionation
preparation. I thank Dr. Michelle Theus and Dr. Xinyu Zhao for their advice in adult mouse neural
stem cell isolation and culture. I thank Dr. Alicia Pickrell for her help in the preparation of
lentivirus for knockdown experiments. I thank Dr. Michael Fox and his former Ph.D. student
Aboozar Monavarfeshani for their collaboration in the paper “Retinal-input-induced epigenetic
dynamics in the developing mouse dorsal lateral geniculate nucleus”.
I thank my current and previous lab members. I thank Xiaoran Wei, Natalie Melville and
Zachary Johnson for their generous time and effort in bioinformatics data analysis. I thank Alex
Murray, Razan Alajoleen, Dr. Jiayi Fan for their help in experiments. I thank our former lab
members, Dr. Ming-an Sun, Dr. Zhixiong Sun, Jianlin He, and Dr. Sharmi Banerjee for their help
in bioinformatics analysis and experiments. I thank the undergraduates that I worked with, Niki
Armstrong, Karen Huang, Megan Harrigan, for their curiosity in science and help in experiments.
I thank Amanda Wang for her help in editing my writing. It’s my pleasure to work with them.

vi
I thank my friends in the Blacksburg Chinese Community: Johnny Yu, Dr. Y.A. Liu, Ziwei
Zuo, Waifong Chan, Qiang Li, Xiaoqi Li, Yu Zhou, Ming Xie, Yuchang Wu, …, a long list. I
received so much help and support from this community. We have had very impressive fellowship
and reunion time during the past years and will continue the friendship in the future. Friendship is
an indispensable part of my Ph.D. life in Blacksburg.
Lastly, I thank my family: my wife, my parents, my elder brother and sister, and my
parents-in-law, who supported my academic pursuits, and provided the help at every stage of my
personal life. My special thanks go to my wife, Yanan Jiao, my two lovely kids, Jeremy and Jasper.
You’re my endless source of happiness and inspiration. I love you all!
vii
Tables of Contents
ABSTRACT...............................................................................................................................ii
GENERALAUDIENCEABSTRACT..............................................................................................iv
ACKNOWLEDGMENTS.............................................................................................................v
TablesofContents.................................................................................................................vii
ListofFigures..........................................................................................................................x
ListofTables..........................................................................................................................xi
ListofAbbreviations..............................................................................................................xii
Chapter1-AdvancesinMethodsandSoftwareforRNACytosineMethylationAnalysis........1
1.1Abstract......................................................................................................................................2
1.2Background................................................................................................................................3
1.3TechniquesforthedetectionofRNACytosine-5methylation.....................................................4
1.3.1Globalassessmentofthe5-mrClevel........................................................................................5
1.3.2Transcriptome-wideapproachestogenerate5-mrCprofiles....................................................5
1.3.3Locus-specificapproachestodeterminemethylationwithinagivenmRNA.............................7
1.4DataanalysisforRNAcytosine-5methylationstudies.................................................................9
1.4.1SharedstepsforRNAbisulfitesequencingdataanalysis.........................................................10
1.4.2ComparisonofexistingtoolsforRNAbisulfitesequencingdataanalysis................................11
1.5ConclusionsandFuturePerspectives........................................................................................13
1.6References................................................................................................................................13
Chapter2-NeuronalActivityModifiesRNACytosine-5MethylationLandscapeinMouse
CorticalNeuron.....................................................................................................................18
2.1Abstract....................................................................................................................................19
2.2Background..............................................................................................................................20
2.3Methods...................................................................................................................................21
2.4Results......................................................................................................................................25
2.4.1Distinctgeneexpressionprofileuponneuronalactivation......................................................25
viii
2.4.2Distributionprofileof5-mrCinmousecorticalneurons..........................................................28
2.4.3Dynamic5-mrClandscapeuponneuronalactivation...............................................................31
2.4.4RNAmethylationnegativelycorrelateswithmRNAexpressioninneuronsuponneuronal
activation...........................................................................................................................................32
2.5Discussion................................................................................................................................34
2.6Supplementarydata.................................................................................................................36
SupplementaryFigure1.ReproducibilitybetweenreplicatesinRNA-seqdatasets.........................36
SupplementaryFigure2.GOannotationofdifferentiallyexpressedgenesinneuronsupon
activation...........................................................................................................................................37
SupplementaryFigure3.Expressionprofileoflateresponsegenes.................................................38
SupplementaryFigure4.ReproducibilitybetweenreplicatesinRNABS-seqdatasets.....................39
SupplementaryFigure5.GOannotationofmRNAscontaining5-mrCsites.....................................39
2.7References................................................................................................................................40
Chapter3-InfluenceofFolateonRNACytosine-5MethylationinNeuralStemCells.............42
3.1Abstract....................................................................................................................................43
3.2Background..............................................................................................................................44
3.3Methods...................................................................................................................................46
3.4Results......................................................................................................................................50
3.4.1Distributionprofileof5-mrCintotalmRNAsinadultmouseneuralstemcells.......................50
3.4.2FolateinduceschangesintotalmRNAmethylationinadultmouseneuralstemcells............55
3.4.3Distributionprofileof5-mrCinpolysomemRNAsinadultmouseneuralstemcells...............57
3.4.4FolateinduceschangespolysomemRNAmethylationinadultmouseneuralstemcells........60
3.4.5Distinct5-mrCprofileintotalandpolysomemRNAinadultmouseneuralstemcells............61
3.4.6FolateinduceschangesinmRNAtranslationinadultmouseneuralstemcells.......................64
3.5Discussion................................................................................................................................66
3.6Supplementarydata.................................................................................................................67
SupplementaryFigure1.Reproducibilityof5-mrCsitesbetweenreplicatesintotalpoly(A)RNABS-
seqdatasets.......................................................................................................................................67
SupplementaryFigure2.GOannotationof5-mrCcontainingmRNAsinNSCs.................................68
SupplementaryFigure3.Schematicdiagramofpolysomefractionation.........................................69
SupplementaryFigure4.Reproducibilityof5-mrCsitesbetweenreplicatesinpolysomepoly(A)
RNABS-seqdatasets..........................................................................................................................69
ix
SupplementaryFigure5.Reproducibilitybetweenreplicatesintotalandpolysomepoly(A)RNA-seq
datasets.............................................................................................................................................70
3.7References................................................................................................................................70
Chapter4–ConclusionsandFutureDirections......................................................................75
4.1Conclusions..............................................................................................................................75
4.2Futuredirections......................................................................................................................76
4.3References................................................................................................................................77
x
List of Figures
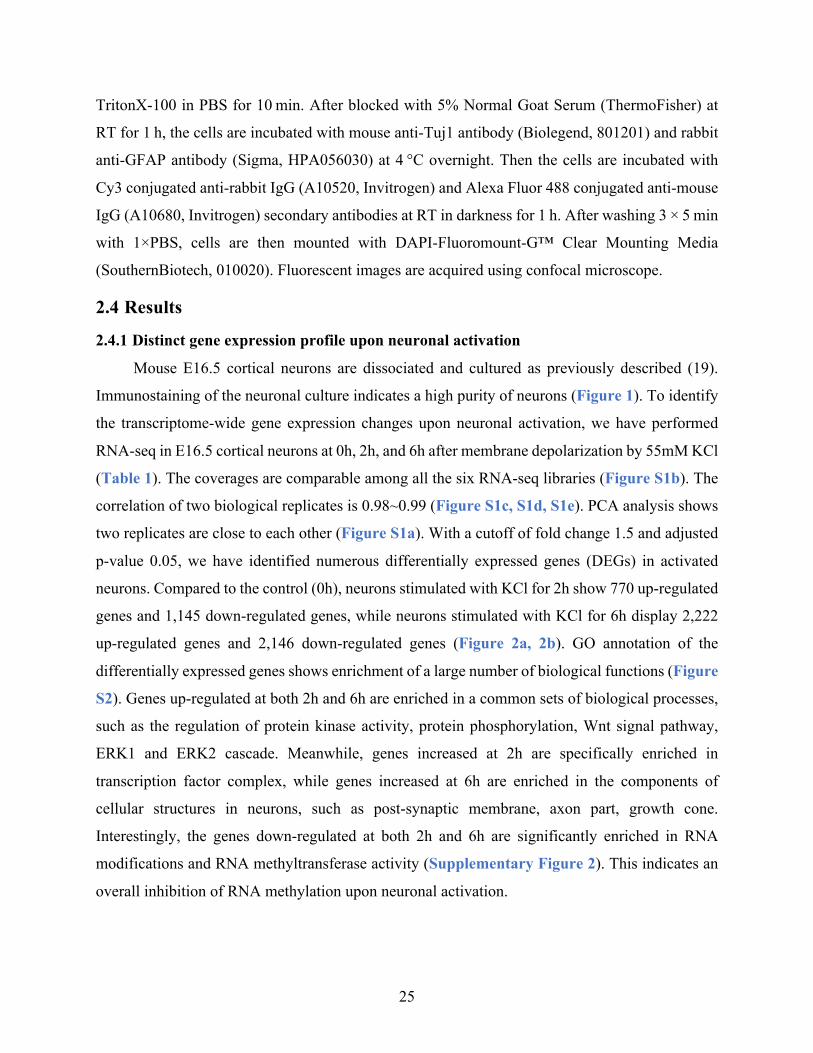
Figure 2-1 Characterization of E16.5 cortical neuronal culture ................................................... 26
Figure 2-2 Neuronal activity induces distinct gene expression profiles ....................................... 27
Figure 2-3 Distribution profile of 5-mrC modification in mouse cortical neurons during neuronal
activity ........................................................................................................................................... 30
Figure 2-4 Neuronal activity induces RNA methylation changes in neurons .............................. 32
Figure 2-5 5-mrC hypermethylation negatively correlates with mRNA expression .................... 34
Figure 3-1 Characterization of adult mouse neural stem cell (NSC) culture ................................ 51
Figure 3-2 Distribution profile of 5-mrC modification in adult mouse NSCs .............................. 54
Figure 3-3 Folate induces RNA methylation changes in total mRNAs in adult mouse NSCs ..... 56
Figure 3-4 Distribution profile of 5-mrC in polysome mRNAs in adult mouse NSCs ................ 59
Figure 3-5 Folate induces RNA methylation changes in polysome mRNAs in adult mouse NSCs
....................................................................................................................................................... 61
Figure 3-6 Distinct methylation profiles of 5-mrC modification in total and polysome mRNAs in
NSCs ............................................................................................................................................. 63
Figure 3-7 Identification of differentially translated genes in NSCs with different concentration of
folate ............................................................................................................................................. 65
xi
List of Tables
Table 1-1 Summary of techniques for the detection of RNA cytosine-5 methylation (5-mrC) ..... 8
Table 1-2 Comparison of filters in RNA BS-seq data analysis pipeline from different studies ... 12
Table 2-1 Mapping statistics of RNA-seq datasets ....................................................................... 27
Table 2-2 Mapping statistics of RNA BS-seq datasets ................................................................. 28
Table 3-1 Mapping statistics of total and polysome poly(A) RNA-seq data ................................ 51
Table 3-2 Mapping statistics of total and polysome poly (A) RNA BS-seq data ......................... 52
xii
List of Abbreviations
Symbol Description
3'UTR 3' untranslated region
5-hmrC 5-hydroxymethylcytosine
5-mrC RNA cytoine-5 methylation
5'UTR 5' untranslated region
ALYREF ALY/REF export factor
ASD Autism spectrum disorder
Aza-IP 5-azacytidine-mediated RNA immunoprecipitation
bFGF basic fibroblast growth factor
bp Base pair
CDS Coding sequence
CHX cyclohexamide
CPM counts per million
DEG differentially expressed gene
DMS differentially methylated site
DNMTs DNA methyltransferases
dsRNA double-strand RNA
DTG differentially translated gene
EGF epidermal growth factor
ELISA Enzyme-Linked Immunosorbent Assay
FA folic acid
GO Gene ontology
GSC germline stem cell
HF high folate
LC–MS Liquid chromatography coupled with tandem mass spectrometry
LF low folate
m1A 1-Methyladenosine
m6A N6-methyadenosine
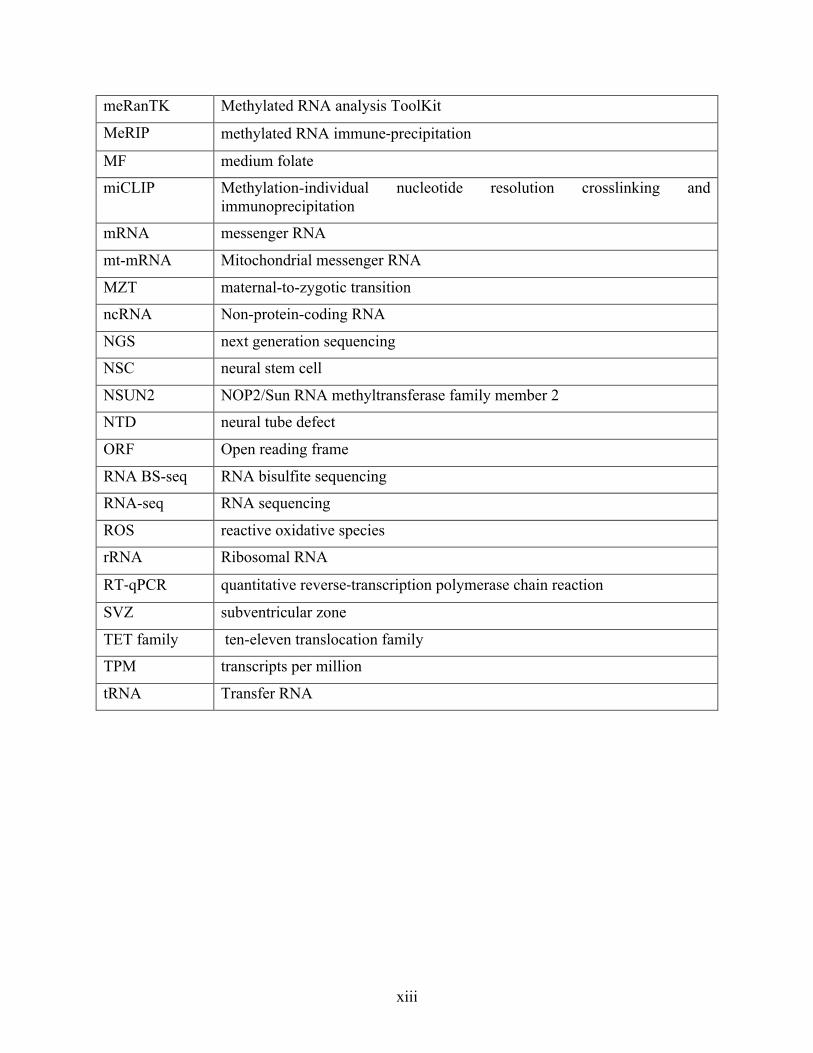
xiii
meRanTK Methylated RNA analysis ToolKit
MeRIP methylated RNA immune-precipitation
MF medium folate
miCLIP Methylation-individual nucleotide resolution crosslinking and immunoprecipitation
mRNA messenger RNA
mt-mRNA Mitochondrial messenger RNA
MZT maternal-to-zygotic transition
ncRNA Non-protein-coding RNA
NGS next generation sequencing
NSC neural stem cell
NSUN2 NOP2/Sun RNA methyltransferase family member 2
NTD neural tube defect
ORF Open reading frame
RNA BS-seq RNA bisulfite sequencing
RNA-seq RNA sequencing
ROS reactive oxidative species
rRNA Ribosomal RNA
RT-qPCR quantitative reverse-transcription polymerase chain reaction
SVZ subventricular zone
TET family ten-eleven translocation family
TPM transcripts per million
tRNA Transfer RNA
1
Chapter 1 - Advances in Methods and Software for RNA Cytosine
Methylation Analysis
Xiguang Xu1,2, Xiaoran Wei1,3, Hehuang Xie1,2,3*
1. Fralin Life Sciences Institute at Virginia Tech, Blacksburg, VA 24061, USA
2. Department of Biological Sciences, Virginia Tech, Blacksburg, VA 24061, USA
3. Department of Biomedical Sciences and Pathobiology, Virginia-Maryland College of
Veterinary Medicine, Blacksburg, VA 24061, USA
*Corresponding author: Email: [email protected]
History: Received 3 August 2019, Revised 2 October 2019, Accepted 29 October 2019, Available
online 31 October 2019.
Citation: Xu, X., et al. (2019). "Advances in methods and software for RNA cytosine methylation
analysis." Genomics.
Author contributions
Conceptualization, X.X. and H.X.; original draft preparation and editing, X.W., X.X. and H.X.;
funding acquisition, H.X.
2
Highlights
l Epitranscriptomics is an exciting, new field for understanding the fundamental
mechanisms underlying RNA modifications and their impact on gene expression.
l Cytosine methylation in mRNA (5-mrC) is an important epitranscriptomic mark that
modulates mRNA transportation, translation, and stability at the post-transcriptional
level.
l This short review summarizes the experimental techniques that are exploited to determine
5-mrC in mRNA and the computational procedures implemented for RNA bisulfite
sequencing data analysis.
1.1 Abstract Our understanding of RNA modifications has been growing rapidly over the last decade.
Epitranscriptomics has recently emerged as an exciting, new field for understanding the
fundamental mechanisms underlying RNA modifications and their impact on gene expression.
Among the over one hundred different kinds of RNA modifications, cytosine methylation in
mRNA (5-mrC) is now recognized as an important epigenetic mark that modulates mRNA
transportation, translation, and stability at the post-transcriptional level. Across plant and animal
species, recent studies have revealed the roles of mRNA cytosine methylation in several
fundamental biological processes. In mammals, genome-wide profiling has determined thousands
of mRNA transcripts carrying the 5-mrC modification in a tissue specific manner. Here, we
summarize the experimental techniques that were exploited to determine 5-mrC in mRNA and the
computational procedures implemented for RNA bisulfite sequencing data analysis.
Keywords: RNA cytosine methylation; post-transcriptional regulation; RNA bisulfite sequencing;
methylation data analysis
3
1.2 Background “RNA epigenetics” or “epitranscriptomics” is an emerging new field in the study of RNA
post-transcriptional modification (1-3). Currently, around 170 distinct types of RNA modifications,
including N6-methyladenosine, N1-methyladenosine, 5-methylcytosine, and 5-
hydroxymethylcytosine, have been identified (4). The N6-methyladenosine modification in
poly(A) RNA has been extensively studied and was found to regulate messenger RNA (mRNA)
splicing, stability, and translation efficiency in diverse biological processes (5-7). RNA cytosine
methylation (5-mrC) is another important form of RNA modification. In the 1960’s, studies
identified the presence of 5-mrC in ribosomal RNA (8). Later studies showed that 5-mrC was not
only found in rRNA and tRNA but was also found in mRNA and non-coding RNA from all three
domains of life: Archaea, Bacteria, and Eukarya (9-14).
In recent years, several pivotal findings have been reported regarding the writers, erasers,
and readers of 5-mrC in RNA. In mammalian cells, the addition of a methyl group on the fifth
carbon of cytosine in RNA is catalyzed by a large protein family called the NOP2/Sun domain
RNA methyltransferases (NSUN) and by DNA methyltransferase 2 (12, 15, 16). Both Yang et. al
and Huang et. al identified that NSUN2 is the major RNA methyltransferase mediating the
formation of 5-mrC in mRNAs (14, 17). Previous studies showed that the ten-eleven translocation
(TET) family of Fe(II)- and 2-oxoglutarate-dependent dioxygenases function as DNA
demethylases via sequential oxidation of 5-methylcytidine to yield 5-hydroxymethylcytidine, 5-
formylcytidine, 5-carboxylcytidine, and eventually unmethylated cytosines (18-21). Interestingly,
5-mrC in RNA can be oxidized by TET enzymes (TET1, TET2, TET3) to 5-
hydroxymethylcytosine (22), and then further oxidized to 5-formylcytosine (23) and 5-
carboxylcytosine (24). The molecular mechanism that mediates the conversion of 5-
carboxylcytosine to unmethylated Cs in RNA remains elusive. Very little information has been
gained about 5-mrC reader proteins. Aly/REF Export Factor (ALYREF) was recently identified as
a 5-mrC specific binding protein that mediates target mRNAs export from the nucleus to the
cytoplasm (14), indicating the critical role of 5-mrC reader protein in RNA metabolism.
Advances in next generation sequencing (NGS) accelerated the development of high-
throughput 5-mrC detection methods, which provided a comprehensive view of 5-mrC distribution
4
across the transcriptome. Transcriptome-wide distribution of 5-mrC has been revealed in poly(A)
RNAs from a broad range of mammalian cell lines and tissues (13, 14, 17, 25). Almost all recent
transcriptome-wide studies showed that methylated cytosines are preferentially enriched around
the translation initiation sites (TIS) of mRNAs (13, 14, 17), indicating an important regulatory role
of RNA cytosine methylation on the translation of mRNAs. Moreover, cytosine methylation in
mRNA regulates systemic mRNA mobility and promotes mRNA nuclear export (14). In
Arabidopsis thaliana, 5-mrC are significantly enriched in graft-mobile mRNAs that can be
transported over graft junctions to distinct plant parts (26). Together with RNA-binding proteins,
methylated RNA and RNA methyltransferases gain the ability to mediate the interactions between
transcription factors and genomic DNA to participate in chromatin organization (27). Despite these
recent findings, the functional roles of 5-mrC in mRNA during biological processes and their
relevance to human disease are just beginning to be understood.
In this review, we focus on the experimental techniques and corresponding data analysis of mRNA
cytosine methylation. We summarize current available approaches for detecting RNA cytosine-5
methylation at the global, transcriptome-wide and locus-specific levels. Additionally, we
emphasize the bioinformatics data analysis of RNA bisulfite sequencing datasets by comparing
key features of three published packages, meRanTK, BS-RNA, and BisRNA (28-30), and discuss
the major issues in the analysis of RNA bisulfite sequencing data.
1.3 Techniques for the detection of RNA Cytosine-5 methylation Methylation at position 5 of cytosine in mRNA was discovered over 40 years ago (9, 10).
Most of the early studies on 5-mrC relied on radial labelling and paper chromatography (10). Due
to the lack of reliable and sensitive techniques for 5-mrC detection, the distribution and functional
roles of 5-mrC in low abundance mRNA has remained largely unknown over the past four decades.
Recent advances in NGS techniques have enabled a transcriptome-wide view of 5-mrC distribution
in diverse biological processes, broadening our understanding of the functional roles of RNA
cytosine methylation. Below, we summarized currently available approaches for detecting 5-mrC
at the global, transcriptome-wide, and locus-specific levels (Table 1). The advantages and
limitations of these techniques, including future directions, are discussed.
5
1.3.1 Global assessment of the 5-mrC level
The global level of 5-mrC modification in mRNA refers to the sum of all 5-mrC that can
be identified in all mRNA transcripts from a given cell or tissue sample. Since tRNA and rRNA
molecules are rich in 5-mrC modifications, one key step of the global approach for detecting 5-
mrC in mRNA is to remove undesired RNA species. RNA dot blot and mass spectrometry are
frequently used global approaches. Dot blot is a traditional technique that has been widely used to
measure the level of protein expression (31). This technique was later applied to detect base
modifications, such as 5-mC, in DNA (19) and RNA (32). RNA dot blot for 5-mrC utilizes the
anti-5-mrC antibody to measure the levels of 5-mrC in RNA samples. The signal density captured
represents the relative 5-mrC level. RNA dot blot results are regarded as qualitative or semi-
quantitative data. Despite the straightforward signal provided, the RNA dot blot may not be able
to detect slight changes in RNA methylation. Anti-5-mrC antibody has also been explored in
Enzyme-Linked Immunosorbent Assay (ELISA)-based approaches (33, 34). The standard curve,
generated with controls at different methylation levels, allows the ELISA-based kit to accurately
quantitate the global level of 5-mrC in RNA. Like dot blot, an ELISA-based kit accepts a wide
range of input RNA samples from vertebrate, plant, and microbial sources.
Liquid chromatography coupled with tandem mass spectrometry (LC–MS) is an accurate,
quantitative approach to assess the 5-mrC level globally (14, 22, 23). Prior to the analysis, a critical
step that should be taken is to completely digest the input RNA molecules into individual
ribonucleotides. With a 5-mrC standard as a positive reference, LC-MS separates individual
ribonucleotides to obtain the absolute 5-mrC level in a given RNA sample. RNA dot blot, ELISA
and mass spectrometry can provide the global methylation level but not locus-specific methylation
information. In other words, even if no change in 5-mrC level can be detected with these global
approaches, some mRNA transcripts could have different levels of methylation modification at
specific cytosines.
1.3.2 Transcriptome-wide approaches to generate 5-mrC profiles
A transcriptome-wide view of the 5-mrC profile may be achieved via antibody-based or
bisulfite conversion-based approaches coupled with high-throughput sequencing. RNA
immunoprecipitation of 5-mrC, followed by deep-sequencing (5-mrC-RIP-seq) utilizes 5-mrC-
specific antibodies to enrich 5-mrC-modified RNAs (11, 35). The use of antibodies enables the
enrichment of mRNA transcripts with low 5-mrC levels, which may go undetected in a large pool
6
of unmethylated RNA molecules. In addition, 5-mrC-RIP-seq allows distinction of RNA having
the 5-mrC modification from RNA having other methylation modifications such as 5-hmrC. Not
surprisingly, the specificity of such an approach is highly dependent on the antibody used. Non-
specific bound RNA may be introduced in the immunoprecipitation process as well. The sequence
reads generated for RNA pulled down by anti-5-mrC antibodies are usually 100-150 nt in length.
Thus, the resolution of 5-mrC-RIP-seq for methylation detection is not at the single-nucleotide
level.
5-azacytidine-mediated RNA immunoprecipitation (Aza-IP) utilizes 5-azacytidine, a
cytidine analog that traps its target RNA methyltransferase by forming a stable RNA
methyltransferase-RNA adduct. Covalently bound enzyme-RNA complexes may be
immunoprecipitated with either tag- or enzyme-specific antibodies. The target RNA with 5-Aza-
C is eventually read as a guanine during reverse transcription and sequencing (36). The most
significant advantage is that this technique allows for identification of enzyme-specific cytosine
substrates at single-nucleotide resolution. Due to stable covalent binding between the RNA
methyltransferase and the 5-azacytidine, the enzyme-RNA substrate complexes can be
immunoprecipitated with highly stringent washes, thus largely reducing the non-specific binding
of unmethylated RNA. However, efficient enrichment of the enzyme-RNA complexes depends
highly on the specific antibodies against the target enzymes or the expression of epitope-tagged
enzymes in the target cells. The incorporation efficiency of the cytidine analog 5-Aza is also a
concern. The methylation targets in nascent RNA molecules without 5-Aza incorporations will be
missed. Furthermore, genomic DNA in somatic tissues is heavily methylated and 5-Aza may
incorporate into DNA molecules, particularly in proliferating cells. Such altered DNA methylation
profiles may lead to differential gene expression and, thus, may influence the transcription profile.
Methylation-individual nucleotide resolution crosslinking and immunoprecipitation
(miCLIP) is a customized technique derived from the individual-nucleotide-resolution
crosslinking and immunoprecipitation (iCLIP) method, which allows the detection of RNA
methyltransferase-specific substrate sites at nucleotide resolution (37). This technique has been
used to identify NSUN2 and NSUN3 substrates (38, 39). The point mutation of the conserved
cysteine that is needed within the catalytic domain of RNA methyltransferases for the release of
methylated RNA from the enzyme results in the irreversible formation of covalent RNA-enzyme
complex at the methylation sites. Covalent crosslinking of the RNA-protein complex leaves a short
7
peptide at the target 5-mrC site, which stalls the reverse transcription during library construction.
As a result, all sequences end at the methylation site (38, 39). Despite its robustness and high
specificity, miCLIP requires the generation of mutant enzymes, which is expensive and time-
consuming.
Bisulfite sequencing was originally developed to detect the 5-mC sites in genomic DNA
(40). In the presence of sodium bisulfite, unmethylated cytosines are converted to uracils, which
are later replaced by thymines during subsequent PCR amplification, while methylated cytosines
remain unchanged. In recent years, bisulfite sequencing has been modified to identify the 5-mrC
profile in RNAs on a transcriptome-wide scale (41). After the initial development of RNA bisulfite
sequencing, this technique has been commercialized and various RNA bisulfite conversion kits are
available, including the EZ RNA Methylation Kit from ZymoResearch and Methylamp RNA
Bisulfite Conversion Kit from Epigentek (42). The primary advantage of this technique is that it
can provide a transcriptome-wide view of 5-mrC deposition at single-nucleotide resolution.
However, bisulfite sequencing has the limitation that it cannot differentiate 5-methylcytosine from
5-hydroxymethylcytosine, as both are resistant to deamination, but the level of 5-hmrC is very low
in human and mouse mRNAs (23, 43). The ratio between 5-hmrC:5-mrC is estimated to be around
1:5,000 (22), making RNA bisulfite sequencing an attractive approach to generate the 5-mrC
profile. Bisulfite treatment results in significant degradation of RNA, making it difficult to detect
5-mrC in low expressed mRNA molecules (44). To protect RNA integrity, RNA bisulfite
conversion is usually performed at a relatively low temperature compared to DNA bisulfite
conversion. Bisulfite conversion can also be encumbered by the secondary structures of RNAs,
such as double-strand RNA (dsRNA) and stem-loop structures. Thus, incomplete denaturation of
RNA secondary structure may introduce cytosines resistant to bisulfite conversion, which end as
false positive signals. Despite these disadvantages, RNA bisulfite sequencing has been
increasingly applied to study RNA cytosine methylation in recent years (13, 14, 17, 25, 30, 45).
1.3.3 Locus-specific approaches to determine methylation within a given mRNA
Locus-specific approaches have been developed to measure the methylation level of
specific 5-mrC sites in mRNA. The most common approach is to use 5-mrC RIP, followed by RT-
qPCR (13, 35). In this procedure, RNA molecules are fragmented and pulled down by the 5-mrC
antibody and then reverse transcribed to cDNA. Real-time qPCR is then performed to measure the
relative fold changes for specific transcripts. With appropriate controls, such as normal IgG control,
8
this approach has been used to validate the 5-mrC sites identified by RNA bisulfite sequencing
(13). RNA bisulfite conversion combined with either cloning-based (41, 45) or PCR amplicon-
based (11, 14) Sanger sequencing are another two locus-specific methylation assays commonly
used in the validation of 5-mrC sites. The cDNA template derived from bisulfite-converted RNA
was used for cloning into vectors or PCR amplification with primers fused with consensus
sequences, and then subject to Sanger sequencing. RNA bisulfite pyrosequencing may be
developed as an alternative approach to determine the 5-mrC levels for multiple cytosines in a
short stretch of RNA molecule. Similar to the pyrosequencing of bisulfite-converted DNA (46),
RNA molecules may be subjected to bisulfite conversion first prior to cDNA generation. After
reverse transcription, cDNA molecules are used as templates for PCR and pyrosequencing.
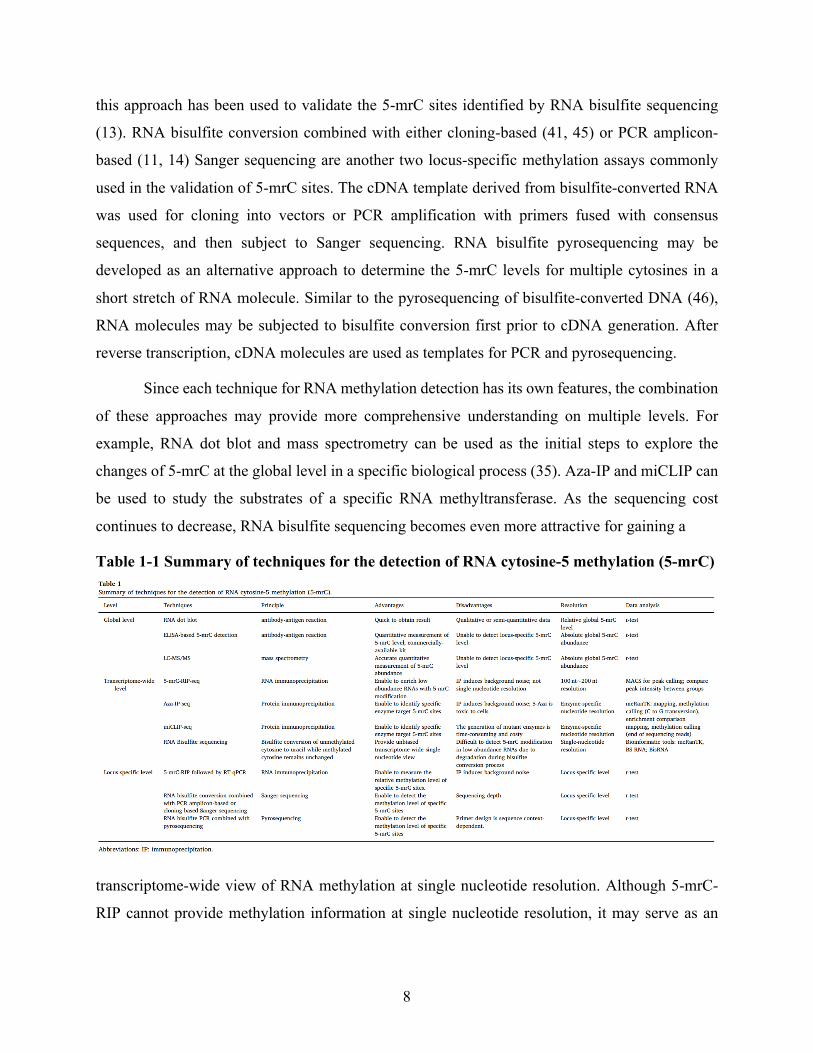
Since each technique for RNA methylation detection has its own features, the combination
of these approaches may provide more comprehensive understanding on multiple levels. For
example, RNA dot blot and mass spectrometry can be used as the initial steps to explore the
changes of 5-mrC at the global level in a specific biological process (35). Aza-IP and miCLIP can
be used to study the substrates of a specific RNA methyltransferase. As the sequencing cost
continues to decrease, RNA bisulfite sequencing becomes even more attractive for gaining a
Table 1-1 Summary of techniques for the detection of RNA cytosine-5 methylation (5-mrC)
transcriptome-wide view of RNA methylation at single nucleotide resolution. Although 5-mrC-
RIP cannot provide methylation information at single nucleotide resolution, it may serve as an
9
alternative approach to validate bisulfite sequencing results and to eliminate the false-positive 5-
mrC sites resulting from an incomplete bisulfite conversion.
1.4 Data analysis for RNA cytosine-5 methylation studies The methods used for 5-mrC data analysis depend on the types of data results obtained
with different 5-mrC detection approaches. For techniques used to detect 5-mrC at the global level
(i.e., ELISA) or at the locus-specific level (i.e., RNA bisulfite pyrosequencing), each measurement
provides a numerical number. A typical experiment often includes multiple biological or technical
replicates as one group and the research goal may embrace the determination of group differences.
A two-tailed paired Student's t-test is frequently used to determine the significance of the
methylation differences between two groups, while ANOVA can be used to compare the
methylation levels among two or more groups.
For transcriptome-wide approaches, the data analysis strategies vary depending on the
principle of each technique. The analysis of datasets generated using antibody-based techniques
follows the same principle as ChIP-seq for the identification of transcription factor binding sites.
One frequently used tool is Model-based Analysis of ChIP-Seq (MACS), which adopts a dynamic
Poisson distribution for peak calling (47). Peaks, ranked by p-value, indicate the local biases of
read coverage in the genome. The primary goal of both Aza-IP-seq and miCLIP-seq techniques is
to identify the direct RNA substrates of cytosine-5 RNA methyltransferases. The data analysis of
Aza-IP-seq includes sequence alignment, enrichment analysis and signature analysis. After the
sequences alignment, enrichment analysis is performed using the open-source USeq package to
identify transcripts that are enriched in replicate samples compared to IgG control sample.
Signature analysis is then performed using the VarScan package (48) to scan the enriched
transcripts for significant C to G transversion sites that are caused by Aza-IP but not SNPs or indel.
These transversion sites are then determined as the cytosine targets of a specific methyltransferase
(49). Despite differential methylation analysis is not desired, meRanTK toolkit provides functions
of mapping, methylation calling and enrichment comparison for Aza-IP data. Similarly, the
analysis of miCLIP-seq data is to identify enzyme-specific target sites. After sequence alignment,
the miCLIP read stop positions will be determined and read counts are normalized to per thousand
reads in the replicates. To perform differential methylation analysis for 5-mrC-RIP-seq, miCLIP-
seq, and Aza-IP-seq results, both the enrichment of peaks/sites and RNA expression level will be
10
required. Therefore, additional RNAseq data has to be generated. With the reduced cost of NGS,
RNA bisulfite sequencing is becoming the prevailing approach to study 5-mrC profiles at single
nucleotide resolution. However, the data analysis for RNA bisulfite sequencing is a challenging
task. Below, we summarize the key features for several bioinformatics packages dealing with RNA
bisulfite sequencing data.
1.4.1 Shared steps for RNA bisulfite sequencing data analysis
Like regular RNA-seq data processing, RNA bisulfite sequencing data analysis involves
steps for quality control and read alignment to references. Due to bisulfite conversion,
unmethylated cytosines in mRNA will end up as thymines after cDNA conversion. Given that, the
level of methylated cytosine in mRNA is much lower than that in genomic DNA (13) and the
frequency of C (or G in the cDNA) is extremely low in mRNA bisulfite sequencing data. For
Illumina sequencing, the sequence quality deteriorates along the read, particularly for bisulfite
sequencing reads with low GC content. Prior to sequence alignment, low quality bases should be
trimmed off from the raw RNA bisulfite sequencing reads along with adaptor sequences. Clean
reads may be obtained using software tools such as Cutadapt (50), Trim Galore!
(http://www.bioinformatics.babraham.ac.uk/projects/trim_galore), or Trimmomatic (51) to
eliminate low-quality bases.
Either an annotated genome or a transcriptome may be used as a reference for the alignment
of bisulfite sequencing reads. A step that should not be skipped is to prepare an in silico bisulfite-
converted reference. If a transcriptome is chosen as the reference, Bowtie 2 is recommended,
which is a memory-efficient, highly sensitive and accurate alignment algorithm (52). Mapping
with the transcriptome as a reference may have the issue that a sequence read may be aligned to
multiple transcripts derived from the same gene. To address this issue, the longest transcript with
the highest mapping score were usually selected as the top candidate (28). Using a large set of
small indexes, HISAT2 is a fast and sensitive splicing aware program with alignment strategies
that manage reads spanning multiple exons (53). Thus, it is a great tool to align reads to the genome.
Either using the transcriptome or the genome as a reference, the mapping efficiency is expected to
be around 70-80%. To achieve a higher mapping rate, genome and transcriptome references may
be used in sequential order. For instance, sequence reads may be mapped to the genome first, and
then aligned against the transcriptome for the reads that cannot be mapped to the genome (14).
11
1.4.2 Comparison of existing tools for RNA bisulfite sequencing data analysis
Several bioinformatics tools have been developed to aid in mapping the clean reads and
subsequent methylation calling processes (17, 28, 29). Methylated RNA analysis ToolKit
(meRanTK) is the first publicly available software specialized for high-throughput RNA cytosine
methylation data analysis (28). Written in the Perl language, it utilizes splice-aware bisulfite
sequencing read mapping to either the genome or the transcriptome. The toolkit allows for
methylation calling and the identification of differentially methylated cytosines with statistical
analysis. In addition, a package is provided by meRanTK to annotate candidate 5-mrC sites with
genomic features such as gene or transcript names and positional metrics. Worthy of mention,
MeRanTK can be used to handle Aza-IP data as well.
Similar to meRanTK, BS-RNA is another efficient and highly automated mapping and
annotation tool developed in the Perl language (29). BS-RNA only supports RNA bisulfite
sequencing data generated from directional libraries. Yet, the mapping speed of BS-RNA is much
faster than that of meRanTK. By calling the HISAT2 program, BS-RNA can finish the mapping
of 80 M 100 bp paired-end reads to the reference genome within five hours. The same job takes
over 35 hours to perform for meRanGs using STAR (54) or 101 hours for meRanGt using TopHat2
(55), which are the two variants of aligners provided by meRanTK. Similar to meRanTK, BS-
RNA can also manage “dovetailing” reads generated with paired-end sequencing, where one or
both reads seem to extend past the start of the mate read. Such “dovetailing” reads often result
from the sequence reads that have their 5’-ends trimmed.
BisRNA is a statistical modeling method for methylation calling (30). This software
integrates tailored filtering to address sequencing and alignment artifacts and data-driven statistical
modeling to eliminate the artifacts associated with bisulfite sequencing. Using BisRNA, Legrand
et. al reported that very sparse methylated Cs, or possibly none at all, can be found in mRNAs (30).
This result raises awareness for developing more reasonable and statistically reliable data analysis
strategies for RNA bisulfite sequencing datasets. BisRNA software can only be used for
methylation calling. meRanTK and BS-RNA toolkits have similar functions on handling the
processes of mapping, methylation calling, and annotation. Liang et al. performed a comparison
between BS-RNA, meRanGs and meRanGt (29). They concluded that BS-RNA has a better
performance than both meRanGs and meRanGt when dealing with simulated reads in the mapping
process. Both BS-RNA and meRanGs performed better than meRanGt when mapping published
12
single-end bisulfite sequencing reads. In the methylation calling process, although there is no
significant difference in precision among these tools, BS-RNA has a significant higher recall rate
than meRanGt and meRanGs.
Several methods have been taken to eliminate false positive sites. Most of them adopted
statistical methods to avoid false positive sites and set strict filters during methylation calling (11,
13, 14, 17). In addition, low quality and unconverted reads were excluded (11, 14, 17) and RNA
secondary structure prediction tools were used to filter bisulfite conversion-resistant sites (13, 56).
Furthermore, databases including dbSNP for single nucleotide polymorphisms (SNPs) and
REDIdb for RNA editing sites may be explored to filter candidate methylated cytosines
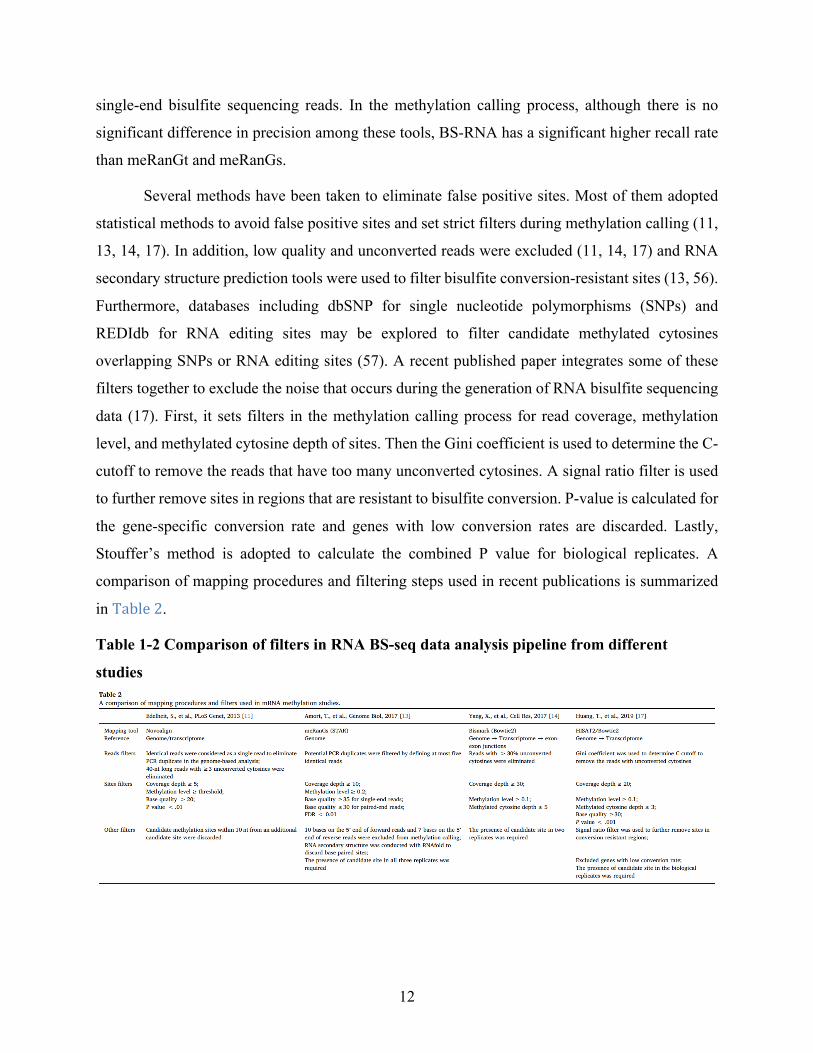
overlapping SNPs or RNA editing sites (57). A recent published paper integrates some of these
filters together to exclude the noise that occurs during the generation of RNA bisulfite sequencing
data (17). First, it sets filters in the methylation calling process for read coverage, methylation
level, and methylated cytosine depth of sites. Then the Gini coefficient is used to determine the C-
cutoff to remove the reads that have too many unconverted cytosines. A signal ratio filter is used
to further remove sites in regions that are resistant to bisulfite conversion. P-value is calculated for
the gene-specific conversion rate and genes with low conversion rates are discarded. Lastly,
Stouffer’s method is adopted to calculate the combined P value for biological replicates. A
comparison of mapping procedures and filtering steps used in recent publications is summarized
in Table2.
Table 1-2 Comparison of filters in RNA BS-seq data analysis pipeline from different
studies
13
1.5 Conclusions and Future Perspectives In the past decade, technology advancements in methylation detection has reignited interest
in the dynamics and biological impacts of 5-mrC in mRNA. However, several issues should be
taken into consideration when undertaking RNA methylation studies. mRNA molecules are prone
to heat degradation and are more chemically labile than DNA. To avoid RNA degradation, the less
aggressive conditions that are adopted in bisulfite conversion will lead to a large number of false
positive sites. Thus, it is critical to ensure successful bisulfite conversion, i.e., by monitoring the
bisulfite conversion rate of spike-in RNA controls. On the other hand, over 60% of cytosines in
mRNA have methylation levels of less than 20% in mammals (14, 17). This poses a challenge to
accurately determining all the methylation sites in a given sample. The multiple filtering steps
during analytical procedures may result in a significant number of false negative calls.
Development of novel techniques and associated bioinformatics tools is driven by the needs to
address specific biological questions. For instance, determination of co-methylated mRNA
transcripts in a single cell may reveal gene pathways sharing a same regulatory mechanism. Finally,
future techniques and associated analytical procedures are desired to generate and analyze more
sophisticated data to determine the association of mRNA methylation with other important
biological phenomena, such as RNA splicing, RNA editing, and other kinds of RNA modifications.
ACKNOWLEDGEMENTS
This work was supported by the Center for One Health Research at the Virginia-Maryland, College
of Veterinary Medicine and The Edward Via College of Osteopathic Medicine, NIH grant
NS094574, and the Fralin Life Sciences Institute faculty development fund for H.X., and VT’s
Open Access Subvention Fund. We recognize The Center for Engineered Health and the Virginia-
Maryland College of Veterinary Medicine at Virginia Tech. We thank Dr. Janet Webster for
English language editing.
COMPETING INTERESTS
The authors declare no competing interests.
1.6 References 1. He C. Grand challenge commentary: RNA epigenetics? Nature chemical biology. 2010;6(12):863-5.
14
2. Saletore Y, Meyer K, Korlach J, Vilfan ID, Jaffrey S, Mason CE. The birth of the Epitranscriptome: deciphering the function of RNA modifications. Genome biology. 2012;13(10):175. 3. Song J, Yi C. Chemical Modifications to RNA: A New Layer of Gene Expression Regulation. ACS chemical biology. 2017;12(2):316-25. 4. Boccaletto P, Machnicka MA, Purta E, Piatkowski P, Baginski B, Wirecki TK, et al. MODOMICS: a database of RNA modification pathways. 2017 update. Nucleic acids research. 2018;46(D1):D303-d7. 5. Zhao X, Yang Y, Sun BF, Shi Y, Yang X, Xiao W, et al. FTO-dependent demethylation of N6-methyladenosine regulates mRNA splicing and is required for adipogenesis. Cell research. 2014;24(12):1403-19. 6. Wang X, Lu Z, Gomez A, Hon GC, Yue Y, Han D, et al. N6-methyladenosine-dependent regulation of messenger RNA stability. Nature. 2014;505(7481):117-20. 7. Wang X, Zhao BS, Roundtree IA, Lu Z, Han D, Ma H, et al. N(6)-methyladenosine Modulates Messenger RNA Translation Efficiency. Cell. 2015;161(6):1388-99. 8. Iwanami Y, Brown GM. Methylated bases of ribosomal ribonucleic acid from HeLa cells. Archives of biochemistry and biophysics. 1968;126(1):8-15. 9. Dubin DT, Stollar V. Methylation of Sindbis virus "26S" messenger RNA. Biochemical and biophysical research communications. 1975;66(4):1373-9. 10. Dubin DT, Taylor RH. The methylation state of poly A-containing messenger RNA from cultured hamster cells. Nucleic acids research. 1975;2(10):1653-68. 11. Edelheit S, Schwartz S, Mumbach MR, Wurtzel O, Sorek R. Transcriptome-wide mapping of 5-methylcytidine RNA modifications in bacteria, archaea, and yeast reveals m5C within archaeal mRNAs. PLoS genetics. 2013;9(6):e1003602. 12. Squires JE, Patel HR, Nousch M, Sibbritt T, Humphreys DT, Parker BJ, et al. Widespread occurrence of 5-methylcytosine in human coding and non-coding RNA. Nucleic acids research. 2012;40(11):5023-33. 13. Amort T, Rieder D, Wille A, Khokhlova-Cubberley D, Riml C, Trixl L, et al. Distinct 5-methylcytosine profiles in poly(A) RNA from mouse embryonic stem cells and brain. Genome biology. 2017;18(1):1. 14. Yang X, Yang Y, Sun BF, Chen YS, Xu JW, Lai WY, et al. 5-methylcytosine promotes mRNA export - NSUN2 as the methyltransferase and ALYREF as an m(5)C reader. Cell research. 2017;27(5):606-25. 15. Goll MG, Kirpekar F, Maggert KA, Yoder JA, Hsieh CL, Zhang X, et al. Methylation of tRNAAsp by the DNA methyltransferase homolog Dnmt2. Science (New York, NY). 2006;311(5759):395-8. 16. Tuorto F, Liebers R, Musch T, Schaefer M, Hofmann S, Kellner S, et al. RNA cytosine methylation by Dnmt2 and NSun2 promotes tRNA stability and protein synthesis. Nature structural & molecular biology. 2012;19(9):900-5. 17. Huang T, Chen W, Liu J, Gu N, Zhang R. Genome-wide identification of mRNA 5-methylcytosine in mammals. Nature structural & molecular biology. 2019;26(5):380-8. 18. Tahiliani M, Koh KP, Shen Y, Pastor WA, Bandukwala H, Brudno Y, et al. Conversion of 5-methylcytosine to 5-hydroxymethylcytosine in mammalian DNA by MLL partner TET1. Science (New York, NY). 2009;324(5929):930-5.
15
19. Ito S, D'Alessio AC, Taranova OV, Hong K, Sowers LC, Zhang Y. Role of Tet proteins in 5mC to 5hmC conversion, ES-cell self-renewal and inner cell mass specification. Nature. 2010;466(7310):1129-33. 20. He YF, Li BZ, Li Z, Liu P, Wang Y, Tang Q, et al. Tet-mediated formation of 5-carboxylcytosine and its excision by TDG in mammalian DNA. Science (New York, NY). 2011;333(6047):1303-7. 21. Ito S, Shen L, Dai Q, Wu SC, Collins LB, Swenberg JA, et al. Tet proteins can convert 5-methylcytosine to 5-formylcytosine and 5-carboxylcytosine. Science (New York, NY). 2011;333(6047):1300-3. 22. Fu L, Guerrero CR, Zhong N, Amato NJ, Liu Y, Liu S, et al. Tet-mediated formation of 5-hydroxymethylcytosine in RNA. Journal of the American Chemical Society. 2014;136(33):11582-5. 23. Huber SM, van Delft P, Mendil L, Bachman M, Smollett K, Werner F, et al. Formation and abundance of 5-hydroxymethylcytosine in RNA. Chembiochem : a European journal of chemical biology. 2015;16(5):752-5. 24. Basanta-Sanchez M, Wang R, Liu Z, Ye X, Li M, Shi X, et al. TET1-Mediated Oxidation of 5-Formylcytosine (5fC) to 5-Carboxycytosine (5caC) in RNA. Chembiochem : a European journal of chemical biology. 2017;18(1):72-6. 25. Shen Q, Zhang Q, Shi Y, Shi Q, Jiang Y, Gu Y, et al. Tet2 promotes pathogen infection-induced myelopoiesis through mRNA oxidation. Nature. 2018;554(7690):123-7. 26. Yang L, Perrera V, Saplaoura E, Apelt F, Bahin M, Kramdi A, et al. m(5)C Methylation Guides Systemic Transport of Messenger RNA over Graft Junctions in Plants. Curr Biol. 2019. 27. Cheng JX, Chen L, Li Y, Cloe A, Yue M, Wei J, et al. RNA cytosine methylation and methyltransferases mediate chromatin organization and 5-azacytidine response and resistance in leukaemia. Nature communications. 2018;9(1):1163. 28. Rieder D, Amort T, Kugler E, Lusser A, Trajanoski Z. meRanTK: methylated RNA analysis ToolKit. Bioinformatics. 2016;32(5):782-5. 29. Liang F, Hao L, Wang J, Shi S, Xiao J, Li R. BS-RNA: An efficient mapping and annotation tool for RNA bisulfite sequencing data. Comput Biol Chem. 2016;65:173-7. 30. Legrand C, Tuorto F, Hartmann M, Liebers R, Jacob D, Helm M, et al. Statistically robust methylation calling for whole-transcriptome bisulfite sequencing reveals distinct methylation patterns for mouse RNAs. Genome research. 2017;27(9):1589-96. 31. Vera-Cabrera L, Rendon A, Diaz-Rodriguez M, Handzel V, Laszlo A. Dot blot assay for detection of antidiacyltrehalose antibodies in tuberculous patients. Clinical and diagnostic laboratory immunology. 1999;6(5):686-9. 32. Miao Z, Xin N, Wei B, Hua X, Zhang G, Leng C, et al. 5-hydroxymethylcytosine is detected in RNA from mouse brain tissues. Brain research. 2016;1642:546-52. 33. Lewinska A, Adamczyk-Grochala J, Kwasniewicz E, Wnuk M. Downregulation of methyltransferase Dnmt2 results in condition-dependent telomere shortening and senescence or apoptosis in mouse fibroblasts. Journal of cellular physiology. 2017;232(12):3714-26. 34. Lewinska A, Adamczyk-Grochala J, Kwasniewicz E, Deregowska A, Semik E, Zabek T, et al. Reduced levels of methyltransferase DNMT2 sensitize human fibroblasts to oxidative stress and DNA damage that is accompanied by changes in proliferation-related miRNA expression. Redox biology. 2018;14:20-34. 35. Cui X, Liang Z, Shen L, Zhang Q, Bao S, Geng Y, et al. 5-Methylcytosine RNA Methylation in Arabidopsis Thaliana. Molecular plant. 2017;10(11):1387-99.
16
36. Khoddami V, Cairns BR. Identification of direct targets and modified bases of RNA cytosine methyltransferases. Nature biotechnology. 2013;31(5):458-64. 37. George H, Ule J, Hussain S. Illustrating the Epitranscriptome at Nucleotide Resolution Using Methylation-iCLIP (miCLIP). Methods in molecular biology (Clifton, NJ). 2017;1562:91-106. 38. Hussain S, Sajini AA, Blanco S, Dietmann S, Lombard P, Sugimoto Y, et al. NSun2-mediated cytosine-5 methylation of vault noncoding RNA determines its processing into regulatory small RNAs. Cell reports. 2013;4(2):255-61. 39. Van Haute L, Dietmann S, Kremer L, Hussain S, Pearce SF, Powell CA, et al. Deficient methylation and formylation of mt-tRNA(Met) wobble cytosine in a patient carrying mutations in NSUN3. Nature communications. 2016;7:12039. 40. Frommer M, McDonald LE, Millar DS, Collis CM, Watt F, Grigg GW, et al. A genomic sequencing protocol that yields a positive display of 5-methylcytosine residues in individual DNA strands. Proceedings of the National Academy of Sciences of the United States of America. 1992;89(5):1827-31. 41. Schaefer M, Pollex T, Hanna K, Lyko F. RNA cytosine methylation analysis by bisulfite sequencing. Nucleic acids research. 2009;37(2):e12. 42. Chen YS, Ma HL, Yang Y, Lai WY, Sun BF, Yang YG. 5-Methylcytosine Analysis by RNA-BisSeq. Methods in molecular biology (Clifton, NJ). 2019;1870:237-48. 43. Foss-Feig JH, Adkinson BD, Ji JL, Yang G, Srihari VH, McPartland JC, et al. Searching for Cross-Diagnostic Convergence: Neural Mechanisms Governing Excitation and Inhibition Balance in Schizophrenia and Autism Spectrum Disorders. Biol Psychiatry. 2017;81(10):848-61. 44. Hussain S, Aleksic J, Blanco S, Dietmann S, Frye M. Characterizing 5-methylcytosine in the mammalian epitranscriptome. Genome biology. 2013;14(11):215. 45. Amort T, Souliere MF, Wille A, Jia XY, Fiegl H, Worle H, et al. Long non-coding RNAs as targets for cytosine methylation. RNA biology. 2013;10(6):1003-8. 46. Tost J, Gut IG. DNA methylation analysis by pyrosequencing. Nature protocols. 2007;2(9):2265-75. 47. Feng J, Liu T, Qin B, Zhang Y, Liu XS. Identifying ChIP-seq enrichment using MACS. Nature protocols. 2012;7(9):1728-40. 48. Koboldt DC, Chen K, Wylie T, Larson DE, McLellan MD, Mardis ER, et al. VarScan: variant detection in massively parallel sequencing of individual and pooled samples. Bioinformatics (Oxford, England). 2009;25(17):2283-5. 49. Khoddami V, Cairns BR. Transcriptome-wide target profiling of RNA cytosine methyltransferases using the mechanism-based enrichment procedure Aza-IP. Nature protocols. 2014;9(2):337-61. 50. Martin M. Cutadapt removes adapter sequences from high-throughput sequencing reads. EMBnetjournal. 2011;17:10--2. 51. Bolger AM, Lohse M, Usadel B. Trimmomatic: a flexible trimmer for Illumina sequence data. Bioinformatics. 2014;30(15):2114-20. 52. Langmead B, Salzberg SL. Fast gapped-read alignment with Bowtie 2. Nat Methods. 2012;9(4):357-9. 53. Kim D, Langmead B, Salzberg SL. HISAT: a fast spliced aligner with low memory requirements. Nat Methods. 2015;12(4):357-60. 54. Dobin A, Davis CA, Schlesinger F, Drenkow J, Zaleski C, Jha S, et al. STAR: ultrafast universal RNA-seq aligner. Bioinformatics. 2013;29(1):15-21.

17
55. Kim D, Pertea G, Trapnell C, Pimentel H, Kelley R, Salzberg SL. TopHat2: accurate alignment of transcriptomes in the presence of insertions, deletions and gene fusions. Genome biology. 2013;14(4):R36. 56. Wei Z, Panneerdoss S, Timilsina S, Zhu J, Mohammad TA, Lu ZL, et al. Topological Characterization of Human and Mouse m(5)C Epitranscriptome Revealed by Bisulfite Sequencing. International journal of genomics. 2018;2018:1351964. 57. Parker BJ. Statistical Methods for Transcriptome-Wide Analysis of RNA Methylation by Bisulfite Sequencing. Methods in molecular biology (Clifton, NJ). 2017;1562:155-67.
18
Chapter 2 - Neuronal Activity Modifies RNA Cytosine-5 Methylation
Landscape in Mouse Cortical Neuron
Xiguang Xu1,2, Zachary Johnson1,2, Xiaoran Wei1,3, and Hehuang Xie1,2,3*
1. Fralin Life Sciences Institute at Virginia Tech, Blacksburg, VA 24061, USA
2. Department of Biological Sciences, Virginia Tech, Blacksburg, VA 24061, USA
3. Department of Biomedical Sciences and Pathobiology, Virginia-Maryland College of
Veterinary Medicine, Blacksburg, VA 24061, USA
*Corresponding author: Email: [email protected]
Status: Manuscript under preparation.
19
Highlights
l Neuronal activity induces distinct gene expression changes at the early and late phases.
l RNA bisulfite sequencing reveals dynamic RNA 5-mrC landscape in neurons upon
activation.
l mRNA methylation changes negatively correlate with mRNA expression changes in
activated neurons.
2.1 Abstract RNA cytosine-5 methylation (5-mrC) is an important posttranscriptional modification
involved in diverse biological processes. The dynamic regulation of 5-mrC modification in
response to environmental stimuli is still largely unknown. Here we provide a transcriptome-wide
map of 5-mrC modification at single nucleotide-resolution combined with gene expression profile
in mouse cortical neurons upon activation. We have identified distinct gene expression changes in
activated neurons at both the early and late stages. RNA bisulfite sequencing reveals dynamic
RNA 5-mrC landscape during neuronal activity. It shows mRNAs harboring differentially
methylated 5-mrC sites (DMS) are associated with mitochondrial and synaptic functions.
Moreover, it shows a negative correlation between RNA methylation changes and mRNA
expression changes in activated neurons. In summary, our study provides the transcriptome-wide
landscape of RNA methylation dynamics in neurons in response to environmental input and
reveals a potential link between RNA methylation and mRNA expression.
Keywords: RNA cytosine-5 methylation, neuronal activity, RNA bisulfite sequencing.
20
2.2 Background Post-transcriptional modification of RNA is emerging as a new layer in the regulation of
gene expression (1). With recent advances in chemical and biochemical detection techniques,
researchers have identified more than 170 types of RNA modifications (2), including N6-
methyladenosine (m6A) and 5-methylcytosine (5-mrC). A number of studies have appeared (3-5)
on the modification of m6A in mRNA regarding its writer, eraser and reader proteins, indicating a
reversible and highly dynamic property of RNA modification. Meanwhile, the study of 5-mrC has
just begun.
RNA cytosine-5 methylation (5-mrC) was first identified in the more abundant and stable
ribosomal RNA (rRNA) and transfer RNA (tRNA) (6, 7). Later on, 5-mrC modification was
identified in the much less abundant messenger RNA (mRNA) and non-coding RNA by applying
transcriptome-wide approaches based on next generation sequencing (NGS) (8, 9). The 5-mrC
modification in mRNA was reported to be introduced mainly by NOP2/Sun RNA
methyltransferase family member 2 (NSUN2) (10, 11). There are reports (12-14) that 5-mrC
modification in RNA can be sequentially oxidized by the ten-eleven translocation (TET) enzymes
(TET1, TET2, TET3) to form 5-hydroxymethylcytosine (5-hmrC), 5-formylcytosine (5-fC) and 5-
carboxylcytosine (5-caC). However, we still don’t know much about the underlying mechanism
that further mediates the conversion of 5-carboxylcytosine to unmethylated cytosine in RNA.
Moreover, Tet1/Tet2/Tet3 triple knockout mouse embryonic stem cells (ESCs) showed reduced
but detectable 5-hmrC level compared to wild type ESCs (12), indicating that additional unknown
enzymes may be affecting the RNA demethylation pathway.
Despite the elusive pathway for 5-mrC demethylation, recent studies have revealed critical
roles of 5-mrC modification in RNA metabolism. Transcriptome-wide mapping of 5-mrC
modification shows a significant enrichment in the vicinity of the translational start sites and 3’-
untranslated regions (3’UTRs) (8, 10, 15). 5-mrC in mRNAs facilitates mRNA export from the
nucleus to the cytoplasm with the aid of the 5-mrC reader protein ALY/REF export factor
(ALYREF) (10). Moreover, the changes of 5-mrC in mRNAs affect the regulation of mouse testis
tissue development (10), the ovarian germline stem cell (GSC) development in Drosophila (16),
the process of maternal-to-zygotic transition (MZT) in Zebrafish (17), and the pathogenesis of
21
human bladder cancer (18). These findings indicate highly dynamic regulation of 5-mrC
modification in diverse physiological and pathological conditions.
To investigate the dynamic changes of 5-mrC modification, we adopt a widely used
neuronal activity model, in which the in vitro cultured mouse cortical neurons were depolarized
with potassium chloride (19). Membrane depolarization triggers a calcium influx and activates a
complex signaling cascade with highly dynamic gene expression (19, 20). This provides an ideal
system to investigate the dynamics of 5-mrC modification in neurons in response to environmental
stimuli. We perform RNA bisulfite sequencing (RNA BS-seq) and RNA-seq to provide the single-
nucleotide resolution of 5-mrC modification at the transcriptome-wide level, as well as gene
expression profile upon neuronal activation. We have identified distinct gene expression profiles
at the early and late stages of activated neurons. Differential methylation analysis shows the
dynamic mRNA methylation changes during neuronal activity, and the DMS-containing genes are
linked to mitochondrial and synaptic functions. Furthermore, the changes in mRNA methylation
are negatively correlated with the changes in mRNA expression in activated neurons. Thus, our
findings illustrate the highly dynamics of 5-mrC modification induced by neuronal activity, and
indicate a potential link between 5-mrC modification and mRNA expression.
2.3 Methods
Animal
C57BL/6 mice are maintained and bred in a 12-hour light/dark cycle under standard
pathogen-free conditions; adult female and male mice are used for time pregnancy. Embryos are
timed by checking virginal plugs daily in the morning. Positive plugs are designated as E0.5. The
experiments have been approved prior to the study by the Institutional Animal Care and Use
Committee (IACUC) of Virginia Tech.
Primary mouse cortical neuronal culture
Primary mouse cortical neurons are prepared as previously described (19) with some
modifications. Briefly, C57BL/6 E16.5 mouse embryos are micro-dissected for cortex tissues and
the cortex tissues are dissociated into single-cell suspension by Neural tissue dissociation kit (P)
(Cat# 130-092-628) according to the manufacturer’s instructions. After dissociation, neuronal cells
are filtered through 70-µm strainer (Falcon), and spun at 300g for 10 min. The cell pellet is
resuspended in neuronal culture medium (Neurobasal medium containing 2% B27 supplement
22
(Invitrogen), 1% Glutamax (ThermoFisher) and 1% penicillin-streptomycin (ThermoFisher)) and
seeded on laminin and poly-ornithine coated 10-cm dishes. Neurons are grown in vitro for 7 days
with fresh medium changed on DIV3 and DIV6.
Membrane depolarization with potassium chloride
At DIV6, neuronal cells are silenced with 1 µM tetrodotoxin (TTX; Fisher) and 100 µM DL-
2-amino-5-phosphopentanoic acid (DL-AP5; Fisher) overnight. The next morning, neuronal cells
are depolarized with 55mM KCl for 0h, 2h, and 6h. At the end time point, the neuronal cells are
harvested and lysed with TRIzol reagent for RNA extraction.
RNA sample preparation
Total RNA is extracted using TRIzol reagent combined with RNeasy min kit (QIAGEN)
with DNase I on-column digestion. To enrich poly(A)-containing mRNAs, two rounds of poly(A)
selection are performed using oligo(dT) beads (ThermoFisher) following the manufacturer’s
instructions.
Generation of spike-in unmethylated mRNA control
The spiked-in unmethylated mRNA is transcribed from the pTRI-Xef plasmid supplied by
the MEGAscript™ T7 Transcription Kit (Invitorgen). Briefly, the linearized pTRI-Xef plasmid is
in vitro transcribed in a reaction with MEGAscript T7 RNA polymerase (Ambion) at 37 °C for 4
h, followed by DNase treatment to remove DNA template. The RNA sample is purified by RNeasy
Mini Kit (QIAGEN). The in vitro transcribed unmethylated mRNA control is spiked at a ratio of
0.5% in the RNA samples before bisulfite treatment.
RNA BS-seq library construction
RNA bisulfite conversion is performed as previously described (15) with minor
modifications. Briefly, poly(A) RNA is spiked-in with Xef unmethylated RNA and bisulfte
converted using the EZ RNA methylation Kit (Zymo Research) with initial denaturation at 95°C
for 1min, followed by three cycles of 70 °C for 10min and 64 °C for 45min. Binding,
desulphonation, and purification are performed on-column following the manufacturer’s
instructions. The eluted RNA is used for stranded RNA-seq library construction using the TruSeq
Stranded mRNA Library Preparation Kit (Illumina) with the following modifications: 1) omit the
fragmentation step; 2) supplement ACT random hexamers during first strand cDNA synthesis.
RNA-seq library construction
23
Stranded RNA-seq libraries are constructed using the TruSeq Stranded mRNA Library
Preparation Kit (Illumina) following the manufacturer’s instructions. Briefly, after two rounds of
poly(A) selection, the mRNA samples are fragmented and primed to synthesize first strand cDNA,
followed by the synthesis of the second strand cDNA. After Ampure XP beads purification, dA
tailing is performed and indexed adapters are ligated to both ends of the ds cDNA. Adapter-ligated
DNA fragments are enriched by PCR amplification for 12 cycles. After Ampure XP beads
purification, the PCR products are size-selected with the range from 350bp to 550bp on 2% dye-
free agarose gel using pippin recovery system (Sage Science). The recovered libraries are
sequenced on Hiseq 4000 platform with 150bp paired end mode (Illumina).
RNA-seq data analysis
Raw reads are trimmed off adapter sequences and low quality bases (Q < 30) using Trim
Galore (version 0.5.0) (https://www.bioinformatics.babraham.ac.uk/projects/trim_galore/). The
processed reads with lengths greater than 30 nt are defined as clean reads. Clean reads are mapped
to mm10 genome and gene expression level are calculated by RSEM (21). We filter out genes that
are not expressed (TPM=0). The union genes of two replicates are used as expressed gene list. For
differentially expressed genes analysis, we use the cpm function from the edgeR package (22, 23)
to generate the CPM (Counts per million) values. Then we filter out the genes with CPM ≤ 0.5.
The raw counts are used to identify differentially expressed genes by DESeq2 (24). The criteria of
differentially expression genes includes: (1) the adjusted p-value is less than 0.05, and (2) the gene
expression fold change is above 1.5.
RNA BS-seq data analysis
Mouse transcriptome (GRCm38) and annotation files are download from Emsemble
database. Raw reads are trimmed off the first 6 bases on 5’ end, adapter sequences, and low quality
bases by Trim Galore (https://www.bioinformatics.babraham.ac.uk/projects/trim_galore/). The
processed reads with lengths greater than 30 nt are defined as clean reads and mapped to mouse
transcriptome using “meRanT align” from meRanTK (version 1.2.1) with the parameters: -fmo –
mmr 0.01 (25). Analysis of the unmethylated Xef mRNA spike-in controls reveals global bisulfite
conversion rate > 99.8%. Unambiguously aligned reads are used to call candidate 5-mrCs by
meRanCall from meRanTK with parameters: -md 1 -ei 0.1 -fdr 0.01. Only cytosine positions with
coverage depth ≥ 20, methylation level ≥ 0.1 and methylated cytosine depth ≥ 3 are considered as
candidate 5-mrC sites. The candidate 5-mrC sites found on transcripts that are not expressed in the
24
corresponding RNA-seq datasets are further filtered out. The overlapped 5-mrC sites between two
replicates are considered as credible 5-mrC sites and used for downstream analysis. The
coordinates of these 5-mrC sites are converted to genome coordinates using R package ensembldb
(26) (Supplementary Table 3).
Distribution of 5-mrC sites
The 5-mrC sites are annotated with GTF file from Ensemble. The 5-mrC sites located within
mRNAs are assigned into three segments: 5’ UTR, CDS, and 3’ UTR. Based on the ratio of the
average lengths of 5’ UTR, CDS, and 3’ UTR in the transcriptome, we assign 5, 22 and 18 bins to
5’ UTR, CDS, and 3’ UTR, respectively. The number of 5-mrC sites located in each bin was
counted and and the percentage of 5-mrC sites in each bin was calculated to plot the density of 5-
mrC sites along mRNA transcripts.
Differential 5-mrC methylation analysis
The sites used for differential methylation analysis require the following two criteria: (1)
coverage depth ≥ 1 in all replicates, and (2) candidate 5-mrC sites in at least one condition. A
customized Perl code implemented with Fisher Exact Test is used to evaluate the significance of
differential methylation, and false discovery rate (FDR) method is used to correct for multiple
comparisons. Sites with adjusted p value < 0.05 are considered as differentially methylated sites
(DMS).
Correlation analysis between RNA methylation and RNA expression
The odds ratio (OR) or methylation fold change is calculated as previously described (27).
Pearson correlation between log2 expression fold changes and log2 methylation fold change is
performed to identify the correlation between RNA methylation and RNA expression.
Gene Ontology analysis
Gene ontology (GO) analysis is performed using the R package clusterProfiler (28). Default
parameters are used for the enrichment analysis for Biological Process (BP), cellular component
(CC), and molecular function (MF). The ten most significant BP categories are shown.
Immunostaining
Immunostaining is performed as previously described (29). Briefly, E16.5 mouse cortical
neurons are dissociated and seeded on 8-well chamber and cultured in vitro for 7 days (DIV7). The
neurons are fixed with 4% paraformaldehyde in PBS for 15 min and permeabilized with 0.2%
25
TritonX-100 in PBS for 10 min. After blocked with 5% Normal Goat Serum (ThermoFisher) at
RT for 1 h, the cells are incubated with mouse anti-Tuj1 antibody (Biolegend, 801201) and rabbit
anti-GFAP antibody (Sigma, HPA056030) at 4 °C overnight. Then the cells are incubated with
Cy3 conjugated anti-rabbit IgG (A10520, Invitrogen) and Alexa Fluor 488 conjugated anti-mouse
IgG (A10680, Invitrogen) secondary antibodies at RT in darkness for 1 h. After washing 3 × 5 min
with 1×PBS, cells are then mounted with DAPI-Fluoromount-G™ Clear Mounting Media
(SouthernBiotech, 010020). Fluorescent images are acquired using confocal microscope.
2.4 Results
2.4.1 Distinct gene expression profile upon neuronal activation
Mouse E16.5 cortical neurons are dissociated and cultured as previously described (19).
Immunostaining of the neuronal culture indicates a high purity of neurons (Figure 1). To identify
the transcriptome-wide gene expression changes upon neuronal activation, we have performed
RNA-seq in E16.5 cortical neurons at 0h, 2h, and 6h after membrane depolarization by 55mM KCl
(Table 1). The coverages are comparable among all the six RNA-seq libraries (Figure S1b). The
correlation of two biological replicates is 0.98~0.99 (Figure S1c, S1d, S1e). PCA analysis shows
two replicates are close to each other (Figure S1a). With a cutoff of fold change 1.5 and adjusted
p-value 0.05, we have identified numerous differentially expressed genes (DEGs) in activated
neurons. Compared to the control (0h), neurons stimulated with KCl for 2h show 770 up-regulated
genes and 1,145 down-regulated genes, while neurons stimulated with KCl for 6h display 2,222
up-regulated genes and 2,146 down-regulated genes (Figure 2a, 2b). GO annotation of the
differentially expressed genes shows enrichment of a large number of biological functions (Figure
S2). Genes up-regulated at both 2h and 6h are enriched in a common sets of biological processes,
such as the regulation of protein kinase activity, protein phosphorylation, Wnt signal pathway,
ERK1 and ERK2 cascade. Meanwhile, genes increased at 2h are specifically enriched in
transcription factor complex, while genes increased at 6h are enriched in the components of
cellular structures in neurons, such as post-synaptic membrane, axon part, growth cone.
Interestingly, the genes down-regulated at both 2h and 6h are significantly enriched in RNA
modifications and RNA methyltransferase activity (Supplementary Figure 2). This indicates an
overall inhibition of RNA methylation upon neuronal activation.
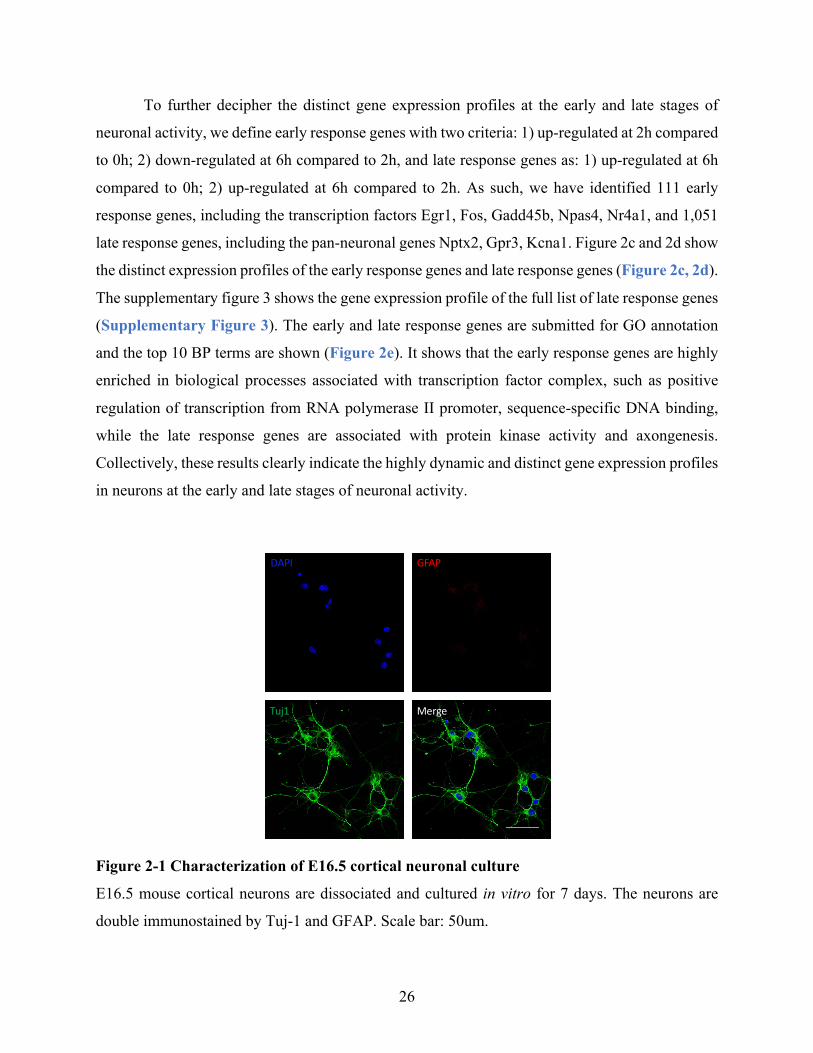
26
To further decipher the distinct gene expression profiles at the early and late stages of
neuronal activity, we define early response genes with two criteria: 1) up-regulated at 2h compared
to 0h; 2) down-regulated at 6h compared to 2h, and late response genes as: 1) up-regulated at 6h
compared to 0h; 2) up-regulated at 6h compared to 2h. As such, we have identified 111 early
response genes, including the transcription factors Egr1, Fos, Gadd45b, Npas4, Nr4a1, and 1,051
late response genes, including the pan-neuronal genes Nptx2, Gpr3, Kcna1. Figure 2c and 2d show
the distinct expression profiles of the early response genes and late response genes (Figure 2c, 2d).
The supplementary figure 3 shows the gene expression profile of the full list of late response genes
(Supplementary Figure 3). The early and late response genes are submitted for GO annotation
and the top 10 BP terms are shown (Figure 2e). It shows that the early response genes are highly
enriched in biological processes associated with transcription factor complex, such as positive
regulation of transcription from RNA polymerase II promoter, sequence-specific DNA binding,
while the late response genes are associated with protein kinase activity and axongenesis.
Collectively, these results clearly indicate the highly dynamic and distinct gene expression profiles
in neurons at the early and late stages of neuronal activity.
Figure 2-1 Characterization of E16.5 cortical neuronal culture
E16.5 mouse cortical neurons are dissociated and cultured in vitro for 7 days. The neurons are
double immunostained by Tuj-1 and GFAP. Scale bar: 50um.
Tuj1
DAPI GFAP
Merge
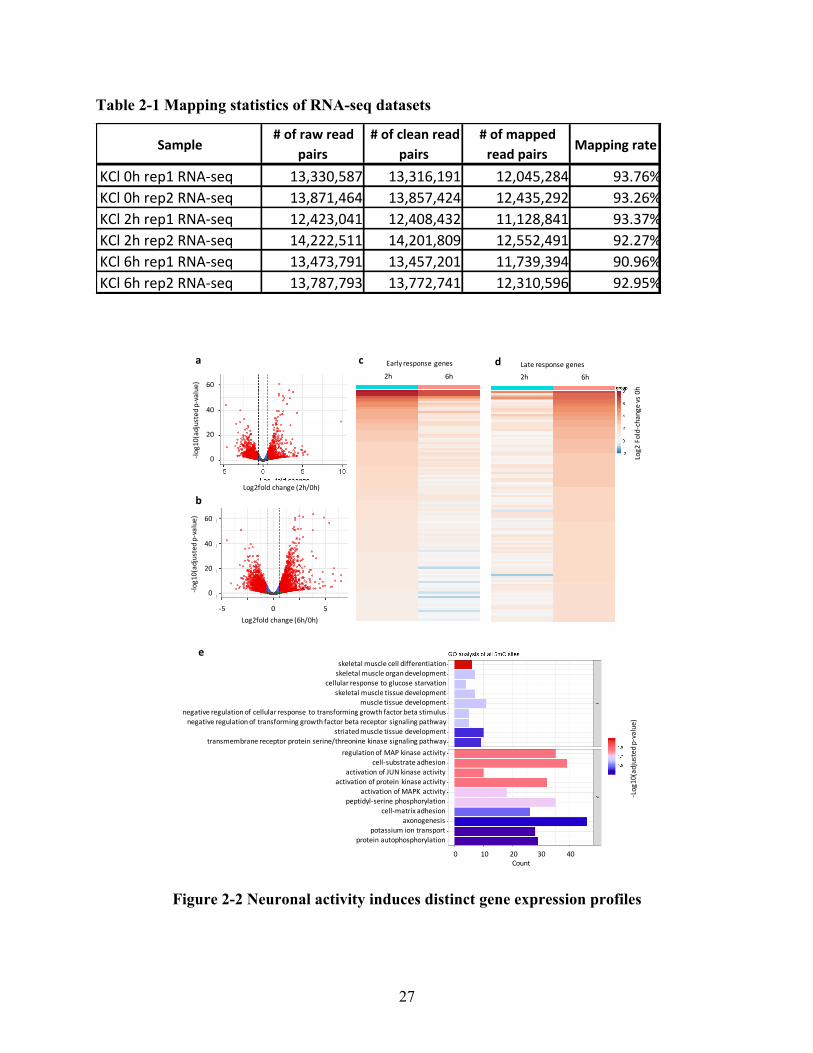
27
Table 2-1 Mapping statistics of RNA-seq datasets
Figure 2-2 Neuronal activity induces distinct gene expression profiles
RNA-seqdatasets(NA)
Sample#ofrawread
pairs#ofcleanread
pairs#ofmappedreadpairs Mappingrate
KCl0hrep1RNA-seq 13,330,587 13,316,191 12,045,284 93.76%KCl0hrep2RNA-seq 13,871,464 13,857,424 12,435,292 93.26%KCl2hrep1RNA-seq 12,423,041 12,408,432 11,128,841 93.37%KCl2hrep2RNA-seq 14,222,511 14,201,809 12,552,491 92.27%KCl6hrep1RNA-seq 13,473,791 13,457,201 11,739,394 90.96%KCl6hrep2RNA-seq 13,787,793 13,772,741 12,310,596 92.95%
-50510
60
40
20
0-log10(adjustedp-value)
Log2foldchange(2h/0h)
60
40
20
0-log10(adjustedp-value)
-505Log2foldchange(6h/0h)
a
b
c d Lateresponsegenes2h 6h
Log2Fold-changevs0h
Earlyresponsegenes
2h 6h
eskeletalmusclecelldifferentiationskeletalmuscleorgandevelopment
cellularresponsetoglucosestarvationskeletalmuscletissuedevelopment
muscletissuedevelopmentnegativeregulationofcellularresponse totransforminggrowthfactorbetastimulusnegativeregulationoftransforminggrowthfactorbetareceptor signalingpathway
striatedmuscletissuedevelopmenttransmembranereceptorproteinserine/threoninekinasesignalingpathway
regulationofMAPkinaseactivitycell-substrateadhesion
activationofJUNkinaseactivityactivationofproteinkinaseactivity
activationofMAPKactivitypeptidyl-serinephosphorylation
cell-matrixadhesionaxonogenesis
potassiumiontransportproteinautophosphorylation
-Log10(adjustedp-value)
010203040Count
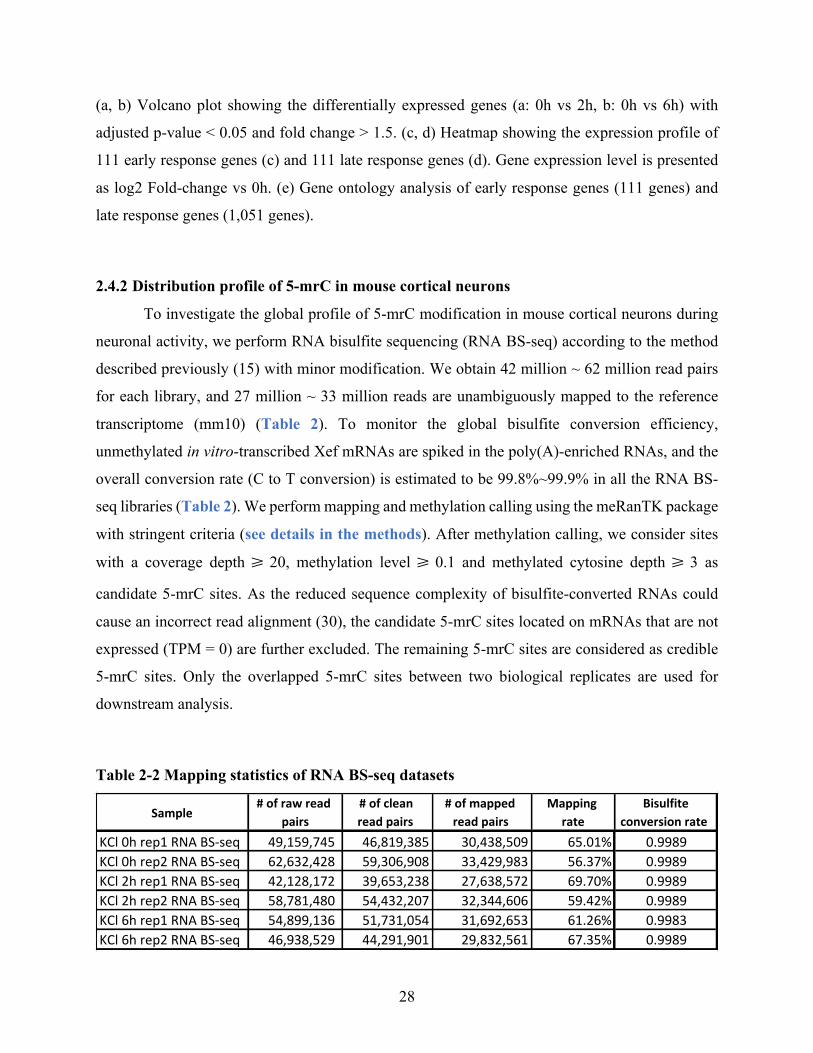
28
(a, b) Volcano plot showing the differentially expressed genes (a: 0h vs 2h, b: 0h vs 6h) with
adjusted p-value < 0.05 and fold change > 1.5. (c, d) Heatmap showing the expression profile of
111 early response genes (c) and 111 late response genes (d). Gene expression level is presented
as log2 Fold-change vs 0h. (e) Gene ontology analysis of early response genes (111 genes) and
late response genes (1,051 genes).
2.4.2 Distribution profile of 5-mrC in mouse cortical neurons
To investigate the global profile of 5-mrC modification in mouse cortical neurons during
neuronal activity, we perform RNA bisulfite sequencing (RNA BS-seq) according to the method
described previously (15) with minor modification. We obtain 42 million ~ 62 million read pairs
for each library, and 27 million ~ 33 million reads are unambiguously mapped to the reference
transcriptome (mm10) (Table 2). To monitor the global bisulfite conversion efficiency,
unmethylated in vitro-transcribed Xef mRNAs are spiked in the poly(A)-enriched RNAs, and the
overall conversion rate (C to T conversion) is estimated to be 99.8%~99.9% in all the RNA BS-
seq libraries (Table 2). We perform mapping and methylation calling using the meRanTK package
with stringent criteria (see details in the methods). After methylation calling, we consider sites
with a coverage depth ≥ 20, methylation level ≥ 0.1 and methylated cytosine depth ≥ 3 as
candidate 5-mrC sites. As the reduced sequence complexity of bisulfite-converted RNAs could
cause an incorrect read alignment (30), the candidate 5-mrC sites located on mRNAs that are not
expressed (TPM = 0) are further excluded. The remaining 5-mrC sites are considered as credible
5-mrC sites. Only the overlapped 5-mrC sites between two biological replicates are used for
downstream analysis.
Table 2-2 Mapping statistics of RNA BS-seq datasets
Sample#ofrawread
pairs#ofcleanreadpairs
#ofmappedreadpairs
Mappingrate
Bisulfiteconversionrate
KCl0hrep1RNABS-seq 49,159,745 46,819,385 30,438,509 65.01% 0.9989KCl0hrep2RNABS-seq 62,632,428 59,306,908 33,429,983 56.37% 0.9989KCl2hrep1RNABS-seq 42,128,172 39,653,238 27,638,572 69.70% 0.9989KCl2hrep2RNABS-seq 58,781,480 54,432,207 32,344,606 59.42% 0.9989KCl6hrep1RNABS-seq 54,899,136 51,731,054 31,692,653 61.26% 0.9983KCl6hrep2RNABS-seq 46,938,529 44,291,901 29,832,561 67.35% 0.9989
29
The reproducibility of RNA BS-seq datasets are high between two biological replicates
(Supplementary Figure 4). The percentage of overlapped 5-mrC sites between two biological
replicates ranges from 49.9% to 78.9% (Supplementary Figure 3a-c)., and the Pearson’s
correlation for the methylation level of the overlapped 5-mrC sites between two biological
replicates is in the range from 0.81 to 0.90 (Supplementary Figure 3d-f). A total of 2009-3175
5-mrC sites within 249-334 RNA molecules are identified in neurons stimulated with KCl for 0h,
2h and 6h. Among the 5-mrC sites identified, the majority (95.6% ~ 97.6%) are located within
messenger RNAs (mRNAs) (Figure 3f-h). The remaining 5-mrC sites are mapped to diverse types
of RNAs, including processed transcripts, pseudogene transcripts, and others (Figure 3f-h). The
medium methylation level of 5-mrC sites is approximately 20% among the three groups (20.4% in
0h, 20.0% in 2h, and 21.6% in 6h) (Figure 3d). The methylation level of the majority (71.6% in
0h, 68.8% in 2h, and 62.5% in 6h) of 5-mrC sites is below 30%, and only 5.6%-6.0% of 5-mrC
sites shows methylation level above 50% (Figure 3a-c). The sequence frequency logo shows the
embedment of 5-mrC sites in C-C/T-rich sequence context (Figure 3e). Density plot shows a mild
peak of 5-mrC sites immediately downstream of translation initiation sites and significant peaks
at 3’UTR (Figure 3i-k).
To further explore the potential functions of 5-mrC modification in neurons upon neuronal
activation, we perform gene ontology (GO) analysis on mRNAs harboring 5-mrC modification.
We find that 5-mrC containing mRNAs in all the three groups (0h, 2h, 6h) showed consistent
enrichment in mitochondrial function, such as oxidative phosphorylation, ATP synthesis, electron
transport chain (Supplementary Figure 5). This indicates a critical role of 5-mrC modification in
mitochondrial mRNAs regarding the regulation of cellular energy metabolism. This is consistent
with previous findings that mitochondrial mRNAs in tissues with high demand of energy, such as
muscle and heart, are enriched with 5-mrC modification (11). Interestingly, 5-mrC containing
mRNAs in neurons at 2hr are specifically enriched with numerous signaling pathways, such as the
response to extracellular stimuli, and TOR signaling, while 5-mrC containing mRNAs in neurons
at 6hr are more enriched in synaptic functions, such as the regulation of long-term neuronal
synaptic plasticity, synapse organization, and the positive regulation of neuron projection
development (Supplementary Figure 5). The difference in GO enrichment during the different
stages of neurons after stimulation indicates a potential role of 5-mrC modification’s involvement
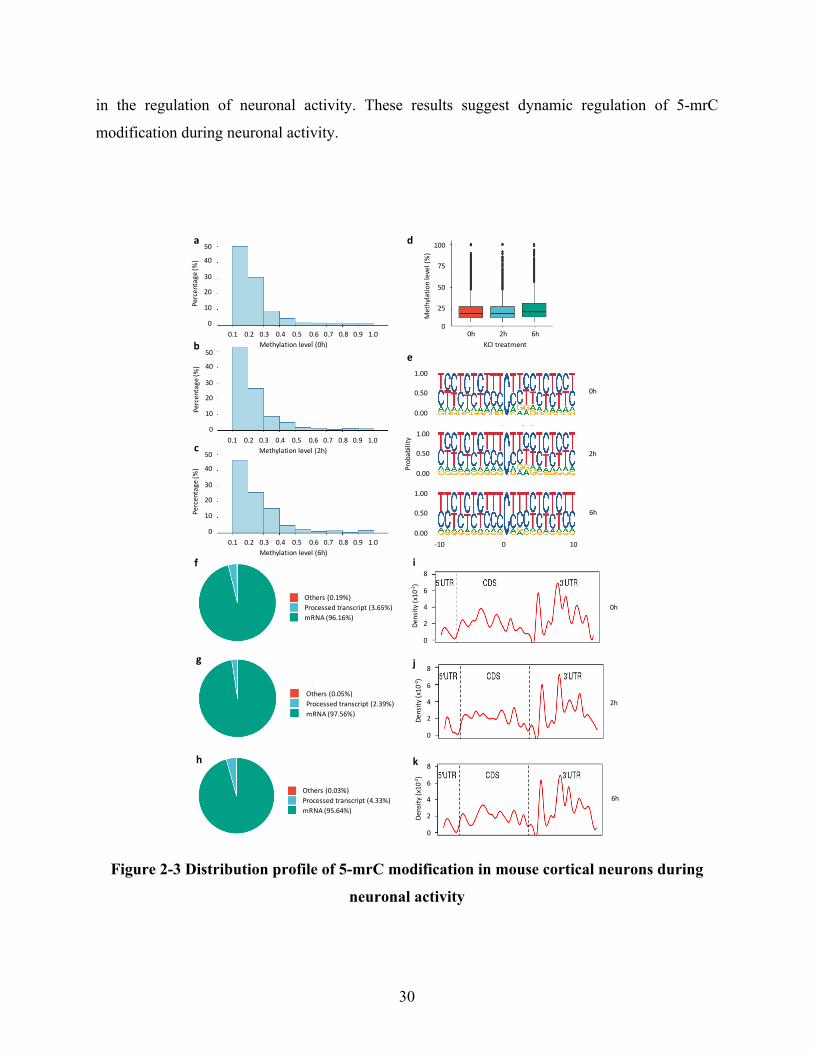
30
in the regulation of neuronal activity. These results suggest dynamic regulation of 5-mrC
modification during neuronal activity.
Figure 2-3 Distribution profile of 5-mrC modification in mouse cortical neurons during
neuronal activity
a
b
c
d
e
0.10.20.30.40.50.60.70.80.91.0Methylationlevel(0h)
50
40
30
20
10
0
Percentage(%
)
0.10.20.30.40.50.60.70.80.91.0Methylationlevel(2h)
50
40
30
20
10
0
Percentage(%
)
0.10.20.30.40.50.60.70.80.91.0Methylationlevel(6h)
50
40
30
20
10
0
Percentage(%
)
0h2h6hKCl treatment
100
75
50
25
0
Methylatio
nlevel(%)
1.00
0.50
0.00
1.00
0.50
0.00
1.00
0.50
0.00
Probability
-10010
0h
2h
6h
Others(0.19%)Processedtranscript(3.65%)mRNA(96.16%)
Others(0.05%)Processedtranscript(2.39%)mRNA(97.56%)
Others(0.03%)Processedtranscript(4.33%)mRNA(95.64%)
f
h
g
0h
2h
6h
8
6
4
2
0
Density(x10
-2)
8
6
4
2
0
Density(x10
-2)
8
6
4
2
0
Density(x10
-2)
j
i
k
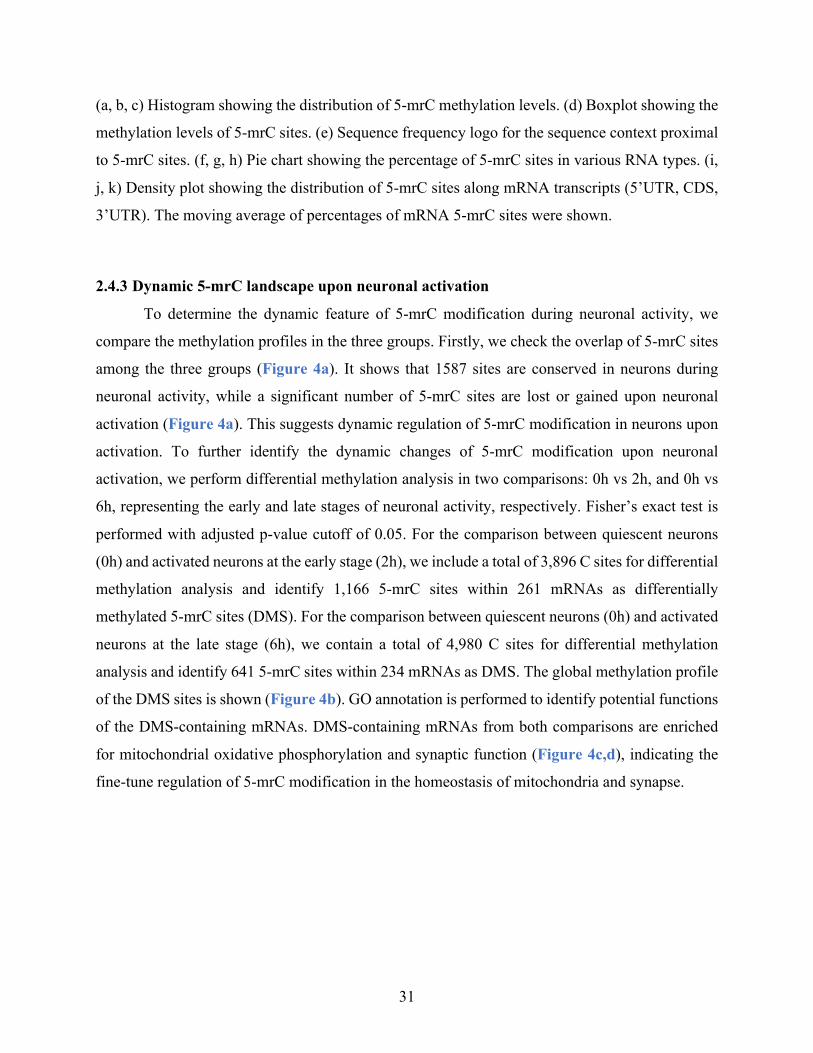
31
(a, b, c) Histogram showing the distribution of 5-mrC methylation levels. (d) Boxplot showing the
methylation levels of 5-mrC sites. (e) Sequence frequency logo for the sequence context proximal
to 5-mrC sites. (f, g, h) Pie chart showing the percentage of 5-mrC sites in various RNA types. (i,
j, k) Density plot showing the distribution of 5-mrC sites along mRNA transcripts (5’UTR, CDS,
3’UTR). The moving average of percentages of mRNA 5-mrC sites were shown.
2.4.3 Dynamic 5-mrC landscape upon neuronal activation
To determine the dynamic feature of 5-mrC modification during neuronal activity, we
compare the methylation profiles in the three groups. Firstly, we check the overlap of 5-mrC sites
among the three groups (Figure 4a). It shows that 1587 sites are conserved in neurons during
neuronal activity, while a significant number of 5-mrC sites are lost or gained upon neuronal
activation (Figure 4a). This suggests dynamic regulation of 5-mrC modification in neurons upon
activation. To further identify the dynamic changes of 5-mrC modification upon neuronal
activation, we perform differential methylation analysis in two comparisons: 0h vs 2h, and 0h vs
6h, representing the early and late stages of neuronal activity, respectively. Fisher’s exact test is
performed with adjusted p-value cutoff of 0.05. For the comparison between quiescent neurons
(0h) and activated neurons at the early stage (2h), we include a total of 3,896 C sites for differential
methylation analysis and identify 1,166 5-mrC sites within 261 mRNAs as differentially
methylated 5-mrC sites (DMS). For the comparison between quiescent neurons (0h) and activated
neurons at the late stage (6h), we contain a total of 4,980 C sites for differential methylation
analysis and identify 641 5-mrC sites within 234 mRNAs as DMS. The global methylation profile
of the DMS sites is shown (Figure 4b). GO annotation is performed to identify potential functions
of the DMS-containing mRNAs. DMS-containing mRNAs from both comparisons are enriched
for mitochondrial oxidative phosphorylation and synaptic function (Figure 4c,d), indicating the
fine-tune regulation of 5-mrC modification in the homeostasis of mitochondria and synapse.
32
Figure 2-4 Neuronal activity induces RNA methylation changes in neurons
(a) Venn diagram showing the overlap of 5-mrC sites among the three groups. (b) Heatmap
showing the methylation profile of the union differentially methylated 5-mrC sites (0h vs 2h and
0h vs 6h) in the three groups. (c) Gene ontology analysis of mRNAs with differentially methylated
5-mrC sites (0h vs 2h and 0h vs 6h).
2.4.4 RNA methylation negatively correlates with mRNA expression in neurons upon
neuronal activation
To investigate the link between 5-mrC modification and gene expression, we integrate
RNA-seq and RNA BS-seq datasets to compare 5-mrC methylation changes and corresponding
mRNA expression changes. This procedure is performed for both comparisons (0h vs 2h, and 0h
vs 6h). Firstly, we include the union 5-mrC sites between the two groups and the corresponding
127
184
1,587
111798
662
397
0h 2h
6h
6h0h 2h
a b
cCellmigrationinhindbrain
HindbrainradialgliaguidedcellmigrationATPsynthesiscoupledelectrontransport
TORsignalingRegulationofRas proteinsignaltransduction
RegulationofsmallGTPasemediatedsignalingtransductionATPsynthesiscoupledelectrontransport
electrontransportchainrespiratoryelectrontransportchainProton transmembranetransport
CellmigrationinhindbrainGenerationofprecursormetabolitesandenergy
CellularrespirationRegulationofsmallGTPasemediatedsignaltransduction
OxidativephosphorylationRegulationofRas proteinsignaltransduction
-Log10(adjustedp-value)
DMS-genes(0hvs2h)
DMS-genes(0hvs6h)
0510Count
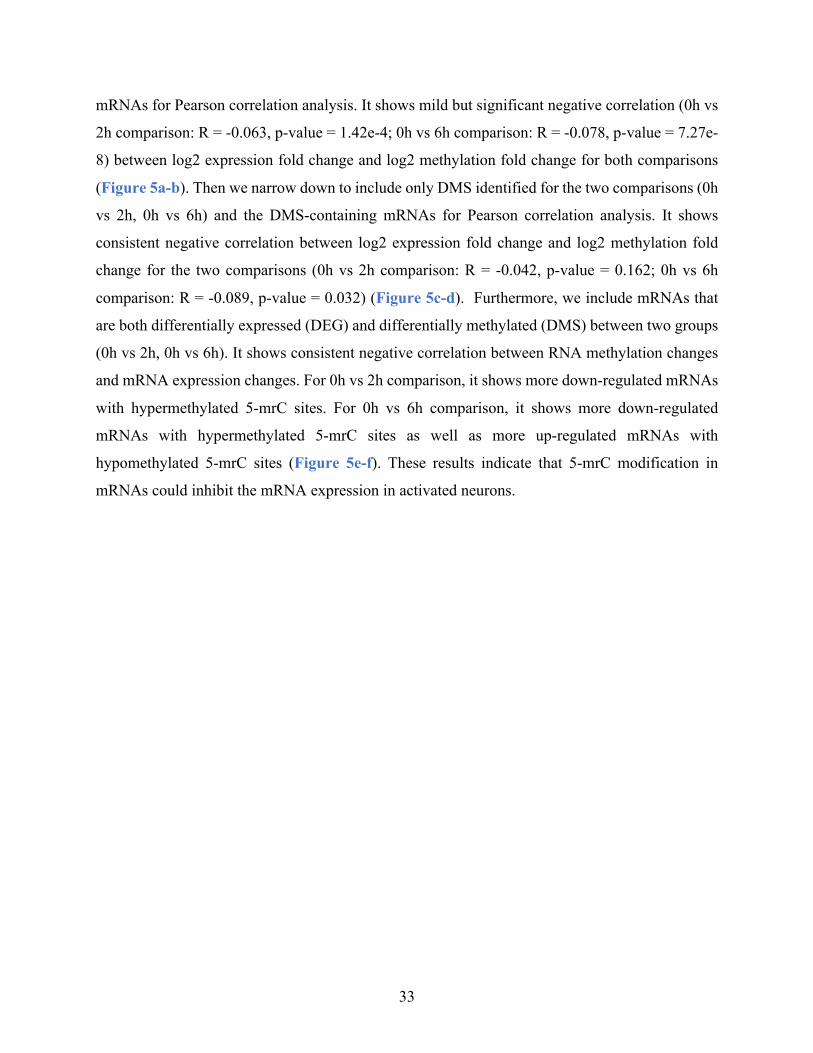
33
mRNAs for Pearson correlation analysis. It shows mild but significant negative correlation (0h vs
2h comparison: R = -0.063, p-value = 1.42e-4; 0h vs 6h comparison: R = -0.078, p-value = 7.27e-
8) between log2 expression fold change and log2 methylation fold change for both comparisons
(Figure 5a-b). Then we narrow down to include only DMS identified for the two comparisons (0h
vs 2h, 0h vs 6h) and the DMS-containing mRNAs for Pearson correlation analysis. It shows
consistent negative correlation between log2 expression fold change and log2 methylation fold
change for the two comparisons (0h vs 2h comparison: R = -0.042, p-value = 0.162; 0h vs 6h
comparison: R = -0.089, p-value = 0.032) (Figure 5c-d). Furthermore, we include mRNAs that
are both differentially expressed (DEG) and differentially methylated (DMS) between two groups
(0h vs 2h, 0h vs 6h). It shows consistent negative correlation between RNA methylation changes
and mRNA expression changes. For 0h vs 2h comparison, it shows more down-regulated mRNAs
with hypermethylated 5-mrC sites. For 0h vs 6h comparison, it shows more down-regulated
mRNAs with hypermethylated 5-mrC sites as well as more up-regulated mRNAs with
hypomethylated 5-mrC sites (Figure 5e-f). These results indicate that 5-mrC modification in
mRNAs could inhibit the mRNA expression in activated neurons.
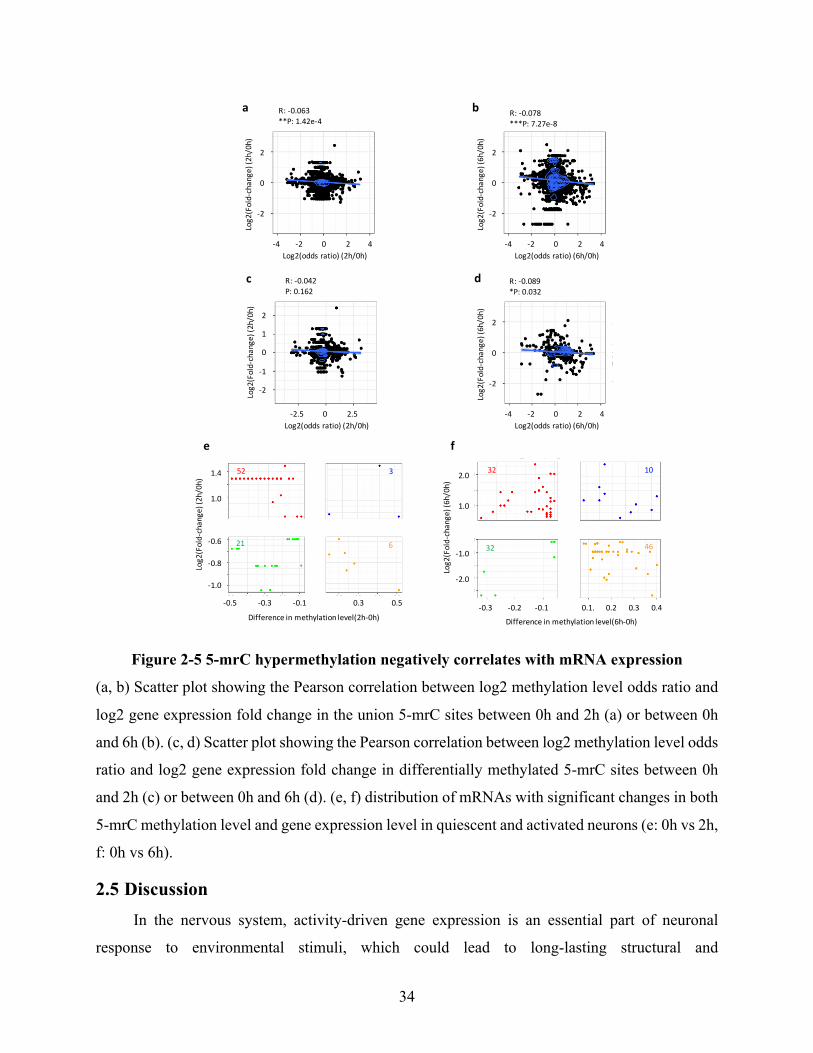
34
Figure 2-5 5-mrC hypermethylation negatively correlates with mRNA expression
(a, b) Scatter plot showing the Pearson correlation between log2 methylation level odds ratio and
log2 gene expression fold change in the union 5-mrC sites between 0h and 2h (a) or between 0h
and 6h (b). (c, d) Scatter plot showing the Pearson correlation between log2 methylation level odds
ratio and log2 gene expression fold change in differentially methylated 5-mrC sites between 0h
and 2h (c) or between 0h and 6h (d). (e, f) distribution of mRNAs with significant changes in both
5-mrC methylation level and gene expression level in quiescent and activated neurons (e: 0h vs 2h,
f: 0h vs 6h).
2.5 Discussion In the nervous system, activity-driven gene expression is an essential part of neuronal
response to environmental stimuli, which could lead to long-lasting structural and
R:-0.078***P:7.27e-8
-4-2024Log2(oddsratio)(6h/0h)
2
0
-2
Log2(Fold-change)(6h/0h)
R:-0.063**P:1.42e-4
-4-2024Log2(oddsratio)(2h/0h)
2
0
-2
Log2(Fold-change)(2h/0h)
R:-0.089*P:0.032
-4-2024Log2(oddsratio)(6h/0h)
2
0
-2
Log2(Fold-change)(6h/0h)
R:-0.042P:0.162
-2.502.5Log2(oddsratio)(2h/0h)
2
1
0
-1
-2
Log2(Fold-change)(2h/0h)
-0.5-0.3-0.1 0.30.5
Differenceinmethylationlevel(2h-0h)
1.4
1.0
-0.6
-0.8
-1.0
Log2(Fold-change)(2h/0h)
52
21
3
6
-0.3-0.2-0.1 0.1.0.20.30.4
Differenceinmethylationlevel(6h-0h)
2.0
1.0
-1.0
-2.0
Log2(Fold-change)(6h/0h)
32
32
10
46
c d
e
a b
f
35
electrophysiological adaptations in the neural circuit during development, learning and memory
formation (31, 32). Previous studies have reported the dynamic changes in DNA methylation and
chromatin accessibility in neurons in response to stimulation (33, 34). Meanwhile, the changes in
RNA cytosine-5 methylation in activated neurons have not been studied yet.
In this study, we have applied a classical neuronal activity model to investigate the dynamic
5-mrC profile in activated neurons. With both RNA-seq and RNA BS-seq datasets, we are able to
profile gene expression as well as 5-mrC modification at transcriptome-wide level. We identify
distinct gene expression profiles with one set of early response genes (111 genes) for the early
stage and one set of late response genes (1,051 genes) for the late stage of neuronal activity. The
number of late responses genes is many more than that of early response genes. This is consistent
with the concept that the early response genes serve as the regulatory factors, such as transcription
factors, that regulate the expression of late response genes, which are involved in diverse aspects
of neuronal functions (19). Moreover, genes down-regulated at 2h are highly enriched in the
regulation of RNA methyltransferase activity. More studies are needed to elucidate the biological
functions of RNA methylation-related differentially expressed genes during neuronal activity.
With stringent parameters for alignment, methylation calling and filtering of potential false
positive 5-mrC sites, we identify thousands of 5-mrC sites in neurons during different stages of
neuronal activity. We further perform differential methylation analysis by Fisher’s exact test and
identify dynamic 5-mrC modification landscape upon neuronal activation. GO annotation shows
that DMS-related genes are significantly enriched in mitochondrial and synaptic functions. This
indicates the potential roles of 5-mrC modification in the regulation of energy metabolism and
synaptic adaptation in neurons in response to environment stimuli.
Furthermore, we investigate the relationship between RNA methylation and RNA expression.
We perform Pearson correlation between log2 expression fold changes and log2 methylation fold
changes using mRNAs containing either the union sets of 5-mrC sites or the DMS sites between
two groups (early stage: 0h vs 2h, late stage: 0h vs 6h). It shows consistently negative correlation
between RNA expression changes and RNA methylation changes. We further confirm this trend
by plotting the distribution of differentially expressed genes containing differentially methylated
5-mrC sites. Thus, these findings illustrate a potential link between RNA methylation and RNA
expression.
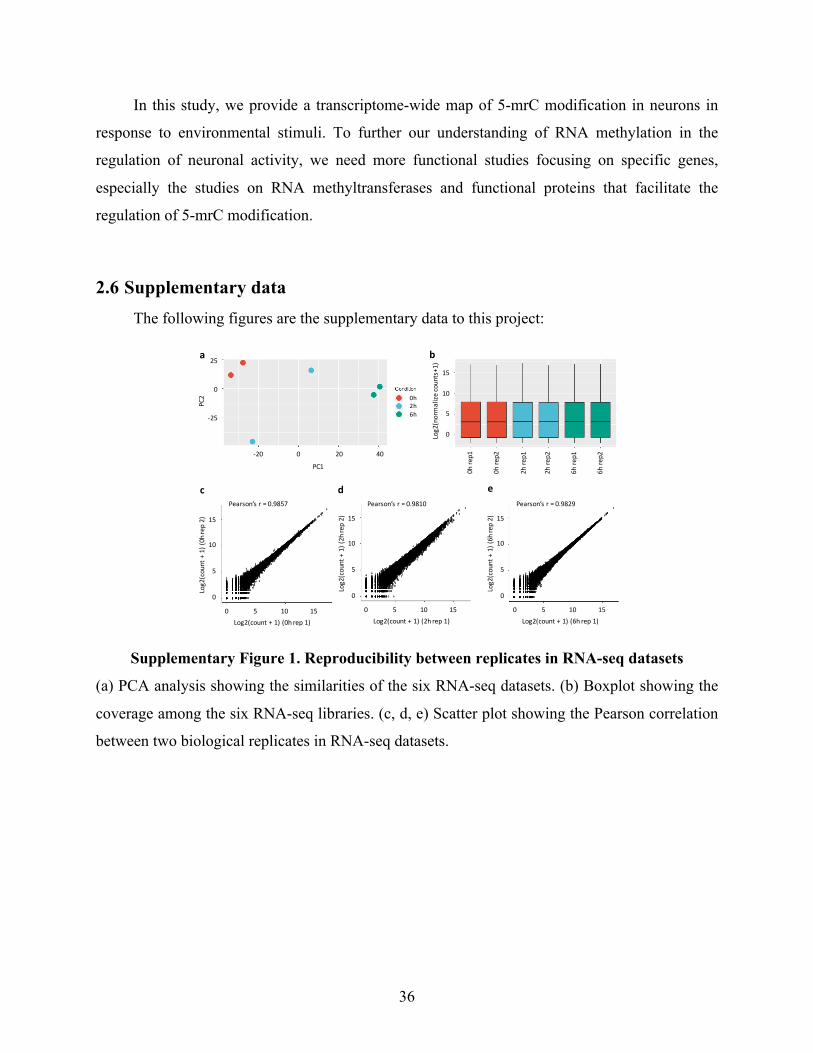
36
In this study, we provide a transcriptome-wide map of 5-mrC modification in neurons in
response to environmental stimuli. To further our understanding of RNA methylation in the
regulation of neuronal activity, we need more functional studies focusing on specific genes,
especially the studies on RNA methyltransferases and functional proteins that facilitate the
regulation of 5-mrC modification.
2.6 Supplementary data The following figures are the supplementary data to this project:
Supplementary Figure 1. Reproducibility between replicates in RNA-seq datasets
(a) PCA analysis showing the similarities of the six RNA-seq datasets. (b) Boxplot showing the
coverage among the six RNA-seq libraries. (c, d, e) Scatter plot showing the Pearson correlation
between two biological replicates in RNA-seq datasets.
15
10
5
0
Log2(count+1)(0hrep2)
051015Log2(count+1)(0hrep1)
Pearson’sr=0.99
15
10
5
0
Log2(count+1)(2hrep2)
051015Log2(count+1)(2hrep1)
Pearson’sr=0.98
15
10
5
0
Log2(count+1)(6hrep2)
051015Log2(count+1)(6hrep1)
Pearson’sr=0.98
25
0
-25
PC2
-2002040
PC1
0h2h6h
15
10
5
0Log2(normalize
counts+1)
0hre
p1
0hre
p2
2hre
p1
2hre
p2
6hre
p1
6hre
p2
c d e
a b
Pearson’sr=0.9829Pearson’sr=0.9810Pearson’sr=0.9857
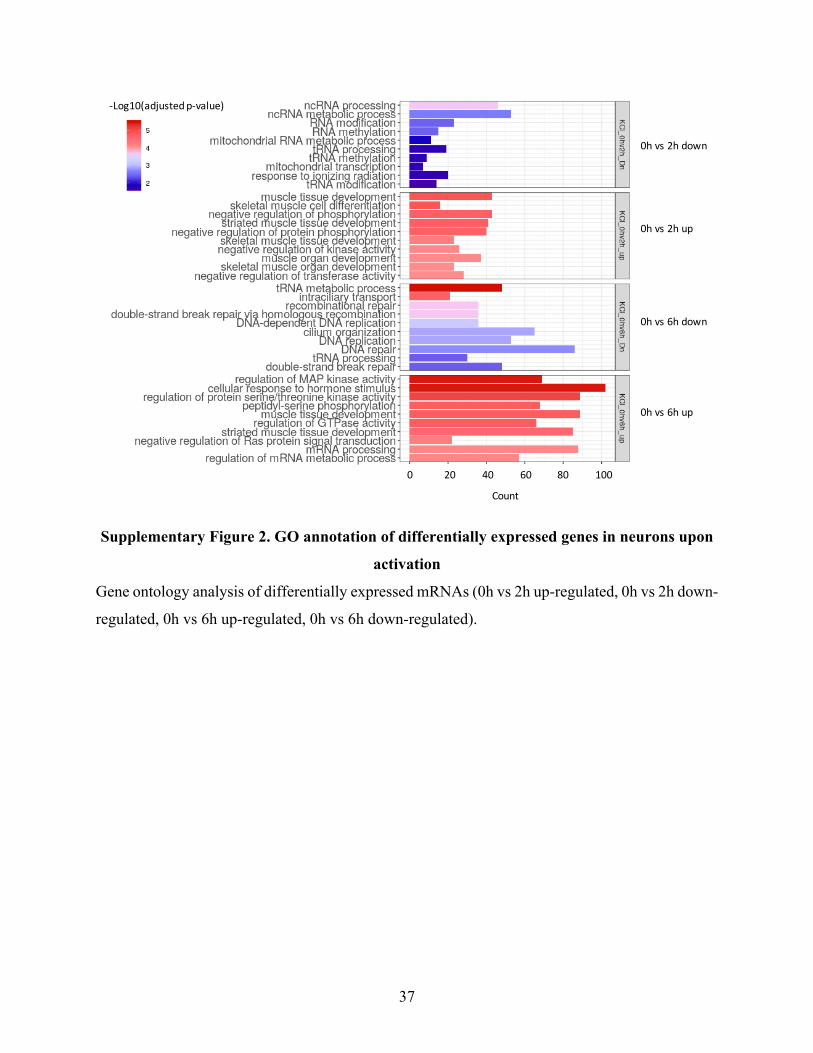
37
Supplementary Figure 2. GO annotation of differentially expressed genes in neurons upon
activation
Gene ontology analysis of differentially expressed mRNAs (0h vs 2h up-regulated, 0h vs 2h down-
regulated, 0h vs 6h up-regulated, 0h vs 6h down-regulated).
0hvs2hdown
0hvs2hup
0hvs6hup
0hvs6hdown
020406080100
Count
-Log10(adjustedp-value)
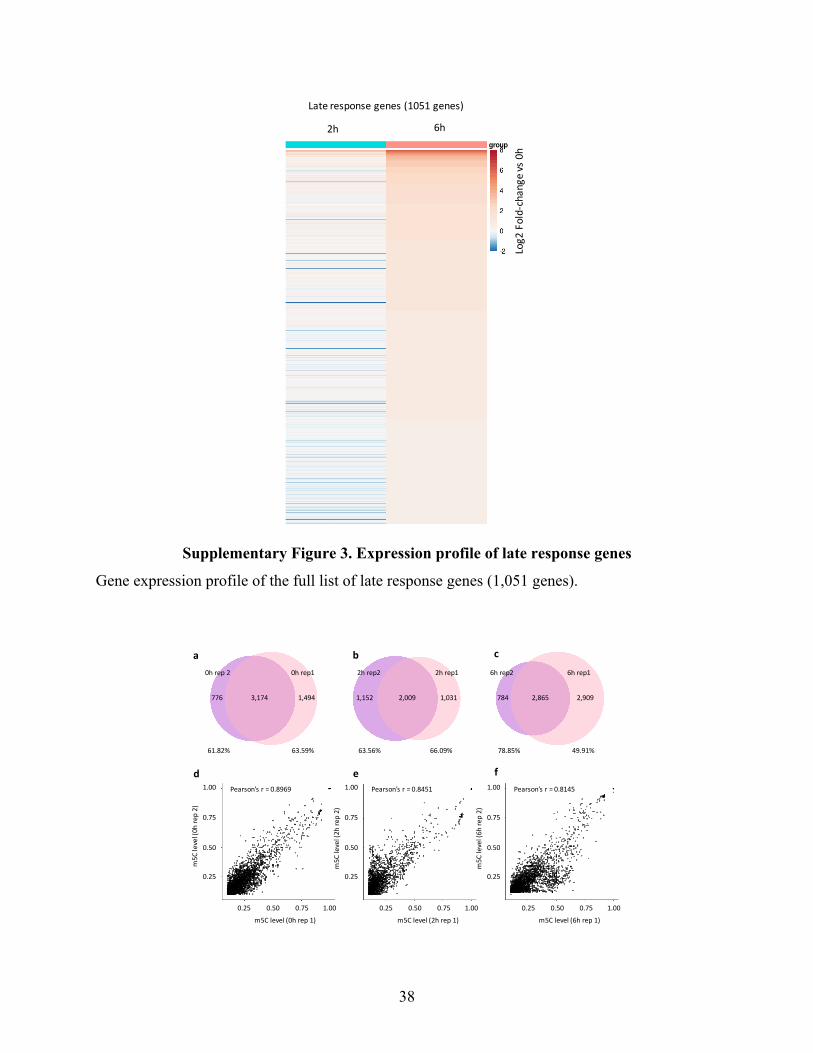
38
Supplementary Figure 3. Expression profile of late response genes
Gene expression profile of the full list of late response genes (1,051 genes).
Lateresponsegenes(1051genes)
2h 6h
Log2Fold-changevs0h
3,174776 1,494 1,152 2,009 1,031 784 2,865 2,909
61.82% 63.59% 63.56% 66.09% 78.85% 49.91%
0hrep10hrep2 2hrep12hrep2 6hrep16hrep2
1.00
0.75
0.50
0.25
m5Clevel(0hre
p2)
0.250.500.751.00m5Clevel(0hrep1)
Pearson’sr=0.8969 1.00
0.75
0.50
0.25
m5Clevel(2hre
p2)
0.250.500.751.00m5Clevel(2hrep1)
1.00
0.75
0.50
0.25
m5Clevel(6hre
p2)
0.250.500.751.00m5Clevel(6hrep1)
Pearson’sr=0.8451 Pearson’sr=0.8145
d e f
a b c
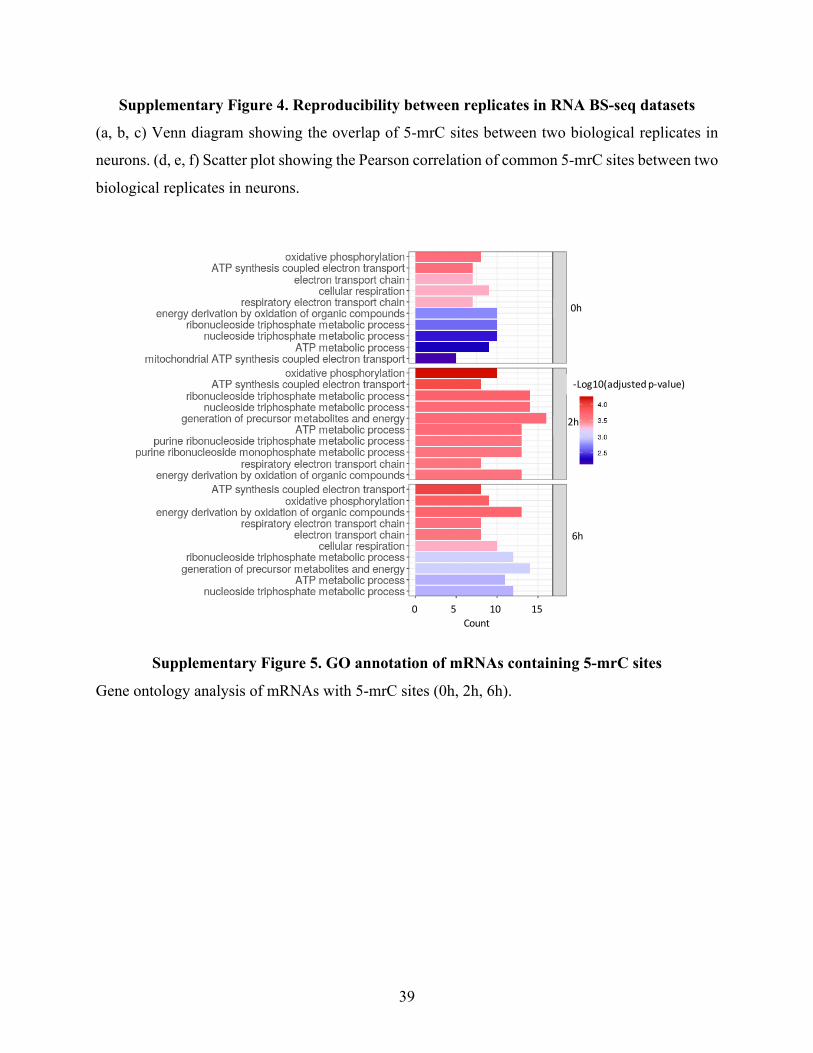
39
Supplementary Figure 4. Reproducibility between replicates in RNA BS-seq datasets
(a, b, c) Venn diagram showing the overlap of 5-mrC sites between two biological replicates in
neurons. (d, e, f) Scatter plot showing the Pearson correlation of common 5-mrC sites between two
biological replicates in neurons.
Supplementary Figure 5. GO annotation of mRNAs containing 5-mrC sites
Gene ontology analysis of mRNAs with 5-mrC sites (0h, 2h, 6h).
0h
2h
6h
051015Count
-Log10(adjustedp-value)
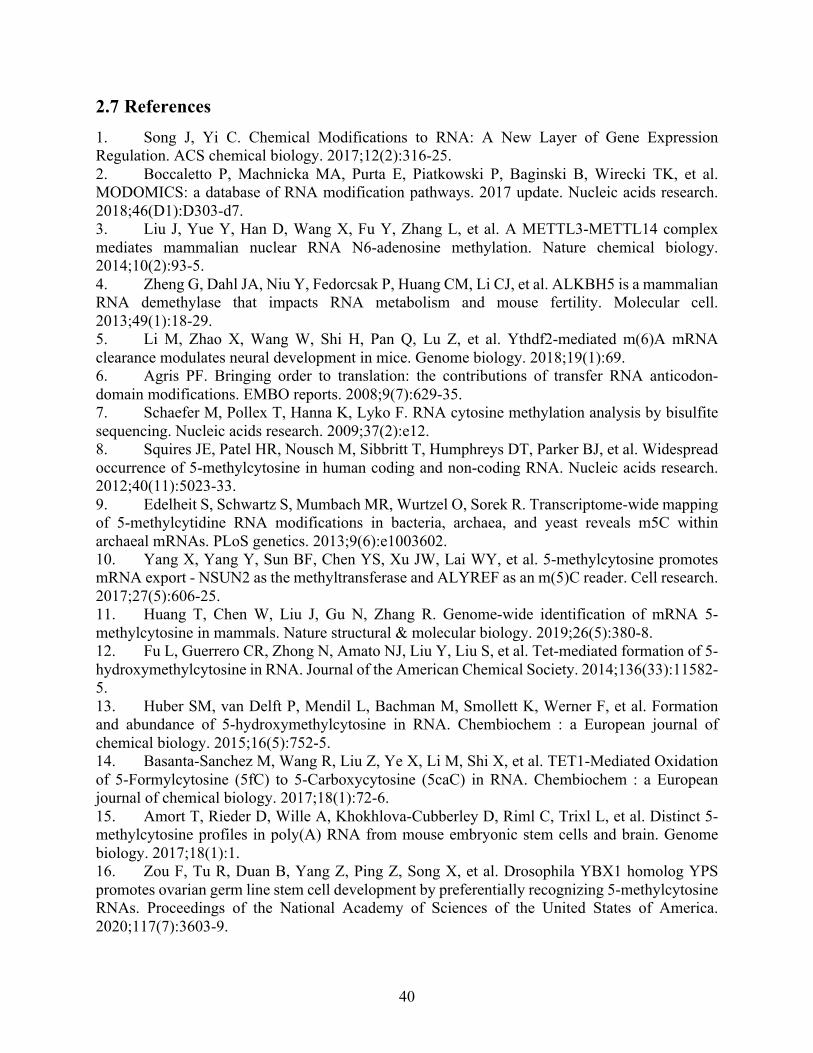
40
2.7 References 1. Song J, Yi C. Chemical Modifications to RNA: A New Layer of Gene Expression Regulation. ACS chemical biology. 2017;12(2):316-25. 2. Boccaletto P, Machnicka MA, Purta E, Piatkowski P, Baginski B, Wirecki TK, et al. MODOMICS: a database of RNA modification pathways. 2017 update. Nucleic acids research. 2018;46(D1):D303-d7. 3. Liu J, Yue Y, Han D, Wang X, Fu Y, Zhang L, et al. A METTL3-METTL14 complex mediates mammalian nuclear RNA N6-adenosine methylation. Nature chemical biology. 2014;10(2):93-5. 4. Zheng G, Dahl JA, Niu Y, Fedorcsak P, Huang CM, Li CJ, et al. ALKBH5 is a mammalian RNA demethylase that impacts RNA metabolism and mouse fertility. Molecular cell. 2013;49(1):18-29. 5. Li M, Zhao X, Wang W, Shi H, Pan Q, Lu Z, et al. Ythdf2-mediated m(6)A mRNA clearance modulates neural development in mice. Genome biology. 2018;19(1):69. 6. Agris PF. Bringing order to translation: the contributions of transfer RNA anticodon-domain modifications. EMBO reports. 2008;9(7):629-35. 7. Schaefer M, Pollex T, Hanna K, Lyko F. RNA cytosine methylation analysis by bisulfite sequencing. Nucleic acids research. 2009;37(2):e12. 8. Squires JE, Patel HR, Nousch M, Sibbritt T, Humphreys DT, Parker BJ, et al. Widespread occurrence of 5-methylcytosine in human coding and non-coding RNA. Nucleic acids research. 2012;40(11):5023-33. 9. Edelheit S, Schwartz S, Mumbach MR, Wurtzel O, Sorek R. Transcriptome-wide mapping of 5-methylcytidine RNA modifications in bacteria, archaea, and yeast reveals m5C within archaeal mRNAs. PLoS genetics. 2013;9(6):e1003602. 10. Yang X, Yang Y, Sun BF, Chen YS, Xu JW, Lai WY, et al. 5-methylcytosine promotes mRNA export - NSUN2 as the methyltransferase and ALYREF as an m(5)C reader. Cell research. 2017;27(5):606-25. 11. Huang T, Chen W, Liu J, Gu N, Zhang R. Genome-wide identification of mRNA 5-methylcytosine in mammals. Nature structural & molecular biology. 2019;26(5):380-8. 12. Fu L, Guerrero CR, Zhong N, Amato NJ, Liu Y, Liu S, et al. Tet-mediated formation of 5-hydroxymethylcytosine in RNA. Journal of the American Chemical Society. 2014;136(33):11582-5. 13. Huber SM, van Delft P, Mendil L, Bachman M, Smollett K, Werner F, et al. Formation and abundance of 5-hydroxymethylcytosine in RNA. Chembiochem : a European journal of chemical biology. 2015;16(5):752-5. 14. Basanta-Sanchez M, Wang R, Liu Z, Ye X, Li M, Shi X, et al. TET1-Mediated Oxidation of 5-Formylcytosine (5fC) to 5-Carboxycytosine (5caC) in RNA. Chembiochem : a European journal of chemical biology. 2017;18(1):72-6. 15. Amort T, Rieder D, Wille A, Khokhlova-Cubberley D, Riml C, Trixl L, et al. Distinct 5-methylcytosine profiles in poly(A) RNA from mouse embryonic stem cells and brain. Genome biology. 2017;18(1):1. 16. Zou F, Tu R, Duan B, Yang Z, Ping Z, Song X, et al. Drosophila YBX1 homolog YPS promotes ovarian germ line stem cell development by preferentially recognizing 5-methylcytosine RNAs. Proceedings of the National Academy of Sciences of the United States of America. 2020;117(7):3603-9.
41
17. Yang Y, Wang L, Han X, Yang WL, Zhang M, Ma HL, et al. RNA 5-Methylcytosine Facilitates the Maternal-to-Zygotic Transition by Preventing Maternal mRNA Decay. Molecular cell. 2019. 18. Chen X, Li A, Sun BF, Yang Y, Han YN, Yuan X, et al. 5-methylcytosine promotes pathogenesis of bladder cancer through stabilizing mRNAs. Nature cell biology. 2019;21(8):978-90. 19. Malik AN, Vierbuchen T, Hemberg M, Rubin AA, Ling E, Couch CH, et al. Genome-wide identification and characterization of functional neuronal activity-dependent enhancers. Nature neuroscience. 2014;17(10):1330-9. 20. Kim TK, Hemberg M, Gray JM, Costa AM, Bear DM, Wu J, et al. Widespread transcription at neuronal activity-regulated enhancers. Nature. 2010;465(7295):182-7. 21. Li B, Dewey CN. RSEM: accurate transcript quantification from RNA-Seq data with or without a reference genome. BMC bioinformatics. 2011;12:323. 22. Robinson MD, McCarthy DJ, Smyth GK. edgeR: a Bioconductor package for differential expression analysis of digital gene expression data. Bioinformatics. 2010;26(1):139-40. 23. McCarthy DJ, Chen Y, Smyth GK. Differential expression analysis of multifactor RNA-Seq experiments with respect to biological variation. Nucleic Acids Res. 2012;40(10):4288-97. 24. Love MI, Huber W, Anders S. Moderated estimation of fold change and dispersion for RNA-seq data with DESeq2. Genome Biol. 2014;15(12):550. 25. Rieder D, Amort T, Kugler E, Lusser A, Trajanoski Z. meRanTK: methylated RNA analysis ToolKit. Bioinformatics (Oxford, England). 2016;32(5):782-5. 26. Rainer J, Gatto L, Weichenberger CX. ensembldb: an R package to create and use Ensembl-based annotation resources. Bioinformatics. 2019;35(17):3151-3. 27. Wei Z, Panneerdoss S, Timilsina S, Zhu J, Mohammad TA, Lu ZL, et al. Topological Characterization of Human and Mouse m(5)C Epitranscriptome Revealed by Bisulfite Sequencing. International journal of genomics. 2018;2018:1351964. 28. Yu G, Wang LG, Han Y, He QY. clusterProfiler: an R package for comparing biological themes among gene clusters. OMICS. 2012;16(5):284-7. 29. Sun Z, Xu X, He J, Murray A, Sun MA, Wei X, et al. EGR1 recruits TET1 to shape the brain methylome during development and upon neuronal activity. Nature communications. 2019;10(1):3892. 30. Khoddami V, Yerra A, Cairns BR. Experimental Approaches for Target Profiling of RNA Cytosine Methyltransferases. Methods in enzymology. 2015;560:273-96. 31. Leslie JH, Nedivi E. Activity-regulated genes as mediators of neural circuit plasticity. Progress in neurobiology. 2011;94(3):223-37. 32. West AE, Greenberg ME. Neuronal activity-regulated gene transcription in synapse development and cognitive function. Cold Spring Harbor perspectives in biology. 2011;3(6). 33. Guo JU, Ma DK, Mo H, Ball MP, Jang MH, Bonaguidi MA, et al. Neuronal activity modifies the DNA methylation landscape in the adult brain. Nature neuroscience. 2011;14(10):1345-51. 34. Su Y, Shin J, Zhong C, Wang S, Roychowdhury P, Lim J, et al. Neuronal activity modifies the chromatin accessibility landscape in the adult brain. Nature neuroscience. 2017;20(3):476-83.
42
Chapter 3 - Influence of Folate on RNA Cytosine-5 Methylation in Neural
Stem Cells
Xiguang Xu1,2, Xiaoran Wei1,3, Natalie Melville, Razan Alajoleen1,3, Rachel Padget2,4, James
Smyth2,4, Hrubec Terry5, Hehuang Xie1,2,3*
1. Epigenomics and Computational Biology Lab, Fralin Life Sciences Institute of Virginia
Tech, VA, 24060 USA
2. Department of Biological Sciences, College of Science, Virginia Tech, Blacksburg, VA
24061, USA
3. Department of Biomedical Sciences and Pathobiology, Virginia-Maryland College of
Veterinary Medicine; Virginia Tech, VA, 24060 USA
4. Fralin Biomedical Research Institute at VTC, Virginia Tech, VA, 24060 USA
*Corresponding author: Email: [email protected]
Status: Manuscript under preparation.
43
Highlights
l Folate deficiency and supplementation induce changes in mRNA translation efficiency in
adult mouse neural stem cells.
l Folate deficiency and supplementation induce 5-mrC modification changes in adult
mouse neural stem cells.
l It reveals 5-mrC hypermethylation in polysome mRNAs than that in total mRNAs.
3.1 Abstract RNA cytosine-5 methylation (5-mrC) is a post-transcriptional modification involved in diverse
physiological and pathological conditions. The formation of 5-mrC modification is mediated by
the transfer of a methyl-group to RNA cytosine-5 position. Meanwhile, the influence of the
methyl donor, folate, on 5-mrC modification is largely unkown. Here, we provide a
transcriptome-wide landscape of 5-mrC modification in both total mRNAs and polysome-
associated mRNAs at single-nucleotide resolution in adult mouse neural stem cells (NSCs)
cultured in low folate (LF), medium folate (MF) and high folate (HF) conditions. Polysome
profiling reveals a panel of differentially translated mRNAs in NSCs with folate deficiency or
supplementation. We identify distinct 5-mrC modification profiles in both total mRNAs and
polysome mRNAs in NSCs treated with different concentration of folate. Moreover, it reveals 5-
mrC hypermethylation in polysome mRNAs than that in total mRNAs. This study presents the
comprehensive influence of folate deficiency and supplementation on RNA cytosine-5
methylation and mRNA translation.
Keywords RNA cytosine-5 methylation, folic acid, adult mouse neural stem cell, polysome
profiling
44
3.2 Background Folate is an essential B vitamin and a major methyl donor with many important biological
functions including DNA methylation and synthesis (1-6). The demand for folate increases during
pregnancy because of the growth of fetus, placenta and uterus (7). The benefits of sufficient folate
on reproductive and cardiovascular health have been well established (8-11). However, recent
studies have raised the concern about the adverse effect of maternal folate excess. Beard CM et
al. found that too much intake of folic acid may lead to autism-associated nervous tissue damage
(12). A recent study reveals a ‘U shaped’ relationship between maternal multivitamin
supplementation frequency and autism spectrum disorder (ASD) risk; this association is further
supported by findings based on the measurement of maternal plasma folate levels (13). Similarly,
the methyl donor supplementation used in the yellow agouti mouse model prevents
transgenerational amplification of obesity (14). However, high folate intake has been shown to
have adverse effects on rodent development (15) with a higher incidence of ventricular septal
defects, embryonic growth retardation and short-term memory impairment in offspring (16-18).
Additionally, at the molecular level, aberrant expression of imprinted and autism-related genes
including Aust1 and Fmr1 are observed in the cerebral cortex of postnatal day 1 (P1) pups (19).
Maternal folate supplementation prior to conception rescues the proliferation potential of
neural stem cells in Sp-/- embryos via epigenetic mechanisms (20). The splotch (Sp-/-) mice have a
homogenous mutation of Pax3 gene and is a widely used neural tube defect (NTD)-prone mouse
model with impaired ability to synthesize thymidylate and spontaneous occurrence of neural tube
defects in Sp-/- embryos (21, 22). Furthermore, recent studies showed that folic acid promotes the
proliferation of neural stem cells (NSCs) (23-25). It increases the phosphorylation of ERK1/2 (26),
and activates the ERK signaling that is implicated in proliferation (27). It activates Notch signaling
with elevated expression of Notch1 and Hes5 at both mRNA and protein levels (23). Moreover,
folic acid supplementation increases the protein expression and enzymatic activities of DNMT
family (24), resulting in altered DNA methylation profile in the PI3K/Akt/CREB pathway (25).
Folate deficiency leads to elevated level of homocysteine, which may induce DNA damage via
increased reactive oxidative species (ROS) production, leading to apoptosis in NSCs (28). In
addition, homocysteine inhibits the phosphorylation of ERK1/2, thus suppressing ERK signaling
(29), which affects the regulation of cell growth (27). The protein expression levels and enzymatic
activities of aconitase and respiratory complex III, two critical components on mitochondrial
45
respiratory chain, are decreased because of the neurotoxicity induced by homocysteine in NSCs
(30). Moreover, high level of homocysteine reduces the protein expression and the enzymatic
activity of DNA methyltransferases including DNMT1, DNMT3a and DNMT3b (31). This
indicates dysregulation of methylation events is an essential molecular mechanism underlying the
pathogenesis of folate deficiency.
Post-transcriptional modification of RNA is emerging as a new layer of gene expression
(32). Among the numerous modifications, 5-methylcytosine (5-mrC) is one of the most well-
known RNA modifications detected in transfer RNAs (tRNAs), ribosomal RNAs (rRNAs) and
most recently in messenger RNAs (mRNAs) (33, 34). RNA cytosine-5 methylation plays an
essential role in the regulation of diverse biological processes. 5-mrC in tRNAs is involved in the
regulation of tRNA stability and protein synthesis (35). 5-mrC in rRNAs affects the regulation of
translational fidelity and ribosome biogenesis (36, 37). 5-mrC in mRNAs regulates the stability,
export, translation efficiency of mRNAs (38, 39). Folate affects the regulation of RNA methylation
as well. The one-carbon unit bound by folate is shown to be essential for the methylation of tRNA
in mammalian mitochondria, which is required for mitochondrial mRNA (mt-mRNA) translation
and subsequent oxidative phosphorylation (40). Despite the critical roles of folate as a methyl-
donor, there has been no previous study to investigate the influence of folate intake on mRNA
cytosine-5 methylation.
The goal of this study is to explore the folate dose-response relationships and underlying
molecular mechanisms in term of mRNA methylation, transcription and translation. We
hypothesize that the intake of the methyl donor folate may influence RNA metabolism in neural
stem cells. Here, we systematically assess the transcriptome-wide influence of folic acid deficiency
and supplementation on RNA cytosine-5 methylation, transcription as well as translation profiles
in adult mouse neural stem cells (NSCs). To our surprise, we haven’t detected differentially
expressed genes but a number of differentially translated genes in NSCs with folate deficiency or
supplementation. We identify distinct 5-mrC modification profiles in NSCs cultured with different
concentration of folic acid. Moreover, we find consistent hypermethylation in polysome mRNAs
compared to total mRNAs. Our findings illustrate the transcriptome-wide influence of folate on
mRNA methylation and translation in NSCs and indicate a potential link between mRNA
methylation and mRNA translation efficiency.
46
3.3 Methods
Adult mouse NSC culture and treatments
Adult mouse neural stem cells (NSCs) from the subventricular zone (SVZ) of the lateral
ventricles are isolated and cultured as previously described (41). The mouse adult NSCs within 10
passages are used for experiments.
To test the effect of folic acid (FA), we prepare low FA medium (1.5 µmol/L folic acid) by
mixing folic acid-free DMEM (Sigma) and Ham’s F12 medium (containing 3 µmol/L folic acid)
at 1:1 volume ratio, with supplement of 2% B27 supplement, 2 mmol/L L-glutamine, 1x penicillin-
streptomycin, 20 ng/ml epidermal growth factor (EGF, PeproTech), 20 ng/ml basic fibroblast
growth factor (bFGF, PeproTech). 10mM FA stock is prepared from folic acid powder (Sigma)
and filtered through 0.22µm membrane. NSCs are incubated with the indicated concentration of
FA for 4 days, with medium change at day 2. The three treatment groups are 1.5 µmol/L folic acid
(LF group), 10 µmol/L folic acid (MF group), 80 µmol/L folic acid (HF group).
Polysome fractionation
Polysome fractionation is performed as previously described (42). After treating with
different concentrations of folic acid for 4 days, monolayer culture of NSCs are incubated with
cyclohexamide (CHX, Sigma Aldrich, 100 µg/ml) at 37 °C for 10 min to stabilize ribosomes. After
washed with ice-cold PBS containing 100 µg/ml CHX, the NSCs are detached from the plate by
cell scraper and spun down at 300g at 4°C for 5min. The cell pellet is immediately stored in -80
°C freezer for later analysis. Frozen cell pellets are thawed on ice, lysed in hypotonic lysis buffer,
centrifuged at 15,000 rpm for 5 min at 4 °C. The supernatant is collected and subjected to the
measurement of OD260nm using Nanodrop 2000. Based on the values of OD260nm, equal amount
of the lysate is loaded on 10%-50% sucrose gradients and ultracentrifuged in a SW41Ti rotor
(Beckman Coulter) at 35,000 rpm at 4°C for 3 hours. The gradients are fractionated into 15
fractions through Gradient Station (BioCamp). Polysome fractions (fraction 9-15) are identified,
pooled, and extracted with TRIzol LS reagent. The purified polysome RNA samples are used for
RNA-seq and RNA BS-seq library construction.
Generation of unmethylated spike-in mRNA control
The spiked-in unmethylated mRNA is transcribed from the pTRI-Xef plasmid supplied by
the MEGAscript™ T7 Transcription Kit (Invitorgen), which encodes 1.85 kb Xenopus elongation
47
factor 1α mRNA according to the manufacturer’s manual. Briefly, the linearized pTRI-Xef
plasmid is in vitro transcribed in an reaction with MEGAscript T7 RNA polymerase (Ambion) at
37 °C for 4 h, followed by DNase treatment to remove DNA template. The RNA sample is purified
by RNeasy Mini Kit (QIAGEN). The in vitro transcribed unmethylated mRNA control is spiked
at a ratio of 0.5% in the RNA samples before bisulfite treatment.
RNA BS-seq library construction
RNA bisulfite conversion is performed as previously described (43) with minor
modifications. Briefly, poly(A) RNA is spiked-in with Xef1 unmethylated RNA and bisulfte
converted using the EZ RNA methylation Kit (Zymo Research) with initial denaturation at 94°C
for 1min, followed by three cycles of 70 °C for 10min and 64 °C for 45min. Binding,
desulphonation, and purification are performed on-column following the manufacturer’s
instructions. The eluted RNA is used for stranded RNA-seq library construction using the TruSeq
Stranded mRNA Library Preparation Kit (Illumina) with the following modifications: 1) omit the
fragmentation step; 2) supplement ACT random hexamers during first strand cDNA synthesis.
RNA-seq library construction
Stranded RNA-seq libraries are constructed using the TruSeq Stranded mRNA Library
Preparation Kit (Illumina) following the manufacturer’s instructions. Briefly, after two rounds of
poly(A) selection, the mRNA samples are fragmented and primed to synthesize first strand cDNA,
followed by the synthesis of the second strand cDNA. After Ampure XP beads purification, dA
tailing is performed and indexed adapters are ligated to both ends of the ds cDNA. Adapter-ligated
DNA fragments are enriched by PCR amplification for 12 cycles. After Ampure XP beads
purification, the PCR products are size-selected with the range from 350bp to 550bp on 2% dye-
free agarose gel using pippin recovery system (Sage Science). The recovered libraries are
sequenced on Hiseq 4000 platform with 150bp paired end mode (Illumina).
RNA-seq data analysis
Raw reads are trimmed of adapter sequences and low quality bases (Q < 30) using Trim
Galore (version 0.5.0) (https://www.bioinformatics.babraham.ac.uk/projects/trim_galore/). The
processed reads with lengths greater than 30 nt are defined as clean reads. Clean reads are mapped
to mm10 genome and gene expression levels are outputted by RSEM (44). We filter out genes that
are not expressed (TPM=0) and the union genes of the two replicates are compiled as the expressed
48
gene list. For differentially expressed genes analysis, we use the cpm function from the edgeR
package (45, 46) to generate the CPM (Counts per million) values and then filter out the genes
with CPM ≤ 0.5. The raw counts are employed to identify differentially expression genes by
DESeq2 (47). The criteria of differentially expressed genes include: (1) the adjusted p-value is less
than 0.05, and (2) the fold change is above 1.5.
Differential translation analysis
Translation efficiency (TE) is estimated as the ratio between polysome mRNA counts and
total mRNA counts (TE=polysome/total). Fold changes in TE between two conditions are
calculated as TE(treatment)/TE(control). We perform differential translation efficiency analysis
using the package Xtail (48) with the following parameter: minMeanCount = 1. The criteria of
differentially translated genes (DTG) include: (1) the adjusted p-value is less than 0.05, and (2)
there are at least 1.5 fold changes.
RNA BS seq data analysis
Mouse transcriptome and annotation files are download from Emsemble database. Raw reads
are trimmed of adapter sequences, the first 6 bases on 5’ end, and low quality bases (Q < 30) using
Trim Galore (https://www.bioinformatics.babraham.ac.uk/projects/trim_galore/). The processed
reads with lengths greater than 30 nt are defined as clean reads and mapped to the mouse
transcriptome (GRCm38) using “meRanT align” from meRanTK (version 1.2.1) with stringent
parameters: -fmo –mmr 0.01 (49). Analysis of the Xef spike-in controls reveals bisulfite
conversion rates of > 99%. Unambiguously aligned reads are used to call candidate m5Cs by
meRanCall from meRanTK with the parameters: -md 1 -ei 0.1 -fdr 0.01. Only cytosine positions
with coverage depth ≥ 20, methylation level ≥ 0.1 and methylated cytosine depth ≥ 3 are considered
as candidate 5-mrC sites. As the reduced complexity of bisulfite-converted RNA could cause
incorrect read alignment (50), we exclude 5-mrC sites located on transcripts that are not expressed
in the corresponding RNA-seq datasets (TPM = 0). Each group contains two biological replicates
and the overlapped m5C sites between the two replicates are used for downstream analysis. The
coordinates of these sites are converted to genome coordinates using R package ensembldb (51).
Distribution of 5-mrC sites
The 5-mrC sites are annotated with the GTF file downloaded from Ensemble. The 5-mrC
sites are assigned to four regions: 5’ UTR, 3’ UTR, CDS and noncoding RNA. According to the
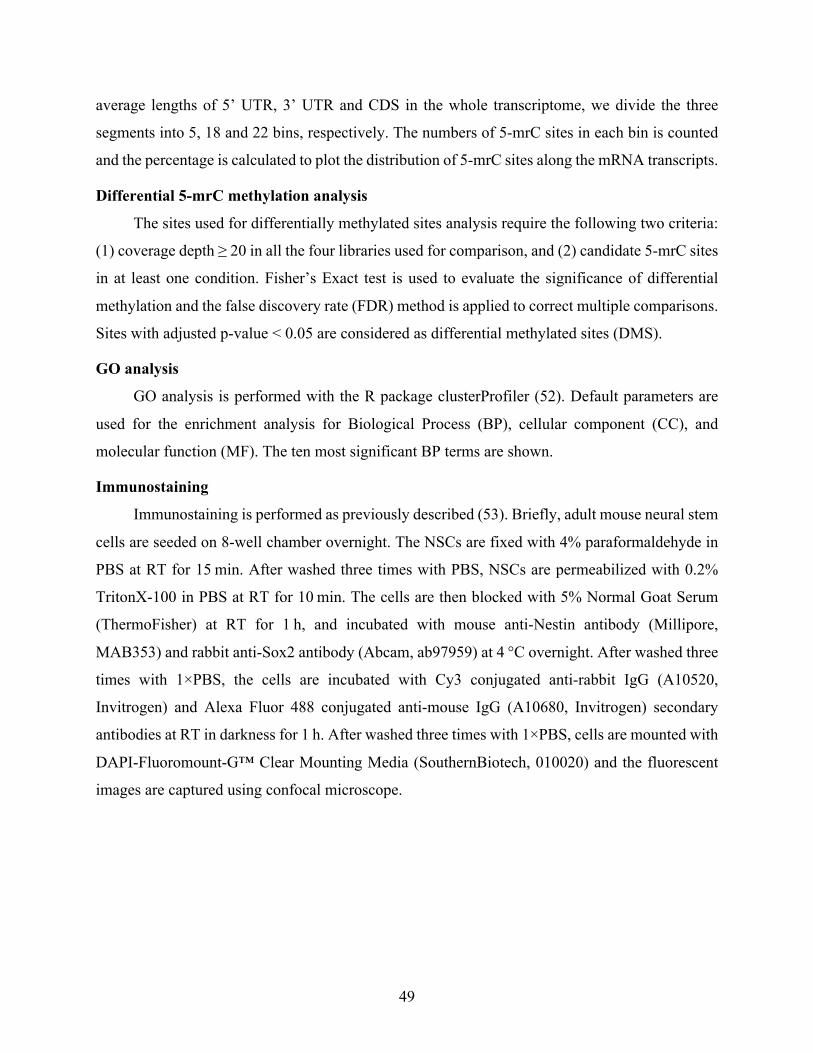
49
average lengths of 5’ UTR, 3’ UTR and CDS in the whole transcriptome, we divide the three
segments into 5, 18 and 22 bins, respectively. The numbers of 5-mrC sites in each bin is counted
and the percentage is calculated to plot the distribution of 5-mrC sites along the mRNA transcripts.
Differential 5-mrC methylation analysis
The sites used for differentially methylated sites analysis require the following two criteria:
(1) coverage depth ≥ 20 in all the four libraries used for comparison, and (2) candidate 5-mrC sites
in at least one condition. Fisher’s Exact test is used to evaluate the significance of differential
methylation and the false discovery rate (FDR) method is applied to correct multiple comparisons.
Sites with adjusted p-value < 0.05 are considered as differential methylated sites (DMS).
GO analysis
GO analysis is performed with the R package clusterProfiler (52). Default parameters are
used for the enrichment analysis for Biological Process (BP), cellular component (CC), and
molecular function (MF). The ten most significant BP terms are shown.
Immunostaining
Immunostaining is performed as previously described (53). Briefly, adult mouse neural stem
cells are seeded on 8-well chamber overnight. The NSCs are fixed with 4% paraformaldehyde in
PBS at RT for 15 min. After washed three times with PBS, NSCs are permeabilized with 0.2%
TritonX-100 in PBS at RT for 10 min. The cells are then blocked with 5% Normal Goat Serum
(ThermoFisher) at RT for 1 h, and incubated with mouse anti-Nestin antibody (Millipore,
MAB353) and rabbit anti-Sox2 antibody (Abcam, ab97959) at 4 °C overnight. After washed three
times with 1×PBS, the cells are incubated with Cy3 conjugated anti-rabbit IgG (A10520,
Invitrogen) and Alexa Fluor 488 conjugated anti-mouse IgG (A10680, Invitrogen) secondary
antibodies at RT in darkness for 1 h. After washed three times with 1×PBS, cells are mounted with
DAPI-Fluoromount-G™ Clear Mounting Media (SouthernBiotech, 010020) and the fluorescent
images are captured using confocal microscope.
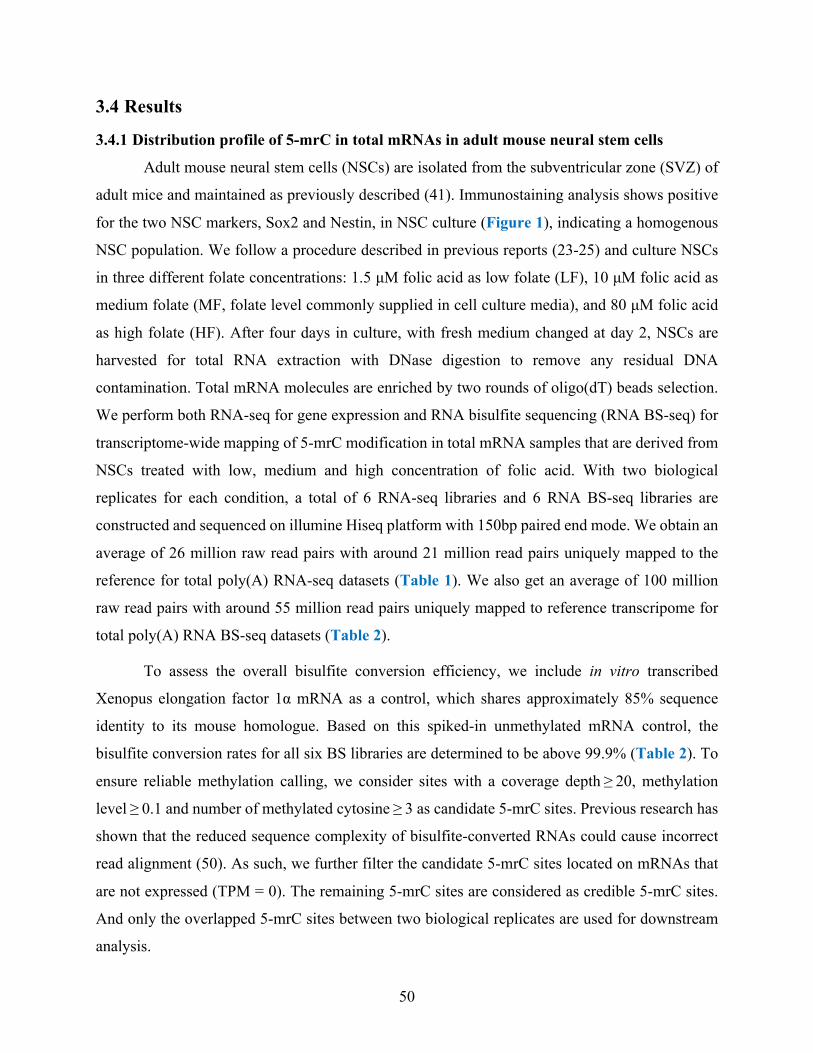
50
3.4 Results
3.4.1 Distribution profile of 5-mrC in total mRNAs in adult mouse neural stem cells
Adult mouse neural stem cells (NSCs) are isolated from the subventricular zone (SVZ) of
adult mice and maintained as previously described (41). Immunostaining analysis shows positive
for the two NSC markers, Sox2 and Nestin, in NSC culture (Figure 1), indicating a homogenous
NSC population. We follow a procedure described in previous reports (23-25) and culture NSCs
in three different folate concentrations: 1.5 µM folic acid as low folate (LF), 10 µM folic acid as
medium folate (MF, folate level commonly supplied in cell culture media), and 80 µM folic acid
as high folate (HF). After four days in culture, with fresh medium changed at day 2, NSCs are
harvested for total RNA extraction with DNase digestion to remove any residual DNA
contamination. Total mRNA molecules are enriched by two rounds of oligo(dT) beads selection.
We perform both RNA-seq for gene expression and RNA bisulfite sequencing (RNA BS-seq) for
transcriptome-wide mapping of 5-mrC modification in total mRNA samples that are derived from
NSCs treated with low, medium and high concentration of folic acid. With two biological
replicates for each condition, a total of 6 RNA-seq libraries and 6 RNA BS-seq libraries are
constructed and sequenced on illumine Hiseq platform with 150bp paired end mode. We obtain an
average of 26 million raw read pairs with around 21 million read pairs uniquely mapped to the
reference for total poly(A) RNA-seq datasets (Table 1). We also get an average of 100 million
raw read pairs with around 55 million read pairs uniquely mapped to reference transcripome for
total poly(A) RNA BS-seq datasets (Table 2).
To assess the overall bisulfite conversion efficiency, we include in vitro transcribed
Xenopus elongation factor 1α mRNA as a control, which shares approximately 85% sequence
identity to its mouse homologue. Based on this spiked-in unmethylated mRNA control, the
bisulfite conversion rates for all six BS libraries are determined to be above 99.9% (Table 2). To
ensure reliable methylation calling, we consider sites with a coverage depth ≥ 20, methylation
level ≥ 0.1 and number of methylated cytosine ≥ 3 as candidate 5-mrC sites. Previous research has
shown that the reduced sequence complexity of bisulfite-converted RNAs could cause incorrect
read alignment (50). As such, we further filter the candidate 5-mrC sites located on mRNAs that
are not expressed (TPM = 0). The remaining 5-mrC sites are considered as credible 5-mrC sites.
And only the overlapped 5-mrC sites between two biological replicates are used for downstream
analysis.
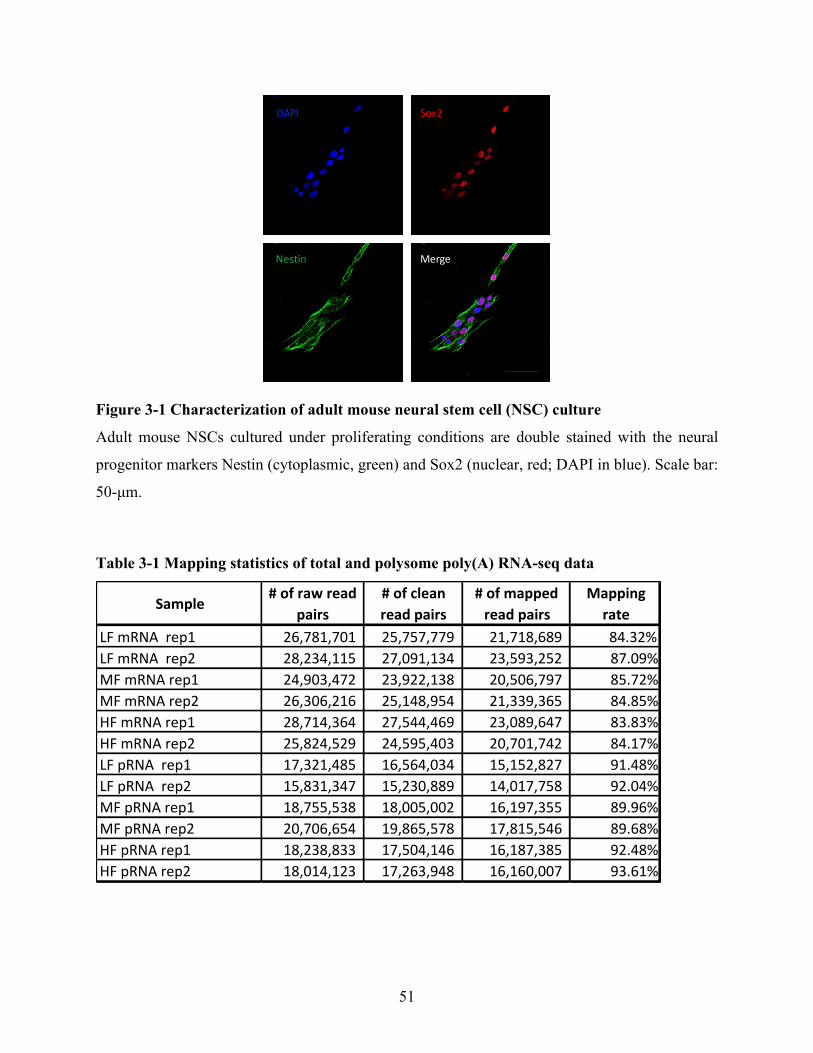
51
Figure 3-1 Characterization of adult mouse neural stem cell (NSC) culture
Adult mouse NSCs cultured under proliferating conditions are double stained with the neural
progenitor markers Nestin (cytoplasmic, green) and Sox2 (nuclear, red; DAPI in blue). Scale bar:
50-µm.
Table 3-1 Mapping statistics of total and polysome poly(A) RNA-seq data
Nestin
DAPI Sox2
Merge
RNA-seqdatasets(FA)
Sample #ofrawreadpairs
#ofcleanreadpairs
#ofmappedreadpairs
Mappingrate
LFmRNArep1 26,781,701 25,757,779 21,718,689 84.32%LFmRNArep2 28,234,115 27,091,134 23,593,252 87.09%MFmRNArep1 24,903,472 23,922,138 20,506,797 85.72%MFmRNArep2 26,306,216 25,148,954 21,339,365 84.85%HFmRNArep1 28,714,364 27,544,469 23,089,647 83.83%HFmRNArep2 25,824,529 24,595,403 20,701,742 84.17%LFpRNArep1 17,321,485 16,564,034 15,152,827 91.48%LFpRNArep2 15,831,347 15,230,889 14,017,758 92.04%MFpRNArep1 18,755,538 18,005,002 16,197,355 89.96%MFpRNArep2 20,706,654 19,865,578 17,815,546 89.68%HFpRNArep1 18,238,833 17,504,146 16,187,385 92.48%HFpRNArep2 18,014,123 17,263,948 16,160,007 93.61%
52
Table 3-2 Mapping statistics of total and polysome poly (A) RNA BS-seq data
Our results show good reproducibility between the two biological replicates. About 34.8%
to 66.1% of 5-mrC sites identified in one biological replicate are found to be methylated in the
other biological replicate as well (Supplementary Figure 1a-c). In addition, the Pearson’s
correlation for the methylation level of 5-mrC sites overlapped between two replicates is in the
range from 0.90 to 0.97 (Supplementary Figure 1d-f). A total of 1,706-1,777 5-mrC sites within
128-159 mRNA molecules are identified in NSCs cultured with different concentrations of folic
acid. The majority (98.7% ~ 99.5%) of the 5-mrC sites are found to occur within mRNAs (Figure
2f-h). The rest 5-mrC sites are mapped to noncoding RNAs (Figure 2f-h). Similar to previous
reports (38, 54), the medium methylation level of 5-mrC sites is ~25% among the three groups
(27.6% in LF, 22.5% in MF, and 24.6% in HF) (Figure 2d). The majority (48.3% in LF, 60.0% in
MF, and 51.9% in HF) of 5-mrC sites are below 30%, and only 11.0%-27.8% of 5-mrC sites show
methylation level above 50% (Figure 2a-c). In addition, the sequence frequency logo shows that
5-mrC sites are embedded in C-C/U-rich sequence context (Figure 2e). This is similar to the
sequence context reported in zebrafish early embryos (55), but slightly different from previous
finding in HeLa cells that 5-mrC sites are embedded in CG-rich environment (38). The distribution
profile of 5-mrC sites in mRNAs shows an enrichment of 5-mrC modification in the coding
sequences (CDS) and 3’UTR (Figure 2f-h). The density plot shows a mild peak of 5-mrC sites
RNABS-seqdatasets(FA)
Sample#ofrawread
pairs#ofcleanreadpairs
#ofmappedreadpairs
Mappingrate
Bisulfiteconversionrate
LFmRNA_BSrep1 77,642,938 71,099,322 50,784,214 71.43% 0.9994LFmRNA_BSrep2 91,976,960 86,729,807 57,488,191 66.28% 0.9994MFmRNA_BSrep1 72,018,791 66,361,290 49,604,196 74.75% 0.9994MFmRNA_BSrep2 77,644,048 72,915,734 51,864,274 71.13% 0.9994HFmRNA_BSrep1 153,352,803 120,820,824 67,063,229 55.51% 0.9994HFmRNA_BSrep2 124,057,769 90,325,039 55,291,666 61.21% 0.9995LFpRNA_BSrep1 135,957,235 101,147,250 34,690,802 34.30% 0.9994LFpRNA_BSrep2 190,267,641 137,991,422 52,362,410 37.95% 0.9994MFpRNA_BSrep1 121,340,008 104,067,601 35,324,997 33.94% 0.9994MFpRNA_BSrep2 134,987,984 108,062,216 32,469,104 30.05% 0.9994HFpRNA_BSrep1 138,865,399 115,410,482 34,319,240 29.74% 0.9994HFpRNA_BSrep2 134,315,655 127,897,752 68,248,452 53.36% 0.9994
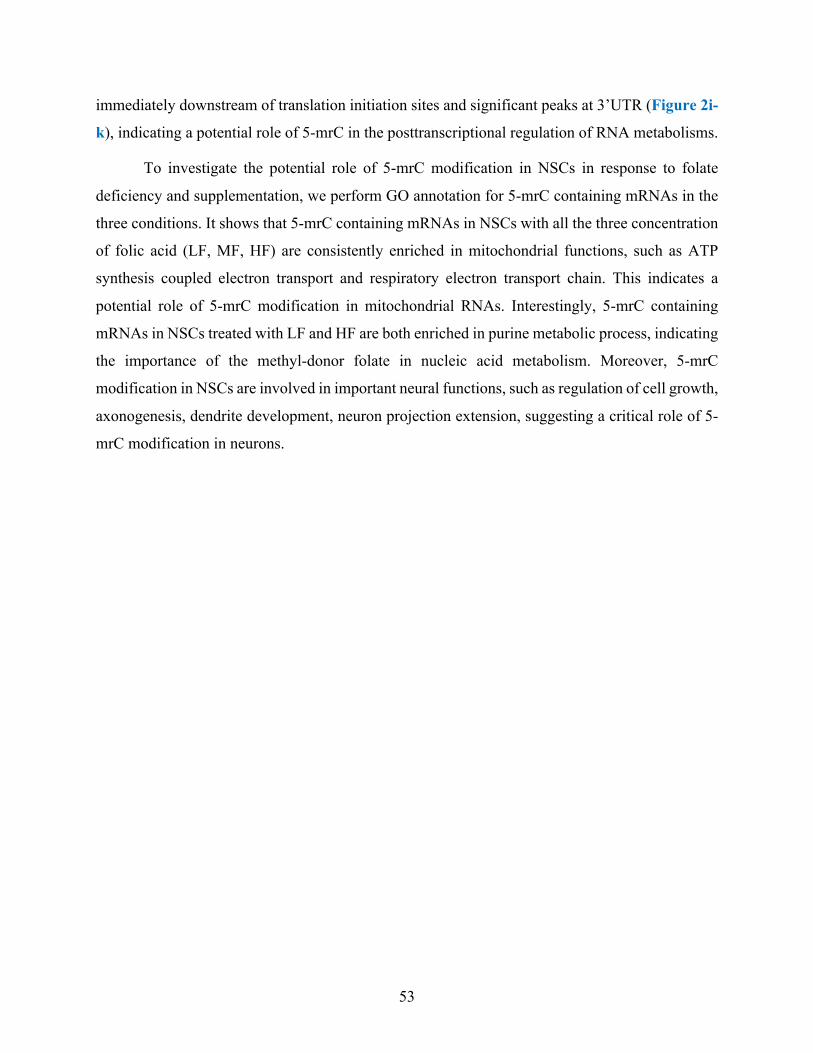
53
immediately downstream of translation initiation sites and significant peaks at 3’UTR (Figure 2i-
k), indicating a potential role of 5-mrC in the posttranscriptional regulation of RNA metabolisms.
To investigate the potential role of 5-mrC modification in NSCs in response to folate
deficiency and supplementation, we perform GO annotation for 5-mrC containing mRNAs in the
three conditions. It shows that 5-mrC containing mRNAs in NSCs with all the three concentration
of folic acid (LF, MF, HF) are consistently enriched in mitochondrial functions, such as ATP
synthesis coupled electron transport and respiratory electron transport chain. This indicates a
potential role of 5-mrC modification in mitochondrial RNAs. Interestingly, 5-mrC containing
mRNAs in NSCs treated with LF and HF are both enriched in purine metabolic process, indicating
the importance of the methyl-donor folate in nucleic acid metabolism. Moreover, 5-mrC
modification in NSCs are involved in important neural functions, such as regulation of cell growth,
axonogenesis, dendrite development, neuron projection extension, suggesting a critical role of 5-
mrC modification in neurons.
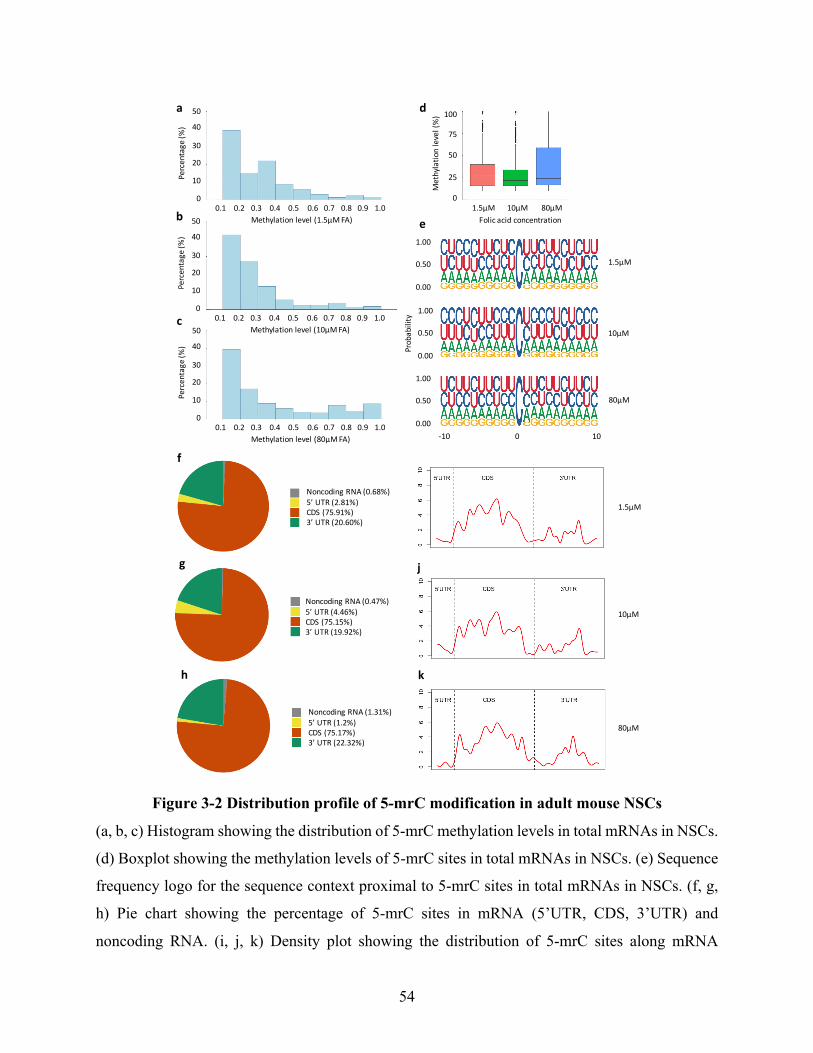
54
Figure 3-2 Distribution profile of 5-mrC modification in adult mouse NSCs
(a, b, c) Histogram showing the distribution of 5-mrC methylation levels in total mRNAs in NSCs.
(d) Boxplot showing the methylation levels of 5-mrC sites in total mRNAs in NSCs. (e) Sequence
frequency logo for the sequence context proximal to 5-mrC sites in total mRNAs in NSCs. (f, g,
h) Pie chart showing the percentage of 5-mrC sites in mRNA (5’UTR, CDS, 3’UTR) and
noncoding RNA. (i, j, k) Density plot showing the distribution of 5-mrC sites along mRNA
0.10.20.30.40.50.60.70.80.91.0Methylationlevel(1.5μMFA)
50
40
30
20
10
0
Percentage(%
)
0.10.20.30.40.50.60.70.80.91.0Methylationlevel(10μMFA)
50
40
30
20
10
0
Percentage(%
)
0.10.20.30.40.50.60.70.80.91.0Methylationlevel(80μMFA)
50
40
30
20
10
0
Percentage(%
)
1.00
0.50
0.00
1.00
0.50
0.00
1.00
0.50
0.00
Probability
-10010
1.5μM
10μM
80μM
1.5μM 10μM 80μMFolicacidconcentration
100
75
50
25
0
Methylatio
nlevel(%)
a
b
c
d
e
1.5μM
10μM
80μM
j
k
NoncodingRNA(0.68%)5’UTR(2.81%)CDS(75.91%)3’UTR(20.60%)
f
NoncodingRNA(0.47%)5’UTR(4.46%)CDS(75.15%)3’UTR(19.92%)
g
NoncodingRNA(1.31%)5’UTR(1.2%)CDS(75.17%)3’UTR(22.32%)
h
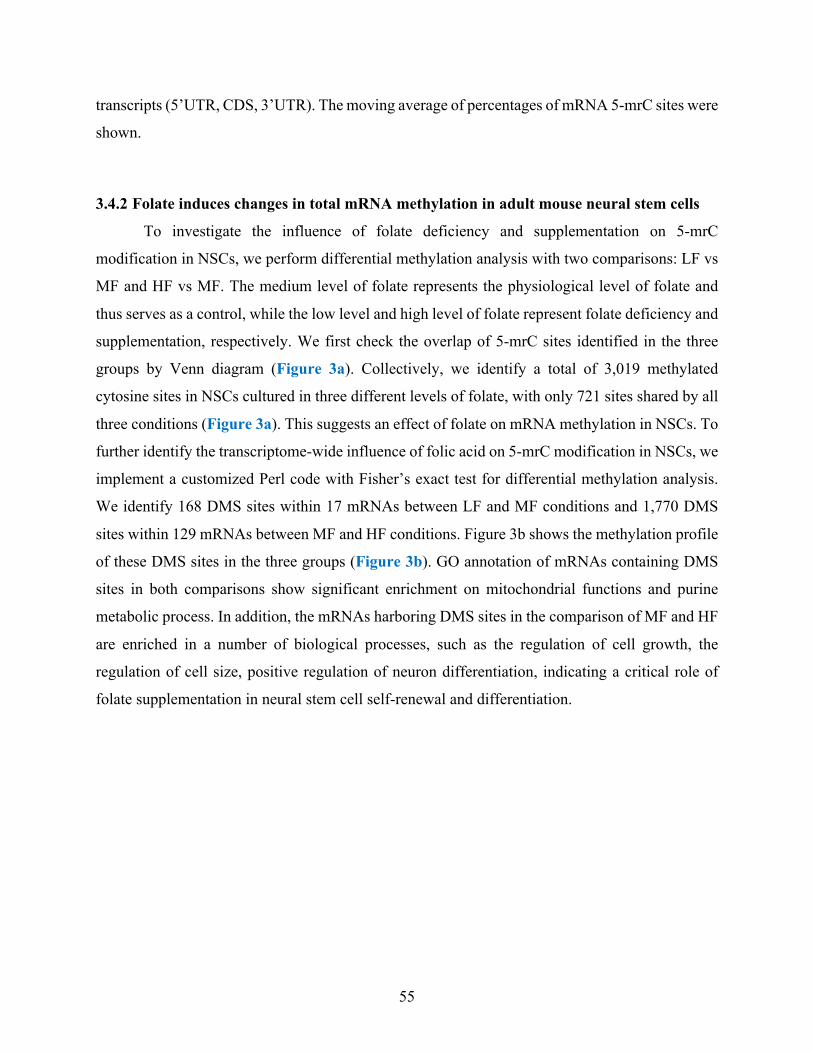
55
transcripts (5’UTR, CDS, 3’UTR). The moving average of percentages of mRNA 5-mrC sites were
shown.
3.4.2 Folate induces changes in total mRNA methylation in adult mouse neural stem cells
To investigate the influence of folate deficiency and supplementation on 5-mrC
modification in NSCs, we perform differential methylation analysis with two comparisons: LF vs
MF and HF vs MF. The medium level of folate represents the physiological level of folate and
thus serves as a control, while the low level and high level of folate represent folate deficiency and
supplementation, respectively. We first check the overlap of 5-mrC sites identified in the three
groups by Venn diagram (Figure 3a). Collectively, we identify a total of 3,019 methylated
cytosine sites in NSCs cultured in three different levels of folate, with only 721 sites shared by all
three conditions (Figure 3a). This suggests an effect of folate on mRNA methylation in NSCs. To
further identify the transcriptome-wide influence of folic acid on 5-mrC modification in NSCs, we
implement a customized Perl code with Fisher’s exact test for differential methylation analysis.
We identify 168 DMS sites within 17 mRNAs between LF and MF conditions and 1,770 DMS
sites within 129 mRNAs between MF and HF conditions. Figure 3b shows the methylation profile
of these DMS sites in the three groups (Figure 3b). GO annotation of mRNAs containing DMS
sites in both comparisons show significant enrichment on mitochondrial functions and purine
metabolic process. In addition, the mRNAs harboring DMS sites in the comparison of MF and HF
are enriched in a number of biological processes, such as the regulation of cell growth, the
regulation of cell size, positive regulation of neuron differentiation, indicating a critical role of
folate supplementation in neural stem cell self-renewal and differentiation.
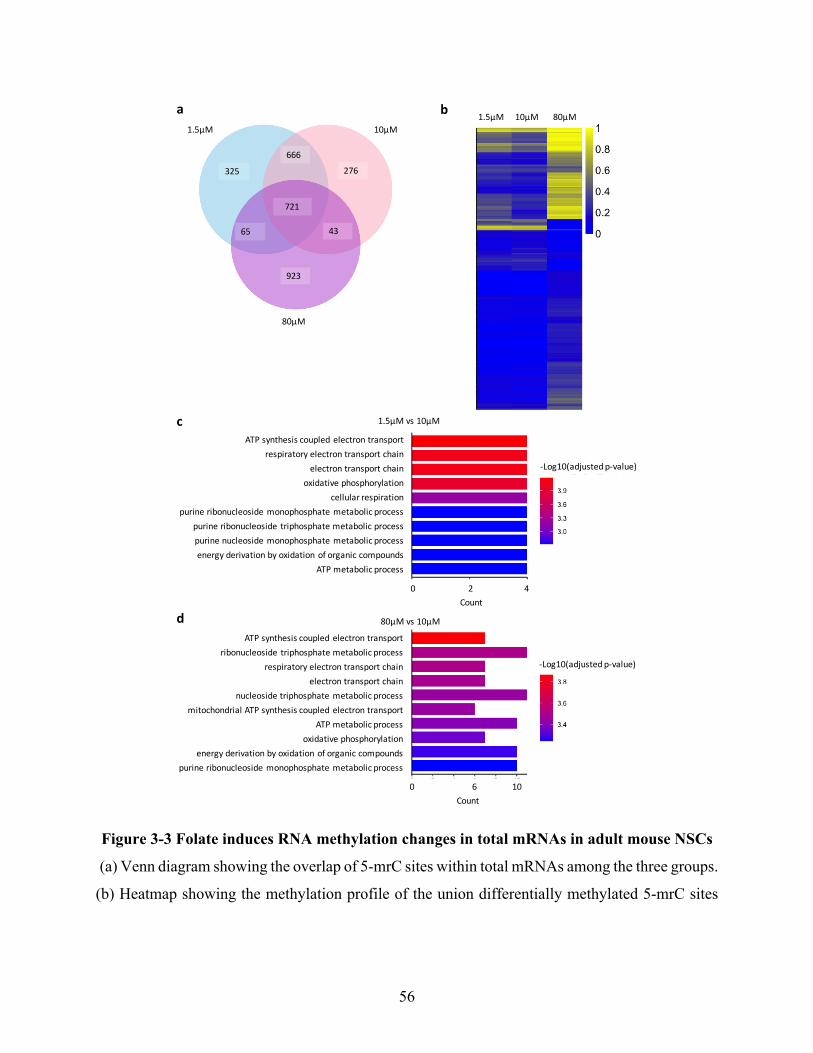
56
Figure 3-3 Folate induces RNA methylation changes in total mRNAs in adult mouse NSCs
(a) Venn diagram showing the overlap of 5-mrC sites within total mRNAs among the three groups.
(b) Heatmap showing the methylation profile of the union differentially methylated 5-mrC sites
1.5μM 10μM
80μM
666276
721
4365
325
923
80μM1.5μM 10μMa b
c 1.5μM vs10μM
ATPsynthesiscoupledelectrontransportrespiratoryelectrontransportchain
electrontransportchainoxidativephosphorylation
cellularrespirationpurineribonucleoside monophosphatemetabolicprocess
purineribonucleoside triphosphatemetabolicprocesspurinenucleosidemonophosphatemetabolicprocessenergyderivationbyoxidationoforganiccompounds
ATPmetabolicprocess
-Log10(adjustedp-value)
0 24Count
80μM vs10μM
ATPsynthesiscoupledelectrontransportribonucleoside triphosphatemetabolicprocess
respiratoryelectrontransportchainelectrontransportchain
nucleosidetriphosphatemetabolicprocessmitochondrialATPsynthesiscoupledelectrontransport
ATPmetabolicprocessoxidativephosphorylation
energyderivationbyoxidationoforganiccompoundspurineribonucleoside monophosphatemetabolicprocess
-Log10(adjustedp-value)
0 610Count
d
57
(1.5µM vs 10µM and 80µM vs 10µM) in the three groups. (c, d) Gene ontology analysis of mRNAs
with differentially methylated 5-mrC sites (c: 1.5µM vs 10µM, d: 80µM vs 10µM).
3.4.3 Distribution profile of 5-mrC in polysome mRNAs in adult mouse neural stem cells
To investigate the influence of folate on translation and provide a direct evidence of the
methylation status of actively translating mRNAs, we perform polysome profiling as well as RNA
bisulfite sequencing of polysome-associated mRNAs. Briefly, we culture NSCs in three
concentrations of folic acid, 1.5 µM (LF), 10 µM (MF) and 80 µM (HF), for 4 days. The NSC
cultures are treated with cyclohexamide (CHX) to stabilize ribosomes on poly(A) RNAs, and then
lysed with hypotonic lysis buffer. The cell lysates are separated by sucrose gradient
ultracentrifugation and fractionated by Gradient Station (BioCamp). The polysome fractions with
more than 3 ribosomes are pooled for RNA extraction, representing medium to high actively
translating mRNAs. The polysome RNA samples are digested with DNase enzyme and then
subjected to two rounds of oligo(dT) beads selection to enrich poly(A)-containing mRNAs. The
polysome mRNA samples are used for RNA-seq and RNA BS-seq library construction. With two
biological replicates for each condition, we construct 6 polysome poly(A) RNA-seq libraries and
6 polysome poly(A) RNA BS-seq libraries for high-throughput sequencing. We obtain an average
of 18 million raw read pairs for polysome poly(A) RNA-seq libraries with around 16 million read
pairs uniquely mapped to the reference (Table 1). We also obtain an average of 140 million raw
read pairs for polysome poly(A) RNA BS-seq libraries with around 43 million read pairs uniquely
mapped to the reference transcriptome (Table 2).
Similar to the total poly(A) RNA BS-seq datasets, the spiked-in unmethylated Xef mRNA
control shows a very high bisulfite conversion rate (0.9994) in all the six polysome poly(A) RNA
BS-seq libraries (Table 2). To obtain consistent and comparable results for 5-mrC calling on
polysome-associated mRNAs, we implement the same parameters of trimming, alignment and
methylation calling for polysome poly(A) RNA BS-seq datasets. We apply the same criteria to
filter potentially false-positive 5-mrC sites. Only the overlapped 5-mrC sites between two
biological replicates are used for downstream analysis.
The reproducibility is very high between two biological replicates (Supplementary Figure
4). We obtain 2,253~4,207 credible 5-mrC sites within 236-283 RNA molecules in polysome
58
poly(A) RNA BS-seq datasets. Similar to total poly(A) RNAs, most of 5-mrC sites identified from
polysome-associated poly(A) RNAs are located on mRNA molecules (LF: 95.3%; MF: 96.7%;
HF: 96.6%) (Figure 4f-h). The medium methylation level is around 25% (24.4% in LF, 23.6% in
MF, and 25.9% in HF) (Figure 4d). Sequence frequency logo shows a C-C/U-rich sequence
context (Figure 4e). The distribution of 5-mrC modification shows enrichment at 5’UTR and
3’UTR, with a small peak downstream of translation initiation sites (Figure 4i-k), indicating the
potential regulatory role of 5-mrC modification in mRNA translation.
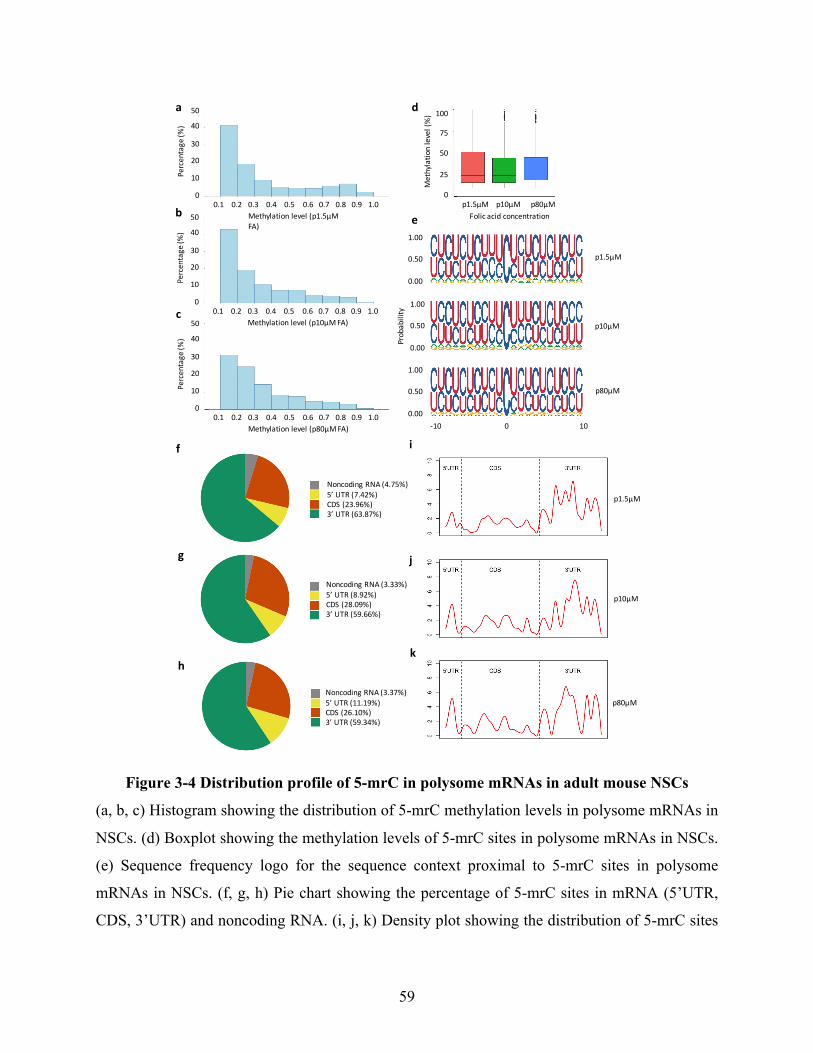
59
Figure 3-4 Distribution profile of 5-mrC in polysome mRNAs in adult mouse NSCs
(a, b, c) Histogram showing the distribution of 5-mrC methylation levels in polysome mRNAs in
NSCs. (d) Boxplot showing the methylation levels of 5-mrC sites in polysome mRNAs in NSCs.
(e) Sequence frequency logo for the sequence context proximal to 5-mrC sites in polysome
mRNAs in NSCs. (f, g, h) Pie chart showing the percentage of 5-mrC sites in mRNA (5’UTR,
CDS, 3’UTR) and noncoding RNA. (i, j, k) Density plot showing the distribution of 5-mrC sites
a d
0.10.20.30.40.50.60.70.80.91.0
Methylationlevel(p1.5μMFA)
50
40
30
20
10
0
Percentage(%
)
0.10.20.30.40.50.60.70.80.91.0
Methylationlevel(p10μMFA)
50
40
30
20
10
0
Percentage(%
)
0.10.20.30.40.50.60.70.80.91.0
Methylationlevel(p80μMFA)
50
40
30
20
10
0
Percentage(%
)
p1.5μM p10μM p80μM
Folicacidconcentration
100
75
50
25
0
Methylationlevel(%)
1.00
0.50
0.00
1.00
0.50
0.00
1.00
0.50
0.00
Probability
-10010
p1.5μM
p10μM
p80μM
b
c
e
p1.5μM
p10μM
p80μM
f
h
i
g j
k
NoncodingRNA(4.75%)5’UTR(7.42%)CDS(23.96%)3’UTR(63.87%)
NoncodingRNA(3.33%)5’UTR(8.92%)CDS(28.09%)3’UTR(59.66%)
NoncodingRNA(3.37%)5’UTR(11.19%)CDS(26.10%)3’UTR(59.34%)
60
along mRNA transcripts (5’UTR, CDS, 3’UTR). The moving average of percentages of mRNA 5-
mrC sites are shown.
3.4.4 Folate induces changes polysome mRNA methylation in adult mouse neural stem cells
To identify the influence of folate on 5-mrC modification on polysome-associated mRNAs,
we apply the same procedures for differential methylation analysis. Venn diagram shows a total
of 5,342 5-mrC sites and 1,303 sites are conserved in the three conditions (Figure 5a). We next
perform Fisher’s exact test to identify differentially methylated 5-mrC sites. As a result, we
identify 465 DMS sites within 43 mRNAs between LF and MF, and 905 DMS sites within 86
mRNAs between HF and MF. Figure 5b shows the methylation profile of these DMS sites in the
three groups (Figure 5b). GO annotation is performed to identify the potential biological functions
associated with DMS-containing mRNAs. We are not able to identify any enrichment for DMS-
containing mRNAs in the comparison of MF and HF. However, it shows significant enrichment
for DMS-containing mRNAs in the comparison of LF and MF in several biological processes,
such as cellular response to starvation, cellular response to nutrient levels (Figure 5c), indicating
a critical role of the methyl donor folate as a nutrient supplement.
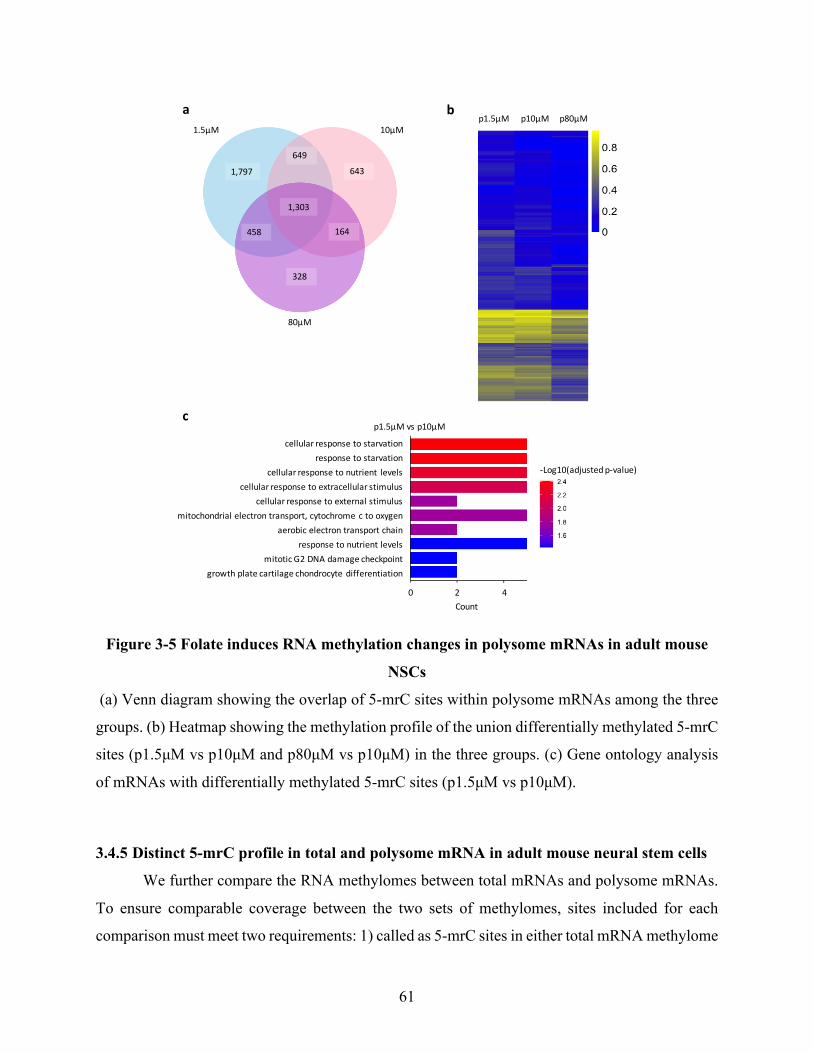
61
Figure 3-5 Folate induces RNA methylation changes in polysome mRNAs in adult mouse
NSCs
(a) Venn diagram showing the overlap of 5-mrC sites within polysome mRNAs among the three
groups. (b) Heatmap showing the methylation profile of the union differentially methylated 5-mrC
sites (p1.5µM vs p10µM and p80µM vs p10µM) in the three groups. (c) Gene ontology analysis
of mRNAs with differentially methylated 5-mrC sites (p1.5µM vs p10µM).
3.4.5 Distinct 5-mrC profile in total and polysome mRNA in adult mouse neural stem cells
We further compare the RNA methylomes between total mRNAs and polysome mRNAs.
To ensure comparable coverage between the two sets of methylomes, sites included for each
comparison must meet two requirements: 1) called as 5-mrC sites in either total mRNA methylome
1.5μM 10μM
80μM
649
643
1,303
164458
1,797
328
p80μMp1.5μM p10μMa b
cp1.5μM vsp10μM
-Log10(adjustedp-value)
0 24
Count
cellularresponsetostarvation
responsetostarvation
cellularresponsetonutrient levels
cellularresponsetoextracellularstimulus
cellularresponsetoexternalstimulus
mitochondrialelectrontransport,cytochromectooxygen
aerobicelectrontransportchain
responsetonutrientlevels
mitoticG2DNAdamagecheckpoint
growthplatecartilagechondrocytedifferentiation
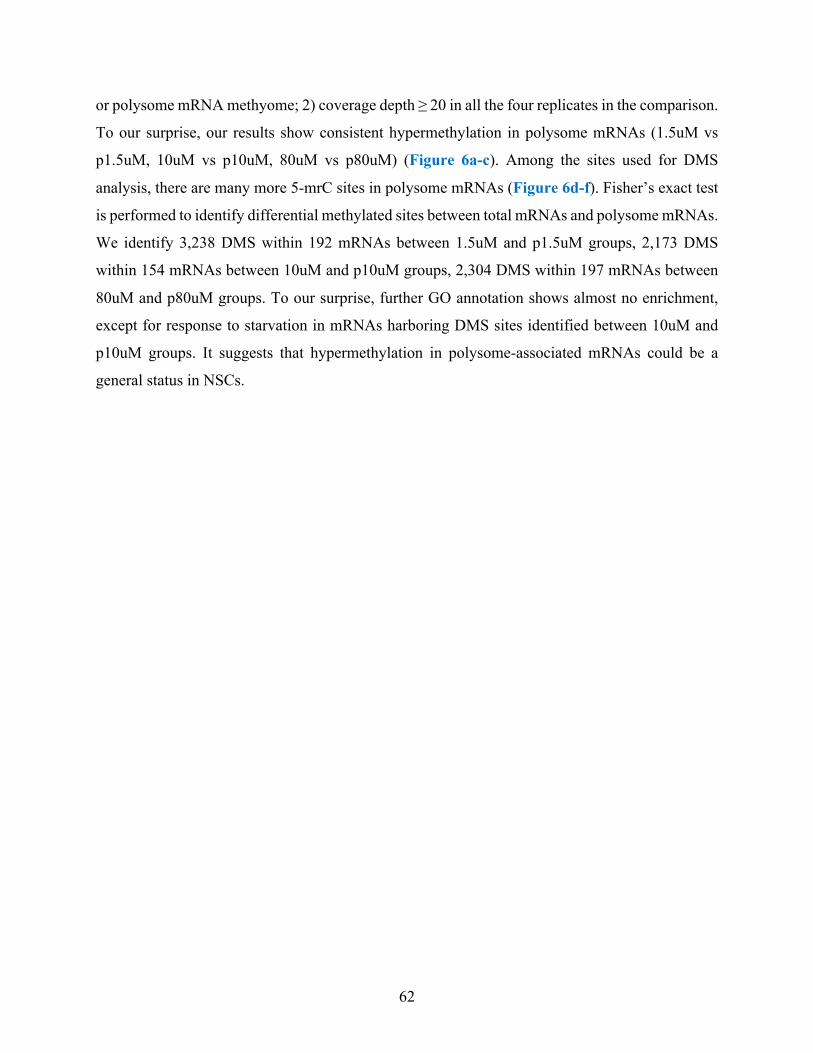
62
or polysome mRNA methyome; 2) coverage depth ≥ 20 in all the four replicates in the comparison.
To our surprise, our results show consistent hypermethylation in polysome mRNAs (1.5uM vs
p1.5uM, 10uM vs p10uM, 80uM vs p80uM) (Figure 6a-c). Among the sites used for DMS
analysis, there are many more 5-mrC sites in polysome mRNAs (Figure 6d-f). Fisher’s exact test
is performed to identify differential methylated sites between total mRNAs and polysome mRNAs.
We identify 3,238 DMS within 192 mRNAs between 1.5uM and p1.5uM groups, 2,173 DMS
within 154 mRNAs between 10uM and p10uM groups, 2,304 DMS within 197 mRNAs between
80uM and p80uM groups. To our surprise, further GO annotation shows almost no enrichment,
except for response to starvation in mRNAs harboring DMS sites identified between 10uM and
p10uM groups. It suggests that hypermethylation in polysome-associated mRNAs could be a
general status in NSCs.
63
Figure 3-6 Distinct methylation profiles of 5-mrC modification in total and polysome
mRNAs in NSCs
(a, b, c) Boxplot showing the methylation level between total mRNAs and polysome mRNAs
(1.5µM vs p1.5µM, 10µM vs p10µM and 80µM vs p80µM). (d, e, f) Venn diagram showing the
overlap of 5-mrC sites between total mRNAs and polysome mRNAs (1.5µM vs p1.5µM, 10µM vs
p10µM and 80µM vs p80µM). (g, h, i) Heatmap showing the methylation profile of differentially
methylated 5-mrC sites between total mRNAs and polysome mRNAs (1.5µM vs p1.5µM, 10µM
vs p10µM and 80µM vs p80µM).
g h i1.5μM p1.5μM 10μM p10μM 80μM p80μM
1.5μM p1.5μM
0.8
0.6
0.4
0.2
0.0
Methylatio
nlevel
10μM p10μM
0.8
0.6
0.4
0.2
0.0
Methylatio
nlevel
80μM p80μM
0.8
0.6
0.4
0.2
0.0
Methylatio
nlevel
a b c
d f
364 517 1,4742,971 94221 7391.5μM
p1.5μM10μM
p10μM80μM
p80μM
1,966 250
e
64
3.4.6 Folate induces changes in mRNA translation in adult mouse neural stem cells
We further perform polysome profiling analysis to investigate the transcriptome-wide
influence of folate on mRNA abundance and translation. Differentially expression analysis shows
that no genes induce significant mRNA level changes under folic acid deficiency or
supplementation conditions. However, we identify 10 genes with translation efficiency going up
and 93 genes with translation efficiency going down in NSCs with folate deficiency (Figure 7a),
250 genes with translation efficiency going up and 143 genes with translation efficiency going
down in NSCs with folate supplementation (Figure 7b). We further conduct GO annotation to
determine the potential roles of these differentially translated genes. It shows the differentially
translated genes between LF and MF are enriched in cytoplasmic translation, cellular response to
zinc ion, and protein localization to mitochondrion. And the differentially translated genes between
HF and MF are enriched in the regulation of cell substrate adhension, extracellular structure
organization, glial and neuronal differentiation. The difference in the functional enrichment
suggests the distinct influences between folate deficiency and supplementation on neural cell
metabolism.
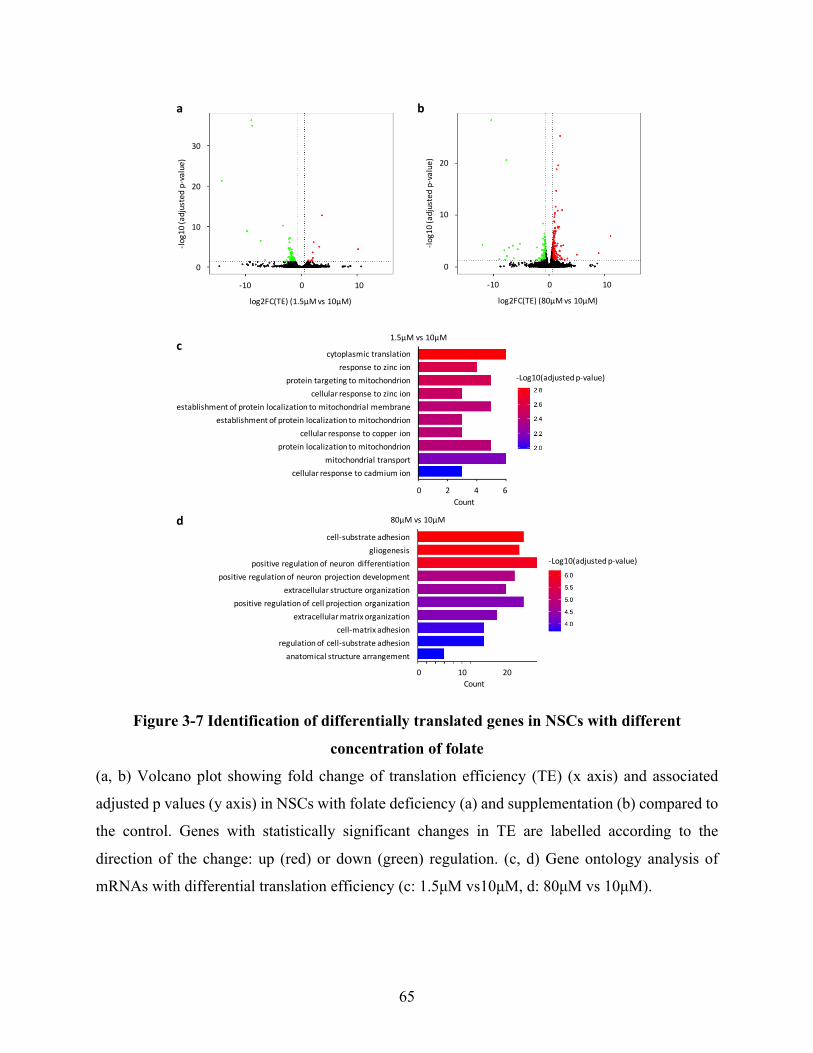
65
Figure 3-7 Identification of differentially translated genes in NSCs with different
concentration of folate
(a, b) Volcano plot showing fold change of translation efficiency (TE) (x axis) and associated
adjusted p values (y axis) in NSCs with folate deficiency (a) and supplementation (b) compared to
the control. Genes with statistically significant changes in TE are labelled according to the
direction of the change: up (red) or down (green) regulation. (c, d) Gene ontology analysis of
mRNAs with differential translation efficiency (c: 1.5µM vs10µM, d: 80µM vs 10µM).
-100 10
log2FC(TE)(1.5μMvs10μM)
30
20
10
0
-log10(adjustedp-value)
-100 10
log2FC(TE)(80μMvs10μM)
20
10
0
-log10(adjustedp-value)
cytoplasmictranslationresponsetozincion
proteintargetingtomitochondrioncellularresponsetozincion
establishmentofproteinlocalizationtomitochondrialmembraneestablishmentofproteinlocalizationtomitochondrion
cellularresponsetocopper ionproteinlocalizationtomitochondrion
mitochondrialtransportcellularresponsetocadmiumion
1.5μM vs10μM
-Log10(adjustedp-value)
0246Count
cell-substrateadhesiongliogenesis
positiveregulationofneurondifferentiationpositiveregulationofneuronprojectiondevelopment
extracellularstructureorganizationpositiveregulationofcellprojectionorganization
extracellularmatrixorganizationcell-matrixadhesion
regulationofcell-substrateadhesionanatomicalstructurearrangement
80μM vs10μM
-Log10(adjustedp-value)
0 1020Count
a b
c
d
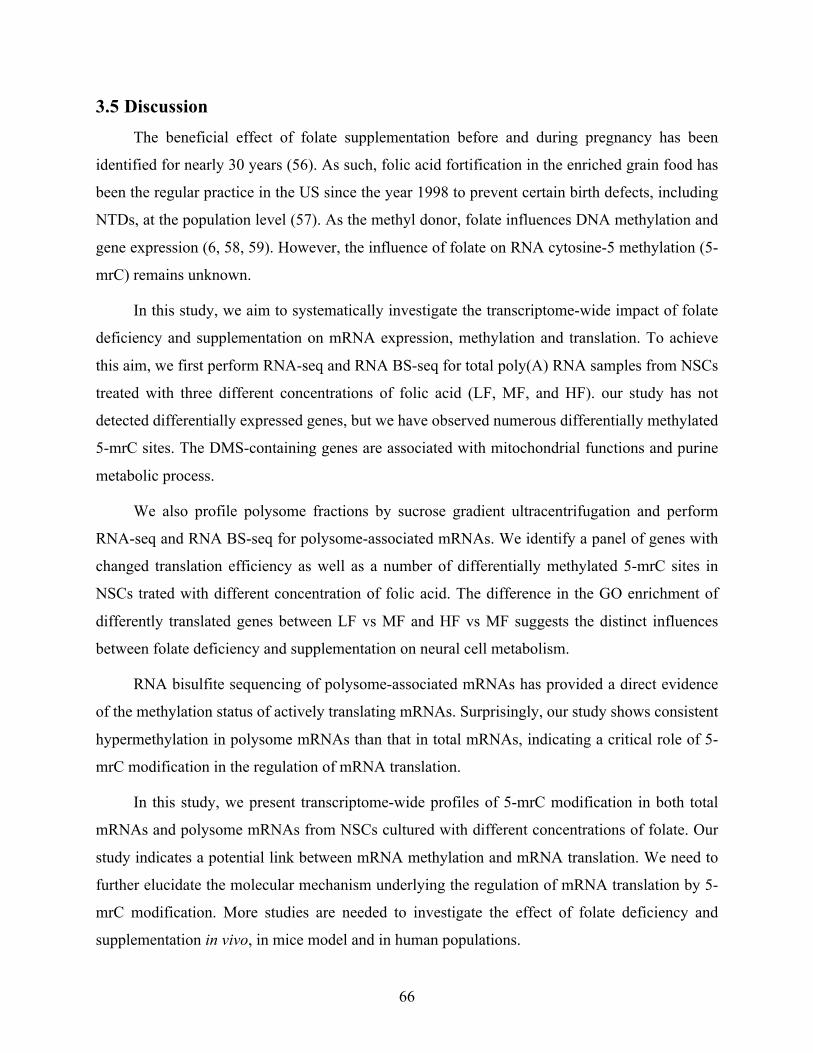
66
3.5 Discussion The beneficial effect of folate supplementation before and during pregnancy has been
identified for nearly 30 years (56). As such, folic acid fortification in the enriched grain food has
been the regular practice in the US since the year 1998 to prevent certain birth defects, including
NTDs, at the population level (57). As the methyl donor, folate influences DNA methylation and
gene expression (6, 58, 59). However, the influence of folate on RNA cytosine-5 methylation (5-
mrC) remains unknown.
In this study, we aim to systematically investigate the transcriptome-wide impact of folate
deficiency and supplementation on mRNA expression, methylation and translation. To achieve
this aim, we first perform RNA-seq and RNA BS-seq for total poly(A) RNA samples from NSCs
treated with three different concentrations of folic acid (LF, MF, and HF). our study has not
detected differentially expressed genes, but we have observed numerous differentially methylated
5-mrC sites. The DMS-containing genes are associated with mitochondrial functions and purine
metabolic process.
We also profile polysome fractions by sucrose gradient ultracentrifugation and perform
RNA-seq and RNA BS-seq for polysome-associated mRNAs. We identify a panel of genes with
changed translation efficiency as well as a number of differentially methylated 5-mrC sites in
NSCs trated with different concentration of folic acid. The difference in the GO enrichment of
differently translated genes between LF vs MF and HF vs MF suggests the distinct influences
between folate deficiency and supplementation on neural cell metabolism.
RNA bisulfite sequencing of polysome-associated mRNAs has provided a direct evidence
of the methylation status of actively translating mRNAs. Surprisingly, our study shows consistent
hypermethylation in polysome mRNAs than that in total mRNAs, indicating a critical role of 5-
mrC modification in the regulation of mRNA translation.
In this study, we present transcriptome-wide profiles of 5-mrC modification in both total
mRNAs and polysome mRNAs from NSCs cultured with different concentrations of folate. Our
study indicates a potential link between mRNA methylation and mRNA translation. We need to
further elucidate the molecular mechanism underlying the regulation of mRNA translation by 5-
mrC modification. More studies are needed to investigate the effect of folate deficiency and
supplementation in vivo, in mice model and in human populations.
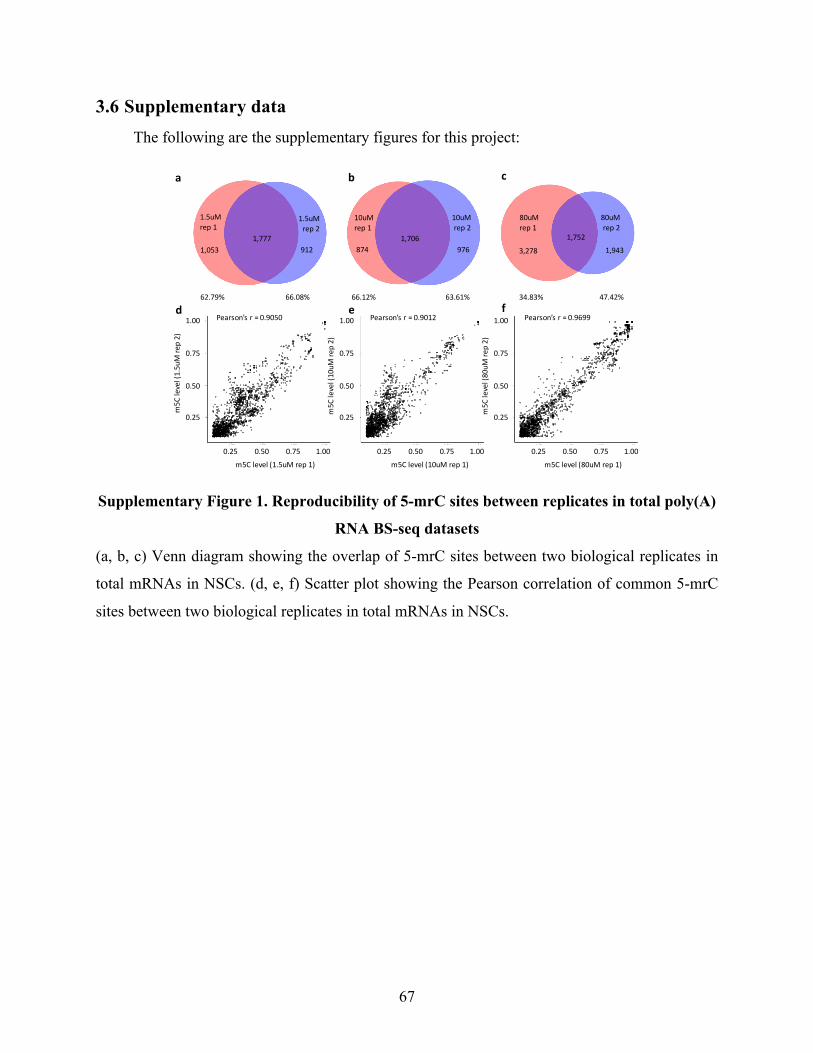
67
3.6 Supplementary data The following are the supplementary figures for this project:
Supplementary Figure 1. Reproducibility of 5-mrC sites between replicates in total poly(A)
RNA BS-seq datasets
(a, b, c) Venn diagram showing the overlap of 5-mrC sites between two biological replicates in
total mRNAs in NSCs. (d, e, f) Scatter plot showing the Pearson correlation of common 5-mrC
sites between two biological replicates in total mRNAs in NSCs.
1.00
0.75
0.50
0.25
m5Clevel(1.5uMre
p2)
0.250.500.751.00m5Clevel(1.5uMrep1)
Pearson’sr=0.9050 1.00
0.75
0.50
0.25m5Clevel(10uM
rep2)
0.250.500.751.00m5Clevel(10uMrep1)
Pearson’sr=0.9012 1.00
0.75
0.50
0.25m5Clevel(80uM
rep2)
0.250.500.751.00m5Clevel(80uMrep1)
Pearson’sr=0.9699d e f
9121,777
1,0531,706 1,752
3,278 1,943976874
62.79% 66.08% 66.12% 63.61% 34.83% 47.42%
1.5uMrep2
1.5uMrep1
10uMrep2
10uMrep1
80uMrep2
80uMrep1
a b c
68
Supplementary Figure 2. GO annotation of 5-mrC containing mRNAs in NSCs
(a, b, c) Gene ontology analysis of mRNAs with 5-mrC sites (1.5µM, 10µM, and 80µM).
a
b
c 80μM
negativeregulationofproteincatabolicprocessregulationofproteincatabolicprocess
negativeregulationofcellularproteincatabolicprocesscellularresponsetopeptide
signaltransductioninresponsetoDNAdamageresponsetoangiotensin
positiveregulationofcatabolicprocessnegativeregulationofcatabolicprocess
negativeregulationofproteasomal proteincatabolicprocesscellularresponsetoangiotensin
-Log10(adjustedp-value)
0 48Count
10μM
responsetotransforminggrowthfactorbetaregulationofcellgrowth
positiveregulationofneuronprojectiondevelopmentnegativeregulationofproteincatabolicprocess
cellularresponsetotransforminggrowthfactorbetastimulusregulationofproteincatabolicprocess
transforminggrowthfactorbetareceptorsignalingpathwaypositiveregulationofcatabolicprocess
neuronprojectionextensiondevelopmentalgrowthinvolved inmorphogenesis
-Log10(adjustedp-value)
0 48Count
1.5μM
positiveregulationofneuronprojectiondevelopmentpositiveregulationofneurondifferentiation
positiveregulationofcatabolicprocessnegativeregulationofproteincatabolicprocess
semaphorin-plexin signalingpathwaypositiveregulationofcellprojectionorganization
regulationofproteincatabolicprocessdendritedevelopment
axonogenesisresponsetostarvation
-Log10(adjustedp-value)
0 48Count
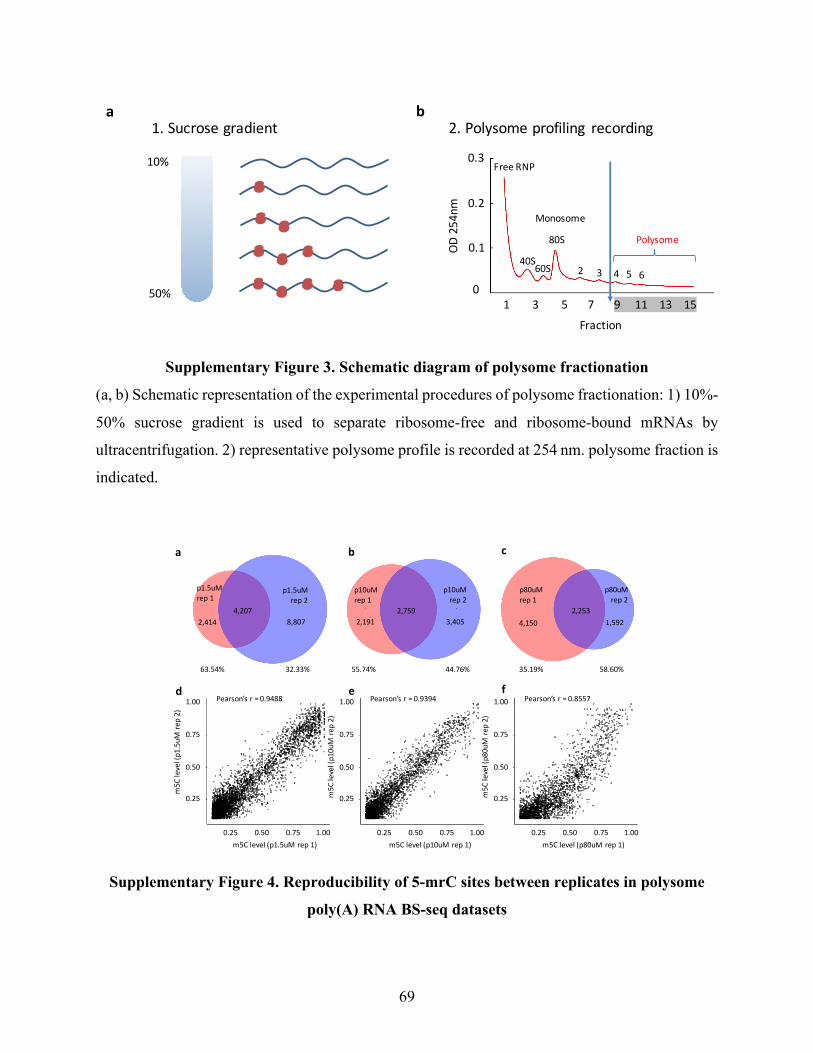
69
Supplementary Figure 3. Schematic diagram of polysome fractionation
(a, b) Schematic representation of the experimental procedures of polysome fractionation: 1) 10%-
50% sucrose gradient is used to separate ribosome-free and ribosome-bound mRNAs by
ultracentrifugation. 2) representative polysome profile is recorded at 254 nm. polysome fraction is
indicated.
Supplementary Figure 4. Reproducibility of 5-mrC sites between replicates in polysome
poly(A) RNA BS-seq datasets
1.Sucrosegradient
10%
50%
80S
40S60S 2 3 4 5 6
Polysome
FreeRNP
Monosome
13579111315Fraction
0
0.1
0.2
0.3
OD254nm
2.Polysomeprofiling recordinga b
1.00
0.75
0.50
0.25
m5Clevel(p1.5uM
rep2)
0.250.500.751.00m5Clevel(p1.5uMrep1)
Pearson’sr=0.9488 1.00
0.75
0.50
0.25m5Clevel(p10uMrep2)
0.250.500.751.00m5Clevel(p10uMrep1)
Pearson’sr=0.9394 1.00
0.75
0.50
0.25m5Clevel(p80uMrep2)
0.250.500.751.00m5Clevel(p80uMrep1)
Pearson’sr=0.8557
p1.5uMrep2
p1.5uMrep1
p10uMrep2
p10uMrep1
p80uMrep2
p80uMrep1
8,8074,207
2,4142,759 2,253
4,150 1,5923,4052,191
63.54% 32.33% 55.74% 44.76% 35.19% 58.60%
a b c
d e f
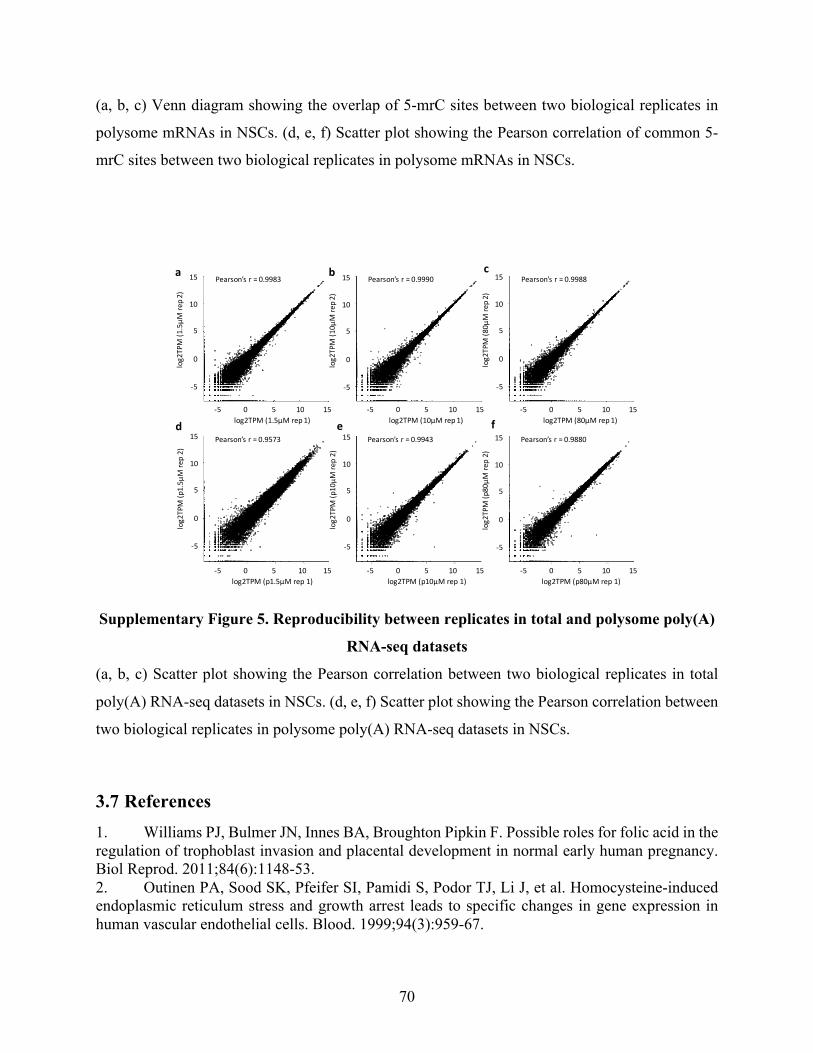
70
(a, b, c) Venn diagram showing the overlap of 5-mrC sites between two biological replicates in
polysome mRNAs in NSCs. (d, e, f) Scatter plot showing the Pearson correlation of common 5-
mrC sites between two biological replicates in polysome mRNAs in NSCs.
Supplementary Figure 5. Reproducibility between replicates in total and polysome poly(A)
RNA-seq datasets
(a, b, c) Scatter plot showing the Pearson correlation between two biological replicates in total
poly(A) RNA-seq datasets in NSCs. (d, e, f) Scatter plot showing the Pearson correlation between
two biological replicates in polysome poly(A) RNA-seq datasets in NSCs.
3.7 References 1. Williams PJ, Bulmer JN, Innes BA, Broughton Pipkin F. Possible roles for folic acid in the regulation of trophoblast invasion and placental development in normal early human pregnancy. Biol Reprod. 2011;84(6):1148-53. 2. Outinen PA, Sood SK, Pfeifer SI, Pamidi S, Podor TJ, Li J, et al. Homocysteine-induced endoplasmic reticulum stress and growth arrest leads to specific changes in gene expression in human vascular endothelial cells. Blood. 1999;94(3):959-67.
-50510 15log2TPM(p1.5μM rep1)
Pearson’sr=0.9573
-50510 15log2TPM(p10μM rep1)
Pearson’sr= 0.9943
-50510 15log2TPM(p80μM rep1)
Pearson’sr=0.988015
10
5
0
-5
log2TPM(p
1.5μ
Mrep2)
15
10
5
0
-5
log2TPM(p
10μM
rep2)
15
10
5
0
-5
log2TPM(p
80μM
rep2)
-50510 15log2TPM(1.5μM rep1)
Pearson’sr=0.9983
-50510 15log2TPM(10μM rep1)
Pearson’sr= 0.9990 15
10
5
0
-5
log2TPM(8
0μM
rep2)
-50510 15log2TPM(80μM rep1)
Pearson’sr=0.998815
10
5
0
-5
log2TPM(1
0μM
rep2)
15
10
5
0
-5
log2TPM(1
.5μM
rep2)
a b c
d e f
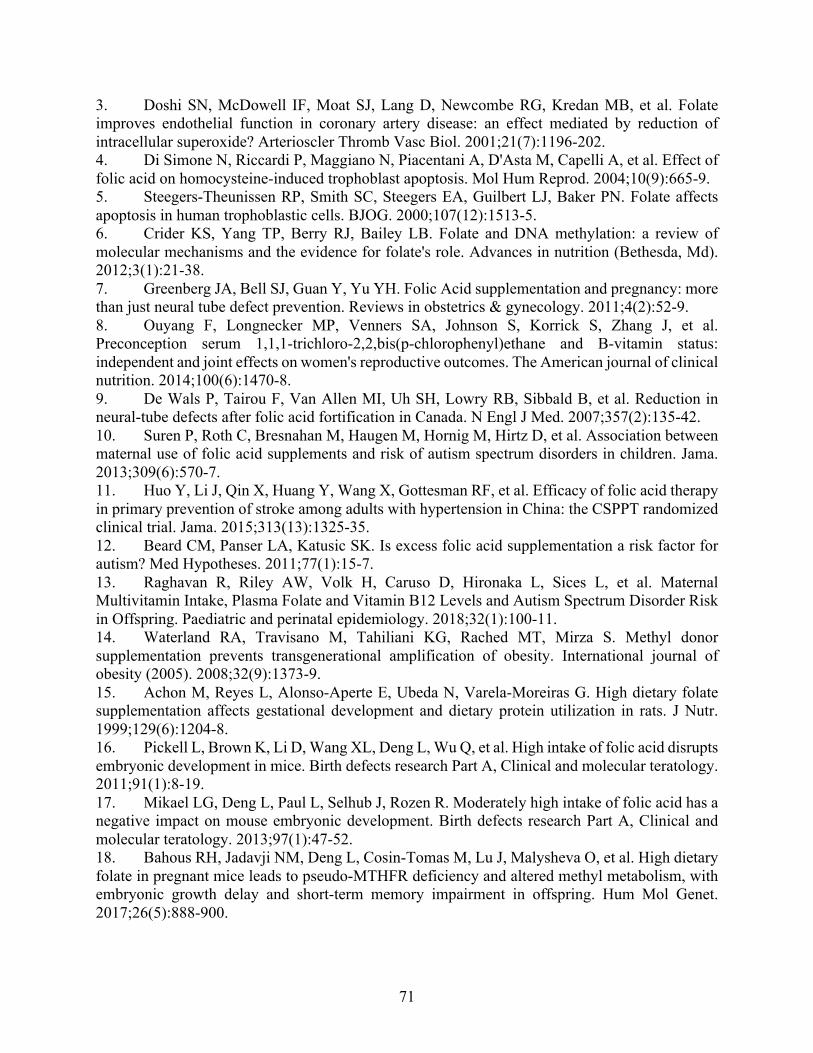
71
3. Doshi SN, McDowell IF, Moat SJ, Lang D, Newcombe RG, Kredan MB, et al. Folate improves endothelial function in coronary artery disease: an effect mediated by reduction of intracellular superoxide? Arterioscler Thromb Vasc Biol. 2001;21(7):1196-202. 4. Di Simone N, Riccardi P, Maggiano N, Piacentani A, D'Asta M, Capelli A, et al. Effect of folic acid on homocysteine-induced trophoblast apoptosis. Mol Hum Reprod. 2004;10(9):665-9. 5. Steegers-Theunissen RP, Smith SC, Steegers EA, Guilbert LJ, Baker PN. Folate affects apoptosis in human trophoblastic cells. BJOG. 2000;107(12):1513-5. 6. Crider KS, Yang TP, Berry RJ, Bailey LB. Folate and DNA methylation: a review of molecular mechanisms and the evidence for folate's role. Advances in nutrition (Bethesda, Md). 2012;3(1):21-38. 7. Greenberg JA, Bell SJ, Guan Y, Yu YH. Folic Acid supplementation and pregnancy: more than just neural tube defect prevention. Reviews in obstetrics & gynecology. 2011;4(2):52-9. 8. Ouyang F, Longnecker MP, Venners SA, Johnson S, Korrick S, Zhang J, et al. Preconception serum 1,1,1-trichloro-2,2,bis(p-chlorophenyl)ethane and B-vitamin status: independent and joint effects on women's reproductive outcomes. The American journal of clinical nutrition. 2014;100(6):1470-8. 9. De Wals P, Tairou F, Van Allen MI, Uh SH, Lowry RB, Sibbald B, et al. Reduction in neural-tube defects after folic acid fortification in Canada. N Engl J Med. 2007;357(2):135-42. 10. Suren P, Roth C, Bresnahan M, Haugen M, Hornig M, Hirtz D, et al. Association between maternal use of folic acid supplements and risk of autism spectrum disorders in children. Jama. 2013;309(6):570-7. 11. Huo Y, Li J, Qin X, Huang Y, Wang X, Gottesman RF, et al. Efficacy of folic acid therapy in primary prevention of stroke among adults with hypertension in China: the CSPPT randomized clinical trial. Jama. 2015;313(13):1325-35. 12. Beard CM, Panser LA, Katusic SK. Is excess folic acid supplementation a risk factor for autism? Med Hypotheses. 2011;77(1):15-7. 13. Raghavan R, Riley AW, Volk H, Caruso D, Hironaka L, Sices L, et al. Maternal Multivitamin Intake, Plasma Folate and Vitamin B12 Levels and Autism Spectrum Disorder Risk in Offspring. Paediatric and perinatal epidemiology. 2018;32(1):100-11. 14. Waterland RA, Travisano M, Tahiliani KG, Rached MT, Mirza S. Methyl donor supplementation prevents transgenerational amplification of obesity. International journal of obesity (2005). 2008;32(9):1373-9. 15. Achon M, Reyes L, Alonso-Aperte E, Ubeda N, Varela-Moreiras G. High dietary folate supplementation affects gestational development and dietary protein utilization in rats. J Nutr. 1999;129(6):1204-8. 16. Pickell L, Brown K, Li D, Wang XL, Deng L, Wu Q, et al. High intake of folic acid disrupts embryonic development in mice. Birth defects research Part A, Clinical and molecular teratology. 2011;91(1):8-19. 17. Mikael LG, Deng L, Paul L, Selhub J, Rozen R. Moderately high intake of folic acid has a negative impact on mouse embryonic development. Birth defects research Part A, Clinical and molecular teratology. 2013;97(1):47-52. 18. Bahous RH, Jadavji NM, Deng L, Cosin-Tomas M, Lu J, Malysheva O, et al. High dietary folate in pregnant mice leads to pseudo-MTHFR deficiency and altered methyl metabolism, with embryonic growth delay and short-term memory impairment in offspring. Hum Mol Genet. 2017;26(5):888-900.
72
19. Barua S, Kuizon S, Brown WT, Junaid MA. High Gestational Folic Acid Supplementation Alters Expression of Imprinted and Candidate Autism Susceptibility Genes in a sex-Specific Manner in Mouse Offspring. J Mol Neurosci. 2016;58(2):277-86. 20. Ichi S, Costa FF, Bischof JM, Nakazaki H, Shen YW, Boshnjaku V, et al. Folic acid remodels chromatin on Hes1 and Neurog2 promoters during caudal neural tube development. The Journal of biological chemistry. 2010;285(47):36922-32. 21. Fleming A, Copp AJ. Embryonic folate metabolism and mouse neural tube defects. Science (New York, NY). 1998;280(5372):2107-9. 22. Wlodarczyk BJ, Tang LS, Triplett A, Aleman F, Finnell RH. Spontaneous neural tube defects in splotch mice supplemented with selected micronutrients. Toxicology and applied pharmacology. 2006;213(1):55-63. 23. Liu H, Huang GW, Zhang XM, Ren DL, J XW. Folic Acid supplementation stimulates notch signaling and cell proliferation in embryonic neural stem cells. Journal of clinical biochemistry and nutrition. 2010;47(2):174-80. 24. Li W, Yu M, Luo S, Liu H, Gao Y, Wilson JX, et al. DNA methyltransferase mediates dose-dependent stimulation of neural stem cell proliferation by folate. The Journal of nutritional biochemistry. 2013;24(7):1295-301. 25. Yu M, Li W, Luo S, Zhang Y, Liu H, Gao Y, et al. Folic acid stimulation of neural stem cell proliferation is associated with altered methylation profile of PI3K/Akt/CREB. The Journal of nutritional biochemistry. 2014;25(4):496-502. 26. Zhang XM, Huang GW, Tian ZH, Ren DL, Wilson JX. Folate stimulates ERK1/2 phosphorylation and cell proliferation in fetal neural stem cells. Nutritional neuroscience. 2009;12(5):226-32. 27. Junttila MR, Li SP, Westermarck J. Phosphatase-mediated crosstalk between MAPK signaling pathways in the regulation of cell survival. FASEB journal : official publication of the Federation of American Societies for Experimental Biology. 2008;22(4):954-65. 28. Wang D, Chen YM, Ruan MH, Zhou AH, Qian Y, Chen C. Homocysteine inhibits neural stem cells survival by inducing DNA interstrand cross-links via oxidative stress. Neuroscience letters. 2016;635:24-32. 29. Yan H, Zhang X, Luo S, Liu H, Wang X, Gao Y, et al. Effects of homocysteine on ERK signaling and cell proliferation in fetal neural stem cells in vitro. Cell biochemistry and biophysics. 2013;66(1):131-7. 30. Cui X, Liang Z, Shen L, Zhang Q, Bao S, Geng Y, et al. 5-Methylcytosine RNA Methylation in Arabidopsis Thaliana. Molecular plant. 2017;10(11):1387-99. 31. Lin N, Qin S, Luo S, Cui S, Huang G, Zhang X. Homocysteine induces cytotoxicity and proliferation inhibition in neural stem cells via DNA methylation in vitro. The FEBS journal. 2014;281(8):2088-96. 32. Song J, Yi C. Chemical Modifications to RNA: A New Layer of Gene Expression Regulation. ACS chemical biology. 2017;12(2):316-25. 33. Schaefer M, Pollex T, Hanna K, Lyko F. RNA cytosine methylation analysis by bisulfite sequencing. Nucleic acids research. 2009;37(2):e12. 34. Squires JE, Patel HR, Nousch M, Sibbritt T, Humphreys DT, Parker BJ, et al. Widespread occurrence of 5-methylcytosine in human coding and non-coding RNA. Nucleic acids research. 2012;40(11):5023-33.
73
35. Tuorto F, Liebers R, Musch T, Schaefer M, Hofmann S, Kellner S, et al. RNA cytosine methylation by Dnmt2 and NSun2 promotes tRNA stability and protein synthesis. Nature structural & molecular biology. 2012;19(9):900-5. 36. Schosserer M, Minois N, Angerer TB, Amring M, Dellago H, Harreither E, et al. Methylation of ribosomal RNA by NSUN5 is a conserved mechanism modulating organismal lifespan. Nature communications. 2015;6:6158. 37. Metodiev MD, Spahr H, Loguercio Polosa P, Meharg C, Becker C, Altmueller J, et al. NSUN4 is a dual function mitochondrial protein required for both methylation of 12S rRNA and coordination of mitoribosomal assembly. PLoS genetics. 2014;10(2):e1004110. 38. Yang X, Yang Y, Sun BF, Chen YS, Xu JW, Lai WY, et al. 5-methylcytosine promotes mRNA export - NSUN2 as the methyltransferase and ALYREF as an m(5)C reader. Cell research. 2017;27(5):606-25. 39. Shen Q, Zhang Q, Shi Y, Shi Q, Jiang Y, Gu Y, et al. Tet2 promotes pathogen infection-induced myelopoiesis through mRNA oxidation. Nature. 2018;554(7690):123-7. 40. Morscher RJ, Ducker GS, Li SH, Mayer JA, Gitai Z, Sperl W, et al. Mitochondrial translation requires folate-dependent tRNA methylation. Nature. 2018;554(7690):128-32. 41. Theus MH, Ricard J, Liebl DJ. Reproducible expansion and characterization of mouse neural stem/progenitor cells in adherent cultures derived from the adult subventricular zone. Current protocols in stem cell biology. 2012;Chapter 2:Unit 2D.8. 42. Morita M, Alain T, Topisirovic I, Sonenberg N. Polysome Profiling Analysis. Bio-protocol. 2013;3(14):e833. 43. Amort T, Rieder D, Wille A, Khokhlova-Cubberley D, Riml C, Trixl L, et al. Distinct 5-methylcytosine profiles in poly(A) RNA from mouse embryonic stem cells and brain. Genome biology. 2017;18(1):1. 44. Li B, Dewey CN. RSEM: accurate transcript quantification from RNA-Seq data with or without a reference genome. BMC bioinformatics. 2011;12:323. 45. Robinson MD, McCarthy DJ, Smyth GK. edgeR: a Bioconductor package for differential expression analysis of digital gene expression data. Bioinformatics. 2010;26(1):139-40. 46. McCarthy DJ, Chen Y, Smyth GK. Differential expression analysis of multifactor RNA-Seq experiments with respect to biological variation. Nucleic Acids Res. 2012;40(10):4288-97. 47. Love MI, Huber W, Anders S. Moderated estimation of fold change and dispersion for RNA-seq data with DESeq2. Genome Biol. 2014;15(12):550. 48. Xiao Z, Zou Q, Liu Y, Yang X. Genome-wide assessment of differential translations with ribosome profiling data. Nature communications. 2016;7:11194. 49. Rieder D, Amort T, Kugler E, Lusser A, Trajanoski Z. meRanTK: methylated RNA analysis ToolKit. Bioinformatics (Oxford, England). 2016;32(5):782-5. 50. Khoddami V, Yerra A, Cairns BR. Experimental Approaches for Target Profiling of RNA Cytosine Methyltransferases. Methods in enzymology. 2015;560:273-96. 51. Rainer J, Gatto L, Weichenberger CX. ensembldb: an R package to create and use Ensembl-based annotation resources. Bioinformatics. 2019;35(17):3151-3. 52. Yu G, Wang LG, Han Y, He QY. clusterProfiler: an R package for comparing biological themes among gene clusters. OMICS. 2012;16(5):284-7. 53. Sun Z, Xu X, He J, Murray A, Sun MA, Wei X, et al. EGR1 recruits TET1 to shape the brain methylome during development and upon neuronal activity. Nature communications. 2019;10(1):3892.
74
54. Huang T, Chen W, Liu J, Gu N, Zhang R. Genome-wide identification of mRNA 5-methylcytosine in mammals. Nature structural & molecular biology. 2019:1 %@ 1545-9985. 55. Yang Y, Wang L, Han X, Yang WL, Zhang M, Ma HL, et al. RNA 5-Methylcytosine Facilitates the Maternal-to-Zygotic Transition by Preventing Maternal mRNA Decay. Molecular cell. 2019. 56. Prevention of neural tube defects: results of the Medical Research Council Vitamin Study. MRC Vitamin Study Research Group. Lancet (London, England). 1991;338(8760):131-7. 57. Food, Drug A. Food standards: Amendment of standards of identity for enriched grain products to require addition of folic acid; final rule (21 CFR Parts 136, 137, and 139). Federal Register. 1996;61:8781-97. 58. Barua S, Kuizon S, Chadman KK, Flory MJ, Brown WT, Junaid MA. Single-base resolution of mouse offspring brain methylome reveals epigenome modifications caused by gestational folic acid. Epigenetics & chromatin. 2014;7(1):3. 59. Barua S, Kuizon S, Brown WT, Junaid MA. DNA Methylation Profiling at Single-Base Resolution Reveals Gestational Folic Acid Supplementation Influences the Epigenome of Mouse Offspring Cerebellum. Frontiers in neuroscience. 2016;10:168.
75
Chapter 4 – Conclusions and Future Directions
4.1 Conclusions Post-transcriptional modification to RNA molecules, now termed “RNA epigenetics” or
“epitranscriptomics”, is a rapidly emerging field studying the regulation of gene expression at post-
transcriptional level (1, 2). As one of the most well-known RNA modifications, RNA cytosine-5
methylation (5-mrC) is formed by adding a methyl (-CH3) group to the fifth position of cytosine.
Previous research has shown that 5-mrC modification is involved in diverse aspects of RNA
metabolism. In particular, it facilitates the export of mRNAs from nucleus to cytoplasm with the
help of the 5-mrC reader protein ALY/REF export factor (ALYREF) (3), maintains RNA stability
by binding with the 5-mrC reader protein YBX1 through its cold-shock domain (4-6). Because of
the low abundance of 5-mrC in mRNAs, our understanding of 5-mrC modification is still very
limited in regard of its distribution, dynamic regulation and biological functions in different
physiological and pathological processes.
In this dissertation, we aim to investigate the dynamic regulation of RNA cytosine-5
methylation (5-mrC) in response to environmental cues and to explore the potential links between
5-mrC modification and mRNA abundance or mRNA translation. Thereafter, we adopt two in vitro
cell models combined with state-of-art high-throughput sequencing techniques.
In chapter 1, we summarize the currently available approaches to measure 5-mrC
modification at global level, transcriptome-wide level and locus-specific level. We specially
highlight the bioinformatics data analysis for RNA bisulfite sequencing datasets, which is able to
provide transcriptoeme-wide profile of 5-mrC modification at single nucleotide resolution. The
RNA bisulfite sequencing technique serves as a powerful tool in the study of 5-mrC modification.
In chapter 2, we adopt a widely used neuronal activity model to study the dynamic regulation
of 5-mrC modification in neurons in response to environmental stimuli. The in vitro cultured
mouse cortical neurons are depolarized with KCl for 0h, 2h, and 6h. RNA sequencing (RNA-seq)
and RNA bisulfite sequencing (RNA BS-seq) are performed simultaneously to profile gene
expression as well as 5-mrC modification at transcriptome-wide level. We have identified distinct
gene expression profiles with one group of early response genes for the early stage and another
76
group of late response genes for the late stage in neurons upon activation. It reveals a dynamic 5-
mrC modification landscape in activated neurons. We have also found two sets of differentially
methylated 5-mrC sites (DMS) for the early and late stages of neuronal activity, and the mRNAs
with DMS sites are associated with mitochondrial and synaptic functions. Furthermore, we have
determined a negative correlation between RNA methylation and mRNA expression in mouse
cortical neurons during neuronal activity. Thus, these findings have shown the dynamic regulation
of 5-mrC modification during neuronal activity and revealed a potential link between RNA
methylation and mRNA expression.
In chapter 3, we investigate the influence of a common nutrient supplement, folate, which
serves as the methyl donor in the methylation events of cellular metabolism, on RNA cytosine-5
methylation (5-mrC) in adult mouse neural stem cells (NSCs). Compared to the control (medium
level of folate, MF), NSCs cultured in folate deficiency (low level of folate, LF) or
supplementation (high level of folate, HF) condition have shown no changes in mRNA abundance,
but changes in mRNA translation efficiency. RNA bisulfite sequencing of both total poly(A) RNA
samples and polysome poly(A) RNA samples has revealed distinct 5-mrC profiles in NSCs treated
with different concentrations of folic acid. Intriguingly, it shows consistent hypermethylation in
polysome mRNAs than that in total mRNAs, indicating a critical role of 5-mrC modification in
the regulation of mRNA translation.
In summary, we have identified the transcriptome-wide distribution of 5-mrC modification
within mRNAs in mouse cortical neurons and adult mouse neural stem cells (NSCs), as well as
the dynamic regulation of 5-mrC modification in response to environmental factors such as
neuronal activity and the methyl donor folate deficiency and supplementation. Furthermore, we
have shown a potential link between mRNA methylation and mRNA expression or mRNA
translation, highlighting the critical role of 5-mrC modification in the post-transcriptional
regulation of RNA metabolism.
4.2 Future directions In this dissertation, we have identified transcriptome-wide profiles of 5-mrC modification in
different biological settings by using high-throughput sequencing techniques. Meanwhile, we need
more functional studies narrowing down to specific mRNAs and specific 5-mrC loci that are linked
77
to important cellular functions in order to further elucidate the critical function of 5-mrC
modification in physiological and pathological conditions.
Recently studies show TET family enzymes are involved in the sequential oxidation of RNA
cytosine-5 methylation (5-mrC) to form 5-hmrC, 5-fC and 5-CaC (7-9). However, underlying
molecular mechanism that mediate the conversion from 5-CaC to unmethylated cytosine is still
elusive. Moreover, Tet1/Tet2/Tet3 triple knockout mouse embryonic stem cells (ESCs) still show
detectable 5-hmrC level (7). More studies are needed to elucidate the comprehensive RNA
demethylation pathway.
RNA cytosine-5 methylation has been shown to influence the binding affinity of specific
RNA binding proteins, such as ALYREF and YBX1 (3-5). These proteins show preferential
binding to methylated mRNAs and thus are termed 5-mrC reader protein. More efforts are needed
to identify novel 5-mrC reader proteins and their involvement in the facilitation of specific RNA
metabolisms, such as mRNA export from nucleus to cytoplasm, mRNA transport to specific
cellular organelles, the regulation of mRNA stabilization or degradation, the regulation of mRNA
translation on polyribosome complex. Identification of novel 5-mrC binding proteins and
functional characterization of these 5-mrC binding proteins in diverse biological settings are
essential to further our understanding the biology of RNA cytosine-5 methylation.
4.3 References 1. He C. Grand challenge commentary: RNA epigenetics? Nature chemical biology. 2010;6(12):863-5. 2. Saletore Y, Meyer K, Korlach J, Vilfan ID, Jaffrey S, Mason CE. The birth of the Epitranscriptome: deciphering the function of RNA modifications. Genome biology. 2012;13(10):175. 3. Yang X, Yang Y, Sun BF, Chen YS, Xu JW, Lai WY, et al. 5-methylcytosine promotes mRNA export - NSUN2 as the methyltransferase and ALYREF as an m(5)C reader. Cell research. 2017;27(5):606-25. 4. Chen X, Li A, Sun BF, Yang Y, Han YN, Yuan X, et al. 5-methylcytosine promotes pathogenesis of bladder cancer through stabilizing mRNAs. Nature cell biology. 2019;21(8):978-90. 5. Yang Y, Wang L, Han X, Yang WL, Zhang M, Ma HL, et al. RNA 5-Methylcytosine Facilitates the Maternal-to-Zygotic Transition by Preventing Maternal mRNA Decay. Molecular cell. 2019. 6. Zou F, Tu R, Duan B, Yang Z, Ping Z, Song X, et al. Drosophila YBX1 homolog YPS promotes ovarian germ line stem cell development by preferentially recognizing 5-methylcytosine
78
RNAs. Proceedings of the National Academy of Sciences of the United States of America. 2020;117(7):3603-9. 7. Fu L, Guerrero CR, Zhong N, Amato NJ, Liu Y, Liu S, et al. Tet-mediated formation of 5-hydroxymethylcytosine in RNA. Journal of the American Chemical Society. 2014;136(33):11582-5. 8. Huber SM, van Delft P, Mendil L, Bachman M, Smollett K, Werner F, et al. Formation and abundance of 5-hydroxymethylcytosine in RNA. Chembiochem : a European journal of chemical biology. 2015;16(5):752-5. 9. Basanta-Sanchez M, Wang R, Liu Z, Ye X, Li M, Shi X, et al. TET1-Mediated Oxidation of 5-Formylcytosine (5fC) to 5-Carboxycytosine (5caC) in RNA. Chembiochem : a European journal of chemical biology. 2017;18(1):72-6.


![Cytosine methylation is a conserved epigenetic feature ...€¦ · and repetitive element silencing [6]. Metazoan DNA methyltransferases (DNMT1, DNMT2, DNMT3a/3b [7]) catalyse this](https://img.pdfslide.us/doc/110x75/5eab33730f2ba76ce938ef9e/cytosine-methylation-is-a-conserved-epigenetic-feature-and-repetitive-element.jpg)