Embed Size (px)
Citation preview

audemat WorldCast Systems Group
web: www.audemat.com - e-mail: [email protected]
MODULATION
ANALYZER Test and Measurement Equipment
USER MANUAL (Version 2.3.x)
Date: 2012/05/31 Ref: DOC00429
Audemat® is a registered trademark.

Modulation Analyzer 2.3.x User Manual – 05/2012
Page 2 Head Office : Parc d’activites Kennedy - 20, avenue Neil Armstrong – F-33700 Bordeaux-Merignac (France) Tel +33 (0)5 57 928 928 – Fax +33 (0)5 57 928 929 – contact@ worldcastsystems.com – www.audemat.com
DECLARATION OF CONFORMANCE Established following the Directives 99/5/EC and 2006/95/EC
We, hereby, certify that the AUDEMAT MODULATION ANALYZER complies with the dispositions of the European Community Directive for harmonized standards within the Member States related to radio equipment and telecommunications terminal equipment (Directive 99/5/EC) and low voltage (Directive 2006/95/EC).
This conformance statement results from respecting EMC and low impedance requirements and from an analysis carried out by AUDEMAT Quality Department, complying with European standards EN 50081-1, EN 50082-1 and EN 60215.
Laurence Gex Quality Manager
Modulation Analyzer 2.3.x User Manual – 05/2012
Page 3 Head Office : Parc d’activites Kennedy - 20, avenue Neil Armstrong – F-33700 Bordeaux-Merignac (France) Tel +33 (0)5 57 928 928 – Fax +33 (0)5 57 928 929 – contact@ worldcastsystems.com – www.audemat.com
TABLE OF CONTENTS
1. INTRODUCTION ....................................................................................................................................... 6 1.1. General information ......................................................................................................................... 6
1.1.1. About the Audemat Group .......................................................................................................... 6 1.1.2. About the Modulation Analyzer ................................................................................................... 7
1.2. Before beginning .............................................................................................................................. 7 1.3. Versions and options ....................................................................................................................... 8
1.3.1. Laboratory version ...................................................................................................................... 8 1.3.2. RF Generator option ................................................................................................................... 8
2. PRODUCT PRESENTATION ................................................................................................................... 9 2.1. List of included accessories ............................................................................................................. 9 2.2. Front panel ....................................................................................................................................... 9
2.2.1. General view ............................................................................................................................... 9 2.2.2. Connections .............................................................................................................................. 10 2.2.3. Screen ...................................................................................................................................... 11
3. TECHNICAL SPECIFICATIONS ............................................................................................................ 12 3.1. General specifications ................................................................................................................... 12 3.2. Measurement specifications on the RF input ................................................................................ 12
3.2.1. RF ............................................................................................................................................. 12 3.2.2. Demodulated signals ................................................................................................................ 12 3.2.3. Multiplex decoder / AF stereo signals specifications ................................................................ 13 3.2.4. L&R channel noise measurements........................................................................................... 13 3.2.5. De-emphasis filters ................................................................................................................... 13
3.3. Specifications on the MPX input .................................................................................................... 14 3.3.1. MPX .......................................................................................................................................... 14 3.3.2. Power measurement for the MPX channel ............................................................................... 14 3.3.3. Multiplex decoding / AF stereo signals specifications .............................................................. 14 3.3.4. L&R channel noise measurements........................................................................................... 14 3.3.5. De-emphasis filters ................................................................................................................... 15
3.4. Specifications for filters and measurements of non-audio sub-carriers ........................................ 15 3.5. Outputs .......................................................................................................................................... 16
3.5.1. Composite MPX /AUX output ................................................................................................... 16 3.5.2. AES output ................................................................................................................................ 17 3.5.3. L and R analog outputs ............................................................................................................ 18 3.5.4. Headphone outputs .................................................................................................................. 19
3.6. Distortion tool ................................................................................................................................. 19 3.7. Internal AF generator specifications .............................................................................................. 19 3.8. Internal composite MPX generator specifications ......................................................................... 20 3.9. Internal RF generator specifications .............................................................................................. 20 3.10. External 10 MHz ............................................................................................................................ 20
4. QUICK START ........................................................................................................................................ 21 4.1. PC System requirements ............................................................................................................... 21 4.2. Front panel configuration ............................................................................................................... 21 4.3. Connecting to the network to access the remote application ........................................................ 22 4.4. Installing the Modulation Analyzer application ............................................................................... 23
5. THE FRONT PANEL APPLICATION ..................................................................................................... 24 5.1. Overview ........................................................................................................................................ 24 5.2. Unit configuration ........................................................................................................................... 25

Modulation Analyzer 2.3.x User Manual – 05/2012
Page 4 Head Office : Parc d’activites Kennedy - 20, avenue Neil Armstrong – F-33700 Bordeaux-Merignac (France) Tel +33 (0)5 57 928 928 – Fax +33 (0)5 57 928 929 – contact@ worldcastsystems.com – www.audemat.com
5.3. Measures ....................................................................................................................................... 27 5.3.1. Launching measures ................................................................................................................ 27 5.3.2. Configuring the FM modulator .................................................................................................. 29 5.3.3. Real time measurements .......................................................................................................... 30 5.3.4. Automatic measurements ......................................................................................................... 33 5.3.5. Capturing measurements ......................................................................................................... 35
6. THE EMBEDDED WEB SITE ................................................................................................................. 37 6.1. Product ID ...................................................................................................................................... 37 6.2. Network .......................................................................................................................................... 38 6.3. Unit ................................................................................................................................................. 39 6.4. Download ....................................................................................................................................... 40
7. THE REMOTE COMPUTER APPLICATION ......................................................................................... 41 7.1. Launching the Modulation Analyzer’s application .......................................................................... 41
7.1.1. Prerequisite ............................................................................................................................... 41 7.1.2. Connection to the unit ............................................................................................................... 42
7.2. System Configuration .................................................................................................................... 44 7.2.1. Product Identifiers ..................................................................................................................... 44 7.2.2. Date/Time ................................................................................................................................. 45 7.2.3. Status ........................................................................................................................................ 46 7.2.4. Users ........................................................................................................................................ 47 7.2.5. Network ..................................................................................................................................... 48 7.2.6. Support ..................................................................................................................................... 49 7.2.7. Preferences .............................................................................................................................. 50 7.2.8. Report ....................................................................................................................................... 51 7.2.9. Capture ..................................................................................................................................... 51
7.3. Measurement Configuration .......................................................................................................... 52 7.3.1. Configuration management ...................................................................................................... 52 7.3.2. Analyzer tab .............................................................................................................................. 53 7.3.3. Reference tab ........................................................................................................................... 55 7.3.4. Generator tab ............................................................................................................................ 58
7.4. Measurement Mode ....................................................................................................................... 59 7.4.1. Overview ................................................................................................................................... 59 7.4.2. Analysis tools ............................................................................................................................ 60 7.4.3. MPX tab .................................................................................................................................... 61 7.4.4. Audio tab ................................................................................................................................... 62 7.4.5. Sub-carrier tab .......................................................................................................................... 63 7.4.6. Modulation tab .......................................................................................................................... 64 7.4.7. Filters tab .................................................................................................................................. 65 7.4.8. Spectrum tab ............................................................................................................................ 66 7.4.9. Oscilloscope tab ....................................................................................................................... 67 7.4.10. Thd tab ...................................................................................................................................... 68 7.4.11. AM Noise tab ............................................................................................................................ 69 7.4.12. RDS tab .................................................................................................................................... 70 7.4.13. Automation tab .......................................................................................................................... 81 7.4.14. Summary tab ............................................................................................................................ 82
7.5. Creating Reports ............................................................................................................................ 83 7.6. Managing captures ........................................................................................................................ 85
7.6.1. Download one or more captures .............................................................................................. 85 7.6.2. Displaying a capture ................................................................................................................. 85
7.7. Laboratory version ......................................................................................................................... 86 7.7.1. Laboratory version features ...................................................................................................... 86 7.7.2. Upgrading ................................................................................................................................. 86

Modulation Analyzer 2.3.x User Manual – 05/2012
Page 5 Head Office : Parc d’activites Kennedy - 20, avenue Neil Armstrong – F-33700 Bordeaux-Merignac (France) Tel +33 (0)5 57 928 928 – Fax +33 (0)5 57 928 929 – contact@ worldcastsystems.com – www.audemat.com
8. AUTOMATION TOOLS .......................................................................................................................... 87 8.1. Connection ..................................................................................................................................... 87 8.2. Using the automation tools ............................................................................................................ 89 8.3. A final note ..................................................................................................................................... 90
APPENDIX A: AUTOMATION COMMAND LIST .................................................................................. 91 A.1. Global commands .......................................................................................................................... 91 A.2. Set RF frequency ........................................................................................................................... 91 A.3. Set .................................................................................................................................................. 91 A.4. Set Input/output matrix ................................................................................................................... 91 A.5. Set AF Generator ........................................................................................................................... 92 A.6. Reference levels ............................................................................................................................ 92 A.7. Set references deviation for each modulation standard ................................................................ 93 A.8. Get versions ................................................................................................................................... 93 A.9. Get Levels ...................................................................................................................................... 94 A.10. Set the RF generator (option) ........................................................................................................ 96
APPENDIX B: KEYBOARD SHORTCUTS ........................................................................................... 97
APPENDIX C: GLOSSARY ................................................................................................................... 98 C.1. RDS ............................................................................................................................................... 98 C.2. Detector filters ................................................................................................................................ 99
APPENDIX D: FOR FURTHER INFORMATION ................................................................................. 100

Modulation Analyzer 2.3.x User Manual – 05/2012
Page 6 Head Office : Parc d’activites Kennedy - 20, avenue Neil Armstrong – F-33700 Bordeaux-Merignac (France) Tel +33 (0)5 57 928 928 – Fax +33 (0)5 57 928 929 – contact@ worldcastsystems.com – www.audemat.com
1. INTRODUCTION
1.1. General information 1.1.1. About the Audemat Group
Audemat provides a suite of professional monitoring and measurement tools for Radio and TV broadcasters, telecommunication operators and regulation authorities worldwide.
The Audemat portfolio includes radio frequency (RF) and data monitoring equipment and mobile field strength meters for analog and digital radio and TV, digital test and measurement equipment, audio processors, world-class RDS encoders and an extensive range of facility remote control solutions.
To complement Audemat’s hardware product line, the company also offers an extensive range of professional software solutions for the management, configuration and monitoring of broadcast networks.
Founded in 1980, Audemat is part of the WorldCast Systems group of companies which combines the collective expertise & extensive product portfolio of several major broadcast brands to offer turnkey systems in all major analog and digital technologies. Other brands within the group include:
• APT Codecs who offer reliable and cost effective broadcast codec platforms delivering high quality content over IP, T1, E1, ISDN & Leased Lines.
• Ecreso who design a range of highly efficient transmitters for broadcast transmission technologies such as FM, DAB/ DAB+/ T-DMB. Both liquid- and air-cooled options are available.
As such, WorldCast Systems can offer complete broadcast solutions for the delivery, transmission and monitoring of broadcast content throughout the broadcast chain.
The group is founded on three core values:
1) Product innovation: Audemat places a key emphasis on Research & Development and its innovative approach has been repeatedly recognized by the industry. WorldCast Systems has won awards for innovation at consecutive NAB Shows for over 10 years.
2) Customer satisfaction: Audemat is dedicated to ensuring the best quality, value and service for its customers and has achieved IS0 9001 certification.
3) Sustainable Development: Audemat is committed to sustainable development and demonstrates this commitment in several ways: it has been ISO 14001 certified since 2007, adheres to the UN Global Compact project and all new products are developed in keeping with an eco-design philosophy and built within Audemat’s low energy consumption factory.
Audemat employs around 80 employees at headquarters in Bordeaux-Merignac, France. Audemat also has a subsidiary in Miami, USA that manages the North & South American markets as well as sales offices in the UK, India and China. An extensive network of international dealers and distributors means that the company is represented in over 45 countries throughout Europe, Middle East, Africa and Asia.
Modulation Analyzer 2.3.x User Manual – 05/2012
Page 7 Head Office : Parc d’activites Kennedy - 20, avenue Neil Armstrong – F-33700 Bordeaux-Merignac (France) Tel +33 (0)5 57 928 928 – Fax +33 (0)5 57 928 929 – contact@ worldcastsystems.com – www.audemat.com
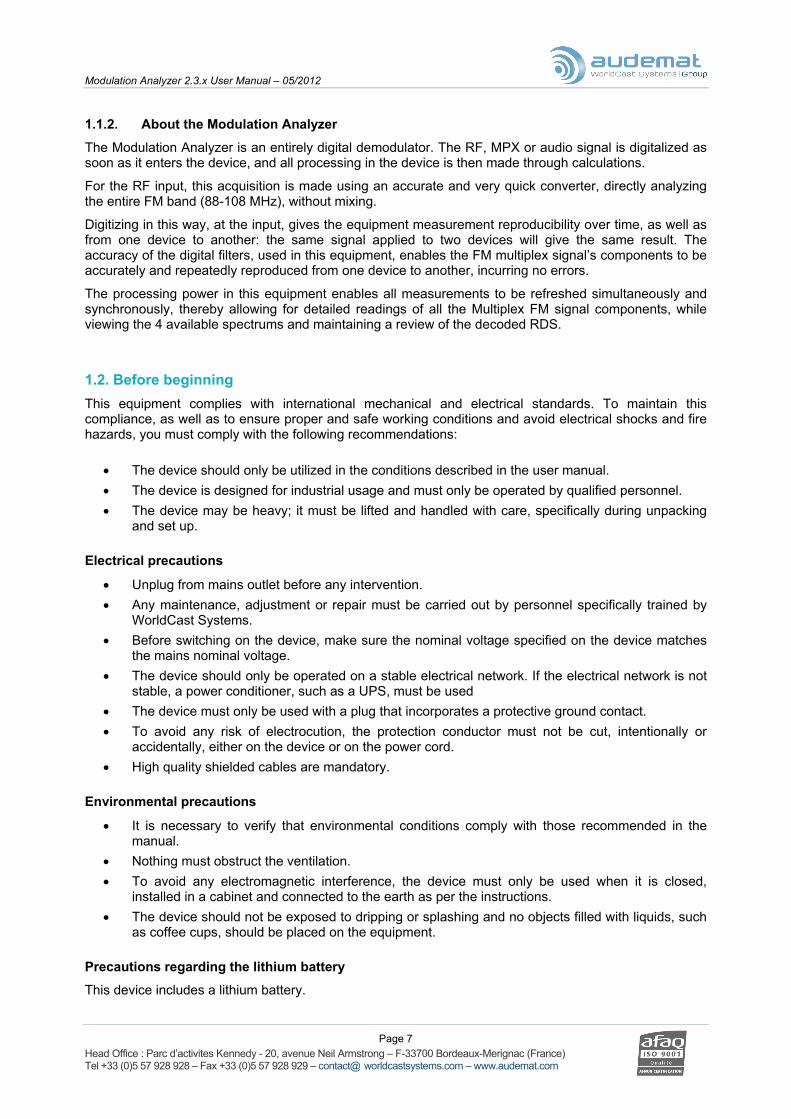
1.1.2. About the Modulation Analyzer
The Modulation Analyzer is an entirely digital demodulator. The RF, MPX or audio signal is digitalized as soon as it enters the device, and all processing in the device is then made through calculations.
For the RF input, this acquisition is made using an accurate and very quick converter, directly analyzing the entire FM band (88-108 MHz), without mixing.
Digitizing in this way, at the input, gives the equipment measurement reproducibility over time, as well as from one device to another: the same signal applied to two devices will give the same result. The accuracy of the digital filters, used in this equipment, enables the FM multiplex signal’s components to be accurately and repeatedly reproduced from one device to another, incurring no errors.
The processing power in this equipment enables all measurements to be refreshed simultaneously and synchronously, thereby allowing for detailed readings of all the Multiplex FM signal components, while viewing the 4 available spectrums and maintaining a review of the decoded RDS.
1.2. Before beginning This equipment complies with international mechanical and electrical standards. To maintain this compliance, as well as to ensure proper and safe working conditions and avoid electrical shocks and fire hazards, you must comply with the following recommendations:
• The device should only be utilized in the conditions described in the user manual. • The device is designed for industrial usage and must only be operated by qualified personnel. • The device may be heavy; it must be lifted and handled with care, specifically during unpacking
and set up. Electrical precautions
• Unplug from mains outlet before any intervention. • Any maintenance, adjustment or repair must be carried out by personnel specifically trained by
WorldCast Systems. • Before switching on the device, make sure the nominal voltage specified on the device matches
the mains nominal voltage. • The device should only be operated on a stable electrical network. If the electrical network is not
stable, a power conditioner, such as a UPS, must be used • The device must only be used with a plug that incorporates a protective ground contact. • To avoid any risk of electrocution, the protection conductor must not be cut, intentionally or
accidentally, either on the device or on the power cord. • High quality shielded cables are mandatory.
Environmental precautions
• It is necessary to verify that environmental conditions comply with those recommended in the manual.
• Nothing must obstruct the ventilation. • To avoid any electromagnetic interference, the device must only be used when it is closed,
installed in a cabinet and connected to the earth as per the instructions. • The device should not be exposed to dripping or splashing and no objects filled with liquids, such
as coffee cups, should be placed on the equipment. Precautions regarding the lithium battery
This device includes a lithium battery.

Modulation Analyzer 2.3.x User Manual – 05/2012
Page 8 Head Office : Parc d’activites Kennedy - 20, avenue Neil Armstrong – F-33700 Bordeaux-Merignac (France) Tel +33 (0)5 57 928 928 – Fax +33 (0)5 57 928 929 – contact@ worldcastsystems.com – www.audemat.com
If the battery is not correctly replaced, there is a risk of explosion.
Only replace it with a battery of the same type. Contact us before attempting to use another type
• Do not puncture the battery • Do not throw the battery in fire • Do not immerse the battery in water • Do not throw away the used battery, recycle it instead. You may send it back to us if needed.
If these precautions are not followed, the guarantee will be void.
1.3. Versions and options 1.3.1. Laboratory version
The Modulation Analyzer comes in standard or Laboratory version. The Laboratory version includes the following features:
RF frequency meter, AF distortion meter, AF frequency meter, Pilot frequency meter, Test signal generator (pure sine wave), RDS frequency meter, Pilot/RDS synchronization/phase difference Oscilloscope (0 – 200 kHz), Automatic frequency sweep to measure crosstalk, bandwidth, SNR and THDN, Automation tools for remote console access.
A software upgrade allows turning the standard version of the Modulation Analyzer into the Laboratory version.
Please read section 6.7 for more information on getting and installing this option.
1.3.2. RF Generator option
The RF Generator is a hardware option (available only for the Laboratory version). It makes it possible to generate an FM signal with integrated audio and composite generators.
This option will be particularly useful to test rebroadcast equipment: inject a known signal from the Modulation Analyzer’s RF generator into rebroadcast equipment and test its output by measuring it with the Modulation Analyzer.
From the output of rebroadcast equipment to the relevant Modulation Analyzer’s input
From the Modulation Analyzer’s RF generator to the RF input of rebroadcast equipment
Modulation Analyzer 2.3.x User Manual – 05/2012
Page 9 Head Office : Parc d’activites Kennedy - 20, avenue Neil Armstrong – F-33700 Bordeaux-Merignac (France) Tel +33 (0)5 57 928 928 – Fax +33 (0)5 57 928 929 – contact@ worldcastsystems.com – www.audemat.com
2. PRODUCT PRESENTATION
2.1. List of included accessories Check that all accessories are present:
• 1 external 200 V/12 V power supply
• 1 crossed network cable (labeled “B”)
• 1 male/male BNC cable (“N”) + 1 N/BNC adapter
• 1 box including a CD-Rom, a cable connection diagram, quality control document and a quick start notice.
• 1 binder including the user manual, the technical specifications and a measurement synthesis report for your equipment
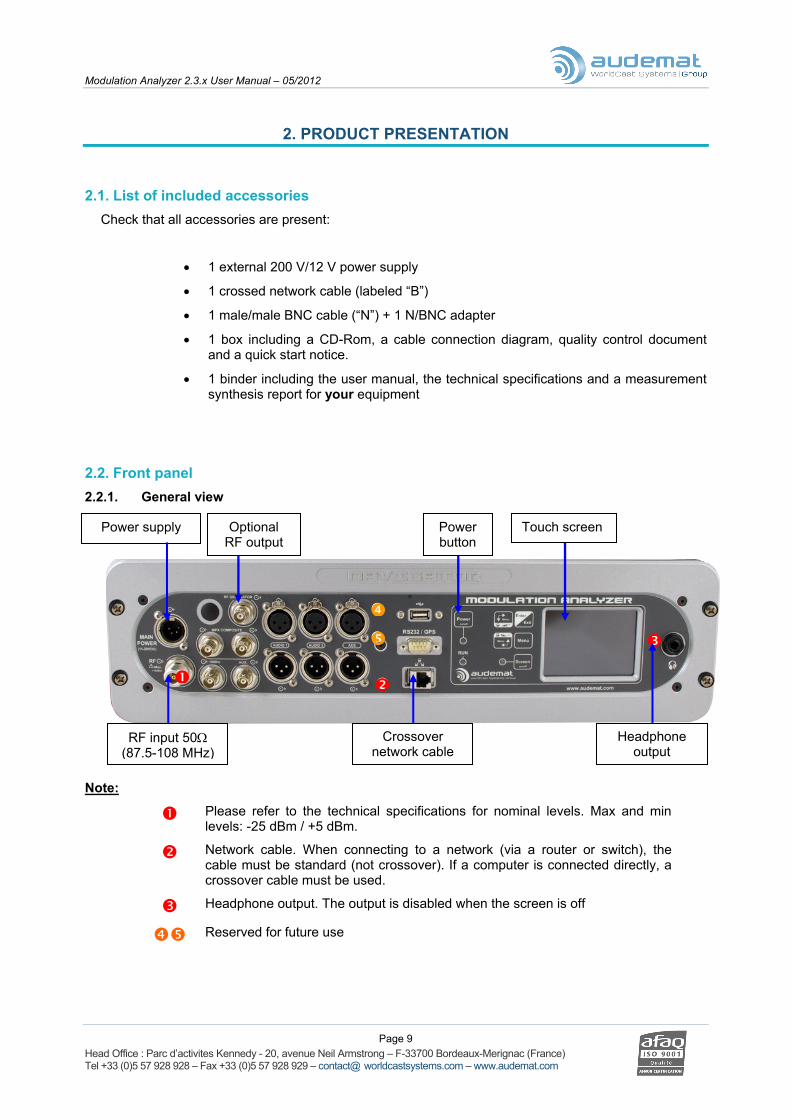
2.2. Front panel 2.2.1. General view
Power supply
Crossover network cable
Optional RF output
RF input 50Ω (87.5-108 MHz)
Power button
Headphone output
Touch screen
Note:
Please refer to the technical specifications for nominal levels. Max and min levels: -25 dBm / +5 dBm.
Network cable. When connecting to a network (via a router or switch), the cable must be standard (not crossover). If a computer is connected directly, a crossover cable must be used.
Headphone output. The output is disabled when the screen is off
Reserved for future use

Modulation Analyzer 2.3.x User Manual – 05/2012
Page 10 Head Office : Parc d’activites Kennedy - 20, avenue Neil Armstrong – F-33700 Bordeaux-Merignac (France) Tel +33 (0)5 57 928 928 – Fax +33 (0)5 57 928 929 – contact@ worldcastsystems.com – www.audemat.com
2.2.2. Connections
MPX input.
10 MHz input to synchronize the internal clock on an external signal. The synchronization is automatic when 10 MHz signal is present, there is no need to set anything with the application software.
Analog audio inputs.
Audio AES/EBU input (48 kHz).
MPX output. See § 7.3.2 for directions on how to assign a signal to this output.
Auxiliary output. See § 7.3.2 for directions on how to assign a signal to this output.
Analog outputs. See § 7.3.2 for directions on how to assign a signal to this output.
AES/EBU output (48 kHz). See § 7.3.2 for directions on how to assign a signal to this output.
Optional RF output.
Input / output pinout:
Analog inputs / outputs
Signal designation
Pin number
Analog - 3
Analog + 2
Ground 1
Digital inputs / outputs
Signal designation
Pin number
Digital - 2
Digital + 3
Ground 1
Inputs
Outputs
2 1
3

Modulation Analyzer 2.3.x User Manual – 05/2012
Page 11 Head Office : Parc d’activites Kennedy - 20, avenue Neil Armstrong – F-33700 Bordeaux-Merignac (France) Tel +33 (0)5 57 928 928 – Fax +33 (0)5 57 928 929 – contact@ worldcastsystems.com – www.audemat.com
2.2.3. Screen
Power On/Off button.
We strongly recommend the use of the screen on the front panel to turn off the equipment. (see § 4.1)
Screen On/Off button.
When the screen is not necessary, we strongly recommend turning it off using this button.
This button also controls the headphone output: if the screen is off, the headphone output will be off.
Volume control for headphone output and for screen configuration setting.
Control for screen configuration setting
The screen has a tactile faceplate for which a stylus has been supplied. When starting up the equipment, this touch screen requires calibration, so that the cursor follows the movements of the stylus. This calibration is done by dragging the stylus around the edges of the screen. Repeat this manipulation whenever the cursor does not track properly.

Modulation Analyzer 2.3.x User Manual – 05/2012
Page 12 Head Office : Parc d’activites Kennedy - 20, avenue Neil Armstrong – F-33700 Bordeaux-Merignac (France) Tel +33 (0)5 57 928 928 – Fax +33 (0)5 57 928 929 – contact@ worldcastsystems.com – www.audemat.com
3. TECHNICAL SPECIFICATIONS
3.1. General specifications
Characteristics Value Dimension (LxDxH) 48 x 27.5 x 13 cm / 19 x 11 x 5 in Weight 4.45 kg / 9.8 Lb Humidity
Operating Storage
< 70% < 95%
Temperature 0° to 40°C, 32°F to 113°F Power supply 100-240 V Power consumption 60 W
3.2. Measurement specifications on the RF input Optimal specifications are guaranteed for a ambient temperature range from +20°C to +30°C (68°F to 86°F), with a warm-up time of: 15 minutes
3.2.1. RF
Min. Typ. Max. Unit Frequency range (Tuning: manual) 87,5 108 MHzInput impedance (BNC connector) 50 ΩFrequency measurement (RF level range: -25 dBm to +10 dBm)
• On internal input • On external input : linked to external precision
1 ppm
Frequency resolution 1 HzPower measurement between -50 dBm to +10 dBm ± 0.5 ± 0.8 dBRF level for best precision on demodulated signals -25 +7 dBm
3.2.2. Demodulated signals
3.2.2.1 MPX Min. Typ. Max. Unit Frequency range 0.01 90 kHzMeasurable deviation ±150 kHzAbsolute deviation measurement precision @ 1kHz (deviation between 2 kHz and 80 kHz)
± 0.2 ± 0.5 %

Modulation Analyzer 2.3.x User Manual – 05/2012
Page 13 Head Office : Parc d’activites Kennedy - 20, avenue Neil Armstrong – F-33700 Bordeaux-Merignac (France) Tel +33 (0)5 57 928 928 – Fax +33 (0)5 57 928 929 – contact@ worldcastsystems.com – www.audemat.com
3.2.2.2 Power measurement for the MPX channel Min. Typ. Max. Unit Frequency range 0.01 90 kHzMax error:
• With sine wave signal @ 1 kHz for -10 dBr < P < 9dB
±0,08
±0,100
dB
3.2.3. Multiplex decoder / AF stereo signals specifications
Min. Typ. Max. Unit Frequency range 0.01 15 kHzStereo separation (Reference L=R @ ±75 kHz of deviation, without filter, without de-emphasis , RMS detection):
• Fmod = 1 kHz • 20 Hz < Fmod < 15 kHz
>67>52
>65 >50
dB
Deviation with a mono or stereo L=R or stereo L=-R signal
• 1 kHz @ 0 dBu • 20 Hz – 15 kHz @ 0 dBu
±0.05±0.1
±0.03 +0.08/-0.05
dB
Variation between L and R channels <±0.02 <±0.03 dB
3.2.4. L&R channel noise measurements
Min. Typ. Max. Unit Frequency range 0.01 15 kHzMeasurement range -100 +6 dBuEquipment residual noise rate (reference 0 dBFS with Fmod = 500 Hz @ ±75 kHz of deviation, de-emphasis = 50 µs / RF level = 0 dBm):
• Mono signal, RMS, without filter • Mono signal, weighted CCIR quasi-peak • Stereo signal, RMS, without filter • Stereo signal, weighted CCIR quasi-peak
> 95> 88> 92> 83
> 93 > 83 > 82 > 71
dB
3.2.5. De-emphasis filters
Type 0 µs, 50 µs, 75 µs
Modulation Analyzer 2.3.x User Manual – 05/2012
Page 14 Head Office : Parc d’activites Kennedy - 20, avenue Neil Armstrong – F-33700 Bordeaux-Merignac (France) Tel +33 (0)5 57 928 928 – Fax +33 (0)5 57 928 929 – contact@ worldcastsystems.com – www.audemat.com
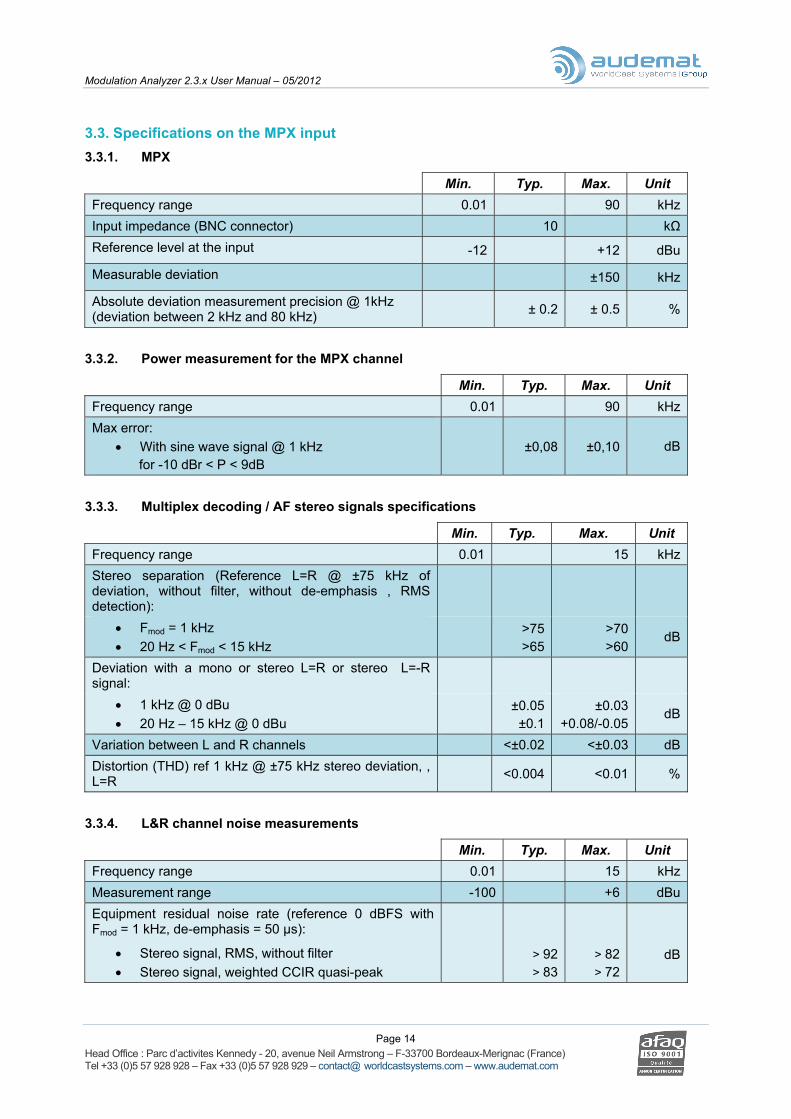
3.3. Specifications on the MPX input 3.3.1. MPX
Min. Typ. Max. Unit Frequency range 0.01 90 kHzInput impedance (BNC connector) 10 kΩReference level at the input -12 +12 dBu
Measurable deviation ±150 kHz
Absolute deviation measurement precision @ 1kHz (deviation between 2 kHz and 80 kHz) ± 0.2 ± 0.5 %
3.3.2. Power measurement for the MPX channel
Min. Typ. Max. Unit Frequency range 0.01 90 kHzMax error:
• With sine wave signal @ 1 kHz for -10 dBr < P < 9dB
±0,08
±0,10
dB
3.3.3. Multiplex decoding / AF stereo signals specifications
Min. Typ. Max. Unit Frequency range 0.01 15 kHzStereo separation (Reference L=R @ ±75 kHz of deviation, without filter, without de-emphasis , RMS detection):
• Fmod = 1 kHz • 20 Hz < Fmod < 15 kHz
>75>65
>70 >60
dB
Deviation with a mono or stereo L=R or stereo L=-R signal:
• 1 kHz @ 0 dBu • 20 Hz – 15 kHz @ 0 dBu
±0.05±0.1
±0.03 +0.08/-0.05
dB
Variation between L and R channels <±0.02 <±0.03 dBDistortion (THD) ref 1 kHz @ ±75 kHz stereo deviation, , L=R <0.004 <0.01 %
3.3.4. L&R channel noise measurements
Min. Typ. Max. Unit Frequency range 0.01 15 kHzMeasurement range -100 +6 dBuEquipment residual noise rate (reference 0 dBFS with Fmod = 1 kHz, de-emphasis = 50 µs):
• Stereo signal, RMS, without filter • Stereo signal, weighted CCIR quasi-peak
> 92> 83
> 82 > 72
dB

Modulation Analyzer 2.3.x User Manual – 05/2012
Page 15 Head Office : Parc d’activites Kennedy - 20, avenue Neil Armstrong – F-33700 Bordeaux-Merignac (France) Tel +33 (0)5 57 928 928 – Fax +33 (0)5 57 928 929 – contact@ worldcastsystems.com – www.audemat.com
3.3.5. De-emphasis filters
Type 0 µs, 50 µs, 75 µs
3.4. Specifications for filters and measurements of non-audio sub-carriers
3.4.1.1 Pilot Min. Typ. Max. Unit Bandpass filter frequency 19 kHzRejection:
• 15 kHz • 23 kHz
>70 dB
Measurable deviation ± 15.0 kHzAbsolute pilot deviation measurement precision:
• Measurement range: 0.1 to ±15 kHz ± 0.8
± 1.0 %Pilot frequency resolution 0.1 HzPilot Frequency measurement precision:
• Measurement range: 1 to ±15 kHz ± 0.3
± 0.5 Hz
3.4.1.2 RDS Min. Typ. Max. Unit Bandpass filter bandwidth (-3 dB) 54.3 59.7 kHzRejection (compared to F0):
• 53 kHz • 61 kHz
>70 dB
Ripple within the band from 55 kHz to 59 kHz <0,3 dBMeasurable deviation ± 10.0 kHzAbsolute RDS deviation measurement precision - Sine wave:
• Deviation between±1 kHz and ±2 kHz • Deviation between±2 kHz and ±10 kHz
± 1.2± 0.5
± 1.5 ± 0.8
%
Absolute RDS deviation measurement precision - Data: • Deviation between±1 kHz and ±2 kHz • Deviation between±2 kHz and ±10 kHz
± 0.8± 0.6
± 1.2 ± 1.0
%
Modulation Analyzer 2.3.x User Manual – 05/2012
Page 16 Head Office : Parc d’activites Kennedy - 20, avenue Neil Armstrong – F-33700 Bordeaux-Merignac (France) Tel +33 (0)5 57 928 928 – Fax +33 (0)5 57 928 929 – contact@ worldcastsystems.com – www.audemat.com
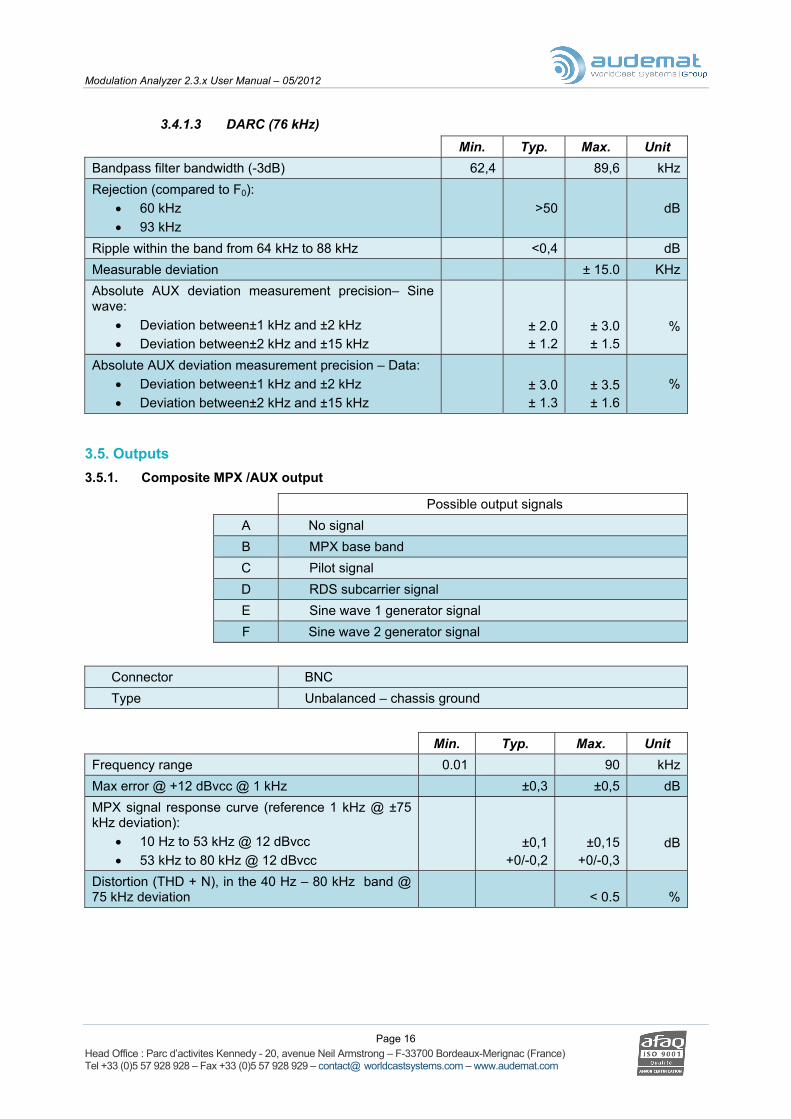
3.4.1.3 DARC (76 kHz) Min. Typ. Max. Unit Bandpass filter bandwidth (-3dB) 62,4 89,6 kHzRejection (compared to F0):
• 60 kHz • 93 kHz
>50 dB
Ripple within the band from 64 kHz to 88 kHz <0,4 dBMeasurable deviation ± 15.0 KHzAbsolute AUX deviation measurement precision– Sine wave:
• Deviation between±1 kHz and ±2 kHz • Deviation between±2 kHz and ±15 kHz
± 2.0± 1.2
± 3.0 ± 1.5
%
Absolute AUX deviation measurement precision – Data: • Deviation between±1 kHz and ±2 kHz • Deviation between±2 kHz and ±15 kHz
± 3.0± 1.3
± 3.5 ± 1.6
%
3.5. Outputs 3.5.1. Composite MPX /AUX output
Possible output signals A No signal B MPX base band C Pilot signal D RDS subcarrier signal E Sine wave 1 generator signal F Sine wave 2 generator signal
Connector BNC Type Unbalanced – chassis ground
Min. Typ. Max. Unit Frequency range 0.01 90 kHzMax error @ +12 dBvcc @ 1 kHz ±0,3 ±0,5 dBMPX signal response curve (reference 1 kHz @ ±75 kHz deviation):
• 10 Hz to 53 kHz @ 12 dBvcc • 53 kHz to 80 kHz @ 12 dBvcc
±0,1+0/-0,2
±0,15 +0/-0,3
dB
Distortion (THD + N), in the 40 Hz – 80 kHz band @ 75 kHz deviation < 0.5 %

Modulation Analyzer 2.3.x User Manual – 05/2012
Page 17 Head Office : Parc d’activites Kennedy - 20, avenue Neil Armstrong – F-33700 Bordeaux-Merignac (France) Tel +33 (0)5 57 928 928 – Fax +33 (0)5 57 928 929 – contact@ worldcastsystems.com – www.audemat.com
3.5.2. AES output
Signals that can be assigned to channel 1 and 2 A No signal B L channel signal without de-emphasis C R channel signal without de-emphasis D M channel signal E S channel signal F L channel signal with de-emphasis G R channel signal with de-emphasis H Sine wave 1 generator signal I Sine wave 2 generator signal
Connector XLR 3 male
Type Balanced
Min. Typ. Max. Unit Frequency range @ -4 dBFS and 1 kHz 0.01 15 kHzMax error for the output level @ -4 dBFS and 1 kHz <±0.01 <±0.015 dBMax variation between L and R channels <±0.006 <±0.01 dBResponse curve @ -4 dBFS between 10 Hz and 15 kHz ±0.10 ±0.20 dBDistortion (THD + N). Reference L=R @ -4 dBFS, without filter, without de-emphasis between 10 Hz and 15 kHz <0.01 <0.05 %
Signal/Noise (reference -4 dBFS @ 1 kHz, stereo L=R: • RMS, without filter • Weighted CCIR quasi-peak
> 130> 118
>125 > 115
dB
Stereo separation (L/ R & R/L), Reference L=R @ -4 dBFS, without filter, RMS detection:
• 20 Hz < Fmod < 15 kHz >130 >125 dB

Modulation Analyzer 2.3.x User Manual – 05/2012
Page 18 Head Office : Parc d’activites Kennedy - 20, avenue Neil Armstrong – F-33700 Bordeaux-Merignac (France) Tel +33 (0)5 57 928 928 – Fax +33 (0)5 57 928 929 – contact@ worldcastsystems.com – www.audemat.com
3.5.3. L and R analog outputs
Signals that can be assigned to channel 1 and 2 A No signal B L channel signal without de-emphasis C R channel signal without de-emphasis D M channel signal E S channel signal F L channel signal with de-emphasis G R channel signal with de-emphasis H Sine wave 1 generator signal I Sine wave 2 generator signal
Connector XLR 3 male Type Balanced
Min. Typ. Max. Unit Frequency range 0.01 15 kHzLevels 18 dBuMax error for the output level @ +12 dBu and 1 kHz ±0.05 ±0.1 dBMax variation between L and R channels <±0.05 <±0.1 dBResponse curve @ +12 dBu between 10 Hz and 15 kHz ±0.10 ±0.20 dBDistortion (THD + N). Reference L=R @ ±75 kHz deviation, without filter, without de-emphasis between 10 Hz and 15 kHz
<0.003 <0.005 %
Signal/Noise (reference +12 dBu @ 1 kHz, stereo L=R): • RMS, without filter • Weighted CCIR quasi-peak
> 115> 82
>112 > 80
dB
Stereo separation (L/ R & R/L), Reference L=R @ +12 dBu, without filter, RMS detection:
• 20 Hz < Fmod < 15 kHz >115 >110 dB

Modulation Analyzer 2.3.x User Manual – 05/2012
Page 19 Head Office : Parc d’activites Kennedy - 20, avenue Neil Armstrong – F-33700 Bordeaux-Merignac (France) Tel +33 (0)5 57 928 928 – Fax +33 (0)5 57 928 929 – contact@ worldcastsystems.com – www.audemat.com
3.5.4. Headphone outputs
Output signal: dependant on equipment settings:
Channel 1 Channel 2 A L channel signal without de-emphasis R channel signal without de-emphasis B M channel signal S channel signal C M channel signal M channel signal D L channel signal with de-emphasis R channel signal with de-emphasis E Sine wave 1 generator signal Sine wave 1 generator signal F Sine wave 2 generator signal Sine wave 2 generator signal
Connector Jack 6.35mm (1/4”) female Type Unbalanced, floating ground Output level Adjustable by the user on the front panel
3.6. Distortion tool
Measurement types THD, THD+N Harmonics displayed F2, F3, F4, F5
Min. Typ. Max. Unit Frequency range 0.01 15 kHzMeasurement range 0,01 100 %Frequency resolution 0,1 HzWith RF signal Max signal deviation for an internal distortion rate < 0,5 % ±180 kHzResidual THD in the equipment from 10 Hz – 15 kHz @ ±75 kHz of deviation <0,005 %
Frequency resolution 0,1 Hz
3.7. Internal AF generator specifications
Min. Typ. Max. Unit Frequency range:
• MPX Composite or Aux outputs • Audio outputs
0.010.01
80 24
kHz
Frequency step 0.1 HzDistortion (THD): 20 kHz / 15 kHz <0.0003 <0.0005 %
Modulation Analyzer 2.3.x User Manual – 05/2012
Page 20 Head Office : Parc d’activites Kennedy - 20, avenue Neil Armstrong – F-33700 Bordeaux-Merignac (France) Tel +33 (0)5 57 928 928 – Fax +33 (0)5 57 928 929 – contact@ worldcastsystems.com – www.audemat.com
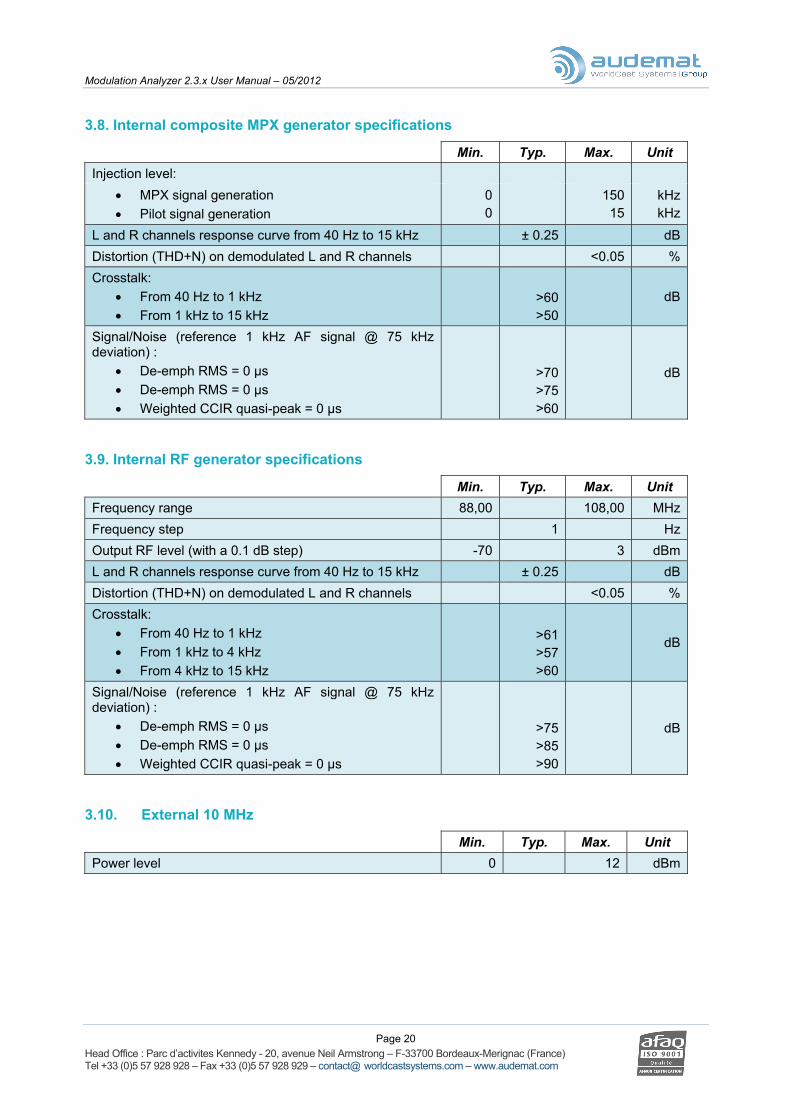
3.8. Internal composite MPX generator specifications
Min. Typ. Max. Unit Injection level:
• MPX signal generation • Pilot signal generation
00
150 15
kHzkHz
L and R channels response curve from 40 Hz to 15 kHz ± 0.25 dBDistortion (THD+N) on demodulated L and R channels <0.05 %Crosstalk:
• From 40 Hz to 1 kHz • From 1 kHz to 15 kHz
>60>50
dB
Signal/Noise (reference 1 kHz AF signal @ 75 kHz deviation) :
• De-emph RMS = 0 µs • De-emph RMS = 0 µs • Weighted CCIR quasi-peak = 0 µs
>70>75>60
dB
3.9. Internal RF generator specifications
Min. Typ. Max. Unit Frequency range 88,00 108,00 MHzFrequency step 1 HzOutput RF level (with a 0.1 dB step) -70 3 dBmL and R channels response curve from 40 Hz to 15 kHz ± 0.25 dBDistortion (THD+N) on demodulated L and R channels <0.05 %Crosstalk:
• From 40 Hz to 1 kHz • From 1 kHz to 4 kHz • From 4 kHz to 15 kHz
>61>57>60
dB
Signal/Noise (reference 1 kHz AF signal @ 75 kHz deviation) :
• De-emph RMS = 0 µs • De-emph RMS = 0 µs • Weighted CCIR quasi-peak = 0 µs
>75>85>90
dB
3.10. External 10 MHz
Min. Typ. Max. Unit Power level 0 12 dBm
Modulation Analyzer 2.3.x User Manual – 05/2012
Page 21 Head Office : Parc d’activites Kennedy - 20, avenue Neil Armstrong – F-33700 Bordeaux-Merignac (France) Tel +33 (0)5 57 928 928 – Fax +33 (0)5 57 928 929 – contact@ worldcastsystems.com – www.audemat.com
4. QUICK START
4.1. PC System requirements The minimum configuration required to run the Modulation Analyzer application is:
• Pentium IV • 2 GHz processor • Microsoft® Windows® XP • 1 Go of RAM
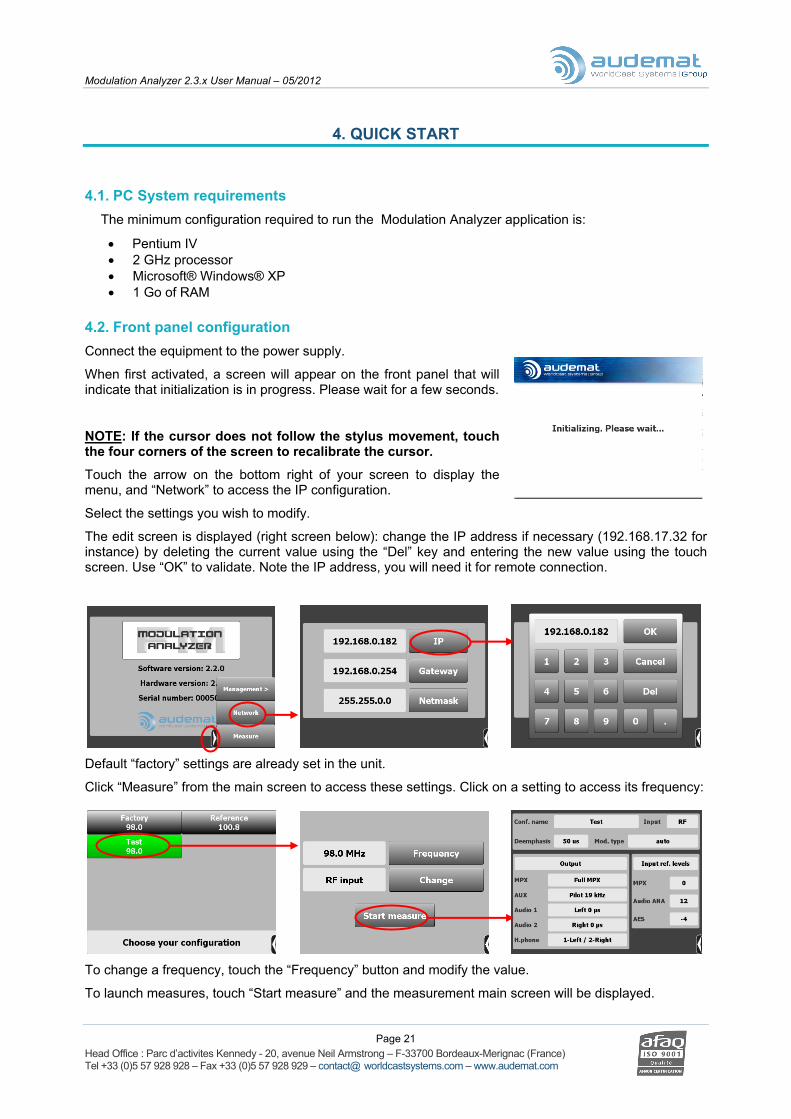
4.2. Front panel configuration Connect the equipment to the power supply.
When first activated, a screen will appear on the front panel that will indicate that initialization is in progress. Please wait for a few seconds.
NOTE: If the cursor does not follow the stylus movement, touch the four corners of the screen to recalibrate the cursor.
Touch the arrow on the bottom right of your screen to display the menu, and “Network” to access the IP configuration.
Select the settings you wish to modify.
The edit screen is displayed (right screen below): change the IP address if necessary (192.168.17.32 for instance) by deleting the current value using the “Del” key and entering the new value using the touch screen. Use “OK” to validate. Note the IP address, you will need it for remote connection.
Default “factory” settings are already set in the unit.
Click “Measure” from the main screen to access these settings. Click on a setting to access its frequency:
To change a frequency, touch the “Frequency” button and modify the value.
To launch measures, touch “Start measure” and the measurement main screen will be displayed.
Modulation Analyzer 2.3.x User Manual – 05/2012
Page 22 Head Office : Parc d’activites Kennedy - 20, avenue Neil Armstrong – F-33700 Bordeaux-Merignac (France) Tel +33 (0)5 57 928 928 – Fax +33 (0)5 57 928 929 – contact@ worldcastsystems.com – www.audemat.com
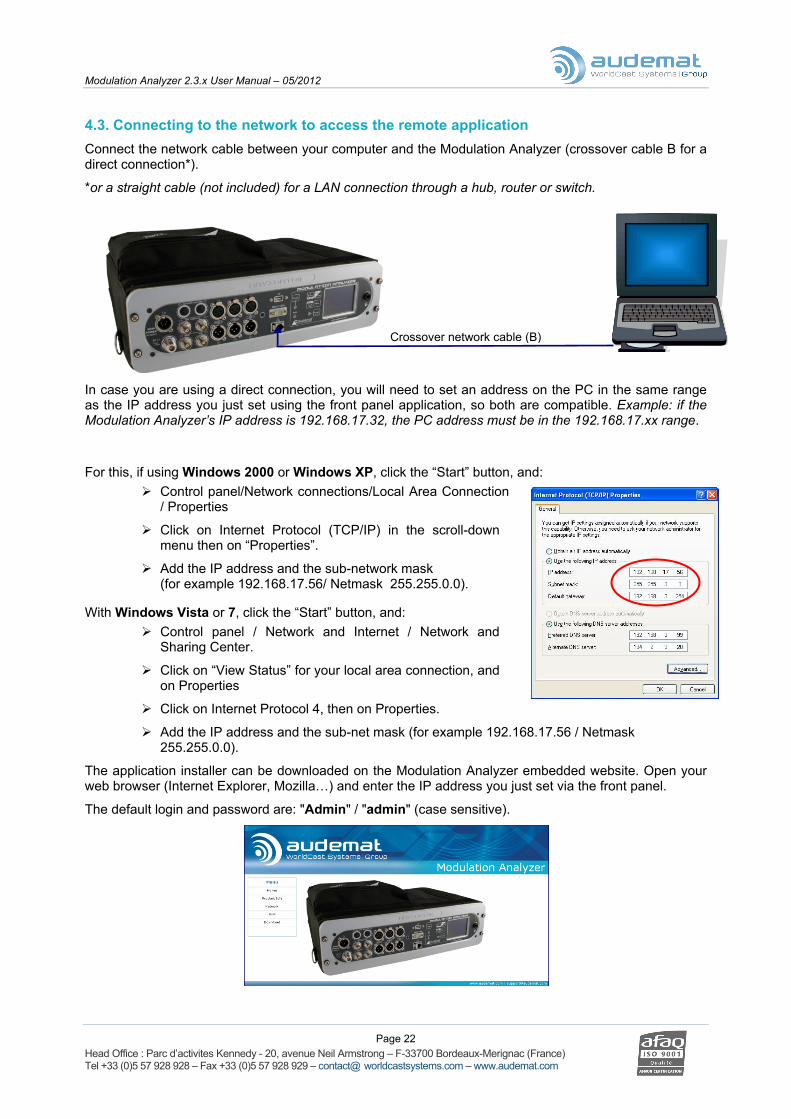
4.3. Connecting to the network to access the remote application Connect the network cable between your computer and the Modulation Analyzer (crossover cable B for a direct connection*).
*or a straight cable (not included) for a LAN connection through a hub, router or switch.
Crossover network cable (B)
In case you are using a direct connection, you will need to set an address on the PC in the same range as the IP address you just set using the front panel application, so both are compatible. Example: if the Modulation Analyzer’s IP address is 192.168.17.32, the PC address must be in the 192.168.17.xx range.
For this, if using Windows 2000 or Windows XP, click the “Start” button, and: Control panel/Network connections/Local Area Connection
/ Properties
Click on Internet Protocol (TCP/IP) in the scroll-down menu then on “Properties”.
Add the IP address and the sub-network mask (for example 192.168.17.56/ Netmask 255.255.0.0).
With Windows Vista or 7, click the “Start” button, and: Control panel / Network and Internet / Network and
Sharing Center.
Click on “View Status” for your local area connection, and on Properties
Click on Internet Protocol 4, then on Properties.
Add the IP address and the sub-net mask (for example 192.168.17.56 / Netmask 255.255.0.0).
The application installer can be downloaded on the Modulation Analyzer embedded website. Open your web browser (Internet Explorer, Mozilla…) and enter the IP address you just set via the front panel.
The default login and password are: "Admin" / "admin" (case sensitive).

Modulation Analyzer 2.3.x User Manual – 05/2012
Page 23 Head Office : Parc d’activites Kennedy - 20, avenue Neil Armstrong – F-33700 Bordeaux-Merignac (France) Tel +33 (0)5 57 928 928 – Fax +33 (0)5 57 928 929 – contact@ worldcastsystems.com – www.audemat.com
4.4. Installing the Modulation Analyzer application Navigate to the “Download” page to download the remote application. Click “Application installer” and
follow on-screen instructions to install it.

Modulation Analyzer 2.3.x User Manual – 05/2012
Page 24 Head Office : Parc d’activites Kennedy - 20, avenue Neil Armstrong – F-33700 Bordeaux-Merignac (France) Tel +33 (0)5 57 928 928 – Fax +33 (0)5 57 928 929 – contact@ worldcastsystems.com – www.audemat.com
5. THE FRONT PANEL APPLICATION
5.1. Overview The Modulation Analyzer’s front panel application makes it possible to configure the unit but also to launch measures and to view a large number of graphs and data.
When first activating the equipment, a screen appears on the front panel; this screen indicates that initialization is happening. Wait a few seconds.
The arrow on the lower right of the screen allows access to the menus. Using the stylus, touch it to display menus and touch it again to hide them.
A menu entry followed by an arrow pointing to the right indicates there is a sub-menu.
The last menu item (preceded by an arrow pointing to the left) will bring you back to the previous screen).
If the cursor does not follow the movements of the stylus, touch all 4 corners of the screen in order to recalibrate the cursor.

Modulation Analyzer 2.3.x User Manual – 05/2012
Page 25 Head Office : Parc d’activites Kennedy - 20, avenue Neil Armstrong – F-33700 Bordeaux-Merignac (France) Tel +33 (0)5 57 928 928 – Fax +33 (0)5 57 928 929 – contact@ worldcastsystems.com – www.audemat.com
5.2. Unit configuration Touch the arrow to access the main menu:
1 2
1 : Click on “Management” to display the following screen:
1 2 3
You may then:
1. “Reboot": restart the unit.
2. “Shutdown”: this is the recommended method to shut down your Modulation Analyzer.
3. “Reset password” to factory settings (Admin/admin).

Modulation Analyzer 2.3.x User Manual – 05/2012
Page 26 Head Office : Parc d’activites Kennedy - 20, avenue Neil Armstrong – F-33700 Bordeaux-Merignac (France) Tel +33 (0)5 57 928 928 – Fax +33 (0)5 57 928 929 – contact@ worldcastsystems.com – www.audemat.com
2: Click on “Network” to display and modify network parameters: IP address, gateway and netmask.
Click on the button for the parameter you wish to modify:
• Use the “Del” button to erase current value and enter the new value.
• Once the IP address (or mask or gateway) has been changed, the OK button is activated. Click on it to validate. New values are in effect right away.
The IP address set here will be the one used to connect to the equipment with the remote application (see § 6.1.2).

Modulation Analyzer 2.3.x User Manual – 05/2012
Page 27 Head Office : Parc d’activites Kennedy - 20, avenue Neil Armstrong – F-33700 Bordeaux-Merignac (France) Tel +33 (0)5 57 928 928 – Fax +33 (0)5 57 928 929 – contact@ worldcastsystems.com – www.audemat.com
5.3. Measures 5.3.1. Launching measure
Click “Start measure” to launch measures.
Note: the type of measurements (real time ordepend on the configuration, which can onlremote application (see section 6.3.1).
s
Click on “Measure” from the main screen menu.
The list of current configurations is displayed: default configurations and user configurations created from the remote application. The active configuration, if any, has a green background.
Once selected, details for this configuration are displayed. The frequency may be modified as is done with the IP address (see section 5.2).
To change the source, click on the “Change” button; then, simply click on the new source to update the configuration.
If you need to configure your FM modulator, see section 5.3.2.
automatic) will y be set in the
Modulation Analyzer 2.3.x User Manual – 05/2012
Page 28 Head Office : Parc d’activites Kennedy - 20, avenue Neil Armstrong – F-33700 Bordeaux-Merignac (France) Tel +33 (0)5 57 928 928 – Fax +33 (0)5 57 928 929 – contact@ worldcastsystems.com – www.audemat.com
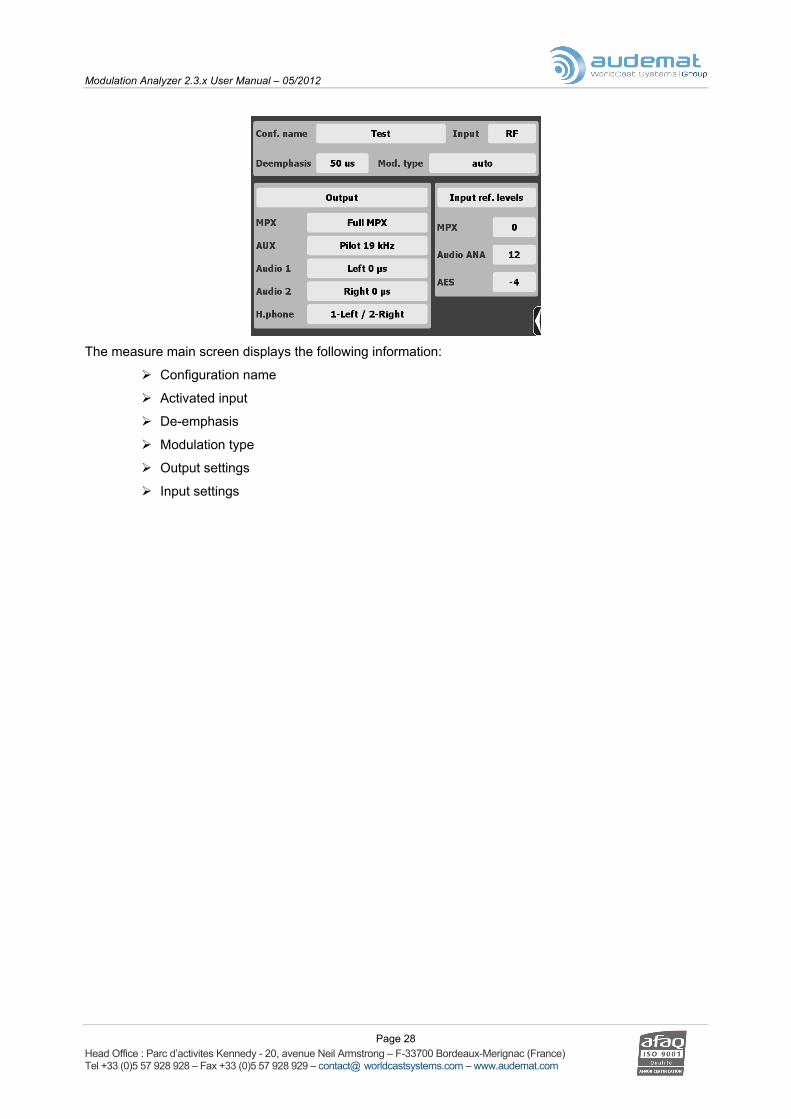
The measure main screen displays the following information:
Configuration name
Activated input
De-emphasis
Modulation type
Output settings
Input settings
Modulation Analyzer 2.3.x User Manual – 05/2012
Page 29 Head Office : Parc d’activites Kennedy - 20, avenue Neil Armstrong – F-33700 Bordeaux-Merignac (France) Tel +33 (0)5 57 928 928 – Fax +33 (0)5 57 928 929 – contact@ worldcastsystems.com – www.audemat.com
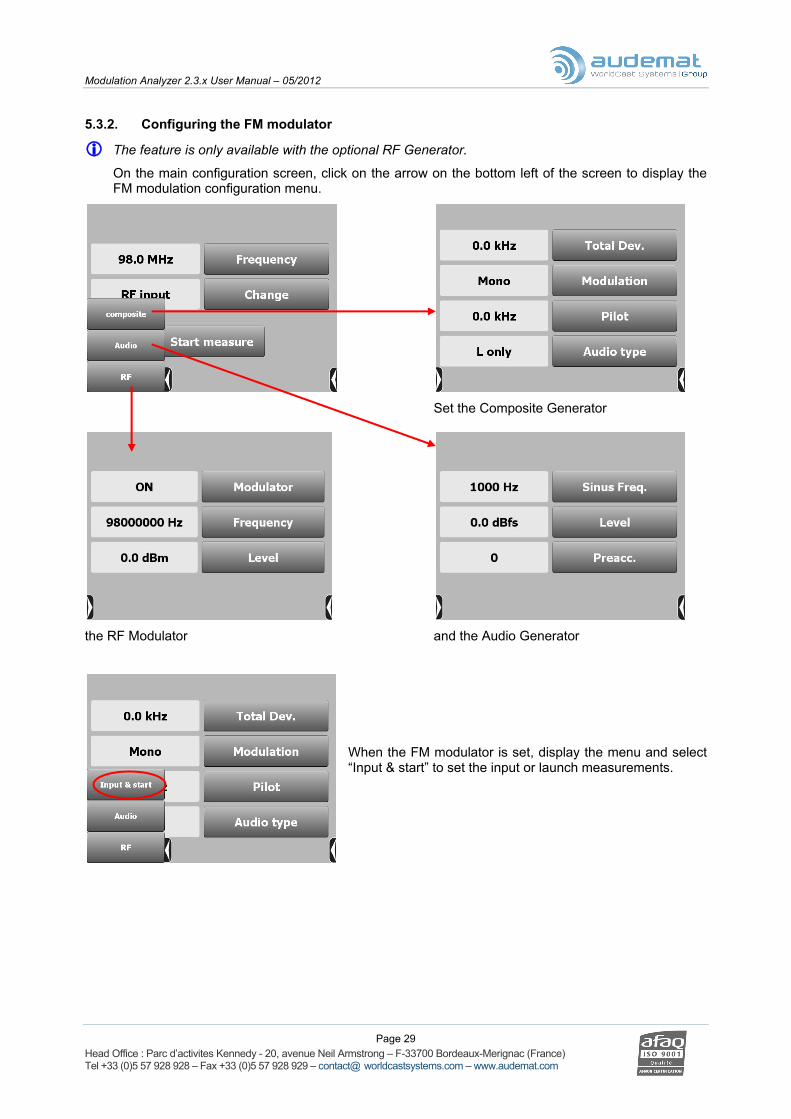
5.3.2. Configuring the FM modulator
The feature is only available with the optional RF Generator.
On the main configuration screen, click on the arrow on the bottom left of the screen to display the FM modulation configuration menu.
Set the Composite Generator
the RF Modulator and the Audio Generator
When the FM modulator is set, display the menu and select “Input & start” to set the input or launch measurements.

Modulation Analyzer 2.3.x User Manual – 05/2012
Page 30 Head Office : Parc d’activites Kennedy - 20, avenue Neil Armstrong – F-33700 Bordeaux-Merignac (France) Tel +33 (0)5 57 928 928 – Fax +33 (0)5 57 928 929 – contact@ worldcastsystems.com – www.audemat.com
5.3.3. Real time measurements
When the configuration is set for realtime measurements in the remote application, access the full measure menu and choose the type of measure you wish to perform on the frequency: spectrum analysis, modulation measurement, MPX power…
All menu items are not directly accessible; click on “More” to view the last menu items:
1 2
3
While in measure mode, you may:
1. “Reset” measurements: the current capture is stopped and a new one starts.
2. “Stop Measurements”: this command is only available from the main measure screen.
3. Go back to the "Main” measurement screen.

Modulation Analyzer 2.3.x User Manual – 05/2012
Page 31 Head Office : Parc d’activites Kennedy - 20, avenue Neil Armstrong – F-33700 Bordeaux-Merignac (France) Tel +33 (0)5 57 928 928 – Fax +33 (0)5 57 928 929 – contact@ worldcastsystems.com – www.audemat.com
5.3.3.1 Spectrum
Click on "Spectrum": you get an RF spectrum on the chosen frequency.
Display the left menu to be able to view the MPX spectrum or the L and R audio spectrum.
5.3.3.2 MPX Power
Select the MPX power menu to obtain a diagram of measured deviation repartition.
Display the left menu to be able to view the instantaneous curve or the cumulated curve.
Modulation Analyzer 2.3.x User Manual – 05/2012
Page 32 Head Office : Parc d’activites Kennedy - 20, avenue Neil Armstrong – F-33700 Bordeaux-Merignac (France) Tel +33 (0)5 57 928 928 – Fax +33 (0)5 57 928 929 – contact@ worldcastsystems.com – www.audemat.com
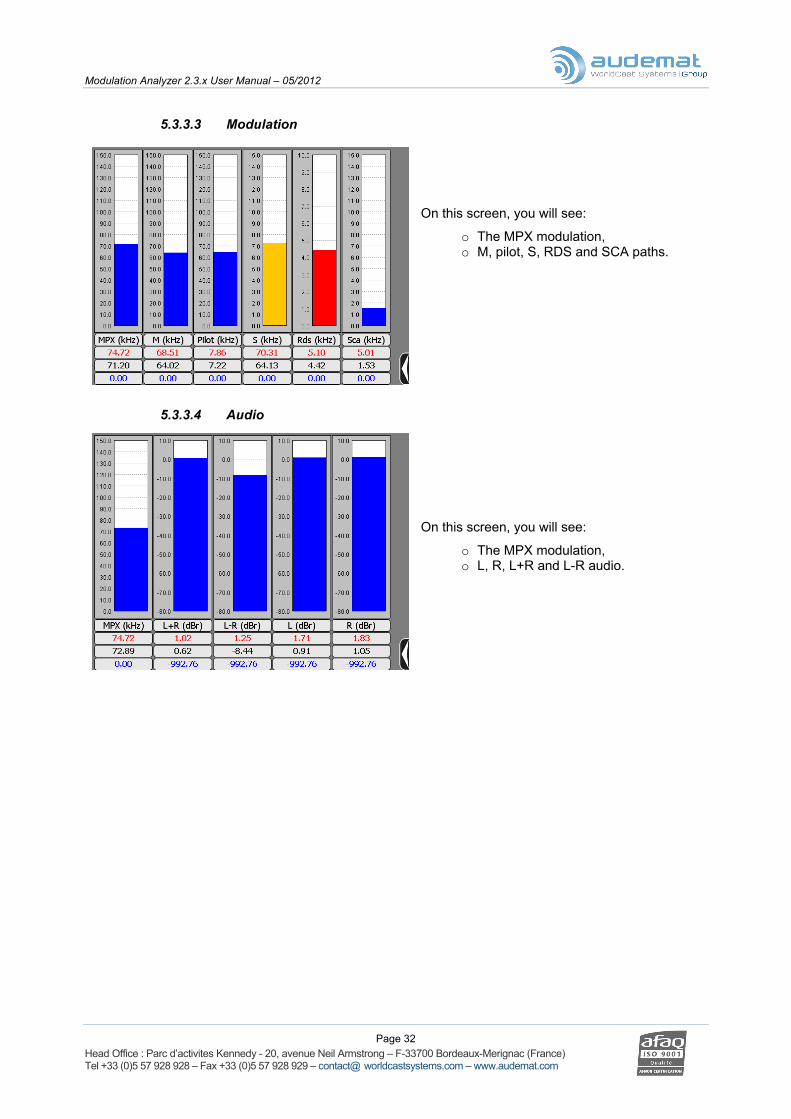
5.3.3.3 Modulation
On this screen, you will see:
o The MPX modulation, o M, pilot, S, RDS and SCA paths.
5.3.3.4 Audio
On this screen, you will see:
o The MPX modulation, o L, R, L+R and L-R audio.

Modulation Analyzer 2.3.x User Manual – 05/2012
Page 33 Head Office : Parc d’activites Kennedy - 20, avenue Neil Armstrong – F-33700 Bordeaux-Merignac (France) Tel +33 (0)5 57 928 928 – Fax +33 (0)5 57 928 929 – contact@ worldcastsystems.com – www.audemat.com
5.3.3.5 RDS
The information RDS screen offers a summary of decoded RDS information:
o PI o PS o TP o TA o Character table (or code table) o PTY o PTYN o DI o PIN o GRPD
Display the left menu to be able to view the groups, instantaneous and global errors and AF.
5.3.4. Automatic measurements
When the configuration is set for automatic measurements in the remote application (only available with the Laboratory version), use the menu on the right to access other types of measurements: bandwidth, signal to noise ration, distortion + noise and crosstalk.
The menu on the left allows access to the type of flow, it differs with the selected measurement.

Modulation Analyzer 2.3.x User Manual – 05/2012
Page 34 Head Office : Parc d’activites Kennedy - 20, avenue Neil Armstrong – F-33700 Bordeaux-Merignac (France) Tel +33 (0)5 57 928 928 – Fax +33 (0)5 57 928 929 – contact@ worldcastsystems.com – www.audemat.com
5.3.4.1 Bandwidth
On this screen, you will see the bandwidth level in dBr for each channel. You may select:
o Left RMS o Right RMS o Left RMS with de-emphasis o Right RMS with de-emphasis
5.3.4.2 SNR
5.3.4.3 THD+N
On this screen, you will see the signal to noise ratio in dBr:
Total noise – Bandwidth.
You may select:
o Left RMS o Right RMS o Left RMS with de-emphasis o Right RMS with de-emphasis
On this screen, you will see the Total Harmonic Distortion + Noise for each channel in dBr. You may select:
o THDN left o THDN right.
Modulation Analyzer 2.3.x User Manual – 05/2012
Page 35 Head Office : Parc d’activites Kennedy - 20, avenue Neil Armstrong – F-33700 Bordeaux-Merignac (France) Tel +33 (0)5 57 928 928 – Fax +33 (0)5 57 928 929 – contact@ worldcastsystems.com – www.audemat.com
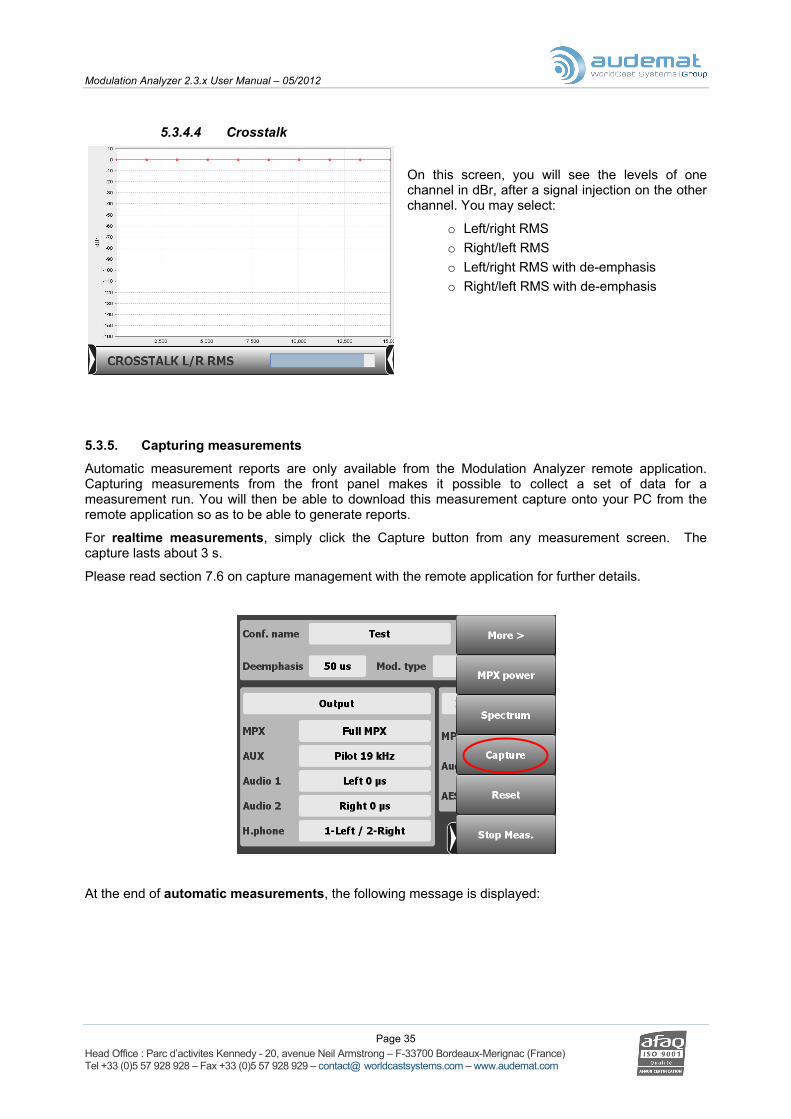
5.3.4.4 Crosstalk
On this screen, you will see the levels of one channel in dBr, after a signal injection on the other channel. You may select:
o Left/right RMS o Right/left RMS o Left/right RMS with de-emphasis o Right/left RMS with de-emphasis
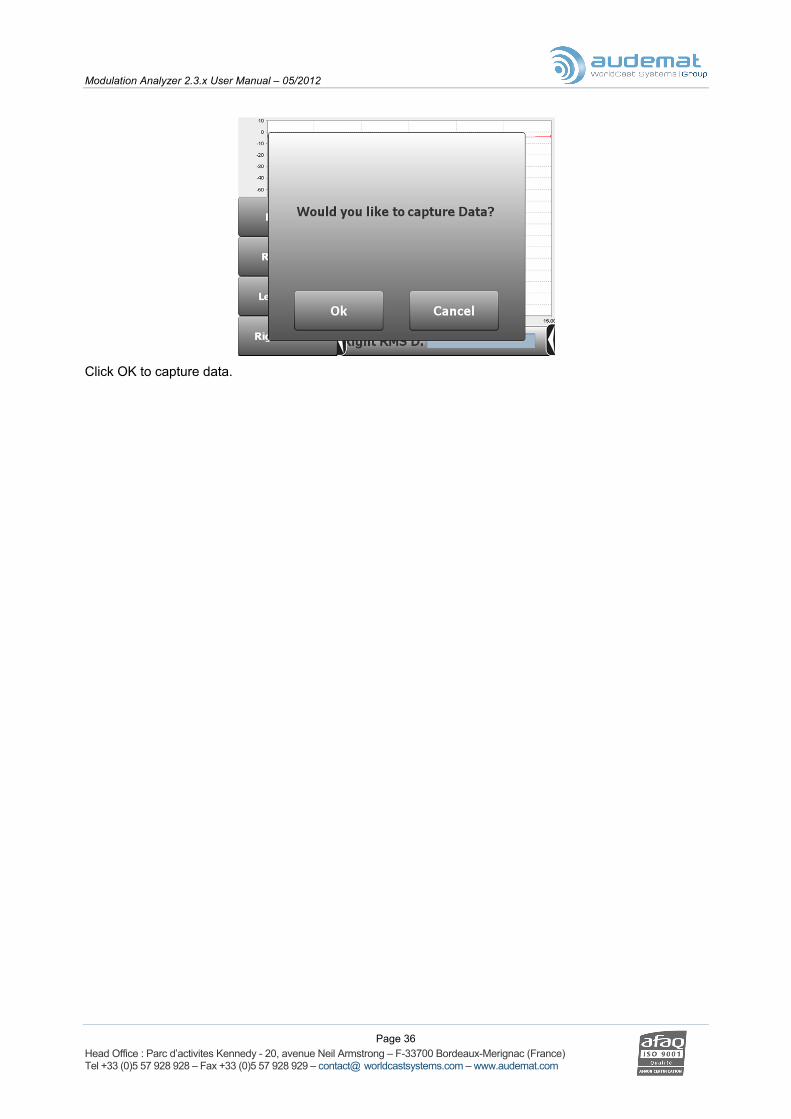
5.3.5. Capturing measurements
Automatic measurement reports are only available from the Modulation Analyzer remote application. Capturing measurements from the front panel makes it possible to collect a set of data for a measurement run. You will then be able to download this measurement capture onto your PC from the remote application so as to be able to generate reports.
For realtime measurements, simply click the Capture button from any measurement screen. The capture lasts about 3 s.
Please read section 7.6 on capture management with the remote application for further details.
At the end of automatic measurements, the following message is displayed:
Modulation Analyzer 2.3.x User Manual – 05/2012
Page 36 Head Office : Parc d’activites Kennedy - 20, avenue Neil Armstrong – F-33700 Bordeaux-Merignac (France) Tel +33 (0)5 57 928 928 – Fax +33 (0)5 57 928 929 – contact@ worldcastsystems.com – www.audemat.com
Click OK to capture data.

Modulation Analyzer 2.3.x User Manual – 05/2012
Page 37 Head Office : Parc d’activites Kennedy - 20, avenue Neil Armstrong – F-33700 Bordeaux-Merignac (France) Tel +33 (0)5 57 928 928 – Fax +33 (0)5 57 928 929 – contact@ worldcastsystems.com – www.audemat.com
6. THE EMBEDDED WEB SITE
Go to the embedded web site for basic configuration functions and to download the remote application.
6.1. Product ID
On this page of the embedded website, the user can:
Configure:
o Product name: it can be used for connecting to the equipment from the java application. It is therefore recommended to use a unique and easily recognizable name.
o Product description (optional)
View:
o Serial number
o Software version
o Hardware version
Avoid particular characters for the product name; only alphanumerical characters, dashes, underscores and spaces are allowed.
When making changes you must click on the “Update” button before leaving the page to lock in your changes.
Modulation Analyzer 2.3.x User Manual – 05/2012
Page 38 Head Office : Parc d’activites Kennedy - 20, avenue Neil Armstrong – F-33700 Bordeaux-Merignac (France) Tel +33 (0)5 57 928 928 – Fax +33 (0)5 57 928 929 – contact@ worldcastsystems.com – www.audemat.com
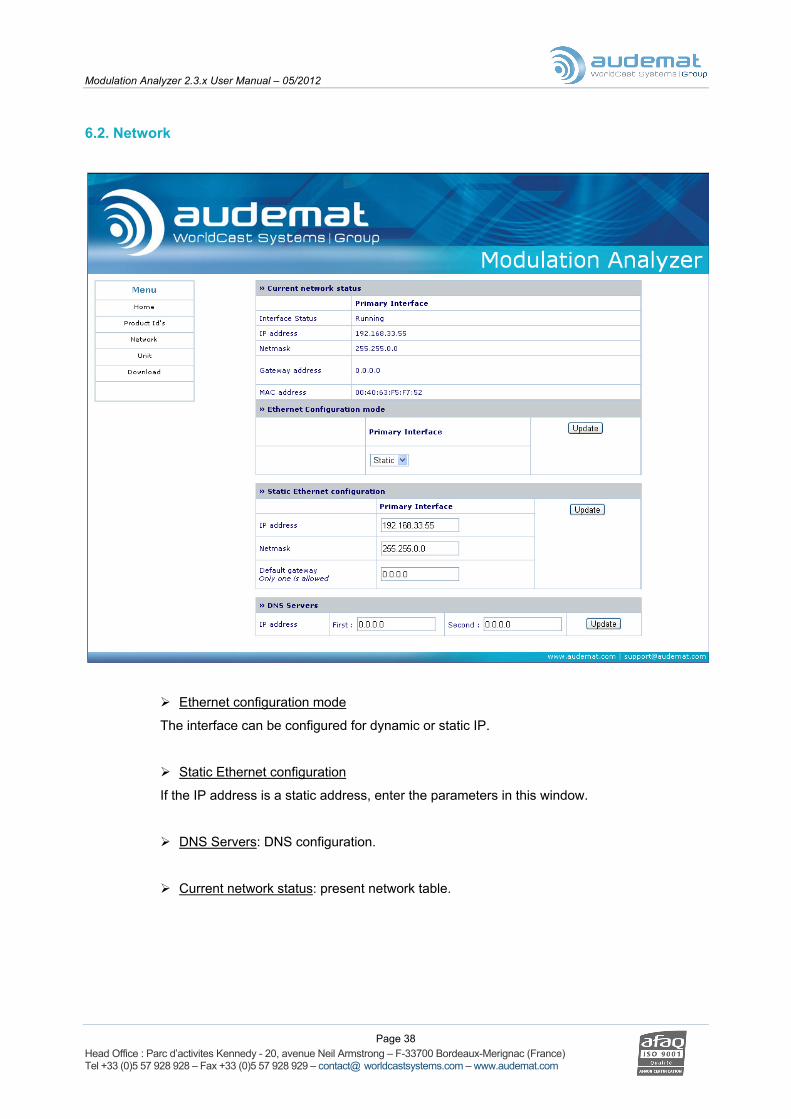
6.2. Network
Ethernet configuration mode
The interface can be configured for dynamic or static IP.
Static Ethernet configuration
If the IP address is a static address, enter the parameters in this window.
DNS Servers: DNS configuration.
Current network status: present network table.
Modulation Analyzer 2.3.x User Manual – 05/2012
Page 39 Head Office : Parc d’activites Kennedy - 20, avenue Neil Armstrong – F-33700 Bordeaux-Merignac (France) Tel +33 (0)5 57 928 928 – Fax +33 (0)5 57 928 929 – contact@ worldcastsystems.com – www.audemat.com
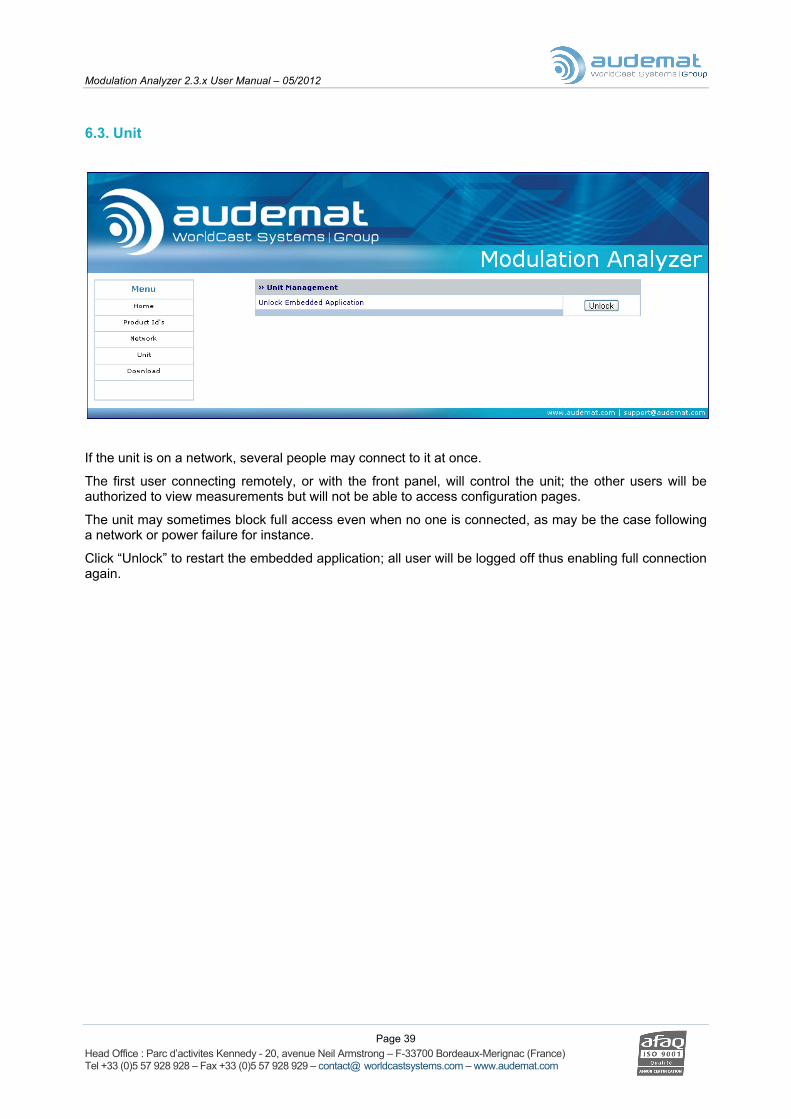
6.3. Unit
If the unit is on a network, several people may connect to it at once.
The first user connecting remotely, or with the front panel, will control the unit; the other users will be authorized to view measurements but will not be able to access configuration pages.
The unit may sometimes block full access even when no one is connected, as may be the case following a network or power failure for instance.
Click “Unlock” to restart the embedded application; all user will be logged off thus enabling full connection again.
Modulation Analyzer 2.3.x User Manual – 05/2012
Page 40 Head Office : Parc d’activites Kennedy - 20, avenue Neil Armstrong – F-33700 Bordeaux-Merignac (France) Tel +33 (0)5 57 928 928 – Fax +33 (0)5 57 928 929 – contact@ worldcastsystems.com – www.audemat.com
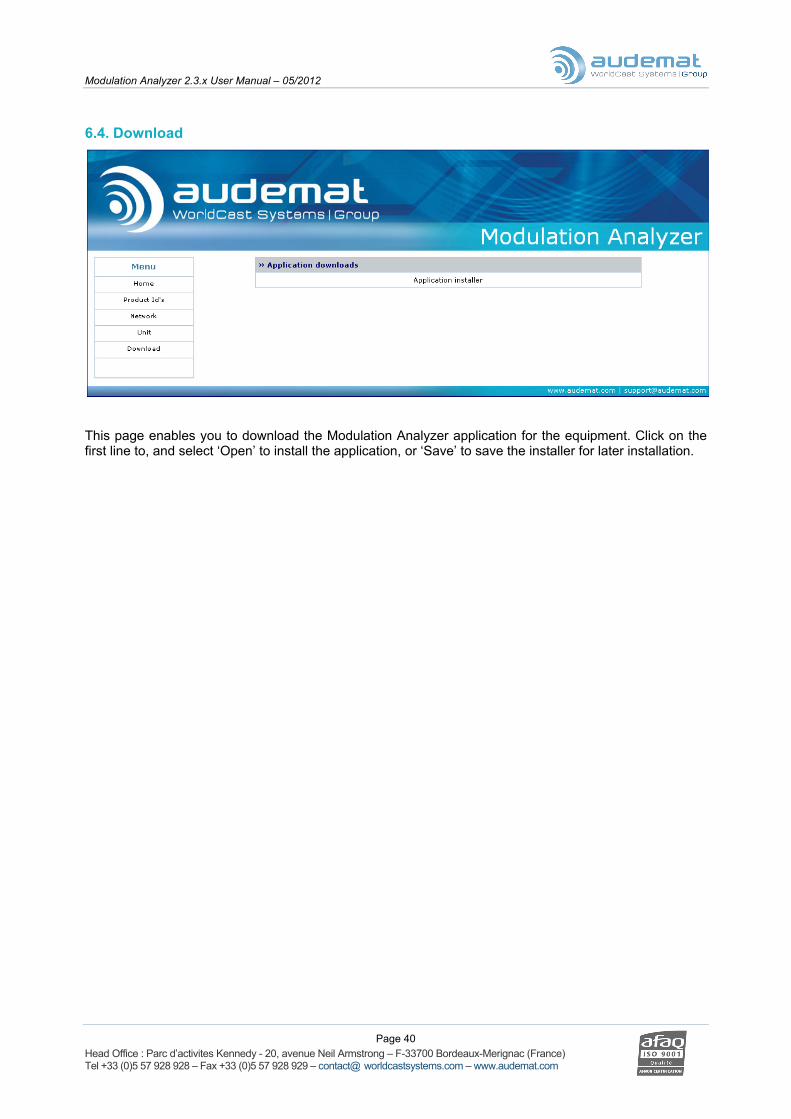
6.4. Download
This page enables you to download the Modulation Analyzer application for the equipment. Click on the first line to, and select ‘Open’ to install the application, or ‘Save’ to save the installer for later installation.

Modulation Analyzer 2.3.x User Manual – 05/2012
Page 41 Head Office : Parc d’activites Kennedy - 20, avenue Neil Armstrong – F-33700 Bordeaux-Merignac (France) Tel +33 (0)5 57 928 928 – Fax +33 (0)5 57 928 929 – contact@ worldcastsystems.com – www.audemat.com
7. THE REMOTE COMPUTER APPLICATION
7.1. Launching the Modulation Analyzer’s application 7.1.1. Prerequisite
A remote application, “Modulation Analyzer” is stored in the unit and is available to be downloaded from the embedded web site in the “Download” tab.
You should also check that the equipment’s network parameters are compatible with those of your computer.
The equipment does not have a DHCP server. It is therefore mandatory, when using a crossover cable, to configure the computer with a fixed IP address.
For a direct connection, configure the computer’s IP address in the same range as the Modulation Analyzer’s IP address (refer to section 3.3).
In case of doubt, and so as to be sure that the equipment can be contacted by the PC, use the ping command via the computer’s command prompt, and check that a reply comes back from the Modulation Analyzer.
If the unit is on a network, several people may connect to it at once. The first user will control the unit; the other users will be authorized to view measurements but will not be able to access the configuration pages, even if the first user has not started measurements yet.
In case of network or power failure or other problem, the unit may completely block access with the application even if no one is connected. Go to the “Unit” page of the embedded website to unlock the application (see section 5.3).

Modulation Analyzer 2.3.x User Manual – 05/2012
Page 42 Head Office : Parc d’activites Kennedy - 20, avenue Neil Armstrong – F-33700 Bordeaux-Merignac (France) Tel +33 (0)5 57 928 928 – Fax +33 (0)5 57 928 929 – contact@ worldcastsystems.com – www.audemat.com
7.1.2. Connection to the unit
Launch the application from the desktop shortcut or go to ‘Programs’ ‘AUDEMAT’ ‘ModulationAnalyzer’ ‘ModulationAnalyzer’.
The first time the software starts, the following screen is displayed :
Reset previously saved data
12
3 4
5
Enter the equipment’s IP address (2) and the HTTP port (3) (port 80 by default), as well
as the login and password (4).
• The IP address can be set and modified from the front screen (see § 4.1)
• The login and password can be modified from the embedded web site’s “Users” tab (section ‘Web’). Default values are “Admin”/ “admin” for the administrator and “Guest”/ “guest” for a basic user.
Or: click on the magnifying glass (5) to display a list of equipment connected to the network. All units will be listed. The green indicators show units whose embedded version is compatible with the remote application version; the red indicators show units that are not compatible with the application.
Double-click on the line for the chosen equipment: its IP address and port will appear in (2) and (3). Just enter the login and password as described above.

Modulation Analyzer 2.3.x User Manual – 05/2012
Page 43 Head Office : Parc d’activites Kennedy - 20, avenue Neil Armstrong – F-33700 Bordeaux-Merignac (France) Tel +33 (0)5 57 928 928 – Fax +33 (0)5 57 928 929 – contact@ worldcastsystems.com – www.audemat.com
Once the application has been used, a scroll-down menu is available (1) to select the equipment’s name from a list of current connections:
Enter the login and password if the "Save password" box had not been checked.
Click on the "OK" button. The application may take a few seconds to establish the connection.
Each time the application is started up, a note about the equipment will appear.
You may deactivate this pop-up window by checking the box at the bottom.
Once the connection has been established, click on the “Configuration” tab to begin your equipment’s configuration.
The File ‘Connect’ menu makes it possible to connect to different units one after the other without closing the software application. However, we recommend closing and reopening the application, if you need to connect to a different unit.

Modulation Analyzer 2.3.x User Manual – 05/2012
Page 44 Head Office : Parc d’activites Kennedy - 20, avenue Neil Armstrong – F-33700 Bordeaux-Merignac (France) Tel +33 (0)5 57 928 928 – Fax +33 (0)5 57 928 929 – contact@ worldcastsystems.com – www.audemat.com
7.2. System Configuration The first step is to set up the unit and the application.
To view the system configuration pages, click the button, or go the “View” ”System configuration” menu, and use links on the left side of the window to access the different pages .
7.2.1. Product Identifiers
The ‘Product ID’ page lists the build versions of the various pieces of software and firmware that make the Modulation Analyzer function. It also allows you to give your unit a unique name and description, for your own internal use.
Avoid special characters for the product name; only alphanumerical characters, dashes, underscores and spaces are allowed.
Click the “Update” button to lock in your changes (this is true for every page of the system configuration).
These settings can also be managed on the “Product ID” page of the embedded web site.

Modulation Analyzer 2.3.x User Manual – 05/2012
Page 45 Head Office : Parc d’activites Kennedy - 20, avenue Neil Armstrong – F-33700 Bordeaux-Merignac (France) Tel +33 (0)5 57 928 928 – Fax +33 (0)5 57 928 929 – contact@ worldcastsystems.com – www.audemat.com
7.2.2. Date/Time
Set system date:
The user may update both date (year/month/day) and time (hour/minute/second).
Set system time zone:
The user selects the geographical zone from the list. Important to have this set correctly when using an NTP server.
Network Time Protocol: NTP update
The user can enter a time server address to update the equipment’s internal clock automatically. Enter either an IP address or a DNS address the unit can reach; make sure to properly set the Gateway and DNS servers on the ‘Network’ page (see section 6.5).
Set the time zone first! Changes in the time zone affect the time that is displayed in the system time window, so setting the zone first will eliminate the need to set the system time twice!

Modulation Analyzer 2.3.x User Manual – 05/2012
Page 46 Head Office : Parc d’activites Kennedy - 20, avenue Neil Armstrong – F-33700 Bordeaux-Merignac (France) Tel +33 (0)5 57 928 928 – Fax +33 (0)5 57 928 929 – contact@ worldcastsystems.com – www.audemat.com
7.2.3. Status
The ‘Status’ page gives a summary of the unit’s vital parameters: temperature, available memory, CPU load and available disk space. This information may be requested to establish a diagnosis in case of malfunction.
Alarm thresholds make it possible to monitor critical parameters. An ‘Equipment default’ type SNMT trap is sent in case of overshoot.
Modulation Analyzer 2.3.x User Manual – 05/2012
Page 47 Head Office : Parc d’activites Kennedy - 20, avenue Neil Armstrong – F-33700 Bordeaux-Merignac (France) Tel +33 (0)5 57 928 928 – Fax +33 (0)5 57 928 929 – contact@ worldcastsystems.com – www.audemat.com
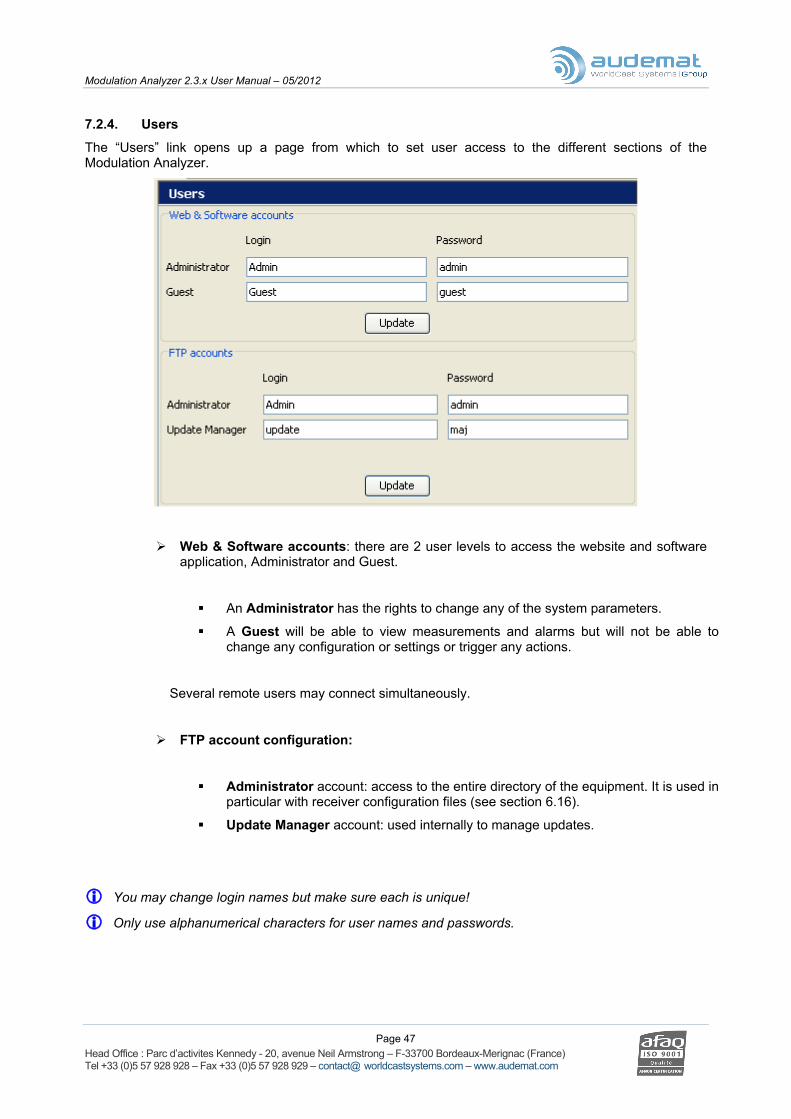
7.2.4. Users
The “Users” link opens up a page from which to set user access to the different sections of the Modulation Analyzer.
Web & Software accounts: there are 2 user levels to access the website and software application, Administrator and Guest.
An Administrator has the rights to change any of the system parameters.
A Guest will be able to view measurements and alarms but will not be able to change any configuration or settings or trigger any actions.
Several remote users may connect simultaneously.
FTP account configuration:
Administrator account: access to the entire directory of the equipment. It is used in particular with receiver configuration files (see section 6.16).
Update Manager account: used internally to manage updates.
You may change login names but make sure each is unique!
Only use alphanumerical characters for user names and passwords.

Modulation Analyzer 2.3.x User Manual – 05/2012
Page 48 Head Office : Parc d’activites Kennedy - 20, avenue Neil Armstrong – F-33700 Bordeaux-Merignac (France) Tel +33 (0)5 57 928 928 – Fax +33 (0)5 57 928 929 – contact@ worldcastsystems.com – www.audemat.com
7.2.5. Network
IP Configuration:
Ethernet configuration mode
The interface can be configured with a static or dynamic IP address (DHCP).
DHCP mode is only recommended if the IP address given by the server is know (for instance if the server gives an IP address to the MAC address).
Static Ethernet configuration
If using a static IP address, enter the parameters in this window.
DNS Servers: DNS configuration, to be able to use domain names rather than numerical IP
addresses. Mandatory if before using DNS addresses on other configuration pages.
Current network status: summary of current network parameters.
IP configuration is also available on the “Network” page of the embedded web site.

Modulation Analyzer 2.3.x User Manual – 05/2012
Page 49 Head Office : Parc d’activites Kennedy - 20, avenue Neil Armstrong – F-33700 Bordeaux-Merignac (France) Tel +33 (0)5 57 928 928 – Fax +33 (0)5 57 928 929 – contact@ worldcastsystems.com – www.audemat.com
7.2.6. Support
Stop / Restart:
‘Restart’ enables the user to restart the application to reinitialize the parameters.
“Reboot equipment”: restarts the entire unit.
“Power off equipment”: enables the unit to be switched off remotely.
The unit cannot be turned on remotely.
Default configuration:
This function will allow the user to delete the present configuration and to reset the default configuration.
Caution: all parameters including log files will be deleted.
Resetting will not erase your current IP address.

Modulation Analyzer 2.3.x User Manual – 05/2012
Page 50 Head Office : Parc d’activites Kennedy - 20, avenue Neil Armstrong – F-33700 Bordeaux-Merignac (France) Tel +33 (0)5 57 928 928 – Fax +33 (0)5 57 928 929 – contact@ worldcastsystems.com – www.audemat.com
7.2.7. Preferences
On this page:
• Enable or disable the startup notice.
• Set whether the “Reset” button starts a new capture (if checked) or only resets minima and maxima (see § 7.4.1).
• Set the maximum time for a measurement capture in minutes (0 = no max time).
• Automatically generate a report at the end of a capture if checked.
• Choose the language to be used for display: the default language is English unless French is the operating system language.
Modulation options
• Check if damping correction should be applied to bargraphs.
• Modulation unit: kHz or %.
Close and reopen the application in order for the language changes to be taken into account.
Modulation Analyzer 2.3.x User Manual – 05/2012
Page 51 Head Office : Parc d’activites Kennedy - 20, avenue Neil Armstrong – F-33700 Bordeaux-Merignac (France) Tel +33 (0)5 57 928 928 – Fax +33 (0)5 57 928 929 – contact@ worldcastsystems.com – www.audemat.com
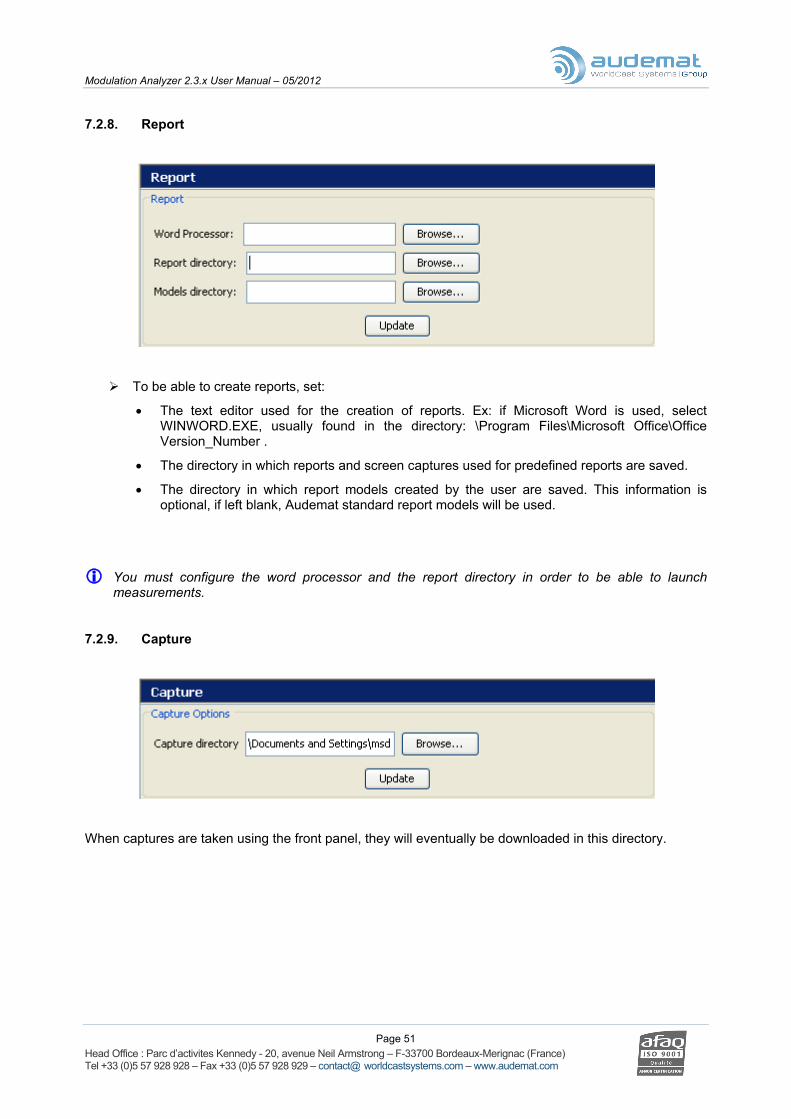
7.2.8. Report
To be able to create reports, set:
• The text editor used for the creation of reports. Ex: if Microsoft Word is used, select WINWORD.EXE, usually found in the directory: \Program Files\Microsoft Office\Office Version_Number .
• The directory in which reports and screen captures used for predefined reports are saved.
• The directory in which report models created by the user are saved. This information is optional, if left blank, Audemat standard report models will be used.
You must configure the word processor and the report directory in order to be able to launch measurements.
7.2.9. Capture
When captures are taken using the front panel, they will eventually be downloaded in this directory.

Modulation Analyzer 2.3.x User Manual – 05/2012
Page 52 Head Office : Parc d’activites Kennedy - 20, avenue Neil Armstrong – F-33700 Bordeaux-Merignac (France) Tel +33 (0)5 57 928 928 – Fax +33 (0)5 57 928 929 – contact@ worldcastsystems.com – www.audemat.com
7.3. Measurement Configuration
The configuration settings are displayed on startup. Later on, they are only accessible when no measurement is being carried out. It is necessary to stop measurements by clicking the “Stop” button in order to toggle onto the configuration and modify the parameters.
To access the configuration view, click on the button, or go the menu “View” ”Configuration”.
CAUTION: the Modulation Analyzer comes with three default configurations: Factory, Reference and Test. These configurations may be modified, but not deleted. They ensure the unit will work properly.
7.3.1. Configuration management
Use icons on the tool bar:
In order to create a new configuration, click the "New conf." button:
Enter the name of the new configuration.
Click "Create configuration”, its name will then appear in the list and you will be able to set its parameters.
When a configuration is modified, click “Save conf.” to lock in the changes. If you exit the Configuration mode without saving, the Modulation Analyzer will offer to do so.
To delete a configuration, select it from the list and click the “Del. Conf.” button.

Modulation Analyzer 2.3.x User Manual – 05/2012
Page 53 Head Office : Parc d’activites Kennedy - 20, avenue Neil Armstrong – F-33700 Bordeaux-Merignac (France) Tel +33 (0)5 57 928 928 – Fax +33 (0)5 57 928 929 – contact@ worldcastsystems.com – www.audemat.com
7.3.2. Analyzer tab
List of up to 10 recorded configurations: these configurations are available on the unit’s front panel application. They enable configurations specific to a station to be memorized. These configurations are stored in the unit, not locally on the PC.
Name of the selected configuration.
List of signals which will be routed to the equipment’s outputs.
Possible choices are summarized below:
MPX and/or AUX outputs
Audio 1 and/or 2 outputs
Head-phone output RF output**
MPX Pilot RDS Mono
Stereo Left
Right Left with de-emphasis
Right with de-emphasis Sine wave 1 generator * Sine wave 2 generator * Composite generator **
Signals routed to the AES/EBU and audio Analog outputs are identical
For the headphone output the outputs are ‘linked’: Mono/Stereo, Left/Right.

Modulation Analyzer 2.3.x User Manual – 05/2012
Page 54 Head Office : Parc d’activites Kennedy - 20, avenue Neil Armstrong – F-33700 Bordeaux-Merignac (France) Tel +33 (0)5 57 928 928 – Fax +33 (0)5 57 928 929 – contact@ worldcastsystems.com – www.audemat.com
* Only available with the Laboratory version.
** Only available with the RF Generator option.
Acquiring data and readings: all panels in the application are simultaneously refreshed at a frequency depending on the type of information displayed. The speed will also depend on the power of the computer being used, with a slow computer, it is best not to check all boxes. Warning: ‘Thd’ and ‘Oscilloscope’ screens (Laboratory version) are linked to the ‘Analyze FM modulation’ and ‘Analyze RF spectrum’ options.
Modulation Analyzer input selection. This may be Analog Audio, AES Audio, MPX or RF input. • If the RF is chosen, the frequency in MHz should be entered. The RF signal at the
input must contain only that frequency to guarantee accuracy of the equipment, and the RF level must be in the -25 dBm/+5 dBm range.
• If the MPX input is chosen, the signal is a 0-100 kHz signal, whose nominal level is defined in § 7.3.1 (if the reference level is 0 dBu, the reference deviation is 75 kHz and the signal is applied with a level of 6 dBu, the deviation bargraphs will display 150 kHz).
• If the audio inputs (AES or Analog) are chosen, the signal is a 0-16 kHz signal, whose nominal level is defined in § 7.3.1 (if the reference level is 6 dBu, and the signal is applied with a level of 0 dBu the audio bargraphs will display a level of -6 dB).
Set parameters for automatic measurements of bandwidth, SFN, crosstalk and THD+N. When this mode is selected, clicking the “Start” button will start these types of measurements instead of standard realtime measurements.
Before launching measurement, it is possible to check Left/Right inversion.
In Step by step mode, set the 1st and last frequency and the number of steps. These frequencies must be between 10 Hz and 90 kHz. If the logarithmic scale box is checked, the step and the display are logarithmic.
In List mode, set the frequencies that need to be scanned. These frequencies must be between 10 Hz and 90 kHz. However, make sure you do not assign a sine wave with a frequency greater than 24 kHz on audio outputs. If the logarithmic scale box is checked the display is logarithmic.
The sine wave level is set in dBr. An immediate conversion gives access to digital (AES/EBU) and analog levels.
Select specific measurements to run.
Make sure you check the output settings before launching measurements:
• If the MPX generator is used on the MPX output, set the output as needed.
• If the RF output is used, set the RF frequency, its level, its pre-emphasis (if needed) and enable the MPX generator.
Automatic measurements are only available with the Laboratory version.
So as to facilitate the learning curve on the Modulation Analyzer, tool tips containing short explanations are available. Simply hover over the text zone you wish to learn more about and keep the mouse still for one second:
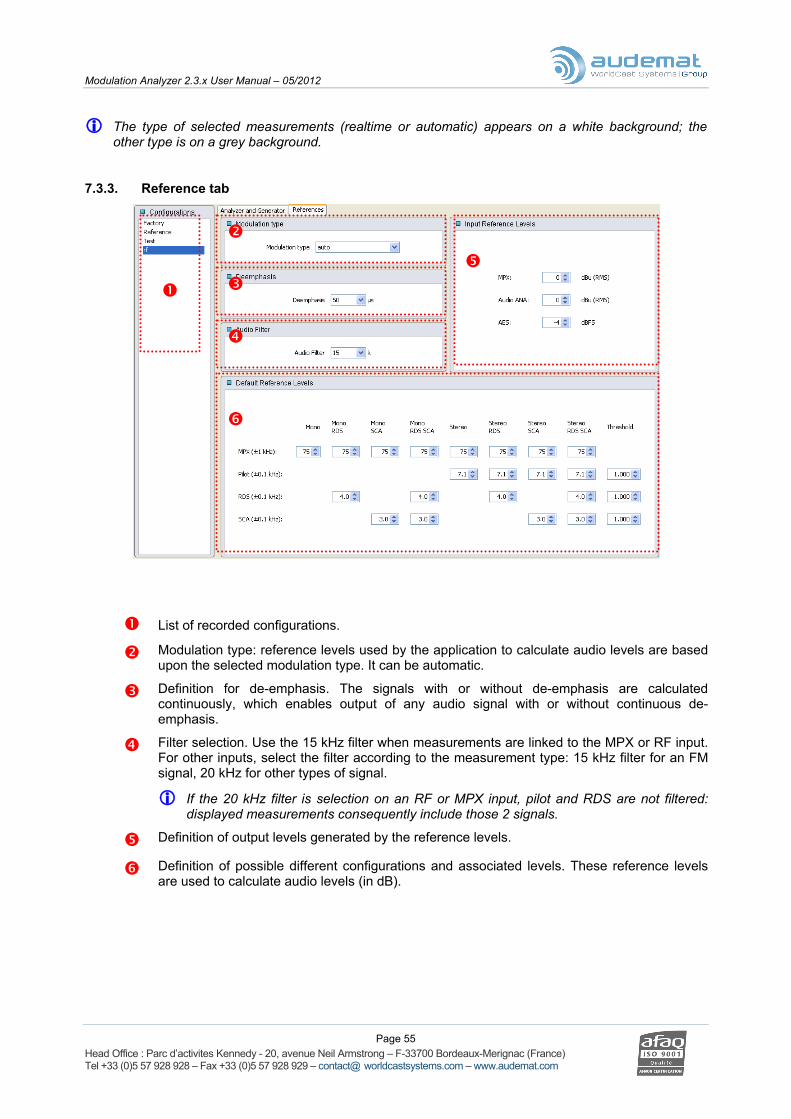
Modulation Analyzer 2.3.x User Manual – 05/2012
Page 55 Head Office : Parc d’activites Kennedy - 20, avenue Neil Armstrong – F-33700 Bordeaux-Merignac (France) Tel +33 (0)5 57 928 928 – Fax +33 (0)5 57 928 929 – contact@ worldcastsystems.com – www.audemat.com
The type of selected measurements (realtime or automatic) appears on a white background; the other type is on a grey background.
7.3.3. Reference tab
List of recorded configurations.
Modulation type: reference levels used by the application to calculate audio levels are based upon the selected modulation type. It can be automatic.
Definition for de-emphasis. The signals with or without de-emphasis are calculated continuously, which enables output of any audio signal with or without continuous de-emphasis.
Filter selection. Use the 15 kHz filter when measurements are linked to the MPX or RF input. For other inputs, select the filter according to the measurement type: 15 kHz filter for an FM signal, 20 kHz for other types of signal.
If the 20 kHz filter is selection on an RF or MPX input, pilot and RDS are not filtered: displayed measurements consequently include those 2 signals.
Definition of output levels generated by the reference levels.
Definition of possible different configurations and associated levels. These reference levels are used to calculate audio levels (in dB).
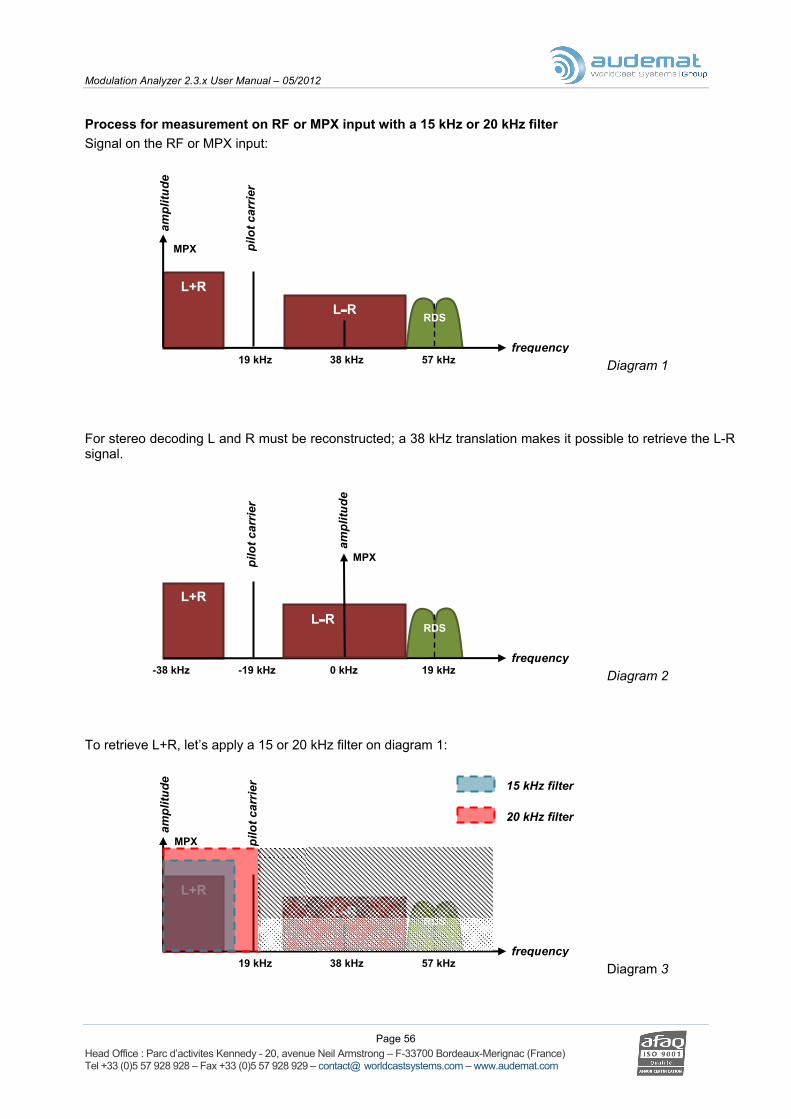
Modulation Analyzer 2.3.x User Manual – 05/2012
Page 56 Head Office : Parc d’activites Kennedy - 20, avenue Neil Armstrong – F-33700 Bordeaux-Merignac (France) Tel +33 (0)5 57 928 928 – Fax +33 (0)5 57 928 929 – contact@ worldcastsystems.com – www.audemat.com
Process for measurement on RF or MPX input with a 15 kHz or 20 kHz filter Signal on the RF or MPX input:
L-R L+R
MPX
ampl
itude
pilo
t car
rier
RDS
57 kHz 38 kHz 19 kHz frequency
Diagram 1 For stereo decoding L and R must be reconstructed; a 38 kHz translation makes it possible to retrieve the L-R signal.
ampl
itude
L+R
-19 kHz 0 kHz 19 kHz
RDS
MPX
-38 kHz
L-R
pilo
t car
rier
frequency Diagram 2
To retrieve L+R, let’s apply a 15 or 20 kHz filter on diagram 1:
L-R L+R
19 kHz 38 kHz 57 kHz
RDS
MPX
frequency
ampl
itude
15 kHz filter
20 kHz filter
pilo
t car
rier
Diagram 3

Modulation Analyzer 2.3.x User Manual – 05/2012
Page 57 Head Office : Parc d’activites Kennedy - 20, avenue Neil Armstrong – F-33700 Bordeaux-Merignac (France) Tel +33 (0)5 57 928 928 – Fax +33 (0)5 57 928 929 – contact@ worldcastsystems.com – www.audemat.com
To retrieve L-R, let’s apply a 15 or 20 kHz filter on diagram 2:
L-R L+R
RDS
MPX ampl
itude
pilo
t car
rier
19 kHz 0 kHz -19 kHz
15 kHz filter
20 kHz filter
frequency -38 kHz Diagram 4
L and R can now be de ms 3 and 4: ducted from diagra
L R L R
2
L R L R
2 As shown on diagram 4, the presence of the pilot carrier and parts of the RDS is perfectly normal on the whole signal filtered at 20 kHz.

Modulation Analyzer 2.3.x User Manual – 05/2012
Page 58 Head Office : Parc d’activites Kennedy - 20, avenue Neil Armstrong – F-33700 Bordeaux-Merignac (France) Tel +33 (0)5 57 928 928 – Fax +33 (0)5 57 928 929 – contact@ worldcastsystems.com – www.audemat.com
7.3.4. Generator tab
This tab is only available with the RF Generator option.
List of recorded configurations.
RF modulator settings: enable or disable the modulator, set the frequency from 87500000 to 108000000 kHz, set the level from -70 to 3 dBm
Composite generator settings: enable or disable the generator, set the total deviation from 0 to 150 kHz, the modulation type (mono or stereo), the pilot level from 0 to 25 kHz and the audio type (L, R, L=R, L=-R)
Choice of frequency generated by both local generators. These frequencies must be between 10 Hz and 90 kHz. However, make sure you do not assign a sine wave with a frequency greater than 24 kHz on audio outputs. The sine wave level is set in dBr. An immediate conversion gives access to digital (AES/EBU) and analog levels.
Actual levels are equal to:
reference level + RMS level (in dBr)
(Reference levels are set on the “Reference” tab).

Modulation Analyzer 2.3.x User Manual – 05/2012
Page 59 Head Office : Parc d’activites Kennedy - 20, avenue Neil Armstrong – F-33700 Bordeaux-Merignac (France) Tel +33 (0)5 57 928 928 – Fax +33 (0)5 57 928 929 – contact@ worldcastsystems.com – www.audemat.com
7.4. Measurement Mode
7.4.1. Overview
Click the Measures button (or go to the menu “View” ”Measures”) to display to all measurement tabs. This does not trigger off value acquisitions; the graphs and their former values are displayed.
After having selected a configuration, the recording of measurements is launched by clicking the “Start” button (or going to the menu “Measures” ”Start”, or using the shortcut ‘s’). From this moment on, all selected tabs (see § 7.3.2) are simultaneously and continuously refreshed; time graphs store the measurements that, are not visible on the graph. Data is viewed by clicking from one tab to another. The process is the same for the RDS views.
Depending on whether the measurement type is “realtime” or “automatic” for the selected configuration, the measured data and therefore the tabs will be different.
With realtime measurements (standard version):
With realtime measurements (Laboratory version):
With automatic measurements:
Tabs composed of several graphs enable related data to be viewed as a group. This view is divided into two parts; the first part has three or four smaller graphs, the second contains the larger working graph. Contents of the large graph are chosen by clicking on one of the small graphs.
This working graph can incorporate advanced functions, depending on its type. These functions include zoom, markers and maximum hold capabilities.
To view the RDS, press the “Stop” button (or go to the menu “Measures” ”Stop”, or using the shortcut ‘h’) This is the only way to see the data (since the first measurement).
The “Reset” button (or the menu “Measures” ”Reset”, or using the shortcut ‘r’) resets the displayed minima and maxima. If the option “The Reset button acts as restart” is checked (see § 6.4), clicking on the “Reset” button stops the current capture and starts a new one.
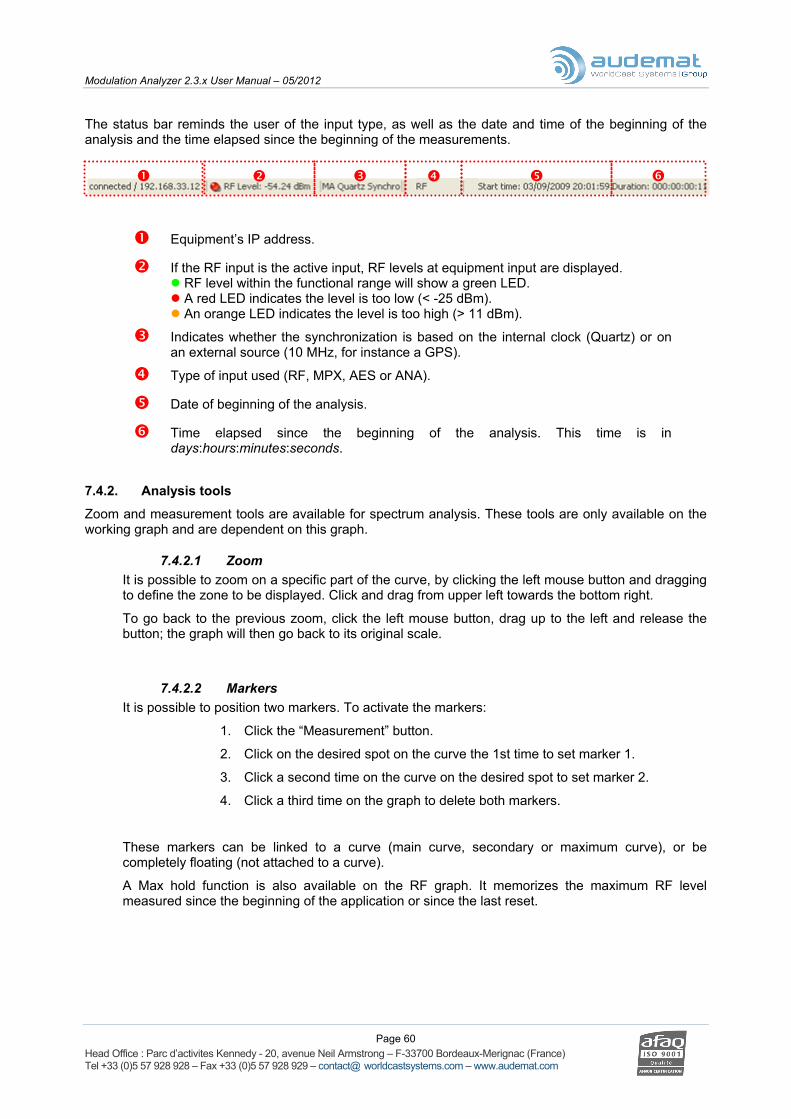
Modulation Analyzer 2.3.x User Manual – 05/2012
Page 60 Head Office : Parc d’activites Kennedy - 20, avenue Neil Armstrong – F-33700 Bordeaux-Merignac (France) Tel +33 (0)5 57 928 928 – Fax +33 (0)5 57 928 929 – contact@ worldcastsystems.com – www.audemat.com
The status bar reminds the user of the input type, as well as the date and time of the beginning of the analysis and the time elapsed since the beginning of the measurements.
Equipment’s IP address.
If the RF input is the active input, RF levels at equipment input are displayed. RF level within the functional range will show a green LED. A red LED indicates the level is too low (< -25 dBm). An orange LED indicates the level is too high (> 11 dBm).
Indicates whether the synchronization is based on the internal clock (Quartz) or on an external source (10 MHz, for instance a GPS).
Type of input used (RF, MPX, AES or ANA).
Date of beginning of the analysis.
Time elapsed since the beginning of the analysis. This time is in days:hours:minutes:seconds.
7.4.2. Analysis tools
Zoom and measurement tools are available for spectrum analysis. These tools are only available on the working graph and are dependent on this graph.
7.4.2.1 Zoom It is possible to zoom on a specific part of the curve, by clicking the left mouse button and dragging to define the zone to be displayed. Click and drag from upper left towards the bottom right.
To go back to the previous zoom, click the left mouse button, drag up to the left and release the button; the graph will then go back to its original scale.
7.4.2.2 Markers It is possible to position two markers. To activate the markers:
1. Click the “Measurement” button.
2. Click on the desired spot on the curve the 1st time to set marker 1.
3. Click a second time on the curve on the desired spot to set marker 2.
4. Click a third time on the graph to delete both markers.
These markers can be linked to a curve (main curve, secondary or maximum curve), or be completely floating (not attached to a curve).
A Max hold function is also available on the RF graph. It memorizes the maximum RF level measured since the beginning of the application or since the last reset.

Modulation Analyzer 2.3.x User Manual – 05/2012
Page 61 Head Office : Parc d’activites Kennedy - 20, avenue Neil Armstrong – F-33700 Bordeaux-Merignac (France) Tel +33 (0)5 57 928 928 – Fax +33 (0)5 57 928 929 – contact@ worldcastsystems.com – www.audemat.com
7.4.3. MPX tab
To access this “realtime measurement” tab, you may also go the "Measures” menu or use the “F1” shortcut.
Diagram showing distribution of measured deviations.
Cumulated MPX.
Time representation of minimal and maximal deviation.
Time representation of the calculated multiplex power (in dB, according to ITU BS412-7 standard).
This graph is the zoom of the selected graph: click on the frames or on first line to see the graph displayed bigger, below. Example in this tab with the “instantaneous MPX”. Note: this window is present in all tabs. Markers and zoom are available to facilitate readings (please refer to section 6.4.2).
Display of data in numerical format for a better interpretation. The cumulated MPX (absolute value or in %) indicates the time ratio during which excursion levels are greater than or equal to 70 kHz.
The Max MPX power value will only appear after one minute of measurements.

Modulation Analyzer 2.3.x User Manual – 05/2012
Page 62 Head Office : Parc d’activites Kennedy - 20, avenue Neil Armstrong – F-33700 Bordeaux-Merignac (France) Tel +33 (0)5 57 928 928 – Fax +33 (0)5 57 928 929 – contact@ worldcastsystems.com – www.audemat.com
7.4.4. Audio tab
To access this “realtime measurement” tab, you may also go the "Measures” menu or use the “F2” shortcut. Refer to section 6.4.2 to learn how to zoom on the graph.
Time representation of positive and negative peaks linked to the Mono signal.
Time representation of positive and negative peaks linked to the Stereo signal.
Time representation of positive and negative peaks linked to Left signal without de-emphasis.
Time representation of positive and negative peaks linked to the Right signal without de-emphasis.
Peak levels of these 4 signals from the beginning of the acquisition or from the last reset.

Modulation Analyzer 2.3.x User Manual – 05/2012
Page 63 Head Office : Parc d’activites Kennedy - 20, avenue Neil Armstrong – F-33700 Bordeaux-Merignac (France) Tel +33 (0)5 57 928 928 – Fax +33 (0)5 57 928 929 – contact@ worldcastsystems.com – www.audemat.com
7.4.5. Sub-carrier tab
To access this “realtime measurement” tab, you may also go the "Measures” menu or use the “F3” shortcut. Refer to section 6.4.2 to learn how to zoom on the graph.
Time representation of positive and negative peaks linked to the Pilot signal.
Time representation of positive and negative peaks linked to the RDS signal.
Time representation of positive and negative peaks linked to the Auxiliary signal (DARC).
Peaks of these 3 signals from the beginning of the acquisition or from the last reset.

Modulation Analyzer 2.3.x User Manual – 05/2012
Page 64 Head Office : Parc d’activites Kennedy - 20, avenue Neil Armstrong – F-33700 Bordeaux-Merignac (France) Tel +33 (0)5 57 928 928 – Fax +33 (0)5 57 928 929 – contact@ worldcastsystems.com – www.audemat.com
7.4.6. Modulation tab
To access this “realtime measurement” tab, you may also go the "Measures” menu or use the “F4” shortcut. Refer to section 6.4.2 to learn how to zoom on the graph.
Level of Multiplex signal components: • Total deviation, • Mono component, • Pilot, • Stereo component (if pilot is detected), • RDS, • Auxiliary (DARC).
Audio level without de-emphasis.
Reminder of the current configuration: reference levels.

Modulation Analyzer 2.3.x User Manual – 05/2012
Page 65 Head Office : Parc d’activites Kennedy - 20, avenue Neil Armstrong – F-33700 Bordeaux-Merignac (France) Tel +33 (0)5 57 928 928 – Fax +33 (0)5 57 928 929 – contact@ worldcastsystems.com – www.audemat.com
7.4.7. Filters tab
To access this “realtime measurement” tab, you may also go the "Measures” menu or use the “F10” shortcut. Refer to section 6.4.2 to learn how to zoom on the graph.
P-P/2 deviation display.
Display of signal levels for filters/detectors as selected in .
Laboratory version only. Display of detected RF frequency (around configured frequency ± 100 kHz). Display of pilot frequency and RDS when those signals are detected. Indication of synchronization RDS pilot / phase difference between these 2 signals.
Display of selected ‘reference’ and ‘observed’ signals over time (In this example, L+R in P-P/2 and L+R in P-P/2 with de-emphasis)
Choice of filters/detectors used for display. Click on the “Relative” button to memorize the current value selected as reference (L+R P-P/2 on the picture) and use it as the new reference. Available filters/detectors associations:
P-P/2
P-P/2 + with de-emphasis
RMS
RMS with de-emphasis
RMS CCIR 468-4 unweighted *
* This filter is only available with the Laboratory version.

Modulation Analyzer 2.3.x User Manual – 05/2012
Page 66 Head Office : Parc d’activites Kennedy - 20, avenue Neil Armstrong – F-33700 Bordeaux-Merignac (France) Tel +33 (0)5 57 928 928 – Fax +33 (0)5 57 928 929 – contact@ worldcastsystems.com – www.audemat.com
7.4.8. Spectrum tab
To access this “realtime measurement” tab, you may also go the "Measures” menu or use the “F5” shortcut.
This tab displays three spectrums simultaneously.
Refer to section 6.4.2 to learn how to zoom or position markers on the graph.
RF channel spectrum before demodulation, with a pass band of ±155 kHz. The spectral resolution is ~390 Hz/pixel.
100 kHz MPX signal spectrum. The spectral resolution is 195 Hz/pixel.
Demodulated left (red) and right (blue) audio spectrums. The graph has 512 dots for a pass band of 25 kHz.
Work panel: marker coordinates and delta in frequency and level.
With the RF and MPX spectrums, the “Max” button display the largest curve while “PH Auto” places a marker at the highest point.
With the audio spectrums, a pull-down menu allows the user to select the de-emphasis level. The default spectrum is for the signal without de-emphasis.

Modulation Analyzer 2.3.x User Manual – 05/2012
Page 67 Head Office : Parc d’activites Kennedy - 20, avenue Neil Armstrong – F-33700 Bordeaux-Merignac (France) Tel +33 (0)5 57 928 928 – Fax +33 (0)5 57 928 929 – contact@ worldcastsystems.com – www.audemat.com
7.4.9. Oscilloscope tab
This option is only available with the Laboratory version
To access this “realtime measurement” tab, you may also go the "Measures” menu or use the “F6” shortcut. Refer to section 6.4.2 to learn how to zoom on the graph.
View of the MPX signal oscilloscope.
View of the synchronized left and right signals oscilloscope.
View of the vectorscope (x = Left / y = Right)
Reminder of levels for the signal displayed.
When the MPX oscilloscope is selected, the following information is displayed:.
If the Audio oscilloscope or the vectorscope is selected, it displays information about
L and R peak, RMS, frequency and period.
For the MPX oscilloscope, choice of edge type. thresholds references and horizontal scale.
For the Audio oscilloscope,
selection of the signal used for synchronization and choice of thresholds and references
For the vectorscope, select the horizontal scale.

Modulation Analyzer 2.3.x User Manual – 05/2012
Page 68 Head Office : Parc d’activites Kennedy - 20, avenue Neil Armstrong – F-33700 Bordeaux-Merignac (France) Tel +33 (0)5 57 928 928 – Fax +33 (0)5 57 928 929 – contact@ worldcastsystems.com – www.audemat.com
7.4.10. Thd tab
This option is only available with the Laboratory version.
To access this “realtime measurement” tab, you may also go the "Measures” menu or use the “F7” shortcut. Refer to section 6.4.2 to learn how to zoom on the graph.
MPX spectrum view
Left audio spectrum view (identical to the Spectrum tab).
Right audio spectrum view (identical to the Spectrum tab).
Level of the first 4 harmonics for each channel.
Detected frequency for each channel and THD 1 and THD+N 2 measurements for each channel with double display: % and dB. The table summarizes levels for the first 4 harmonics for each channel. 1: Thd = Total Harmonic Distortion. 2: Thd+N = Total Harmonic Distortion + Noise.
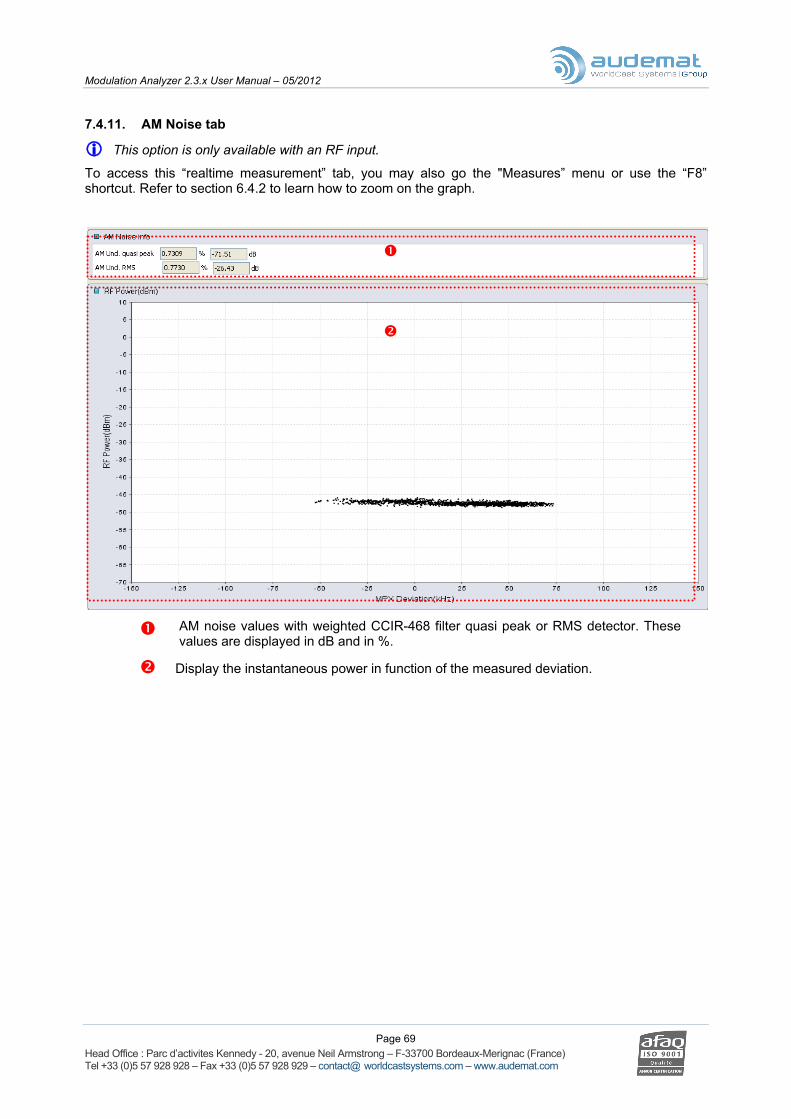
Modulation Analyzer 2.3.x User Manual – 05/2012
Page 69 Head Office : Parc d’activites Kennedy - 20, avenue Neil Armstrong – F-33700 Bordeaux-Merignac (France) Tel +33 (0)5 57 928 928 – Fax +33 (0)5 57 928 929 – contact@ worldcastsystems.com – www.audemat.com
7.4.11. AM Noise tab
This option is only available with an RF input.
To access this “realtime measurement” tab, you may also go the "Measures” menu or use the “F8” shortcut. Refer to section 6.4.2 to learn how to zoom on the graph.
AM noise values with weighted CCIR-468 filter quasi peak or RMS detector. These values are displayed in dB and in %.
Display the instantaneous power in function of the measured deviation.

Modulation Analyzer 2.3.x User Manual – 05/2012
Page 70 Head Office : Parc d’activites Kennedy - 20, avenue Neil Armstrong – F-33700 Bordeaux-Merignac (France) Tel +33 (0)5 57 928 928 – Fax +33 (0)5 57 928 929 – contact@ worldcastsystems.com – www.audemat.com
7.4.12. RDS tab
7.4.12.1 General points To access this “realtime measurement” tab, you may also go the "Measures” menu or use the “F11” shortcut.
All RDS tabs are refreshed simultaneously; this enables the user to view one data display then another with no risk of losing information.
Some tabs have a history feature, with which the user can display all data received since the application was started or since the last reset. This is the case for the following tabs:
o List of AFs
o Hexa group
o ASCII groups
o Radio paging
o TMC
To prevent computer overloading, this history is not visible in real time; data viewing is only enabled by stopping the analyzer (Stop button) (a scroll bar will then appear).
Pressing Stop will stop the whole application and not just the RDS part.
If the RDS analysis is enabled after the measure is launched, it will not be taken into account. Reset to view RDS data. See section 7.3.2 to enable RDS analysis.
Information in sections , , and is available on every tab:

Modulation Analyzer 2.3.x User Manual – 05/2012
Page 71 Head Office : Parc d’activites Kennedy - 20, avenue Neil Armstrong – F-33700 Bordeaux-Merignac (France) Tel +33 (0)5 57 928 928 – Fax +33 (0)5 57 928 929 – contact@ worldcastsystems.com – www.audemat.com
Identifies the station main RDS data: • PI, PS codes, • Traffic information (TA / TP), • Table of characters used, • Information on contents: MS, DI, PTY, PIN, GRPD, PTYN.
Displays RDS error information.
Button for filtering groups and/or blocks: check boxes for groups and blocks to be displayed. By default, every box is checked.
Indication of reception of an A type (red) or B type (blue) group. Red and blue dots on left indicate if the group is filtered or not.

Modulation Analyzer 2.3.x User Manual – 05/2012
Page 72 Head Office : Parc d’activites Kennedy - 20, avenue Neil Armstrong – F-33700 Bordeaux-Merignac (France) Tel +33 (0)5 57 928 928 – Fax +33 (0)5 57 928 929 – contact@ worldcastsystems.com – www.audemat.com
7.4.12.2 General tab
Last decoded AF list. This panel contains: • The number of AFs contained in the list, • The type of method used for sending these frequencies (A or B).
RadioText information: • A/B flag (indication of new RadioText), • Current RadioText, • Previous RadioText.
Decoded RDS date and time.
Slow Labelling Code.
Enhanced Other Network: information on the network’s other stations.

Modulation Analyzer 2.3.x User Manual – 05/2012
Page 73 Head Office : Parc d’activites Kennedy - 20, avenue Neil Armstrong – F-33700 Bordeaux-Merignac (France) Tel +33 (0)5 57 928 928 – Fax +33 (0)5 57 928 929 – contact@ worldcastsystems.com – www.audemat.com
7.4.12.3 Lists of AF tab
List of AFs (Alternative Frequencies) received by the equipment since the beginning of the measure. These frequencies are sorted chronologically.
When printing reports, all AF lists are saved in a text file: af_list.txt, stored in the report directory.
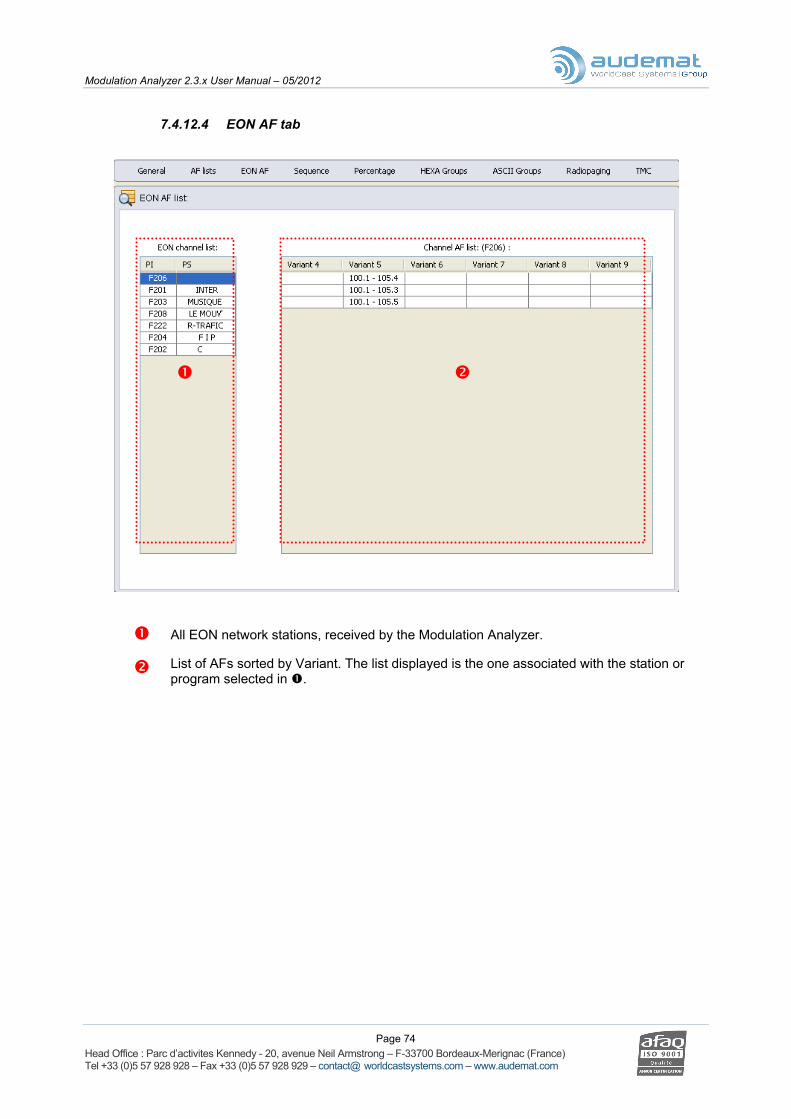
Modulation Analyzer 2.3.x User Manual – 05/2012
Page 74 Head Office : Parc d’activites Kennedy - 20, avenue Neil Armstrong – F-33700 Bordeaux-Merignac (France) Tel +33 (0)5 57 928 928 – Fax +33 (0)5 57 928 929 – contact@ worldcastsystems.com – www.audemat.com
7.4.12.4 EON AF tab
All EON network stations, received by the Modulation Analyzer.
List of AFs sorted by Variant. The list displayed is the one associated with the station or program selected in .

Modulation Analyzer 2.3.x User Manual – 05/2012
Page 75 Head Office : Parc d’activites Kennedy - 20, avenue Neil Armstrong – F-33700 Bordeaux-Merignac (France) Tel +33 (0)5 57 928 928 – Fax +33 (0)5 57 928 929 – contact@ worldcastsystems.com – www.audemat.com
7.4.12.5 Sequence tab
Statistics on the received RDS groups: • Number of groups received over the last minute (or between two 4A
groups if the RDS time and date are being transmitted). • Percentage represented by each group (both A and B variants). • Running total of group count.
RDS groups received, displayed in order of reception: • Red background: type A groups, • Blue background: type B groups, • Grey background: filtered groups.

Modulation Analyzer 2.3.x User Manual – 05/2012
Page 76 Head Office : Parc d’activites Kennedy - 20, avenue Neil Armstrong – F-33700 Bordeaux-Merignac (France) Tel +33 (0)5 57 928 928 – Fax +33 (0)5 57 928 929 – contact@ worldcastsystems.com – www.audemat.com
7.4.12.6 Percentage tab
View of received RDS groups.
• The red bars on the graph represent the proportion of type A groups.
• The blue bars on the graph represent the proportion of type B groups.
• The grey bars on the graph part represent both A&B groups.
Putting the cursor over any grey bar will trigger a popup display of the group number and contents.
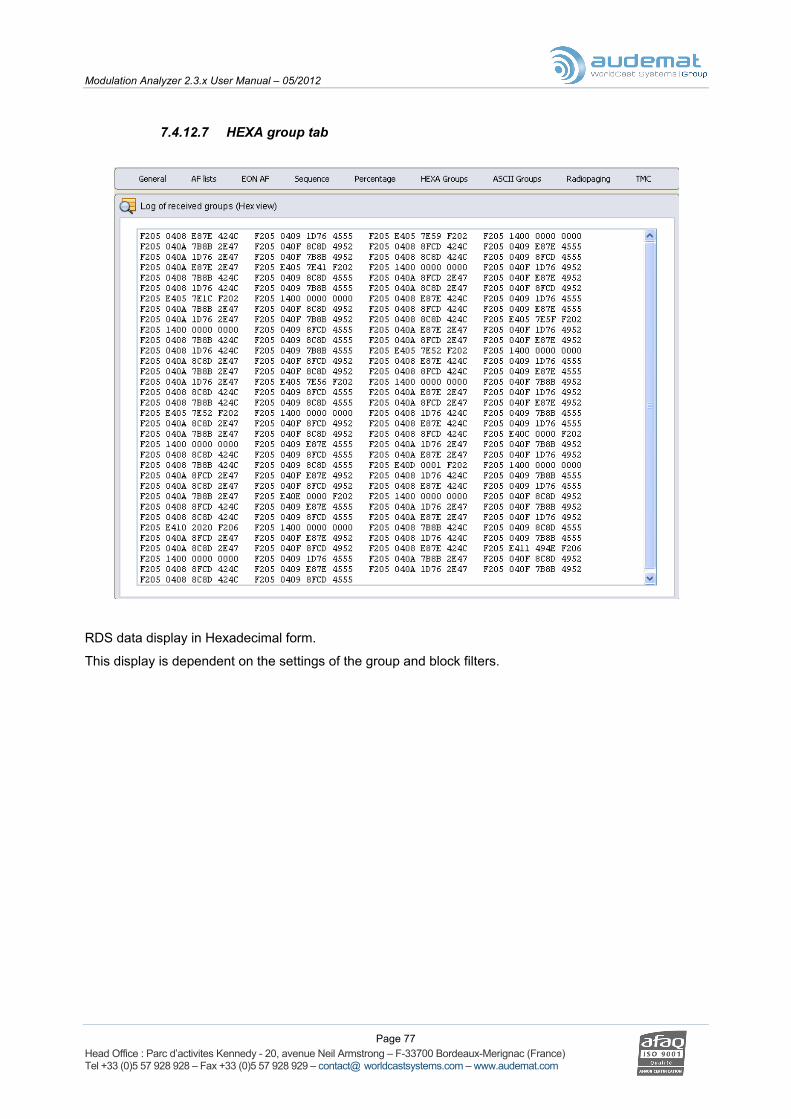
Modulation Analyzer 2.3.x User Manual – 05/2012
Page 77 Head Office : Parc d’activites Kennedy - 20, avenue Neil Armstrong – F-33700 Bordeaux-Merignac (France) Tel +33 (0)5 57 928 928 – Fax +33 (0)5 57 928 929 – contact@ worldcastsystems.com – www.audemat.com
7.4.12.7 HEXA group tab
RDS data display in Hexadecimal form.
This display is dependent on the settings of the group and block filters.

Modulation Analyzer 2.3.x User Manual – 05/2012
Page 78 Head Office : Parc d’activites Kennedy - 20, avenue Neil Armstrong – F-33700 Bordeaux-Merignac (France) Tel +33 (0)5 57 928 928 – Fax +33 (0)5 57 928 929 – contact@ worldcastsystems.com – www.audemat.com
7.4.12.8 ASCII group tab
RDS data display in ASCII form.
This display is dependent on the settings of the group and block filters.

Modulation Analyzer 2.3.x User Manual – 05/2012
Page 79 Head Office : Parc d’activites Kennedy - 20, avenue Neil Armstrong – F-33700 Bordeaux-Merignac (France) Tel +33 (0)5 57 928 928 – Fax +33 (0)5 57 928 929 – contact@ worldcastsystems.com – www.audemat.com
7.4.12.9 Radio paging tab
Radio Paging linked data display.
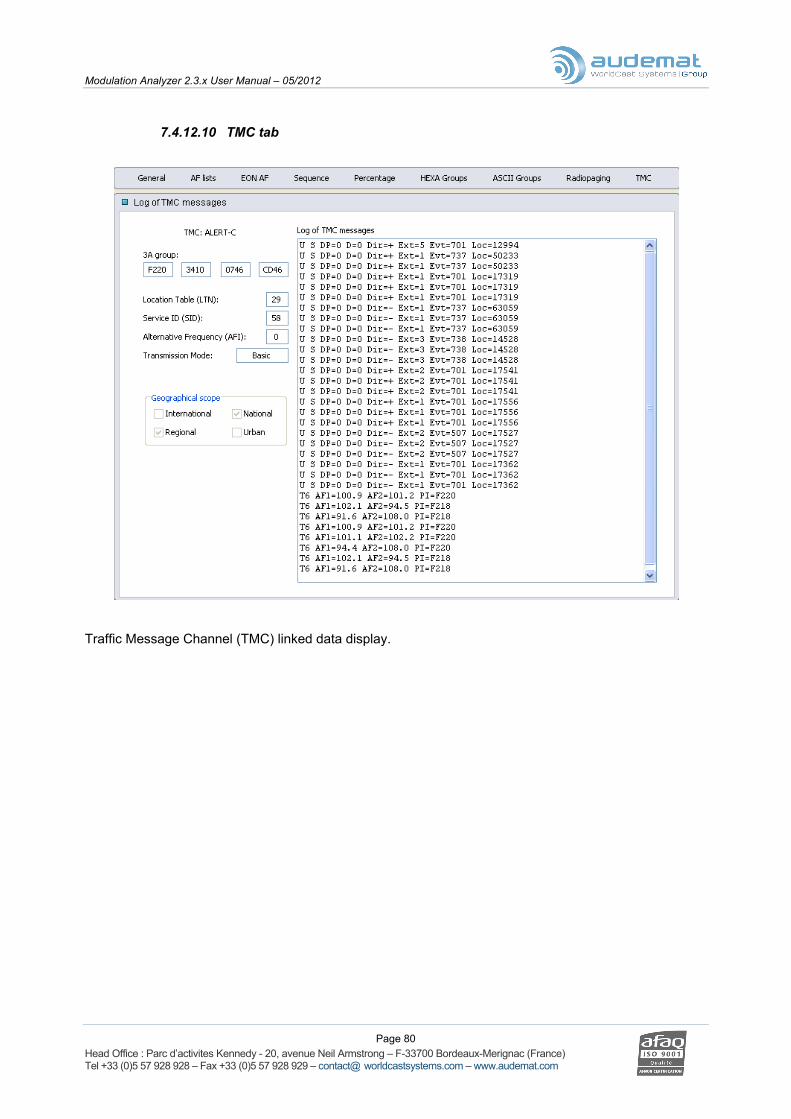
Modulation Analyzer 2.3.x User Manual – 05/2012
Page 80 Head Office : Parc d’activites Kennedy - 20, avenue Neil Armstrong – F-33700 Bordeaux-Merignac (France) Tel +33 (0)5 57 928 928 – Fax +33 (0)5 57 928 929 – contact@ worldcastsystems.com – www.audemat.com
7.4.12.10 TMC tab
Traffic Message Channel (TMC) linked data display.

Modulation Analyzer 2.3.x User Manual – 05/2012
Page 81 Head Office : Parc d’activites Kennedy - 20, avenue Neil Armstrong – F-33700 Bordeaux-Merignac (France) Tel +33 (0)5 57 928 928 – Fax +33 (0)5 57 928 929 – contact@ worldcastsystems.com – www.audemat.com
7.4.13. Automation tab
This option is only available with the Laboratory version.
If the 20 kHz filter is selection on an RF or MPX input, pilot and RDS are not filtered: displayed measurements consequently include those 2 signals.
To access this “automatic measurement” tab, you may also go the "Measures” menu or use the “F9” shortcut.
On start up, an automatic check may detect an inversion of the left and right inputs, a warning message may then pop up. There are three possible scenarios:
• The left and right cables are switched,
• One of the cables is not connected,
• The input selected for the analysis is not connected,
• The 20 kHz filter has been selected for an RF or MPX input.
Bandwidth level in dBr for each channel.
Signal to noise ratio in dBr: Total noise – Bandwidth.
Total Harmonic Distortion + Noise for each channel in dBr.
Injects a signal on one channel and measures the level on the other in dBr.
Select the type of flow. The selection varies depending on the view.
Measurement processing progress bar.

Modulation Analyzer 2.3.x User Manual – 05/2012
Page 82 Head Office : Parc d’activites Kennedy - 20, avenue Neil Armstrong – F-33700 Bordeaux-Merignac (France) Tel +33 (0)5 57 928 928 – Fax +33 (0)5 57 928 929 – contact@ worldcastsystems.com – www.audemat.com
The points of the curves can be either red or blue. When blue, the measurement is valid, ie. The transmitted frequency is equal to the measured frequency and with the THD+N, since the calculation takes longer, the value is confirmed.
7.4.14. Summary tab
To access this tab, you may also go the "Measures” menu or use the “F12” shortcut.
When measurements are being carried out, it is not possible to access the equipment’s configuration tab; measurements need to be stopped to modify configuration.
However, this page is a summary of the equipment’s current configuration. It groups all parameters and, therefore, enables input, output and reference level settings to be consulted without modifying them.

Modulation Analyzer 2.3.x User Manual – 05/2012
Page 83 Head Office : Parc d’activites Kennedy - 20, avenue Neil Armstrong – F-33700 Bordeaux-Merignac (France) Tel +33 (0)5 57 928 928 – Fax +33 (0)5 57 928 929 – contact@ worldcastsystems.com – www.audemat.com
7.5. Creating Reports
In realtime measurement mode, this button enables measurement reports to be created from:
- RDS analysis
- Audio analysis
- Spectrum analysis
- MPX power analysis
In automatic measurement mode, the report includes measurements as selected in the configuration: bandwidth, C/N, crosstalk and/or THDN.
The button is enabled only if data has been recorded since the beginning of the session.
Make sure a word processor software and directory have been selected.
Several report models are supplied, automatically integrating values and graphs relative to a specific type of measurement. They have been created to be compatible with Microsoft Word 2003 (or more recent).
Report Models can be found in the Modulation Analyzer installation directory. They can be modified to insert a company logo or to be compatible with other word processors. If you wish to modify the existing models, we recommend you copy them into the Models directory as set in the Report configuration page.
Information regarding unit, environment, date, configuration, inputs, references and more, printed on pages 2 and 3 of standard reports, is required to guarantee report validity and must be included in all custom reports.
To generate a report, click on the “Report” button, the “File” ’Report’ menu or the shortcut ‘p’.

Modulation Analyzer 2.3.x User Manual – 05/2012
Page 84 Head Office : Parc d’activites Kennedy - 20, avenue Neil Armstrong – F-33700 Bordeaux-Merignac (France) Tel +33 (0)5 57 928 928 – Fax +33 (0)5 57 928 929 – contact@ worldcastsystems.com – www.audemat.com
d will then be launched to automatically merge the collected data
es and images will be integrated thanks to the word-processing software mass mailing
Click on one of the report button to open it.
ns…” buttons of the safety warning on top of the window, and select “Enable this content”.
will indicate that an SQL command will be executed upon opening the document. Click
acro”; in Word be used:
images, or
‘incorporate’ to place the images directly in the report.
d in the directory set in the options, in a sub-folder with a unique time stamp name: yyyymmddhhmmss.
The word-processing software selectewith all Modulation Analyzer models.
When generating the report, the application will freeze and all the tabs, graphs and minimal / maximal values will be archived in the selected directory. As for graphs with markers, these will also be saved. These valufunctions.
It may be necessary to modify the word processor security level so as to allow macro activation. In Microsoft Word 2003, go to the menu « Tools » ’Macros’ ‘Security’ Security level tab. In Microsoft Word 2007, click the “Optio
An alert message “OK” to continue.
For graphics to appear in the report, in Word 2003, go the menu “Tools” “Macros” ”M2007, select the “Developer” tab and click “Macro” (or Alt + F8). Two macros can
‘refresh’ to update links between the report file and the
All reports and associated screen captures are store

Modulation Analyzer 2.3.x User Manual – 05/2012
Page 85 Head Office : Parc d’activites Kennedy - 20, avenue Neil Armstrong – F-33700 Bordeaux-Merignac (France) Tel +33 (0)5 57 928 928 – Fax +33 (0)5 57 928 929 – contact@ worldcastsystems.com – www.audemat.com
7.6. Managing captures Captures can be done from the unit front panel application (see section 5.3.5). These captures can then be downloaded to the PC and viewed via the remote application so as to create automatic reports.
The following procedures may only be done if captures have already been taken from the front panel application. Please make sure the capture is completed before downloading or the capture file may get corrupted (wait for the ‘RUN’ LED to turn off, about 10 s).
Captures commands can be found in the “File” menu.
7.6.1. Download one or more captures
The list of available captures is displayed in a window in tree form. There is one folder per day (yyyymmdd).
Display details for a folder to see captures made that day. Names of capture files include date and time and the .mac extension.
Check the captures you wish to download. Check the folder if you want all captures for one day.
Click the Download button to retrieve the files from the unit to the PC, or the Display button to view the capture right away.
Captures are saved in the directory as set in the Capture configuration page (see section 7.2.8).
7.6.2. Displaying a capture
Once a capture has been downloaded, the application can read it.
Simply select the .mac file from the “Open” window. Capture values are displayed. Proceed as with real time to generate reports.
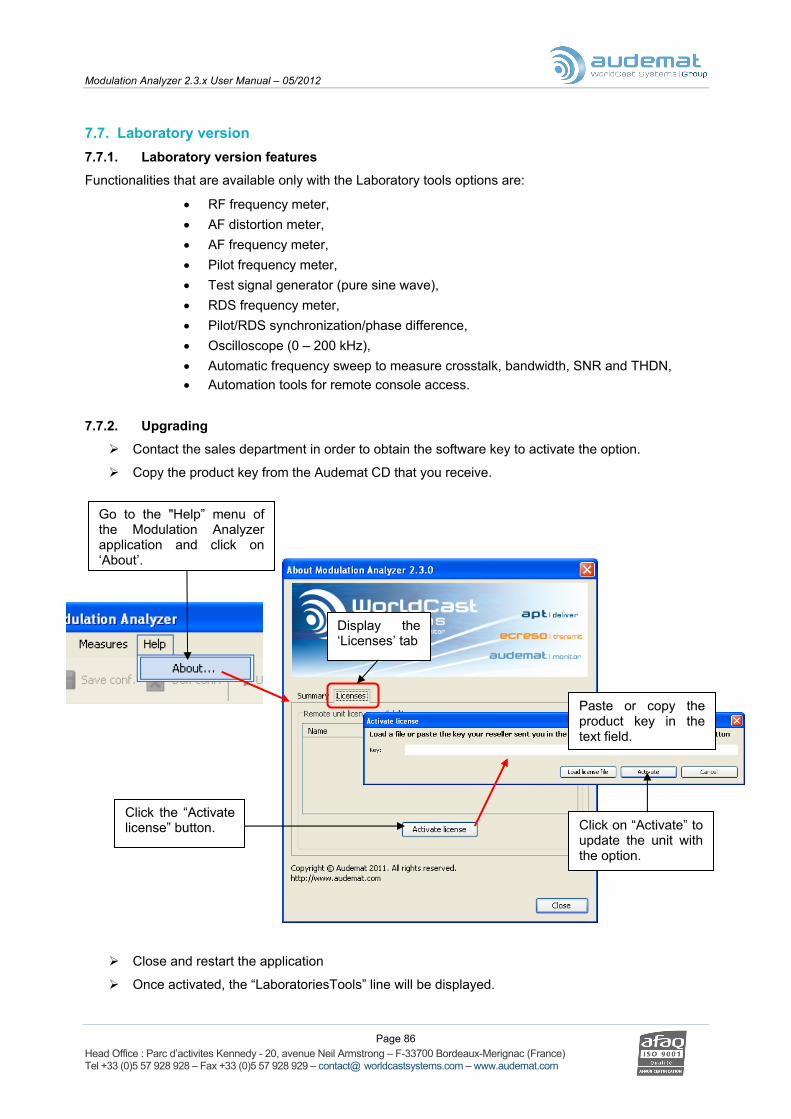
Modulation Analyzer 2.3.x User Manual – 05/2012
Page 86 Head Office : Parc d’activites Kennedy - 20, avenue Neil Armstrong – F-33700 Bordeaux-Merignac (France) Tel +33 (0)5 57 928 928 – Fax +33 (0)5 57 928 929 – contact@ worldcastsystems.com – www.audemat.com
7.7. Laboratory version 7.7.1. Laboratory version features
Functionalities that are available only with the Laboratory tools options are:
• RF frequency meter, • AF distortion meter, • AF frequency meter, • Pilot frequency meter, • Test signal generator (pure sine wave), • RDS frequency meter, • Pilot/RDS synchronization/phase difference, • Oscilloscope (0 – 200 kHz), • Automatic frequency sweep to measure crosstalk, bandwidth, SNR and THDN, • Automation tools for remote console access.
7.7.2. Upgrading
Contact the sales department in order to obtain the software key to activate the option.
Copy the product key from the Audemat CD that you receive.
Click on “Activate” to update the unit with the option.
Paste or copy the product key in the text field.
Display the ‘Licenses’ tab
Click the “Activate license” button.
Go to the "Help” menu of the Modulation Analyzer application and click on ‘About’.
Close and restart the application
Once activated, the “LaboratoriesTools” line will be displayed.

Modulation Analyzer 2.3.x User Manual – 05/2012
Page 87 Head Office : Parc d’activites Kennedy - 20, avenue Neil Armstrong – F-33700 Bordeaux-Merignac (France) Tel +33 (0)5 57 928 928 – Fax +33 (0)5 57 928 929 – contact@ worldcastsystems.com – www.audemat.com
8. AUTOMATION TOOLS
Automation tools are only available with the Laboratory version.
Automation tools enable a remote access to the Modulation Analyzer via a Telnet connection, without using the java application.
8.1. Connection Open a Telnet application, such as HyperTerminal.
Set connection parameters:
IP address
Unit’s
Port: 4321
Connection type: TCP/IP

Modulation Analyzer 2.3.x User Manual – 05/2012
Page 88 Head Office : Parc d’activites Kennedy - 20, avenue Neil Armstrong – F-33700 Bordeaux-Merignac (France) Tel +33 (0)5 57 928 928 – Fax +33 (0)5 57 928 929 – contact@ worldcastsystems.com – www.audemat.com
It may be necessary to modify properties:
Click on the properties button
Then on the “ASCII Setup” button.
Check both boxes for your commands to be readable.
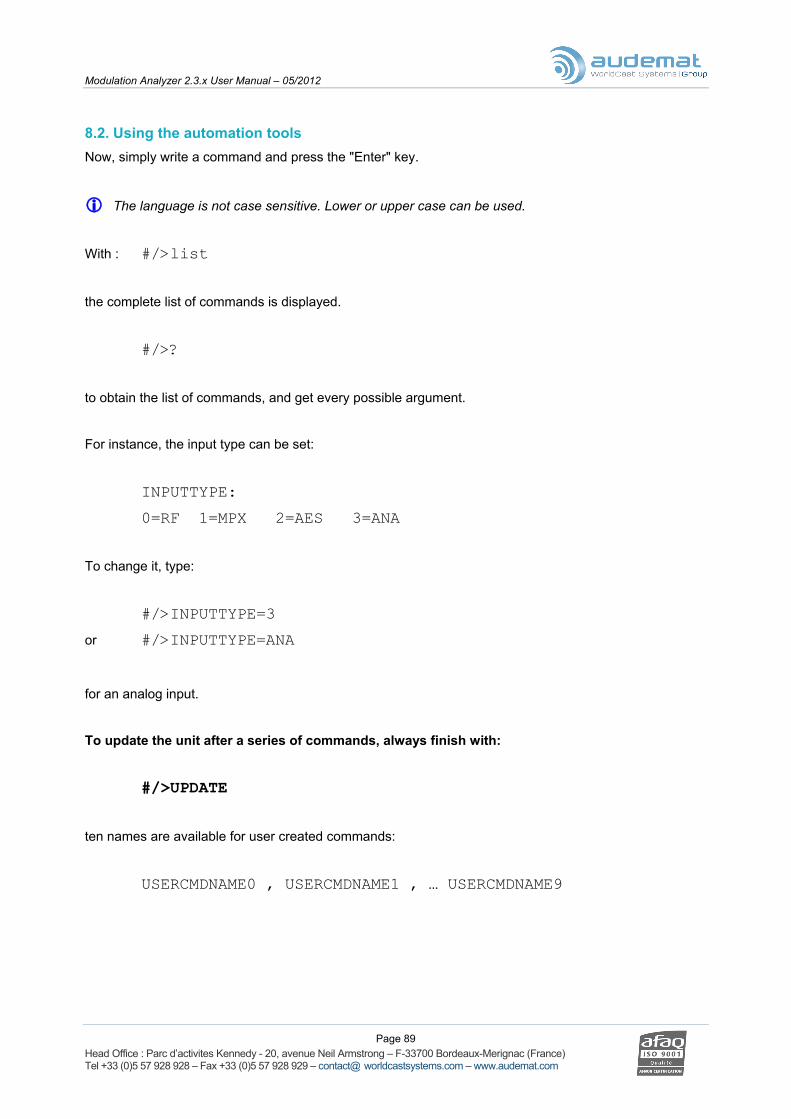
Modulation Analyzer 2.3.x User Manual – 05/2012
Page 89 Head Office : Parc d’activites Kennedy - 20, avenue Neil Armstrong – F-33700 Bordeaux-Merignac (France) Tel +33 (0)5 57 928 928 – Fax +33 (0)5 57 928 929 – contact@ worldcastsystems.com – www.audemat.com
8.2. Using the automation tools Now, simply write a command and press the "Enter" key.
The language is not case sensitive. Lower or upper case can be used.
With : #/>list
the complete list of commands is displayed.
#/>?
to obtain the list of commands, and get every possible argument.
For instance, the input type can be set:
INPUTTYPE:
0=RF 1=MPX 2=AES 3=ANA
To change it, type:
#/>INPUTTYPE=3
or #/>INPUTTYPE=ANA
for an analog input.
To update the unit after a series of commands, always finish with:
#/>UPDATE
ten names are available for user created commands:
USERCMDNAME0 , USERCMDNAME1 , … USERCMDNAME9

Modulation Analyzer 2.3.x User Manual – 05/2012
Page 90 Head Office : Parc d’activites Kennedy - 20, avenue Neil Armstrong – F-33700 Bordeaux-Merignac (France) Tel +33 (0)5 57 928 928 – Fax +33 (0)5 57 928 929 – contact@ worldcastsystems.com – www.audemat.com
They must be associated with:
USERCMDLIST0 , USERCMDLIST1 , … USERCMDLIST9
so as to define the commands.
Example:
#/>USERCMDNAME3=MACOMMANDE
#/>USERCMDLIST3=FREQ=96.8;SETDRL=STEREO;UPDATE
#/>MACOMMANDE
The command has been named, defined and executed. The response will be:
OK
OK
OK
User commands can be deactivated:
#/>USERCMDLIST3=
8.3. A final note Commands are recorded within the equipment; it is therefore possible to connect from a different machine and use previously set user commands..
It is possible to write a script to automate a series of frequently used commands: Each command must be typed on a new line. Copy the entire script in the Telnet application text window to be able to execute it.
Communication with the Modulation Analyzer is therefore faster.
A list of available commands is available in Appendix A.

Modulation Analyzer 2.3.x User Manual – 05/2012
Page 91 Head Office : Parc d’activites Kennedy - 20, avenue Neil Armstrong – F-33700 Bordeaux-Merignac (France) Tel +33 (0)5 57 928 928 – Fax +33 (0)5 57 928 929 – contact@ worldcastsystems.com – www.audemat.com
APPENDIX A: AUTOMATION COMMAND LIST
! Don’t forget to use the UPDATE command when you wish to modify values (see section 8.2).
A.1. Global commands
? List of all commands - detailed mode LIST List of all commands QUIT Exit UPDATE Save all changes USERCMDNAME<0-9> Set or read user command name USERCMDLIST<0-9> Set or read user list of commands
CONFNUM Select the configuration stored in the equipment 0-9 (if set in the application)
A.2. Set RF frequency
FREQ Select RF frequency to tune 97.5-108.0 MHz
A.3. Set DEEMPHASIS Select the de-emphasis value
0=50µs 1=75µs
AUDIOFILTER Select the filter 0=15 kHz 1=20 kHz
A.4. Set Input/output matrix
INPUTTYPE Select input measurement 0=RF 1=MPX 2=AES 3=ANA
TXOUTPUT1 Select output signal on TX1 (MPX Composite) 0=NONE 1=MPX 2=PILOT 3=RDS 4=SINE WAVE1 5=SINE WAVE2 6=MPXGEN
TXOUTPUT2 Select output signal on TX2 (AUX) 0=NONE 1=MPX 2=PILOT 3=RDS 4=SINE WAVE1 5=SINE WAVE2

Modulation Analyzer 2.3.x User Manual – 05/2012
Page 92 Head Office : Parc d’activites Kennedy - 20, avenue Neil Armstrong – F-33700 Bordeaux-Merignac (France) Tel +33 (0)5 57 928 928 – Fax +33 (0)5 57 928 929 – contact@ worldcastsystems.com – www.audemat.com
AUDIOOUTPUT1 Select output signal on Audio1 0=NONE 1=LEFT 2=RIGHT 3=M 4=S 5=LEFTD 6=RIGHTD 7=SINE WAVE1 8=SINE WAVE2
AUDIOOUTPUT2 Select output signal on Audio2 0=NONE 1=LEFT 2=RIGHT 3=M 4=S 5=LEFTD 6=RIGHTD 7=SINE WAVE1 8=SINE WAVE2
HEADOUTPUT Select output signal on HeadPhone 0=LR 1=MS 2=MM 3=LRD 4=SINE WAVE1 5=SINE WAVE2
A.5. Set AF Generator
RMSDBRLEVEL Set generator level -50.00 – 6.00 dB SIN0FREQ Set sine wave1 frequency 10.00 – 90000.00 Hz SIN1FREQ Set sine wave2 frequency 10.00 – 90000.00 Hz
A.6. Reference levels
MPXREFLEVEL Select MPX input/output level ** -12 ; 12 dBu AFREFLEVEL Select Audio input/output level ** -12 ; 12 dBu AESREFLEVEL Select AES input/output level ** -25 ; 0 dBFS
** Multiply by 10 the value you wish to set. Example: enter 68 for 6.8
SETDRL Select modulation standard to use 0=MONO 1=MONO+R 2=MONO+S 3=MONO+R+S 4=STEREO 5=STEREO+R 6=STEREO+S 7=STEREO+R+S 8=AUTO
CURRENTDRL Read current modulation standard (useful if in auto mode)

Modulation Analyzer 2.3.x User Manual – 05/2012
Page 93 Head Office : Parc d’activites Kennedy - 20, avenue Neil Armstrong – F-33700 Bordeaux-Merignac (France) Tel +33 (0)5 57 928 928 – Fax +33 (0)5 57 928 929 – contact@ worldcastsystems.com – www.audemat.com
A.7. Set references deviation for each modulation standard A.7.1. Set MPX Level reference for each modulation standard
REFMONO_MPX Mono mode * REFMONORDS_MPX Mono mode with RDS * REFMONOAUX_MPX Mono mode with AUX * REFMONORDSAUX_MPX Mono mode with RDS and AUX * REFSTEREO_MPX Stereo mode * REFSTEREORDS_MPX Stereo mode with RDS * REFSTEREOAUX_MPX Stereo mode with AUX * REFSTEREORDSAUX_MPX Stereo mode with RDS and AUX *
* Multiply by 100 the value you wish to set. Example: enter 682 for 6.82
A.7.2. Set Pilot Level reference for each modulation standard
REFSTEREO_PILOT Stereo mode * REFSTEREORDS_PILOT Stereo mode with RDS * REFSTEREOAUX_PILOT Stereo mode with AUX * REFSTEREORDSAUX_PILOT Stereo mode with RDS and AUX *
* Multiply by 100 the value you wish to set. Example: enter 682 for 6.82
A.7.3. Set RDS Level reference for each modulation standard
REFMONORDS_RDS Mono mode with RDS ** REFMONORDSAUX_RDS Mono mode with RDS and AUX ** REFSTEREORDS_RDS Stereo modewith RDS ** REFSTEREORDSAUX_RDS Stereo modewith RDS and AUX **
** Multiply by 10 the value you wish to set. Example: enter 68 for 6.8
A.7.4. Set AUX Level reference for each modulation standard
REFMONOAUX_AUX Mono mode with AUX ** REFMONORDSAUX_AUX Mono mode with RDS and AUX ** REFSTEREOAUX_AUX Stereo mode with AUX ** REFSTEREORDSAUX_AUX Stereo mode with RDS and AUX **
** Multiply by 10 the value you wish to set. Example: enter 68 for 6.8
A.8. Get versions
VERSION_DSP1 Show DSP1 software version VERSION_DSP2 Show DSP2 software version VERSION_SOFT Show embedded software version VERSION_HARD Show hardware version SERIALNUMBER Show equipment serial number
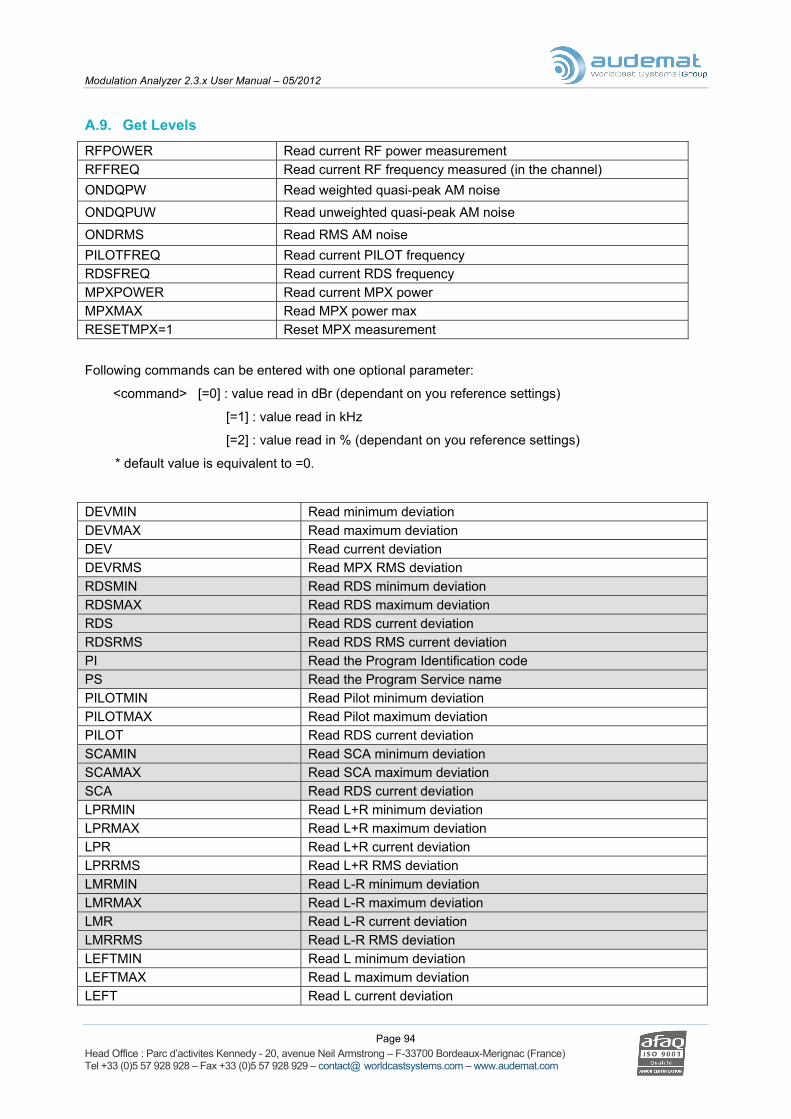
Modulation Analyzer 2.3.x User Manual – 05/2012
Page 94 Head Office : Parc d’activites Kennedy - 20, avenue Neil Armstrong – F-33700 Bordeaux-Merignac (France) Tel +33 (0)5 57 928 928 – Fax +33 (0)5 57 928 929 – contact@ worldcastsystems.com – www.audemat.com
A.9. Get Levels
RFPOWER Read current RF power measurement RFFREQ Read current RF frequency measured (in the channel) ONDQPW Read weighted quasi-peak AM noise
ONDQPUW Read unweighted quasi-peak AM noise
ONDRMS Read RMS AM noise PILOTFREQ Read current PILOT frequency RDSFREQ Read current RDS frequency MPXPOWER Read current MPX power MPXMAX Read MPX power max RESETMPX=1 Reset MPX measurement
Following commands can be entered with one optional parameter:
<command> [=0] : value read in dBr (dependant on you reference settings)
[=1] : value read in kHz
[=2] : value read in % (dependant on you reference settings)
* default value is equivalent to =0.
DEVMIN Read minimum deviation DEVMAX Read maximum deviation DEV Read current deviation DEVRMS Read MPX RMS deviation RDSMIN Read RDS minimum deviation RDSMAX Read RDS maximum deviation RDS Read RDS current deviation RDSRMS Read RDS RMS current deviation PI Read the Program Identification code PS Read the Program Service name PILOTMIN Read Pilot minimum deviation PILOTMAX Read Pilot maximum deviation PILOT Read RDS current deviation SCAMIN Read SCA minimum deviation SCAMAX Read SCA maximum deviation SCA Read RDS current deviation LPRMIN Read L+R minimum deviation LPRMAX Read L+R maximum deviation LPR Read L+R current deviation LPRRMS Read L+R RMS deviation LMRMIN Read L-R minimum deviation LMRMAX Read L-R maximum deviation LMR Read L-R current deviation LMRRMS Read L-R RMS deviation LEFTMIN Read L minimum deviation LEFTMAX Read L maximum deviation LEFT Read L current deviation
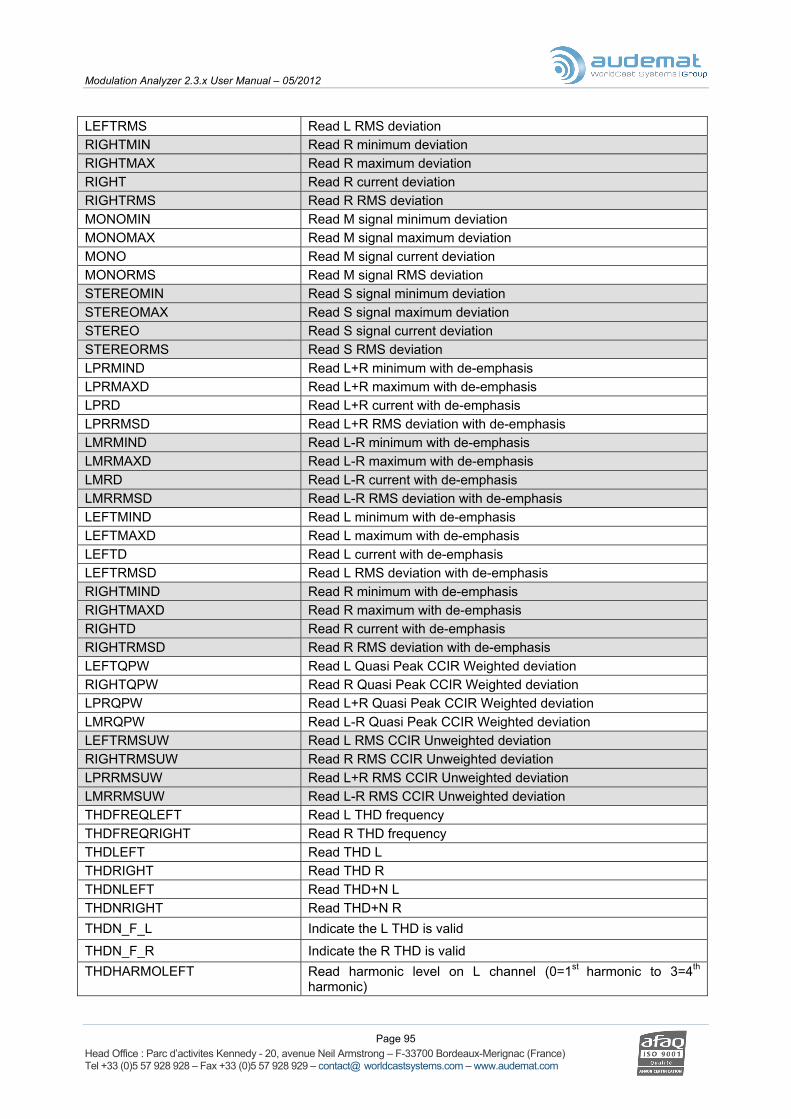
Modulation Analyzer 2.3.x User Manual – 05/2012
Page 95 Head Office : Parc d’activites Kennedy - 20, avenue Neil Armstrong – F-33700 Bordeaux-Merignac (France) Tel +33 (0)5 57 928 928 – Fax +33 (0)5 57 928 929 – contact@ worldcastsystems.com – www.audemat.com
LEFTRMS Read L RMS deviation RIGHTMIN Read R minimum deviation RIGHTMAX Read R maximum deviation RIGHT Read R current deviation RIGHTRMS Read R RMS deviation MONOMIN Read M signal minimum deviation MONOMAX Read M signal maximum deviation MONO Read M signal current deviation MONORMS Read M signal RMS deviation STEREOMIN Read S signal minimum deviation STEREOMAX Read S signal maximum deviation STEREO Read S signal current deviation STEREORMS Read S RMS deviation LPRMIND Read L+R minimum with de-emphasis LPRMAXD Read L+R maximum with de-emphasis LPRD Read L+R current with de-emphasis LPRRMSD Read L+R RMS deviation with de-emphasis LMRMIND Read L-R minimum with de-emphasis LMRMAXD Read L-R maximum with de-emphasis LMRD Read L-R current with de-emphasis LMRRMSD Read L-R RMS deviation with de-emphasis LEFTMIND Read L minimum with de-emphasis LEFTMAXD Read L maximum with de-emphasis LEFTD Read L current with de-emphasis LEFTRMSD Read L RMS deviation with de-emphasis RIGHTMIND Read R minimum with de-emphasis RIGHTMAXD Read R maximum with de-emphasis RIGHTD Read R current with de-emphasis RIGHTRMSD Read R RMS deviation with de-emphasis LEFTQPW Read L Quasi Peak CCIR Weighted deviation RIGHTQPW Read R Quasi Peak CCIR Weighted deviation LPRQPW Read L+R Quasi Peak CCIR Weighted deviation LMRQPW Read L-R Quasi Peak CCIR Weighted deviation LEFTRMSUW Read L RMS CCIR Unweighted deviation RIGHTRMSUW Read R RMS CCIR Unweighted deviation LPRRMSUW Read L+R RMS CCIR Unweighted deviation LMRRMSUW Read L-R RMS CCIR Unweighted deviation THDFREQLEFT Read L THD frequency THDFREQRIGHT Read R THD frequency THDLEFT Read THD L THDRIGHT Read THD R THDNLEFT Read THD+N L THDNRIGHT Read THD+N R THDN_F_L Indicate the L THD is valid
THDN_F_R Indicate the R THD is valid THDHARMOLEFT Read harmonic level on L channel (0=1st harmonic to 3=4th
harmonic)
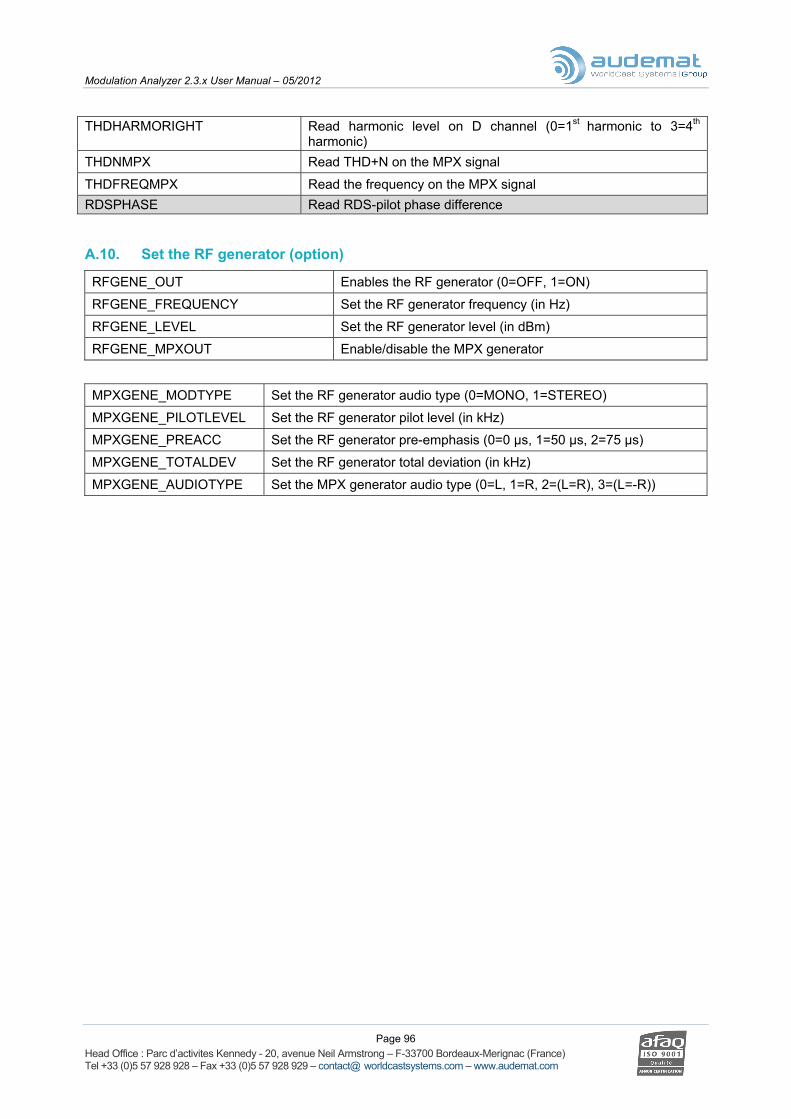
Modulation Analyzer 2.3.x User Manual – 05/2012
Page 96 Head Office : Parc d’activites Kennedy - 20, avenue Neil Armstrong – F-33700 Bordeaux-Merignac (France) Tel +33 (0)5 57 928 928 – Fax +33 (0)5 57 928 929 – contact@ worldcastsystems.com – www.audemat.com
THDHARMORIGHT Read harmonic level on D channel (0=1st harmonic to 3=4th
harmonic) THDNMPX Read THD+N on the MPX signal
THDFREQMPX Read the frequency on the MPX signal RDSPHASE Read RDS-pilot phase difference
A.10. Set the RF generator (option)
RFGENE_OUT Enables the RF generator (0=OFF, 1=ON)
RFGENE_FREQUENCY Set the RF generator frequency (in Hz)
RFGENE_LEVEL Set the RF generator level (in dBm)
RFGENE_MPXOUT Enable/disable the MPX generator
MPXGENE_MODTYPE Set the RF generator audio type (0=MONO, 1=STEREO)
MPXGENE_PILOTLEVEL Set the RF generator pilot level (in kHz)
MPXGENE_PREACC Set the RF generator pre-emphasis (0=0 µs, 1=50 µs, 2=75 µs)
MPXGENE_TOTALDEV Set the RF generator total deviation (in kHz)
MPXGENE_AUDIOTYPE Set the MPX generator audio type (0=L, 1=R, 2=(L=R), 3=(L=-R))
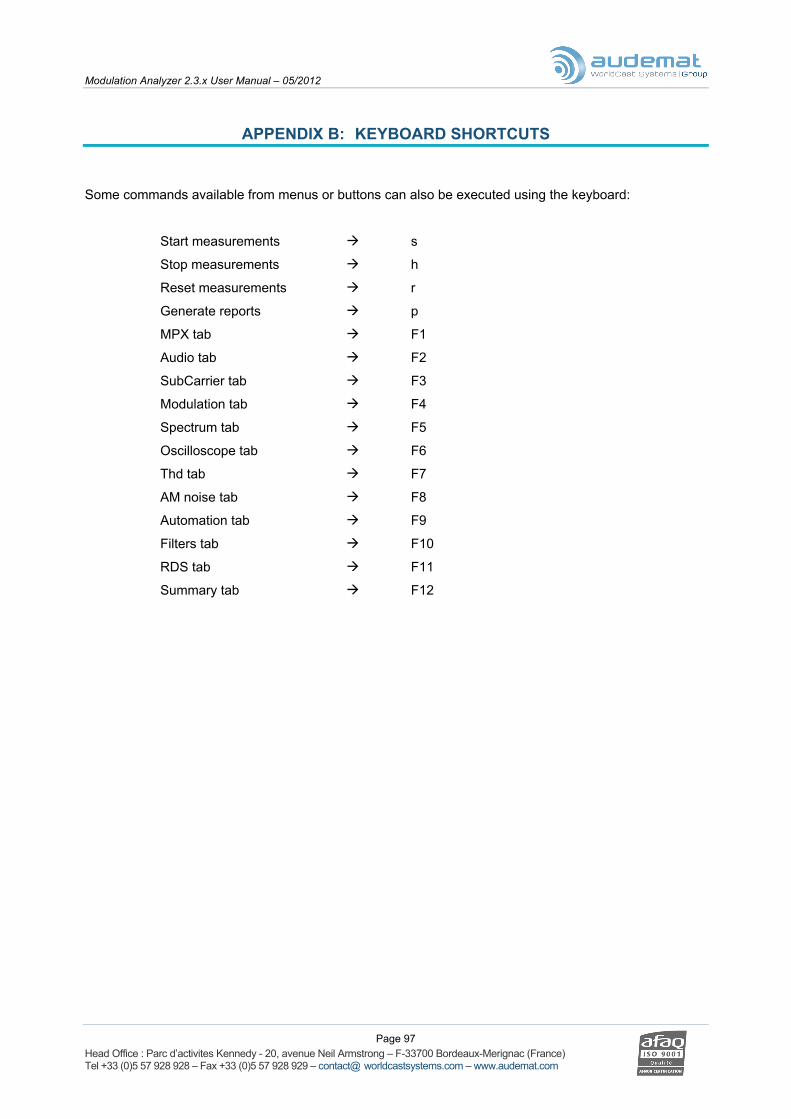
Modulation Analyzer 2.3.x User Manual – 05/2012
Page 97 Head Office : Parc d’activites Kennedy - 20, avenue Neil Armstrong – F-33700 Bordeaux-Merignac (France) Tel +33 (0)5 57 928 928 – Fax +33 (0)5 57 928 929 – contact@ worldcastsystems.com – www.audemat.com
APPENDIX B: KEYBOARD SHORTCUTS
Some commands available from menus or buttons can also be executed using the keyboard:
Start measurements s
Stop measurements h
Reset measurements r
Generate reports p
MPX tab F1
Audio tab F2
SubCarrier tab F3
Modulation tab F4
Spectrum tab F5
Oscilloscope tab F6
Thd tab F7
AM noise tab F8
Automation tab F9
Filters tab F10
RDS tab F11
Summary tab F12

Modulation Analyzer 2.3.x User Manual – 05/2012
Page 98 Head Office : Parc d’activites Kennedy - 20, avenue Neil Armstrong – F-33700 Bordeaux-Merignac (France) Tel +33 (0)5 57 928 928 – Fax +33 (0)5 57 928 929 – contact@ worldcastsystems.com – www.audemat.com
APPENDIX C: GLOSSARY
C.1. RDS AF Alternative Frequency: transmitter frequencies from an encoded station in
digital list form. Two transmission methods are possible: method A (a single list of 25 frequencies) or method B (list of frequency pairs)
Code Table or Character Table
Alphanumeric character table used with radiotext, radio paging and PTYN. Three tables are defined by the RDS standards.
DI Decoder Identification: a digital function which enables an RDS receiver’s audio level to be adjusted according to the type of received audio (mono, stereo ...).
EON Enhanced Other Network: a digital function which enables an RDS station to broadcast RDS parameters to other stations. The following EON codes are used nowadays:
• EON-PI: broadcasting PI identity from another station. • EON-PS: broadcasting the name from another station. • EON-TP: if the flag is at 1, it indicates that the other station is likely to
broadcast traffic information. • EON-TA: switches RDS receivers onto the local frequency of the other
station when it broadcasts traffic information. • EON-AF: broadcasts the list of alternate network frequencies from the
other station. • EON-PIN: broadcasts the time and day of the other station’s program. • EON-PTY: broadcasts the other station’s program types.
EWS Emergency Warning System: an emergency transmission system for alerting
the population should there be any exceptional events, jeopardizing security (storms, a cyclone, earthquake, serious industrial accidents ...). This means of alert used exclusively by Civil Security organizations is developed primarily in geographical areas of high risk (overseas, seismic regions).
GRPD See TNGD.
IH InHouse Transmission of data reserved for broadcasters’ internal needs (urban remote display, remote monitoring, various controlling...).
M/S Music/Speech: a digital flag which automatically modifies an RDS receiver’s audio volume level according to the broadcast program (logical state 1 = musical program, logical state 0 = spoken program).
ODA Open Data Application: a system transmitting any data whose format is free and for which a normalizing procedure is not necessary.
PI Program Identification: a code identifying the received station
PIN Program Item Number: a digital code indicating the time and day of broadcast programs.
PS Program Service name: a station name of 8 characters
Modulation Analyzer 2.3.x User Manual – 05/2012
Page 99 Head Office : Parc d’activites Kennedy - 20, avenue Neil Armstrong – F-33700 Bordeaux-Merignac (France) Tel +33 (0)5 57 928 928 – Fax +33 (0)5 57 928 929 – contact@ worldcastsystems.com – www.audemat.com
PTY Program TYpe: a function for identifying types of programs broadcast by an RDS station.
PTYN
Program TYpe Name: a supplement to program type (PTY), specifying its nature using an 8 character alphanumeric string.
RP Radio Paging: software configuration to broadcast digital data. The transmission protocol is identified with some 1A group bits.
RT Radio Text: a function which enables text messages to be broadcast in groups of 64 characters. The RDS receiver must be equipped with a specific display. The RT function cannot be used on car radios as road safety commissions have forbidden its use on board a vehicle. Only home RDS receivers can have the advantage of this radio text system.
TA Traffic Announcement: a digital flag which instantaneously switches an RDS receiver onto road information reports. At the end of the report, the receiver will automatically go back to its former operating state.
TDC Transparent Data Channel: a transmission path which enables the broadcaster to broadcast diverse types of digital data for specific services. This function is not intended for FM network listeners.
TMC Traffic Message Channel: a road information system in real time, used by navigation terminals, such as Garmin, embedded in vehicles. Messages are broadcast in "localization code" and "event code" form conforming to EN12313-1 to 12313-5 CEN (European Standards Committee) standards.
TNGD Transmitter Network Group Designation: definition of the group number and range associated to a transmitter sending paging calls.
TP Traffic Program: a digital flag showing RDS receivers that the allocated station is likely to broadcast road information. The TP code does not ensure receiver switching during road announcements; it simply lets the listener know if the station offers this type of information.
UTC Universal Time Clock: digital source regularly transmitting UTC (universal time) and Julian date with time zone differential
C.2. Detector filters
De-emphasis De-emphasis filter applied when audio signals are received (50 μs or 75 μs depending on the country).
Quasi Peak Quasi peak filter conform to the CCIR 468-4 standard. P-P/2 Value (peak+max) - (peak -max)/2 RMS Root – Mean –Square value, a widely used form of averaging
various signals. Unweighted Unweighted filter conform to the CCIR 468-4 standard. Weighted Weighted filter conform to the CCIR 468-4 standard.
Modulation Analyzer 2.3.x User Manual – 05/2012
Page 100 Head Office : Parc d’activites Kennedy - 20, avenue Neil Armstrong – F-33700 Bordeaux-Merignac (France) Tel +33 (0)5 57 928 928 – Fax +33 (0)5 57 928 929 – contact@ worldcastsystems.com – www.audemat.com
APPENDIX D: FOR FURTHER INFORMATION
Please contact:
Audemat 20, avenue Neil Armstrong - Parc d'Activités J.F. Kennedy 33700 BORDEAUX – MERIGNAC FRANCE Tel: +33 (5)57 928 928 | Fax: +33 (5)57 928 929 Hotline: [email protected]
WorldCast Systems Inc 19595 NE 10th Ave, Suite A Miami FL 33179 USA Tel: +1 (305)249 31 10 | Fax: +1 (305) 249 31 13