Embed Size (px)
Citation preview
MODIS-based Modeling of Corn and Soybean Yields in the US
United States Department of Agriculture National Agricultural Statistics Service
David M. Johnson Geographer
American Geophysical Union Fall Meeting - San Francisco - 13 December 2013
Maryland Soybean Field 10/3/2013
Furlough Day # 3
AGU Fall Meeting San Francisco | 13 December 2013
2
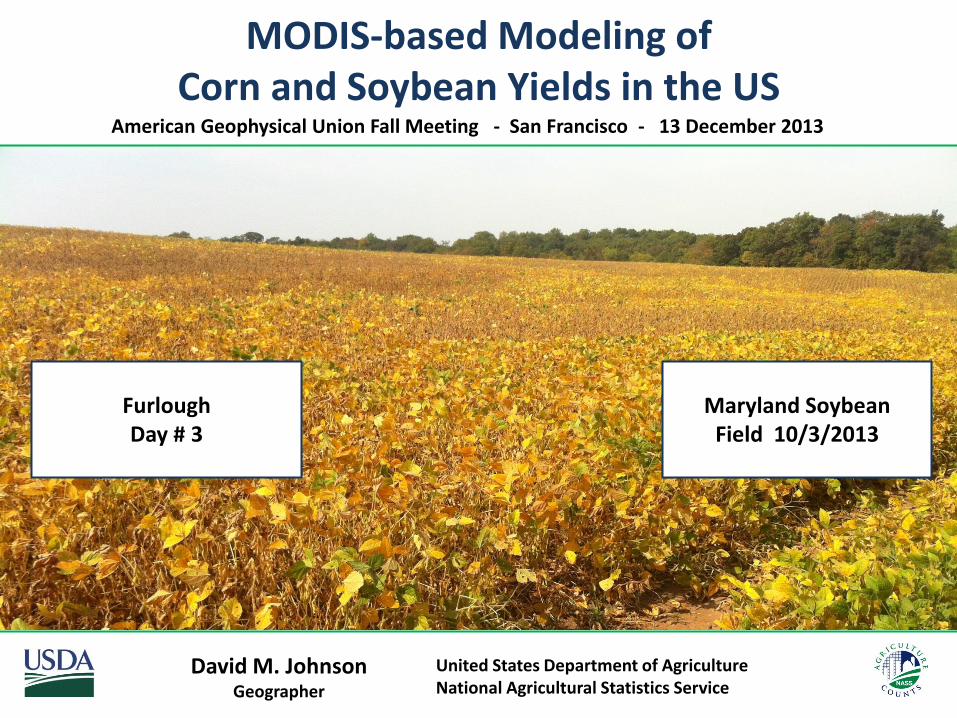
National Agricultural Statistics Service (NASS) Provider of timely, accurate, and useful statistics in service to U.S. agriculture
www.nass.usda.gov
AGU Fall Meeting San Francisco | 13 December 2013
3
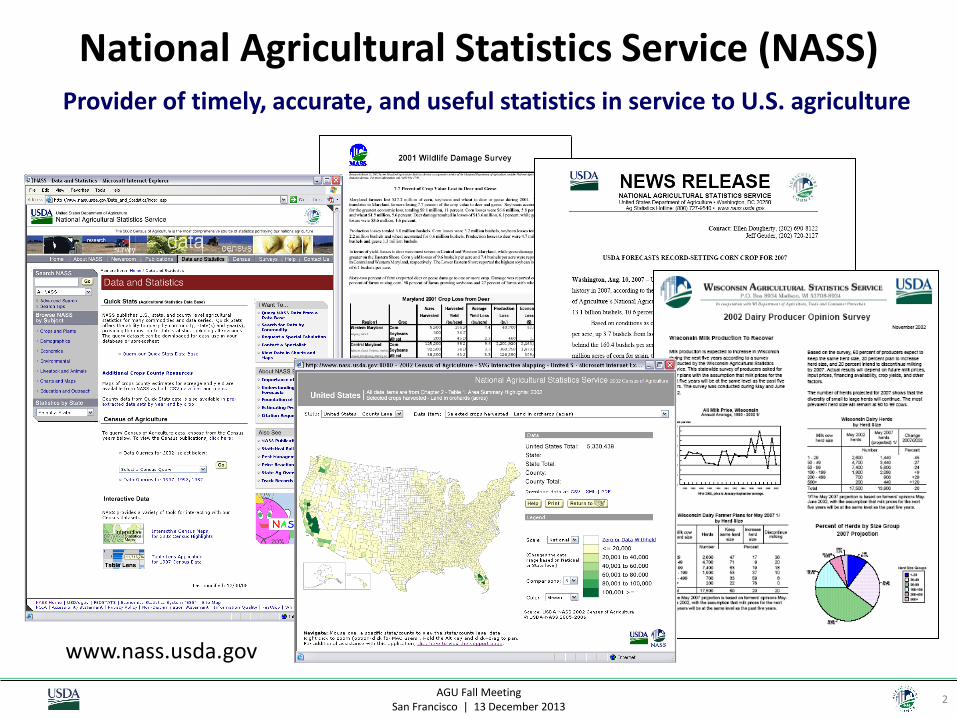
NASS Research and Development Division Geospatial Information Branch
AGU Fall Meeting San Francisco | 13 December 2013
4
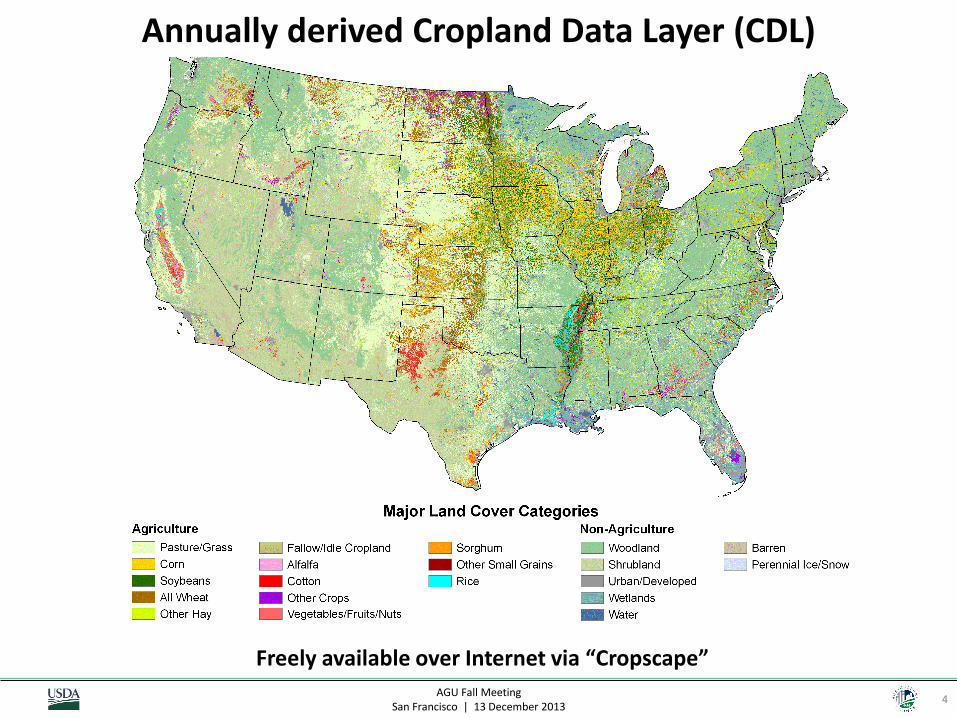
Annually derived Cropland Data Layer (CDL)
Freely available over Internet via “Cropscape”
AGU Fall Meeting San Francisco | 13 December 2013
5
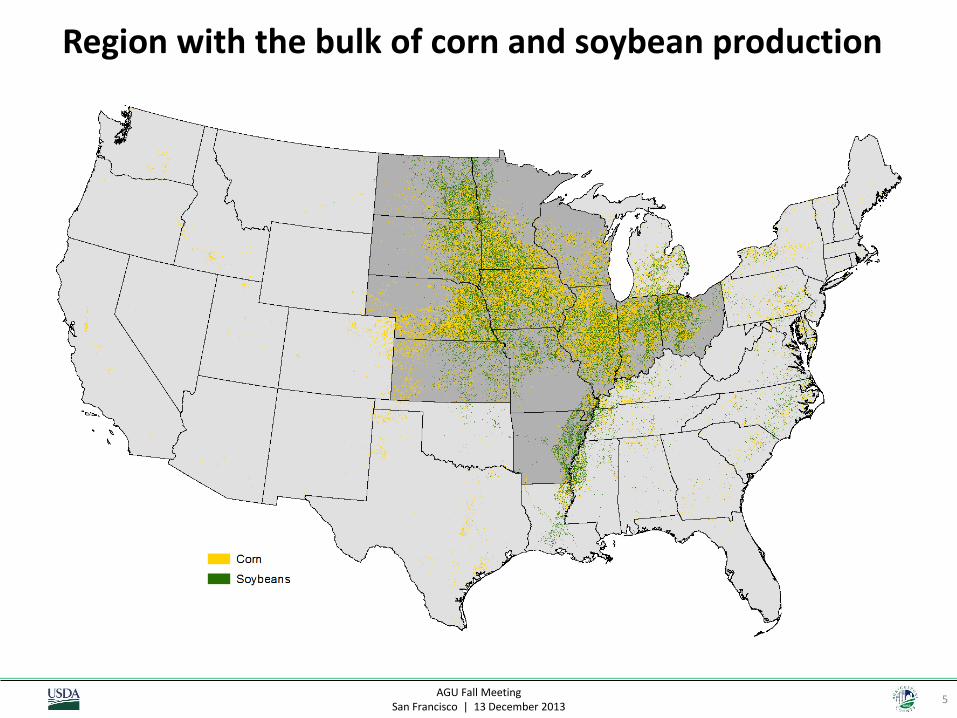
Region with the bulk of corn and soybean production
AGU Fall Meeting San Francisco | 13 December 2013
6
0
20
40
60
80
100
120
140
160
180
1860 1880 1900 1920 1940 1960 1980 2000
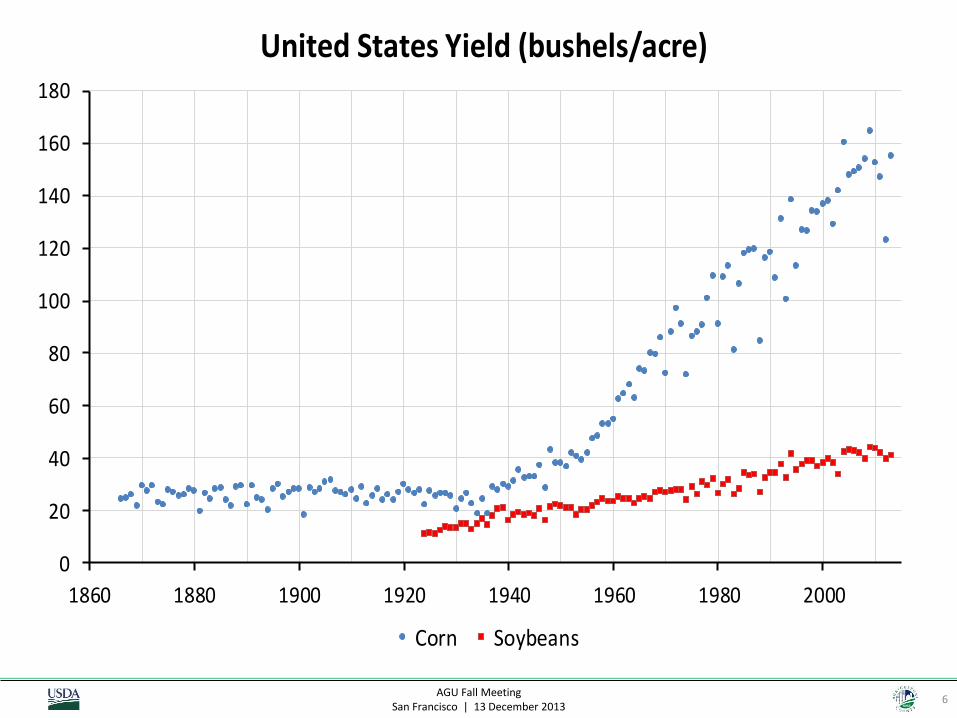
United States Yield (bushels/acre)
Corn Soybeans
AGU Fall Meeting San Francisco | 13 December 2013
7
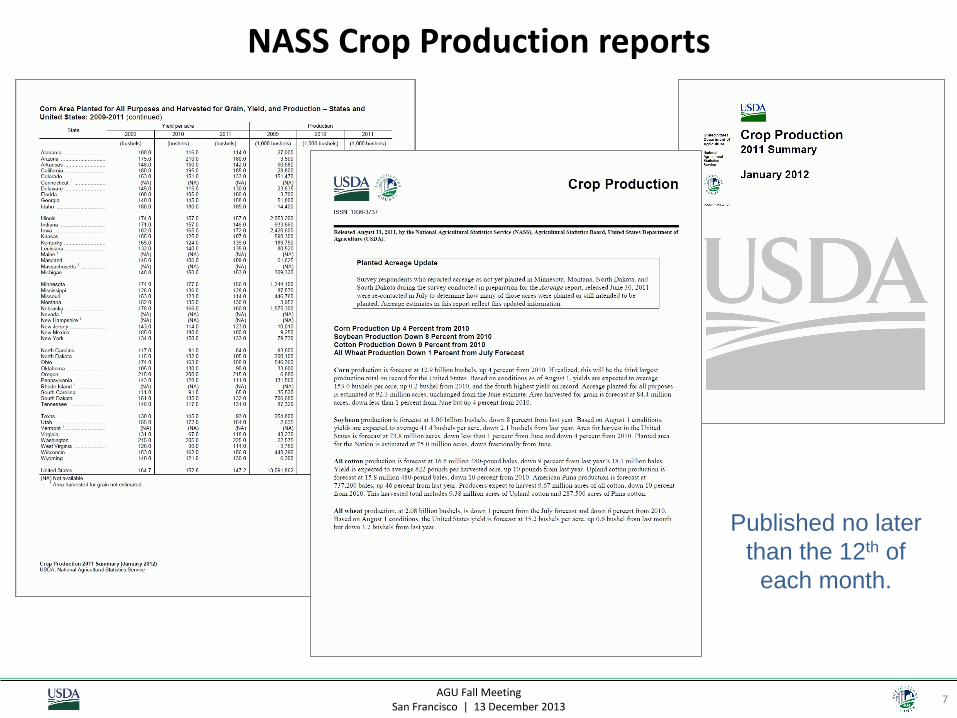
NASS Crop Production reports
Published no later
than the 12th of
each month.
AGU Fall Meeting San Francisco | 13 December 2013
8
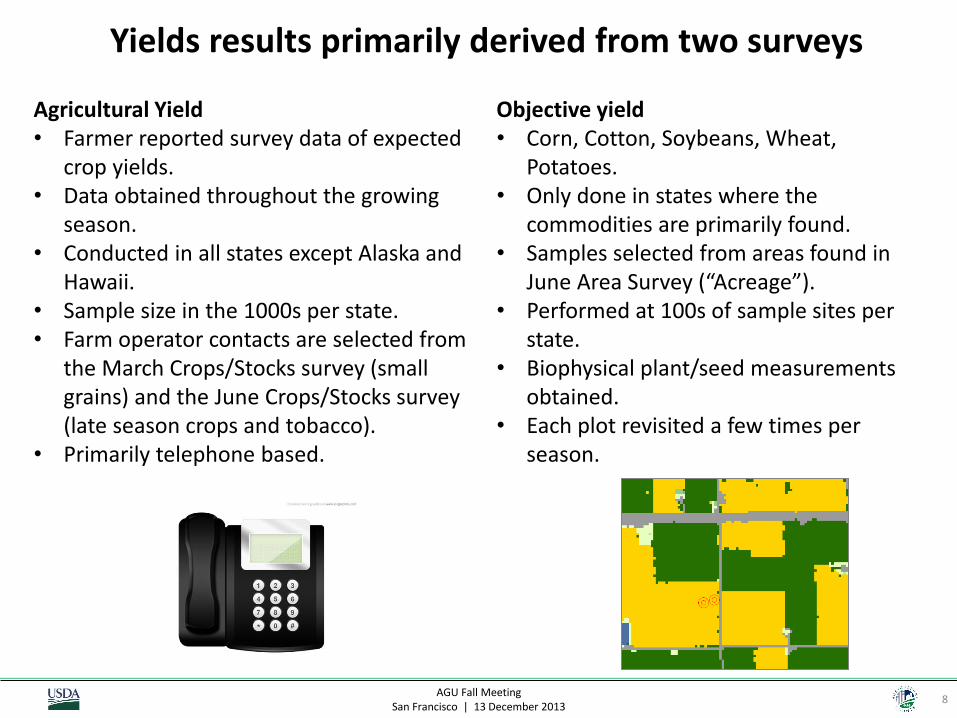
Yields results primarily derived from two surveys
Agricultural Yield • Farmer reported survey data of expected
crop yields. • Data obtained throughout the growing
season. • Conducted in all states except Alaska and
Hawaii. • Sample size in the 1000s per state. • Farm operator contacts are selected from
the March Crops/Stocks survey (small grains) and the June Crops/Stocks survey (late season crops and tobacco).
• Primarily telephone based.
Objective yield • Corn, Cotton, Soybeans, Wheat,
Potatoes. • Only done in states where the
commodities are primarily found. • Samples selected from areas found in
June Area Survey (“Acreage”). • Performed at 100s of sample sites per
state. • Biophysical plant/seed measurements
obtained. • Each plot revisited a few times per
season.
AGU Fall Meeting San Francisco | 13 December 2013
9
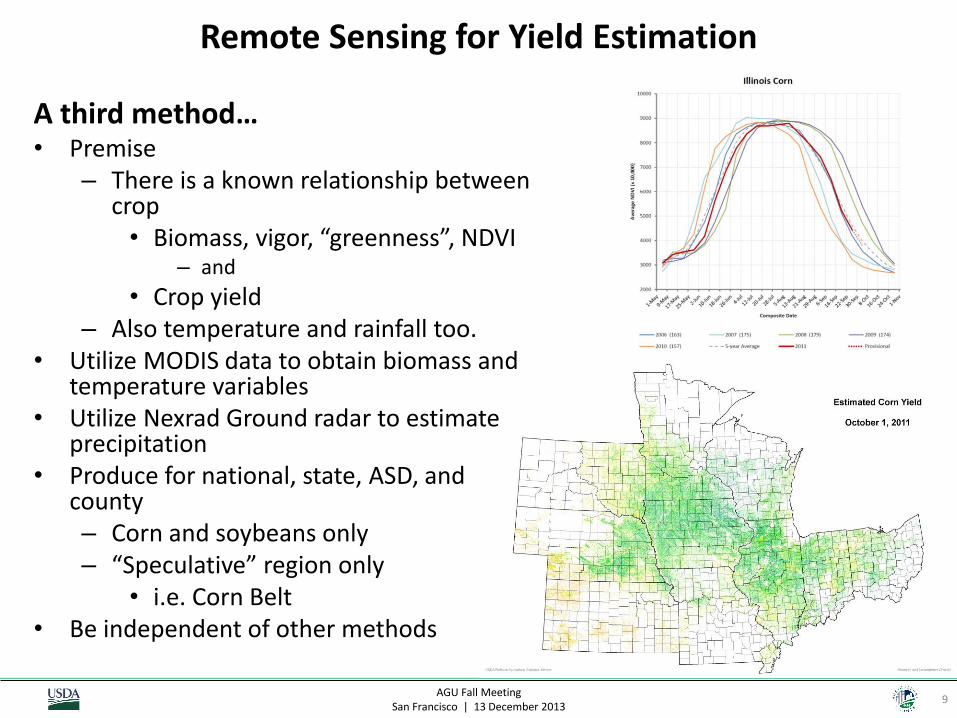
Remote Sensing for Yield Estimation
A third method… • Premise
– There is a known relationship between crop • Biomass, vigor, “greenness”, NDVI
– and
• Crop yield – Also temperature and rainfall too.
• Utilize MODIS data to obtain biomass and temperature variables
• Utilize Nexrad Ground radar to estimate precipitation
• Produce for national, state, ASD, and county – Corn and soybeans only – “Speculative” region only
• i.e. Corn Belt • Be independent of other methods
AGU Fall Meeting San Francisco | 13 December 2013
10
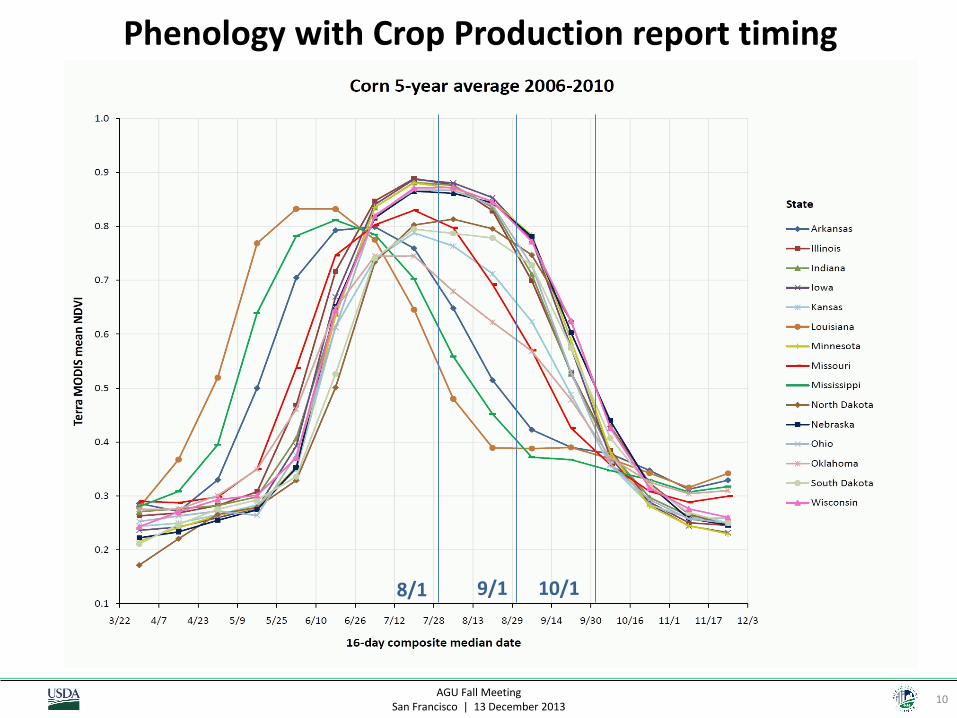
Corn phenology fundamentals
8/1 9/1 10/1
Phenology with Crop Production report timing

AGU Fall Meeting San Francisco | 13 December 2013
11
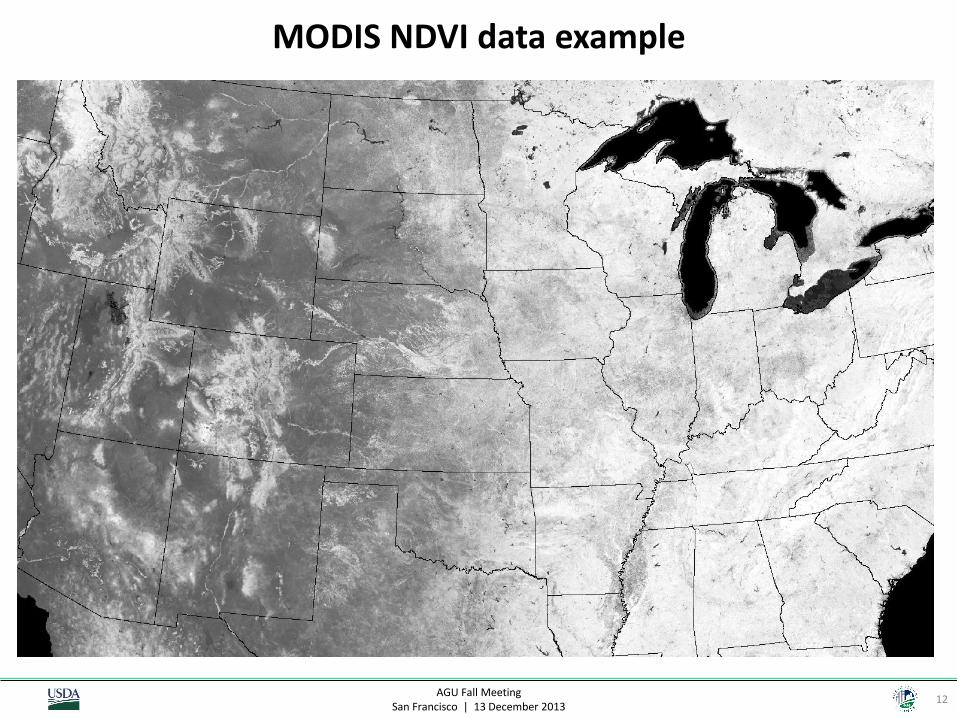
Moderate Resolution Imaging Spectroradiometer (MODIS)
AGU Fall Meeting San Francisco | 13 December 2013
12
MODIS NDVI data example

AGU Fall Meeting San Francisco | 13 December 2013
13
NDVI = (NIR + VIS)
(NIR – VIS)
NIR = near-infrared
VIS = visible
Calculation from surface reflectance and use of NDVI
Ranges from -1.0 to 1.0 NDVI is a related to • Plant health • Cholophyll content • “Greenness” • Biomass • Vegetation vigor
AGU Fall Meeting San Francisco | 13 December 2013
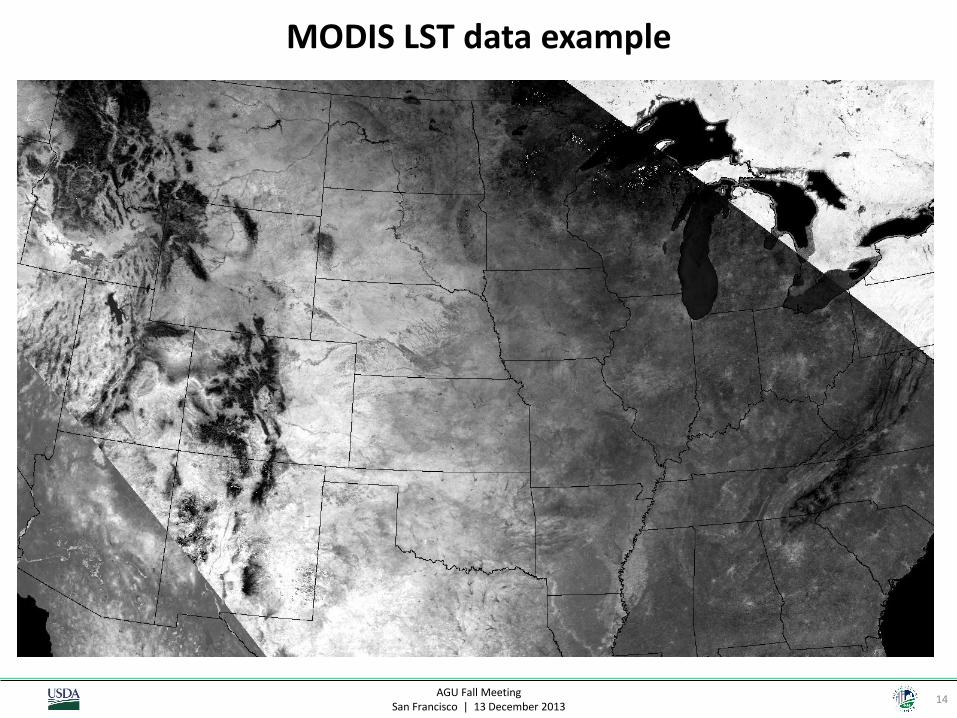
14
MODIS LST data example
AGU Fall Meeting San Francisco | 13 December 2013
15
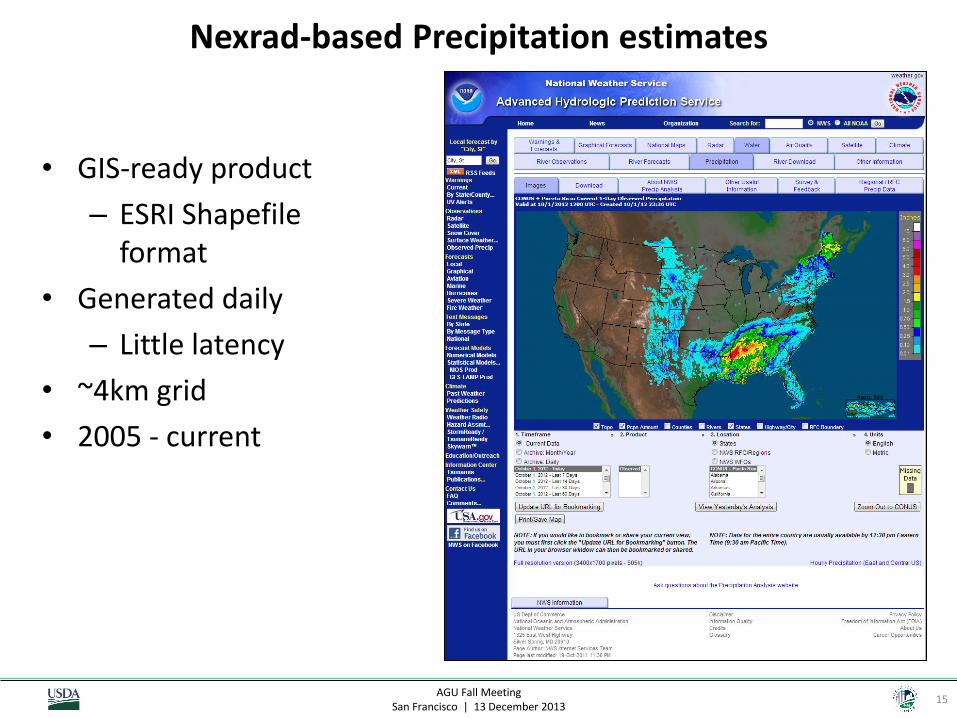
Nexrad-based Precipitation estimates
• GIS-ready product
– ESRI Shapefile format
• Generated daily
– Little latency
• ~4km grid
• 2005 - current
AGU Fall Meeting San Francisco | 13 December 2013
16
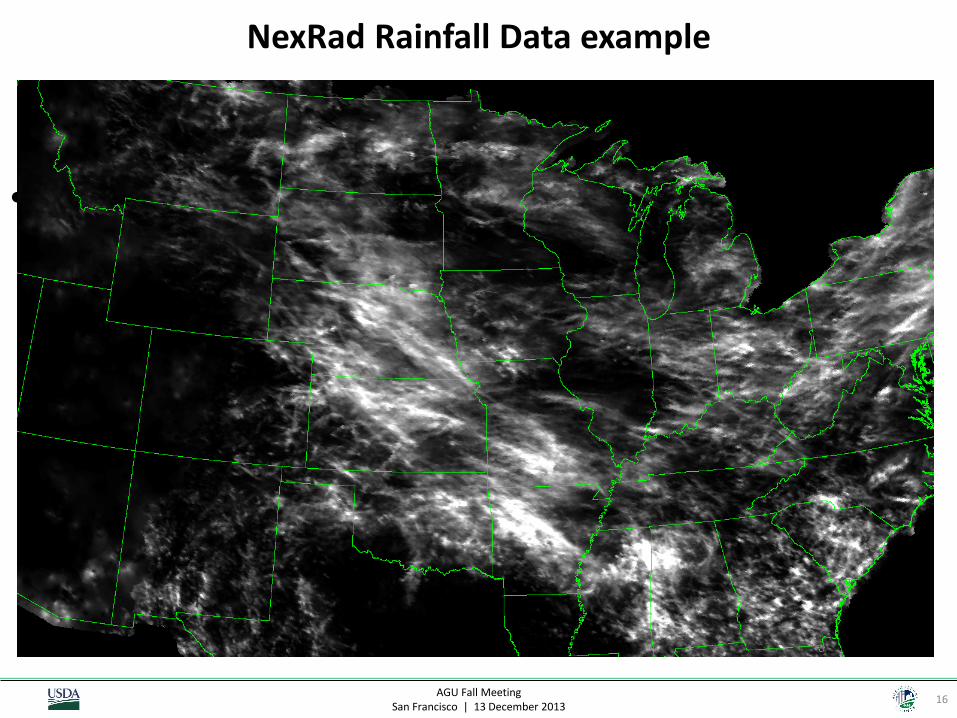
NexRad Rainfall Data example
• Image here

AGU Fall Meeting San Francisco | 13 December 2013
17
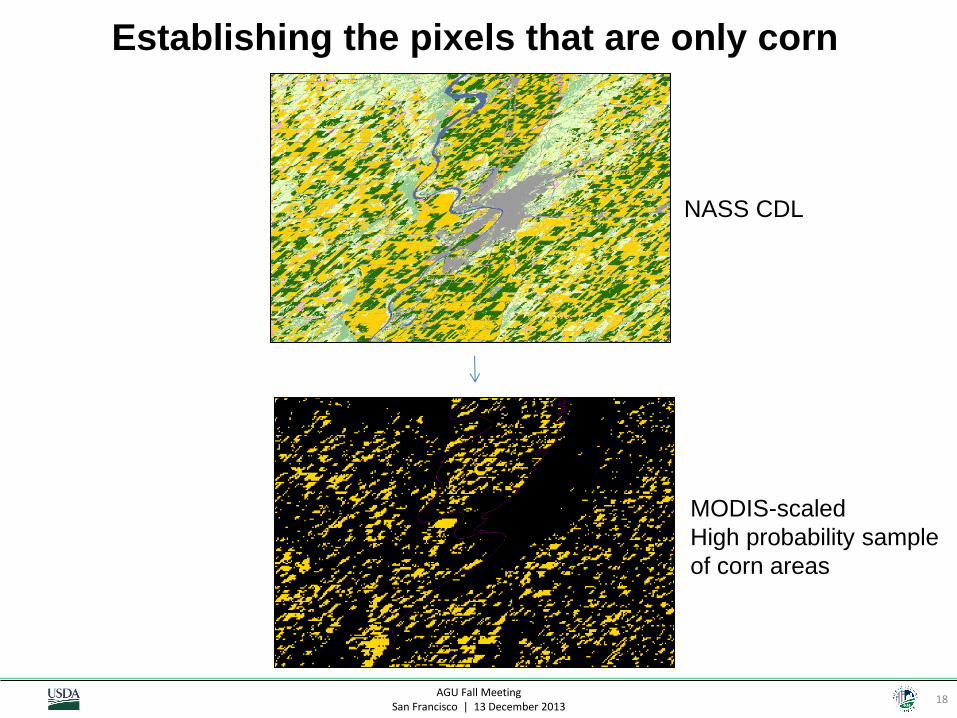
Intersecting corn “mask” with MODIS data
AGU Fall Meeting San Francisco | 13 December 2013
18
NASS CDL
MODIS-scaled
High probability sample
of corn areas
Establishing the pixels that are only corn

AGU Fall Meeting San Francisco | 13 December 2013
19
County-level modeling with “composite” modeling • Historical NASS county-level yields as dependent variable
– 2006-2011
• Analysis over “Speculative” corn and soybean region
• Four timely possible predictor (independent) variables – NDVI (Normalized Difference Vegetation Index)
• derived from Terra satellite MODIS surface reflectance imagery
– LST (Land Surface Temperature) from day and night • derived from Aqua satellite MODIS thermal imagery
– Precipitation • derived from NOAA/NWS Nexrad composite
• Utilizing 8-day composited mosaic products for each – Mid-February through late September
• Modeling/mining using Rulequest Cubist software – Regression tree based
AGU Fall Meeting San Francisco | 13 December 2013
20
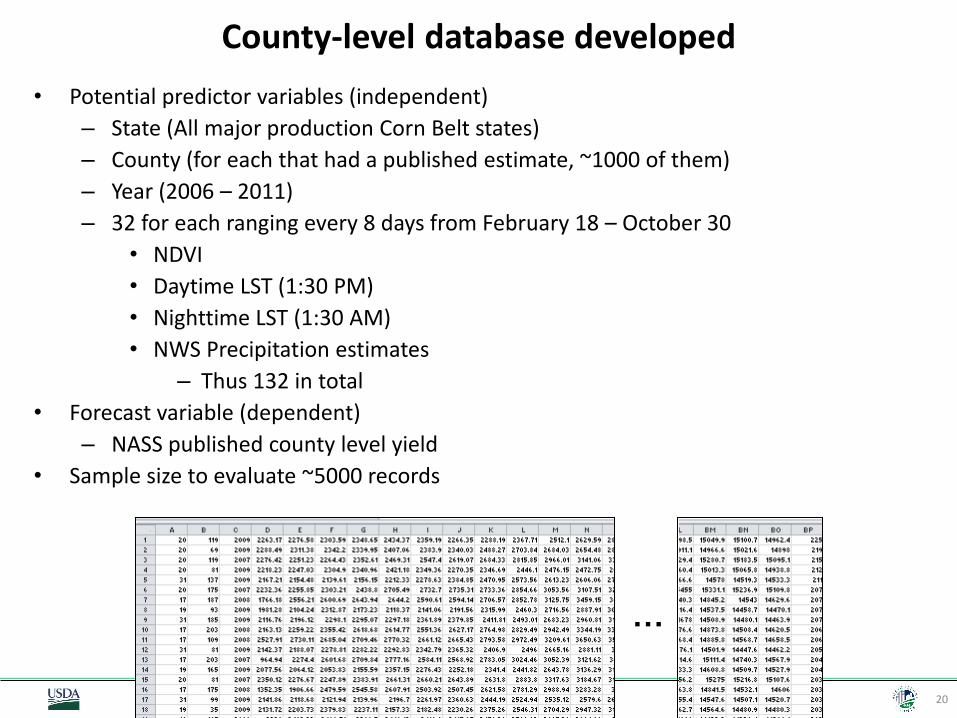
County-level database developed
• Potential predictor variables (independent)
– State (All major production Corn Belt states)
– County (for each that had a published estimate, ~1000 of them)
– Year (2006 – 2011)
– 32 for each ranging every 8 days from February 18 – October 30
• NDVI
• Daytime LST (1:30 PM)
• Nighttime LST (1:30 AM)
• NWS Precipitation estimates
– Thus 132 in total
• Forecast variable (dependent)
– NASS published county level yield
• Sample size to evaluate ~5000 records
…

AGU Fall Meeting San Francisco | 13 December 2013
21
AGU Fall Meeting San Francisco | 13 December 2013
22
AGU Fall Meeting San Francisco | 13 December 2013
23
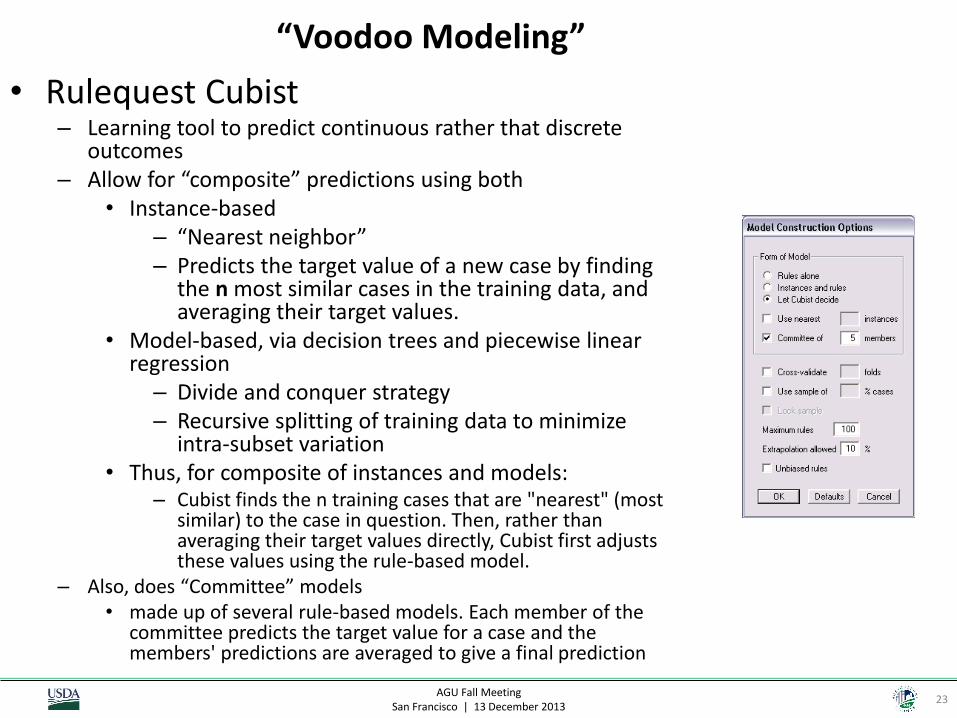
“Voodoo Modeling”
• Rulequest Cubist – Learning tool to predict continuous rather that discrete
outcomes – Allow for “composite” predictions using both
• Instance-based – “Nearest neighbor” – Predicts the target value of a new case by finding
the n most similar cases in the training data, and averaging their target values.
• Model-based, via decision trees and piecewise linear regression – Divide and conquer strategy – Recursive splitting of training data to minimize
intra-subset variation • Thus, for composite of instances and models:
– Cubist finds the n training cases that are "nearest" (most similar) to the case in question. Then, rather than averaging their target values directly, Cubist first adjusts these values using the rule-based model.
– Also, does “Committee” models • made up of several rule-based models. Each member of the
committee predicts the target value for a case and the members' predictions are averaged to give a final prediction
AGU Fall Meeting San Francisco | 13 December 2013
24
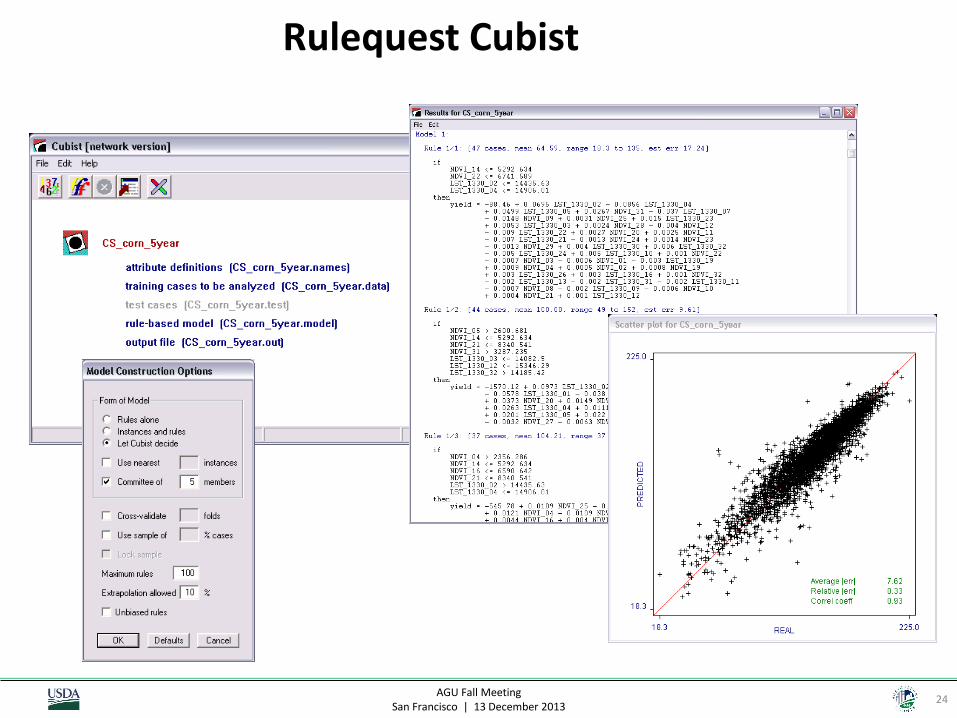
Rulequest Cubist
AGU Fall Meeting San Francisco | 13 December 2013
25
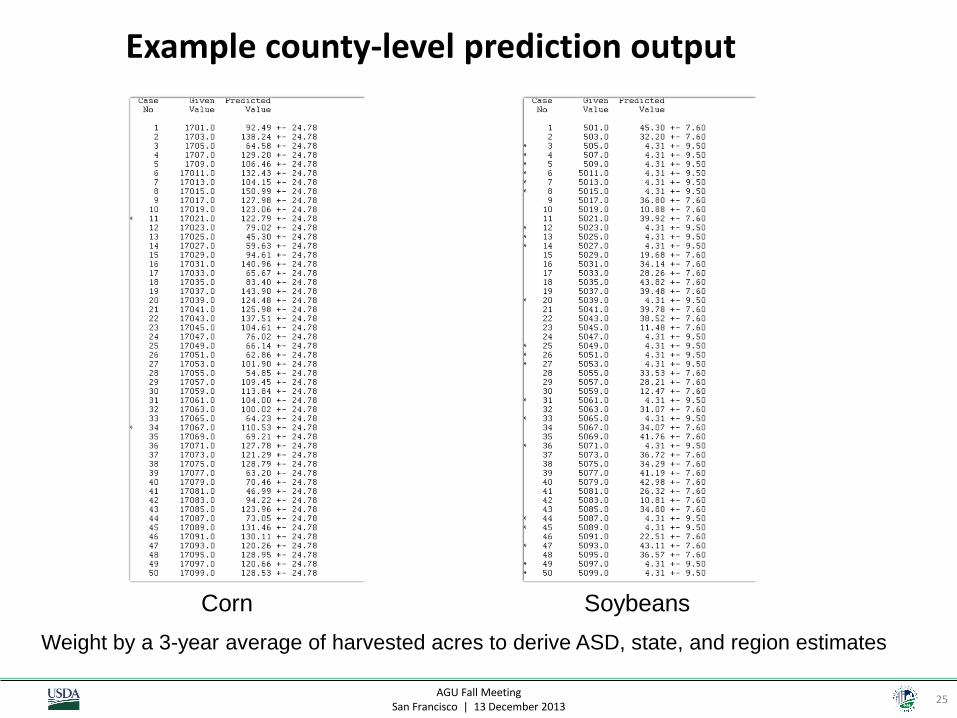
Example county-level prediction output
Corn Soybeans
Weight by a 3-year average of harvested acres to derive ASD, state, and region estimates
AGU Fall Meeting San Francisco | 13 December 2013
26

AGU Fall Meeting San Francisco | 13 December 2013
27
AGU Fall Meeting San Francisco | 13 December 2013
28
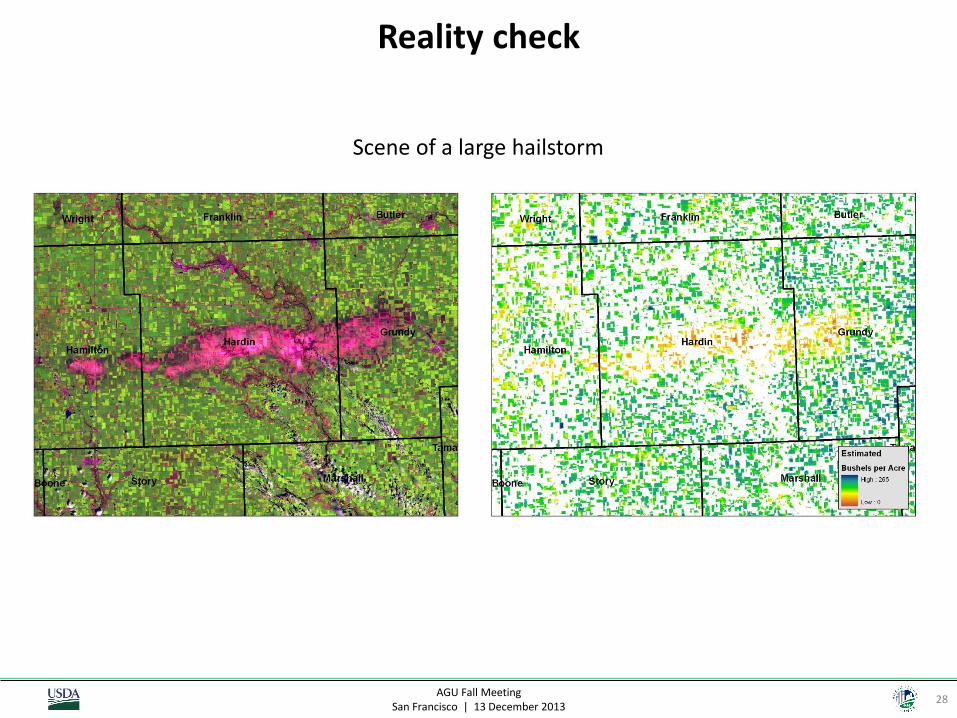
Reality check
Scene of a large hailstorm
AGU Fall Meeting San Francisco | 13 December 2013
29
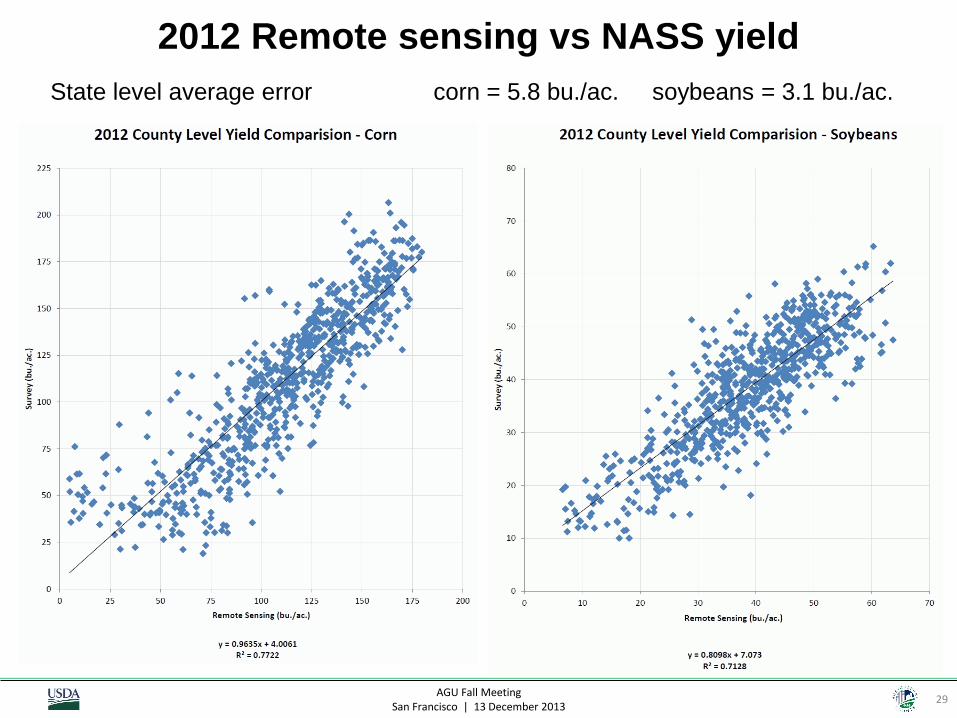
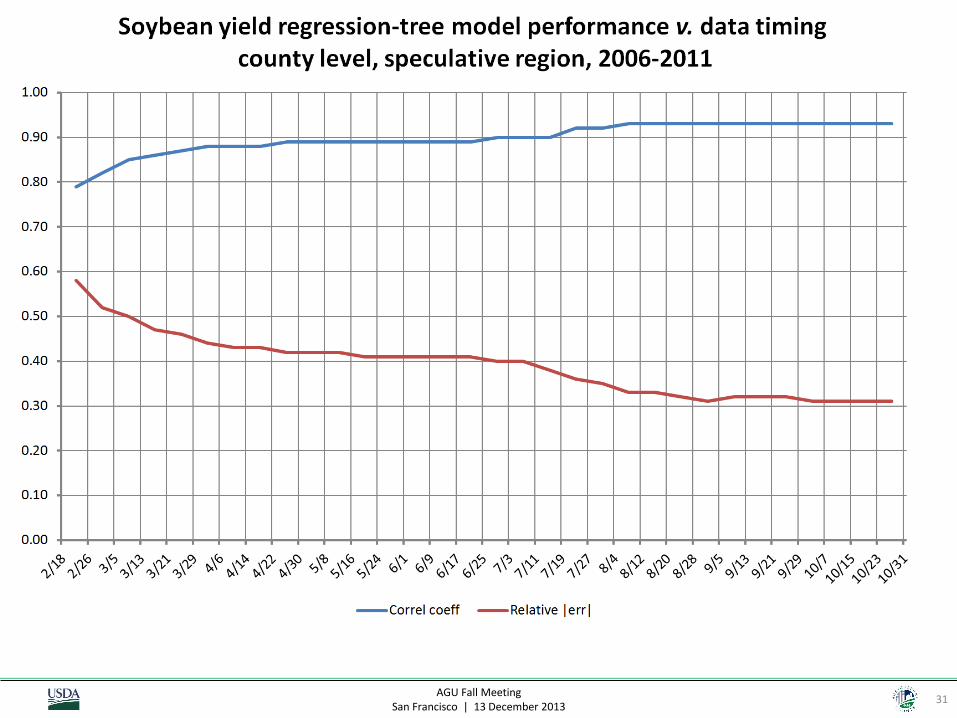
2012 Remote sensing vs NASS yield
State level average error corn = 5.8 bu./ac. soybeans = 3.1 bu./ac.
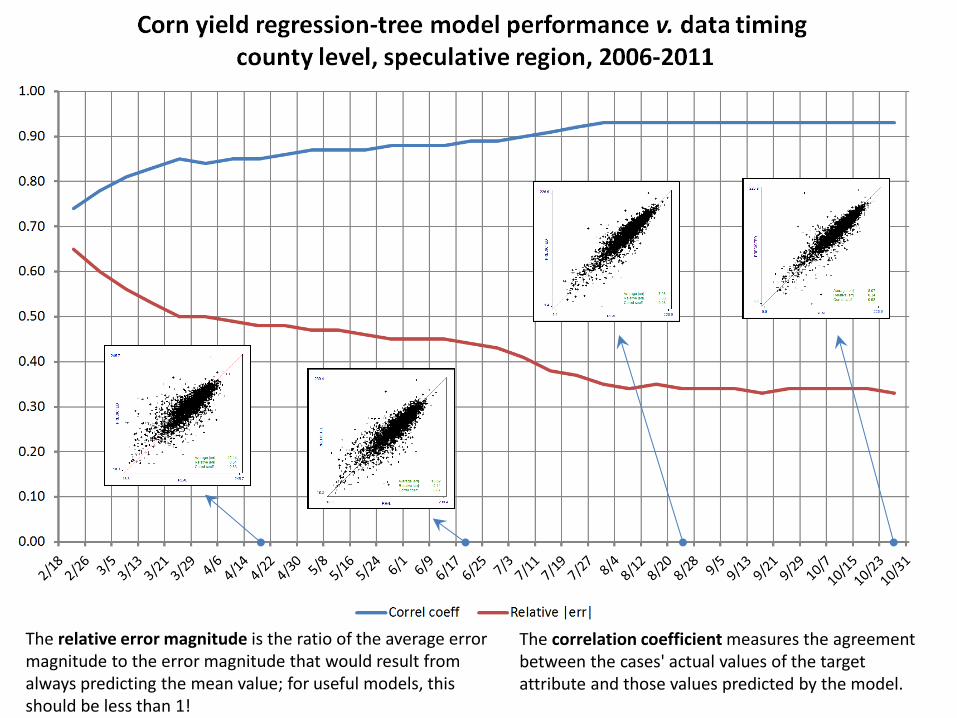
The relative error magnitude is the ratio of the average error magnitude to the error magnitude that would result from always predicting the mean value; for useful models, this should be less than 1!
The correlation coefficient measures the agreement between the cases' actual values of the target attribute and those values predicted by the model.
AGU Fall Meeting San Francisco | 13 December 2013
31
AGU Fall Meeting San Francisco | 13 December 2013
32
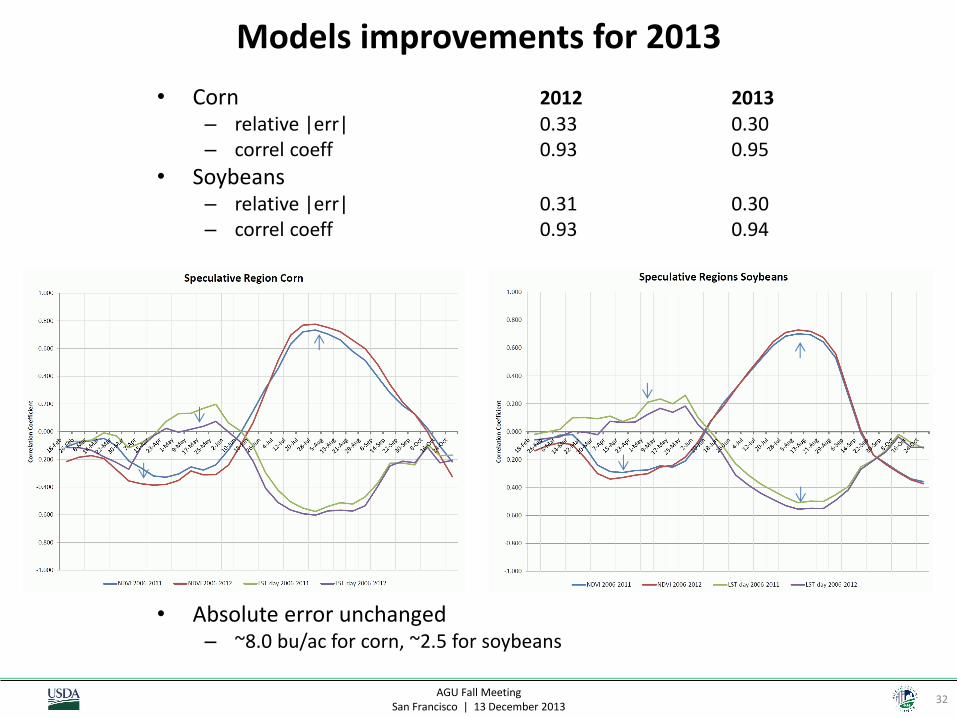
Models improvements for 2013 • Corn 2012 2013
– relative |err| 0.33 0.30 – correl coeff 0.93 0.95
• Soybeans – relative |err| 0.31 0.30 – correl coeff 0.93 0.94
• Absolute error unchanged – ~8.0 bu/ac for corn, ~2.5 for soybeans
AGU Fall Meeting San Francisco | 13 December 2013
33
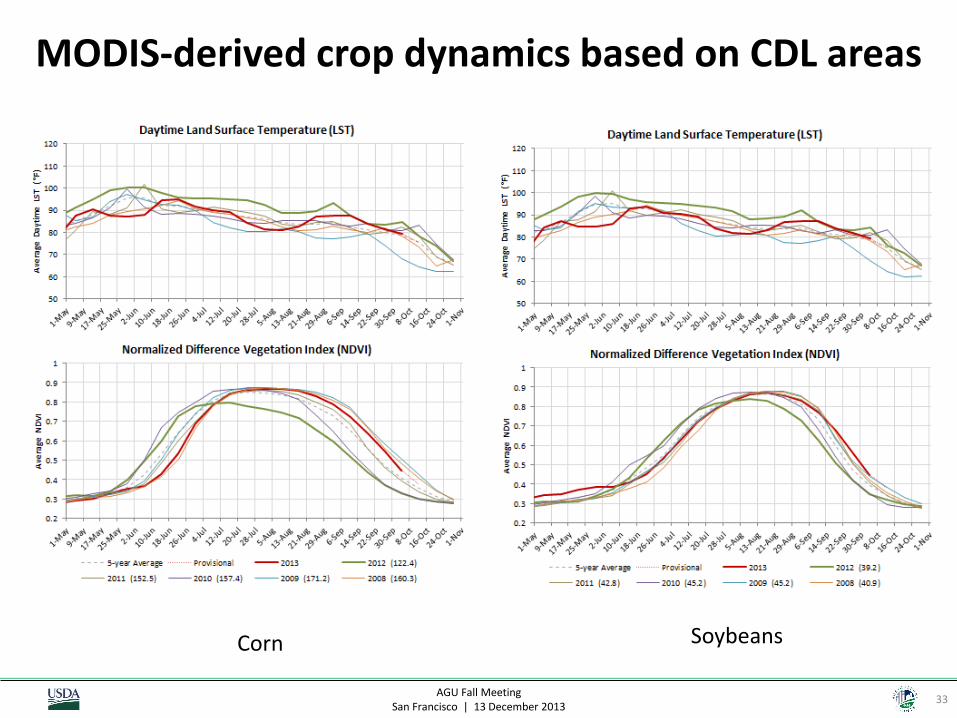
MODIS-derived crop dynamics based on CDL areas
Corn Soybeans Corn Soybeans
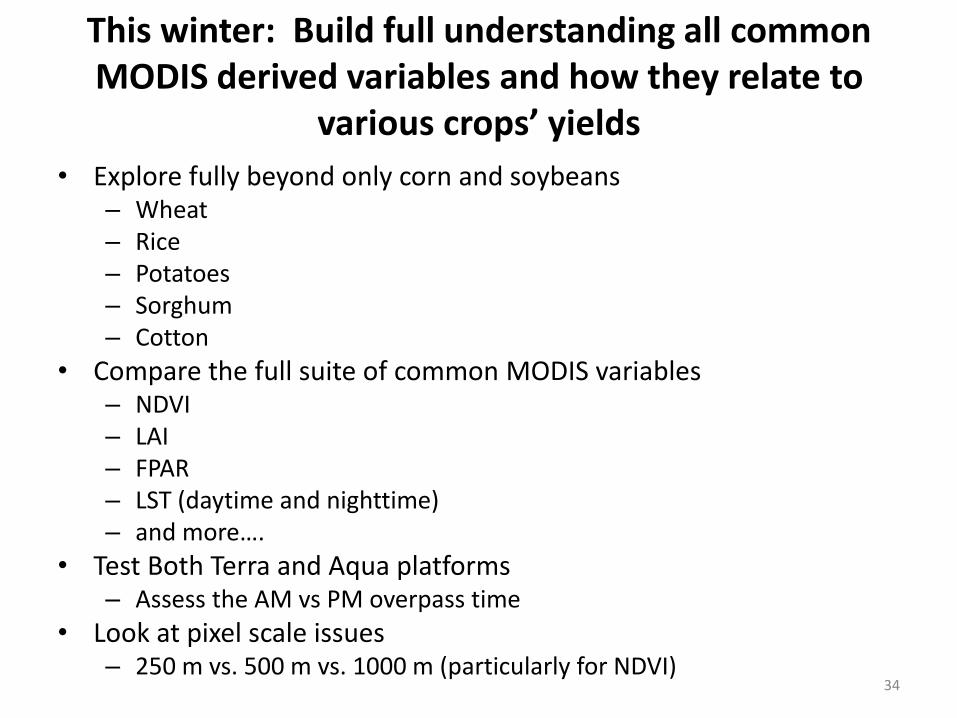
This winter: Build full understanding all common MODIS derived variables and how they relate to
various crops’ yields
• Explore fully beyond only corn and soybeans – Wheat – Rice – Potatoes – Sorghum – Cotton
• Compare the full suite of common MODIS variables – NDVI – LAI – FPAR – LST (daytime and nighttime) – and more….
• Test Both Terra and Aqua platforms – Assess the AM vs PM overpass time
• Look at pixel scale issues – 250 m vs. 500 m vs. 1000 m (particularly for NDVI)
34

AGU Fall Meeting San Francisco | 13 December 2013
35
AGU Fall Meeting San Francisco | 13 December 2013
36

AGU Fall Meeting San Francisco | 13 December 2013
37
Corn yield correlations to NDVI from the different MODIS platforms
-1.0
-0.9
-0.8
-0.7
-0.6
-0.5
-0.4
-0.3
-0.2
-0.1
0.0
0.1
0.2
0.3
0.4
0.5
0.6
0.7
0.8
0.9
1.0
Co
rrel
atio
n C
oef
fici
en
t (r)
8-day composite windows
Terra Aqua
AGU Fall Meeting San Francisco | 13 December 2013
38
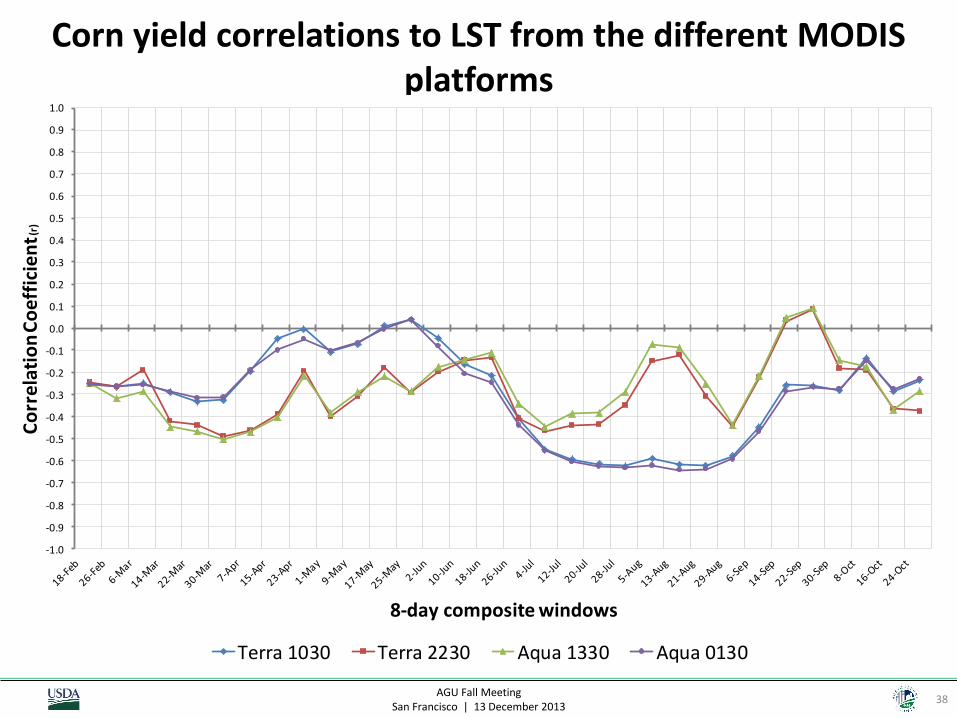
Corn yield correlations to LST from the different MODIS platforms
-1.0
-0.9
-0.8
-0.7
-0.6
-0.5
-0.4
-0.3
-0.2
-0.1
0.0
0.1
0.2
0.3
0.4
0.5
0.6
0.7
0.8
0.9
1.0
Co
rre
lati
on
Co
eff
icie
nt(
r)
8-day composite windows
Terra 1030 Terra 2230 Aqua 1330 Aqua 0130

AGU Fall Meeting San Francisco | 13 December 2013
39
In summary
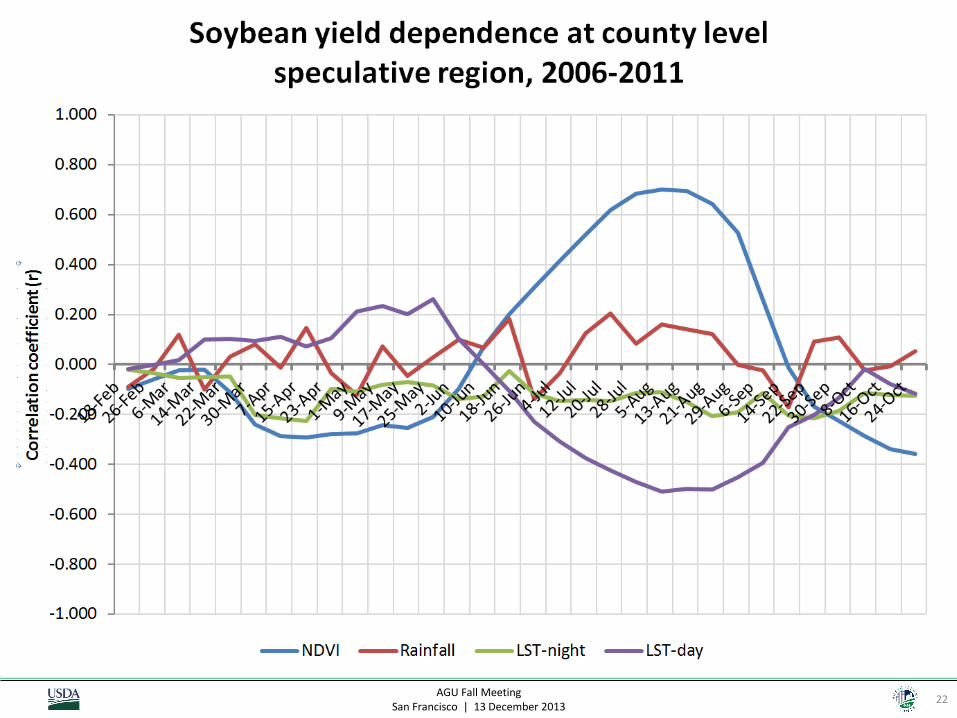
• Corn and soybeans yield predictors – NDVI most useful
– Daytime LST also useful
– Precipitation not useful
– Nighttime LST not useful
• Full exploration of other MODIS variables and other crops has begun

AGU Fall Meeting San Francisco | 13 December 2013
40
Thanks [email protected]
703-877-8000 x169
www.nass.usda.gov www.nass.usda.gov/Research_and_Science
nassgeodata.gmu.edu/CropScape