Embed Size (px)
Citation preview
RESEARCH ARTICLE
Modified starch (cationized)–alginate beads containingaceclofenac: Formulation optimization using centralcomposite design
Jadupati Malakar1, Amit Kumar Nayak2 and Arindam Das1
1 Department of Pharmaceutics, Bengal College of Pharmaceutical Sciences and Research, Durgapur, West Bengal, India2 Department of Pharmaceutics, Seemanta Institute of Pharmaceutical Sciences, Mayurbhanj, Odisha, India
Sustained aceclofenac release cationized starch–alginate beads were developed through ionotropic
gelation. The effects of sodium alginate and cationized starch amounts as independent process
variables on drug encapsulation, and drug release were optimized using central composite design.
The optimized beads showed drug encapsulation efficiency of 88.26 � 3.78% and cumulative drug
release of 26.28 � 1.21% after 6 h of dissolution. The average size of all these beads ranged from
1.08 � 0.08 to 1.48 � 0.18 mm. The developed beads were characterized by scanning electron
microscope, Fourier transform-infrared spectroscopy, and powder X-ray diffraction. The in vitro
dissolution of these beads showed prolonged sustained release of aceclofenac over 6 h, which
followed first-order model with anomalous (non-Fickian) diffusion mechanism. The swelling and
degradation of the optimized beads were influenced by pH of test mediums. These newly developed
beads were found suitable for sustained delivery of aceclofenac for prolonged period.
Received: November 6, 2012
Revised: January 23, 2013
Accepted: January 30, 2013
Keywords:
Aceclofenac / Cationized starch / Central composite design / Sodium alginate / Sustained release
1 Introduction
Starch is known as a cost-effective biodegradable polymer with
excellent biocompatibility [1]. Starch is able to produce quite
stable products in biological environment. However, native
starch alone is almost completely broken down after its oral
ingestion [2]. To improve the properties of starch as sustained
drug release matrices, modifications of functional groups of
starch and/or compounding with other polymers as blends have
been proposed [3–8]. In the literature, various native starches
and modified starches were blended with different polymers to
develop sustained drug delivery formulations [9–16].
Cationized starches are important industrial derivatives of
starches, in which starches are given a positive ionic charge by
introducing ammonium, amino, imino, sulfonium, or phos-
phonium groups [17, 18]. Cationized starches are mainly used
in the field of waste water treatment as flocculants, in the
manufacturing of textiles as additives and adhesives [19, 20].
The wide spread utilization of cationized starches in various
industries is based on their relatively low-price, non-toxicity, and
biodegradability [20]. Recently, cationized starch is one of the
modified starch materials, which was investigated as excipients
for the development of sustained release drug delivery systems
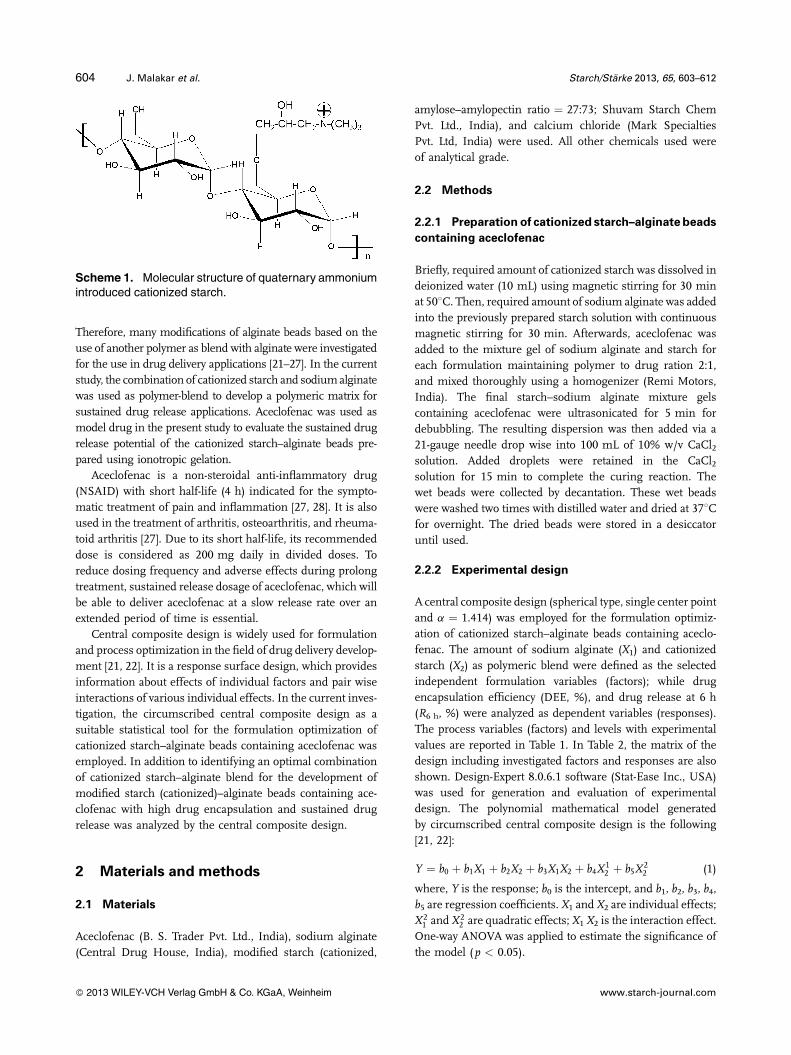
[2]. To the best of our knowledge, quaternary ammonium
introduced cationized starch (Scheme 1) has not been pre-
viously investigated as polymeric-blend with alginate for the
development of sustained release drug delivery systems.
Sodium alginate, an anionic copolymer of mannuronic and
guluronic acid residues, has been widely used in biomedical
applications due to its biodegradability and biocompatibility
[21]. It undergoes ionotropic gelation in the presence of metal
cations like Ca2þ, Ba2þ, Al3þ, etc. due to ionic interaction
between these cations and carboxylic acid groups of alginate
[21, 22]. However, ionotropically-gelled alginate based beads
suffer from some major limitations like drug loss during bead
preparation due to leaching of drugs through the pores [23].
Colour online: See the article online to view Figs. 1–5, 9, and 10 incolour.
Correspondence: Dr. Amit Kumar Nayak, Seemanta Institute ofPharmaceutical Sciences, Mayurbhanj 757086, Odisha, IndiaE-mail: [email protected]: þ91-06791-222238
Abbreviations: DEE, drug encapsulation efficiency; FTIR,Fourier transform-infrared; LOQ, limit of quantification;P-XRD, powder X-ray diffraction
DOI 10.1002/star.201200231Starch/Starke 2013, 65, 603–612 603
� 2013 WILEY-VCH Verlag GmbH & Co. KGaA, Weinheim www.starch-journal.com
Therefore, many modifications of alginate beads based on the
use of another polymer as blend with alginate were investigated
for the use in drug delivery applications [21–27]. In the current
study, the combination of cationized starch and sodiumalginate
was used as polymer-blend to develop a polymeric matrix for
sustained drug release applications. Aceclofenac was used as
model drug in the present study to evaluate the sustained drug
release potential of the cationized starch–alginate beads pre-
pared using ionotropic gelation.
Aceclofenac is a non-steroidal anti-inflammatory drug
(NSAID) with short half-life (4 h) indicated for the sympto-
matic treatment of pain and inflammation [27, 28]. It is also
used in the treatment of arthritis, osteoarthritis, and rheuma-
toid arthritis [27]. Due to its short half-life, its recommended
dose is considered as 200 mg daily in divided doses. To
reduce dosing frequency and adverse effects during prolong
treatment, sustained release dosage of aceclofenac, which will
be able to deliver aceclofenac at a slow release rate over an
extended period of time is essential.
Central composite design is widely used for formulation
and process optimization in the field of drug delivery develop-
ment [21, 22]. It is a response surface design, which provides
information about effects of individual factors and pair wise
interactions of various individual effects. In the current inves-
tigation, the circumscribed central composite design as a
suitable statistical tool for the formulation optimization of
cationized starch–alginate beads containing aceclofenac was
employed. In addition to identifying an optimal combination
of cationized starch–alginate blend for the development of
modified starch (cationized)–alginate beads containing ace-
clofenac with high drug encapsulation and sustained drug
release was analyzed by the central composite design.
2 Materials and methods
2.1 Materials
Aceclofenac (B. S. Trader Pvt. Ltd., India), sodium alginate
(Central Drug House, India), modified starch (cationized,
amylose–amylopectin ratio ¼ 27:73; Shuvam Starch Chem
Pvt. Ltd., India), and calcium chloride (Mark Specialties
Pvt. Ltd, India) were used. All other chemicals used were
of analytical grade.
2.2 Methods
2.2.1 Preparation of cationized starch–alginate beads
containing aceclofenac
Briefly, required amount of cationized starch was dissolved in
deionized water (10 mL) using magnetic stirring for 30 min
at 508C. Then, required amount of sodium alginate was added
into the previously prepared starch solution with continuous
magnetic stirring for 30 min. Afterwards, aceclofenac was
added to the mixture gel of sodium alginate and starch for
each formulation maintaining polymer to drug ration 2:1,
and mixed thoroughly using a homogenizer (Remi Motors,
India). The final starch–sodium alginate mixture gels
containing aceclofenac were ultrasonicated for 5 min for
debubbling. The resulting dispersion was then added via a
21-gauge needle drop wise into 100 mL of 10% w/v CaCl2solution. Added droplets were retained in the CaCl2solution for 15 min to complete the curing reaction. The
wet beads were collected by decantation. These wet beads
were washed two times with distilled water and dried at 378Cfor overnight. The dried beads were stored in a desiccator
until used.
2.2.2 Experimental design
A central composite design (spherical type, single center point
and a ¼ 1.414) was employed for the formulation optimiz-
ation of cationized starch–alginate beads containing aceclo-
fenac. The amount of sodium alginate (X1) and cationized
starch (X2) as polymeric blend were defined as the selected
independent formulation variables (factors); while drug
encapsulation efficiency (DEE, %), and drug release at 6 h
(R6 h, %) were analyzed as dependent variables (responses).
The process variables (factors) and levels with experimental
values are reported in Table 1. In Table 2, the matrix of the
design including investigated factors and responses are also
shown. Design-Expert 8.0.6.1 software (Stat-Ease Inc., USA)
was used for generation and evaluation of experimental
design. The polynomial mathematical model generated
by circumscribed central composite design is the following
[21, 22]:
Y ¼ b0 þ b1X1 þ b2X2 þ b3X1X2 þ b4X12 þ b5X
22 (1)
where, Y is the response; b0 is the intercept, and b1, b2, b3, b4,b5 are regression coefficients. X1 and X2 are individual effects;
X 21 and X2
2 are quadratic effects; X1 X2 is the interaction effect.
One-way ANOVA was applied to estimate the significance of
the model (p < 0.05).
Scheme 1. Molecular structure of quaternary ammoniumintroduced cationized starch.
604 J. Malakar et al. Starch/Starke 2013, 65, 603–612
� 2013 WILEY-VCH Verlag GmbH & Co. KGaA, Weinheim www.starch-journal.com
2.2.3 Determination of viscosity of polymer-blend
The viscosities of various polymer-blends as 10 mL aqueous
solutions were determined by using a Brookfield DV III
ultra V 6.0 RV cone and plate rheometer (Brookfield engin-
eering laboratories, Middleboro, MA) using spindle rpm 1 at
258C. The software used for calculation was Rheocalc V2.
2.2.4 Determination of drug content
An UV–VIS Spectrophotometer (Thermo Spectronic UV-1,
USA) with matched quartz cell corresponding to 1 cm path
length and spectral bandwidth 1 nm was employed for
determination aceclofenac. Aceclofenac stock solutions of
100 mg/mL were prepared for both the drugs, prepared on
the day of analysis by suitable dilution of the stock solution
with distilled water. The stock solution of aceclofenac further
diluted with distilled water to get a series of drug solutions,
i.e. 2–10 mg/mL. Then all samples were scanned separately in
the range of 200–350 nm to detect lmaxs for aceclofenac. The
lmax were found to be 273 nm for the aceclofenac. A linear
relationship between absorbances and concentration was
found in the calibration curve (Y ¼ 0.318 X þ 0.0011,
R2 ¼ 0.9992).
LOD and limit of quantification (LOQ) were estimated and
calculated for validation by taking the SD of the y-interceptand slope of the calibration curve. The formula for determi-
nation of LOD and LOQ are given below:
LOD ¼ 3a
S(2)
LOQ ¼ 10a
S(3)
where a is referred as SD of y-intercept and S is referred as
slope of the standard curve.
The values of LOD and LOQ were determined 0.0189 and
0.0628, which confers the sensitivity of the method.
2.2.5 Determination of DEE (%)
Accurately weighed 100 mg of prepared beads from each
batch were taken separately and were crushed using pestle
and mortar. The crushed powders of these beads were placed
in 500 mL of phosphate buffer, pH 7.4, and kept for 24 h with
occasionally shaking at 37 � 0.58C. After the stipulated time,
the mixture was stirred at 500 rpm for 20 min using a mag-
netic stirrer. The polymer debris formed after disintegration
of beads was removed filtering through Whatman1 filter
paper (No. 40). The drug content in the filtrate was deter-
mined using a UV–VIS spectrophotometer (Thermo
Spectronic UV-1, USA) by measuring absorbance at lMax
of 273 nm. The DEE of beads was calculated using this
following formula:
DEE; % ¼ Actual drug content in beads
Theoretical drug content in beads� 100 (4)
2.2.6 Determination of bead size
Diameters of these formulated beads were measured using
digital slide calipers (CD-600 CS, Mitutoyo Corporation, Japan)
by inserting the beads in between the space of two metallic
plates and diameter of resultant beads were displayed in the
digital screen of the previously calibrated equipment. The
average size was then calculated bymeasuring the diameter of
three sets of 20 beads from each batch.
2.2.7 Surface morphology analysis
The surface morphology of the formulated beads was ana-
lyzed by scanning electron microscope (SEM) (JEOL, JSM-
5800, Japan). Beads were gold coated and mounted on a brass
stub using double-sided adhesive tape and under vacuum in
an ion sputter with a thin layer of gold (3–5 nm) for 75 s and
at 20 kV to make them electrically conductive and their
morphology was examined.
Table 1. Factors and levels of the circumscribed centralcomposite design
Normalized
levels
Experimental settings
Sodium
alginate (mg) (X1)
Cationized
starch (mg) (X2)
�1.414 179.29 79.29
�1 200.00 100.00
0 250.00 150.00
1 300.00 200.00
1.414 320.71 220.71
Table 2. Experimental plan and observed response values fromrandomized run in central composite design
Experimental
formulations
Factors Responsesa)
Sodium
alginate
(mg) (X1)
Cationized
starch
(mg) (X2) DEE (%)b) R6 h (%)c)
F-1 200.00 100.00 58.66 � 1.36 38.74 � 1.56
F-2 200.00 200.00 69.65 � 2.83 35.82 � 1.62
F-3 300.00 100.00 64.85 � 1.92 35.46 � 1.70
F-4 300.00 200.00 75.50 � 2.38 30.08 � 1.24
F-5 179.29 150.00 59.85 � 1.22 38.80 � 1.54
F-6 320.71 150.00 68.82 � 2.60 32.62 � 1.33
F-7 250.00 220.71 76.32 � 2.54 31.75 � 1.38
F-8 250.00 79.29 60.56 � 1.08 37.62 � 1.80
F-9 250.00 150.00 64.88 � 2.03 36.11 � 1.82
a) Observed response values: Mean � SD (n ¼ 3);b) DEE (%) ¼ Drug encapsulation efficiency (%);c) R6 h (%) ¼ drug release at 6 h.
Starch/Starke 2013, 65, 603–612 605
� 2013 WILEY-VCH Verlag GmbH & Co. KGaA, Weinheim www.starch-journal.com
2.2.8 Fourier transform-infrared (FTIR) spectroscopy
Samples were reduced to powder and analyzed as KBr pellets
by using a FTIR spectroscope (Perkin–Elmer Spectrum RX I).
The pellet was placed in the sample holder. Spectral scanning
was taken in wavelength region between 3700, and 400/cm at
a resolution of 4/cm with 1 cm/s scan speed.
2.2.9 Powder X-ray diffraction (P-XRD) analysis
Samples were exposed to Cu Ka radiation (40 kV � 20 mA) in
a wide-angle X-ray diffractometer (Siemens D5000, Munich,
Germany). The instrument was operated in the step-scanmode
in increments of 0.0508 2u. The angular range was 00 to 500 2u,and counts were accumulated for 1 s at each step.
2.2.10 In vitro drug release studies
The release of the aceclofenac from various beads containing
aceclofenac was tested using a dissolution apparatus USP/BP/
IP (Campbell Electronics, India). The baskets were covered
with 100-mesh nylon cloth to prevent the escape of the beads.
The dissolution rates were measured at 37 � 18C under
50 rpm speed. Accurately weighed quantities of starch-blended
calcium alginate beads containing aceclofenac equivalent to
100 mg aceclofenac were added to 900 mL of simulated
gastric fluid (pH 1.2). The test was carried out in
simulated gastric fluid (pH 1.2) for 2 h, and then, continued
in simulated intestinal fluid (pH 7.4) for next 4 h. Five milli-
liters of aliquots were collected at regular time intervals,
and the same amounts of fresh dissolution medium were
replaced into dissolution vessel to maintain the sink condition
throughout the in vitro drug release experiment. The collected
aliquots were filtered, and suitably diluted to determine the
absorbance using a UV–VIS spectrophotometer (Thermo
Spectronic UV-1, USA) by measuring absorbance at lMax of
273 nm.
2.2.11 Analysis of in vitro drug release kinetics and
mechanism
The in vitro drug release data were evaluated kinetically in
different mathematical models [21, 25]:
Zero-ordermodel: Q ¼ ktþQ0 (5)
where Q represents the drug released amount in time t, andQ0 is the start value of Q; k is the rate constant.
First-ordermodel: Q ¼ Q0ekt (6)
where Q represents the drug released amount in time t, andQ0 is the start value of Q; k is the rate constant.
Higuchimodel: Q ¼ kt0:5 (7)
whereQ represents the drug released amount in time t, and kis the rate constant.
Korsmeyer-Peppas model: Q ¼ ktn (8)
where Q represents the drug released amount in time t, k is
the rate constant and n is the diffusional exponent, indicative
of drug release mechanism.
The Korsmeyer-Peppas model was employed in in vitro
drug release behavior analysis of beads to distinguish com-
peting mechanisms: Fickian (diffusion-controlled) release,
non-Fickian (anomalous) release, and case-II transport (re-
laxation-controlled release) [29]. When n is�0.43, it is Fickianrelease. The n-value between 0.43 and 0.85 is defined as non-
Fickian release. When n � 0.85, it is case-II transport [29].
2.2.12 Swelling behavior measurement
Swelling measurement of optimized beads containing ace-
clofenac were carried out in two different aqueous media:
simulated gastric fluid (pH 1.2), and simulated intestinal fluid
(pH 7.4). Beads (100 mg) were placed in vessels of dissolution
apparatus (Campbell Electronics, India) containing 500 mL
respective media. The experiment was carried out at
37 � 18C under 50 rpm paddle speed. The swelled beads
were removed at predetermined time interval and weighed
after drying the surface by using tissue paper. Swelling index
was determined using the following formula:
Swelling index
¼ Weight of beads after swelling�Dryweight of beads
Dryweight of beads� 100
(9)
2.2.13 Statistical analysis
Statistical optimization was performed using Design-Expert
8.0.6.1 software (Stat-Ease Inc., USA). All measured data are
expressed as mean � SD.
3 Results and discussion
3.1 Optimization
In the central composite design (spherical type, single center
point, and a ¼ 1.414), total nine experimental formulations
of cationized starch–alginate beads containing aceclofenac
were proposed by Design-Expert 8.0.6.1 software for two
independent process variables (factors): amount of sodium
alginate (X1) and amount of cationized starch (X2) (Table 1).
The effects of these independent variables on DEE, and R6 h
were investigated as optimization response parameters in the
current investigation. Overview of the experimental plan and
observed response values is presented in Table 2. The Design-
606 J. Malakar et al. Starch/Starke 2013, 65, 603–612
� 2013 WILEY-VCH Verlag GmbH & Co. KGaA, Weinheim www.starch-journal.com
Expert 8.0.6.1 software provided suitable polynomial model
equations involving individual main factors and interaction
factors for each investigated responses after fitting these data.
These models were evaluated statistically by applying one-way
ANOVA (p < 0.05), which is shown in Table 3.
The model equation relating DEE as response became:
DEE ð%Þ ¼ 47:49þ 0:08X1 � 0:12X2 þ 7:90
� 10�4X 22 ½R2
¼ 0:9961; F-value ¼ 154:25; p < 0:05�: (10)
It can be noted that the coefficients, b3 and b4 of the model
equation relating DEE had no statistical significance
(p > 0.05), since the statistic p-value of b3 and b4 were
0.8139 and 0.8533, respectively.
The model equation relating R6h as response became:
R6 h ð%Þ ¼ 31:33þ 0:04X1 þ 0:11X2 � 2:46� 10�4X1X2
� 3:02� 10�4X22 ½R2 ¼ 0:9991; Fvalue
¼ 669:27; p < 0:05�: ð11ÞIt can be noted that the coefficient, b4 of the model
equation relating R6 h had no statistical significance
(p > 0.05), since the statistic p-value of b4 were 0.0721,
respectively.
The three-dimensional response surface graph is very
useful in learning about the main and interaction effects of
the independent variables (factors), whereas two-dimensional
contour graph gives a visual representation of values of the
response [25, 29]. The three-dimensional response surface
graphs relating DEE (%) and R6 h (%) generated by the
Design-Expert 8.0.6.1 software are presented in Figs and 2,
respectively. The two-dimensional contour graphs relating
DEE and R6 h are presented in Figs and 4, respectively.
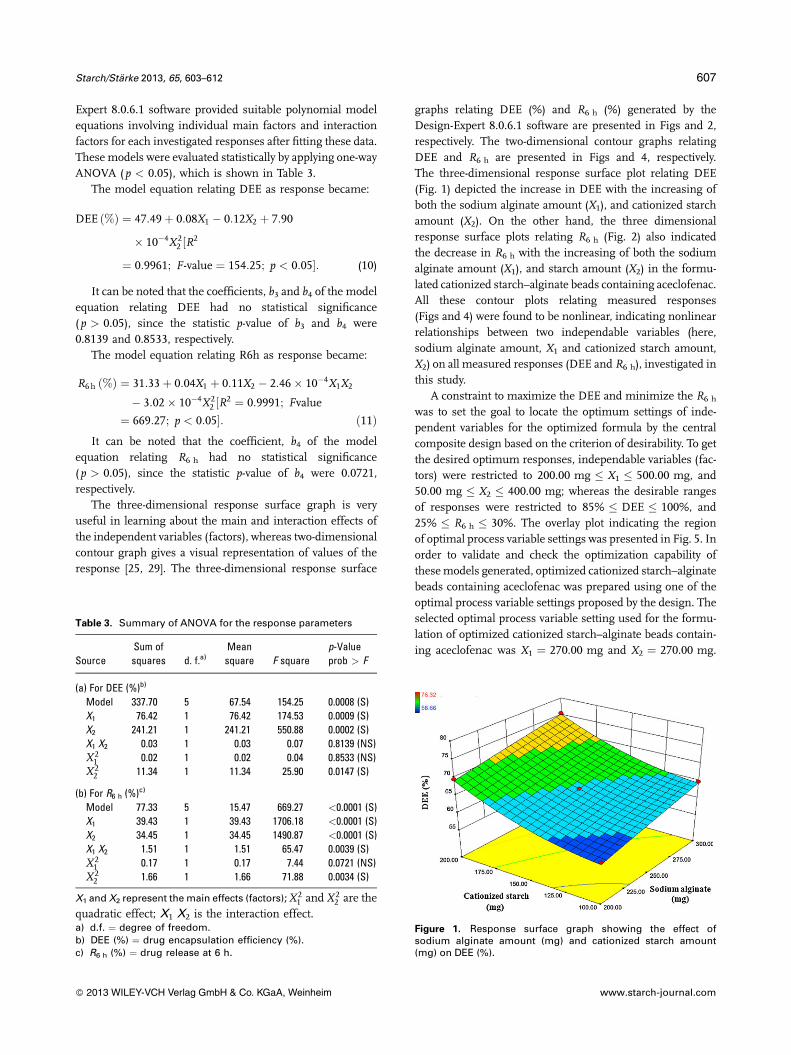
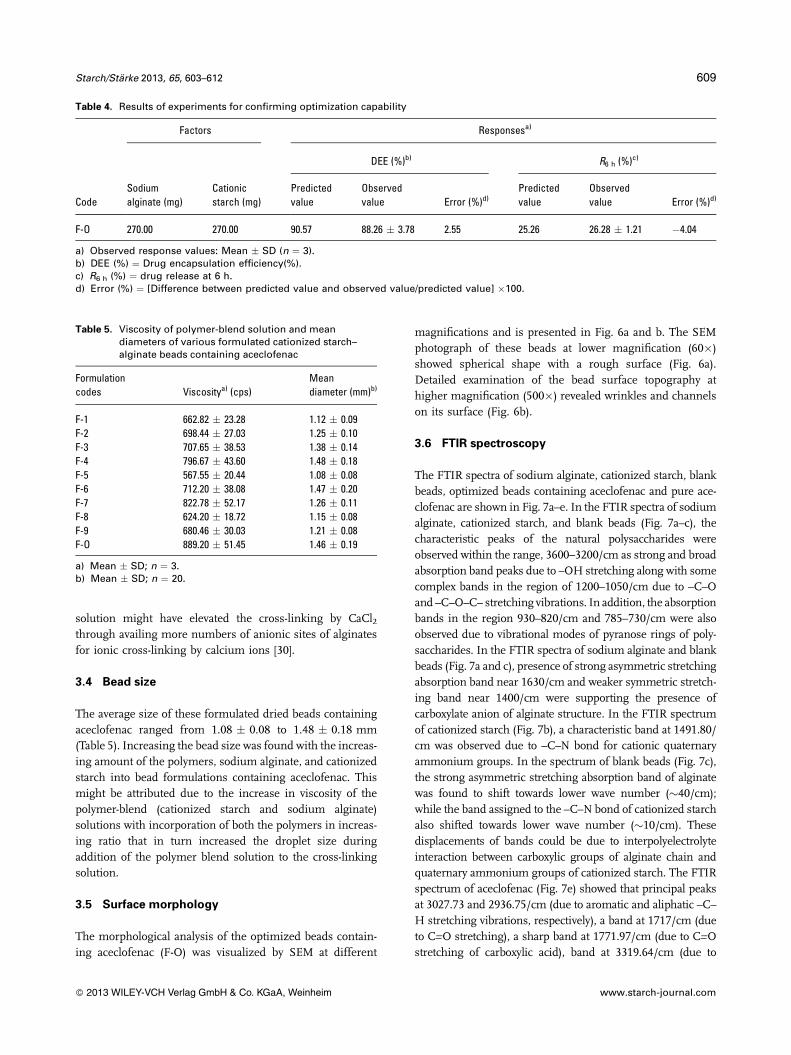
The three-dimensional response surface plot relating DEE
(Fig. 1) depicted the increase in DEE with the increasing of
both the sodium alginate amount (X1), and cationized starch
amount (X2). On the other hand, the three dimensional
response surface plots relating R6 h (Fig. 2) also indicated
the decrease in R6 h with the increasing of both the sodium
alginate amount (X1), and starch amount (X2) in the formu-
lated cationized starch–alginate beads containing aceclofenac.
All these contour plots relating measured responses
(Figs and 4) were found to be nonlinear, indicating nonlinear
relationships between two independable variables (here,
sodium alginate amount, X1 and cationized starch amount,
X2) on all measured responses (DEE and R6 h), investigated in
this study.
A constraint to maximize the DEE and minimize the R6 h
was to set the goal to locate the optimum settings of inde-
pendent variables for the optimized formula by the central
composite design based on the criterion of desirability. To get
the desired optimum responses, independable variables (fac-
tors) were restricted to 200.00 mg � X1 � 500.00 mg, and
50.00 mg � X2 � 400.00 mg; whereas the desirable ranges
of responses were restricted to 85% � DEE � 100%, and
25% � R6 h � 30%. The overlay plot indicating the region
of optimal process variable settings was presented in Fig. 5. In
order to validate and check the optimization capability of
thesemodels generated, optimized cationized starch–alginate
beads containing aceclofenac was prepared using one of the
optimal process variable settings proposed by the design. The
selected optimal process variable setting used for the formu-
lation of optimized cationized starch–alginate beads contain-
ing aceclofenac was X1 ¼ 270.00 mg and X2 ¼ 270.00 mg.
Table 3. Summary of ANOVA for the response parameters
Source
Sum of
squares d. f.a)
Mean
square F square
p-Value
prob > F
(a) For DEE (%)b)
Model 337.70 5 67.54 154.25 0.0008 (S)
X1 76.42 1 76.42 174.53 0.0009 (S)
X2 241.21 1 241.21 550.88 0.0002 (S)
X1 X2 0.03 1 0.03 0.07 0.8139 (NS)
X 21 0.02 1 0.02 0.04 0.8533 (NS)
X 22 11.34 1 11.34 25.90 0.0147 (S)
(b) For R6 h (%)c)
Model 77.33 5 15.47 669.27 <0.0001 (S)
X1 39.43 1 39.43 1706.18 <0.0001 (S)
X2 34.45 1 34.45 1490.87 <0.0001 (S)
X1 X2 1.51 1 1.51 65.47 0.0039 (S)
X 21 0.17 1 0.17 7.44 0.0721 (NS)
X 22 1.66 1 1.66 71.88 0.0034 (S)
X1 and X2 represent the main effects (factors); X21 and X 2
2 are the
quadratic effect; X1 X2 is the interaction effect.a) d.f. ¼ degree of freedom.b) DEE (%) ¼ drug encapsulation efficiency (%).c) R6 h (%) ¼ drug release at 6 h.
Figure 1. Response surface graph showing the effect ofsodium alginate amount (mg) and cationized starch amount(mg) on DEE (%).
Starch/Starke 2013, 65, 603–612 607
� 2013 WILEY-VCH Verlag GmbH & Co. KGaA, Weinheim www.starch-journal.com
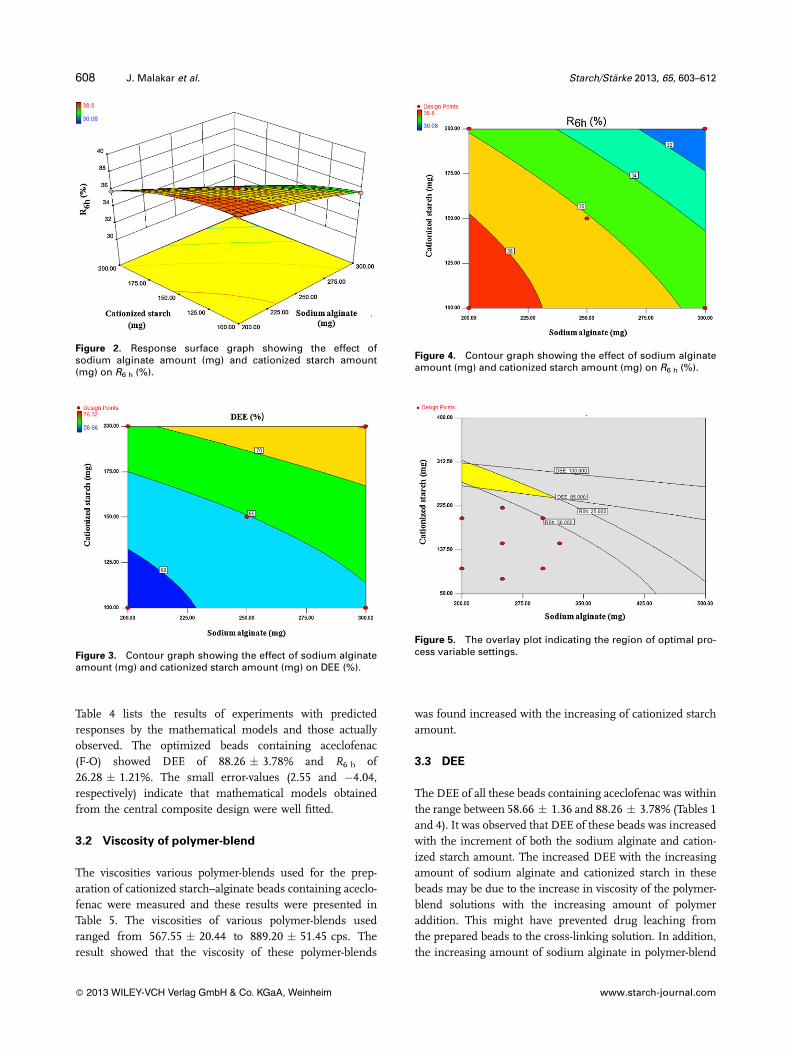
Table 4 lists the results of experiments with predicted
responses by the mathematical models and those actually
observed. The optimized beads containing aceclofenac
(F-O) showed DEE of 88.26 � 3.78% and R6 h of
26.28 � 1.21%. The small error-values (2.55 and �4.04,respectively) indicate that mathematical models obtained
from the central composite design were well fitted.
3.2 Viscosity of polymer-blend
The viscosities various polymer-blends used for the prep-
aration of cationized starch–alginate beads containing aceclo-
fenac were measured and these results were presented in
Table 5. The viscosities of various polymer-blends used
ranged from 567.55 � 20.44 to 889.20 � 51.45 cps. The
result showed that the viscosity of these polymer-blends
was found increased with the increasing of cationized starch
amount.
3.3 DEE
The DEE of all these beads containing aceclofenac was within
the range between 58.66 � 1.36 and 88.26 � 3.78% (Tables 1
and 4). It was observed that DEE of these beads was increased
with the increment of both the sodium alginate and cation-
ized starch amount. The increased DEE with the increasing
amount of sodium alginate and cationized starch in these
beads may be due to the increase in viscosity of the polymer-
blend solutions with the increasing amount of polymer
addition. This might have prevented drug leaching from
the prepared beads to the cross-linking solution. In addition,
the increasing amount of sodium alginate in polymer-blend
Figure 2. Response surface graph showing the effect ofsodium alginate amount (mg) and cationized starch amount(mg) on R6 h (%).
Figure 3. Contour graph showing the effect of sodium alginateamount (mg) and cationized starch amount (mg) on DEE (%).
Figure 4. Contour graph showing the effect of sodium alginateamount (mg) and cationized starch amount (mg) on R6 h (%).
Figure 5. The overlay plot indicating the region of optimal pro-cess variable settings.
608 J. Malakar et al. Starch/Starke 2013, 65, 603–612
� 2013 WILEY-VCH Verlag GmbH & Co. KGaA, Weinheim www.starch-journal.com
solution might have elevated the cross-linking by CaCl2through availing more numbers of anionic sites of alginates
for ionic cross-linking by calcium ions [30].
3.4 Bead size
The average size of these formulated dried beads containing
aceclofenac ranged from 1.08 � 0.08 to 1.48 � 0.18 mm
(Table 5). Increasing the bead size was found with the increas-
ing amount of the polymers, sodium alginate, and cationized
starch into bead formulations containing aceclofenac. This
might be attributed due to the increase in viscosity of the
polymer-blend (cationized starch and sodium alginate)
solutions with incorporation of both the polymers in increas-
ing ratio that in turn increased the droplet size during
addition of the polymer blend solution to the cross-linking
solution.
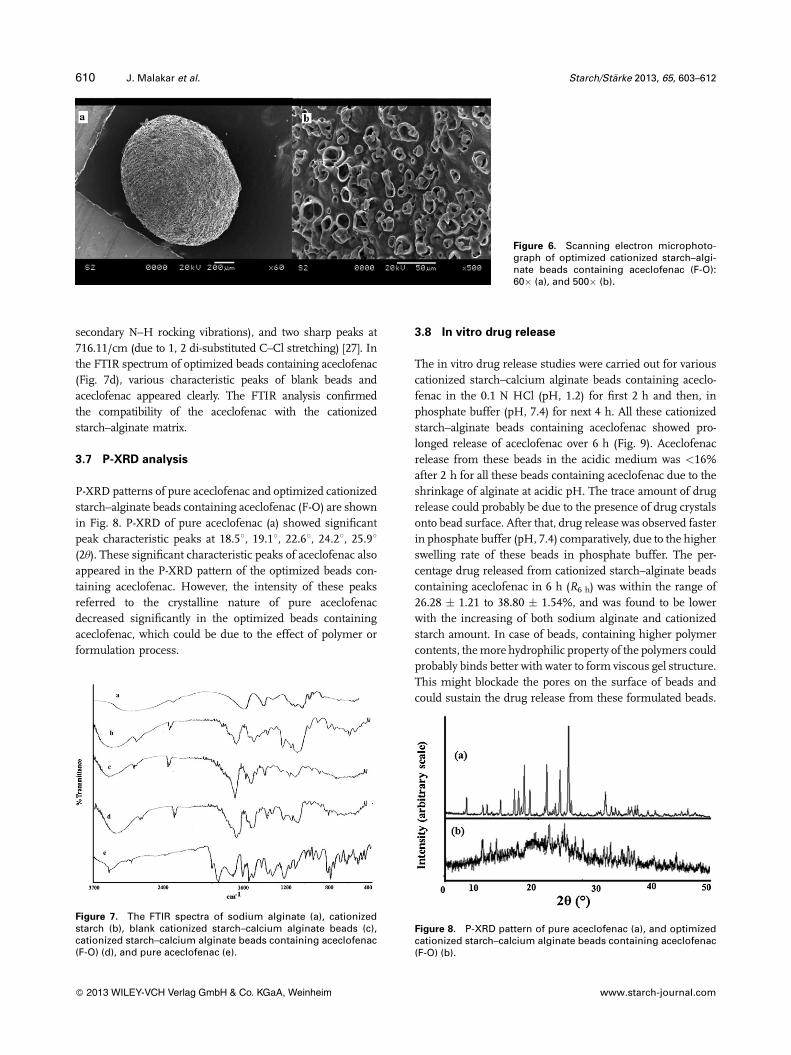
3.5 Surface morphology
The morphological analysis of the optimized beads contain-
ing aceclofenac (F-O) was visualized by SEM at different
magnifications and is presented in Fig. 6a and b. The SEM
photograph of these beads at lower magnification (60�)showed spherical shape with a rough surface (Fig. 6a).
Detailed examination of the bead surface topography at
higher magnification (500�) revealed wrinkles and channels
on its surface (Fig. 6b).
3.6 FTIR spectroscopy
The FTIR spectra of sodium alginate, cationized starch, blank
beads, optimized beads containing aceclofenac and pure ace-
clofenac are shown in Fig. 7a–e. In the FTIR spectra of sodium
alginate, cationized starch, and blank beads (Fig. 7a–c), the
characteristic peaks of the natural polysaccharides were
observed within the range, 3600–3200/cm as strong and broad
absorption band peaks due to –OH stretching along with some
complex bands in the region of 1200–1050/cm due to –C–O
and –C–O–C– stretching vibrations. In addition, the absorption
bands in the region 930–820/cm and 785–730/cm were also
observed due to vibrational modes of pyranose rings of poly-
saccharides. In the FTIR spectra of sodium alginate and blank
beads (Fig. 7a and c), presence of strong asymmetric stretching
absorption band near 1630/cm and weaker symmetric stretch-
ing band near 1400/cm were supporting the presence of
carboxylate anion of alginate structure. In the FTIR spectrum
of cationized starch (Fig. 7b), a characteristic band at 1491.80/
cm was observed due to –C–N bond for cationic quaternary
ammonium groups. In the spectrum of blank beads (Fig. 7c),
the strong asymmetric stretching absorption band of alginate
was found to shift towards lower wave number (�40/cm);
while the band assigned to the –C–N bond of cationized starch
also shifted towards lower wave number (�10/cm). These
displacements of bands could be due to interpolyelectrolyte
interaction between carboxylic groups of alginate chain and
quaternary ammonium groups of cationized starch. The FTIR
spectrum of aceclofenac (Fig. 7e) showed that principal peaks
at 3027.73 and 2936.75/cm (due to aromatic and aliphatic –C–
H stretching vibrations, respectively), a band at 1717/cm (due
to C––O stretching), a sharp band at 1771.97/cm (due to C––O
stretching of carboxylic acid), band at 3319.64/cm (due to
Table 4. Results of experiments for confirming optimization capability
Code
Factors Responsesa)
Sodium
alginate (mg)
Cationic
starch (mg)
DEE (%)b) R6 h (%)c)
Predicted
value
Observed
value Error (%)d)
Predicted
value
Observed
value Error (%)d)
F-O 270.00 270.00 90.57 88.26 � 3.78 2.55 25.26 26.28 � 1.21 �4.04
a) Observed response values: Mean � SD (n ¼ 3).b) DEE (%) ¼ Drug encapsulation efficiency(%).c) R6 h (%) ¼ drug release at 6 h.d) Error (%) ¼ [Difference between predicted value and observed value/predicted value] �100.
Table 5. Viscosity of polymer-blend solution and meandiameters of various formulated cationized starch–alginate beads containing aceclofenac
Formulation
codes Viscositya) (cps)
Mean
diameter (mm)b)
F-1 662.82 � 23.28 1.12 � 0.09
F-2 698.44 � 27.03 1.25 � 0.10
F-3 707.65 � 38.53 1.38 � 0.14
F-4 796.67 � 43.60 1.48 � 0.18
F-5 567.55 � 20.44 1.08 � 0.08
F-6 712.20 � 38.08 1.47 � 0.20
F-7 822.78 � 52.17 1.26 � 0.11
F-8 624.20 � 18.72 1.15 � 0.08
F-9 680.46 � 30.03 1.21 � 0.08
F-O 889.20 � 51.45 1.46 � 0.19
a) Mean � SD; n ¼ 3.b) Mean � SD; n ¼ 20.
Starch/Starke 2013, 65, 603–612 609
� 2013 WILEY-VCH Verlag GmbH & Co. KGaA, Weinheim www.starch-journal.com
secondary N–H rocking vibrations), and two sharp peaks at
716.11/cm (due to 1, 2 di-substituted C–Cl stretching) [27]. In
the FTIR spectrum of optimized beads containing aceclofenac
(Fig. 7d), various characteristic peaks of blank beads and
aceclofenac appeared clearly. The FTIR analysis confirmed
the compatibility of the aceclofenac with the cationized
starch–alginate matrix.
3.7 P-XRD analysis
P-XRD patterns of pure aceclofenac and optimized cationized
starch–alginate beads containing aceclofenac (F-O) are shown
in Fig. 8. P-XRD of pure aceclofenac (a) showed significant
peak characteristic peaks at 18.58, 19.18, 22.68, 24.28, 25.98(2u). These significant characteristic peaks of aceclofenac also
appeared in the P-XRD pattern of the optimized beads con-
taining aceclofenac. However, the intensity of these peaks
referred to the crystalline nature of pure aceclofenac
decreased significantly in the optimized beads containing
aceclofenac, which could be due to the effect of polymer or
formulation process.
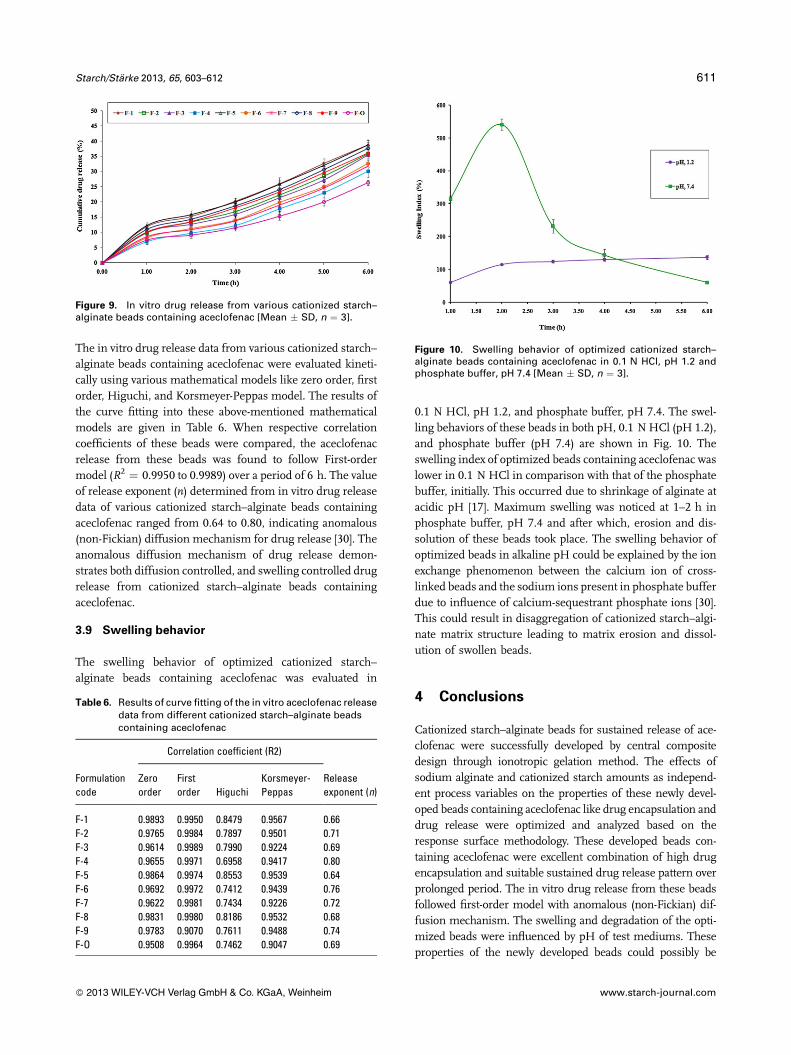
3.8 In vitro drug release
The in vitro drug release studies were carried out for various
cationized starch–calcium alginate beads containing aceclo-
fenac in the 0.1 N HCl (pH, 1.2) for first 2 h and then, in
phosphate buffer (pH, 7.4) for next 4 h. All these cationized
starch–alginate beads containing aceclofenac showed pro-
longed release of aceclofenac over 6 h (Fig. 9). Aceclofenac
release from these beads in the acidic medium was <16%
after 2 h for all these beads containing aceclofenac due to the
shrinkage of alginate at acidic pH. The trace amount of drug
release could probably be due to the presence of drug crystals
onto bead surface. After that, drug release was observed faster
in phosphate buffer (pH, 7.4) comparatively, due to the higher
swelling rate of these beads in phosphate buffer. The per-
centage drug released from cationized starch–alginate beads
containing aceclofenac in 6 h (R6 h) was within the range of
26.28 � 1.21 to 38.80 � 1.54%, and was found to be lower
with the increasing of both sodium alginate and cationized
starch amount. In case of beads, containing higher polymer
contents, themore hydrophilic property of the polymers could
probably binds better with water to form viscous gel structure.
This might blockade the pores on the surface of beads and
could sustain the drug release from these formulated beads.
Figure 6. Scanning electron microphoto-graph of optimized cationized starch–algi-nate beads containing aceclofenac (F-O):60� (a), and 500� (b).
Figure 7. The FTIR spectra of sodium alginate (a), cationizedstarch (b), blank cationized starch–calcium alginate beads (c),cationized starch–calcium alginate beads containing aceclofenac(F-O) (d), and pure aceclofenac (e).
Figure 8. P-XRD pattern of pure aceclofenac (a), and optimizedcationized starch–calcium alginate beads containing aceclofenac(F-O) (b).
610 J. Malakar et al. Starch/Starke 2013, 65, 603–612
� 2013 WILEY-VCH Verlag GmbH & Co. KGaA, Weinheim www.starch-journal.com
The in vitro drug release data from various cationized starch–
alginate beads containing aceclofenac were evaluated kineti-
cally using various mathematical models like zero order, first
order, Higuchi, and Korsmeyer-Peppas model. The results of
the curve fitting into these above-mentioned mathematical
models are given in Table 6. When respective correlation
coefficients of these beads were compared, the aceclofenac
release from these beads was found to follow First-order
model (R2 ¼ 0.9950 to 0.9989) over a period of 6 h. The value
of release exponent (n) determined from in vitro drug release
data of various cationized starch–alginate beads containing
aceclofenac ranged from 0.64 to 0.80, indicating anomalous
(non-Fickian) diffusion mechanism for drug release [30]. The
anomalous diffusion mechanism of drug release demon-
strates both diffusion controlled, and swelling controlled drug
release from cationized starch–alginate beads containing
aceclofenac.
3.9 Swelling behavior
The swelling behavior of optimized cationized starch–
alginate beads containing aceclofenac was evaluated in
0.1 N HCl, pH 1.2, and phosphate buffer, pH 7.4. The swel-
ling behaviors of these beads in both pH, 0.1 N HCl (pH 1.2),
and phosphate buffer (pH 7.4) are shown in Fig. 10. The
swelling index of optimized beads containing aceclofenac was
lower in 0.1 N HCl in comparison with that of the phosphate
buffer, initially. This occurred due to shrinkage of alginate at
acidic pH [17]. Maximum swelling was noticed at 1–2 h in
phosphate buffer, pH 7.4 and after which, erosion and dis-
solution of these beads took place. The swelling behavior of
optimized beads in alkaline pH could be explained by the ion
exchange phenomenon between the calcium ion of cross-
linked beads and the sodium ions present in phosphate buffer
due to influence of calcium-sequestrant phosphate ions [30].
This could result in disaggregation of cationized starch–algi-
nate matrix structure leading to matrix erosion and dissol-
ution of swollen beads.
4 Conclusions
Cationized starch–alginate beads for sustained release of ace-
clofenac were successfully developed by central composite
design through ionotropic gelation method. The effects of
sodium alginate and cationized starch amounts as independ-
ent process variables on the properties of these newly devel-
oped beads containing aceclofenac like drug encapsulation and
drug release were optimized and analyzed based on the
response surface methodology. These developed beads con-
taining aceclofenac were excellent combination of high drug
encapsulation and suitable sustained drug release pattern over
prolonged period. The in vitro drug release from these beads
followed first-order model with anomalous (non-Fickian) dif-
fusion mechanism. The swelling and degradation of the opti-
mized beads were influenced by pH of test mediums. These
properties of the newly developed beads could possibly be
Figure 9. In vitro drug release from various cationized starch–alginate beads containing aceclofenac [Mean � SD, n ¼ 3].
Table 6. Results of curve fitting of the in vitro aceclofenac releasedata from different cationized starch–alginate beadscontaining aceclofenac
Formulation
code
Correlation coefficient (R2)
Release
exponent (n)
Zero
order
First
order Higuchi
Korsmeyer-
Peppas
F-1 0.9893 0.9950 0.8479 0.9567 0.66
F-2 0.9765 0.9984 0.7897 0.9501 0.71
F-3 0.9614 0.9989 0.7990 0.9224 0.69
F-4 0.9655 0.9971 0.6958 0.9417 0.80
F-5 0.9864 0.9974 0.8553 0.9539 0.64
F-6 0.9692 0.9972 0.7412 0.9439 0.76
F-7 0.9622 0.9981 0.7434 0.9226 0.72
F-8 0.9831 0.9980 0.8186 0.9532 0.68
F-9 0.9783 0.9070 0.7611 0.9488 0.74
F-O 0.9508 0.9964 0.7462 0.9047 0.69
Figure 10. Swelling behavior of optimized cationized starch–alginate beads containing aceclofenac in 0.1 N HCl, pH 1.2 andphosphate buffer, pH 7.4 [Mean � SD, n ¼ 3].
Starch/Starke 2013, 65, 603–612 611
� 2013 WILEY-VCH Verlag GmbH & Co. KGaA, Weinheim www.starch-journal.com
advantageous in terms of advanced patient compliance with
reduced dosing interval. This type of polymeric beads can also
be exploited for sustained release drug delivery of other drugs
and can be commercially processed easily.
The authors have declared no conflict of interest.
5 References
[1] Herman, J., Remon, J. P., De Velder, J., Modifiedstarches as hydrophilic matrices for controlled oraldelivery. 1. Production and characterization of thermallymodified starches. Int. J. Pharm. 1989, 56, 51–63.
[2] Prado, H. J., Matulewicz, M. C., Bonelli, P. R., Cukierman,A. L., Preparation and characterization of a novel starch-based interpolyelectrolyte complex as matrix for con-trolled drug release. Carbohydr. Res. 2009, 344, 1325–1331.
[3] Tay, S. H., Pang, S. C., Chin, S. F., Facile synthesis ofstarch-maleate monoesters from native sago starch.Carbohydr. Polym. 2012, 88, 1195–1200.
[4] Pang, S. C., Chin, S. F., Tay, S. H., Tchong, F. M., Starch-maleate-polyvinyl alcohol hydrogels with controllableswelling behaviours. Carbohydr. Polym. 2011, 84, 424–429.
[5] Cui, D., Liu, M., Wu, L., Bi, Y., Synthesis of potato starchsulphate and optimization of the reaction conditions. Int.J. Biol. Macromol. 2009, 44, 294–299.
[6] Willett, J. L., Shogren, R. L., Processing and properties ofextruded starch/polymer foams. Polymer 2002, 43,5935–5947.
[7] Raghavan, D., Emekalam, A., Characterization of starch/polyethylene and starch/polyethylene/poly (lactic acid)composites. Polym. Degrad. Stabil. 2001, 72, 509–517.
[8] Zhang, L., Den, X., Zhao, S., Huang, Z., Biodegradablepolymer blends of poly (3-hydroxybutyrate) and starchacetate. Polym. Int. 1997, 44, 104–110.
[9] Pohja, S., Suihko, E., Vidgren, M., Paronen, P.,Ketolainen, J., Starch acetate as a tablet matrix for sus-tained drug release. J. Control. Release 2004, 94, 293–302.
[10] Rahmouni, M., Chouinard, F., Nekka, F., Lenaerts, V.,Leroux, J. C., Enzymatic degradation of cross-linked highamylose starch tablets and its effect on in vitro release ofsodium diclofenac. Eur. J. Pharm. Biopharm. 2001, 51,191–198.
[11] O’Brien, S., Wang, Y., Vervaet, C., Remon, J. P., Starchphosphates prepared by reactive extrusion as sustainedrelease agent. Carbohydr. Polym. 2009, 76, 557–566.
[12] Wang, Q., Hu, X., Du, Y., Kenedy, J. F., Alginate/starchblend fibers and their properties for drug controlledrelease, Carbohydr. Polym. 2010, 82, 842–847.
[13] Kim, Y. J., Park, H. G., Yang, Y. L., Yoon, Y. et al.,Multifuctional drug delivery system using starch–alginate beads for controlled release. Biol. Pharm.Bull. 2005, 28, 394–397.
[14] Jha, A. K., Bhattacharya, A., Preparation and in vitro evalu-ation of sweet potato starch blended sodiumalginate microbeads. Adv. Nat. Appl. Sci. 2008, 2, 122–128.
[15] Sachan, N. K., Bhattacharya, A., Modeling and charac-terization of drug release from glutinous rice starchbased hydrogel beads for controlled drug delivery. Int.J. Health Res. 2009, 2, 93–99.
[16] Soares, G. A., de Castro, A. D., Cury, B. S. F., Evangelista,R. C., Blends of cross-linked high amylase starch/pectinloaded with diclofenac. Carbohydr. Polym. 2013, 91,135–142.
[17] Xie, X., Liu, Q., Cui, S. W., in: Cui, S. W. (Ed.), FoodCarbohydrates: Chemistry, Physical Properties, andApplications, CRC Press, Boca Raton, FL 2005, pp.357–406.
[18] Rutkaite, R., Bendoraitiene, J., Khimaviciute, R.,Zemaitaitis, R., Cationic starch nanoparticles based onpolyelectrolyte complexes. Int. J. Biol. Macromol. 2012,50, 687–693.
[19] Pal, S., Mal, D., Singh, R. P., Cationic starch: an effectiveflocculating agent. Carbohydr. Polym. 2005, 59, 417–423.
[20] Kuo, W.-Y., Lai, H.-M., Effects of reaction conditionson the physicochemical properties of cationic starchstudied by RSM. Carbohydr. Polym. 2009, 75, 627–635.
[21] Nayak, A. K., Khatua, S., Hasanin, M. S., Sen, K. K.,Development of alginate-PVP K 30 microbeads forcontrolled diclofenac sodium delivery using centralcomposite design. DARU J. Pharm. Sci. 2011, 19, 356–366.
[22] Pal, D., Nayak, A. K., Development, optimization, andanti-diabetic activity of gliclazide-loaded alginate-methyl cellulose mucoadhesive microcapsules. AAPSPharmSci.Tech. 2011, 12, 1431–1441.
[23] Singh, B., Sharma, V., Chauhan, D., Gastroretentivefloating sterculia-alginate beads for use in antiulcer drugdelivery. Chem. Eng. Res. Des. 2010, 88, 997–1012.
[24] Hua, S., Ma, H., Li, X., Yang, H., Wang, A., pH-sensitivesodium alginate/poly(vinyl alcohol) hydrogel beadsprepared by combined Ca2þ crosslinking and freeze-thawing cycles for controlled release diclofenac sodium.Int. J. Biol. Macromol. 2010, 46, 517–523.
[25] Nayak, A. K., Pal, D., Development of pH-sensitive tam-arind seed polysaccharide-alginate composite beads forcontrolled diclofenac sodium delivery using responsesurface methodology. Int. J. Biol. Macromol. 2011, 49,784–793.
[26] Pal, D., Nayak, A. K., Novel tamarind seed polysacchar-ide-alginate mucoadhesive microspheres for oral glicla-zide delivery: In vitro in vivo evaluation. Drug Deliv.2012, 19, 123–131.
[27] Chakraborty, S., Khandai, M., Sharma, A., Khanam, N.et al., Preparation, in vitro and in vivo evaluation ofalgino-pectinate bioadhesive microspheres: an investi-gation of the effects of polymers using multiple com-parison analysis. Acta Pharm. 2010, 60, 255–266.
[28] Yadav, A. V., Shete, A. S., Dabke, A. P., Formulationand evaluation of orodispersible liquisolid compactsof aceclofenac. Indian J. Pharm. Educ. Res. 2010, 44,227–235.
[29] Malakar, J., Nayak, A. K., Pal, D., Development of cloxacillinloaded multiple-unit alginate-based floating system byemulsion-gelation method. Int. J. Biol. Macromol. 2012,50, 138–147.
[30] Nayak, A. K., Das, B., Maji, R., Calcium alginate/gumArabic beads containing glibenclamide: developmentand in vitro characterization. Int. J. Biol. Macromol.2012, 51, 1070–1078.
612 J. Malakar et al. Starch/Starke 2013, 65, 603–612
� 2013 WILEY-VCH Verlag GmbH & Co. KGaA, Weinheim www.starch-journal.com