Embed Size (px)
Citation preview

This article was downloaded by: [Linnaeus University]On: 09 October 2014, At: 06:55Publisher: Taylor & FrancisInforma Ltd Registered in England and Wales Registered Number: 1072954 Registered office: Mortimer House,37-41 Mortimer Street, London W1T 3JH, UK
Environmental TechnologyPublication details, including instructions for authors and subscription information:http://www.tandfonline.com/loi/tent20
Modified septic tank-anaerobic filter unit as a two-stage onsite domestic wastewater treatment systemMeena Kumari Sharmaa, Anwar Khursheedb & Absar Ahmad Kazmiaa Department of Civil Engineering, Indian Institute of Technology Roorkee, Roorkee,Uttarakhand, Indiab Department of Civil Engineering, Aligarh Muslim University, Aligarh, Uttar Pradesh, IndiaPublished online: 01 Apr 2014.
To cite this article: Meena Kumari Sharma, Anwar Khursheed & Absar Ahmad Kazmi (2014) Modified septic tank-anaerobicfilter unit as a two-stage onsite domestic wastewater treatment system, Environmental Technology, 35:17, 2183-2193, DOI:10.1080/09593330.2014.896950
To link to this article: http://dx.doi.org/10.1080/09593330.2014.896950
PLEASE SCROLL DOWN FOR ARTICLE
Taylor & Francis makes every effort to ensure the accuracy of all the information (the “Content”) containedin the publications on our platform. However, Taylor & Francis, our agents, and our licensors make norepresentations or warranties whatsoever as to the accuracy, completeness, or suitability for any purpose of theContent. Any opinions and views expressed in this publication are the opinions and views of the authors, andare not the views of or endorsed by Taylor & Francis. The accuracy of the Content should not be relied upon andshould be independently verified with primary sources of information. Taylor and Francis shall not be liable forany losses, actions, claims, proceedings, demands, costs, expenses, damages, and other liabilities whatsoeveror howsoever caused arising directly or indirectly in connection with, in relation to or arising out of the use ofthe Content.
This article may be used for research, teaching, and private study purposes. Any substantial or systematicreproduction, redistribution, reselling, loan, sub-licensing, systematic supply, or distribution in anyform to anyone is expressly forbidden. Terms & Conditions of access and use can be found at http://www.tandfonline.com/page/terms-and-conditions

Environmental Technology, 2014Vol. 35, No. 17, 2183–2193, http://dx.doi.org/10.1080/09593330.2014.896950
Modified septic tank-anaerobic filter unit as a two-stage onsite domestic wastewatertreatment system
Meena Kumari Sharmaa,∗, Anwar Khursheedb and Absar Ahmad Kazmia
aDepartment of Civil Engineering, Indian Institute of Technology Roorkee, Roorkee, Uttarakhand, India; bDepartment of CivilEngineering, Aligarh Muslim University, Aligarh, Uttar Pradesh, India
(Received 30 September 2013; accepted 17 February 2014 )
This study demonstrates the performance evaluation of a uniquely designed two-stage system for onsite treatment of domesticwastewater. The system consisted of two upflow anaerobic bioreactors, a modified septic tank followed by an upflow anaerobicfilter, accommodated within a single cylindrical unit. The system was started up without inoculation at 24 h hydraulic retentiontime (HRT). It achieved a steady-state condition after 120 days. The system was observed to be remarkably efficient inremoving pollutants during steady-state condition with the average removal efficiency of 88.6 ± 3.7% for chemical oxygendemand, 86.3 ± 4.9% for biochemical oxygen demand and 91.2 ± 9.7% for total suspended solids. The microbial analysisrevealed a high reduction (>90%) capacity of the system for indicator organism and pathogens. It also showed a very goodendurance against imposed hydraulic shock load. Tracer study showed that the flow pattern was close to plug flow reactor.Mean HRT was also found to be close to the designed value.
Keywords: domestic wastewater, indicator organism, pathogens, two-stage system, onsite treatment, tracer study
1. IntroductionMost of the population living in rural and peri-urban areasof developing countries depend upon onsite systems for thetreatment of domestic wastewater. The conventional sep-tic tank (CST) is the oldest and the most popular modeof onsite wastewater treatment in such areas. Accordingto the census of India 2011, total sanitation coverage is50.2%, which comprises 22.2% septic tank, 11.9% pipedsewer system and 15.4% other different options (pit toiletswith or without slab, public toilets and others).[1] Due tosome favourable economical and functional features, suchas simple design, low-cost easier installation and minimummaintenance, septic tanks are the most popular option ofonsite wastewater treatment in such areas of the developingcountries. But, there are several inherent drawbacks associ-ated with existing form of septic tank, the most significantone being its low treatment efficiency.[2,3] To overcome theissue of low efficiency and certain other drawbacks, thereis a need for improvement in the existing design of thesystem. Hence, this study was undertaken with the objec-tive of developing an advanced septic system for the onsitetreatment of domestic wastewater, which is possible eitherby modifications in the existing septic tank design or byadditional post-treatment measures. A number of alterna-tives have been suggested to overcome the drawbacks ofthe CST.[4–6] For the post-treatment of septic tank efflu-ent, several options have been reported,[7–9] out of which
∗Corresponding author. Email: [email protected]
anaerobic filter has been one of the most recommendedone.[10,11] However, all these alternatives require largersize reactors associated with high operational and construc-tional costs. In addition, sometimes it demands a completelynew structure.
Thus, the present study was carried out to develop anew modified version of CST, expecting it to maintainthe favourable features of the existing system as well asovercoming its major drawbacks. Recently, several stud-ies have been reported that the two-stage systems canachieve higher treatment efficiency than the single-stagetreatment systems.[12,13] In fact, the typical feature of thetwo-stage systems, a high-loaded first stage followed by amethanogenic-stage treatment, has been found to improvethe treatment efficiency. Therefore, for the present studyan advanced onsite treatment system was developed to uti-lize the benefits of two-stage systems while minimizing therequirement of land and cost of operation and maintenance.
The present two-stage system consisted of two upflowanaerobic reactors accommodated within a single unit.The system was designed to incorporate the two possibleoptions, the first modification in septic tank and the sec-ond of the post-treatment measure, collectively within thesame unit. The first anaerobic reactor worked as a sep-tic tank with modification in the direction of flow fromhorizontal to upflow mode. The second anaerobic reactorworked as an anaerobic filter following the septic tank. As
© 2014 Taylor & Francis
Dow
nloa
ded
by [
Lin
naeu
s U
nive
rsity
] at
06:
55 0
9 O
ctob
er 2
014

2184 M.K. Sharma et al.
the flow direction through the system was changed to theupflow mode rather than the conventional horizontal flow inCST, removal of suspended solids improved due to enmesh-ments. It also helped in enhancing the degree of contactbetween influent raw domestic wastewater and anaerobicsludge accumulated at the bottom of the tank.[6] Most of thevolume of designed system occupied vertical space ratherthan horizontal, which minimized its footprint.
The removal of pathogens was given equal importanceas the removal of organic matter considering their healthhazards. The domestic wastewater contains a wide vari-ety of faecal indicators and pathogens. The mechanism fortheir removal mainly depends on sedimentation, attach-ment, filtration and the presence of harsh environmentalconditions of extreme pH, temperature, dissolved oxygenand dissolved solids.[14,15] Hence, the present study pro-vides quantitative information about the fate of indicatororganisms and pathogens in a two-stage treatment sys-tem. In addition, the study also incorporated the othermajor aspects, such as (a) long-term performance of thesystem, (b) performance during hydraulic shock load, (c)sludge characteristics and its morphological study and (d)hydrodynamics characteristics of the system.
2. Materials and methods2.1. Experimental set-upA laboratory-scale treatment unit was designed, fabricatedand installed at the campus of Indian Institute of Technology
Roorkee, India. The schematic diagram of the experimentalset-up of the two-stage system is illustrated in Figure 1.The treatment unit was cylindrical in shape and fabricatedby using a transparent acrylic plastic pipe having the unitdimensions as 450 mm (height) × 300 mm (diameter) witha total working volume of 24 L. The unit was connectedwith inlet and outlet pipes to work as a CST designed asper Indian Standards for a single family. Furthermore, toconvert the unit into a two-stage system, it was dividedinto two equal chambers by inserting a partition wall in themiddle of the unit.
A vertically positioned inlet pipe having a length ofabout three-fourth of the height of the water level was pro-vided in chamber I. This modified arrangement of the inletpipe facilitated the movement of the raw wastewater fed intothe system in an upflow mode (modified septic tank). Then,the partially treated wastewater in chamber I was directedto the bottom of chamber II, which was packed with bakedclay media (upflow anaerobic filter). The medium was kepton a semi-circular perforated plastic plate, placed at a heightof 60 mm from the bottom of the tank. The partially treatedwastewater received from chamber I got distributed uni-formly and moved upwards while being in contact withthe media present in chamber II and left the treatment unitcontinuously through an outlet positioned at the top of thechamber II.
The baked clay used in the filter chamber had nearlyidentical particle size of about 10–12 mm with 46%porosity. The media were obtained by crushing the locally
Figure 1. Schematic diagram of the laboratory scale two-stage onsite wastewater treatment unit.
Dow
nloa
ded
by [
Lin
naeu
s U
nive
rsity
] at
06:
55 0
9 O
ctob
er 2
014
Environmental Technology 2185
available bricks into small pieces and then subsequentlypassing it through three consecutive sieves of diameter 8–10–12 mm. Finally, the material retained by the sieve ofdiameter 10 mm was used as the supporting media.
2.2. Start-up and operation of the systemThe system was started up in December 2011 without usinginoculums and operated for a period of 250 days. The mon-itoring was carried out throughout the study period at anambient temperature of 12–40◦C. The system was continu-ously fed with domestic wastewater at a constant flow rateof 24 L/day, which corresponded to a hydraulic retentiontime (HRT) of 24 h till the system achieved steady-statecondition. Pseudo steady-state condition was assumed tobe achieved when the variation in effluent COD concentra-tion was found to be insignificant. After that, the effect ofhydraulic shock load on the performance and stability ofthe system was evaluated to identify its feasibility in actualonsite conditions.
2.3. Feed flow patternIn the actual conditions, onsite systems generally receive thewastewater having large variations in quantity and qualityboth throughout the day. Therefore, the feed pattern waskept according to the daily variations in the flow rate ofwastewater. The daily variation in the flow was determinedon the basis of peak flow factor (PFF), which is the ratioof peak to average hourly flow. The value of PFF 1 andPFF 2 was simulated for constant flow and hydraulic shockload, respectively, at a fixed HRT of 24 h. At the time ofPFF 1, the system was continuously fed at a constant flowrate of 16.6 ml/min, while at PFF 2, variable feed flow wassupplied during a day. Peak flows were set twice a day in themorning and evening for the duration of 1 h each to simulatethe household wastewater flow pattern. The peak flow rateat the time of PFF 2 was maintained by increasing it twotimes the average flow and it came out with the value of33.2 ml/min. Furthermore, the hourly flow rate before andafter the peak flow periods was regulated at half of the peakflow rate with the value of 16.6 ml/min. For the remaining18 h, the system was fed with a flow rate of 14.9 ml/minto indicate the water volume of 0.9-fold of the average asmaintained by Sarathai et al.[16]
2.4. Sampling and analysisWastewater samples were drawn from the points of influ-ent, primary chamber of the system (effluent of modifiedseptic tank) and the finally treated effluent. The samplesof influent and the finally treated effluent were monitoreddaily for chemical oxygen demand (COD), pH and temper-ature; whereas biochemical oxygen demand (BOD), totalsuspended solids (TSS), ammonia nitrogen (NH+
4 − N)
and total phosphorous (TP) were measured twice a week.
Other parameters such as total Kjeldhal nitrogen (TKN),sulphate, sulphide, volatile fatty acid (VFA) and alkalin-ity were analysed on a weekly basis. The samples drawnfrom the primary chamber (modified septic tank) were anal-ysed monthly for all parameters. All the analyses wereperformed according to Standard Methods,[17] except alka-linity and VFA. Alkalinity and VFA were measured bytitration method suggested by DiLallo and Albertson.[18]Measurement of pH was carried out by using HQ Seriesportable pH probes (Model 40 D Hach, USA). A CODdigester (Model AL 38SC, Aqualytic, Germany) and anUV–Vis spectrophotometer (Model DR 4000 Hach, USA)were used for the COD analysis.
All the samples were assayed for microbial analysis andtheir enumeration was carried out for indicator organismand pathogens. Indicator organisms such as total coliform(TC) and faecal coliform (FC) were enumerated weekly,whereas faecal streptococci (FS), Escherichia coli as wellas pathogenic bacteria such as Salmonella and Shigellawere enumerated once in a month. The concentration ofTC, FC and FS was enumerated by Multiple Tube Fermen-tation Technique,[17] whereas E. coli was enumerated byserial dilutions of the sample plated on MacConkey Agarmedium and incubated in an inverted position for 24–48 hat 37◦C. Salmonella species were enumerated by culturingon the plates of Modified Semisolid Rappaport-Vassiliadis(MSRV) medium and incubated for 17 h at 42◦C. Suspectedcolonies were subcultured for confirmation on xylose lysinedeoxycholate (XLD) agar with 21-h incubation at 35◦C.[19]Shigella species were enumerated by plating serial dilutionof samples on MacConkey agar and XLD medium. Theplates were incubated in an inverted position for 24 h at37◦C.
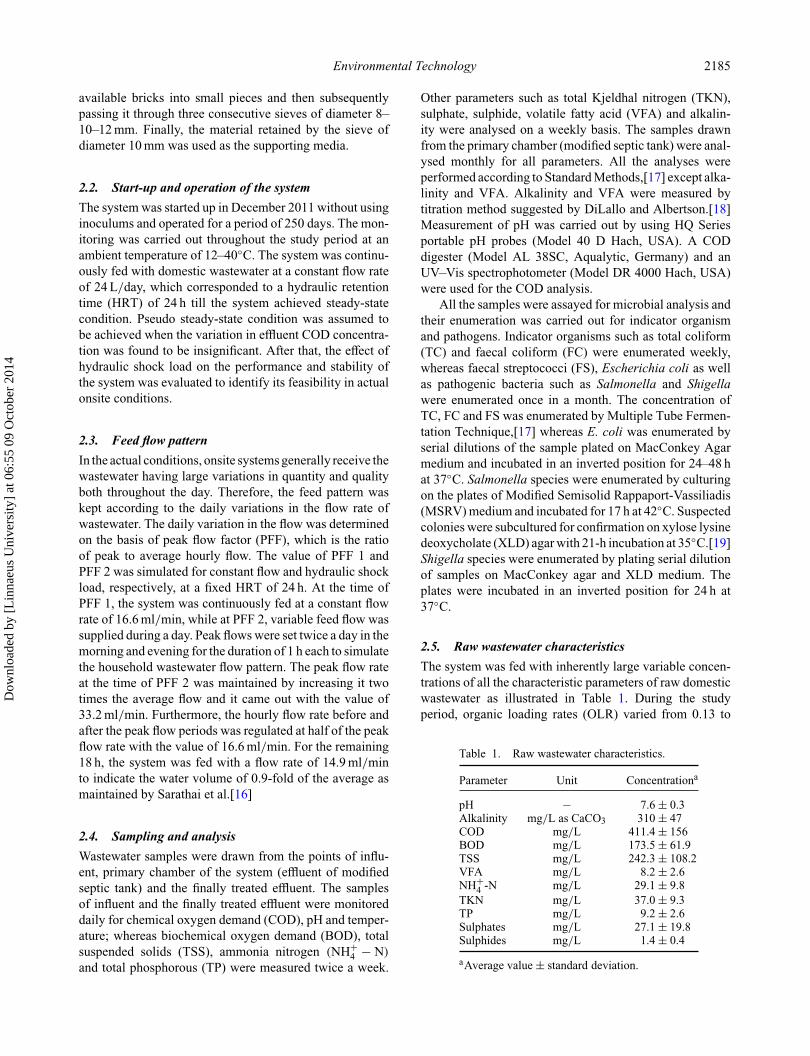
2.5. Raw wastewater characteristicsThe system was fed with inherently large variable concen-trations of all the characteristic parameters of raw domesticwastewater as illustrated in Table 1. During the studyperiod, organic loading rates (OLR) varied from 0.13 to
Table 1. Raw wastewater characteristics.
Parameter Unit Concentrationa
pH – 7.6 ± 0.3Alkalinity mg/L as CaCO3 310 ± 47COD mg/L 411.4 ± 156BOD mg/L 173.5 ± 61.9TSS mg/L 242.3 ± 108.2VFA mg/L 8.2 ± 2.6NH+
4 -N mg/L 29.1 ± 9.8TKN mg/L 37.0 ± 9.3TP mg/L 9.2 ± 2.6Sulphates mg/L 27.1 ± 19.8Sulphides mg/L 1.4 ± 0.4
aAverage value ± standard deviation.
Dow
nloa
ded
by [
Lin
naeu
s U
nive
rsity
] at
06:
55 0
9 O
ctob
er 2
014

2186 M.K. Sharma et al.
1.09 kg COD/m3 day, with an average BOD to COD ratioof the influent being 0.45. The value of this ratio is an agree-ment, which indicates the suitability for its treatment bybiological means.[20]
The microbial quality of the raw domestic waste-water was quite consistent with an average concentra-tion of TC, FC, FS and E. coli observed as 1.2 × 10⁷ ±1.0 × 10⁷, 1.7 × 10⁶ ± 1.1 × 10⁶, 9.3 × 10⁵ ± 2.9 × 10⁵
MPN/100 ml and 5.0 × 10⁵ ± 2.2 × 10⁵ CFU/100 ml,respectively, throughout the study period. In addition,the major pathogens such as Salmonella and Shigellawere quantified as 3.4 × 10⁵ ± 1.1 × 10⁵ MPN/100 ml and1.4 × 104 ± 9.0 × 10³ CFU/100 ml, respectively.
2.6. Specific methanogenic activityAnaerobic sludge is characterized by its specificmethanogenic activity (SMA), which represents the max-imum methane production capacity of methanogenic bac-teria present in the accumulated sludge. At the end of therun, methanogenic activity of anaerobic sludge withdrawnfrom the bottom of the primary chamber of the systemwas assessed according to the procedure reported by Isaet al.[21] The test was carried out in Oxitop bottles (WTW,Germany) of 250 ml working volume and performed in theshaking condition at 30 ± 2◦C. Methanogenic activity ofthe sludge was calculated on the basis of the followingequation:
SMA = (G)(CF)
(VSS)(S)(T)(1)
where SMA is the specific methanogenic activity in(gCOD−CH4)/gVSS day), G is the methane produced in(ml), CF is the conversion factor in (gCOD−CH4 in a stan-dard condition of temperature 0◦C and pressure of 1 atm/mlCH4 at experimental condition), VSS is the volatile sus-pended solids (gVSS/g of sludge), S is the sludge added tothe bottle (g) and T is the time duration (days).
2.7. Sludge morphologyThe morphology of the withdrawn sludge was examinedusing scanning electron microscope (SEM). Sample wasfirst fixed for 1 h at 4◦C with 2.5% (w/v) glutaraldehyde inphosphate buffer solution. It was then dehydrated through agraded series of acetone–water mixtures (10%, 25%, 50%,75%, 90% and 100%). These samples, in each mixture, werethen brought to equilibrium for 10 min and finally dried offby the critical-point drying method before being sputter-coated with gold particles.[22] Finally, the samples wereexamined using SEM (LEO 435 VP).
2.8. COD mass balanceCOD mass balance is a useful tool to quantify the electronsinks in an anaerobic reactor. The influent COD fed to the
treatment unit gets transformed into different components,such as biomass COD and methane COD, whereas a fractionof COD is consumed in the reduction of sulphates present inthe raw domestic wastewater. Therefore, the examination ofCOD mass balance of the whole system for the entire studyperiod was carried out by using the following equation:
CODinf = CODeff + CODCH4 + CODaqCH4+ CODbiomass
+ CODSO4 + CODunacc (2)
where CODinf and CODeff are the total masses of influ-ent and effluent COD, respectively, in g/day, calculatedby multiplying the respective concentration of COD withthe volume of treated wastewater. The terms CODCH4
and CODaqCH4represent the COD of methane produced
in gaseous and aqueous forms, respectively, in g/day.Aqueous methane escaped with the effluent was calculatedaccording to Henry’s law.[20] CODbiomass is the COD of thesludge developed in the system, in g/day, calculated on thebasis of the total growth of VSS within the reactor multi-plied by a factor of 1.42. CODSO4 is the COD consumed insulphate reduction, in g/day, calculated stoichiometricallyby multiplying the reduced mass of sulphates with a factorof 0.67.
2.9. Tracer studyTracer study was performed to analyse the hydrodynamiccharacteristics of the system at both the flow conditions ofPFF 1 and PFF 2 after attaining the steady-state condition.
The tracer step input technique was used for the studyby introducing lithium chloride as a tracer (feed concen-tration of 100 mg/L). Lithium chloride was chosen as thetracer because of its several favourable features.[23] Theresponse was detected as a tracer–response curve by takinggrab samples from the outlet of the reactor at an interval of30 min from 6 h onwards till 12 h. Thereafter, the samplecollection interval was reduced to 15 min till the effluentconcentration matched with the influent concentration. Thechloride ion concentration was measured with a conductiv-ity meter (Hach Model CDC 401) after suitable calibrationwith 0.1 N KCl solution.
To compare the results of the tracer study at differ-ent flow conditions, normalized (with dimensionless unit)time and concentration were used to obtain the normalizedresidence time distribution (RTD) curves. The normalizedRTD curves were further analysed to calculate the meanHRT, variance and dead space within the system by usinga model.[22,24]
Generally, the upflow anaerobic reactors are consid-ered to operate as plug flow reactors. However, there isalways a small amount of deviation from the ideal plugflow condition. This deviation is expressed by a dimen-sionless dispersion number (d), calculated on the basis ofvariance of the RTD curve. A large dispersion number,
Dow
nloa
ded
by [
Lin
naeu
s U
nive
rsity
] at
06:
55 0
9 O
ctob
er 2
014

Environmental Technology 2187
d = ∞, indicates a perfectly mixed system; a small disper-sion number, d = 0, suggests an ideal plug-flow system;d = 0.02 is defined as an intermediate and d = 0.2 showsa large degree of dispersion.[25]
3. Results and discussion3.1. Physico-chemical characteristicsDuring the start-up period, average pollutant removal effi-ciency in terms of COD was observed to be 75.3% withthe contribution of 54.3% by the modified septic tank,which might be attributed to the settling and interceptionof the organic matter in the accumulated sludge at the bot-tom of the primary chamber. Thereafter, the system wasassumed to achieve the steady-state condition after 120 daysand considered to be matured or acclimatized. During thesteady-state condition, the overall performance of the sys-tem improved with the average COD removal efficiencyincreasing up to 88.7%, which is found to be almost constantthereafter. The average performance characteristics of thetwo-stage system in steady-state condition are summarizedin Table 2.
During the study period, it was observed that the anaer-obic biodegradation of organic matter was influenced bytemperature. A diurnal variation in wastewater temperaturewas observed to vary in the range of 11–34◦C. The effect ofvariable temperature on the COD removal efficiency is illus-trated in Figure 2(a). The system was started in winter time;and with the increase in temperature over time, the overallCOD removal efficiency of the system was observed to beincreased. At the time of maximum temperature of sewageat 34◦C, the COD removal efficiency was observed to be92.5%.
Similarly, the COD removal efficiency was also influ-enced by OLR. At a steady-state condition, the variation inthe weekly averages of COD removal efficiency at different
Table 2. Average performance of the treatment unit atsteady-state condition.
Effluent concentrationa
Final removalParameter Unit Stage I Stage II efficiencya (%)
pH – 7.2 ± 0.3 7.7 ± 0.4 –Alkalinity mg/L as 319 ± 20 359 ± 46 –
CaCO3COD mg/L 176.3 ± 75.9 44.1 ± 4.4 88.6 ± 3.7BOD mg/L 87.6 ± 30.9 22.3 ± 8.5 86.3 ± 4.9TSS mg/L 123.7 ± 60.9 19.6 ± 8.7 91.2 ± 9.7VFA mg/L 30.2 ± 8.0 17.5 ± 4.0 –NH+
4 -N mg/L 30.5 ± 10.2 33.3 ± 11.0 –TKN mg/L 33.4 ± 7.7 30.2 ± 7.8 18.3 ± 3.8TP mg/L 8.4 ± 1.9 7.2 ± 2.1 20.9 ± 9.5Sulphates mg/L 16.4 ± 4.3 10.2 ± 3.1 63.3 ± 6.2Sulphides mg/L 4.3 ± 0.4 5.7 ± 1.7 –
aAverage value ± standard deviation.
Figure 2. Evolution of the COD removal efficiency with variable(a) sewage temperature and (b) organic loading rate.
OLRs is illustrated in Figure 2(b). It shows that the over-all COD removal efficiency of the system increased withthe increasing OLRs and it attained the maximum value of94.9% at the highest OLR of 1.09 kg COD/m3. However, atthe lower OLR of 0.13 kg COD/m3 the removal efficiencydropped down to 64.4%.
Figure 3(a) and 3(b) illustrates the influent and efflu-ent concentration patterns for BOD and TSS with theirrespective removal efficiencies during the study period. Inspite of large fluctuations in the influent concentration, thecharacteristics of the effluent were stable and the systemachieved a consistent performance level after attaining thesteady-state condition with the average removal efficienciesfor BOD and TSS as 86.3% and 91.2%, respectively. Thefinal average effluent BOD and TSS concentrations wereobserved as 22.3 ± 8.5 and 19.6 ± 8.7 mg/L, respectively,which fulfilled the disposal standards prescribed in Indiathat the treated sewage should not contain BOD and TSSmore than 30 and 100 mg/L, respectively.
It was observed that the two-stage system with its newconfiguration produced much better quality of the effluentthan the CST for onsite domestic wastewater treatment. Thesystem delivered a high-quality effluent with substantiallyhigher removal efficiencies, which could be accomplishedby an effective modification and a novel combination ofthe two stages of treatment. The modified septic tank wasobserved with improved removal efficiency of BOD andTSS with the individual contributions of 48.3% and 53.8%,respectively, in the overall efficiency of the system. Theaverage concentrations of BOD and TSS in the effluent from
Dow
nloa
ded
by [
Lin
naeu
s U
nive
rsity
] at
06:
55 0
9 O
ctob
er 2
014

2188 M.K. Sharma et al.
Figure 3. Evaluation of the parameter concentration of influent and effluent with percentage removal (a) BOD and (b) TSS.
the primary chamber (modified septic tank) were observedas 87.6 and 123.7 mg/L, respectively. Hence, the suspendedloading rate on the secondary chamber (anaerobic filter)varied in the range of 0.13–0.60 kg/m3 day on the basis ofTSSs leaving from the primary chamber.
The VFA conjunction with pH is an essential prereq-uisite parameter for maintaining the desired environmentalcondition in anaerobic treatment systems.[26] The averagepH value of the treated effluent during the experimentalperiod was observed as 7.7 ± 0.4, which is the optimalpH range for anaerobic metabolism.[20] Though the pHof the primary chamber was always lower than the influentpH, it increased at the effluent point of the system. Thisphenomenon may be attributed to the occurrence of hydrol-ysis, acidogenesis and acetogenesis in the primary chamber,which resulted in the accumulation of fatty acids.[27] Themaximum concentration of VFA in the primary chamberwas 64 mg/L, which was not detrimental to methanogensas it was lower than 150 mg/L.[28] Further, the increase inpH in the final effluent might be due to the consumption ofVFA by methanogens present within the system. However,the lesser presence of VFA in the finally treated effluent thanthe primary chamber might be due to the low methanogenicactivity of the biomass present in the treatment unit.
The alkalinity is another stability measure of the anaer-obic process. The concentration of alkalinity in treatedeffluent was always found to be 11–22% higher than theinfluent alkalinity. This may be attributed due to the for-mation of carbonates and bicarbonates within the system,which indicated a proper anaerobic functioning.
The effluent concentration of ammonia nitrogen wasfound to be increased by 14.7 ± 2.9%. However, the TKNwas partially removed by 18.3% with a contribution of 9.8%of the modified septic tank. This phenomenon of increasedammonia level and partial removal of Kjeldhal nitrogen maybe attributed to anaerobic degradation of biodegradable andremoval of non-biodegradable nitrogen compounds, respec-tively. The system demonstrated 20.9% average removalefficiency of TP, including 7.2% contribution of primarychamber of modified septic tank. Removal of phosphorousmay be due to its utilization in biomass development andentrapment within the accumulated sludge present in thesystem.
During the shock loading of PFF 2, the performanceof the primary chamber (modified septic tank) in terms ofCOD, BOD, TSS and FC reduced to 45.2%, 41.9%, 44.8%and 28%, respectively. This unfavourable performancemight be due to high turbulence, which led to washing out of
Dow
nloa
ded
by [
Lin
naeu
s U
nive
rsity
] at
06:
55 0
9 O
ctob
er 2
014

Environmental Technology 2189
Table 3. Results of microbial analysis at steady-state condition.
Parameter Unit Raw wastewatera Final effluenta Efficiencya (%)
TC MPN/100 ml 1.2 × 10⁷ ± 1.0 × 10⁷ 1.2 × 10⁶ ± 3.5 × 10⁵ 94.3 ± 5.7FC MPN/100 ml 1.7 × 10⁶ ± 1.1 × 10⁶ 2.0 × 10⁵ ± 9.8 × 10⁴ 93.3 ± 7.1FS MPN/100 ml 9.3 × 10⁵ ± 2.9 × 10⁵ 7.5 × 10⁴ ± 1.3 × 10⁴ 91.0 ± 3.0E. coli CFU/100 ml 5.0 × 10⁵ ± 2.2 × 10⁵ 4.1 × 10³ ± 2.2 × 10³ 99.2 ± 2.2Salmonella MPN/100 ml 3.4 × 10⁵ ± 1.1 × 10⁵ 2.3 × 10⁴ ± 1.8 × 10³ 99.6 ± 4.5Shigella CFU/100 ml 1.4 × 10⁴ ± 9 × 10³ 1.3 × 10² ± 1.1 × 10² 99.1 ± 1.2
aAverage value ± standard deviation.
Figure 4. Faecal coliform (FC) removal pattern.
the influent solids and settled biomass. However, the two-stage system demonstrated appreciable tolerance againsthydraulic shock load with the pollutant removal efficien-cies dropping down slightly to 87.1%, 85.6%, 87.6% and96.7% for COD, BOD, TSS and FC, respectively. The sys-tem exhibited appreciable stability and trimness because theconfiguration was strong enough for minimizing the effectof hydraulic shock load. The resilience displayed by thesystem could be attributed to the suitable modifications andconfinement of both the separate treatment processes in asingle unit. The upflow mode provided in both the chambersresulted in an increased resistance to hydraulic and organicshock loads.
3.2. Microbial characteristicsWorld Health Organization [29] has recognized TC and FCas indicators, which provide a total spectrum of water bornediseases. The microbial characteristics of the finally treatedeffluent at steady-state condition are summarized in Table 3.In general, FC is recognized as a key indicator organismthat represents the presence of bacterial pathogens as wellas enteric viruses. Thus, keeping it in view as a primary con-cern, the effectiveness of a two-stage system with respect toelimination of FC during the complete study period is illus-trated in Figure 4. The average removal of FC was found tobe 93.3% (log 1.4) with the effluent concentrations in therange of log 3.4–7.0 per 100 ml.
The average reduction of other indicator organisms ofTC, FS and E. coli were found to be 94.3%, 91% and99.2%, respectively. This high removal efficiency could beattributed to the combination of two mechanisms of phys-ical (adsorption onto the suspended solids) and biological(natural die-off and nutrient depletion) means under anaer-obic conditions.[30] The pathogens such as Salmonella andShigella were observed to be removed by 99.6% and 99.1%,respectively, during the steady-state condition at PFF 1.However, during shock load period of PFF 2, the removalefficiency of indicator organisms was slightly reduced andquantified by 92.8% for TC, 89.4% for FC, 84.7% for FSand 96.1% for E. coli. However, the removal of Salmonellaspecies was quantified as 98.2%, whereas for Shigella it wasobserved to be reduced to 97.4%.
3.3. Sludge characteristics and activityDuring the experimental period, no sludge was thrown offfrom the reactor to identify its sludge holding capacity. After220 days of operation period, the primary chamber wasfilled up with sludge. At this time, about 75% of the totalgenerated sludge was withdrawn from the primary chamber.The characteristics of the withdrawn sludge indicated theconcentrations of TSS and VSS to be as 25.7 and 19.3 g/L,respectively, with a VSS to TSS ratio of 0.75, which is anagreement that the sludge still needs further digestion beforeits final disposal.[31]
Dow
nloa
ded
by [
Lin
naeu
s U
nive
rsity
] at
06:
55 0
9 O
ctob
er 2
014

2190 M.K. Sharma et al.
Figure 5. SEM images showing different types of bacteria: (a) low-resolution view, (b) colony of methanosarcina-like cell, (c) protozoa,(d) rod-shaped bacteria – methanosaeta, (e) filamentous group of bacteria – methanothrix and (f) clumps of methanosarcina clustered-cocci,diplococci.
The SMA value of the withdrawn sludge using acetateas the substrate was observed to be 0.02 g COD-CH4/gVSSday. The activity of the sludge indicated low methanogenicactivity, as active anaerobic sludge represents the value ofactivity between 0.08 and 0.20 g CH4-COD/gVSS day.[32]
3.4. Scanning electron microscopicSEM images of microbes on the surface of the sludgeare illustrated in Figure 5. It indicated that the sludgeflocs seemed to be an agglomeration of methanothrix-likefilaments and revealed the presence of various bacterialdiversity and inert materials in the sludge flocs.
The reactor contained a large variety of hydrolysingand acid-producing microorganisms, predominated by clus-ters of filamentous bacteria and cocci of varying sizes andshapes. Two types of cocci were observed within the reac-tor: large and small. These cocci resembled species ofthe methanococcus genus and it plays an important rolein methanogenesis, the final stage of anaerobic digestionprocess.[33] Figure 5(b) and 5(f) illustrates the varia-tion and relative abundance of two types of cocci withinthe reactor during the study. The other morphotypes asillustrated in Figure 5(d) and 5(e) were observed to bebamboo-shaped rods, which is a typical characteristic of
the acetoclastic methanogen and methanosaeta. Thesemicroorganisms typically occurred in pairs and were oftenenmeshed in flocs of filaments.
3.5. Mass balanceThe COD mass balance over the total period of operationis illustrated in Figure 6. The mass balance was applied tothe system with the average input and output COD being9.02 and 1.86 g COD/day respectively. Results indicatedthat 80% of the input COD was removed within the reactorand got converted into different forms during the anaerobictreatment. The measurement of the methane gas generatedfrom the reactor was determined by means of calculation,which also included the fraction of unaccounted COD.
Mass balance analyses indicated that the input COD wasmainly converted into CH4, both in gaseous and aqueousforms. Out of the total removed COD, 26% and 47% wererecovered in aqueous and gaseous forms, respectively. Thesludge accounted for 23% of COD consumed in the sys-tem. COD consumed in sulphate reduction was quite low at3% only. Additionally, the calculated results of methanegas generation were compared with the results of themethanogenic activity test, which revealed that the resultsof the onsite methane production were in agreement with
Dow
nloa
ded
by [
Lin
naeu
s U
nive
rsity
] at
06:
55 0
9 O
ctob
er 2
014

Environmental Technology 2191
Figure 6. Mass balances of influent COD in the treatment unit: (a) total distribution and (b) percent distribution.
the activity test performed on the sludge in the laboratorybioassay.
3.6. Hydrodynamic characteristicsHydrodynamic characteristics are essential to identify themixing characteristics and flow pattern, which indicatethe actual exposure time and substrate distribution withinthe system and it also affect the treatment efficiency. Thenormalized RTD curves of two different flow conditions ofPFF1 and PFF 2 are illustrated in Figure 7.
The hydrodynamic characteristics indicated that themean HRT of the system was observed as 19.7 and 18.1 hat PFF 1 and PFF 2 loading, respectively. It was found thatthe mean HRT of the system did not change significantlyby the change in loading conditions at a fixed 24 h HRT.The modified arrangement of the inlet pipe in the septictank chamber and the presence of filter media in the sub-sequent chamber helped in maintaining the HRT as well asthe removal efficiency.
Dead volume increased to 24% from its initial value of17.9% when the system moved from PFF 1 to PFF 2. Thismight be due to the occurrence of more channelling within
Figure 7. Normalized residence time distribution (RTD) curvesfor treatment unit under the steady and variable loading.
the system at the time of shock load. It was observed that thedesigned system maintains the similar hydraulic character-istics at PFF 1 and PFF 2, which resulted in good stabilityeven at the time of hydraulic shock load. The calculateddispersion numbers of 0.037 and 0.035 for PFF 1 and PFF2
Dow
nloa
ded
by [
Lin
naeu
s U
nive
rsity
] at
06:
55 0
9 O
ctob
er 2
014
2192 M.K. Sharma et al.
indicated that the flow pattern within the system was inter-mediate between plug-flow and perfectly mixed flow duringboth conditions of hydraulic loading.
4. ConclusionsThe designed two-stage system is highly efficient, com-pactly designed and low-cost alternative to the existing sep-tic tank. It delivered a better-quality effluent with averageCOD, BOD and TSS concentrations of 44.1 ± 4.4, 22.3 ±8.5 and 19.6 ± 8.7 mg/L, respectively, during steady-statecondition at 24 h HRT. The system was highly efficientin removing indicator organism and pathogens. The newdesign enabled the system to be highly resilient to thehydraulic shock loads up to twice the average flow, as therewas no significant change noted on the performance of thesystem during these shock loading conditions.
Therefore, the present two-stage system is a feasibleoption of onsite domestic wastewater treatment for the peo-ple living in the unsewered rural and peri-urban areas of thedeveloping countries like India.
FundingThe authors thank the Ministry of Drinking Water Supply andSanitation, Government of India, New Delhi, India, for financialsupport.
References[1] Census of India. Houses household Amenities and Assets:
Latrine Facility. 2011. http://www.censusindia.gov.in/2011census/hlo/Data_sheet/India/Latrine.pdf
[2] Cullimore DR, Viraraghavan T. Microbiological aspectsof anaerobic filter treatment of septic tank effluent at lowtemperatures. Environ Technol. 2008;15:165–173.
[3] Nasr FA, Mikhaeil B. Treatment of domestic wastewa-ter using conventional and baffled septic tanks. EnvironTechnol. 2013;34;2337–2343.
[4] Bogte JJ, Breure AM, Van Andel JG, Lettinga G. Anaerobictreatment of domestic sewage in small-scale UASB reactors.Water Sci Technol. 1993;27(9):75–82.
[5] Mendoza L, Carballa M, Zhang L, Verstraete W. Treatmentof low and medium strength sewage in a lab-scale grad-ual concentric chambers (GCC) reactor. Water Sci Technol.2008;57:1155–1160.
[6] Moussavi G, Kazembeigi F, Farzadkia M. Performance of apilot scale up-flow septic tank for on-site decentralized treat-ment of residential wastewater. Process Saf Environ Protect.2010;88:47–52.
[7] Panswad T, Komolmethee L. Effects of hydraulic shock loadson small onsite sewage treatment unit. Water Sci Technol.1997;35:145–152.
[8] Iyo T, Yoshino T, Tadokoro M, Ogawa T, Ohno S.Advanced performance of small-scale domestic sewagetreatment plants using anaerobic–aerobic filter systemswith flow-equalization and recirculation. Environ Technol.1996;17:1235–1243.
[9] Wu S, Austin D, Liu L, Dong R. Performance of integratedhousehold constructed wetland for domestic wastewatertreatment in rural areas. Ecol Eng. 2011;37:948–954.
[10] US Environmental Protection Agency. Onsite wastewa-ter treatment systems manual. Washington, DC: Office ofResearch and Development; 2002.
[11] Raman V, Chakladar N. Upflow filters for septic tankeffluents. J Water Poll Cont Fed. 1972;41:1552–1560.
[12] Elmitwalli TA, Sayed S, Groendijk L, van Lier J, Zee-man G, Lettinga G. Decentralized treatment of concentratedsewage at low temperature in a two-step anaerobic sys-tem: two upflow-hybrid septic tanks. Water Sci Technol.2003;48:219–226.
[13] Zuo Z, Wu S, Zhang W, Dong R. Effects of organic load-ing rate and effluent recirculation on the performance oftwo-stage anaerobic digestion of vegetable waste. BioresourTechnol. 2013;146:556–561.
[14] Tyagi VK, Sahoo BK, Kazmi AA, Ahmad Z, Khursheed A,Chopra AK. Fate of coliforms and pathogenic parasite in fourfull-scale sewage treatment systems in India. Environ MonitAssess. 2011;181:123–135.
[15] Awuah E. Pathogen removal mechanisms in macrophyteand algal waste stabilization ponds [PhD dissertation].Netherland: Wageningen University; 2006.
[16] Sarathai Y, Koottatep T, Morel A. Hydraulic characteristicsof an anaerobic baffled reactor as onsite wastewater treatmentsystem. J Environ Sci. 2010;22:1319–1326.
[17] APHA. Standard methods for examination of water andwastewater. 21st ed. Washington, DC: American PublicHealth Association; 2005.
[18] DiLallo R, Albertson OE. Volatile acids by direct titration. JWater Pollut Control Fed. 1961;33(3):356–365.
[19] US Environmental Protection Agency. Method 1682:salmonella in sewage sludge (biosolids) by modifiedsemisolid Rappaport-Vassiliadis (MSRV) medium. Wash-ington, DC: Office of Water; 2006.
[20] Metcalf and Eddy. Wastewater engineering: treatment andreuse. 4th ed. New Delhi, India: Tata McGraw-Hill Publish-ing Company Limited; 2003.
[21] Isa MH, Farooqi IH, Siddiqi RH. Methanogenic activity testfor study of anaerobic processes. Indian J Environ Health.1993;35:1–8.
[22] Gopal Krishna GVT, Kumar P, Kumar P. Treatment oflow-strength soluble wastewater using an anaerobic baffledreactor (ABR). J Environ Manage. 2009;90:166–176.
[23] Anderson GK, Campos CMM, Chernicharo CAL, Smith LC.Evaluation of the inhibitory effects of lithium when used as atracer for anaerobic digesters. Water Res. 1991;25:755–760.
[24] Morgan-Sagastume JM, Jimenez B, Noyola A. Tracer stud-ies in a laboratory and pilot scale UASB reactor. EnvironTechnol. 1997;18:817–825.
[25] Levenspiel O. Chemical reaction engineering. 3rd ed. India:Wiley; 2004.
[26] Bodkhe SY. A modified anaerobic baffled reactor for munici-pal wastewater treatment. J Environ Manage. 2009;90:2488–2493.
[27] Baloch MI, Akunna JC. Granular bed baffled reactor(GRABBR): solution to a two-phase anaerobic digestionsystem. J Environ Eng. 2003;129(11):1015–1021.
[28] Langenhoff AAM, Stuckey DC. Treatment of dilute wastew-ater using an anaerobic baffled reactor: effect of law temper-ature. Water Res. 2000;34(15):3867–3875.
[29] World Health Organization. Water quality: guideline, stan-dards and health. London: IWA Publishing; 2002.
[30] Polprasert C, Hoang LH. Kinetics of bacteria and bac-teriophages in anaerobic filters. J Water Poll Cont Fed.1983;55:385–391.
[31] Alrajoula M, Halalsheh M, Fayyad M. Anaerobic filter forpolishing effluent of UASB reactor treating strong sewage at23◦C. Water Sci Technol. 2009;59:1975–1982.
Dow
nloa
ded
by [
Lin
naeu
s U
nive
rsity
] at
06:
55 0
9 O
ctob
er 2
014

Environmental Technology 2193
[32] Lettinga G, Van Velsen AFM, Hobma SW, De Zeeuw W,Klapwijk A. Use of the upflow sludge blanket (USB) reactorconcept for biological wastewater treatment, especially foranaerobic treatment. Biotechnol Bioeng. 1980;22:699–734.
[33] Jetten MSM, Stams AJM, Zehnder AJB. Methanogenesisfrom acetate: a comparison of the acetate metabolism inMethanothrix soehngenii and Methanosarcina spp. FEMSMicrobiol Rev. 1992;88:181–198.
Dow
nloa
ded
by [
Lin
naeu
s U
nive
rsity
] at
06:
55 0
9 O
ctob
er 2
014