Embed Size (px)
Citation preview
Modified Local Straight-Line Screening to Detect SyntheticDrugs in Adulterated Herbal Medicines
ZHU XUEYI, ZHANG ZHONGHU, LU FENG,* WU YUTIAN, and QI YUNPENGSchool of Pharmacy, Second Military Medical University, Shanghai 200433, China (Z.X., L.F., W.Y., Q.Y.); 12th hospital of PLA, Shule Xinjiang,
844200, China (Z.X.); and Shandong Institute for Drug Control, Jinan 250012, China (Z.Z.)
A local straight-line screening (LSLS) algorithm was recently designed as
a method to detect synthetic drug(s) in adulterated herbal medicines
based on infrared spectroscopy. Some modifications are made in this
paper to improve the existing LSLS algorithm, including interpolation,
second derivation, and change of calculation regions from 3 to 7 data
points. These modifications have decreased the effect of unpredicted noises
and baseline shift on infrared spectroscopy, resulting in outstanding
detailed spectral characteristics of the suspected synthetic drugs. The
algorithm has been tested using five kinds of synthetic drugs (sibutramine,
fenfluramine, lovastatin, sildenafil, and methyldopa) in 40 herbal medicine
samples. The concentration of the synthetic drug(s) predicted by the
modified LSLS algorithm is closer to those determined by high-
performance liquid chromatography. Consequently, the correct results
rise from 30 obtained using the original LSLS to 36 obtained using the
modified LSLS in 40 samples, the false negative responses drop from 5 to
1, and the false positive responses drop from 5 to 3. The results obtained
using the M-LSLS algorithm based on the sibutramine spectrum collected
at different times and on different instruments also vary within acceptable
ranges. These allow the method to be more appropriate for the
preliminary screening of herbal medicines suspected of adulteration with
synthetic drugs, with high rapidity, accuracy, and cost effectiveness.
Index Headings: Local straight line screening algorithm; Modified LSLS
algorithm; Adulteration; Infrared spectroscopy; Synthetic drugs; Herbal
medicines; Second derivatives; Interpolation.
INTRODUCTION
Adulteration of herbal medicines (HM) with syntheticdrug(s) is a serious worldwide problem. Fast and accuratedetection of the adulterant(s) is necessary and has also been ahot point of research in recent years.1,2 Chromatographycoupled with an advanced detector is the main method used toresolve the problem,3–5 but it is not convenient because of thecomplex sample pretreatment procedure required. Also,chromatography cannot satisfy the requirement of screeninglarge amounts of herbal medicines and suspected syntheticdrugs, and it might be the last resort, rather than the first choice,for high-throughput screening, in which the spectroscopicmethod(s) might have superiority.
A recently developed method called local straight linescreening (LSLS) was introduced recently on the basis ofinfrared spectroscopy. The method could be applied to both thequalitative and quantitative analysis of suspected HM (as wehave mentioned in the previous paper,6 if the LSLS algorithmreturns a sound positive value, qualitative and quantitativeanalysis are fulfilled simultaneously, while if zp is a negativevalue, qualitative analysis comes to an end and no quantitativeanalysis is needed), based solely on the infrared spectrum of thepossible synthetic drug and the suspected HM without any
sample pretreatment. The concept and the application of themethod were exemplified by analysis of sibutramine hydro-chloride in 20 HM samples and compared with the minimizedsummation of first derivative of subtraction spectra (MSFDSS)7
method and the stochastic non-negative independent componentanalysis (SNICA)8 method. The results showed that the methodwas able to resolve the problem as a preliminary screening tool.Though some reasonable results have been gained by the LSLSalgorithm, some results were still disputable and some samplesmight be misjudged mainly because of the unpredicted noisesand seriously overlapped peaks of the original spectra.
In this paper, some modifications including interpolation,second derivation, and change of calculation regions areintroduced, aiming to make the original LSLS algorithm morerobust and reasonable. The modified LSLS algorithm (M-LSLS) is verified using five synthetic drugs in forty (40) HMsamples and the results are compared with those obtained usingthe original LSLS algorithm.
THEORY
As we have already discussed in the previous work onLSLS,6 gradual subtraction of the suspected adulterant peak(s)from the possibly adulterated HM spectrum is exactly theopposite process of the addition process. When an excessiveamount of adulterant peak is subtracted from where the convexcurve, the (near) straight line, or the concave curve exists on thenegative control sample spectrum, then the correspondingamount is respectively higher than, covering, or less than thereal concentration of the adulterant (defined as z). Since theconvexity of the convex curve (or concave curve) of thenegative control sample spectrum varies, the calculated amountcorresponding to different adulterant peaks disperses. On thecontrary, the linearity of the local (near) straight lines does notvary much; each jrj lies between 0.99 and approximately 1.Therefore, the calculated amount (scope, in fact) at the localstraight line does not disperse. So the concentration of thesuspected adulterant will be covered by these centralized scopes.
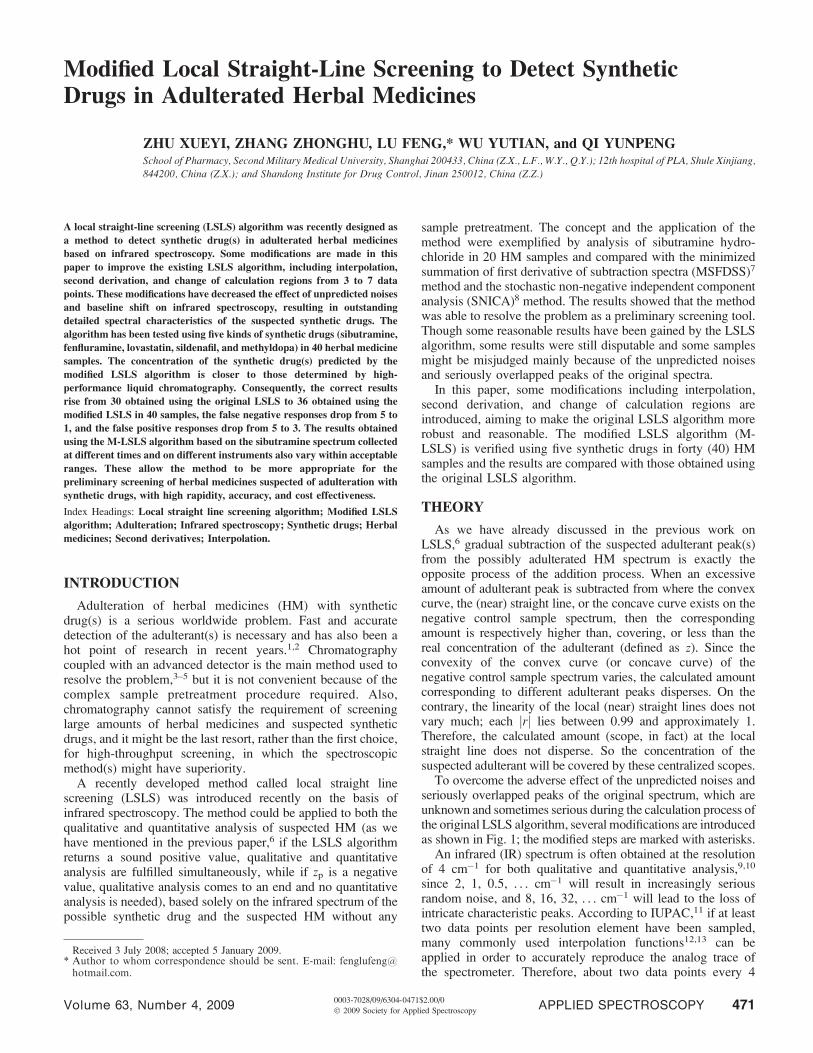
To overcome the adverse effect of the unpredicted noises andseriously overlapped peaks of the original spectrum, which areunknown and sometimes serious during the calculation process ofthe original LSLS algorithm, several modifications are introducedas shown in Fig. 1; the modified steps are marked with asterisks.
An infrared (IR) spectrum is often obtained at the resolutionof 4 cm�1 for both qualitative and quantitative analysis,9,10
since 2, 1, 0.5, . . . cm�1 will result in increasingly seriousrandom noise, and 8, 16, 32, . . . cm�1 will lead to the loss ofintricate characteristic peaks. According to IUPAC,11 if at leasttwo data points per resolution element have been sampled,many commonly used interpolation functions12,13 can beapplied in order to accurately reproduce the analog trace ofthe spectrometer. Therefore, about two data points every 4
Received 3 July 2008; accepted 5 January 2009.* Author to whom correspondence should be sent. E-mail: [email protected].
Volume 63, Number 4, 2009 APPLIED SPECTROSCOPY 4710003-7028/09/6304-0471$2.00/0
� 2009 Society for Applied Spectroscopy
cm�1 are sampled and recorded on the spectrometer automat-ically, i.e., there are 727 data points in the range of 400–1800cm�1, at the resolution of 4 cm�1.
The original LSLS algorithm uses these discrete data pointsdirectly. If the absorption peak is not symmetrical enough,some peak distortion might occur. Point-to-point subtractionmight result in ‘‘distorted’’ concentration of the adulterant. Inthis paper, a spline interpolation function14 is applied to theoriginal spectra before further calculation is performed. Theobtained data points of an interpolated peak represent theabsorption peak much better than the original data points,especially around the peak tip. (In Fig. 2, the spectra are offsetfor clearer presentation).
Y ¼ Ax3 þ Bx2 þ Cx þ D ð1Þ
where x is the value of abscissa planning to interpolate; Y is thevalue of the Y-coordinate after interpolation; and A, B, C, andD are the parameters of the three multinomial equationsdeduced from the original data.
There are about 50 IR absorption peaks (for example,sibutramine has 52 peaks) in the range of 400–1800 cm�1.However, some potential ‘‘peaks’’ are still covered by the HMsignal or form shoulder peaks, which are not adopted in theoriginal LSLS algorithm. Since LSLS is in essence a statisticalmethod, the loss of potential peaks will sometimes decrease the
FIG. 1. Comparison of the process of the two algorithms.
FIG. 2. The absorption peak (bottom) before and (top) after interpolation.FIG. 3. The (2) original and (1) second-derivative spectra of sibutramine(part).
472 Volume 63, Number 4, 2009
confidence of the calculation results or even lead to falseresults.
Second-order derivation can uncover these overlapped peaksand eliminate baseline shift in the original IR spectrum as well.Moreover, it follows the linearity and additivity law.15 Aseven-point Savitzky–Golay derivative function16 is used inthis paper to calculate the second derivatives, and the numberof peaks on the second-derivative spectrum increases abruptly(sibutramine, from 52 to 160, refer to Fig. 3).
Yi ¼ ð5yi�3 � 3yi�1 � 4yi � 3yiþ1 þ 5yiþ3Þ=42 ð2Þ
where Yi is the value after second-order derivation and yi is thevalue before second-order derivation.
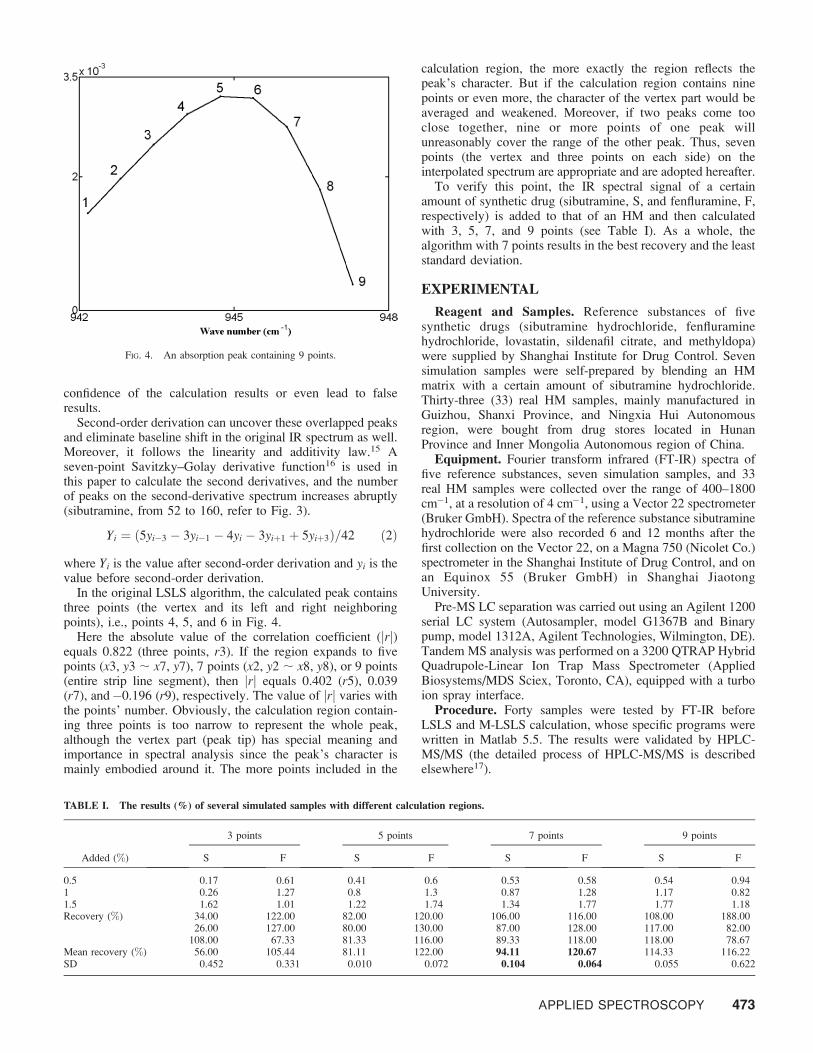
In the original LSLS algorithm, the calculated peak containsthree points (the vertex and its left and right neighboringpoints), i.e., points 4, 5, and 6 in Fig. 4.
Here the absolute value of the correlation coefficient (jrj)equals 0.822 (three points, r3). If the region expands to fivepoints (x3, y3 ; x7, y7), 7 points (x2, y2 ; x8, y8), or 9 points(entire strip line segment), then jrj equals 0.402 (r5), 0.039(r7), and�0.196 (r9), respectively. The value of jrj varies withthe points’ number. Obviously, the calculation region contain-ing three points is too narrow to represent the whole peak,although the vertex part (peak tip) has special meaning andimportance in spectral analysis since the peak’s character ismainly embodied around it. The more points included in the
calculation region, the more exactly the region reflects thepeak’s character. But if the calculation region contains ninepoints or even more, the character of the vertex part would beaveraged and weakened. Moreover, if two peaks come tooclose together, nine or more points of one peak willunreasonably cover the range of the other peak. Thus, sevenpoints (the vertex and three points on each side) on theinterpolated spectrum are appropriate and are adopted hereafter.
To verify this point, the IR spectral signal of a certainamount of synthetic drug (sibutramine, S, and fenfluramine, F,respectively) is added to that of an HM and then calculatedwith 3, 5, 7, and 9 points (see Table I). As a whole, thealgorithm with 7 points results in the best recovery and the leaststandard deviation.
EXPERIMENTAL
Reagent and Samples. Reference substances of fivesynthetic drugs (sibutramine hydrochloride, fenfluraminehydrochloride, lovastatin, sildenafil citrate, and methyldopa)were supplied by Shanghai Institute for Drug Control. Sevensimulation samples were self-prepared by blending an HMmatrix with a certain amount of sibutramine hydrochloride.Thirty-three (33) real HM samples, mainly manufactured inGuizhou, Shanxi Province, and Ningxia Hui Autonomousregion, were bought from drug stores located in HunanProvince and Inner Mongolia Autonomous region of China.
Equipment. Fourier transform infrared (FT-IR) spectra offive reference substances, seven simulation samples, and 33real HM samples were collected over the range of 400–1800cm�1, at a resolution of 4 cm�1, using a Vector 22 spectrometer(Bruker GmbH). Spectra of the reference substance sibutraminehydrochloride were also recorded 6 and 12 months after thefirst collection on the Vector 22, on a Magna 750 (Nicolet Co.)spectrometer in the Shanghai Institute of Drug Control, and onan Equinox 55 (Bruker GmbH) in Shanghai JiaotongUniversity.
Pre-MS LC separation was carried out using an Agilent 1200serial LC system (Autosampler, model G1367B and Binarypump, model 1312A, Agilent Technologies, Wilmington, DE).Tandem MS analysis was performed on a 3200 QTRAP HybridQuadrupole-Linear Ion Trap Mass Spectrometer (AppliedBiosystems/MDS Sciex, Toronto, CA), equipped with a turboion spray interface.
Procedure. Forty samples were tested by FT-IR beforeLSLS and M-LSLS calculation, whose specific programs werewritten in Matlab 5.5. The results were validated by HPLC-MS/MS (the detailed process of HPLC-MS/MS is describedelsewhere17).
FIG. 4. An absorption peak containing 9 points.
TABLE I. The results (%) of several simulated samples with different calculation regions.
Added (%)
3 points 5 points 7 points 9 points
S F S F S F S F
0.5 0.17 0.61 0.41 0.6 0.53 0.58 0.54 0.941 0.26 1.27 0.8 1.3 0.87 1.28 1.17 0.821.5 1.62 1.01 1.22 1.74 1.34 1.77 1.77 1.18Recovery (%) 34.00 122.00 82.00 120.00 106.00 116.00 108.00 188.00
26.00 127.00 80.00 130.00 87.00 128.00 117.00 82.00108.00 67.33 81.33 116.00 89.33 118.00 118.00 78.67
Mean recovery (%) 56.00 105.44 81.11 122.00 94.11 120.67 114.33 116.22SD 0.452 0.331 0.010 0.072 0.104 0.064 0.055 0.622
APPLIED SPECTROSCOPY 473
RESULTS AND DISCUSSION
Five types of adulterated synthetic drugs in 40 samples weretested by the two algorithms. Twenty-three (23) samples weredetected for sibutramine, four for fenfluramine, five forsildenafil, four for lovastatin, and four for methyldopa, sincethese five types of HM pledged to have weight-reducing, male-strengthening, and lipid- and blood-pressure-lowering effects,
respectively (Table II). Thirty-eight results obtained by the M-LSLS algorithm and 36 by the original LSLS were inaccordance with the results obtained using HPLC-MS/MS.
Even though no obvious improvements were apparent in thecorrect response rate, careful observation of the stair-like plotsproduced by the M-LSLS algorithm still revealed furtherprogress based upon the original LSLS.
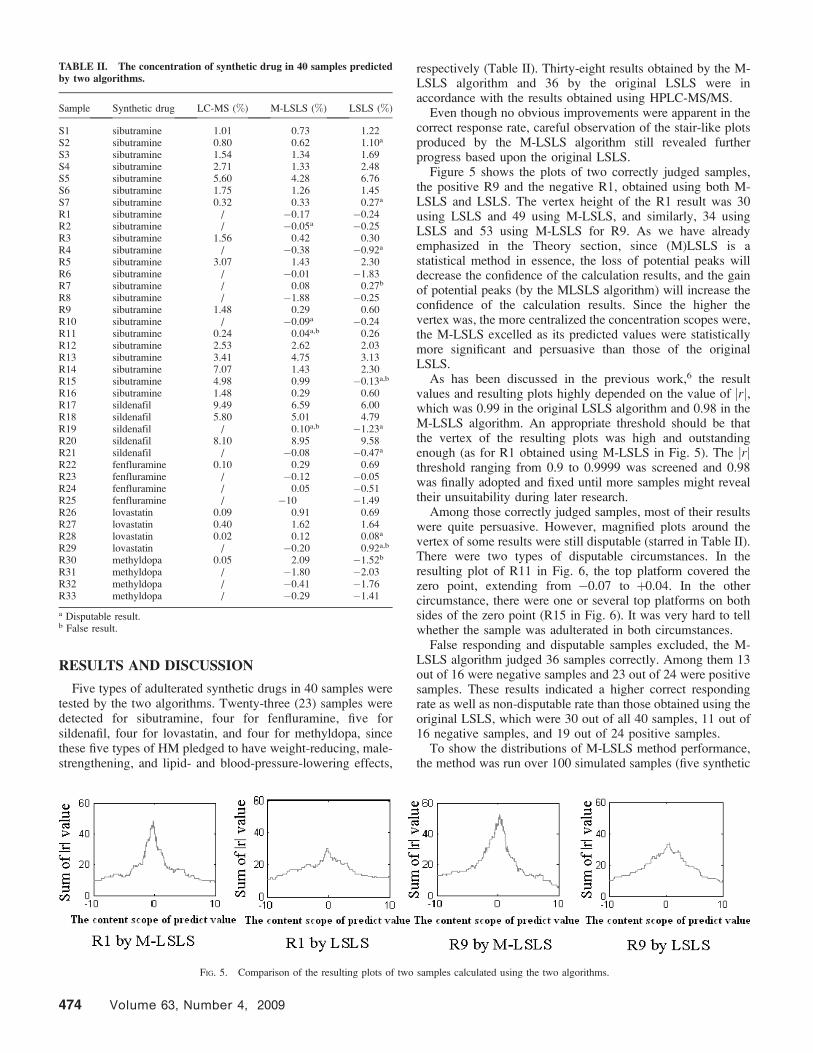
Figure 5 shows the plots of two correctly judged samples,the positive R9 and the negative R1, obtained using both M-LSLS and LSLS. The vertex height of the R1 result was 30using LSLS and 49 using M-LSLS, and similarly, 34 usingLSLS and 53 using M-LSLS for R9. As we have alreadyemphasized in the Theory section, since (M)LSLS is astatistical method in essence, the loss of potential peaks willdecrease the confidence of the calculation results, and the gainof potential peaks (by the MLSLS algorithm) will increase theconfidence of the calculation results. Since the higher thevertex was, the more centralized the concentration scopes were,the M-LSLS excelled as its predicted values were statisticallymore significant and persuasive than those of the originalLSLS.
As has been discussed in the previous work,6 the resultvalues and resulting plots highly depended on the value of jrj,which was 0.99 in the original LSLS algorithm and 0.98 in theM-LSLS algorithm. An appropriate threshold should be thatthe vertex of the resulting plots was high and outstandingenough (as for R1 obtained using M-LSLS in Fig. 5). The jrjthreshold ranging from 0.9 to 0.9999 was screened and 0.98was finally adopted and fixed until more samples might revealtheir unsuitability during later research.
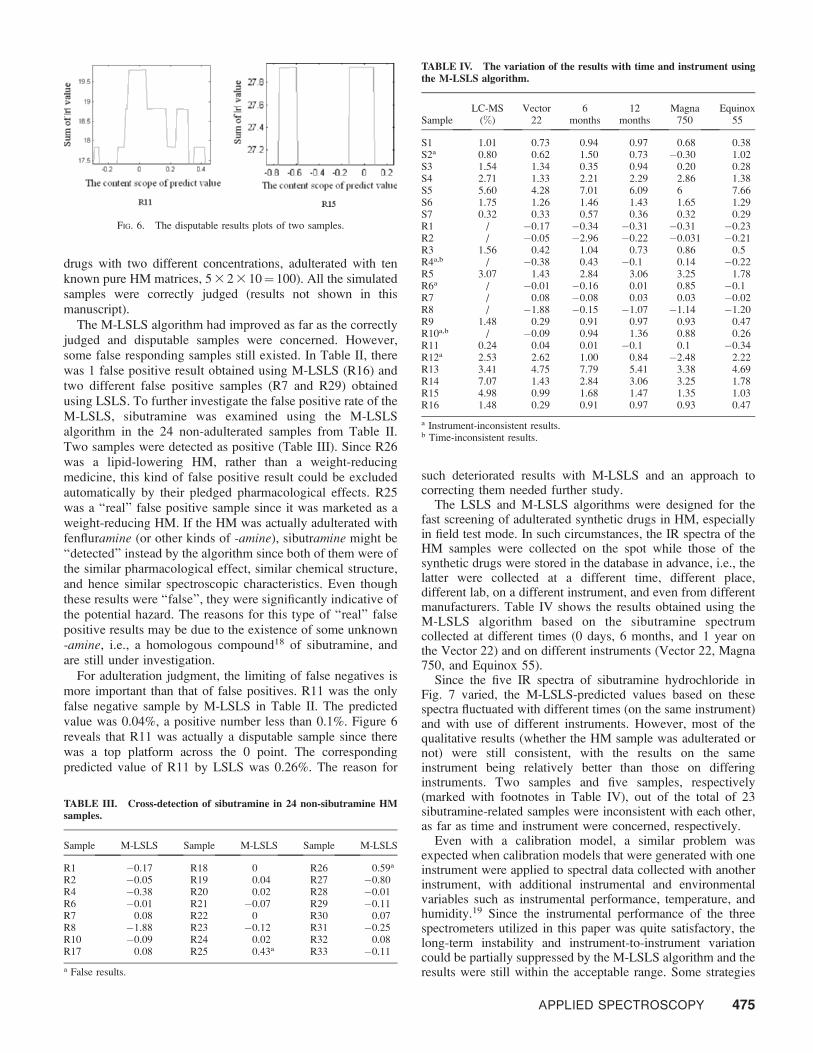
Among those correctly judged samples, most of their resultswere quite persuasive. However, magnified plots around thevertex of some results were still disputable (starred in Table II).There were two types of disputable circumstances. In theresulting plot of R11 in Fig. 6, the top platform covered thezero point, extending from �0.07 to þ0.04. In the othercircumstance, there were one or several top platforms on bothsides of the zero point (R15 in Fig. 6). It was very hard to tellwhether the sample was adulterated in both circumstances.
False responding and disputable samples excluded, the M-LSLS algorithm judged 36 samples correctly. Among them 13out of 16 were negative samples and 23 out of 24 were positivesamples. These results indicated a higher correct respondingrate as well as non-disputable rate than those obtained using theoriginal LSLS, which were 30 out of all 40 samples, 11 out of16 negative samples, and 19 out of 24 positive samples.
To show the distributions of M-LSLS method performance,the method was run over 100 simulated samples (five synthetic
TABLE II. The concentration of synthetic drug in 40 samples predictedby two algorithms.
Sample Synthetic drug LC-MS (%) M-LSLS (%) LSLS (%)
S1 sibutramine 1.01 0.73 1.22S2 sibutramine 0.80 0.62 1.10a
S3 sibutramine 1.54 1.34 1.69S4 sibutramine 2.71 1.33 2.48S5 sibutramine 5.60 4.28 6.76S6 sibutramine 1.75 1.26 1.45S7 sibutramine 0.32 0.33 0.27a
R1 sibutramine / �0.17 �0.24R2 sibutramine / �0.05a �0.25R3 sibutramine 1.56 0.42 0.30R4 sibutramine / �0.38 �0.92a
R5 sibutramine 3.07 1.43 2.30R6 sibutramine / �0.01 �1.83R7 sibutramine / 0.08 0.27b
R8 sibutramine / �1.88 �0.25R9 sibutramine 1.48 0.29 0.60R10 sibutramine / �0.09a �0.24R11 sibutramine 0.24 0.04a,b 0.26R12 sibutramine 2.53 2.62 2.03R13 sibutramine 3.41 4.75 3.13R14 sibutramine 7.07 1.43 2.30R15 sibutramine 4.98 0.99 �0.13a,b
R16 sibutramine 1.48 0.29 0.60R17 sildenafil 9.49 6.59 6.00R18 sildenafil 5.80 5.01 4.79R19 sildenafil / 0.10a,b �1.23a
R20 sildenafil 8.10 8.95 9.58R21 sildenafil / �0.08 �0.47a
R22 fenfluramine 0.10 0.29 0.69R23 fenfluramine / �0.12 �0.05R24 fenfluramine / 0.05 �0.51R25 fenfluramine / �10 �1.49R26 lovastatin 0.09 0.91 0.69R27 lovastatin 0.40 1.62 1.64R28 lovastatin 0.02 0.12 0.08a
R29 lovastatin / �0.20 0.92a,b
R30 methyldopa 0.05 2.09 �1.52b
R31 methyldopa / �1.80 �2.03R32 methyldopa / �0.41 �1.76R33 methyldopa / �0.29 �1.41
a Disputable result.b False result.
FIG. 5. Comparison of the resulting plots of two samples calculated using the two algorithms.
474 Volume 63, Number 4, 2009
drugs with two different concentrations, adulterated with tenknown pure HM matrices, 5 3 2 3 10¼ 100). All the simulatedsamples were correctly judged (results not shown in thismanuscript).
The M-LSLS algorithm had improved as far as the correctlyjudged and disputable samples were concerned. However,some false responding samples still existed. In Table II, therewas 1 false positive result obtained using M-LSLS (R16) andtwo different false positive samples (R7 and R29) obtainedusing LSLS. To further investigate the false positive rate of theM-LSLS, sibutramine was examined using the M-LSLSalgorithm in the 24 non-adulterated samples from Table II.Two samples were detected as positive (Table III). Since R26was a lipid-lowering HM, rather than a weight-reducingmedicine, this kind of false positive result could be excludedautomatically by their pledged pharmacological effects. R25was a ‘‘real’’ false positive sample since it was marketed as aweight-reducing HM. If the HM was actually adulterated withfenfluramine (or other kinds of -amine), sibutramine might be‘‘detected’’ instead by the algorithm since both of them were ofthe similar pharmacological effect, similar chemical structure,and hence similar spectroscopic characteristics. Even thoughthese results were ‘‘false’’, they were significantly indicative ofthe potential hazard. The reasons for this type of ‘‘real’’ falsepositive results may be due to the existence of some unknown-amine, i.e., a homologous compound18 of sibutramine, andare still under investigation.
For adulteration judgment, the limiting of false negatives ismore important than that of false positives. R11 was the onlyfalse negative sample by M-LSLS in Table II. The predictedvalue was 0.04%, a positive number less than 0.1%. Figure 6reveals that R11 was actually a disputable sample since therewas a top platform across the 0 point. The correspondingpredicted value of R11 by LSLS was 0.26%. The reason for
such deteriorated results with M-LSLS and an approach tocorrecting them needed further study.
The LSLS and M-LSLS algorithms were designed for thefast screening of adulterated synthetic drugs in HM, especiallyin field test mode. In such circumstances, the IR spectra of theHM samples were collected on the spot while those of thesynthetic drugs were stored in the database in advance, i.e., thelatter were collected at a different time, different place,different lab, on a different instrument, and even from differentmanufacturers. Table IV shows the results obtained using theM-LSLS algorithm based on the sibutramine spectrumcollected at different times (0 days, 6 months, and 1 year onthe Vector 22) and on different instruments (Vector 22, Magna750, and Equinox 55).
Since the five IR spectra of sibutramine hydrochloride inFig. 7 varied, the M-LSLS-predicted values based on thesespectra fluctuated with different times (on the same instrument)and with use of different instruments. However, most of thequalitative results (whether the HM sample was adulterated ornot) were still consistent, with the results on the sameinstrument being relatively better than those on differinginstruments. Two samples and five samples, respectively(marked with footnotes in Table IV), out of the total of 23sibutramine-related samples were inconsistent with each other,as far as time and instrument were concerned, respectively.
Even with a calibration model, a similar problem wasexpected when calibration models that were generated with oneinstrument were applied to spectral data collected with anotherinstrument, with additional instrumental and environmentalvariables such as instrumental performance, temperature, andhumidity.19 Since the instrumental performance of the threespectrometers utilized in this paper was quite satisfactory, thelong-term instability and instrument-to-instrument variationcould be partially suppressed by the M-LSLS algorithm and theresults were still within the acceptable range. Some strategies
FIG. 6. The disputable results plots of two samples.
TABLE III. Cross-detection of sibutramine in 24 non-sibutramine HMsamples.
Sample M-LSLS Sample M-LSLS Sample M-LSLS
R1 �0.17 R18 0 R26 0.59a
R2 �0.05 R19 0.04 R27 �0.80R4 �0.38 R20 0.02 R28 �0.01R6 �0.01 R21 �0.07 R29 �0.11R7 0.08 R22 0 R30 0.07R8 �1.88 R23 �0.12 R31 �0.25R10 �0.09 R24 0.02 R32 0.08R17 0.08 R25 0.43a R33 �0.11
a False results.
TABLE IV. The variation of the results with time and instrument usingthe M-LSLS algorithm.
SampleLC-MS
(%)Vector
226
months12
monthsMagna
750Equinox
55
S1 1.01 0.73 0.94 0.97 0.68 0.38S2a 0.80 0.62 1.50 0.73 �0.30 1.02S3 1.54 1.34 0.35 0.94 0.20 0.28S4 2.71 1.33 2.21 2.29 2.86 1.38S5 5.60 4.28 7.01 6.09 6 7.66S6 1.75 1.26 1.46 1.43 1.65 1.29S7 0.32 0.33 0.57 0.36 0.32 0.29R1 / �0.17 �0.34 �0.31 �0.31 �0.23R2 / �0.05 �2.96 �0.22 �0.031 �0.21R3 1.56 0.42 1.04 0.73 0.86 0.5R4a,b / �0.38 0.43 �0.1 0.14 �0.22R5 3.07 1.43 2.84 3.06 3.25 1.78R6a / �0.01 �0.16 0.01 0.85 �0.1R7 / 0.08 �0.08 0.03 0.03 �0.02R8 / �1.88 �0.15 �1.07 �1.14 �1.20R9 1.48 0.29 0.91 0.97 0.93 0.47R10a,b / �0.09 0.94 1.36 0.88 0.26R11 0.24 0.04 0.01 �0.1 0.1 �0.34R12a 2.53 2.62 1.00 0.84 �2.48 2.22R13 3.41 4.75 7.79 5.41 3.38 4.69R14 7.07 1.43 2.84 3.06 3.25 1.78R15 4.98 0.99 1.68 1.47 1.35 1.03R16 1.48 0.29 0.91 0.97 0.93 0.47
a Instrument-inconsistent results.b Time-inconsistent results.
APPLIED SPECTROSCOPY 475

similar to calibration transfer techniques to correct spectraldifference are still under way.
CONCLUSION
The M-LSLS algorithm was a rapid method as it took about 1minute per sample to work out the predicted concentration(computer configuration: Intel Pentiumt E2180 2.0G/1G (667MHz)/Windows XPt). Through spectral derivation, interpola-tion, and the change of calculation regions from 3 to 7 datapoints, the modified LSLS algorithm was an improvement uponthe original LSLS algorithm, which was verified by 100simulated samples and five types of synthetic drugs in 40 HMsamples. The correct rate rose from 30 out of 40 to 36 out of 40;the false negative rate dropped from 5 out of 24 to 1 out of 24;and the false positive rate dropped from 5 out of 16 to 3 out of 16.The results obtained using the M-LSLS algorithm based on thesibutramine spectrum collected at different times and on differentinstruments also vary within acceptable ranges. As discussedearlier, the obvious drop in the false negative rate indicated somepromising improvement of the M-LSLS algorithm.
The relatively high positive rate (24/40 ¼ 60%) was theresult of our purposely designed experiments to demonstrate
the M-LSLS algorithm since all the suspicious samples weretaken from remote areas in China (Guizhou, Shanxi, Ningxia,Hunan, etc.), where regulatory detection instruments arerelatively inadequate. In most areas of China, the situation isimproving through the endeavors of China’s government.
Overall the M-LSLS algorithm was promising as a primaryscreening method in testing herbal medicines for adulterationwith synthetic drugs. Studies on the applicability of M-LSLSand its application to more synthetic drugs in more real HMsamples are still to be undertaken.
ACKNOWLEDGMENTS
This work is financially supported by National Project of Scientific andTechnical Supporting Programs funded by the Ministry of Science &Technology of China (No.2008BAI55B06) and the Technical StandardsPrograms funded by the Science & Technology Commission of ShanghaiMunicipality (No.05dz05006).
1. E. Ernst, Trends Pharmacol. Sci. 23, 136 (2002).2. FDA Consumer Magazine, January–February 39, 1 (2005) (http://www.
fda.gov/fdac/departs/2005/105_upd.html).3. A. J. Lau, M. J. Holmes, and S. O. Woo, J. Pharm. Biomed. Anal. 24, 983
(2001).4. S. R. Gratz, C. L. Flurer, and K. A. Wolnik, J. Pharm. Biomed. Anal. 36,
525 (2004).5. M. J. Bogusz, H. Hassan, and E. Al-Enazi, J. Pharm. Biomed. Anal. 36,
554 (2006).6. F. Lu, S. Li, J. Le, G. L. Chen, Y. Cao, Y. P. Qi, Y. F. Chai, and Y. T. Wu,
Anal. Chim. Acta 589, 200 (2007).7. Y. T. Wang, G. L. Chen, Z. Q. Zhu, J. Z. Zhu, and W. Lu, Int. J. Infrared
Millimeter Wave 24, 1177 (2003).8. S. A. Astakhov, H. Stogbauer, A. Kraskov, and P. Grassberger, Anal.
Chem. 78, 1620 (2006).9. E. Bramanti, E. Benedetti, C. Nicolini, T. Berzina, V. Erokhin, A.
D’Alessio, and E. Benedetti, CCC (1997) 0006-3525/97/020227-11.10. V. Koradia, G. Chawla, and A. Bansal, Acta Pharm. 54, 193 (2004).11. J. G. Grasselli, Pure Appl. Chem. 59, 5677 (1987).12. K. T. Klasson, Adv. Eng. Software 39, 422 (2008).13. J. E. Bertie, R. N. Jones, and Y. Apelblat, Appl. Spectros. 47, 1989 (1993).14. W. L. Yoon, R. D. Jee, A. C. Moffat, P. D. Blackler, K. Yeung, and D. C.
Lee, Analyst (Cambridge, UK) 124, 1197 (1999).15. J. Karpinska, Talanta 64, 801 (2004).16. A. Savitzky and M. J. E. Golay, Anal. Chem. 36, 1627 (1964).17. Y. H. Chen, L. F. Zhao, F. Lu, Y. L. Yu, Y. F. Chai, and Y. T. Wu,
Determination of synthetic drugs adulterated in botanical dietarysupplements using the QTRAP LC-MS/MS, Food Addit. Contam. (man.no. TFAC-2008-201), paper accepted (2009).
18. P. Zou, S. Sze-Yin Oh, K. H. Kiang, M. Y. Low, and B. Chen, RapidComm. Mass Spectrom. 21, 614 (2007).
19. Y. Sulub, R. LoBrutto, R. Vivilecchia, and B. W. Wabuyele, Anal. Chim.Acta 611, 143 (2008).
FIG. 7. IR Spectra of sibutramine hydrochloride recorded on the Magna 750,Vector 22, and Equinox 55, and with varying times on the Vector 22. (Top tobottom) Magna 750, Vector 22-i, -ii, -iii, and Equinox 55. All the spectra arenormalized to similar magnitude and offset for clarity.
476 Volume 63, Number 4, 2009


![PROFILE ON HERBAL COSMETICS - ::krishna::krishna.nic.in/PDFfiles/MSME/Herbal/herbal cosmetics[1].pdf · 2 SECTION I PRODUCT CHARACTERISTICS Herbal Cosmetics consists of herbal based](https://img.pdfslide.us/doc/110x75/5a9e561f7f8b9a0d7f8d5810/profile-on-herbal-cosmetics-krishna-cosmetics1pdf2-section-i-product-characteristics.jpg)