Embed Size (px)
Citation preview
QUEENSLAND UNIVERSITY OF TECHNOLOGY
CENTRE FOR MEDICAL, HEALTH AND ENVIRONMENTAL PHYSICS
SCHOOL OF PHYSICAL AND CHEMICAL SCIENCES
MODIFICATION OF ATRIUM DESIGN TO IMPROVE
THERMAL AND DAYLIGHTING PERFORMANCE
Submitted by John Ashley MABB, Centre for Medical, Health and Environmental Physics,
School of Physical and Chemical Sciences, Queensland University of Technology in partial
fulfilment of the requirements of the degree of Masters of Applied Science (Research).
December 2001
Modification of Atrium Design to Improve Thermal and Daylighting Performance Abstract
ii
Keywords: Atrium, Daylight Penetration, Thermal Stratification,
Laser Cut Panel, Computer Simulation.
ABSTRACT
The inclusion of a central court or atrium within a building is a popular design due to its
aesthetic, open appearance. The greater penetration of natural light aids in the reduction in
use of artificial lighting during the day. Care must be taken to balance the solar heat gain
against the daylight penetration. This balance is critical for the reduction of the electrical
energy load of the building, whilst maintaining a high level of comfort for the occupants.
In the tropics modifications to atrium building designs are necessary to diminish high
elevation direct solar heat gain. Traditionally, shading the window apertures or lowering
the transmission through the glazing was used. These solutions limit the view and reduce
the light level. The use of angular selective glazing upon atria allows the rejection of high
elevation direct sunlight whilst redirecting and therefore improving low elevation skylight
penetration. Tilted angular selective glazing used upon adjoining spaces to atria help
vertical light in the atrium well to be redirected horizontally deep into the space. These
effects reduce overheating which would normally restrict the use of atria in warmer
environments as well as improve illumination penetration into adjoining spaces.
The research showed that under clear sky conditions the modified glazing gave a lower
temperature in the middle of the day within the atrium well. A more even distribution of
illuminance across the course of the day was found and a higher level of illuminance was
achieved within the well and its adjoining spaces under clear skies.
These effects were simulated using computer algorithms. The algorithms were verified by
field data collected from the QUT Daylighting Research Test Building located at the
Brisbane Airport Bureau of Meteorology site where two simultaneously monitored model
(1:10 scale) atriums were studied for several months.
Modification of Atrium Design to Improve Thermal and Daylighting Performance Contents
iii
TABLE OF CONTENTS
Title .../i
Keywords
Abstract
Contents /iii
List of Figures /vi
List of Symbols and Abbreviations /xii
Statement of Original Authorship
Acknowledgements
Chapter 1: Aims & Objectives .../1
1.1 Aim
1.2 Objective
1.3 Research Hypothesis
1.4 Proposed Research
1.5 New Aspects of Research
Chapter 2: Introduction .../4
2.1 Introduction
2.2 Building
2.3 Environment
2.4 Energy Consumption
2.5 Human Comfort
2.6 Daylight Penetration
2.7 Thermal Penetration
2.8 Atria
2.9 Problem with Tropical Atria
2.10 Proposed Solution to Tropical Atria
Chapter 3: Literature Review .../19
3.1 Introduction
3.2 Daylighting in Atria
3.3 Daylighting in Adjoining Spaces to Atria
3.4 Thermal Performance in Atria
Modification of Atrium Design to Improve Thermal and Daylighting Performance Contents
iv
3.5 Advanced Fenestration Systems
3.6 Computer Prediction Simulations
3.7 Conclusion
3.8 Background
Chapter 4: Theory .../37
4.1 Light
4.2 The Sky
4.3 Solar Geometry
4.4 Laser Cut Panels
4.5 Thermal Theory
Chapter 5: Daylight Simulation .../55
5.1 Introduction
5.2 Computer Simulation Theory
5.3 Procedure
5.4 Daylight Simulation Results
5.5 Simulation Validation
Chapter 6: Theoretical Thermal Simulation .../93
6.1 Introduction
6.2 Theory
6.3 Procedure
6.4 Thermal Simulation Validation
6.5 Thermal Simulation Comparison
Chapter 7: Field Experiments .../115
7.1 Introduction
7.2 Equipment
7.3 Building Description
7.4 Model Atria Description
7.5 Daylight Measurements
7.6 Irradiance Measurements
7.7 Temperature Measurements
Modification of Atrium Design to Improve Thermal and Daylighting Performance Contents
v
7.8 Ventilation Measurements
Chapter 8: Data Analysis .../164
8.1 Daylight Modification Analysis
8.2 Thermal Modification Analysis
Chapter 9: Conclusions .../189
9.1 Conclusion
9.2 Future Work
Appendices .../193
A.1 2D Daylighting Code
A.2 3D Daylighting Code
A.3 Thermal Code
A.4 Daylight Theory
A.5 Daylight Experiment Results
A.6 TRY Data
A.7 Glossary
References .../265
Modification of Atrium Design to Improve Thermal and Daylighting Performance Tables
vi
LIST OF FIGURES
Figure 1.01: LCPs in atrium and adjoining room configuration
Figure 2.01: Ancient building and modern office building
Figure 2.02: Map of Australia divided into climate zones
Figure 2.03: Sun position at equinox
Figure 2.04: Uncomfortable and comfortable person in building
Figure 2.05: Daylight entering building
Figure 2.06: Illuminance with and without lights
Figure 2.07: Diagram of daylight penetration into building
Figure 2.08: Commercial atria in Australia
Figure 2.09: Solar penetration and heat gain into atrium
Figure 2.10: LCPs redirect light through pyramid skylight
Figure 2.11: LCPs in tilted vertical window
Figure 2.12: LCP angular selective skylight
Figure 3.01: Diagram of daylight penetration into atrium well
Figure 3.02 Room index ratio of atrium well
Figure 3.03: Graph of relationships between daylight factor and well index
Figure 3.04: Atrium with varying glazing size with respect to depth of well
Figure 3.05: Nomograph of illuminance in adjoining room to atrium well
Figure 3.06: Building ratio effect upon thermal stratification
Figure 3.07: LCP application
Figure 3.08: Luxfer Prism design at turn of 20th century
Figure 3.09: Radiance generated picture of atrium
Figure 4.01: Electromagnetic wave spectrum
Figure 4.02: The sun
Figure 4.03: Fish eye view of intermediate sky
Figure 4.04: Solar position with respect to season
Figure 4.05: Earth revolution causing seasons
Figure 4.06: Diagram of LCP with labelled rays
Figure 4.07: Angular selective LCP skylight
Figure 4.08: Representation of stratification boundary conditions
Figure 5.01: 2D daylight simulation screen output of room with rays
Figure 5.02: Axis and angles in 3D geometry
Figure 5.03: Simulated room boundary labels and geometry
Modification of Atrium Design to Improve Thermal and Daylighting Performance Tables
vii
Figure 5.04: Diagram of hemisphere showing greater solid angle near surface
Figure 5.05: Pseudo code of 2D program
Figure 5.06: 2D picture of sky distribution
Figure 5.07: 2D daylight simulation screen output of room and skylight with rays
Figure 5.08: 2D daylight simulation screen output of atrium with illuminance bars
Figure 5.09: 2D daylight simulation screen output of room with illuminance line
Figure 5.10: Pseudo code of 3D program
Figure 5.11: Graph of 3D daylight simulation results
Figure 5.12: Graph of relationship between DF% and surface reflectivity in well
Figure 5.13: Graph of DF% and WI with normal and LCP glazing in 2D well
Figure 5.14: Graph of light level in 2D well for both glazings at various solar altitudes
Figure 5.15: Graph of light level in adjoining room with varying surface reflectivity
Figure 5.16: Graph of relationship between light level and well index in adjoining room
Figure 5.17: Graph of glazing comparison within 2D adjoining room under overcast sky
Figure 5.18: Graph of sky distribution comparison
Figure 5.19: Diagram of simulated test site building
Figure 5.20: Graph of light level programs comparison under overcast skies
Figure 5.21: Graph of light level programs comparison under clear skies
Figure 5.22: Graph of well index daylight penetration comparison
Figure 5.23: Graph of simulated and scale model results in adjoining room
Figure 6.01: Thermal simulation of test site scale model atrium wells
Figure 6.02: Geometrical representation of fraction of light accepted through skylight
Figure 6.03: Graph of transmission through LCP pyramid shaped skylight
Figure 6.04: Diagram of atrium well with basic heat flow directions
Figure 6.05 Pseudo code diagram of thermal program
Figure 6.06: Graph of field and sim temperatures in plain atrium on July 22nd
Figure 6.07: Graph of field and sim temperatures in LCP atrium on July 22nd
Figure 6.08: Graph of field and sim temperatures in plain atrium on September 15th
Figure 6.09: Graph of field and sim temperatures in plain atrium on September 25th
Figure 6.10: LCP atrium comparison between field and simulated average temperatures
Figure 6.11: LCP atrium comparison between field and simulated average temperatures
Figure 6.12: Capsol simulated plain glazed atrium temperatures under clear skies
Figure 6.13: Capsol simulated plain glazed atrium temperatures under overcast skies
Figure 6.14: Capsol simulated LCP glazed atrium temperatures under overcast skies
Modification of Atrium Design to Improve Thermal and Daylighting Performance Tables
viii
Figure 6.15: Capsol simulated LCP glazed atrium temperatures under clear skies
Figure 7.01: Computer logging equipment
Figure 7.02: AD590 temperature sensor electrical circuit
Figure 7.03: Test site building side
Figure 7.04: Test site building end
Figure 7.05: Test site building inside room
Figure 7.06: Northern LCP glazed skylight
Figure 7.07: Southern normal glazed skylight
Figure 7.08: Southern foam atrium well inside test site building
Figure 7.09: Outside storm damaged test site building
Figure 7.10: Inside storm damaged test site building
Figure 7.11: Graph of logged illuminance level data
Figure 7.12: Graph of light level in small model atrium wrt surface reflectivity & WI
Figure 7.13: Graph of light level in adjoining room of model with various glazings
Figure 7.14: Picture inside test site room
Figure 7.15: Graph of illuminance level under overcast sky on work height
Figure 7.16: Graph of illuminance level under overcast sky on floor
Figure 7.17: Graph of illuminance level under clear sky on work height
Figure 7.18: Graph of illuminance level under clear sky on floor
Figure 7.19: Diagram of meter and tube describing solid angle
Figure 7.20: Picture of diffuse and global pyranometers
Figure 7.21: Graph of measured irradiance on 22/8
Figure 7.22: Graph of measured irradiance on 22/7
Figure 7.23: Graph of hourly averaged corrected irradiance on 22/7
Figure 7.24: Graph of measured irradiance on 14/8
Figure 7.25: Graph of hourly averaged corrected irradiance on 14/8
Figure 7.26: Graph of measured irradiance on 25/9
Figure 7.27: Graph of hourly averaged corrected irradiance on 25/9
Figure 7.28: Graph of measured irradiance on 16/9
Figure 7.29: Graph of hourly averaged corrected irradiance on 16/9
Figure 7.30: Graph of measured irradiance on 9/10
Figure 7.31: Graph of hourly averaged corrected irradiance on 9/10
Figure 7.32: Graph of measured and reference diffuse irradiance validation
Figure 7.33: Graph of theoretical measured and TRY direct normal irradiance validation
Modification of Atrium Design to Improve Thermal and Daylighting Performance Tables
ix
Figure 7.34: Temperature sensor AD590 in ping-pong ball
Figure 7.35: Diagram of test site with instrument sensor location after 24th August 1999
Figure 7.36: Graph of measured temperatures on 22/8
Figure 7.37: Graph of measured temperatures on 22/7
Figure 7.38: Graph of measured temperatures on 14/8
Figure 7.39: Graph of measured temperatures on 16/9
Figure 7.40: Graph of measured temperatures on 25/9
Figure 7.41: Graph of measured temperatures on 9/10
Figure 7.42: Graph of hourly averaged temperatures on 22/7
Figure 7.43: Graph of hourly averaged temperatures on 25/9
Figure 7.44: Graph of hourly averaged temperatures on 16/9
Figure 7.45: Graph of hourly averaged temperatures on 9/10
Figure 7.46: Graph of reference and measured temperature validation on 14/8
Figure 8.01: Diagram of atrium well sizes and glazing types
Figure 8.02: Graph comparing 2 glazing in summer in a 3D well WI=3.75
Figure 8.03: Graph comparing 2 glazing in winter in a 3D well WI=3.75
Figure 8.04: Graph comparing 2 glazing in summer in a 3D well WI=2.0
Figure 8.05: Graph comparing 2 glazing in winter in a 3D well WI=2.0
Figure 8.06: Graph of relationship between horizontal DF% and WI for both glazings
Figure 8.07: Diagram of atrium geometry and glazing types
Figure 8.08: Graph of light level in adjoining room to well for 2 glazings in 2 seasons
Figure 8.09: Graph of glazing comparison in room adjoining well in summer
Figure 8.10: Graph of glazing comparison in room adjoining well in winter
Figure 8.11: Diagram of test site with sensor locations before 24th August 1999
Figure 8.12: Graph of hourly temperature sensor comparison and stratification on 22/7
Figure 8.13: Diagram of test site with sensor locations after 24th August 1999
Figure 8.14: Graph of hourly temperature sensor comparison and stratification on 16/9
Figure 8.15: Graph of hourly temperature sensor comparison and stratification on 9/10
Figure 8.16: Graph of temperature gradient in normal glazed well on 22/7
Figure 8.17: Graph of temperature gradient in LCP glazed well on 22/7
Figure 8.18: Graph of stratification equation comparison to hourly averaged field data
Figure 8.19: Matlab screen graph of predicted temperatures in both atria in summer
Figure 8.20: Matlab screen graph of predicted temperatures in both atria in winter
Figure 8.21: Graph of simulated atrium temperature comparison across year at midday
Modification of Atrium Design to Improve Thermal and Daylighting Performance Tables
x
Figure 9.01: LCP glazed atrium well in office building in Herschel Street, Brisbane
LIST OF TABLES
Table 4.01: Sky cloud description
Table 5.01: Surface reflectivity percentages
Table 5.02: Light levels within room
Table 5.03: Table of wall labels and description within 3D simulation
Table 5.04: Light level within room
Table 5.05: Relationship between horizontal DF% & surface reflectivity in well
Table 5.06: Comparison between DF% and WI with 2 glazings in 2D well
Table 5.07: Comparison between glazings and WIs for many solar altitudes in 2D well
Table 5.08: Relationship between light level and surface reflectivity in adjoining room
Table 5.09: Relationship between light level and well index in adjoining room to well
Table 5.10: Glazing comparison within 2D room adjoining well under overcast sky
Table 5.11: Sky luminance data comparison at 10° increments with ratio to zenith
Table 5.12: Surface reflectivity comparison
Table 5.13: Well index simulation comparison to algorithm
Table 6.01: Simplified convection coefficient (hc) equations for air
Table 6.02: Comparison between sim and field temperature across 1 day for 2 glazings
Table 6.03: Comparison between sim and field temperature for 2 days for clear glazing
Table 6.04: Comparison between sim and field temperature for 2 days for LCP glazing
Table 6.05: Simulated temperatures comparing 2 glazings under 2 sky conditions
Table 7.01: Surface reflectivity
Table 7.02: Clear sky days monitored
Table 7.03: Illuminance in atrium well for different orientations and glazings
Table 7.04: Illuminance in small model atrium well with changing reflectivity and WI
Table 7.05: Illuminance in adjoining room with white surfaces and 4 glazing options
Table 7.06: Illuminance levels under overcast sky on work height
Table 7.07: Illuminance levels under overcast sky on floor
Table 7.08: Illuminance levels under clear sky on work height
Table 7.09: Illuminance levels under clear sky on floor
Table 7.10: Sky luminance data across sky at 10° increments with ratio to zenith
Table 7.11: Sky luminance values
Modification of Atrium Design to Improve Thermal and Daylighting Performance Tables
xi
Table 7.12: Temperature sensor calibration correction
Table 8.01: Illuminance comparison in a 3D well between 2 seasons with LCP glazing
Table 8.02: Illuminance comparison in a 3D well between 2 seasons with norm glazing
Table 8.03: Relationship between horizontal daylight factor and well index in 3D
Table 8.04: Comparison in a room adjoining well between LCP and plain glazing
Table 8.05: Illuminance within adjoining room in summer with various glazing options
Table 8.06: Illuminance within adjoining room in winter with various glazing options
Table 8.07: Temperature difference equations produced from field data
Table 8.08: Simulated temperature comparing 2 glazings options in 2 seasons
Table 8.09: Atrium temperature comparison across year at 12pm
Modification of Atrium Design to Improve Thermal and Daylighting Performance Symbols
xii
NOMENCLATURE
LCPs laser cut angular selective panels
DF% daylight factor percentage
WI well index
RI room index
f fraction of tilted panel incident upon cross sectional aperture
fd fraction deflected
fud fraction undeflected
fad fraction accepted deflected
faud fraction accepted undeflected
T Temperature
FET Fresnel energy transmitted
α absorption
r reflection
τ transmission
i angle of incident ray upon LCP
io angle of total deflection
r angle of refraction
W width of the panel
D distance between laser cuts
A Area
E Solar Elevation
Jd Julian date = day number
m relative optical air mass
dec declination
ET equation of time
srh sunrise hour-angle
srt sunrise time
sst sunset time
lat latitude
rlong reference longitude meridian
slong site longitude meridian
Modification of Atrium Design to Improve Thermal and Daylighting Performance Symbols
xiii
GMT Greenwich Mean Time
hra hour angle
t time
I luminous intensity
E Illuminance
Eext extraterrestrial solar illuminance
Esc solar illuminance constant
Edn direct normal illuminance
L Luminance
P Power
h heat transfer coefficient
Φ luminous flux
ω solid angle
salt solar altitude
sazi solar azimuth
Lz zenith luminance
Ig solar irradiance
Iext extraterrestrial direct solar irradiance
Idn direct normal irradiance
Idif diffuse irradiance
Ap Area of input aperture
As Area of surface of atrium that re-radiates energy
τ transmission through glazing
To temperature outside
e emissivity of material
σ Stefan -Boltzmann constant
SC sky component
ERC external reflected component
IRC internal reflected component
ARC atrium reflected component
SAR section aspect ratio
PAR plane aspect ratio
QUT Queensland University of Technology
Modification of Atrium Design to Improve Thermal and Daylighting Performance Symbols
xiv
em electromagnetic
uv ultraviolet
sr steradian
Q luminous energy
L length
W width
H height
R radius
HGI horizontal global illuminance
Z zenith angle
n refractive index
U thermal conductivity
R thermal resistivity
ξ angle between measuring sky point to zenith in radians
γ angle between sun and measuring sky point
ρ density
ε clearness index
cf correction factor
lux unit of illuminance
cd candela
AIP average intensity product
ref reflectivity
tit tilt angle of receiving plane from vertical
has horizontal shadow angle
n' effective refractive index
2D two dimensional
3D three dimensional
TRY test reference year
hc heat transfer coefficient for convection
hr heat transfer coefficient for radiation
Nu Nusselt number
Ray Rayleigh number
Modification of Atrium Design to Improve Thermal and Daylighting Performance Symbols
xv
Gr Groshof number
Pr Prandtl number
g gravity
µ viscosity of the fluid
Cp specific heat
β coefficient of cubical expansion
RT relative transmission
W/D width to depth ratio of the cuts in the LCP
RAPS remote area power supply
ADC analogue to digital convertor
A1 clear glazed atrium well at test site
A2 LCP glazed atrium well at test site
PTAT proportional to absolute temperature
Ω ohm
CIE International Commission of Illumination
LCPyramid pyramid shaped skylight with LCP as 2nd glazing layer
ac/hr air changes per hour
RND random number distribution
Modification of Atrium Design to Improve Thermal and Daylighting Performance Authorship
xvi
STATEMENT OF ORIGINAL AUTHORSHIP
The work contained in this thesis has not been previously submitted for a degree or
diploma at any other higher education institution. To the best of my knowledge and belief,
the thesis contains no material previously published or written by another person except
where due reference is made.
Signed: .....................................
Date: ........................................
Modification of Atrium Design to Improve Thermal and Daylighting Performance Acknowledgements
xvii
ACKNOWLEDGEMENTS
I wish to acknowledge the School of Physical and Chemical Sciences, the Centre for
Medical, Health and Environmental Physics, and the Daylight Research Group. All of
which form part of Queensland University of Technology.
The work described in this paper has been supported by the Australian Cooperative
Research Centre for Renewable Energy (ACRE). ACREs activities are funded by the
Commonwealths Cooperative Research Centres Program.
In particular, I wish to acknowledge the help and support of Dr. Ian Edmonds, Steve
Coyne, Phillip Greenup, my girlfriend Michelle Neil and my parents.
Contributions from the following people helped: Jeremy Mathews, Kane Usher, Dr. Ian
Moore, Bill Lim, Kelvin Tang, Lawrence Leong, Yvonne Wolring, David Pitt, Bob
Organ, Bureau of Meteorology, Dr. Brian J. Thomas and Darren Pearce.
QUOTATION
We shape our buildings and afterwards our buildings shape us - Sir Winston Churchill (28/10/1943 to House of Commons)
- (In The Mind of the Architect, ABC, 2000)
Modification of Atrium Design to Improve Thermal and Daylighting Performance Aims
1
Chapter 1: AIMS AND OBJECTIVES
1.1 Aim
The research aimed to determine the effectiveness of reducing the building energy load by
regulating the passive solar thermal circulation and improving daylight penetration in
atrium buildings and their adjoining spaces in the tropics. In so doing, maintaining a level
of comfort for the occupants and reducing the contribution a building has to pollution
levels such as greenhouse gases.
This study was concerned with designs for the improvement and redevelopment of
existing and future building structures within sub-tropical climates.
1.2 Objective
The objective of this research was to improve the thermal and daylighting performance of
atrium buildings. This was investigated by comparing the temperature and thermal
stratification in clear glazed roof atriums versus that of atriums that incorporate the use of
the angle selective laser cut panels (LCPs). This research project also investigated the
daylight penetration into the atrium and adjoining spaces comparing clear to LCP glazing.
Both the thermal and daylighting performance was modelled theoretically so as to assess
and demonstrate that the modified design using the LCPs was beneficial.
Computer simulated results were compared with measurements undertaken in scale
models and related to previous results.
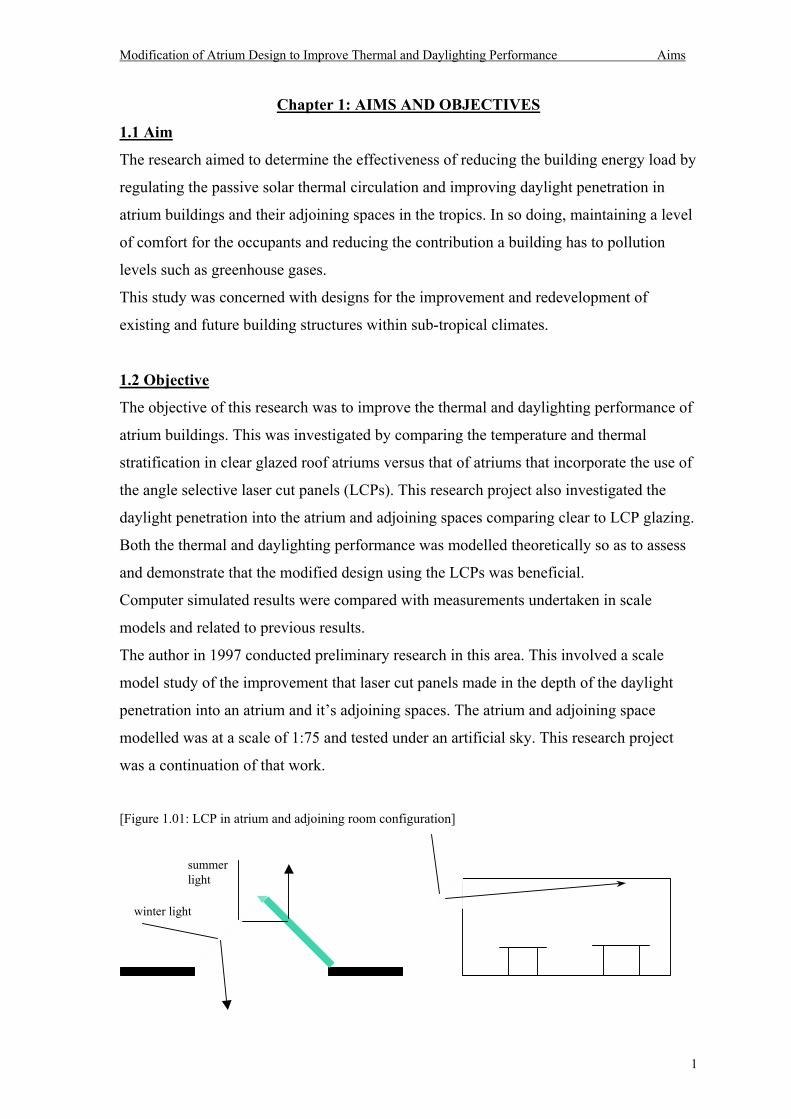
The author in 1997 conducted preliminary research in this area. This involved a scale
model study of the improvement that laser cut panels made in the depth of the daylight
penetration into an atrium and its adjoining spaces. The atrium and adjoining space
modelled was at a scale of 1:75 and tested under an artificial sky. This research project
was a continuation of that work.
[Figure 1.01: LCP in atrium and adjoining room configuration]
winter light
summerlight
Modification of Atrium Design to Improve Thermal and Daylighting Performance Aims
2
1.3 Research Hypothesis
The hypothesis of this project was that with the inclusion of the laser cut angular selective
glazing upon the roof of the atrium well, there would be less thermal stratification at times
of the day and year when a large proportion of the light was being deflected. These times
occur when there was a maximum angular difference between the cuts in the glazing and
the incident direct beam radiation. For example, early morning, late afternoon and midday
mid summer.
A more even distribution of illuminance level across the course of a clear sky summer day
in the tropics would also occur due to the redirecting effect.
The LCP modification is expected to have three overall effects. (1) Human comfort is
improved by redirecting the radiation input and stabilising the natural stratification and
lighting. (2) The need for artificial environmental controls such as lighting and cooling
during the day is eliminated. (3) The electricity usage and therefore the running costs are
reduced.
1.4 Proposed Research Program
This research outline includes areas of introduction, theory, experiment, data analysis and
conclusion.
1) The criteria establishing the desired performance objectives will be explained in
Chapter 2. The methods used to investigate these objectives are through simulation and
scale models.
2) Literature reviews on thermal stratification and daylighting in buildings particularly
those containing atriums is discussed in Chapter 3.
3) Construction of a theoretical computer simulation of light and thermal performance in
atrium spaces with and without LCPs will be explained in Chapter 5 and 6.
4) The design and construction of a model on a 1:10 scale of an atrium building are
provided in Chapter 7.
5) Simultaneous monitoring of atrium wells (one normal glazed and the other with LCP
glazing) with several temperature sensors at various heights within them to measure the
stratification under various climatic conditions. The model is to be varied with different
ventilation modes throughout the seasonal climatic changes.
6) Comparison with professional theoretical simulation programs and improvement to the
theoretical simulations formulated during this research.
7) Comparison between theoretically simulated results and collected field data.
Modification of Atrium Design to Improve Thermal and Daylighting Performance Aims
3
1.5 New Aspects of Research
• The thermal stratification in model sub tropical atria was a new area of investigation.
• The balance between the solar gain and the daylight penetration.
• The experimental daylight penetration investigation was conducted under real sub-
tropical skies so validation to the theoretical simulation was possible.
• The application of LCP technology on a larger scale to enclose an entire atrium roof
glazing in a similar design to a pyramid shaped skylight (Edmonds 1996).
• The scale of the experimental model is also a significant improvement upon previous
research into this area (Mabb 1997; Edmonds 1998; Sharples 1999).
• The length of time of data collection, while not as long as initially expected, still
significantly improved upon previous data collection research periods.
• The computer simulation of LCPs to investigate both thermal and daylight penetration
into atria using heat transfer and backward ray tracing techniques respectively.
Modification of Atrium Design to Improve Thermal and Daylighting Performance Introduction
4
Chapter 2: INTRODUCTION
2.1 Introduction
This initial chapter introduces the concepts of modern office buildings and the inclusion
of an atrium built into the design. A building, which contains an atrium space, is a unique
structure, which has many benefits and disadvantages compared to normal high rise
buildings. The inclusion of an atrium well encourages the penetration of more of the
natural environment in the form of light and heat into the well and its adjoining spaces.
This chapter also includes the topics of comfort, the tropical environment and energy
consumption and the impact of atria upon these areas.
Finally, the thermal and daylighting penetration is looked at along with proposed design
solutions for atria in the tropics. The proposed modification to the atrium glazing is
discussed and the justification for this modification is detailed.
This chapter defines the broad research area and introduces the specific research topic,
which will be discussed in detail in the following chapters.
Daylighting in architecture is an area
in which we know so much
and yet practice so little.
(Moore 1991)
Modification of Atrium Design to Improve Thermal and Daylighting Performance Introduction
5
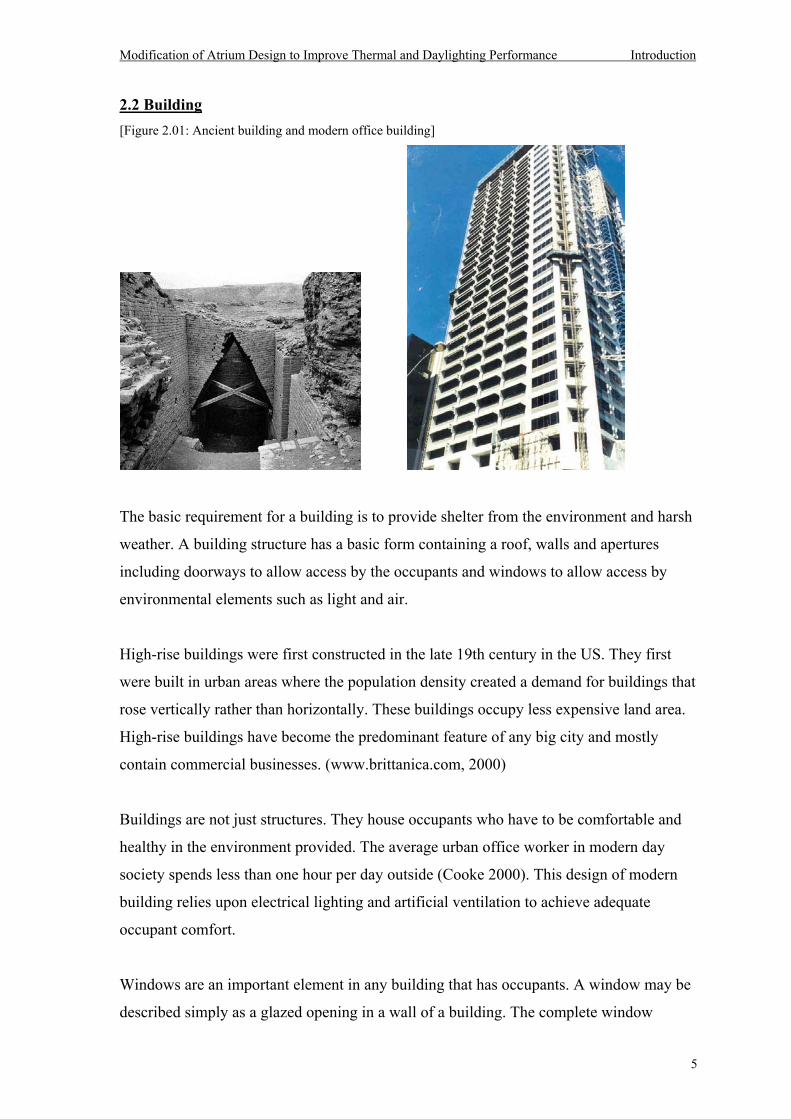
2.2 Building [Figure 2.01: Ancient building and modern office building]
The basic requirement for a building is to provide shelter from the environment and harsh
weather. A building structure has a basic form containing a roof, walls and apertures
including doorways to allow access by the occupants and windows to allow access by
environmental elements such as light and air.
High-rise buildings were first constructed in the late 19th century in the US. They first
were built in urban areas where the population density created a demand for buildings that
rose vertically rather than horizontally. These buildings occupy less expensive land area.
High-rise buildings have become the predominant feature of any big city and mostly
contain commercial businesses. (www.brittanica.com, 2000)
Buildings are not just structures. They house occupants who have to be comfortable and
healthy in the environment provided. The average urban office worker in modern day
society spends less than one hour per day outside (Cooke 2000). This design of modern
building relies upon electrical lighting and artificial ventilation to achieve adequate
occupant comfort.
Windows are an important element in any building that has occupants. A window may be
described simply as a glazed opening in a wall of a building. The complete window
Modification of Atrium Design to Improve Thermal and Daylighting Performance Introduction
6
assembly includes the glazing, frames, sash and any moving parts. They provide a barrier
from the extremes of the external weather, while still providing light penetration, fresh air,
and views of the outside world. Windows are a significant origin of heat transfer through
the building envelope and require regular cleaning maintenance.
The problem with high-rise commercial buildings is that they generally have large depth
to height ratios to maximise the number of floors and therefore the rental area. This
produces gloomy, stuffy, cramped areas for occupants, which have to rely heavily upon
artificial controls to achieve comfortable and safe working environments.
Artificial lighting and mechanical air conditioning can be expensive (rising fuel costs),
unreliable (black outs, brown outs), unhealthy, and polluting (greenhouse gas emissions,
heavy metals).
Maximum reduction in artificial lighting and air conditioning in building requires major
redesign of the style of most large buildings. Buildings with large internal open spaces
and horizontal apertures are required if adequate supply of light and air circulation is to be
achieved via natural methods.
2.3 Environment
In Australia, the sun is predominantly in the northern part of the sky. This means that the
orientation of our buildings has to be changed from the traditional Northern Hemisphere
design. The north facing glazing on our buildings is shaded to eliminate direct summer
sun while still allowing the penetration of winter sunlight. The buildings are also
elongated east to west, reducing the cross sectional area seen from the low elevation rising
and setting sun. Natural cross ventilation needs to be encouraged in the direction of the
prevailing breezes in the occupied area as well as in the roof cavity.
Australia is a land of harshness and extremes with an area of 7.682 million square
kilometres and a population of 18.918 million people but only 10% of the land is arable
(National Geographic website, 1999). Australia spreads over a large latitude range from
Cape York at 10° south to Hobart at 43° south. The tropic of Capricorn runs across the
upper part of the continent through Rockhampton at 23° 27 S. This marks the boundary
of the tropical zone and also the point at which the sun reaches the zenith at mid summer.
Modification of Atrium Design to Improve Thermal and Daylighting Performance Introduction
7
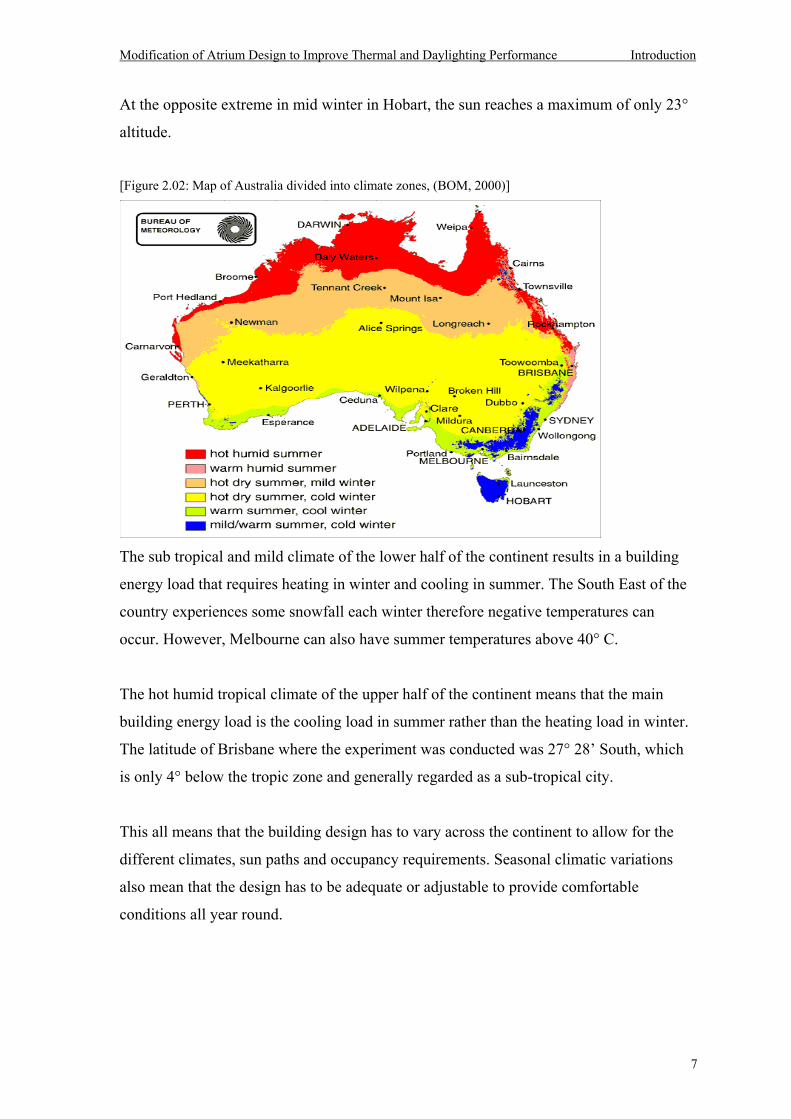
At the opposite extreme in mid winter in Hobart, the sun reaches a maximum of only 23°
altitude.
[Figure 2.02: Map of Australia divided into climate zones, (BOM, 2000)]
The sub tropical and mild climate of the lower half of the continent results in a building
energy load that requires heating in winter and cooling in summer. The South East of the
country experiences some snowfall each winter therefore negative temperatures can
occur. However, Melbourne can also have summer temperatures above 40° C.
The hot humid tropical climate of the upper half of the continent means that the main
building energy load is the cooling load in summer rather than the heating load in winter.
The latitude of Brisbane where the experiment was conducted was 27° 28 South, which
is only 4° below the tropic zone and generally regarded as a sub-tropical city.
This all means that the building design has to vary across the continent to allow for the
different climates, sun paths and occupancy requirements. Seasonal climatic variations
also mean that the design has to be adequate or adjustable to provide comfortable
conditions all year round.
Modification of Atrium Design to Improve Thermal and Daylighting Performance Introduction
8
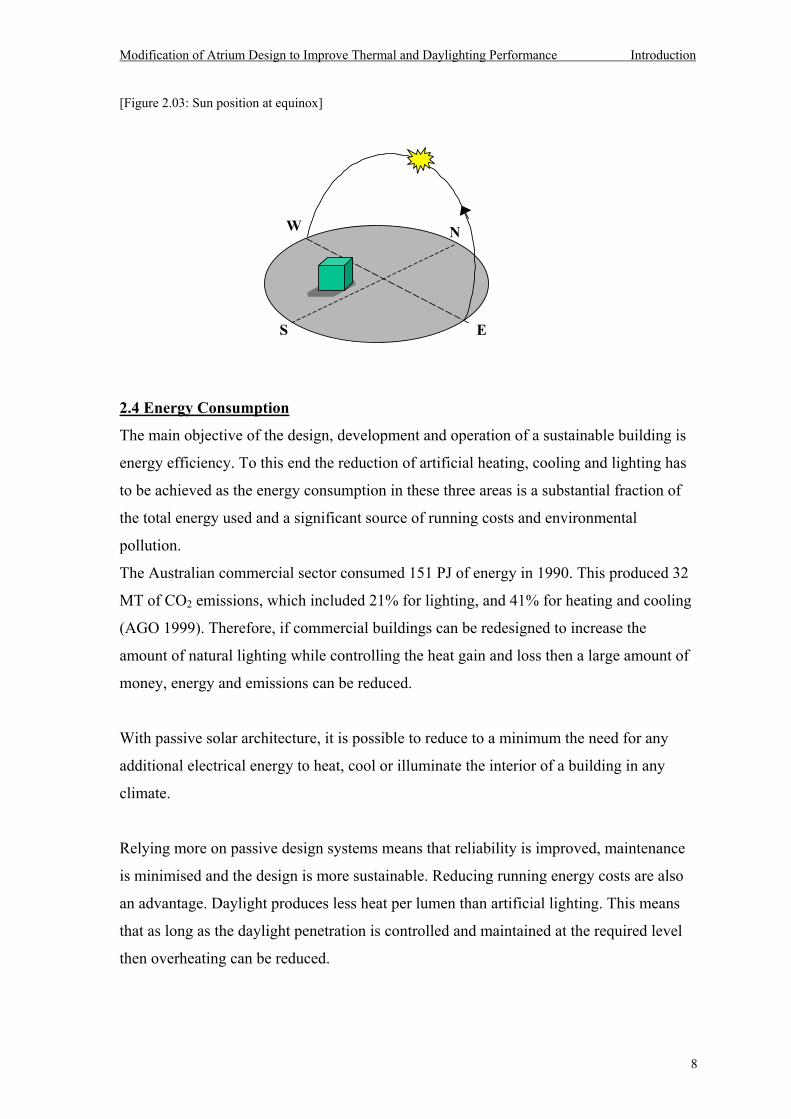
[Figure 2.03: Sun position at equinox]
2.4 Energy Consumption
The main objective of the design, development and operation of a sustainable building is
energy efficiency. To this end the reduction of artificial heating, cooling and lighting has
to be achieved as the energy consumption in these three areas is a substantial fraction of
the total energy used and a significant source of running costs and environmental
pollution.
The Australian commercial sector consumed 151 PJ of energy in 1990. This produced 32
MT of CO2 emissions, which included 21% for lighting, and 41% for heating and cooling
(AGO 1999). Therefore, if commercial buildings can be redesigned to increase the
amount of natural lighting while controlling the heat gain and loss then a large amount of
money, energy and emissions can be reduced.
With passive solar architecture, it is possible to reduce to a minimum the need for any
additional electrical energy to heat, cool or illuminate the interior of a building in any
climate.
Relying more on passive design systems means that reliability is improved, maintenance
is minimised and the design is more sustainable. Reducing running energy costs are also
an advantage. Daylight produces less heat per lumen than artificial lighting. This means
that as long as the daylight penetration is controlled and maintained at the required level
then overheating can be reduced.
NW
ES
Modification of Atrium Design to Improve Thermal and Daylighting Performance Introduction
9
Rather than renewable energy used as the solution to greenhouse gas emission reduction
and rising electricity costs, zero energy use solutions should be sort, which will reduce the
energy usage and supply to a minimum.
(http://renewable.greenhouse.gov.au/home/passive_solar.html, 2000)
2.5 Human Comfort
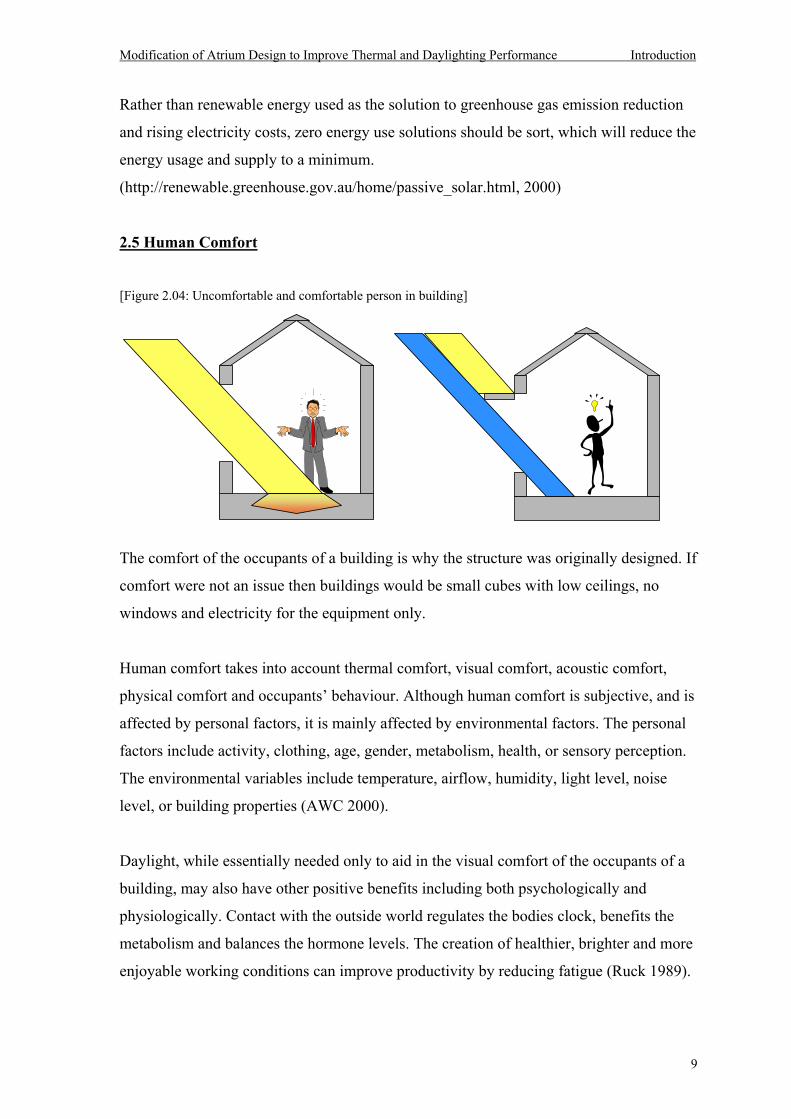
[Figure 2.04: Uncomfortable and comfortable person in building]
The comfort of the occupants of a building is why the structure was originally designed. If
comfort were not an issue then buildings would be small cubes with low ceilings, no
windows and electricity for the equipment only.
Human comfort takes into account thermal comfort, visual comfort, acoustic comfort,
physical comfort and occupants behaviour. Although human comfort is subjective, and is
affected by personal factors, it is mainly affected by environmental factors. The personal
factors include activity, clothing, age, gender, metabolism, health, or sensory perception.
The environmental variables include temperature, airflow, humidity, light level, noise
level, or building properties (AWC 2000).
Daylight, while essentially needed only to aid in the visual comfort of the occupants of a
building, may also have other positive benefits including both psychologically and
physiologically. Contact with the outside world regulates the bodies clock, benefits the
metabolism and balances the hormone levels. The creation of healthier, brighter and more
enjoyable working conditions can improve productivity by reducing fatigue (Ruck 1989).
Modification of Atrium Design to Improve Thermal and Daylighting Performance Introduction
10
The reason for heating or cooling a building occupied by people is to provide thermal
comfort. The comfort level achieved by the occupants depends upon their location to the
windows, air-conditioning vents and radiative or other airflow sources. As the windows
are the main source of heat transfer through a buildings envelope the comfort achieved
by the occupants depends upon their location with respect to the window.
If the window is openable or if infiltration around the windowsill occurs then cool drafts
or high velocity airflow can occur. If the window is closed then the main cause of
discomfort is direct radiation. Airflow and direct radiation can be discomforting or
comforting depending upon the season and the nominal weather conditions outside.
Visual comfort is the main reason we require good lighting conditions. Visual comfort
includes: suitable intensity and direction of illuminance upon the work area, appropriate
colour rendering, absence of contrast and glare discomfort and a variety of lighting quality
and intensity over time and place.
Comfort in buildings that include atria vary depending upon the occupants location. In the
atrium well itself, which is generally used as a relaxing, transitional space, the
requirement of comfort is less stringent. Lighting levels can vary from 50 lux to 5000 lux
and temperature can vary from 21°C up to 27°C without the occupants feeling
uncomfortable. This is because the space is usually not occupied for long periods of time.
The requirement of strict comfort levels is more necessary in the adjoining spaces to
atrium wells. These spaces are usually used as shops or offices and as working spaces can
be occupied for long periods of time. The temperature and lighting levels in these spaces
are affected by the conditions within the atrium well and the outside climate.
The minimum maintenance illuminance level in office spaces is 320 lux and in shops is
160 lux (Australian Standards 1680.2.0 1990). Air-conditioned office spaces are usually
kept within the temperature range of between 21°C and 24°C.
The subjective nature of adequate lighting conditions not only requires a minimum
lighting level but also a minimum quality of light. Contrast is the difference between the
visual appearance of an object and the background. Contrast may occur when (1) one wall
is brightened by the sun while the rest of the room is in shadow, or, (2) when the room is
illuminated and one corner is shadowed and dark.
Modification of Atrium Design to Improve Thermal and Daylighting Performance Introduction
11
Too much direct light can cause uncomfortable glare. Reducing the transmission of the
window through the use of advanced glazing or controlling elements can reduce glare
conditions. Glare is the discomfort caused when the eye has extremely different light
levels in the field of view at the same time. Glare can be caused directly, indirectly or by
reflection. Direct glare can be caused from the view of a light bulb or the sun.
The positive physical effects from daylight upon occupants were clearly shown in two
recent case studies involving school children. A study in Canada used 4 different artificial
lighting strategies to show that full spectrum artificial light gave the best results. Full
spectrum light is produced naturally by the sun. It showed the students were healthier
(higher attendance), happier (less moody) and more productive (academic achievement)
when exposed daily to full spectrum light. This result highlights the non-visual effect of
light upon occupants (Hathaway 1994).
Based upon the previous study, another investigation was conducted in North Carolina
comparing daylit schools to non-daylit schools. The daylit schools showed a scholastic
performance 5% higher than at artificially lit schools. New and old artificially lit schools
were investigated and both showed a negative impact upon students performance
(Nickolas et. al. 1996).
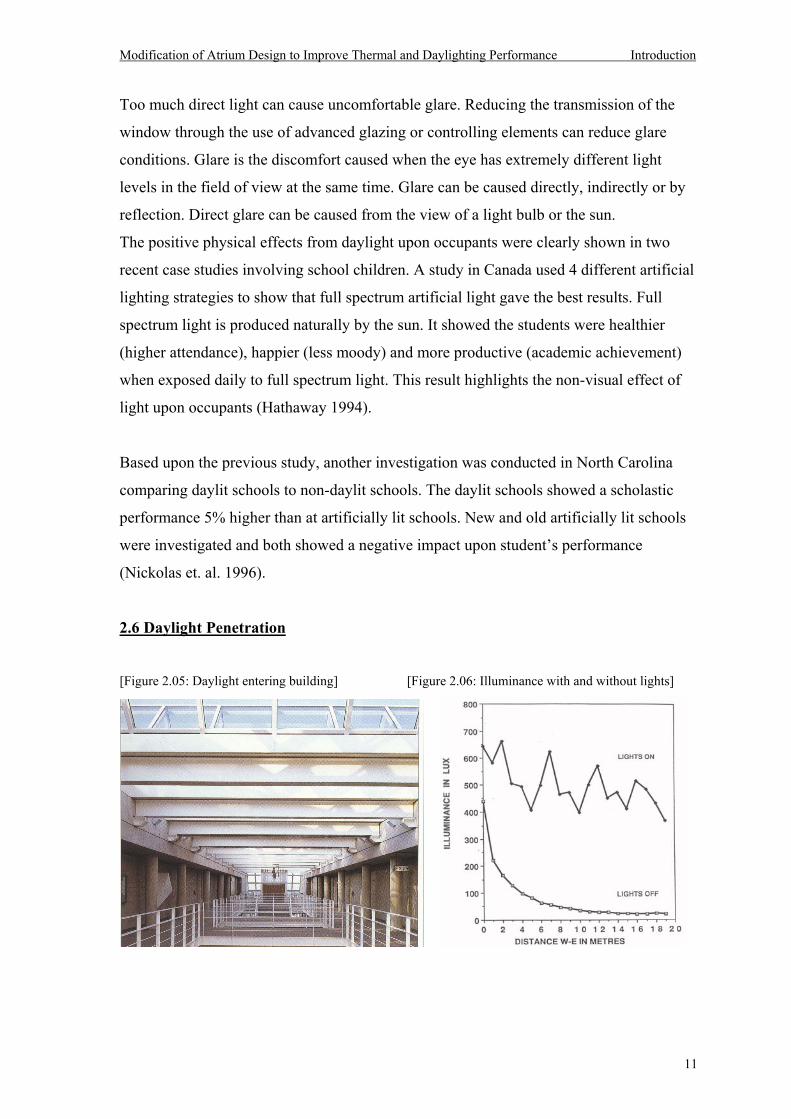
2.6 Daylight Penetration
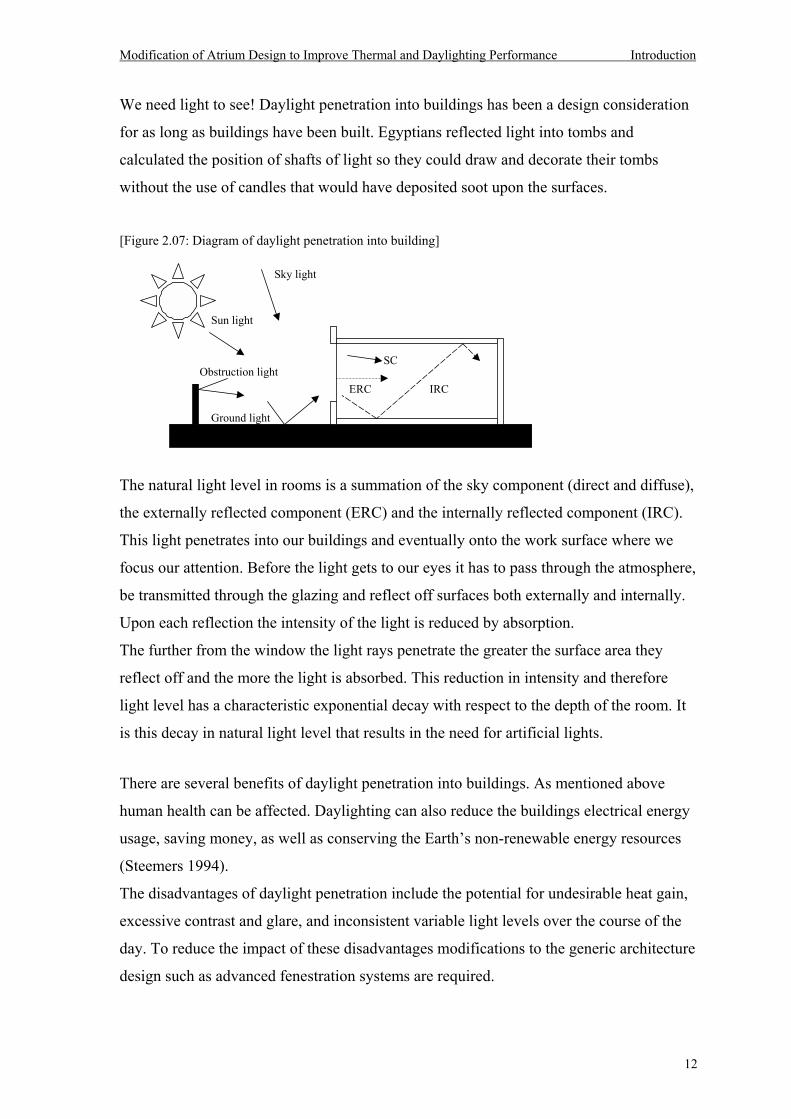
[Figure 2.05: Daylight entering building] [Figure 2.06: Illuminance with and without lights]
Modification of Atrium Design to Improve Thermal and Daylighting Performance Introduction
12
We need light to see! Daylight penetration into buildings has been a design consideration
for as long as buildings have been built. Egyptians reflected light into tombs and
calculated the position of shafts of light so they could draw and decorate their tombs
without the use of candles that would have deposited soot upon the surfaces.
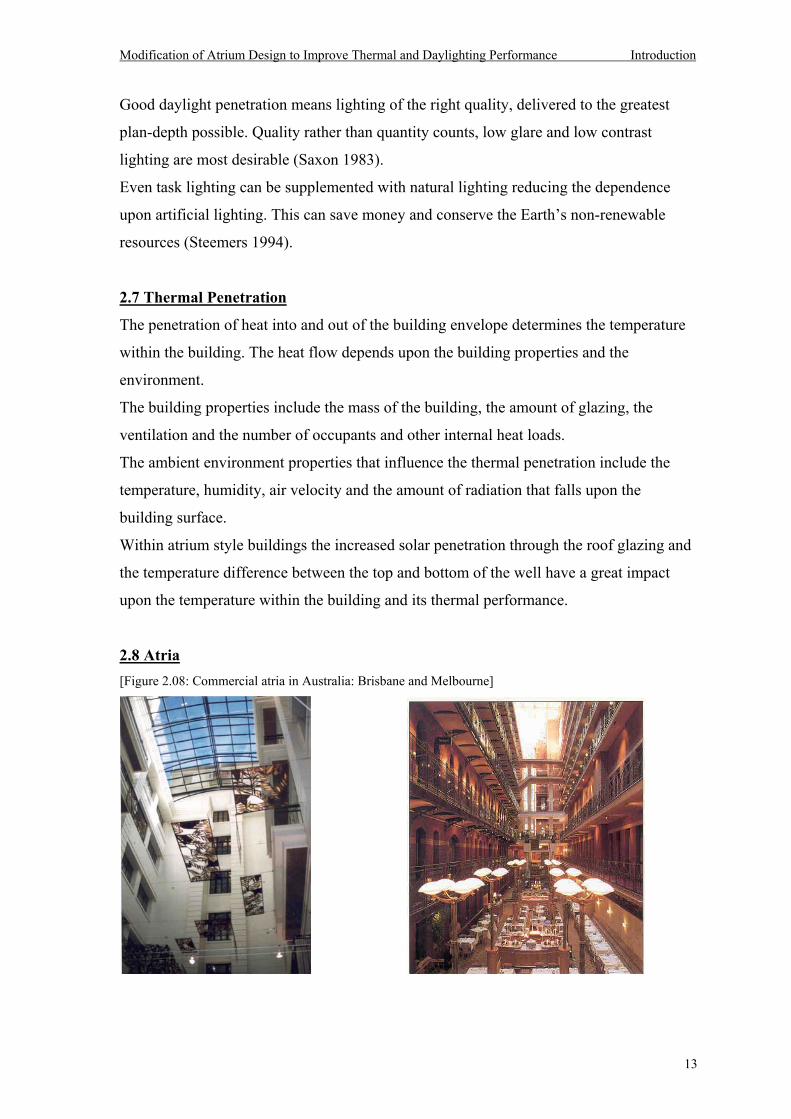
[Figure 2.07: Diagram of daylight penetration into building]
The natural light level in rooms is a summation of the sky component (direct and diffuse),
the externally reflected component (ERC) and the internally reflected component (IRC).
This light penetrates into our buildings and eventually onto the work surface where we
focus our attention. Before the light gets to our eyes it has to pass through the atmosphere,
be transmitted through the glazing and reflect off surfaces both externally and internally.
Upon each reflection the intensity of the light is reduced by absorption.
The further from the window the light rays penetrate the greater the surface area they
reflect off and the more the light is absorbed. This reduction in intensity and therefore
light level has a characteristic exponential decay with respect to the depth of the room. It
is this decay in natural light level that results in the need for artificial lights.
There are several benefits of daylight penetration into buildings. As mentioned above
human health can be affected. Daylighting can also reduce the buildings electrical energy
usage, saving money, as well as conserving the Earths non-renewable energy resources
(Steemers 1994).
The disadvantages of daylight penetration include the potential for undesirable heat gain,
excessive contrast and glare, and inconsistent variable light levels over the course of the
day. To reduce the impact of these disadvantages modifications to the generic architecture
design such as advanced fenestration systems are required.
Sky light
Ground light
Sun light
Obstruction lightIRC
SC
ERC
Modification of Atrium Design to Improve Thermal and Daylighting Performance Introduction
13
Good daylight penetration means lighting of the right quality, delivered to the greatest
plan-depth possible. Quality rather than quantity counts, low glare and low contrast
lighting are most desirable (Saxon 1983).
Even task lighting can be supplemented with natural lighting reducing the dependence
upon artificial lighting. This can save money and conserve the Earths non-renewable
resources (Steemers 1994).
2.7 Thermal Penetration
The penetration of heat into and out of the building envelope determines the temperature
within the building. The heat flow depends upon the building properties and the
environment.
The building properties include the mass of the building, the amount of glazing, the
ventilation and the number of occupants and other internal heat loads.
The ambient environment properties that influence the thermal penetration include the
temperature, humidity, air velocity and the amount of radiation that falls upon the
building surface.
Within atrium style buildings the increased solar penetration through the roof glazing and
the temperature difference between the top and bottom of the well have a great impact
upon the temperature within the building and its thermal performance.
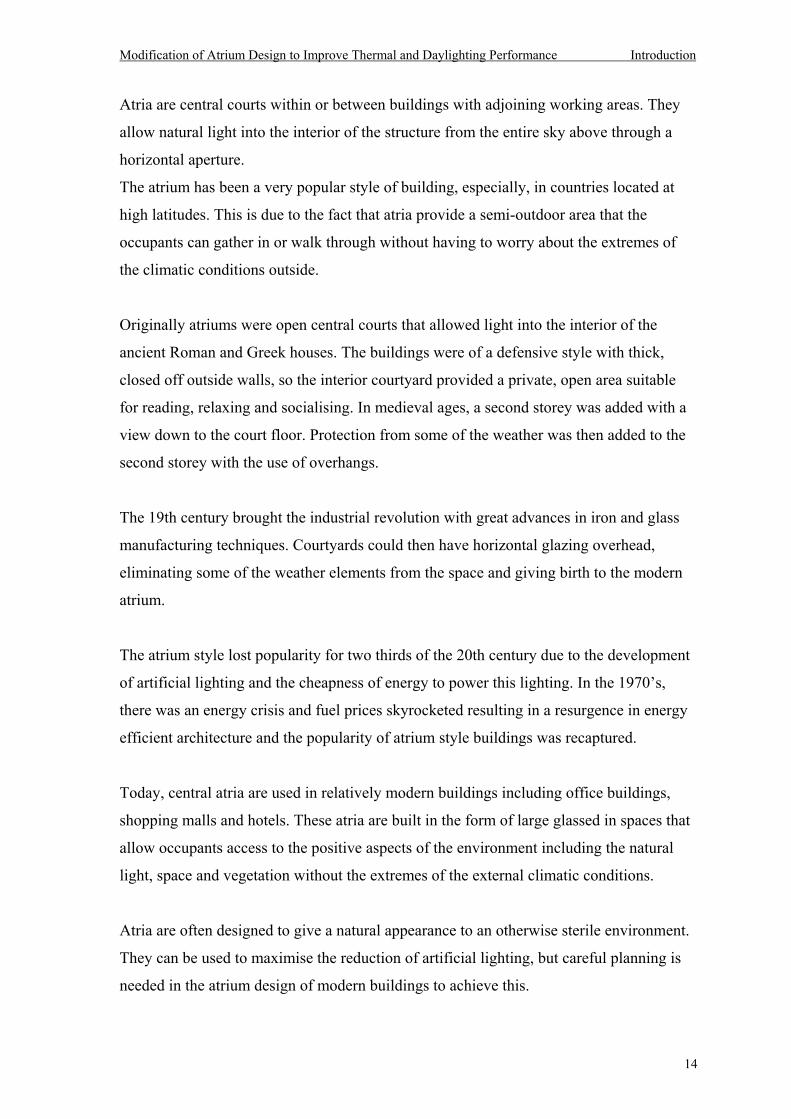
2.8 Atria [Figure 2.08: Commercial atria in Australia: Brisbane and Melbourne]
Modification of Atrium Design to Improve Thermal and Daylighting Performance Introduction
14
Atria are central courts within or between buildings with adjoining working areas. They
allow natural light into the interior of the structure from the entire sky above through a
horizontal aperture.
The atrium has been a very popular style of building, especially, in countries located at
high latitudes. This is due to the fact that atria provide a semi-outdoor area that the
occupants can gather in or walk through without having to worry about the extremes of
the climatic conditions outside.
Originally atriums were open central courts that allowed light into the interior of the
ancient Roman and Greek houses. The buildings were of a defensive style with thick,
closed off outside walls, so the interior courtyard provided a private, open area suitable
for reading, relaxing and socialising. In medieval ages, a second storey was added with a
view down to the court floor. Protection from some of the weather was then added to the
second storey with the use of overhangs.
The 19th century brought the industrial revolution with great advances in iron and glass
manufacturing techniques. Courtyards could then have horizontal glazing overhead,
eliminating some of the weather elements from the space and giving birth to the modern
atrium.
The atrium style lost popularity for two thirds of the 20th century due to the development
of artificial lighting and the cheapness of energy to power this lighting. In the 1970s,
there was an energy crisis and fuel prices skyrocketed resulting in a resurgence in energy
efficient architecture and the popularity of atrium style buildings was recaptured.
Today, central atria are used in relatively modern buildings including office buildings,
shopping malls and hotels. These atria are built in the form of large glassed in spaces that
allow occupants access to the positive aspects of the environment including the natural
light, space and vegetation without the extremes of the external climatic conditions.
Atria are often designed to give a natural appearance to an otherwise sterile environment.
They can be used to maximise the reduction of artificial lighting, but careful planning is
needed in the atrium design of modern buildings to achieve this.
Modification of Atrium Design to Improve Thermal and Daylighting Performance Introduction
15
While atria are designed primarily for aesthetic reasons, this style of building can be
beneficial for energy efficiency and psychological reasons. Living and transition spaces
within buildings could be covered by transparent or translucent material which provides
decreased and less contrasting light levels to the spaces connected to the atrium.
In the tropics, atria are not a popular building design due to the increased penetration of
the direct sunlight, which causes discomfort to the occupants within the building.
The glazing material and the cross ventilation strategy can be modified and improved to
compensate for this fundamental problem.
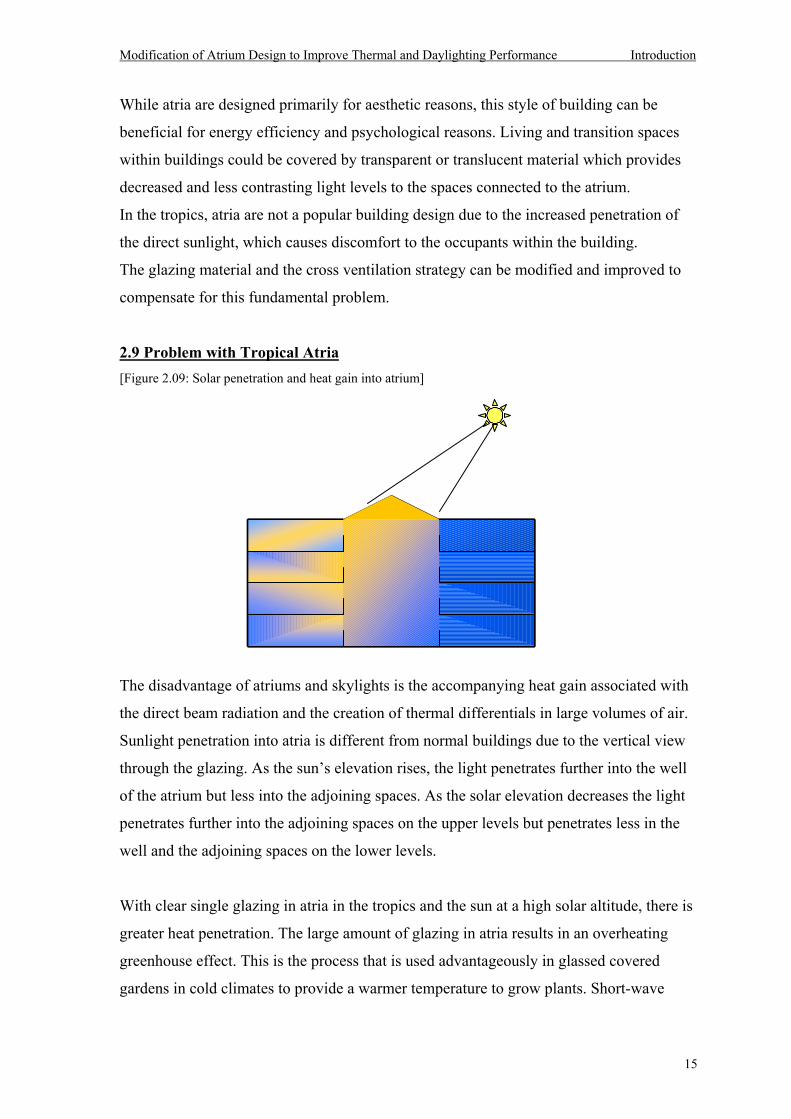
2.9 Problem with Tropical Atria [Figure 2.09: Solar penetration and heat gain into atrium]
The disadvantage of atriums and skylights is the accompanying heat gain associated with
the direct beam radiation and the creation of thermal differentials in large volumes of air.
Sunlight penetration into atria is different from normal buildings due to the vertical view
through the glazing. As the suns elevation rises, the light penetrates further into the well
of the atrium but less into the adjoining spaces. As the solar elevation decreases the light
penetrates further into the adjoining spaces on the upper levels but penetrates less in the
well and the adjoining spaces on the lower levels.
With clear single glazing in atria in the tropics and the sun at a high solar altitude, there is
greater heat penetration. The large amount of glazing in atria results in an overheating
greenhouse effect. This is the process that is used advantageously in glassed covered
gardens in cold climates to provide a warmer temperature to grow plants. Short-wave
Modification of Atrium Design to Improve Thermal and Daylighting Performance Introduction
16
solar energy is transmitted through the glazing and absorbed by the solid elements of the
building or in the building. These elements then re-emit long wave radiation, which is
prevented from re-transmitting back through the glazing (Goulding 1992).
The human comfort zone for a sub tropical zone such as Brisbane is between 21° and 27°
Celsius (Willrath 1998) so the temperature within buildings should be kept within this
temperature range.
The large amount of glazing which results in excess heat gain via direct radiation input
also overrides the natural convection process. This produces a thermal stratification stack
effect within the atrium well. The result is a much higher temperature towards the top of
the atrium. The hot air also flows into the upper level adjoining spaces, making them hot
as well. If the thermal stratification can be reduced then the comfort in the adjoining
spaces is improved.
Thermal stratification within atria is a relatively new area of research (Luther 1991,
Togari 1993, Kolsaker 1995). It is an important concept in terms of the energy running
costs of the building and increasing the human comfort level.
If there is no access to the upper areas of the atrium well then a thermally stratified atrium
will in fact keep the hot air away from the occupants at the bottom of the well.
In an air-conditioned atrium, the placement of the temperature sensor with respect to the
thermally stratified medium will influence the amount of energy the mechanical
ventilation system expends to produce a comfortable indoor climate. More expended
energy means a higher running cost for the buildings tenants.
Rather than avoiding these lighting solutions due to the accompanying heat load,
designers should seek a way to reduce the heat without reducing the light. Some solutions
have involved adjustable screens to block light or monitor skylights but these are still
inefficient at transmitting low elevation light.
Modification of Atrium Design to Improve Thermal and Daylighting Performance Introduction
17
2.10 Proposed Solution to Tropical Atria
Advanced glazing systems can improve the effectiveness and usefulness of atrium style
buildings in the tropics. This is achieved by reducing the solar heat gain during times
when it is not needed and enhancing the light level and penetration into the building at
times when it is needed.
Atriums in tropical architecture have become more popular due to their aesthetic
appearance and many strategies have been used to reduce the overheating problem. Some
of these solutions include using translucent instead of transparent glazing, double glazing
or shading.
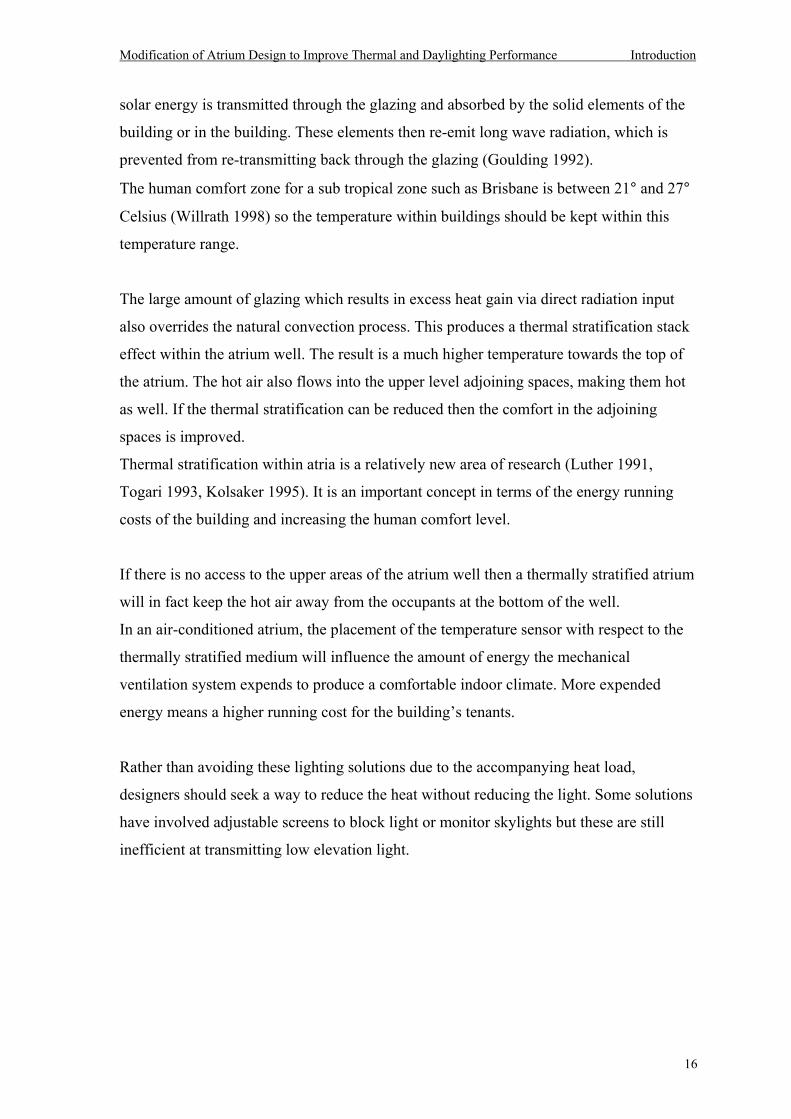
[Figure 2.10: LCPs redirect light through pyramid skylight]
Reject high elevationdirect sunlight
Redirect lowelevation skylight
Less solar energy gain through out the middle of the day willresult in lower temperature and less thermal stratification
The solution discussed here to improve the daylight penetration into buildings, while not
increasing the solar thermal penetration, is to use light redirecting devices to control light
from the bright part of the sky. This particular solution involves using angular selective
glazing (Edmonds 1996) used initially for vertical fenestration and then applied to
skylights.
Modification of Atrium Design to Improve Thermal and Daylighting Performance Introduction
18
It is produced in clear acrylic sheets containing parallel laser cuts. The glazing deflects or
rejects the incident light that hits the laser cuts depending upon the angle of incidence of
the direct light rays. As in the case of a pyramidal shaped skylight the vertical light rays
are rejected while the low angle light rays are redirected through the glazing. This should
have a stabilising effect upon the lighting and heating level within the atrium over the
course of the day and the year.
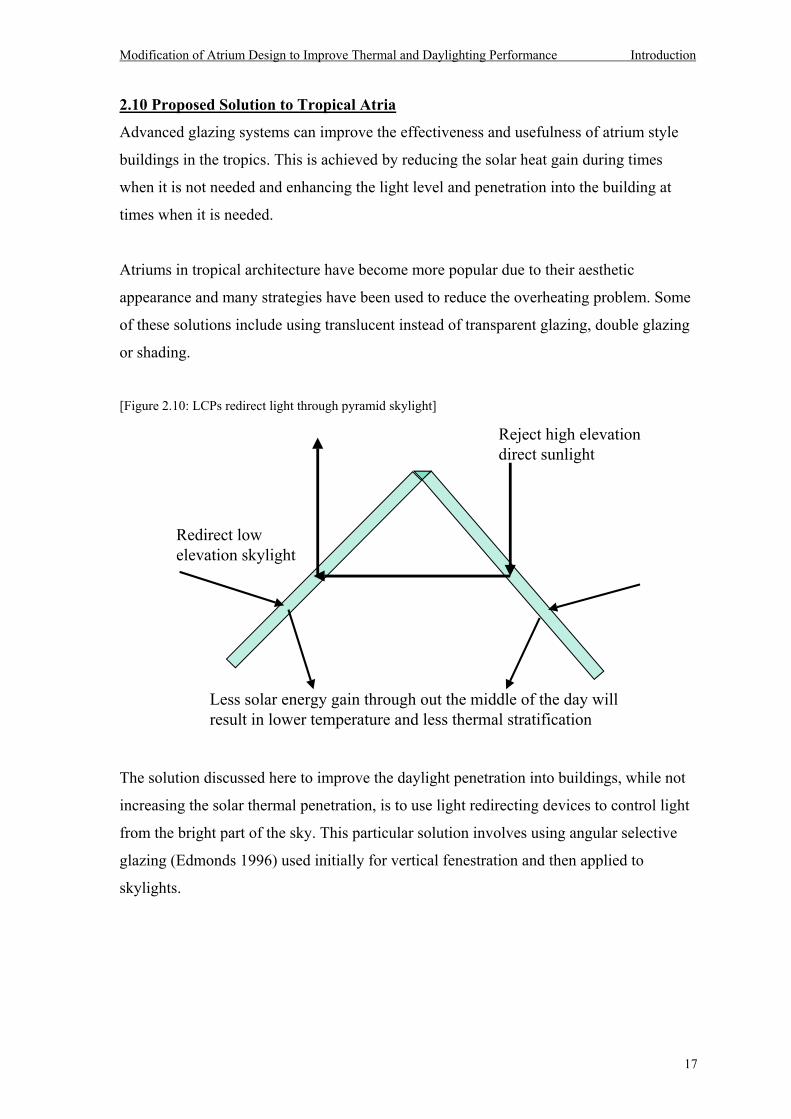
[Figure 2.11: LCPs in tilted vertical window]
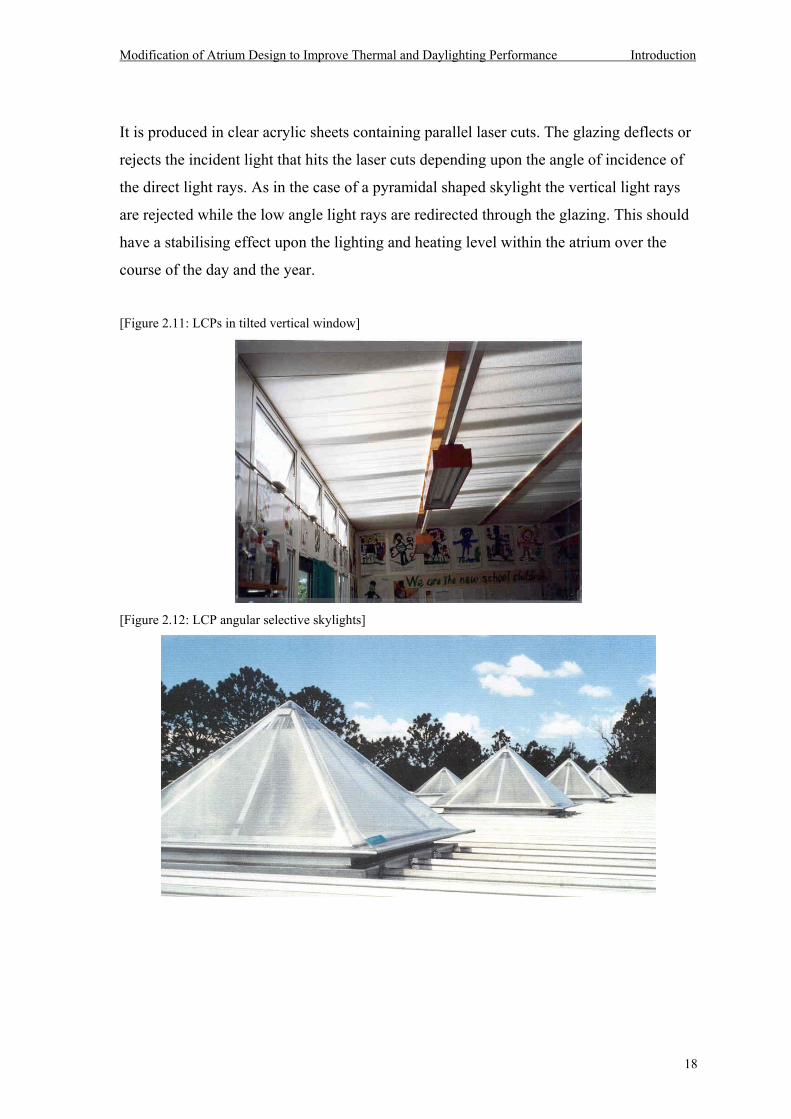
[Figure 2.12: LCP angular selective skylights]
Modification of Atrium Design to Improve Thermal and Daylighting Performance Review
19
Chapter 3: LITERATURE REVIEW
3.1 Introduction
The quantitative improvement of comfort within buildings was a relatively new area
of research considering the history of building structures and the time, effort and
expense placed upon construction. The areas of comfort investigated in this research
include visual and thermal.
The specific building structure that is looked at in this research is the atrium style due
to its recent popularity and the potential for adequate comfort supplied within the
structure via natural, passive methods.
Daylight penetration research has traditionally been investigated with the use of scale
models under artificial skies to establish daylight factor data tables or generic
analytical equations. Models of buildings usually include simplified geometry and are
placed under artificial skies. With this type of model, only a rough estimate of the
final illuminance can be obtained.
The prediction of thermal flow within building structures is a difficult area of research
due to the interaction between conduction, convection, radiation and stratification of
heat transfer. Generally, only energy consumption simulations have been conducted,
though computational fluid dynamics models have been used to some success (Jones
1991).
Recent developments in light and thermal computer simulations have allowed a
greater depth of research into the performance of buildings. The development,
improvement and usefulness of these programs are briefly commented upon towards
the end of this chapter.
Research into advanced glazing and fenestration design to increase the penetration
and usefulness of natural daylight to improve upon the level of comfort within
modern commercial buildings is an area under current review and investigation,
particularly by the International Energy Agency Task 21 and 31 (IEA 2000, Ruck
1989).
Modification of Atrium Design to Improve Thermal and Daylighting Performance Review
20
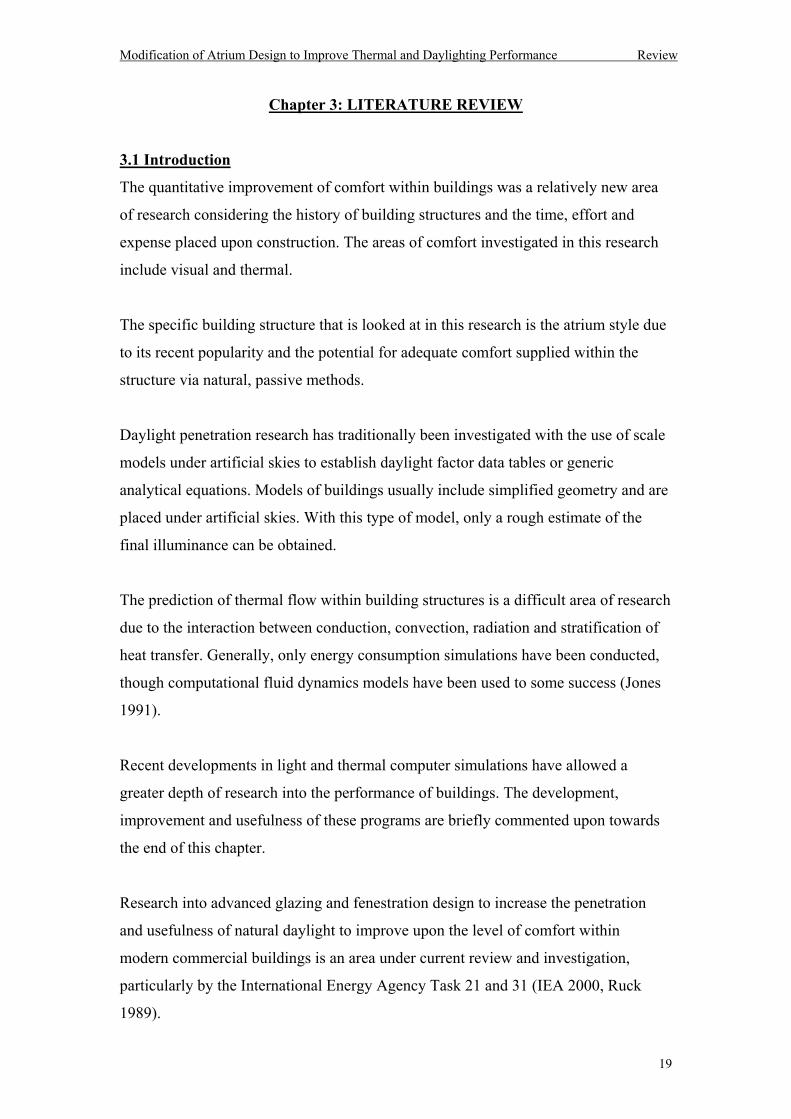
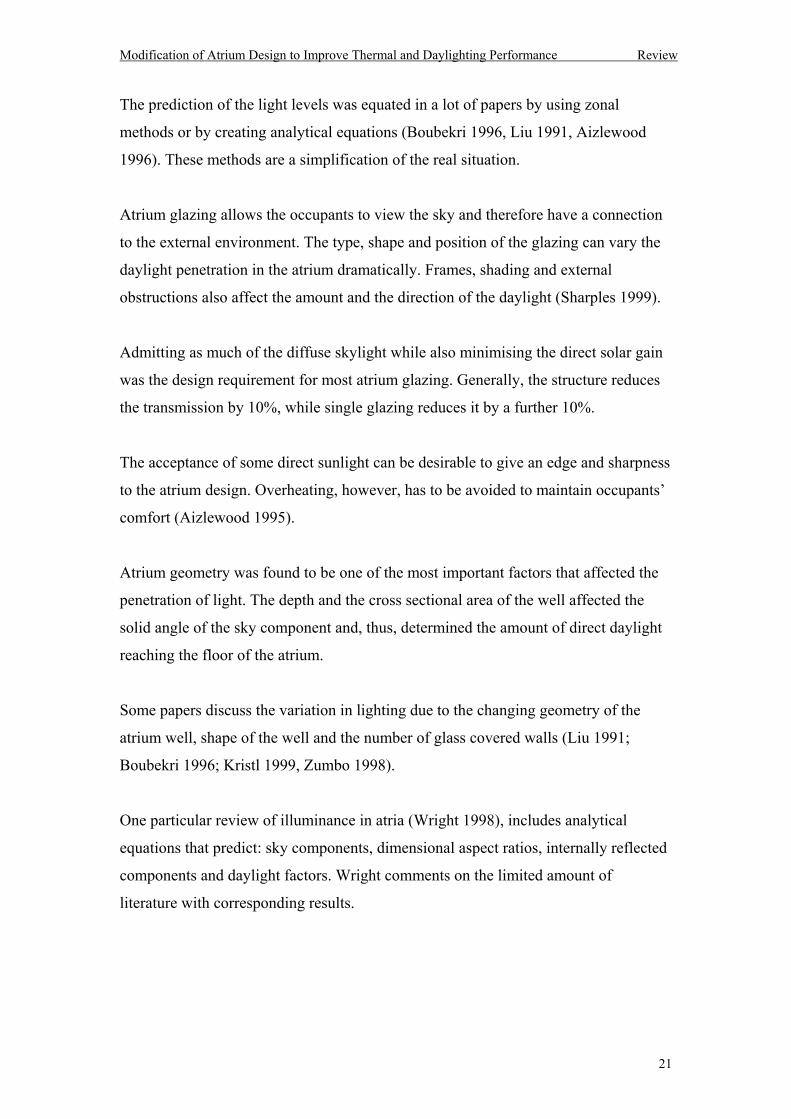
3.2 Daylighting in Atria [Figure 3.01: Diagram of daylight penetration into atrium well]
Research into daylight penetration into atriums takes the form of predicting the light
levels in the wells and adjoining spaces by using either scale model studies, analytical
equations or computer simulations. Some investigations used a combination of these
methods. In the research, comparisons were made between designs after changing one
particular atrium parameter. These parameters include atrium geometry, surface
reflectivity, glazing and sky distribution.
The most commonly used sky distribution and the easiest to simulate is the overcast
sky because there is no direct sun and the ratio of zenith luminance to horizon is
simply 3:1. Most of the previous modelling uses this distribution and all results are
given in terms of daylight factors (Aizlewood 1997; Littlefair 1994; Boubekri 1995;
Aschehoug 1992; Iyer-Raniga 1994). The daylight factor is the ratio of the internal to
external horizontal global illuminance.
Artificial skies were chosen to test ideas because stable reproducible light conditions
were needed. The worst sky conditions (eg., overcast sky distribution) were chosen as
the artificial sky model to find the lowest internal illuminance levels (Iyer-Raniga
1994). Due to atriums view of the sky zenith, which is the brightest part of the
overcast sky, the overcast sky distribution may not be the worst case scenario for this
building structure (Wright 1998).
Sky light Sun light
ARC
SC
ARC
Modification of Atrium Design to Improve Thermal and Daylighting Performance Review
21
The prediction of the light levels was equated in a lot of papers by using zonal
methods or by creating analytical equations (Boubekri 1996, Liu 1991, Aizlewood
1996). These methods are a simplification of the real situation.
Atrium glazing allows the occupants to view the sky and therefore have a connection
to the external environment. The type, shape and position of the glazing can vary the
daylight penetration in the atrium dramatically. Frames, shading and external
obstructions also affect the amount and the direction of the daylight (Sharples 1999).
Admitting as much of the diffuse skylight while also minimising the direct solar gain
was the design requirement for most atrium glazing. Generally, the structure reduces
the transmission by 10%, while single glazing reduces it by a further 10%.
The acceptance of some direct sunlight can be desirable to give an edge and sharpness
to the atrium design. Overheating, however, has to be avoided to maintain occupants
comfort (Aizlewood 1995).
Atrium geometry was found to be one of the most important factors that affected the
penetration of light. The depth and the cross sectional area of the well affected the
solid angle of the sky component and, thus, determined the amount of direct daylight
reaching the floor of the atrium.
Some papers discuss the variation in lighting due to the changing geometry of the
atrium well, shape of the well and the number of glass covered walls (Liu 1991;
Boubekri 1996; Kristl 1999, Zumbo 1998).
One particular review of illuminance in atria (Wright 1998), includes analytical
equations that predict: sky components, dimensional aspect ratios, internally reflected
components and daylight factors. Wright comments on the limited amount of
literature with corresponding results.
Modification of Atrium Design to Improve Thermal and Daylighting Performance Review
22
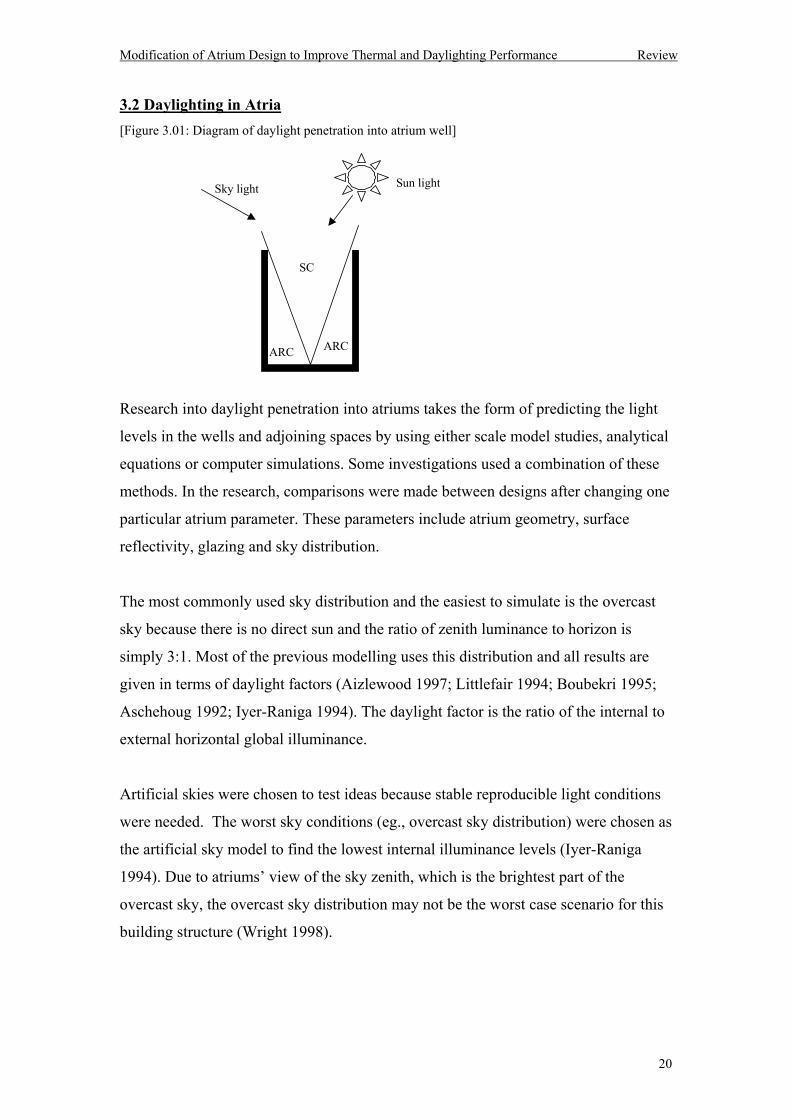
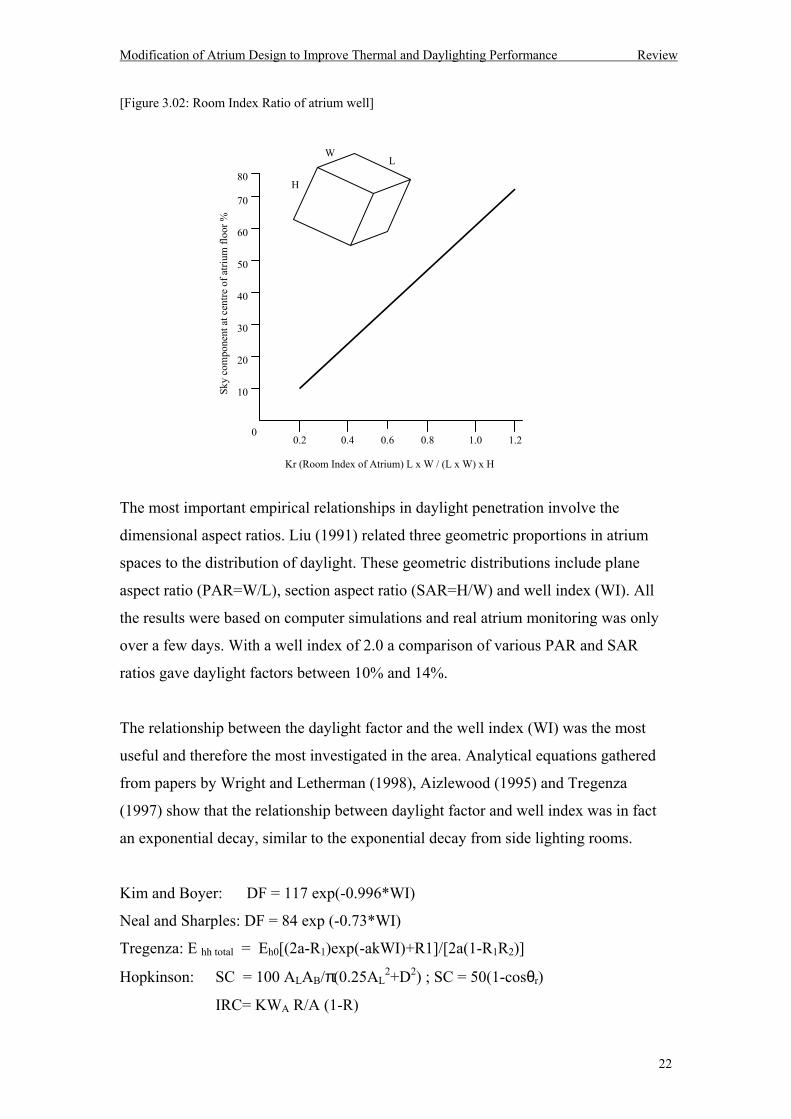
[Figure 3.02: Room Index Ratio of atrium well]
The most important empirical relationships in daylight penetration involve the
dimensional aspect ratios. Liu (1991) related three geometric proportions in atrium
spaces to the distribution of daylight. These geometric distributions include plane
aspect ratio (PAR=W/L), section aspect ratio (SAR=H/W) and well index (WI). All
the results were based on computer simulations and real atrium monitoring was only
over a few days. With a well index of 2.0 a comparison of various PAR and SAR
ratios gave daylight factors between 10% and 14%.
The relationship between the daylight factor and the well index (WI) was the most
useful and therefore the most investigated in the area. Analytical equations gathered
from papers by Wright and Letherman (1998), Aizlewood (1995) and Tregenza
(1997) show that the relationship between daylight factor and well index was in fact
an exponential decay, similar to the exponential decay from side lighting rooms.
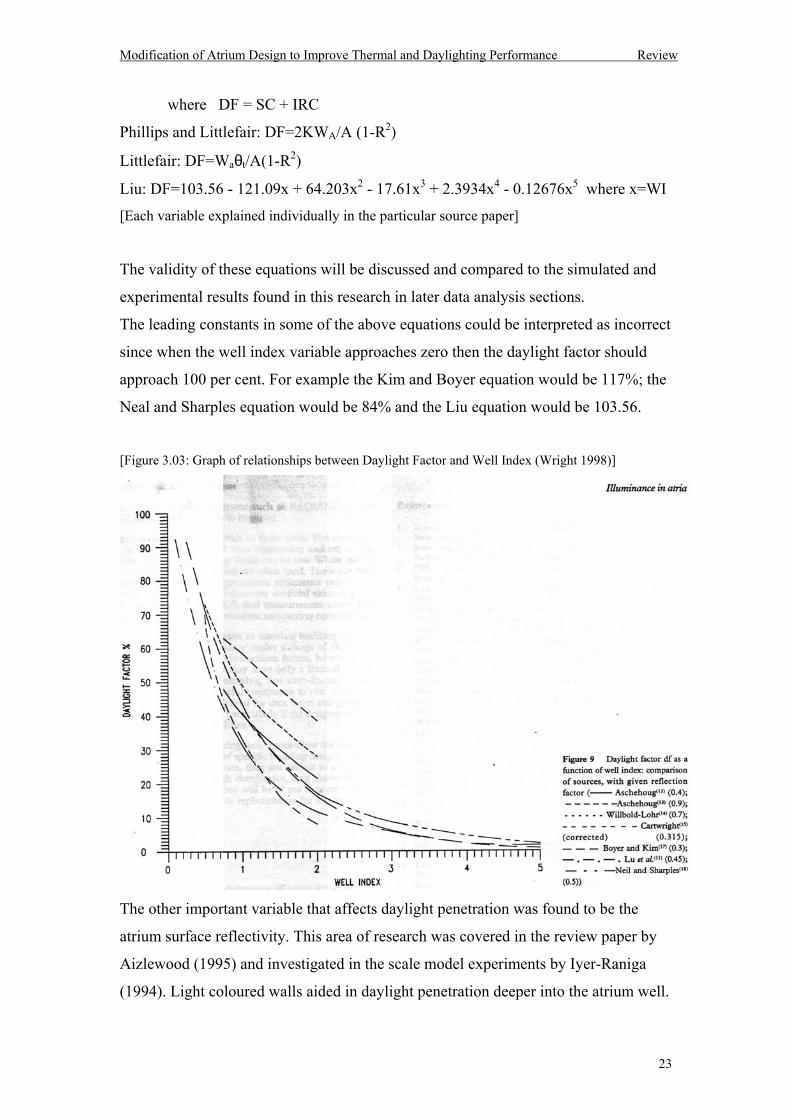
Kim and Boyer: DF = 117 exp(-0.996*WI)
Neal and Sharples: DF = 84 exp (-0.73*WI)
Tregenza: E hh total = Eh0[(2a-R1)exp(-akWI)+R1]/[2a(1-R1R2)]
Hopkinson: SC = 100 ALAB/π(0.25AL2+D2) ; SC = 50(1-cosθr)
IRC= KWA R/A (1-R)
Kr (Room Index of Atrium) L x W / (L x W) x H
00.2 0.8 1.00.4 0.6
30
20
10
40
50
60
70
80
1.2
Sky
com
pone
nt a
t cen
tre o
f atri
um fl
oor %
H
LW
Modification of Atrium Design to Improve Thermal and Daylighting Performance Review
23
where DF = SC + IRC
Phillips and Littlefair: DF=2KWA/A (1-R2)
Littlefair: DF=Waθt/A(1-R2)
Liu: DF=103.56 - 121.09x + 64.203x2 - 17.61x3 + 2.3934x4 - 0.12676x5 where x=WI
[Each variable explained individually in the particular source paper]
The validity of these equations will be discussed and compared to the simulated and
experimental results found in this research in later data analysis sections.
The leading constants in some of the above equations could be interpreted as incorrect
since when the well index variable approaches zero then the daylight factor should
approach 100 per cent. For example the Kim and Boyer equation would be 117%; the
Neal and Sharples equation would be 84% and the Liu equation would be 103.56.
[Figure 3.03: Graph of relationships between Daylight Factor and Well Index (Wright 1998)]
The other important variable that affects daylight penetration was found to be the
atrium surface reflectivity. This area of research was covered in the review paper by
Aizlewood (1995) and investigated in the scale model experiments by Iyer-Raniga
(1994). Light coloured walls aided in daylight penetration deeper into the atrium well.
Modification of Atrium Design to Improve Thermal and Daylighting Performance Review
24
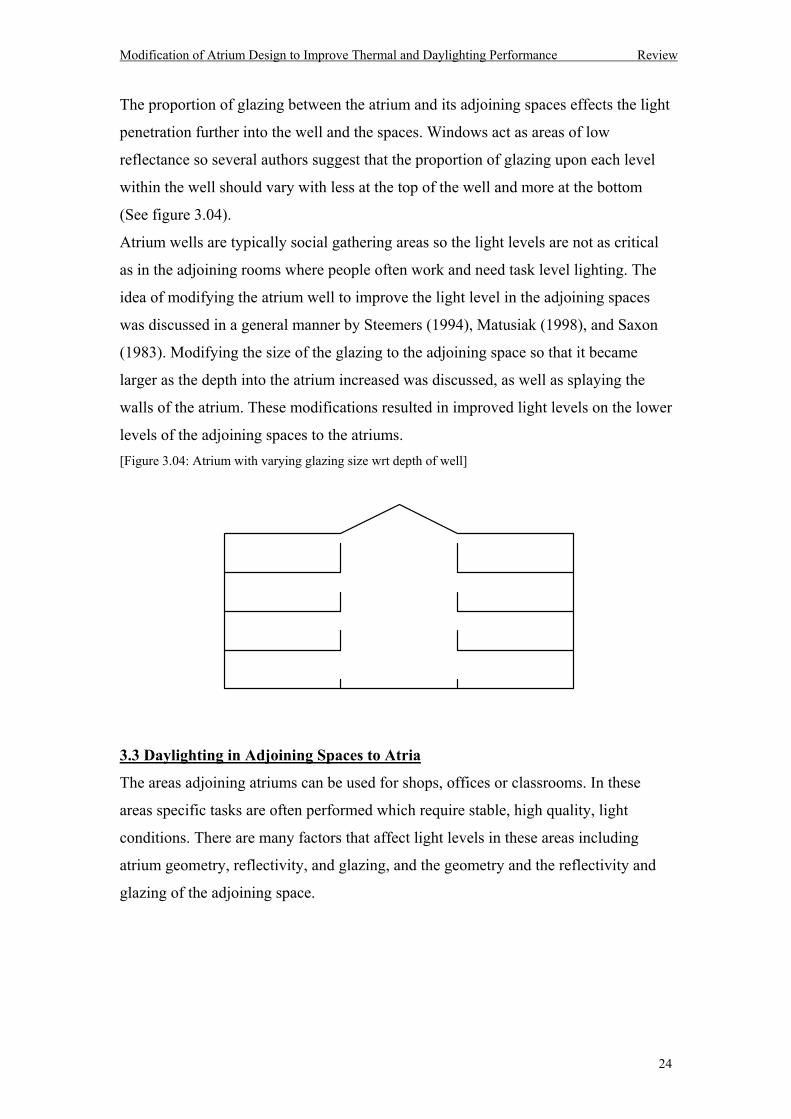
The proportion of glazing between the atrium and its adjoining spaces effects the light
penetration further into the well and the spaces. Windows act as areas of low
reflectance so several authors suggest that the proportion of glazing upon each level
within the well should vary with less at the top of the well and more at the bottom
(See figure 3.04).
Atrium wells are typically social gathering areas so the light levels are not as critical
as in the adjoining rooms where people often work and need task level lighting. The
idea of modifying the atrium well to improve the light level in the adjoining spaces
was discussed in a general manner by Steemers (1994), Matusiak (1998), and Saxon
(1983). Modifying the size of the glazing to the adjoining space so that it became
larger as the depth into the atrium increased was discussed, as well as splaying the
walls of the atrium. These modifications resulted in improved light levels on the lower
levels of the adjoining spaces to the atriums. [Figure 3.04: Atrium with varying glazing size wrt depth of well]
3.3 Daylighting in Adjoining Spaces to Atria
The areas adjoining atriums can be used for shops, offices or classrooms. In these
areas specific tasks are often performed which require stable, high quality, light
conditions. There are many factors that affect light levels in these areas including
atrium geometry, reflectivity, and glazing, and the geometry and the reflectivity and
glazing of the adjoining space.
Modification of Atrium Design to Improve Thermal and Daylighting Performance Review
25
The daylight factor in the adjoining spaces has been measured in two different ways.
One way was directly measuring the light level at several positions within the space
by using scale models. The other way was by relating the vertical daylight factor on
an atrium wall to the average daylight factor in the room using analytical equations.
Aizlewood (1996) used the second method of relating the vertical daylight factor on
the adjoining window to the average daylight factor in the adjoining space. This was
described as a very general analysis that could result in high values. Aizlewood
(1995) summarises the methods other authors had used including Lynes (1989) who
used the same method. Degelman (1988) used a combination of both methods.
Cartwright (1985), Cole (1990), Baker (1993) and Szerman (1992) used the direct
method. Kristl (1999) varied the acceptance of the light from the atrium well into the
adjoining space by using semi-individual light wells.
Matusiak (et al.) (1998) discussed the daylight penetration to adjoining spaces due to
variations in the glazing area and glazing type in scale model atriums under artificial
overcast skies. Equations were established to estimate the daylight factor in the
adjoining rooms. The measurements were taken on the vertical window wall and in
the adjoining rooms on several levels. The investigation was concerned with rooms
with plane depths of only 6 metres whereas other investigations were concerned with
adjoining rooms of up to twice that depth (Aizlewood (12m) 1997; Iyer-Raniga (9m)
1994; Szerman (5m) 1992). Therefore these results were difficult to compare with
other results.
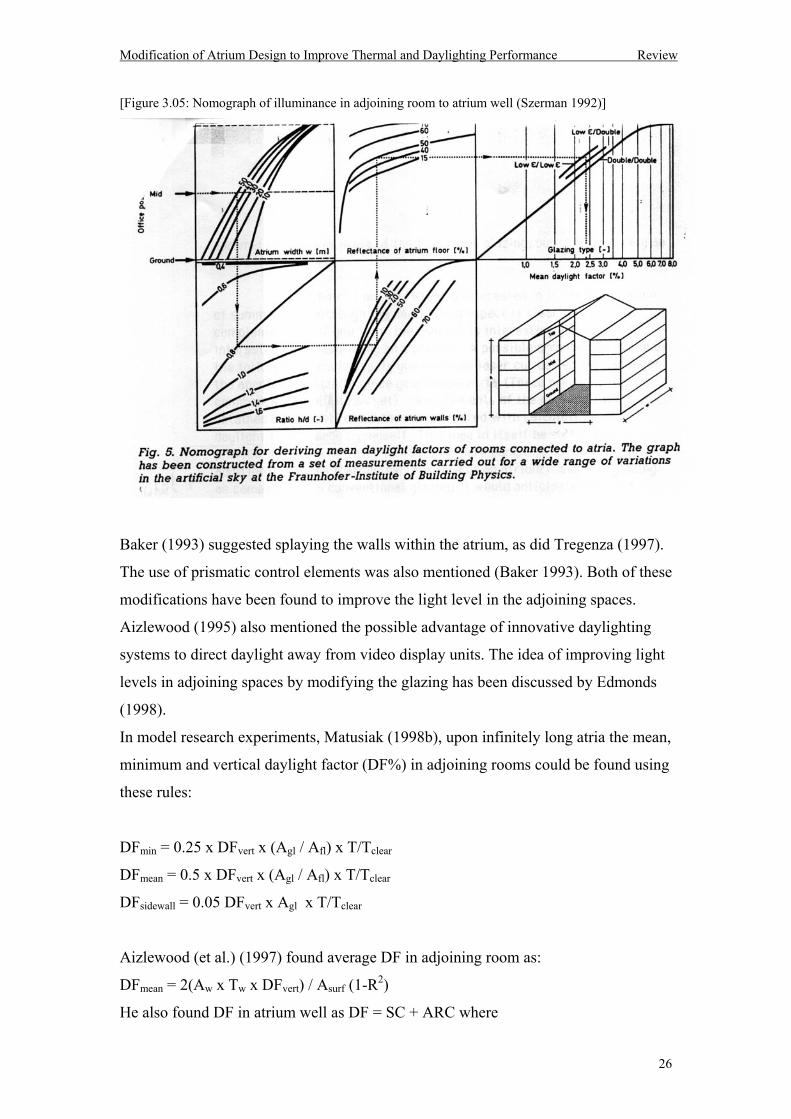
Szerman (1992) created a nomograph for deriving mean daylight factor in adjoining
rooms from atrium width, height to depth ratio, reflectance of wall and floor and
glazing types. This was based on artificial sky scale model experiments.
Modification of Atrium Design to Improve Thermal and Daylighting Performance Review
26
[Figure 3.05: Nomograph of illuminance in adjoining room to atrium well (Szerman 1992)]
Baker (1993) suggested splaying the walls within the atrium, as did Tregenza (1997).
The use of prismatic control elements was also mentioned (Baker 1993). Both of these
modifications have been found to improve the light level in the adjoining spaces.
Aizlewood (1995) also mentioned the possible advantage of innovative daylighting
systems to direct daylight away from video display units. The idea of improving light
levels in adjoining spaces by modifying the glazing has been discussed by Edmonds
(1998).
In model research experiments, Matusiak (1998b), upon infinitely long atria the mean,
minimum and vertical daylight factor (DF%) in adjoining rooms could be found using
these rules:
DFmin = 0.25 x DFvert x (Agl / Afl) x T/Tclear
DFmean = 0.5 x DFvert x (Agl / Afl) x T/Tclear
DFsidewall = 0.05 DFvert x Agl x T/Tclear
Aizlewood (et al.) (1997) found average DF in adjoining room as:
DFmean = 2(Aw x Tw x DFvert) / Asurf (1-R2)
He also found DF in atrium well as DF = SC + ARC where
Modification of Atrium Design to Improve Thermal and Daylighting Performance Review
27
SC = ( )100 1 37
47
2 3− −sin sinθ θ and
ARC = (100-SC) WA W
WRA R
R−
+−
+( ) sin1
73 4 θ
Generally the variables are:
A = area
T = transmission
R = reflectivity
DF = daylight factor
SC = sky component
ARC = atrium reflected component
W = width
3.4 Thermal Performance in Atria
Thermal stratification within atria is a new area of research. The importance related to
reducing the energy running costs of the building and to increase the human comfort
level. In an air conditioned atrium if thermal stratification exists then the mechanical
ventilation system has to do more work to produce a comfortable climate. More work
means more energy and therefore more money. In a naturally ventilated atrium where
the convection process means that the hot air rises and the cold air sinks, the hot air
also flows into the upper level adjoining spaces making them hot. If the thermal
stratification can be reduced then the comfort in the adjoining spaces will be
increased.
The main problem with thermal environment within atrium wells is the vertical height
over which the air is distributed. The temperature variation with respect to height in a
fluid is known as thermal stratification. This also gives rise to a non-uniform density
variation in the fluid (Juluria 1980).
Thermal stratification is a significant problem in tall atria style buildings due to the
large glazing area, large internal air volume, the convection process and the direct
solar radiation. The temperature differences between the lowest and highest points
could be as much as 7 degrees (Jones 1991).
Modification of Atrium Design to Improve Thermal and Daylighting Performance Review
28
Thermal stratification in atriums has mostly been investigated in cold climates where
direct solar radiation is beneficial because the temperature outside is often lower than
the inside temperature. In tropical climates direct solar gain is often avoided due to
the accompanying heat gain. This means that the atria design is not as popular in hot
countries. Atriums are still liked the world over for their aesthetic appearance and for
the ability to gather people together in a casual environment. In tropical areas,
diffusing glazing or shading under skylights and atrium roofs are often used to deflect
or reject the direct solar radiation. This makes these glazing systems more
comfortable but also has the effect of reducing the daylight penetration and therefore
the light level.
The theory of thermal stratification concentrates on heat transfer, natural convection
or zonal models (Juluria 1980, Allard 1998). Allard (1995) reviews thermal
stratification and heat transfer by zonal models including single zone models, multi-
zone models and pressure zonal models.
Research has been performed with computer simulations using zonal models (Wolring
1999; Kolsaker 1995) and computational fluid dynamics (Schild 1995, Noble 1998),
as well as some full scale monitoring (Jones 1991, Luther 1996). Computational fluid
dynamics is useful to predict the change in stratification due to changes in ventilation
but is generally time consuming. While ventilation does have a big impact on the
internal temperature, most commercial atriums are mechanically ventilated and
therefore the more ventilation needed the more energy used.
Two dimensional simulation programs such as Flow in an enclosed cavity by
Hijikata and Kotake (1993) are useful to understand how geometry and heated
surfaces affect natural convection in a tall narrow cavity
Both Moser (1996) and Luther (1996) use computational fluid dynamics for thermal
comfort analysis and commercial thermal building programs to estimate the energy
consumption. Such programs include DOE-2 and TRNSYS.
A paper by Gordon (1991) compared building measurements to computer simulations
for atriums at latitudes from Norway to Southern U.S. (only cold climate results were
presented). Cold climate investigations generally cover situations where the outside
Modification of Atrium Design to Improve Thermal and Daylighting Performance Review
29
temperature is less than the inside temperature and heating is required. This is not
applicable to the tropics where cooling energy loads are more significant than heating
energy loads.
Kolsaker and Frydenlund (1995) found a linear thermal stratification with respect to
height. This is unlike other literature, which found exponential thermal stratification
with respect to height. They used a case study of a building in Norway and the
computer simulation comparison used a single zone energy simulation program.
Full-scale thermal investigation data has been obtained for an actual atrium (Jones
1991, Luther 1996 and Nobel 1998). The presented data is seasonally specific and
shows thermal stratification and the destratification. Other data shows the prediction
of internal and external temperatures associated with the glazed skylight.
Luther in his paper discussed the positioning of his temperature sensors within the
atrium well along with the time interval between measuring points. This information
is useful in reproducing experimental results.
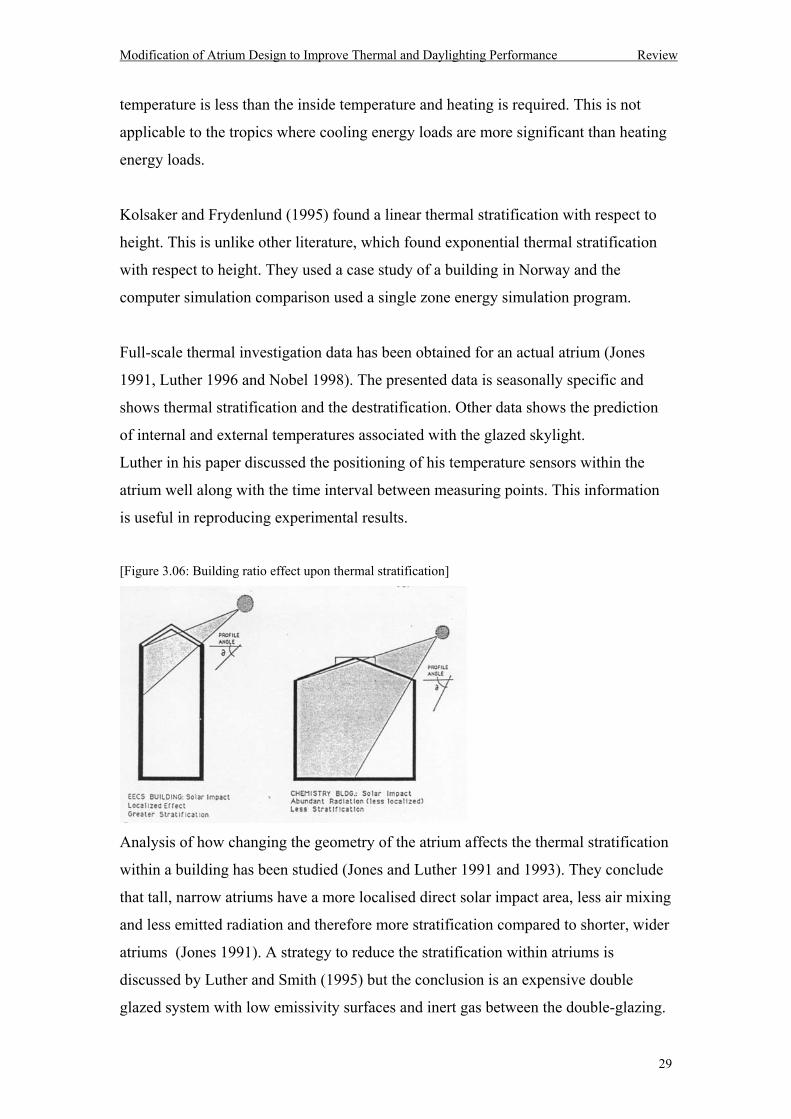
[Figure 3.06: Building ratio effect upon thermal stratification]
Analysis of how changing the geometry of the atrium affects the thermal stratification
within a building has been studied (Jones and Luther 1991 and 1993). They conclude
that tall, narrow atriums have a more localised direct solar impact area, less air mixing
and less emitted radiation and therefore more stratification compared to shorter, wider
atriums (Jones 1991). A strategy to reduce the stratification within atriums is
discussed by Luther and Smith (1995) but the conclusion is an expensive double
glazed system with low emissivity surfaces and inert gas between the double-glazing.
Modification of Atrium Design to Improve Thermal and Daylighting Performance Review
30
Other solutions include monitor skylights and retractable shading (Saxon 1983).
These solutions do not improve the use of low elevation light. Edmonds (1996)
discusses using angular selective glazing in skylights to improve daylighting and
suggests that they might reduce overheating when the sun is at high elevation.
Modifications to atria glazing to affect the thermal stratification gradient within the
system in the sub-tropical climates is the area of research in this investigation and an
area largely not researched to date.
3.5 Advanced Fenestration System
Advanced passive daylighting systems such as light shelves (Beltran 1994), light
pipes (Travers 1998, Ruck 1989), light guiding shades and skylights (Edmonds et al.
1998b) have been researched and improved but are still not commonly used in
building design.
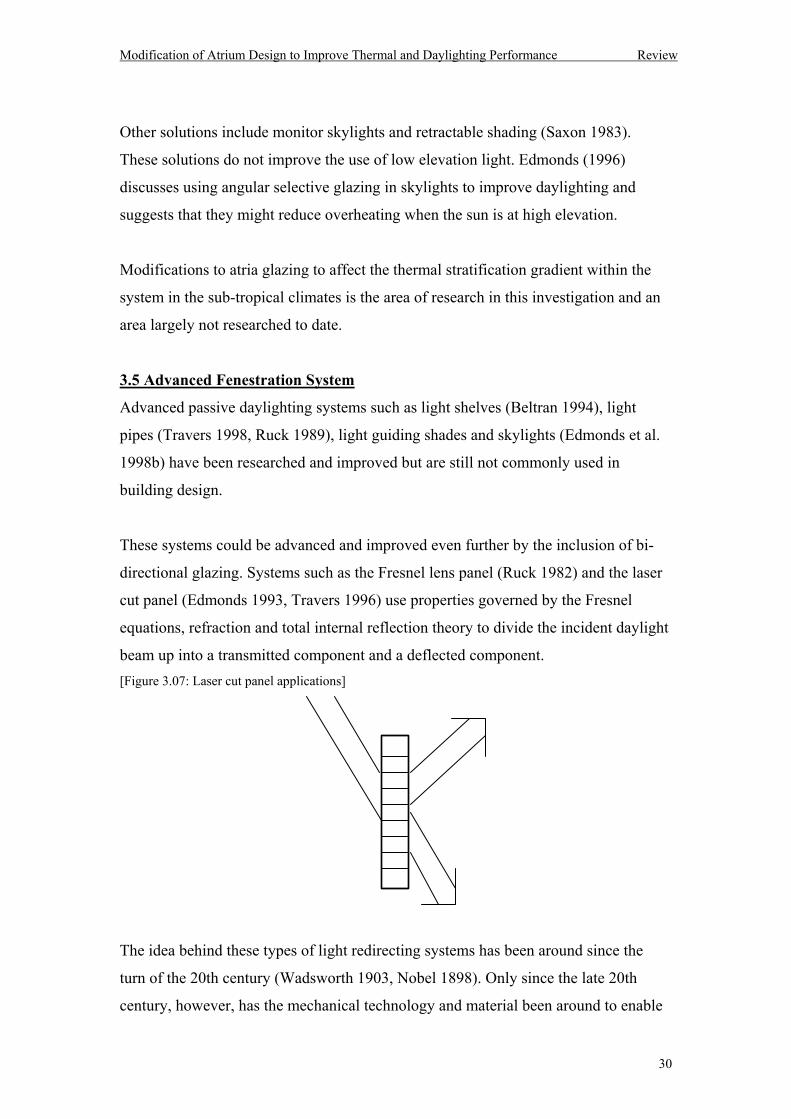
These systems could be advanced and improved even further by the inclusion of bi-
directional glazing. Systems such as the Fresnel lens panel (Ruck 1982) and the laser
cut panel (Edmonds 1993, Travers 1996) use properties governed by the Fresnel
equations, refraction and total internal reflection theory to divide the incident daylight
beam up into a transmitted component and a deflected component. [Figure 3.07: Laser cut panel applications]
The idea behind these types of light redirecting systems has been around since the
turn of the 20th century (Wadsworth 1903, Nobel 1898). Only since the late 20th
century, however, has the mechanical technology and material been around to enable
Modification of Atrium Design to Improve Thermal and Daylighting Performance Review
31
the economical manufacturing of these systems with the accuracy to obtain the
desired effect.
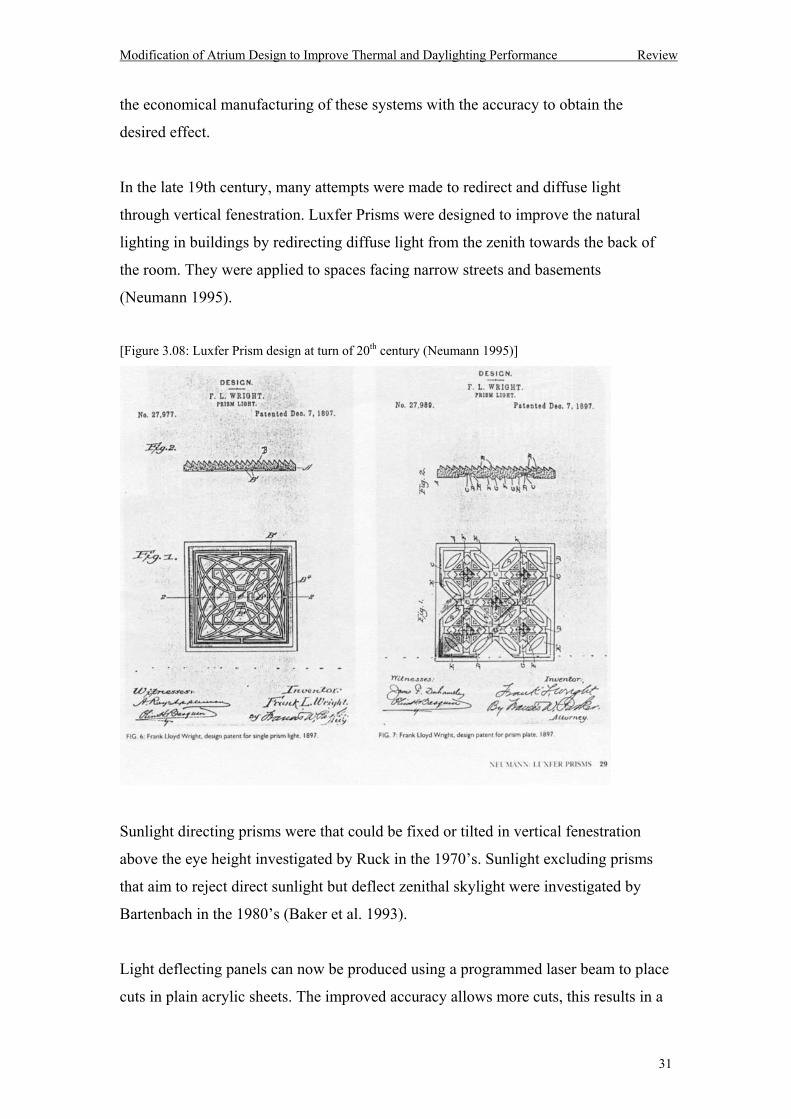
In the late 19th century, many attempts were made to redirect and diffuse light
through vertical fenestration. Luxfer Prisms were designed to improve the natural
lighting in buildings by redirecting diffuse light from the zenith towards the back of
the room. They were applied to spaces facing narrow streets and basements
(Neumann 1995).
[Figure 3.08: Luxfer Prism design at turn of 20th century (Neumann 1995)]
Sunlight directing prisms were that could be fixed or tilted in vertical fenestration
above the eye height investigated by Ruck in the 1970s. Sunlight excluding prisms
that aim to reject direct sunlight but deflect zenithal skylight were investigated by
Bartenbach in the 1980s (Baker et al. 1993).
Light deflecting panels can now be produced using a programmed laser beam to place
cuts in plain acrylic sheets. The improved accuracy allows more cuts, this results in a
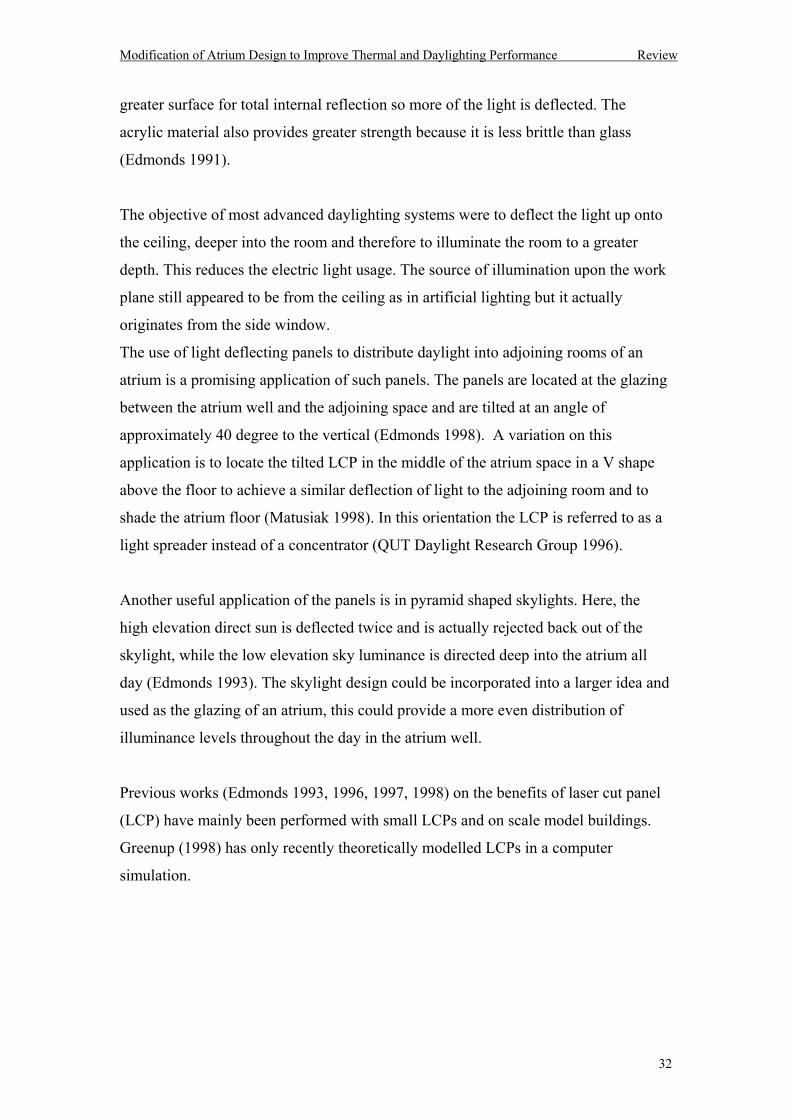
Modification of Atrium Design to Improve Thermal and Daylighting Performance Review
32
greater surface for total internal reflection so more of the light is deflected. The
acrylic material also provides greater strength because it is less brittle than glass
(Edmonds 1991).
The objective of most advanced daylighting systems were to deflect the light up onto
the ceiling, deeper into the room and therefore to illuminate the room to a greater
depth. This reduces the electric light usage. The source of illumination upon the work
plane still appeared to be from the ceiling as in artificial lighting but it actually
originates from the side window.
The use of light deflecting panels to distribute daylight into adjoining rooms of an
atrium is a promising application of such panels. The panels are located at the glazing
between the atrium well and the adjoining space and are tilted at an angle of
approximately 40 degree to the vertical (Edmonds 1998). A variation on this
application is to locate the tilted LCP in the middle of the atrium space in a V shape
above the floor to achieve a similar deflection of light to the adjoining room and to
shade the atrium floor (Matusiak 1998). In this orientation the LCP is referred to as a
light spreader instead of a concentrator (QUT Daylight Research Group 1996).
Another useful application of the panels is in pyramid shaped skylights. Here, the
high elevation direct sun is deflected twice and is actually rejected back out of the
skylight, while the low elevation sky luminance is directed deep into the atrium all
day (Edmonds 1993). The skylight design could be incorporated into a larger idea and
used as the glazing of an atrium, this could provide a more even distribution of
illuminance levels throughout the day in the atrium well.
Previous works (Edmonds 1993, 1996, 1997, 1998) on the benefits of laser cut panel
(LCP) have mainly been performed with small LCPs and on scale model buildings.
Greenup (1998) has only recently theoretically modelled LCPs in a computer
simulation.
Modification of Atrium Design to Improve Thermal and Daylighting Performance Review
33
3.6 Computer Prediction Simulations
Computer modelling offers the opportunity to compare and vary design parameters to
meet requirements of different site orientations with climatic conditions. A lengthy
computation time may still be faster than the alternative of building physical models
(Close 1996).
Simulations can also prove to be better because of the inability to monitor scale
models under real varying conditions for extended periods of time to account for all
the possible changes in climatic conditions.
Computer simulations rarely give absolute values, they are generally used as a
comparison tool to find the relative best design solution.
Simulation programs can simultaneously look at the best, worst and long term
climatic conditions to establish the relative best design. Whereas, monitoring under
real conditions can take at least 6 months to account for these conditions, if not
longer.
[Figure 3.09: Radiance generated picture of atrium]
Computer modelling of building performance has advanced considerably over the last
few decades. Robert Clear wrote the original daylighting program, called Quicklite 1,
on a programmable calculator at Lawrence Berkeley Laboratory in the 1970s.
Modification of Atrium Design to Improve Thermal and Daylighting Performance Review
34
Through the 1980s programs such as Microlite, CADLight, and Superlite were the
standards. In the late 1990s Radiance and Lightscape were the visually elite (Navvab
1989).
Computer ray tracing is one method to simulate the interaction between the daylight
sources and the building. Ray tracing began as very primitive algorithms written in
FORTRAN language in the 1970-80s, with little knowledge of the physical
principles just merely as a computer programming exercise (Reid 1989; Zeitler 1987).
They have now developed into highly advanced programs (eg., Radiance, and
Lightscape) which take almost everything into account. These programs provide
highly realistic visualisations but they take several months to learn how to use. It was
also difficult to obtain useful quantitative data from such programs. Radiance had
problems handling advanced daylighting systems such as complex bi-directional light
devices (eg., LCPs) and parabolic reflectors (eg., Light Guiding Shades). Both devices
of which are under development within the Daylighting Research Group at QUT.
It has been stated (Apian-Bennewitz 1998 and Greenup 1998) that the simulation of
some of these advanced daylighting systems and materials using Radiance has been
achieved but detailed analysis was not yet widely known.
The use of a geometrical framework to determine the intersection point of internal
surface reflections to find light levels within buildings was well set out by Tregenza
(1994). This method outlines the basis of the method used in this research. See the
theory in Chapter 5. Tegenza produced a forward radiosity computer program. This
process traces patches of light rays from the source to the working plane and the
accuracy is based upon the size of the patches. A different method for determining
light levels is a backward ray tracing method where rays are traced from the
measuring point on the work surface back to the source. This method was chosen in
this research.
Wright (1998) stated Ray tracing allows the designer to simulate building features
with a good degree of accuracy under a range of sky luminance distributions. Ray
tracing techniques only have a limited appeal. Programs are typically complex, not
user-friendly, and require comparatively powerful computers to run them. For
Modification of Atrium Design to Improve Thermal and Daylighting Performance Review
35
complex buildings, the time required for data input and the program running can be
prohibitive, particularly if the designer wishes to explore a series of possibilities.
The most widely accepted and used lighting simulation program to date is Radiance
(Ward 1999). Radiance uses both ray-trace and radiosity methods. Ray tracing is used
for the indirect component and zonal/radiosity is used for the direct component.
A review of the daylight penetration prediction computer programs show that they use
either zonal models or ray-tracing models. Zonal models calculate the contribution of
one patch of wall to all the other patches on all the other walls (Moore 1999).
Tracing rays can be performed either forwards (light source to surface) (Pearce 1998)
or backwards (work plane surface to light source) (Navvab 1989).
Thermal simulation programs such as Trnsys, GSL, Capsol, DOE2, Therm, Heat,
FRES and PHOENICS, fall into one of 2 types of programs. Either they use zonal
models similar to the daylight simulations mentioned previously or they use
computational fluid dynamics (CFD).
The zonal models either calculates the equivalent electrical energy used to maintain a
comfortable temperature within the system (GSL) or they equate the temperature
within the system using electrical circuit analogues (Trnsys, Capsol).
The most accurate but also the most computationally expensive method is CFD,
which uses the physical principles of fluid flow and the associated non-linear
conditions. This method can be used to predict the spread of contaminates like fire
and poisons or the temperature.
Validation of field data and simulated data is compared to some professional
simulation programs in Chapter 5 and 6.
3.7 Conclusion
Literature in this area is mostly based upon northern hemisphere buildings in cold
climates where solar gain is an important beneficial element in building design.
To obtain the full benefits from atriums in hot climates, modifications to the
traditional design are needed. Reduction of excessive solar gain and thermal
stratification while still reducing non-renewable energy usage (eg.. artificial lights,
mechanical ventilation) is needed.
Modification of Atrium Design to Improve Thermal and Daylighting Performance Review
36
The simulation of buildings both thermally and visually can best be performed today
on expensive computers software programs.
The recent nature of this research topic can be seen by the recent publication dates of
the literature reviewed.
This literature reviewed here contains some of the background within the general
research area investigated herein. More so I have taken ideas from all of these
different papers to build my own research area looking at modifying glazing in
tropical atria and looking at the lighting and thermal effects.
The construction of a large scale model atrium to investigate the daylight and thermal
penetration and the comparison of clear glazed to advanced glazed atrium is the basis
of this investigation and a logical extension of the work in the literature reviewed.
3.8 Background
The Daylighting Research Group was established as a part of the Centre for Medical
and Health Physics under the supervision of Dr Ian Edmonds.
The Centres research areas include:
-Design of optical systems to improve natural lighting of inside buildings
-Prediction of interior illumination at design stage based on computer simulation and
modelling studies
-Monitoring of illuminance levels within buildings
Previous research and publications by the author in similar area:
- Australian Window Council Inc.; (2000); Window Energy Rating Scheme 2;
unpublished.
-Mabb J.; (1999); Modification of atrium design to improve thermal performance;
Solar 99 Proceedings Case Studies; WA.
-Edmonds I., Close J., Lim W., Mabb J.; (1998); Daylighting Street Level Offices in
City Buildings with Light Deflecting Panels; Architectural Science Review Vol. 41,
p173-184.
-Edmonds I., Greenup P., Mabb J.; (1998); Performance of Advanced Daylighting
Systems; Solar 98 Proceedings.
-Mabb J.; (1997); Modification of atrium design to improve daylight penetration.
3rd year undergraduate project; unpublished.
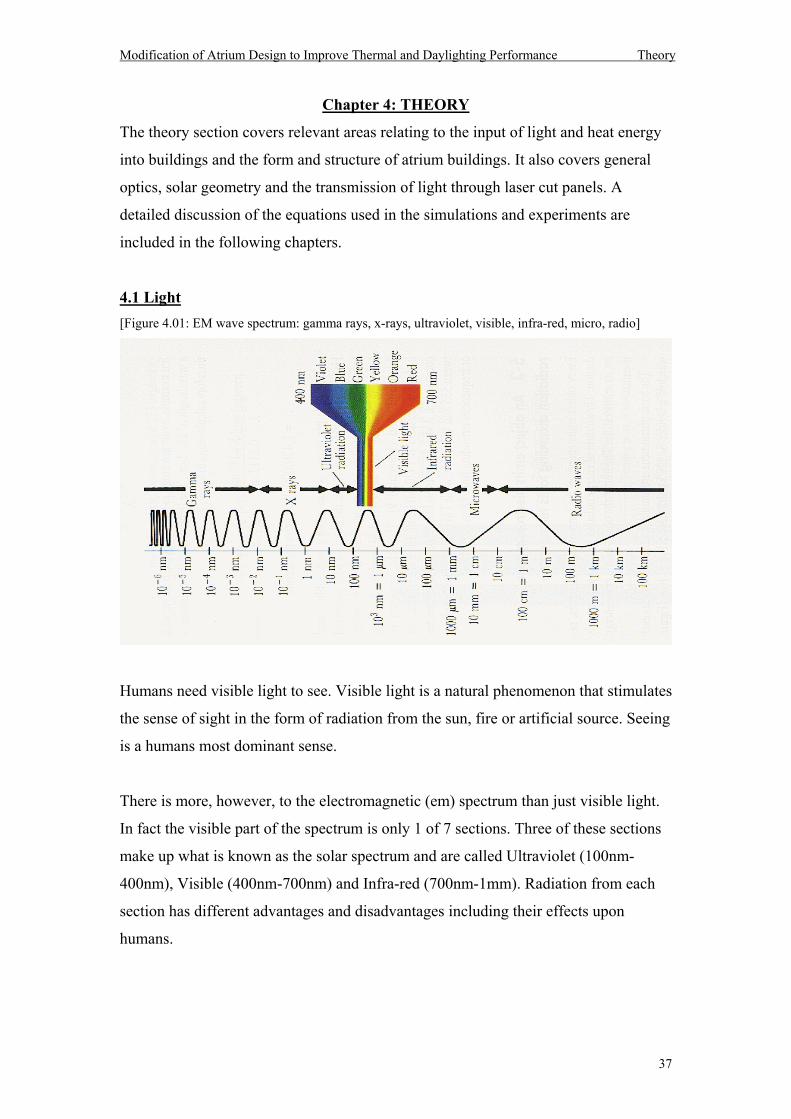
Modification of Atrium Design to Improve Thermal and Daylighting Performance Theory
37
Chapter 4: THEORY
The theory section covers relevant areas relating to the input of light and heat energy
into buildings and the form and structure of atrium buildings. It also covers general
optics, solar geometry and the transmission of light through laser cut panels. A
detailed discussion of the equations used in the simulations and experiments are
included in the following chapters.
4.1 Light [Figure 4.01: EM wave spectrum: gamma rays, x-rays, ultraviolet, visible, infra-red, micro, radio]
Humans need visible light to see. Visible light is a natural phenomenon that stimulates
the sense of sight in the form of radiation from the sun, fire or artificial source. Seeing
is a humans most dominant sense.
There is more, however, to the electromagnetic (em) spectrum than just visible light.
In fact the visible part of the spectrum is only 1 of 7 sections. Three of these sections
make up what is known as the solar spectrum and are called Ultraviolet (100nm-
400nm), Visible (400nm-700nm) and Infra-red (700nm-1mm). Radiation from each
section has different advantages and disadvantages including their effects upon
humans.
Modification of Atrium Design to Improve Thermal and Daylighting Performance Theory
38
The ultraviolet (UV) spectrum can be divided up into 3 areas known as UV-A (400-
300nm), UV-B (320-280nm) and UV-C (280-100nm). Most of the UV-C radiation is
absorbed by the ozone layer of the atmosphere. UV-B radiation is harmful and causes
skin cancer. UV-A radiation causes sun reddening. Clear glass reduces the amount of
transmission of UV-B radiation.
The visible spectrum can be divided into 6 main colour regions: violet (400-450nm),
blue (450-520), green (520-560), yellow (560-600), orange (600-625), red (625-
700nm). The sensitivity of our sight peaks at 555nm, which is in the middle of the
visible spectrum.
The infra-red spectrum also has a number of divisions including the near, medium and
far infra-red. This radiation spreads out over a large range of wavelengths from
700nm to 1mm. All objects reradiate heat energy in the infra-red range of the
spectrum. However, this part of the spectrum does not transmit through glass.
Therefore, once the radiation has entered an enclosed space through the glazing and
been absorbed and reradiated by the internal mass, it can not retransmit out through
the glazing again. This effect is known as the Greenhouse Effect due to its beneficial
effect upon growing plants in cold climates in buildings covered totally in glass.
(Purdue University 2000, www.purdue.edu/REM/RAD/uv.htm)
People need an adequate amount of light to perform any prescribed task. The more
precise the task, the more light is needed. The measurement of light level is based
upon the idea of a standard candle with known output.
Luminous energy (Q) is visually radiant energy travelling as electromagnetic waves.
The quantity of luminous energy flowing from a source is measured in lumen seconds
(lm-s). A solid angle (ω) is the ratio of the sphere surface area (A) enclosed to the
square of the radius (R). The unit is steradian (sr).
ω = 2RA Eq. 4.01
dω = 2RdA

Modification of Atrium Design to Improve Thermal and Daylighting Performance Theory
39
Luminous flux (Φ) is the time rate of flow of luminous energy. The lumen is the
amount of luminous flux per unit solid angle from a uniform source of 1 candle.
Φ = dtdQ Eq. 4.02
Luminous intensity (I) is the luminous flux per unit solid angle in a given direction.
I = ωddΦ Eq. 4.03
A candela is the unit of luminous intensity in a given direction of a source which
emits monochromatic radiation of frequency 540 x 1012 hertz and has a radiant
intensity in that direction of 1/683 watt per unit solid angle (Merriam-Webster 2001).
The brightness of any object in a particular direction in the field of view is known as
the luminance (L) of that object. Luminance can be defined as the luminous intensity
of a surface in a given direction (θ) per unit projected area (A) as viewed from that
direction. (Helms and Belcher, 1991)
dAd
L dω
Φ=
2
= dAdI Eq. 4.04
The luminance efficacy of a source is a measure of how efficient that source is in
producing visible light. It is the ratio of the light output to the total power input.
Sunlight is a very efficient source of light with an efficacy of 94.2 lm/W (IES 1995).
Light from the sun produces less heat for the same light output (lumens) than most
artificial sources. This compares to an incandescent lamp (17.5 lm/W) and a
fluorescent lamp (78.8 lm/W) (Helms 1991). When light falls upon a surface it
produces illumination. The measure of illuminance (E) is the luminous flux (Φ)
incident per unit surface area.
E = dAdΦ Eq. 4.05
The unit is the lumen/m2 or lux.
The minimum recommendations of illuminance level for specific tasks and interiors
are stated in the Australian Standards (AS 1680.2.0 - 1990).
Modification of Atrium Design to Improve Thermal and Daylighting Performance Theory
40
4.2 The Sky [Figure 4.02: The Sun]
Direct radiation comes from the sun which emits 63 MW of power per square metre
of its surface area (this is equivalent to approximately 6 thousand million lumens). It
takes the light from the sun just over 8 minutes to reach the Earth. Travelling in a
vacuum at 3 x 10⁸ m/s this equates to a distance of 150 million kilometres. This light
either reflects off, is absorbed by or refracts through our atmosphere (Steemers 1994).
The fraction that refracts through our atmosphere reaches the ground directly as
sunlight or is diffused by the atmosphere as skylight. The diffuse skylight is produced
by light that is scattered by particulates in the atmosphere. Due to the Rayleigh
scattering by air molecules, the red end of the visible spectrum with longer
wavelengths is scattered more and blue is scattered less so the sky appears blue. The
reduction in transparency of the atmosphere due to scattering of the solar radiation by
particulate matter is known as turbidity.
To calculate the amount of sunlight reaching the ground both the elliptical orbit of the
earth and the earths atmosphere have to be taken into account.
The extraterrestrial solar illuminance (Eext), corrected for the elliptical orbit by using
the day number of the year, known as the Julian date (Jd), is (IES 1995):
Eext = E Jdsc 1 0 034 2 2
365+ −
. * cos ( )π Eq. 4.06
Modification of Atrium Design to Improve Thermal and Daylighting Performance Theory
41
The solar illumination constant, (Esc), is equal to 128 Klux. The direct normal
illuminance, (Edn), corrected for the attenuating effects of the atmosphere is given by:
Edn = Eext . e-cm Eq. 4.07
Where c is the atmospheric extinction coefficient (clear=0.21, partly cloudy=0.8) and
m is the relative optical air mass.
The direct normal irradiance (Idn) can be found either theoretically or calculated from
the global and diffuse irradiance measured at the test site (see section 7.6.3). The
theoretical value is based upon the relative optical air mass (m) and the extraterrestrial
direct solar irradiance (Iext) which is the solar constant stated as 1350 W/m2
(IES, 1995).
Idn = 2I ext [e-0.65m + e-0.095m ] Eq. 4.08
The relative optical air mass varies with respect to the amount of particulate matter in
the sky. The particles can include gases, dust and aerosols. The representation of the
relative optical air mass (m) derived by Pirsel (1991), is
m = )cos(08.62616.1253))cos(08.626( 2 ZZ −+ Eq. 4.09
Where Z is the zenith angle of sun. This can be found in radians from equation 4.21
by subtracting π/2.
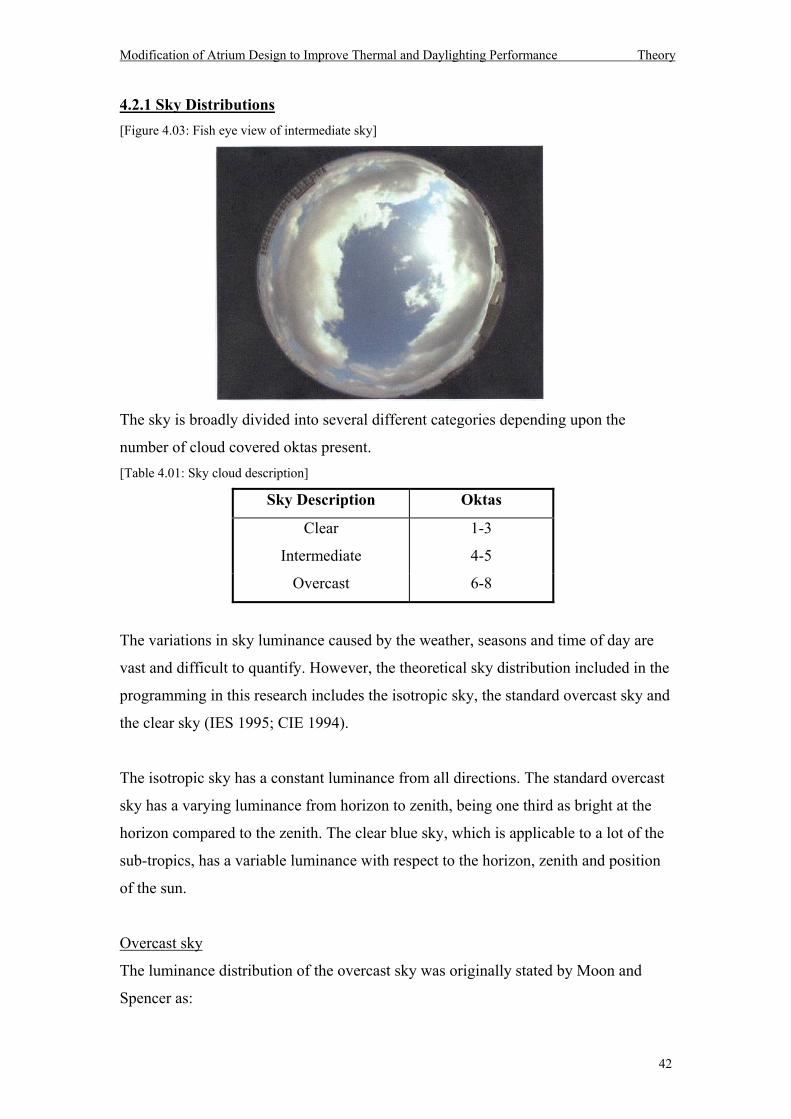
Modification of Atrium Design to Improve Thermal and Daylighting Performance Theory
42
4.2.1 Sky Distributions [Figure 4.03: Fish eye view of intermediate sky]
The sky is broadly divided into several different categories depending upon the
number of cloud covered oktas present. [Table 4.01: Sky cloud description]
Sky Description Oktas
Clear 1-3
Intermediate 4-5
Overcast 6-8
The variations in sky luminance caused by the weather, seasons and time of day are
vast and difficult to quantify. However, the theoretical sky distribution included in the
programming in this research includes the isotropic sky, the standard overcast sky and
the clear sky (IES 1995; CIE 1994).
The isotropic sky has a constant luminance from all directions. The standard overcast
sky has a varying luminance from horizon to zenith, being one third as bright at the
horizon compared to the zenith. The clear blue sky, which is applicable to a lot of the
sub-tropics, has a variable luminance with respect to the horizon, zenith and position
of the sun.
Overcast sky
The luminance distribution of the overcast sky was originally stated by Moon and
Spencer as:
Modification of Atrium Design to Improve Thermal and Daylighting Performance Theory
43
Lp = ( )θcos213
+Lz Eq. 4.10
Lp is the luminance at a point in a particular direction. θ is the zenith angle of the
point and Lz is the luminance in the zenith direction. This equation is equivalent to the
CIE standard overcast sky distribution.
The horizontal global illuminance (HGI) under overcast skies is usually about 20Klux
and from this the zenith luminance (Lz) can be found by using the equation:
Lz = ( )π7
9 HGI Eq. 4.11
This equation can be found from first principles by first finding the illuminance on a
horizontal surface produced by a differential element of sky (Helms 1991):
dEh = L cos θ dω
where L = Lz/3 (1+2 cosθ) for overcast sky
and dω = sin θ dθ dφ
dEh = [ Lz/3 (1+2 cosθ)] cos θ sin θ dθ dφ
This equation is then integrated over the whole sky.
dEh = ( )Ld dz
31 2
0
2
0
2
+
∫∫ cos( ) cos( ) sin( )
/
θ θ θ θ φππ
= L L d dz z
32
30
2
0
2
+
∫∫
cos( ) cos( ) sin( )/ θ θ θ θ φ
ππ
= L L d dz zcos( ) sin( ) cos( ) cos( ) sin( )/ θ θ θ θ θ θ φππ
32
30
2
0
2
+
∫∫
= +∫∫L d dz
32 2
0
2
0
2
cos( ) sin( ) sin( ) cos ( )/
θ θ θ θ θ φππ
2π = 10
2
dφπ
∫
= ( )23
2 2
0
2π θ θ θ θ θπL
dz sin( ) cos( ) cos ( ) sin( )/
+∫
The illuminance Eh can then be stated as:
Modification of Atrium Design to Improve Thermal and Daylighting Performance Theory
44
Eh = 23
12
23
2 2
0
2π θ θπLz sin ( ) cos ( )
/
−
The integral when evaluated from zenith to horizon simplifies to 7 / 6.
HGI = Eh = 2π Lz / 3 x 7/6 = 7/9 π Lz
The standard CIE overcast sky luminance distribution can also be stated as:
Lp =
−
−+ −
−
−
−
ee
eeLZ 52.0
cos/52.0
52.0
cos/52.0
1
1136.0864.0
ζζ
Eq. 4.12
Where ζ is the angle of the measuring point to the zenith in radians. The constants in
equation 4.12 for the overcast sky have been chosen to correspond with the original
empirical Moon-Spencer equation 4.10. The first term in equation 4.12 provides the
luminance contribution of the cloud layer and the second term provides the luminance
contribution of the atmosphere between the clouds and the ground (IES 1995).
A lot of daylight penetration research has been conducted in the northern hemisphere,
especially, in Europe, where the overcast sky is used as the standard for artificial
skies. The tropics, however, have on average more hours of sunshine (Aynsley and
Edmonds, 1997) and a higher solar elevation. The equations that simulate the sky
distribution are different at different locations due to latitude, altitude and turbidity
factors.
Clear Sky
The standard CIE clear sky luminance distribution (IES 1995) was developed by
Kittler and can be stated as:
Lp = )1)(cos45.01091.0(
)1)(cos45.01091.0(32.023
cos/32.023
eZeeeL Zz −++
−++−
−− ζγ γ Eq. 4.13
Where Z is zenithal sun angle and γ is the angle between the sun and sky point both in
radians.
The intensity of the sun patch can be modified within equation 4.13 to correspond
closer to the local sky conditions. The equation also includes the effect upon the
luminance as a result of polarisation at 90° from the sun.
Modification of Atrium Design to Improve Thermal and Daylighting Performance Theory
45
Clear blue skies are the most common sky distribution in the winter and spring
months in the tropics, therefore this sky distribution was included in this research.
(Aynsley and Edmonds 1997, BOM 2000)
Isotropic sky
An isotropic sky is a sky with the same luminance from every point on the sky. A
direct sun patch can also be included with appropriate luminance and positioned with
respect to the solar altitude and azimuth. The horizontal illuminance produced by a
sky of constant luminance is equal to π times the luminance (Lim et al. 1979). This
can be found by considering a hemisphere of uniform sky luminance. At an angle θ,
an elemental ring of width dθ around the hemisphere will have an area of:
A = 2πR2 cos θ dθ
If the luminance is L then the intensity can be found:
I = L.A
The illuminance according to the inverse square law is:
dE = I sin θ / R2
Therefore, by substituting in for I and then A:
dE = L. 2πR2 cos θ dθ / R2 dθ = 2π.L sin θ. cos θ dθ
Integrating to get the illuminance from the whole sphere gives:
E =π θ θ θπ
L d20
2sin .cos
/
∫
The illuminance Eh can then be stated as:
Eh = π L −
cos /22 0
2θ π
Eh = π L Eq. 4.14
This value can be obtained experimentally by measuring the HGI with the sun shaded.
These theoretical sky distributions were investigated and used within the computer
simulation programs described in Chapter 5.
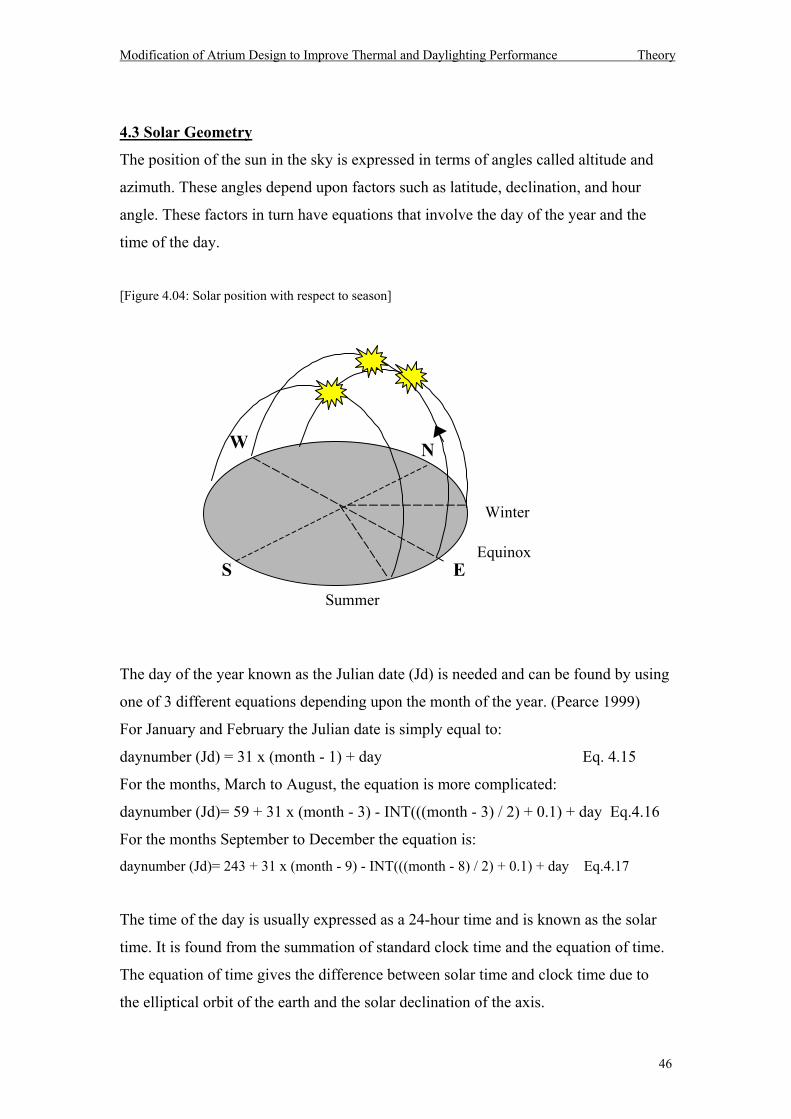
Modification of Atrium Design to Improve Thermal and Daylighting Performance Theory
46
4.3 Solar Geometry
The position of the sun in the sky is expressed in terms of angles called altitude and
azimuth. These angles depend upon factors such as latitude, declination, and hour
angle. These factors in turn have equations that involve the day of the year and the
time of the day.
[Figure 4.04: Solar position with respect to season]
The day of the year known as the Julian date (Jd) is needed and can be found by using
one of 3 different equations depending upon the month of the year. (Pearce 1999)
For January and February the Julian date is simply equal to:
daynumber (Jd) = 31 x (month - 1) + day Eq. 4.15
For the months, March to August, the equation is more complicated:
daynumber (Jd)= 59 + 31 x (month - 3) - INT(((month - 3) / 2) + 0.1) + day Eq.4.16
For the months September to December the equation is:
daynumber (Jd)= 243 + 31 x (month - 9) - INT(((month - 8) / 2) + 0.1) + day Eq.4.17
The time of the day is usually expressed as a 24-hour time and is known as the solar
time. It is found from the summation of standard clock time and the equation of time.
The equation of time gives the difference between solar time and clock time due to
the elliptical orbit of the earth and the solar declination of the axis.
NW
ES
Winter
Summer
Equinox
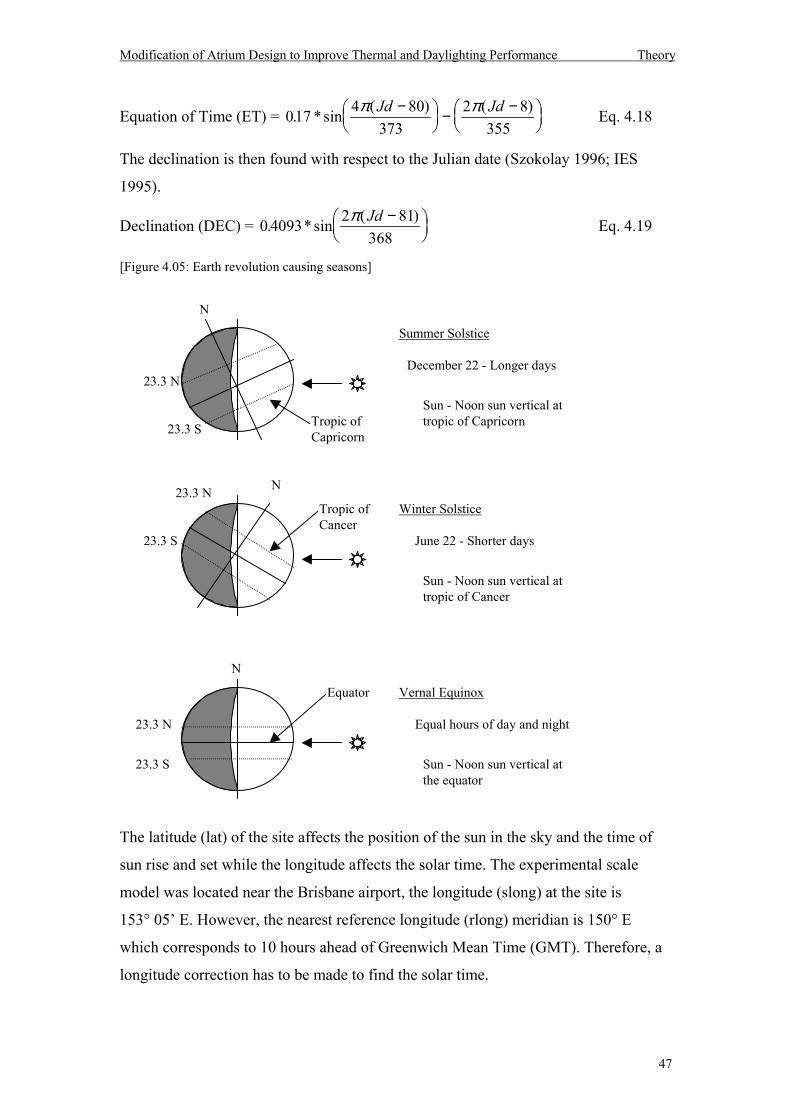
Modification of Atrium Design to Improve Thermal and Daylighting Performance Theory
47
Equation of Time (ET) = 017 4 80373
2 8355
. * sin ( ) ( )π πJd Jd−
− −
Eq. 4.18
The declination is then found with respect to the Julian date (Szokolay 1996; IES
1995).
Declination (DEC) = 0 4093 2 81368
. * sin ( )π Jd −
Eq. 4.19
[Figure 4.05: Earth revolution causing seasons]
The latitude (lat) of the site affects the position of the sun in the sky and the time of
sun rise and set while the longitude affects the solar time. The experimental scale
model was located near the Brisbane airport, the longitude (slong) at the site is
153° 05 E. However, the nearest reference longitude (rlong) meridian is 150° E
which corresponds to 10 hours ahead of Greenwich Mean Time (GMT). Therefore, a
longitude correction has to be made to find the solar time.
Equator
Tropic ofCapricorn
Tropic ofCancer
Summer Solstice
December 22 - Longer days
Sun - Noon sun vertical attropic of Capricorn
Winter Solstice
June 22 - Shorter days
Sun - Noon sun vertical attropic of Cancer
Vernal Equinox
Equal hours of day and night
Sun - Noon sun vertical atthe equator
N
N
N
23.3 N
23.3 S
23.3 N
23.3 N
23.3 S
23.3 S
Modification of Atrium Design to Improve Thermal and Daylighting Performance Theory
48
The correction in time from clock time to solar time is therefore:
Solar Time = Clock Time + ET + (slong - rlong)/15 Eq. 4.20
The hour angle (hra) is the angle of the sun away from maximum. The sun moves at
15° per hour so the hra = 15 x (Time - 12) in radians
From this the time of sunrise and sunset can be found:
Sunrise hour-angle (srh) = arcos [-tan (dec) * tan (lat)]
Sunrise time (srt) = 12 - (srh/15)
Sunset time (sst) = 12 + (srh/15)
These times are solar time.
Then the solar altitude (salt) and azimuth (sazi) can then be found in radians
(Szokolay 1996):
salt = arcsin [ sin(lat) x sin(dec) + cos(lat) x cos(dec) x cos(hra) ] Eq. 4.21
sazi = arccos[ cos(lat) x sin(dec) - cos(dec) x sin(lat) x cos(hra) / cos(salt) ] Eq. 4.22
The solar altitude is the angle of the sun above the ground. The solar zenith angle is
then found by subtracting π/2 from the solar altitude and is therefore the angle with
respect to the zenith. The solar azimuth is stated with respect to the North direction
where a negative azimuth would mean West of North and a positive azimuth is East
of North.
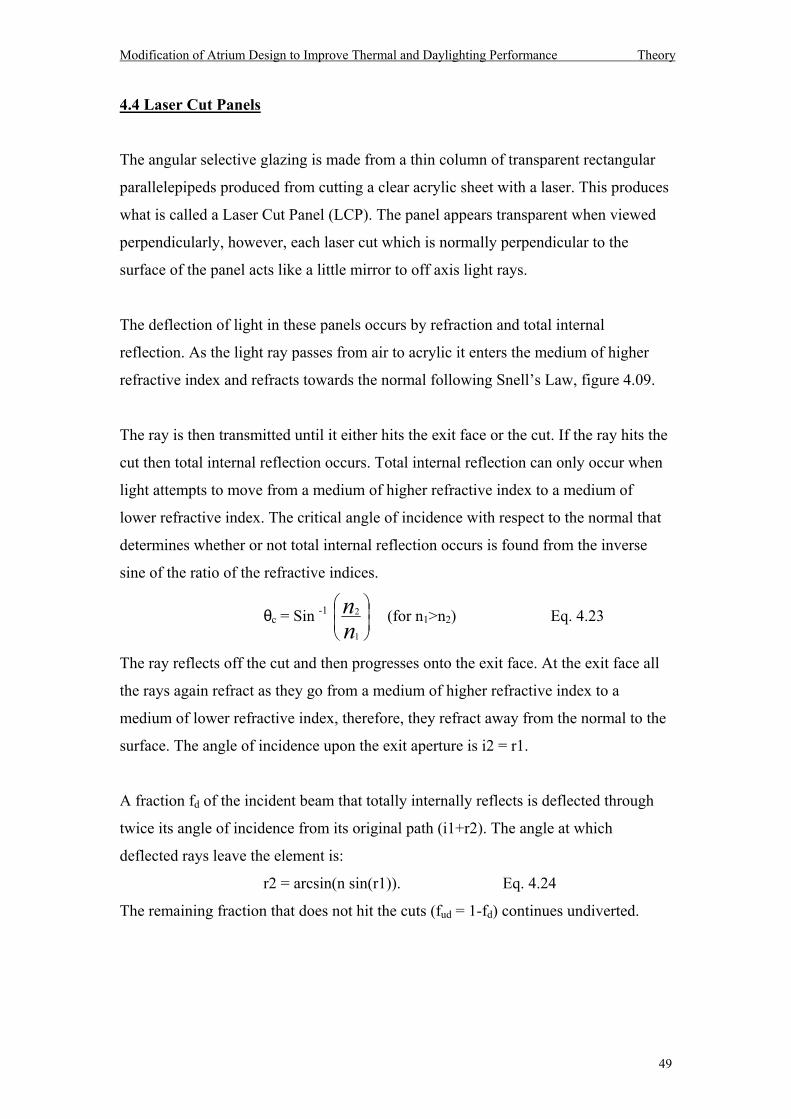
Modification of Atrium Design to Improve Thermal and Daylighting Performance Theory
49
4.4 Laser Cut Panels
The angular selective glazing is made from a thin column of transparent rectangular
parallelepipeds produced from cutting a clear acrylic sheet with a laser. This produces
what is called a Laser Cut Panel (LCP). The panel appears transparent when viewed
perpendicularly, however, each laser cut which is normally perpendicular to the
surface of the panel acts like a little mirror to off axis light rays.
The deflection of light in these panels occurs by refraction and total internal
reflection. As the light ray passes from air to acrylic it enters the medium of higher
refractive index and refracts towards the normal following Snells Law, figure 4.09.
The ray is then transmitted until it either hits the exit face or the cut. If the ray hits the
cut then total internal reflection occurs. Total internal reflection can only occur when
light attempts to move from a medium of higher refractive index to a medium of
lower refractive index. The critical angle of incidence with respect to the normal that
determines whether or not total internal reflection occurs is found from the inverse
sine of the ratio of the refractive indices.
θc = Sin -1
nn
1
2 (for n1>n2) Eq. 4.23
The ray reflects off the cut and then progresses onto the exit face. At the exit face all
the rays again refract as they go from a medium of higher refractive index to a
medium of lower refractive index, therefore, they refract away from the normal to the
surface. The angle of incidence upon the exit aperture is i2 = r1.
A fraction fd of the incident beam that totally internally reflects is deflected through
twice its angle of incidence from its original path (i1+r2). The angle at which
deflected rays leave the element is:
r2 = arcsin(n sin(r1)). Eq. 4.24
The remaining fraction that does not hit the cuts (fud = 1-fd) continues undiverted.
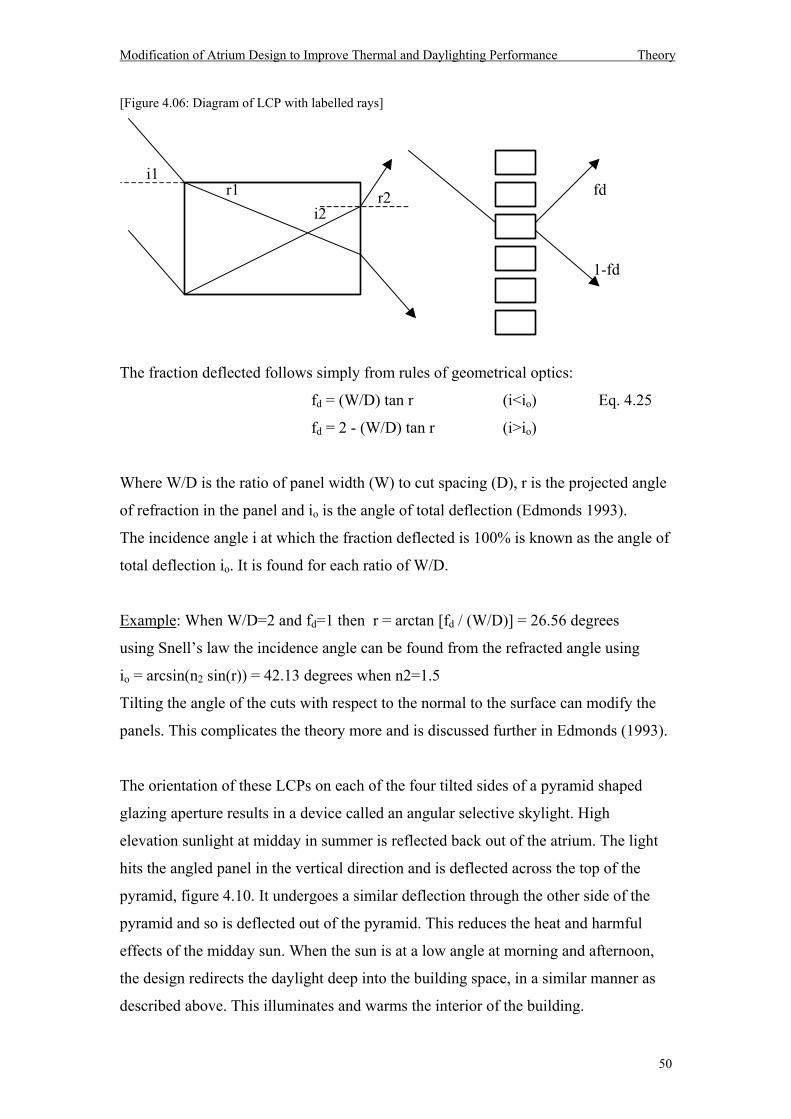
Modification of Atrium Design to Improve Thermal and Daylighting Performance Theory
50
[Figure 4.06: Diagram of LCP with labelled rays]
The fraction deflected follows simply from rules of geometrical optics:
fd = (W/D) tan r (i<io) Eq. 4.25
fd = 2 - (W/D) tan r (i>io)
Where W/D is the ratio of panel width (W) to cut spacing (D), r is the projected angle
of refraction in the panel and io is the angle of total deflection (Edmonds 1993).
The incidence angle i at which the fraction deflected is 100% is known as the angle of
total deflection io. It is found for each ratio of W/D.
Example: When W/D=2 and fd=1 then r = arctan [fd / (W/D)] = 26.56 degrees
using Snells law the incidence angle can be found from the refracted angle using
io = arcsin(n2 sin(r)) = 42.13 degrees when n2=1.5
Tilting the angle of the cuts with respect to the normal to the surface can modify the
panels. This complicates the theory more and is discussed further in Edmonds (1993).
The orientation of these LCPs on each of the four tilted sides of a pyramid shaped
glazing aperture results in a device called an angular selective skylight. High
elevation sunlight at midday in summer is reflected back out of the atrium. The light
hits the angled panel in the vertical direction and is deflected across the top of the
pyramid, figure 4.10. It undergoes a similar deflection through the other side of the
pyramid and so is deflected out of the pyramid. This reduces the heat and harmful
effects of the midday sun. When the sun is at a low angle at morning and afternoon,
the design redirects the daylight deep into the building space, in a similar manner as
described above. This illuminates and warms the interior of the building.
i1r1
i2r2 fd
1-fd
Modification of Atrium Design to Improve Thermal and Daylighting Performance Theory
51
The overall effect is a more even distribution of light over the day while still
eliminating the harmful midday sun rays. [Figure 4.07: Angular selective LCP skylight]
A major development within this research project was the inclusion of the LCPs
within a computer generated backward ray tracing program. The LCPs were included
in the glazing aperture of a normal side lit room and on top of an atrium well.
The incidence angle, refracted angle and the exit angle through the LCPs were
determined as well as the fraction deflected, fraction undeflected and the total
percentage transmitted. The light rays exit out of the LCPs in both the deflected and
undeflected directions simultaneously. The intensity of the two rays sum to the total
percentage transmitted.
In the room simulation, the laser cut glazing was tilted out to a maximum angle of 45°
from the vertical. The various tilts of the LCP effects the sky angle at which the
backward ray traced light ray is deflected towards.
In the atrium well simulation, the LCP is in a fixed tilted position. The deflected rays
mostly go towards the horizon resulting in lower luminance levels under overcast sky
conditions. There is not much difference in the algorithms between the LCP in the 2D
and 3D daylight simulation.
Reject high elevationdirect sunlight
Redirect lowelevation skylight
Less solar energy gain through out the middle of the day willresult in lower temperature and less thermal stratification
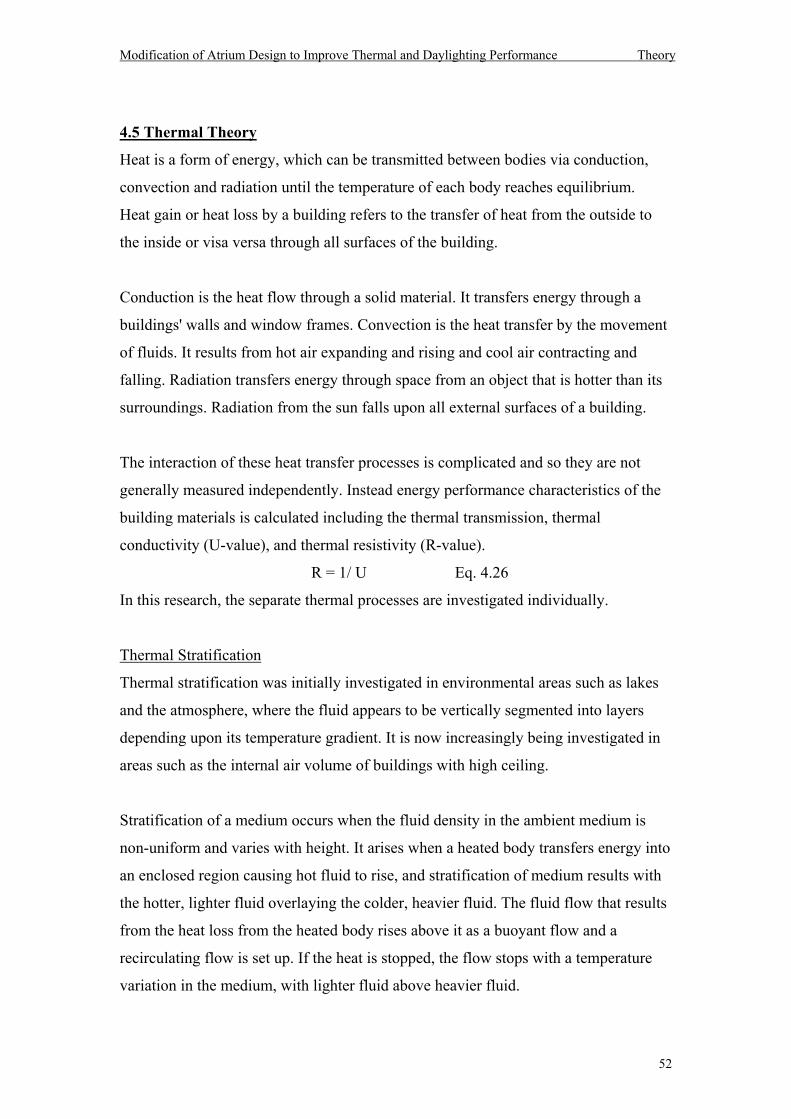
Modification of Atrium Design to Improve Thermal and Daylighting Performance Theory
52
4.5 Thermal Theory
Heat is a form of energy, which can be transmitted between bodies via conduction,
convection and radiation until the temperature of each body reaches equilibrium.
Heat gain or heat loss by a building refers to the transfer of heat from the outside to
the inside or visa versa through all surfaces of the building.
Conduction is the heat flow through a solid material. It transfers energy through a
buildings' walls and window frames. Convection is the heat transfer by the movement
of fluids. It results from hot air expanding and rising and cool air contracting and
falling. Radiation transfers energy through space from an object that is hotter than its
surroundings. Radiation from the sun falls upon all external surfaces of a building.
The interaction of these heat transfer processes is complicated and so they are not
generally measured independently. Instead energy performance characteristics of the
building materials is calculated including the thermal transmission, thermal
conductivity (U-value), and thermal resistivity (R-value).
R = 1/ U Eq. 4.26
In this research, the separate thermal processes are investigated individually.
Thermal Stratification
Thermal stratification was initially investigated in environmental areas such as lakes
and the atmosphere, where the fluid appears to be vertically segmented into layers
depending upon its temperature gradient. It is now increasingly being investigated in
areas such as the internal air volume of buildings with high ceiling.
Stratification of a medium occurs when the fluid density in the ambient medium is
non-uniform and varies with height. It arises when a heated body transfers energy into
an enclosed region causing hot fluid to rise, and stratification of medium results with
the hotter, lighter fluid overlaying the colder, heavier fluid. The fluid flow that results
from the heat loss from the heated body rises above it as a buoyant flow and a
recirculating flow is set up. If the heat is stopped, the flow stops with a temperature
variation in the medium, with lighter fluid above heavier fluid.
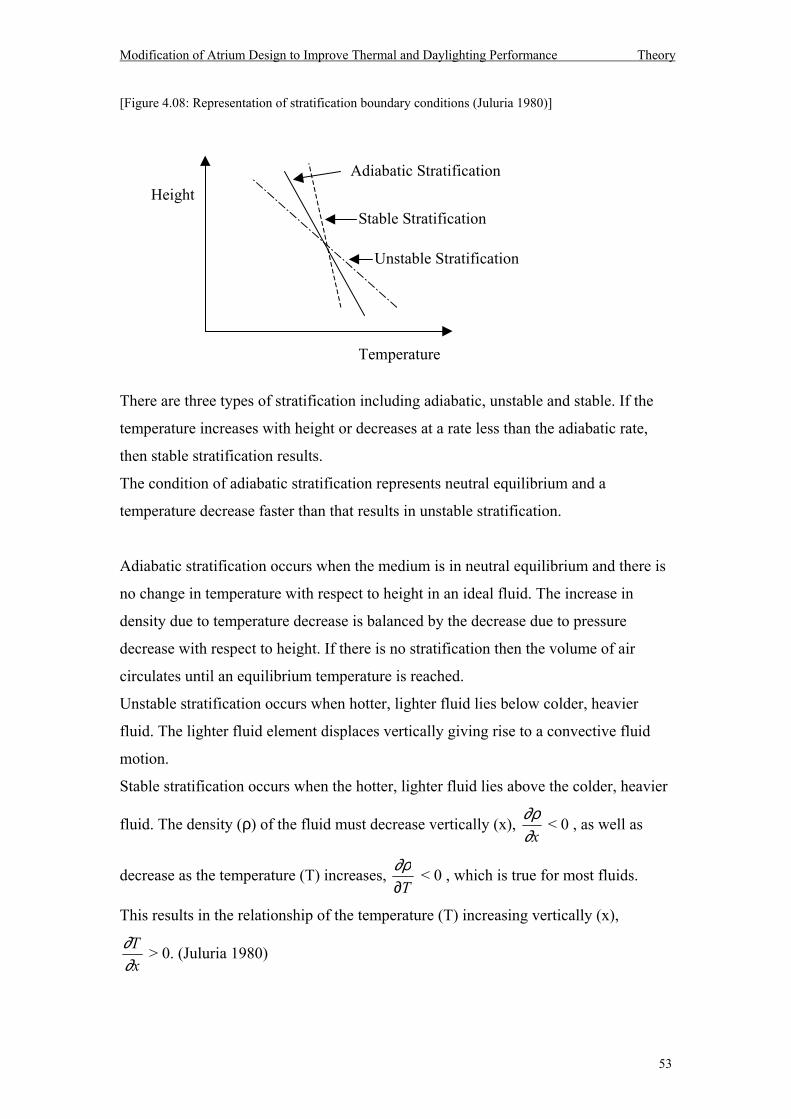
Modification of Atrium Design to Improve Thermal and Daylighting Performance Theory
53
[Figure 4.08: Representation of stratification boundary conditions (Juluria 1980)]
There are three types of stratification including adiabatic, unstable and stable. If the
temperature increases with height or decreases at a rate less than the adiabatic rate,
then stable stratification results.
The condition of adiabatic stratification represents neutral equilibrium and a
temperature decrease faster than that results in unstable stratification.
Adiabatic stratification occurs when the medium is in neutral equilibrium and there is
no change in temperature with respect to height in an ideal fluid. The increase in
density due to temperature decrease is balanced by the decrease due to pressure
decrease with respect to height. If there is no stratification then the volume of air
circulates until an equilibrium temperature is reached.
Unstable stratification occurs when hotter, lighter fluid lies below colder, heavier
fluid. The lighter fluid element displaces vertically giving rise to a convective fluid
motion.
Stable stratification occurs when the hotter, lighter fluid lies above the colder, heavier
fluid. The density (ρ) of the fluid must decrease vertically (x), ∂ρ∂x
< 0 , as well as
decrease as the temperature (T) increases, T∂
∂ρ < 0 , which is true for most fluids.
This results in the relationship of the temperature (T) increasing vertically (x),
xT
∂∂ > 0. (Juluria 1980)
Temperature
HeightAdiabatic Stratification
Stable Stratification
Unstable Stratification
Modification of Atrium Design to Improve Thermal and Daylighting Performance Theory
54
In the case of an atrium building where the heat radiates into the space from the direct
solar beam, the heat is absorbed by the internal walls and reradiates into the enclosed
space.
Due to the relatively large height of the enclosure the direct radiation usually does not
penetrate very deeply into the space. The upper section of the walls, frames and
sometimes glazing act as the heated bodies which lose energy in to the enclosed
space. However, this region is already at the top and so the hotter fluid can not rise
any further. No convective flow is set up even when more heat is added to the system.
Modification of Atrium Design to Improve Thermal and Daylighting Performance Simulation 1
55
Chapter 5: DAYLIGHT SIMULATION
5.1. Introduction
The daylight computer simulation programs have been created as part of this research
to predict the daylighting performance concerned with the various modifications of
three different building structures. These building structures include a room, a well
and an atrium with adjoining spaces. The modifications to these building structures
include the glazing, the dimensional ratios and the surface reflectivities.
The daylight simulations were initially produced as two dimensional geometrical
spaces. These were designed and developed as learning tools. Later the simulations
were updated to simulate three dimensional geometrical spaces.
Computer simulation programs are potentially much quicker than measurements made
on scale models due to the ease at which the programs can be modified to be
simulated with different climatic conditions, dimensions and fenestrations.
The simulations are potentially more accurate than empirical equations based upon
one off experiments because the simulations were mostly based upon first principle
physics. They were written from first principles because at the time of initialisation
complex bi-directional glazing such as the laser cut panels could not be simulated in
commercial lighting programs. The speed of computer processes now allow ray-
tracing techniques to be used and results achieved within a reasonable amount of time.
Due to the simplicity of the scale models in the experimental monitoring in this work,
simple simulations could be written to predicted light levels within these spaces.
Commercial lighting simulation programs were not found to be suitable for this
research because they were quite expensive and time consuming to learn, had
excessively large material libraries which were not needed while still not being able to
handle bi-directional glazing materials that did need to be simulated.
Two computer-programming languages were used in this research. BASIC was
initially used and within this environment the two dimensional daylight simulation
programs were constructed. The other program used was MATLAB, in which the
three dimensional daylight simulation programs and the thermal simulation programs
were completed.
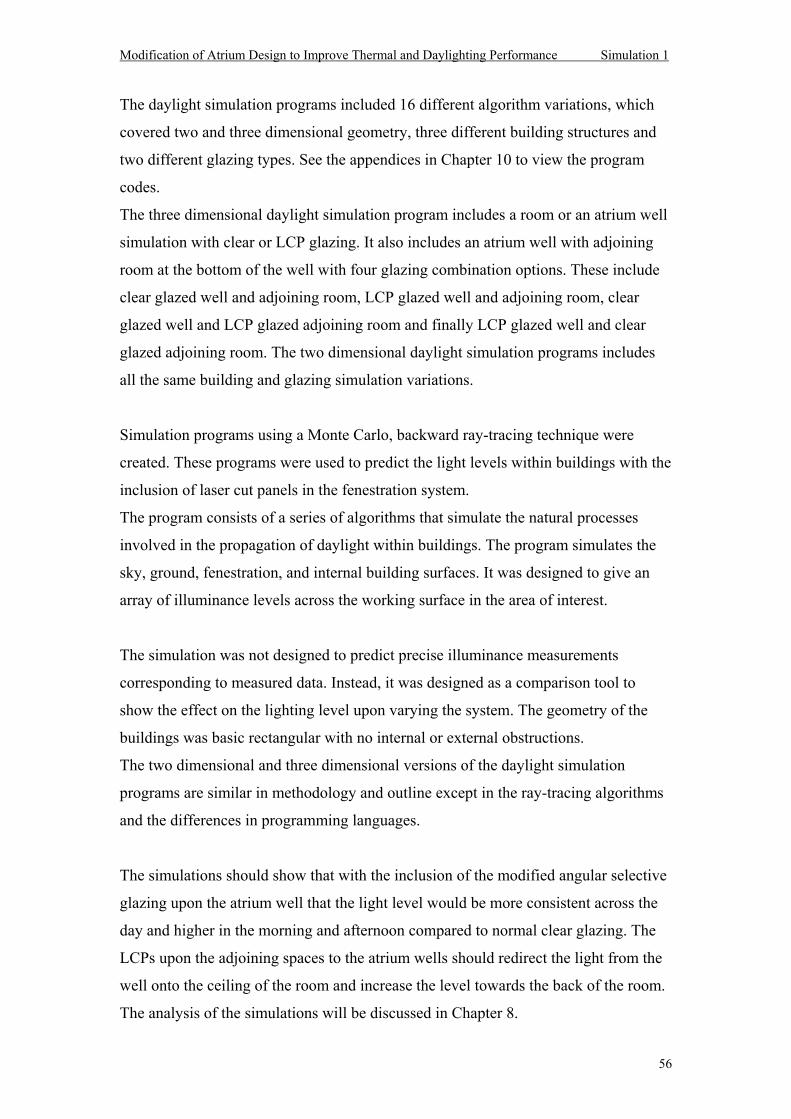
Modification of Atrium Design to Improve Thermal and Daylighting Performance Simulation 1
56
The daylight simulation programs included 16 different algorithm variations, which
covered two and three dimensional geometry, three different building structures and
two different glazing types. See the appendices in Chapter 10 to view the program
codes.
The three dimensional daylight simulation program includes a room or an atrium well
simulation with clear or LCP glazing. It also includes an atrium well with adjoining
room at the bottom of the well with four glazing combination options. These include
clear glazed well and adjoining room, LCP glazed well and adjoining room, clear
glazed well and LCP glazed adjoining room and finally LCP glazed well and clear
glazed adjoining room. The two dimensional daylight simulation programs includes
all the same building and glazing simulation variations.
Simulation programs using a Monte Carlo, backward ray-tracing technique were
created. These programs were used to predict the light levels within buildings with the
inclusion of laser cut panels in the fenestration system.
The program consists of a series of algorithms that simulate the natural processes
involved in the propagation of daylight within buildings. The program simulates the
sky, ground, fenestration, and internal building surfaces. It was designed to give an
array of illuminance levels across the working surface in the area of interest.
The simulation was not designed to predict precise illuminance measurements
corresponding to measured data. Instead, it was designed as a comparison tool to
show the effect on the lighting level upon varying the system. The geometry of the
buildings was basic rectangular with no internal or external obstructions.
The two dimensional and three dimensional versions of the daylight simulation
programs are similar in methodology and outline except in the ray-tracing algorithms
and the differences in programming languages.
The simulations should show that with the inclusion of the modified angular selective
glazing upon the atrium well that the light level would be more consistent across the
day and higher in the morning and afternoon compared to normal clear glazing. The
LCPs upon the adjoining spaces to the atrium wells should redirect the light from the
well onto the ceiling of the room and increase the level towards the back of the room.
The analysis of the simulations will be discussed in Chapter 8.
Modification of Atrium Design to Improve Thermal and Daylighting Performance Simulation 1
57
[Figure 5.01: 2D daylight simulation screen output of room with rays]
5.2 Computer Simulation Theory
The daylight penetration simulation program consists of a series of algorithms that
simulate the sky, building geometry, ground, window, surfaces within the building
and the progression of light through this environment. The equations are mostly based
upon previously published material and are explained in detail in Chapter 4 and
below. They can also be viewed in context in the program code appendices.
In these programs, the only light source simulated is the sky so the distribution of
light across it must be thoroughly described. The luminance of the sky for each ray
was evaluated using the equations set out in section 4.2.1 for overcast and
isotropic/direct sky distributions. The illuminance of each ray was evaluated using the
method described in section 5.2.1. The equations and methods were chosen because
of their simplicity to represent applicable sky distributions and summed illuminances
upon surfaces.
In the theoretical simulations of the overcast sky, the value of the horizontal global
illuminance (HGI) was obtained from field data. The zenith luminance (Lz) and the
luminance at any other point (Lp) was found from the HGI using the equations 4.10
and 4.11 respectfully.
Modification of Atrium Design to Improve Thermal and Daylighting Performance Simulation 1
58
The HGI was generally measured in the range between 20-50 Klux for overcast skies
depending upon cloud type and density. The Lz was also measured in the field in the
range between 8-20 Kcd/m2 for overcast skies.
The clear sky distribution was measured and found to have a horizontal global
illuminance between 60-110 Klux, an indirect sky luminance between 1000-5000
cd/m2 (25-120 lux) and the direct sun luminance between 70-110 Klux (3-7 x10⁶
cd/m2). See Chapter 7 for an explanation of how the sky distribution measurements
were recorded.
The constants that were used in the theoretical simulations for the isotropic/direct sky
distribution were Lsun = 4x10⁶ cd/m2 and Lsky = 3000 cd/m2.
5.2.1 Illuminance Algorithms in simulation
The luminance (L) of each light ray is found in the simulation programs using the
following method.
L = Lp * Average Intensity Product * Cosine Correction * Solid Angle Element Eq. 5.01
The luminance of point (Lp) in the sky as described above is found using the
particular sky distribution equation appropriate (4.10 or 4.13). This value is in candela
per square meter and may be high if it corresponds to the point where the sun is. It
might be low if it corresponds to the isotropic blue sky or it might depend upon
altitude as with the overcast sky.
The luminance (Lg) value given to a ray that has a negative exit altitude (to ground)
was determined by the incidence angle, the reflectivity (ref) of the ground and the
horizontal global illuminance.
Lg = HGI * ref * sin (i) Eq. 5.02
The Average Intensity Product (AIP) in equation 5.01 takes into account the reduction
in intensity of each individual ray (IP) due to multiple reflections (ref) and
transmission (τ) through glazing from the measuring point to the sky.
AIP = IP * ref * τ Eq. 5.03
Modification of Atrium Design to Improve Thermal and Daylighting Performance Simulation 1
59
The Cosine Correction in equation 5.01 accounts for the angle at which the light ray
hits the measuring point. The greater the angle from the normal the more reduced is
the intensity following a cosine function.
The Solid Angle Element (dω) in equation 5.01 is a fraction of the hemispherical sky
divided up into as many segments (k) as stated.
dω = 2π sin (θ) dθ Eq. 5.04
Where dθ = π / k Eq. 5.05
The illuminance (E) was then found by:
dEi = Li (θ).dωi (θ) i = 1k Eq. 5.06
Where i is the sky segment counter
∑k
1dEi = ∑
k
1Li dωi Eq. 5.07
n = jk
1∑ p Eq. 5.08
Where n is the total number of rays in all sky segments.
J is the number of rays in each sky segment and p is the ray counter.
dEi (θ) = ∑k
1dE / jp Eq. 5.09
All the individual segmented illuminances are summed together to find the horizontal
illuminance (E) at the measuring point for between 1000 to 10000 rays.
The luminance of each ray that goes to a sky sector is summed. Then after all the rays
are traced, each sectors summed luminance is averaged and the sum of all the sectors
gives an illuminance level from the whole hemisphere.
E = ∑k
idE1
)(θ Eq. 5.10
The two dimensional daylight simulation program used a similar method to that
outlined in the above equations. The sky luminance distributions for isotropic/direct
(4.14), clear (4.13) and overcast (4.10)* were all modified for the two dimensional
sky view and included in the program.
Modification of Atrium Design to Improve Thermal and Daylighting Performance Simulation 1
60
The main difference between the two and three dimensional daylight simulation
programs was the number of angular segments the sky was divided up into. In the
three dimensional simulation, the hemispherical sky covered a solid angle of 2π
steradians. In the two dimensional simulation, however, the semicircular sky only
covered an angle of π radians. The greater view of the sky in the three dimensional
simulation meant a greater number of sky segments. However, the number was
limited by the array limit in the programming language.
5.2.2 Optics and Geometrical Ray Tracing
When a ray intersects with the boundary of another transparent medium part of the ray
is reflected and part is transmitted. The transmitted fraction is bent at the boundary. If
the ray enters a medium of greater density, then the ray is bent towards the normal to
the surface. If the ray enters a medium of lesser density, then the ray is bent away
from the normal. This is known as Snells law and can be stated as:
n1 sin θ1 = n2 sin θ2 Eq. 5.11
Where the n1 and n2 are the refractive indices of the two media. For example a light
ray travelling from air to glass would have n1=1 and n2=1.5.
Rearrangement of the equation can give the angle of refraction:
θ2 = arcsin (n1/n2 sin θ1) Eq. 5.12
For off axis incident rays a generalised form of Snells law for projection onto the
transverse plane can be found (Szokolay 1996; Whitehead 1992).
θ1 = arccos (sin (alt). sin (tit) + cos (alt). cos (tit). cos (hsa)) Eq. 5.13
Where θ1 is the angle of incidence of off axis incident ray
alt = the altitude of incidence ray
tit = the tilt angle of receiving plane from vertical
hsa = the horizontal shadow angle = azimuth difference between ray and plane
Modification of Atrium Design to Improve Thermal and Daylighting Performance Simulation 1
61
Once the angle of incidence is found then the effective refractive index can be found.
Whitehead (1992) provided a useful alternative way of finding the effective refractive
index of off axis rays transmitting through an optical system. This equation was used
within the three dimensional daylight penetration program upon the light rays as they
exited the room through the glazing.
n` = sqrt( n22 - n1
2.sin2(θ1)) Eq. 5.14
Where n is the effective refractive index.
The refractive index of a medium is the ratio of the wavelength of light in that
medium with respect to that in a vacuum. Crown glass has a refractive index of 1.523
where as acrylic has a refractive index of 1.5. A vacuum has a refractive index of 1
and air has a refractive index of 1.0003.
5.2.3 Ray Trace Algorithm in 2D Simulation
The method used to find the interception points within the two dimensional daylight
penetration simulation program was based upon a simple random number generation.
This gave the angle of the ray with respect to the wall, and basic trigonometry was
used to find the point along the wall at which the ray intercepts.
An angle is selected using a standard Monte Carlo random number generator:
angle = INT((max angle min angle + 1) * RND + min angle) Eq. 5.15
The angles are chosen between 1 and 179 degrees.
The random number (RND) is automatically selected within the range from 0 to 1 and
scaled up to the boundaries of the acceptable angles. The ray is directed away from
the current wall.
The slope of this ray is determined by using the standard formula:
slope = y yx x2 12 1
−−
= TAN (angle) Eq. 5.16
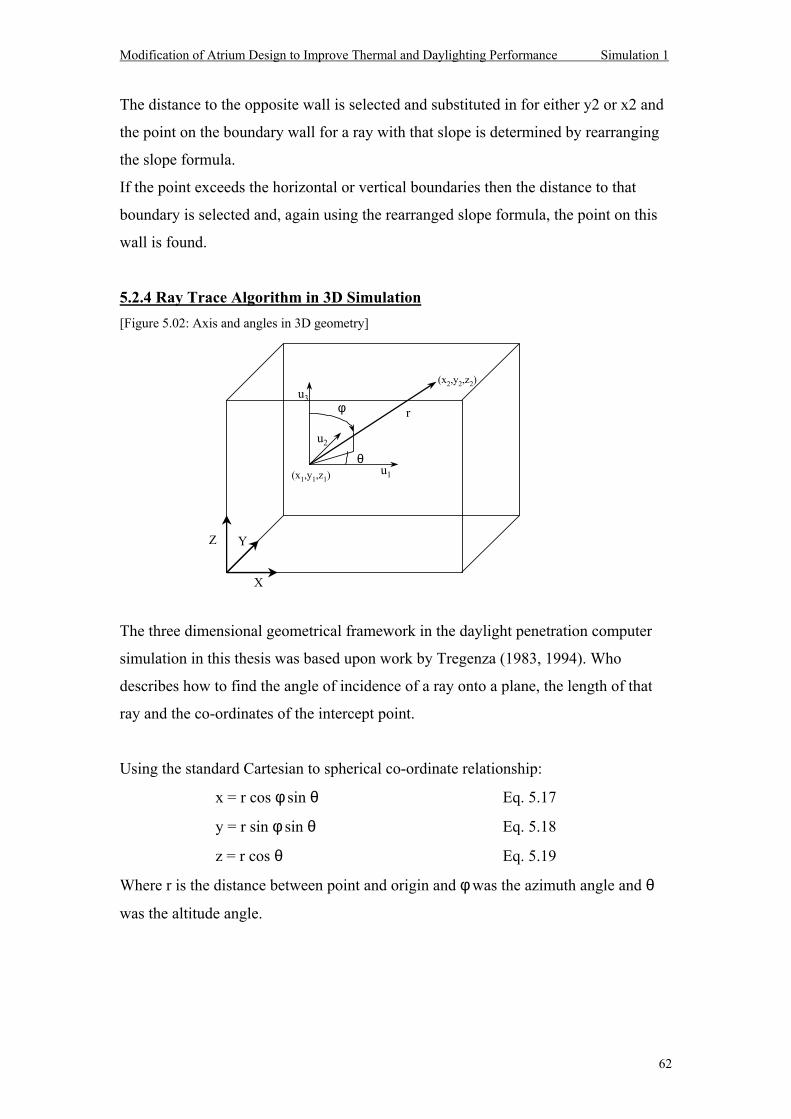
Modification of Atrium Design to Improve Thermal and Daylighting Performance Simulation 1
62
The distance to the opposite wall is selected and substituted in for either y2 or x2 and
the point on the boundary wall for a ray with that slope is determined by rearranging
the slope formula.
If the point exceeds the horizontal or vertical boundaries then the distance to that
boundary is selected and, again using the rearranged slope formula, the point on this
wall is found.
5.2.4 Ray Trace Algorithm in 3D Simulation [Figure 5.02: Axis and angles in 3D geometry]
The three dimensional geometrical framework in the daylight penetration computer
simulation in this thesis was based upon work by Tregenza (1983, 1994). Who
describes how to find the angle of incidence of a ray onto a plane, the length of that
ray and the co-ordinates of the intercept point.
Using the standard Cartesian to spherical co-ordinate relationship:
x = r cos φ sin θ Eq. 5.17
y = r sin φ sin θ Eq. 5.18
z = r cos θ Eq. 5.19
Where r is the distance between point and origin and φ was the azimuth angle and θ
was the altitude angle.
X
YZ
(x1,y1,z1)
(x2,y2,z2)
φ
θ
ru3
u1
u2
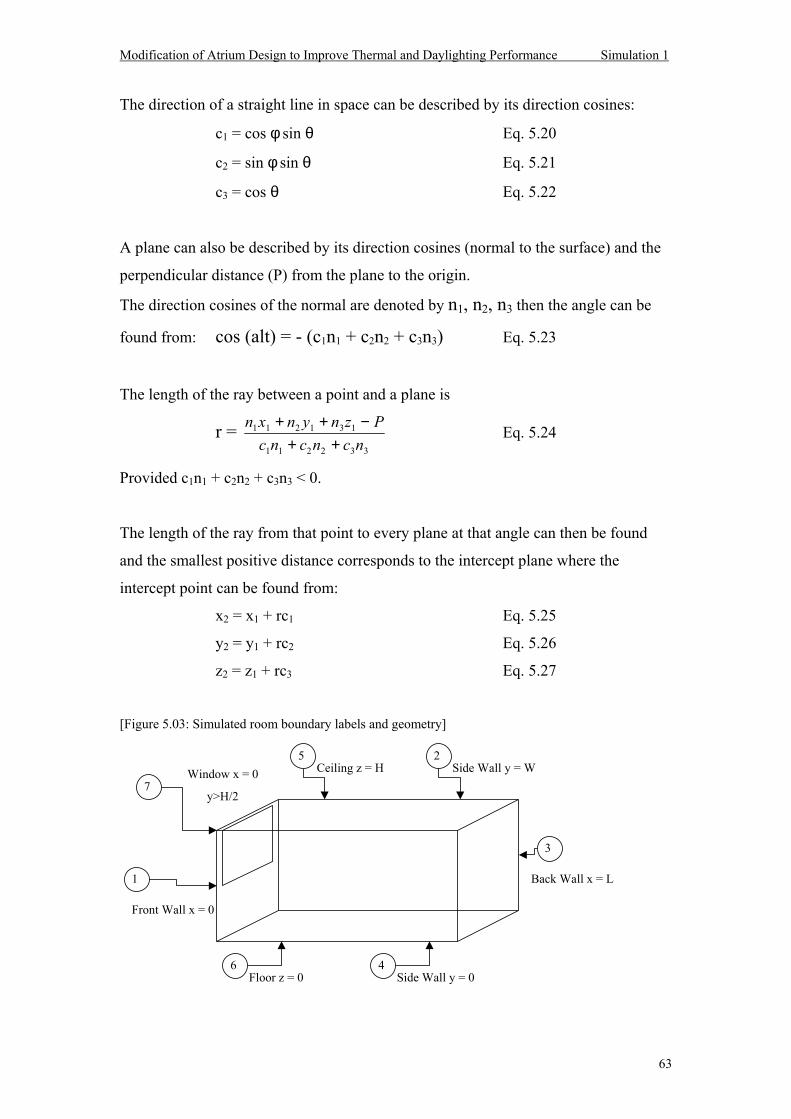
Modification of Atrium Design to Improve Thermal and Daylighting Performance Simulation 1
63
The direction of a straight line in space can be described by its direction cosines:
c1 = cos φ sin θ Eq. 5.20
c2 = sin φ sin θ Eq. 5.21
c3 = cos θ Eq. 5.22
A plane can also be described by its direction cosines (normal to the surface) and the
perpendicular distance (P) from the plane to the origin.
The direction cosines of the normal are denoted by n1, n2, n3 then the angle can be
found from: cos (alt) = - (c1n1 + c2n2 + c3n3) Eq. 5.23
The length of the ray between a point and a plane is
r = n x n y n z Pc n c n c n
1 1 2 1 3 1
1 1 2 2 3 3
+ + −+ +
Eq. 5.24
Provided c1n1 + c2n2 + c3n3 < 0.
The length of the ray from that point to every plane at that angle can then be found
and the smallest positive distance corresponds to the intercept plane where the
intercept point can be found from:
x2 = x1 + rc1 Eq. 5.25
y2 = y1 + rc2 Eq. 5.26
z2 = z1 + rc3 Eq. 5.27
[Figure 5.03: Simulated room boundary labels and geometry]
6Floor z = 0
5Ceiling z = H
7Window x = 0
y>H/2
1
Front Wall x = 0
3
Back Wall x = L
4Side Wall y = 0
2Side Wall y = W
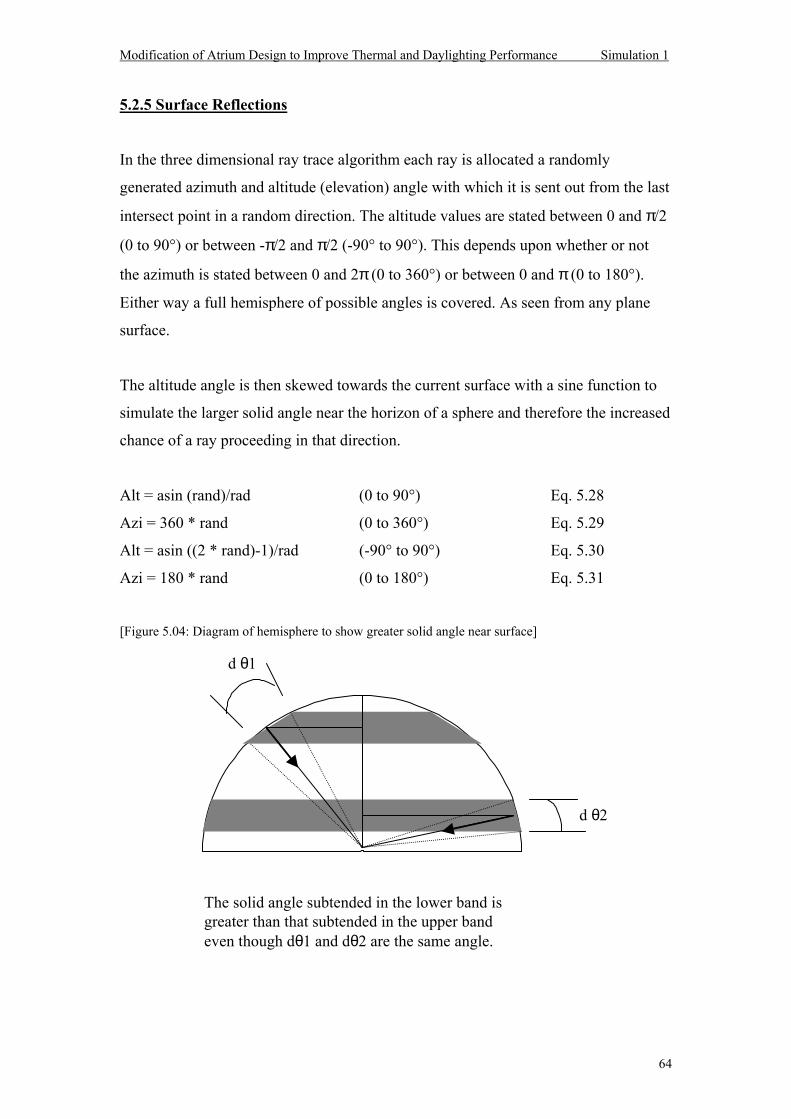
Modification of Atrium Design to Improve Thermal and Daylighting Performance Simulation 1
64
5.2.5 Surface Reflections
In the three dimensional ray trace algorithm each ray is allocated a randomly
generated azimuth and altitude (elevation) angle with which it is sent out from the last
intersect point in a random direction. The altitude values are stated between 0 and π/2
(0 to 90°) or between -π/2 and π/2 (-90° to 90°). This depends upon whether or not
the azimuth is stated between 0 and 2π (0 to 360°) or between 0 and π (0 to 180°).
Either way a full hemisphere of possible angles is covered. As seen from any plane
surface.
The altitude angle is then skewed towards the current surface with a sine function to
simulate the larger solid angle near the horizon of a sphere and therefore the increased
chance of a ray proceeding in that direction.
Alt = asin (rand)/rad (0 to 90°) Eq. 5.28
Azi = 360 * rand (0 to 360°) Eq. 5.29
Alt = asin ((2 * rand)-1)/rad (-90° to 90°) Eq. 5.30
Azi = 180 * rand (0 to 180°) Eq. 5.31
[Figure 5.04: Diagram of hemisphere to show greater solid angle near surface]
d θ1
d θ2
The solid angle subtended in the lower band isgreater than that subtended in the upper bandeven though dθ1 and dθ2 are the same angle.
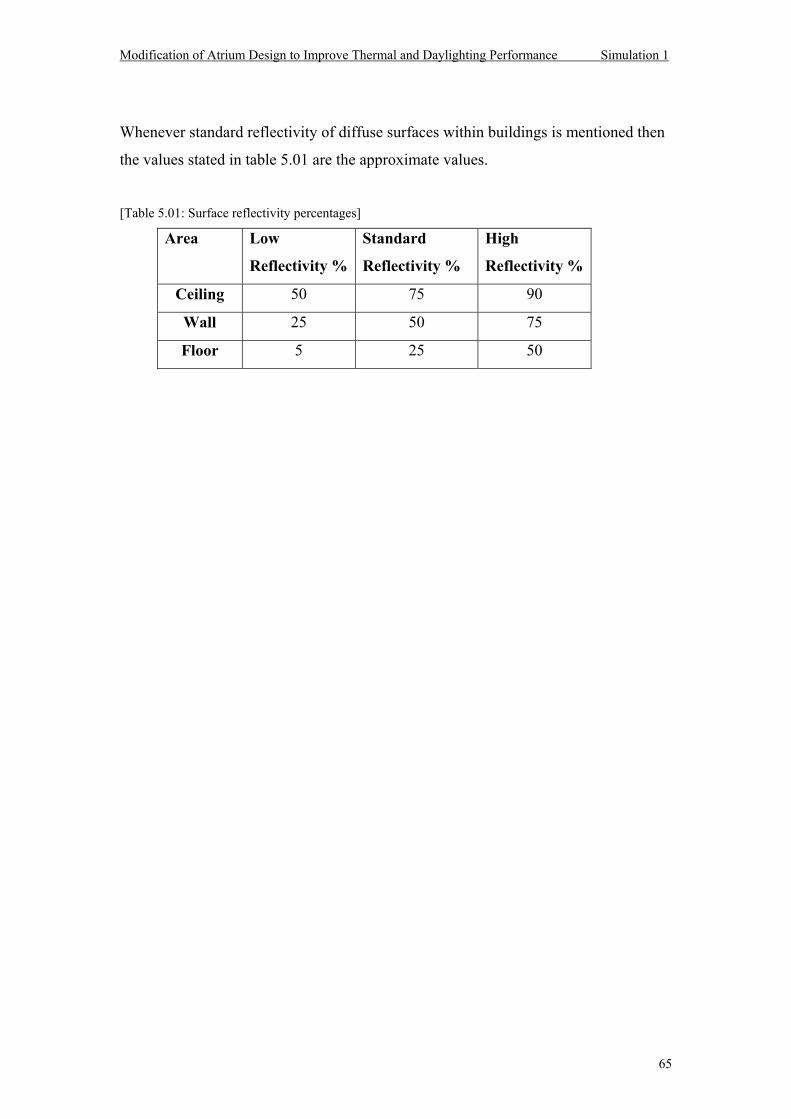
Modification of Atrium Design to Improve Thermal and Daylighting Performance Simulation 1
65
Whenever standard reflectivity of diffuse surfaces within buildings is mentioned then
the values stated in table 5.01 are the approximate values.
[Table 5.01: Surface reflectivity percentages]
Area Low
Reflectivity %
Standard
Reflectivity %
High
Reflectivity %
Ceiling 50 75 90
Wall 25 50 75
Floor 5 25 50
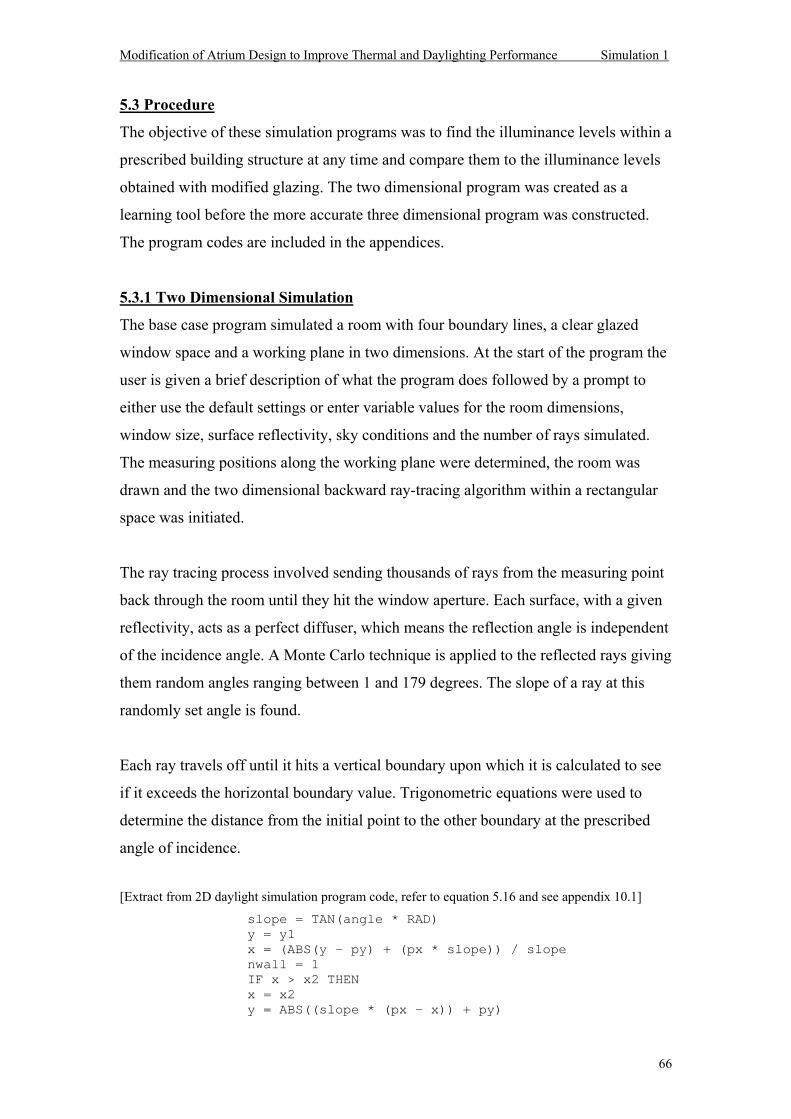
Modification of Atrium Design to Improve Thermal and Daylighting Performance Simulation 1
66
5.3 Procedure
The objective of these simulation programs was to find the illuminance levels within a
prescribed building structure at any time and compare them to the illuminance levels
obtained with modified glazing. The two dimensional program was created as a
learning tool before the more accurate three dimensional program was constructed.
The program codes are included in the appendices.
5.3.1 Two Dimensional Simulation
The base case program simulated a room with four boundary lines, a clear glazed
window space and a working plane in two dimensions. At the start of the program the
user is given a brief description of what the program does followed by a prompt to
either use the default settings or enter variable values for the room dimensions,
window size, surface reflectivity, sky conditions and the number of rays simulated.
The measuring positions along the working plane were determined, the room was
drawn and the two dimensional backward ray-tracing algorithm within a rectangular
space was initiated.
The ray tracing process involved sending thousands of rays from the measuring point
back through the room until they hit the window aperture. Each surface, with a given
reflectivity, acts as a perfect diffuser, which means the reflection angle is independent
of the incidence angle. A Monte Carlo technique is applied to the reflected rays giving
them random angles ranging between 1 and 179 degrees. The slope of a ray at this
randomly set angle is found.
Each ray travels off until it hits a vertical boundary upon which it is calculated to see
if it exceeds the horizontal boundary value. Trigonometric equations were used to
determine the distance from the initial point to the other boundary at the prescribed
angle of incidence.
[Extract from 2D daylight simulation program code, refer to equation 5.16 and see appendix 10.1]
slope = TAN(angle * RAD) y = y1 x = (ABS(y - py) + (px * slope)) / slope nwall = 1 IF x > x2 THEN x = x2 y = ABS((slope * (px - x)) + py)
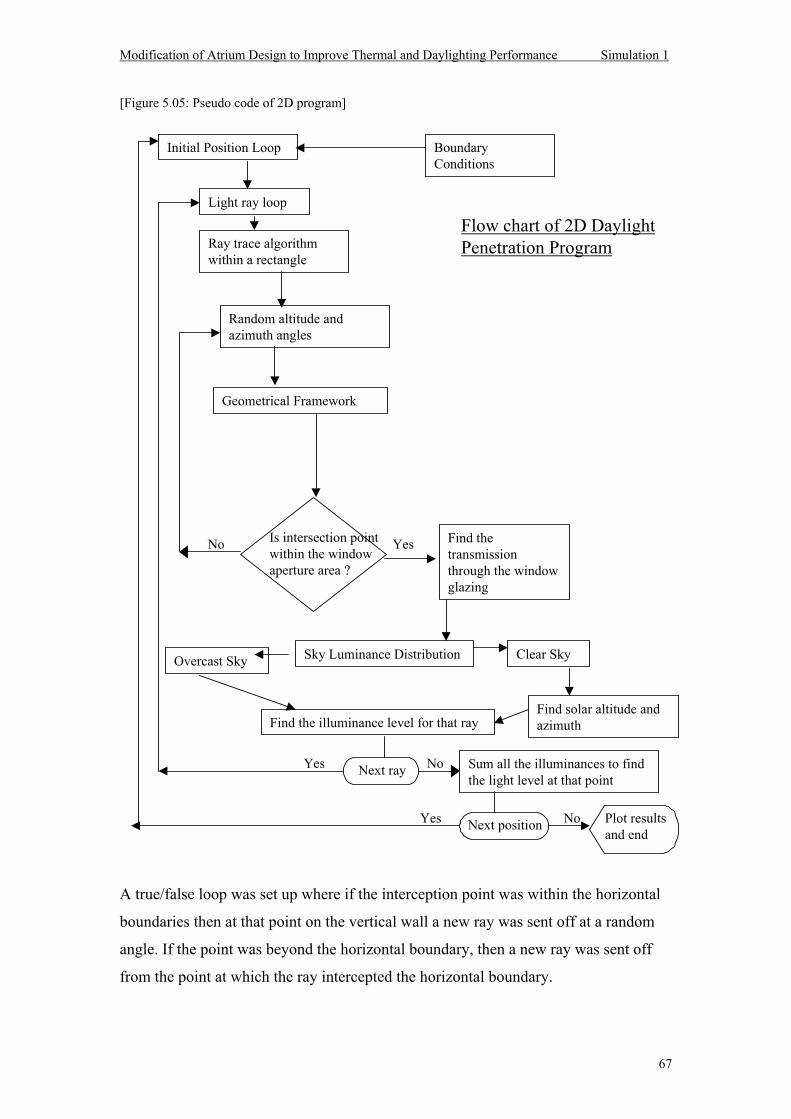
Modification of Atrium Design to Improve Thermal and Daylighting Performance Simulation 1
67
[Figure 5.05: Pseudo code of 2D program]
A true/false loop was set up where if the interception point was within the horizontal
boundaries then at that point on the vertical wall a new ray was sent off at a random
angle. If the point was beyond the horizontal boundary, then a new ray was sent off
from the point at which the ray intercepted the horizontal boundary.
BoundaryConditions
Initial Position Loop
Light ray loop
Ray trace algorithmwithin a rectangle
Random altitude andazimuth angles
Geometrical Framework
Is intersection pointwithin the windowaperture area ?
YesNo Find thetransmissionthrough the windowglazing
Sky Luminance DistributionOvercast Sky Clear Sky
Find solar altitude andazimuthFind the illuminance level for that ray
Sum all the illuminances to findthe light level at that point
Flow chart of 2D DaylightPenetration Program
Next rayYes No
Next positionYes No Plot resultsand end
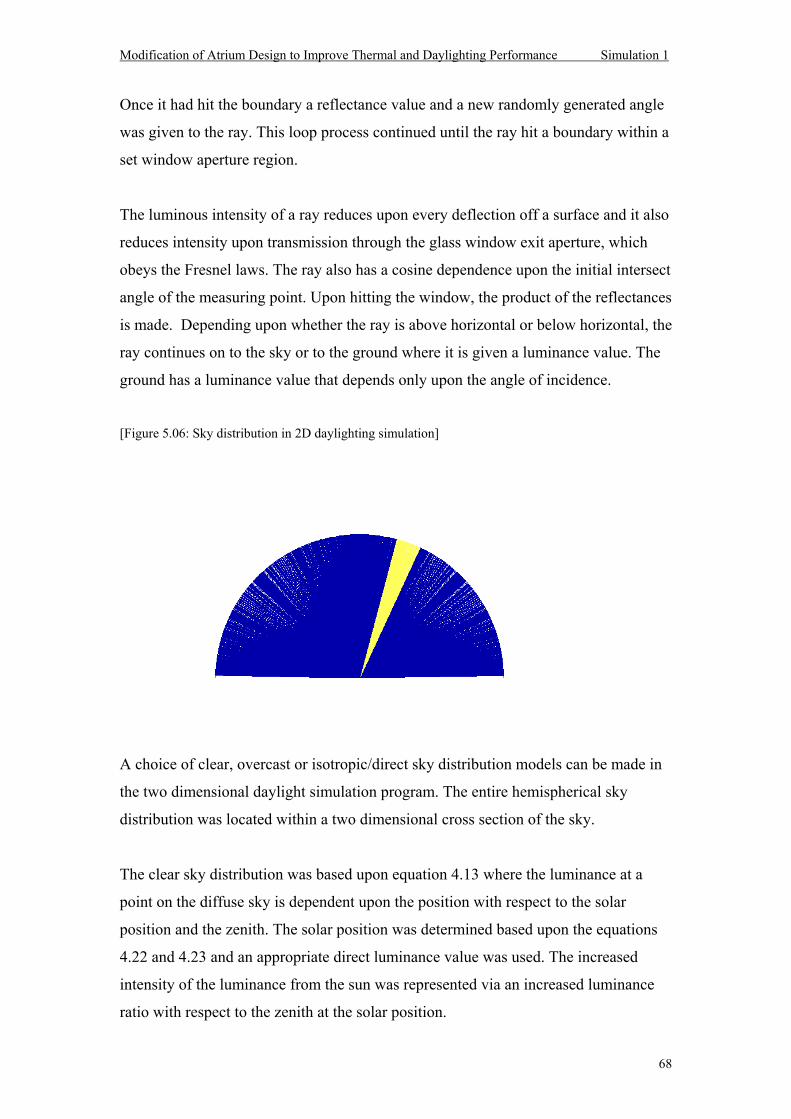
Modification of Atrium Design to Improve Thermal and Daylighting Performance Simulation 1
68
Once it had hit the boundary a reflectance value and a new randomly generated angle
was given to the ray. This loop process continued until the ray hit a boundary within a
set window aperture region.
The luminous intensity of a ray reduces upon every deflection off a surface and it also
reduces intensity upon transmission through the glass window exit aperture, which
obeys the Fresnel laws. The ray also has a cosine dependence upon the initial intersect
angle of the measuring point. Upon hitting the window, the product of the reflectances
is made. Depending upon whether the ray is above horizontal or below horizontal, the
ray continues on to the sky or to the ground where it is given a luminance value. The
ground has a luminance value that depends only upon the angle of incidence.
[Figure 5.06: Sky distribution in 2D daylighting simulation]
A choice of clear, overcast or isotropic/direct sky distribution models can be made in
the two dimensional daylight simulation program. The entire hemispherical sky
distribution was located within a two dimensional cross section of the sky.
The clear sky distribution was based upon equation 4.13 where the luminance at a
point on the diffuse sky is dependent upon the position with respect to the solar
position and the zenith. The solar position was determined based upon the equations
4.22 and 4.23 and an appropriate direct luminance value was used. The increased
intensity of the luminance from the sun was represented via an increased luminance
ratio with respect to the zenith at the solar position.
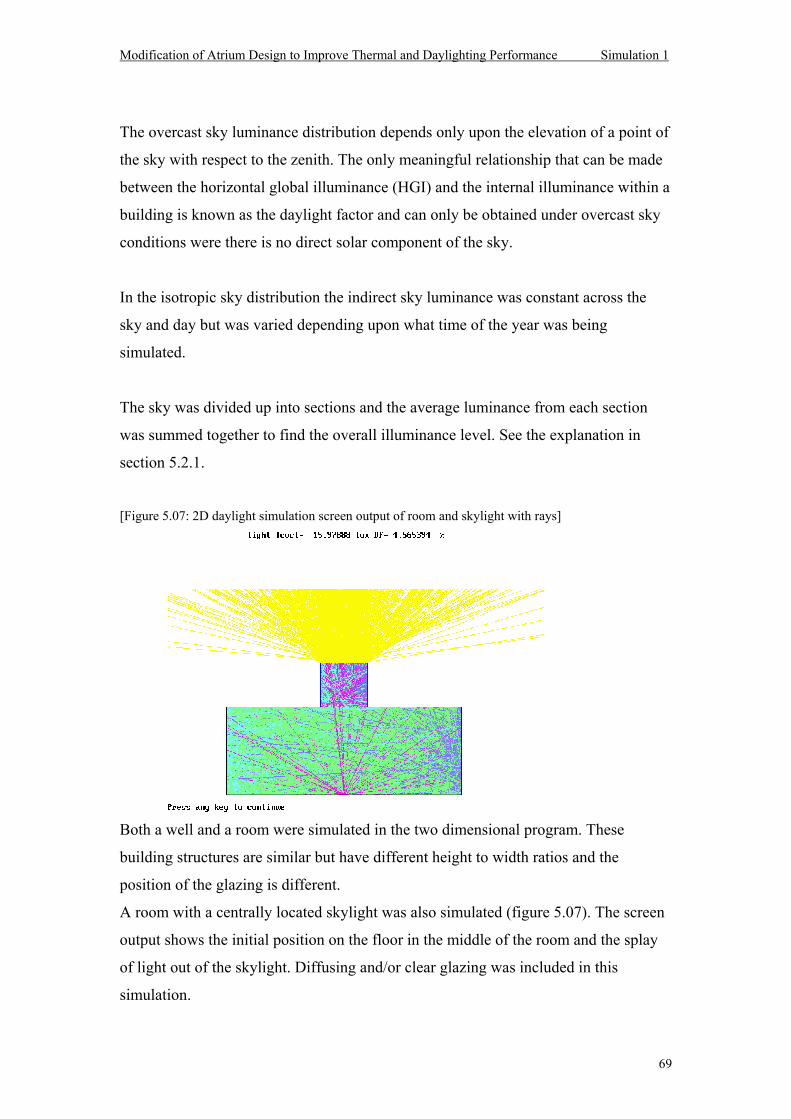
Modification of Atrium Design to Improve Thermal and Daylighting Performance Simulation 1
69
The overcast sky luminance distribution depends only upon the elevation of a point of
the sky with respect to the zenith. The only meaningful relationship that can be made
between the horizontal global illuminance (HGI) and the internal illuminance within a
building is known as the daylight factor and can only be obtained under overcast sky
conditions were there is no direct solar component of the sky.
In the isotropic sky distribution the indirect sky luminance was constant across the
sky and day but was varied depending upon what time of the year was being
simulated.
The sky was divided up into sections and the average luminance from each section
was summed together to find the overall illuminance level. See the explanation in
section 5.2.1.
[Figure 5.07: 2D daylight simulation screen output of room and skylight with rays]
Both a well and a room were simulated in the two dimensional program. These
building structures are similar but have different height to width ratios and the
position of the glazing is different.
A room with a centrally located skylight was also simulated (figure 5.07). The screen
output shows the initial position on the floor in the middle of the room and the splay
of light out of the skylight. Diffusing and/or clear glazing was included in this
simulation.
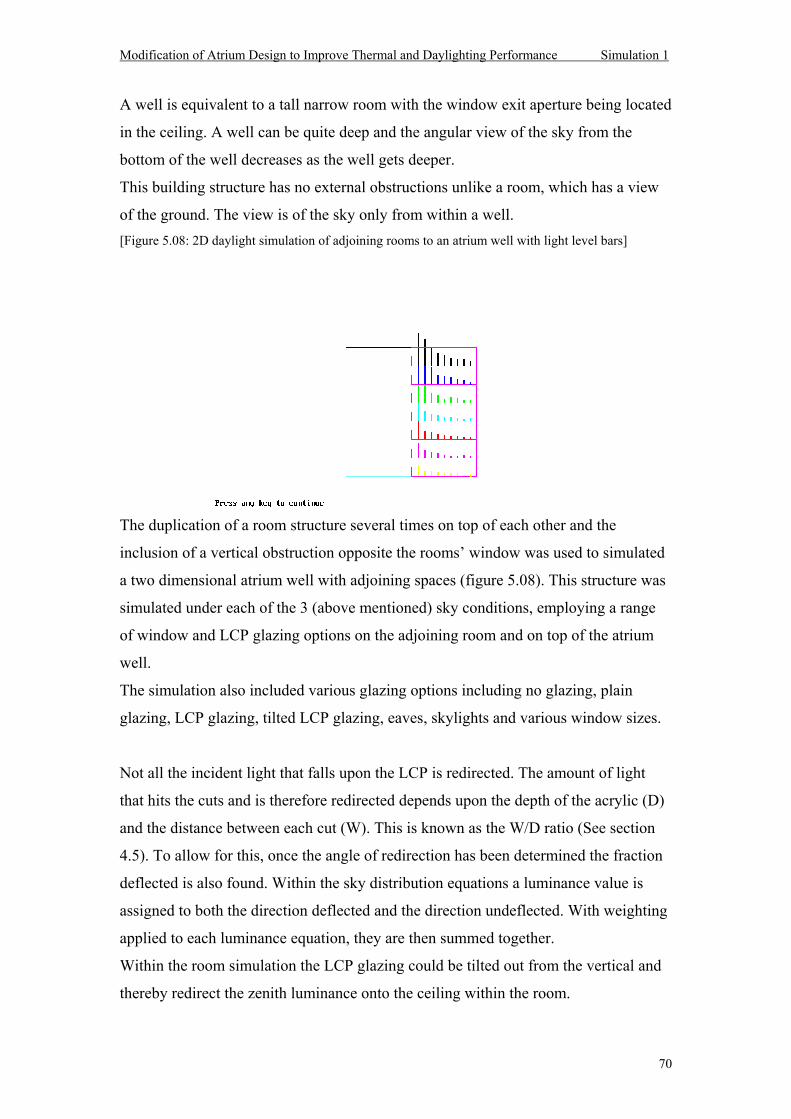
Modification of Atrium Design to Improve Thermal and Daylighting Performance Simulation 1
70
A well is equivalent to a tall narrow room with the window exit aperture being located
in the ceiling. A well can be quite deep and the angular view of the sky from the
bottom of the well decreases as the well gets deeper.
This building structure has no external obstructions unlike a room, which has a view
of the ground. The view is of the sky only from within a well. [Figure 5.08: 2D daylight simulation of adjoining rooms to an atrium well with light level bars]
The duplication of a room structure several times on top of each other and the
inclusion of a vertical obstruction opposite the rooms window was used to simulated
a two dimensional atrium well with adjoining spaces (figure 5.08). This structure was
simulated under each of the 3 (above mentioned) sky conditions, employing a range
of window and LCP glazing options on the adjoining room and on top of the atrium
well.
The simulation also included various glazing options including no glazing, plain
glazing, LCP glazing, tilted LCP glazing, eaves, skylights and various window sizes.
Not all the incident light that falls upon the LCP is redirected. The amount of light
that hits the cuts and is therefore redirected depends upon the depth of the acrylic (D)
and the distance between each cut (W). This is known as the W/D ratio (See section
4.5). To allow for this, once the angle of redirection has been determined the fraction
deflected is also found. Within the sky distribution equations a luminance value is
assigned to both the direction deflected and the direction undeflected. With weighting
applied to each luminance equation, they are then summed together.
Within the room simulation the LCP glazing could be tilted out from the vertical and
thereby redirect the zenith luminance onto the ceiling within the room.
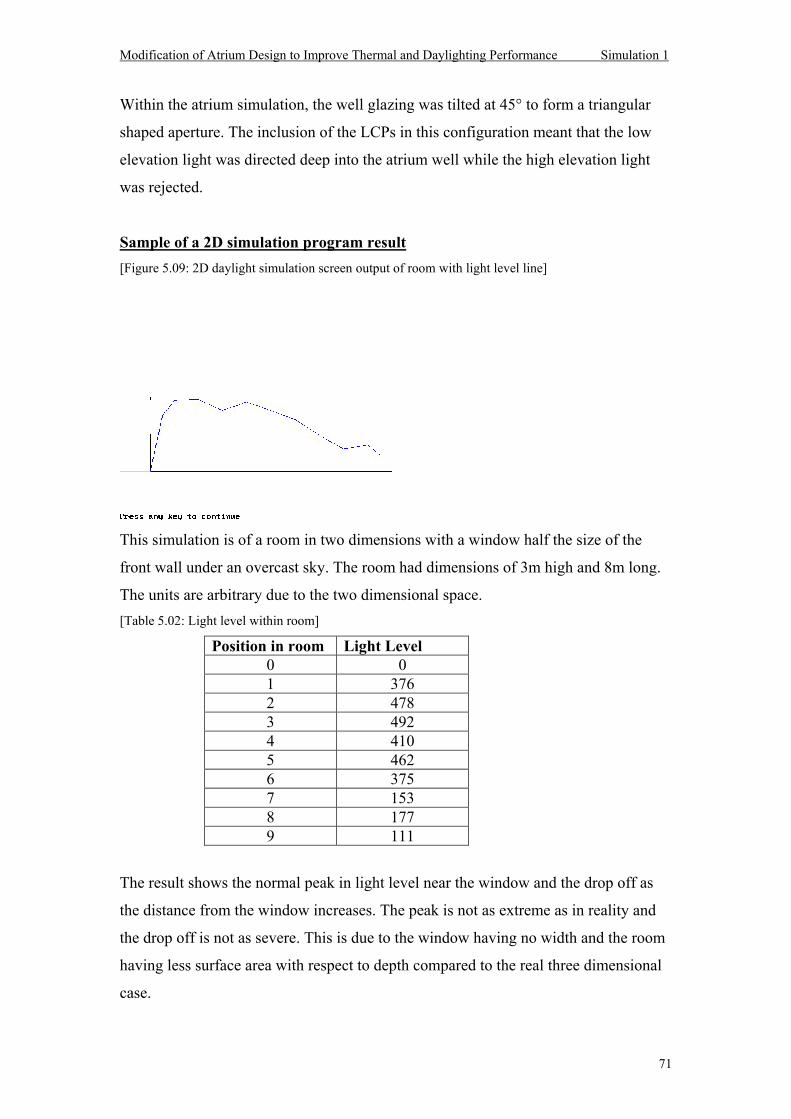
Modification of Atrium Design to Improve Thermal and Daylighting Performance Simulation 1
71
Within the atrium simulation, the well glazing was tilted at 45° to form a triangular
shaped aperture. The inclusion of the LCPs in this configuration meant that the low
elevation light was directed deep into the atrium well while the high elevation light
was rejected.
Sample of a 2D simulation program result [Figure 5.09: 2D daylight simulation screen output of room with light level line]
This simulation is of a room in two dimensions with a window half the size of the
front wall under an overcast sky. The room had dimensions of 3m high and 8m long.
The units are arbitrary due to the two dimensional space. [Table 5.02: Light level within room]
Position in room Light Level 0 0 1 376 2 478 3 492 4 410 5 462 6 375 7 153 8 177 9 111
The result shows the normal peak in light level near the window and the drop off as
the distance from the window increases. The peak is not as extreme as in reality and
the drop off is not as severe. This is due to the window having no width and the room
having less surface area with respect to depth compared to the real three dimensional
case.
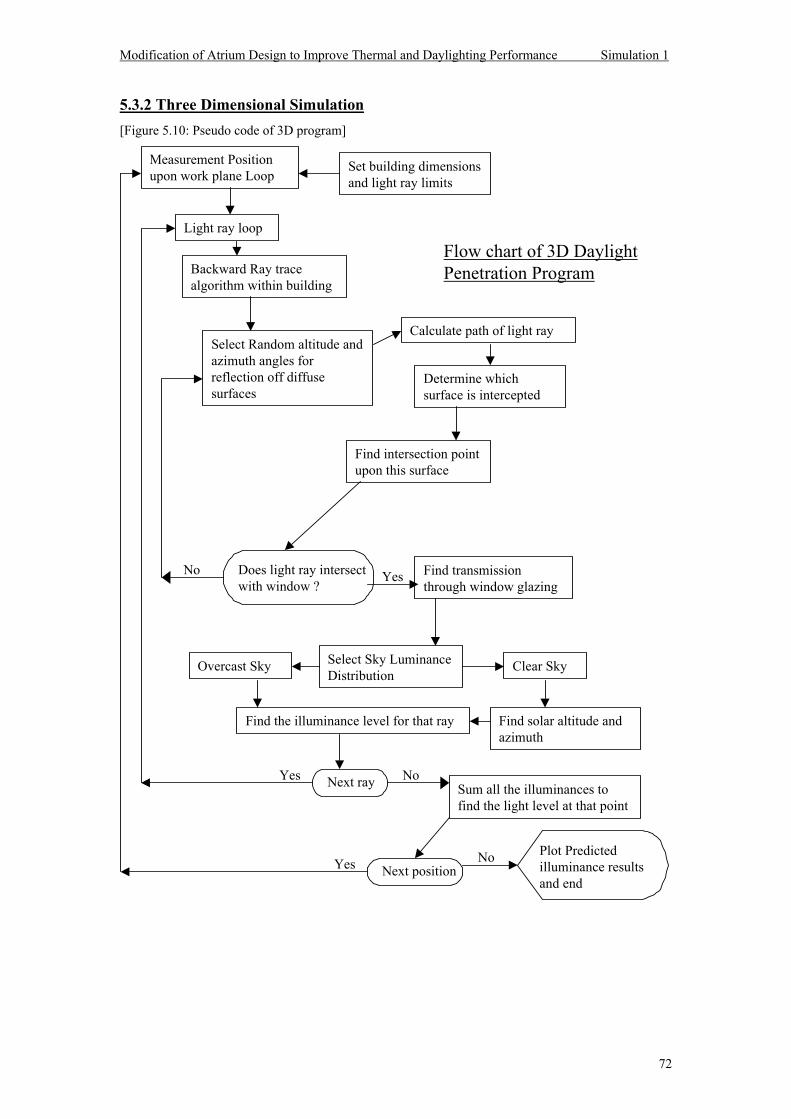
Modification of Atrium Design to Improve Thermal and Daylighting Performance Simulation 1
72
5.3.2 Three Dimensional Simulation [Figure 5.10: Pseudo code of 3D program]
Set building dimensionsand light ray limits
Measurement Positionupon work plane Loop
Light ray loop
Backward Ray tracealgorithm within building
Select Random altitude andazimuth angles forreflection off diffusesurfaces
Calculate path of light ray
Determine whichsurface is intercepted
Find intersection pointupon this surface
Does light ray intersectwith window ?
YesNo Find transmissionthrough window glazing
Select Sky LuminanceDistribution
Overcast Sky Clear Sky
Find solar altitude andazimuth
Find the illuminance level for that ray
Sum all the illuminances tofind the light level at that point
Flow chart of 3D DaylightPenetration Program
Next ray
Next positionPlot Predictedilluminance resultsand end
No
No
Yes
Yes
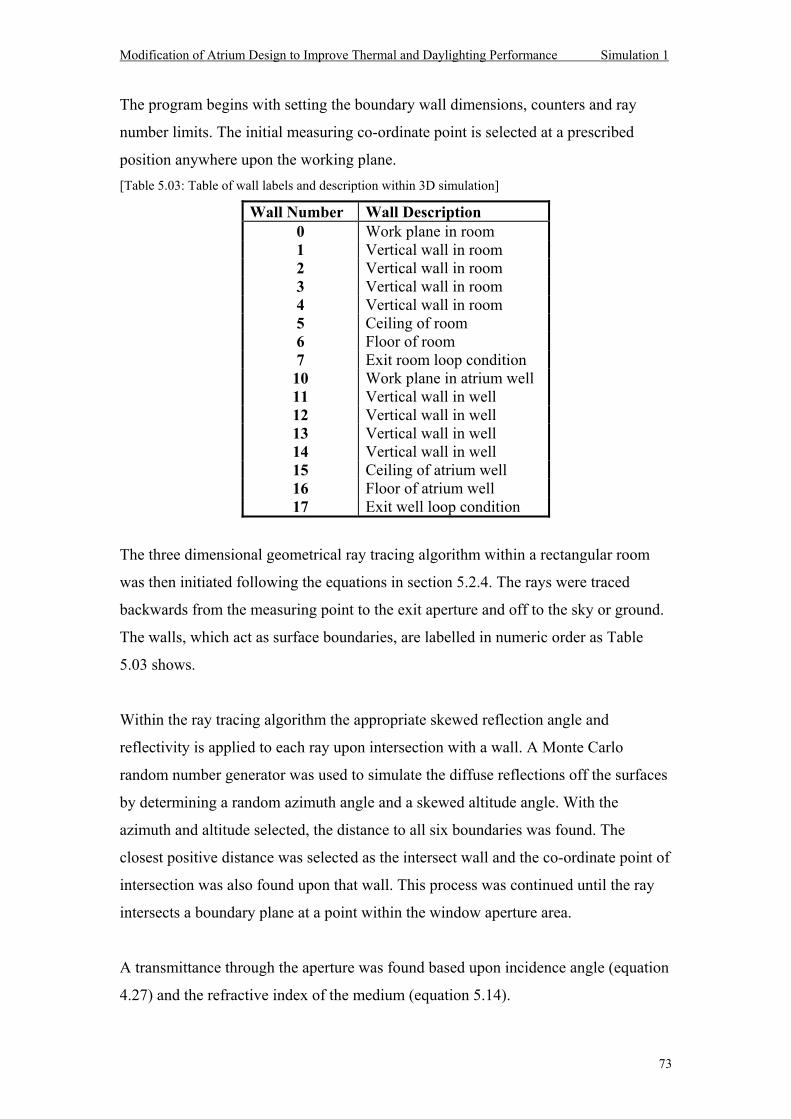
Modification of Atrium Design to Improve Thermal and Daylighting Performance Simulation 1
73
The program begins with setting the boundary wall dimensions, counters and ray
number limits. The initial measuring co-ordinate point is selected at a prescribed
position anywhere upon the working plane. [Table 5.03: Table of wall labels and description within 3D simulation]
Wall Number Wall Description 0 Work plane in room 1 Vertical wall in room 2 Vertical wall in room 3 Vertical wall in room 4 Vertical wall in room 5 Ceiling of room 6 Floor of room 7 Exit room loop condition 10 Work plane in atrium well 11 Vertical wall in well 12 Vertical wall in well 13 Vertical wall in well 14 Vertical wall in well 15 Ceiling of atrium well 16 Floor of atrium well 17 Exit well loop condition
The three dimensional geometrical ray tracing algorithm within a rectangular room
was then initiated following the equations in section 5.2.4. The rays were traced
backwards from the measuring point to the exit aperture and off to the sky or ground.
The walls, which act as surface boundaries, are labelled in numeric order as Table
5.03 shows.
Within the ray tracing algorithm the appropriate skewed reflection angle and
reflectivity is applied to each ray upon intersection with a wall. A Monte Carlo
random number generator was used to simulate the diffuse reflections off the surfaces
by determining a random azimuth angle and a skewed altitude angle. With the
azimuth and altitude selected, the distance to all six boundaries was found. The
closest positive distance was selected as the intersect wall and the co-ordinate point of
intersection was also found upon that wall. This process was continued until the ray
intersects a boundary plane at a point within the window aperture area.
A transmittance through the aperture was found based upon incidence angle (equation
4.27) and the refractive index of the medium (equation 5.14).
Modification of Atrium Design to Improve Thermal and Daylighting Performance Simulation 1
74
Once a ray refracts through the window it proceeds off to the sky or ground,
depending upon whether the altitude is positive or negative, and a luminance value is
obtained.
The product of the reflectivities and transmissions are applied to the luminance along
with the cosine corrections for the intersections with the surfaces and finally the
direction division for that ray.
The sky is divided into a number of set regions across the sky and the average
luminance from each region is summed together to find a total illuminance level. See
the three dimensional simulation equations in section 5.2.1.
Two sky distributions have been simulated in the three dimensional program, these
are the overcast sky and the isotropic/direct sky. The overcast sky distribution is based
upon the classic Moon-Spencer equation (4.10) with the standard relationship
between the zenith luminance and the horizontal global illuminance. If the sky type is
overcast then a corresponding daylight factor (DF) as well as the illuminance level
was found (equation 4.24). If the sky distribution is isotropic with direct sun then the
position of the sun has to be found with respect to the global co-ordinates (latitude,
longitude) and the time of the year. The declination, solar time, solar azimuth and
solar altitude are all found to determine the position of the sun (see section 4.3).
When a clear sky was used enough rays had to go to the sun to be a correct
representation so 10 000 rays were sent out for clear sky while only 1000 rays were
used for an overcast sky. The amount of direct radiation falling upon the measuring
point is determined by allowing only one ray with zero reflections inside the room to
trace back to the sun patch.
To create a building structure of a light well, the entire ceiling is made into the exit
aperture and the height is increased to the appropriate well index ratio. The glazing
over the well is a clear glazed pyramid shaped dome with a tilt of 45°. The room and
well building structures are positioned next to each other where upon the light rays
that exit the rooms window aperture orientated north enter the well on the southern
wall and eventually exit the well through the roof aperture. This combination allows
the light level in a room adjoining to an atrium well to be simulated.
Modification of Atrium Design to Improve Thermal and Daylighting Performance Simulation 1
75
Fresnel equations for the transmission through the glazing with respect to the incident
angle were applied to both the clear glass and the laser cut panels (LCP).
The glazing is positioned within the exit aperture. When a ray intersects with an area
prescribed as within the exit aperture then the looping ray tracing algorithm stops. The
progression of the light through two different glazings is simulated, these being plain
6mm clear glass (n=1.53) and laser cut 6mm clear acrylic (n=1.50). The three
dimensional incident angle is calculated and then the Fresnel equation is applied to
find the intensity of the transmitted ray. Refraction at each air-glass interface is
simulated and the total internal reflection off the cuts within the LCPs is also
simulated.
The LCP can be inserted into the glazing aperture and positioned on any room or well
surface where upon it is tilted to the appropriate angle to redirect and therefore modify
the penetration of direct radiation. With the LCP included in the roof aperture the
glazing becomes a double glazed unit, whereas, when the LCP is placed in the room
aperture it replaces the existing clear glazing.
Not all the incident light falling upon the LCP is redirected. The amount of light that
is redirected depends upon the depth of the acrylic and the distance between each cut.
This is known as the W/D ratio. To allow for this, once the angle of redirection has
been determined the fraction deflected is also found and then within the sky
distribution equations the luminance has to be found for both the direction deflected
and the direction undeflected. With weighting applied to each luminance equation,
they are then summed together.
The program was set up with a large number of rays from each measuring point so
that consistent, reproducible results were obtained. The averaging process of between
1000 and 10000 rays resulted in a very small variation in repeatable run results and
therefore a small uncertainty.
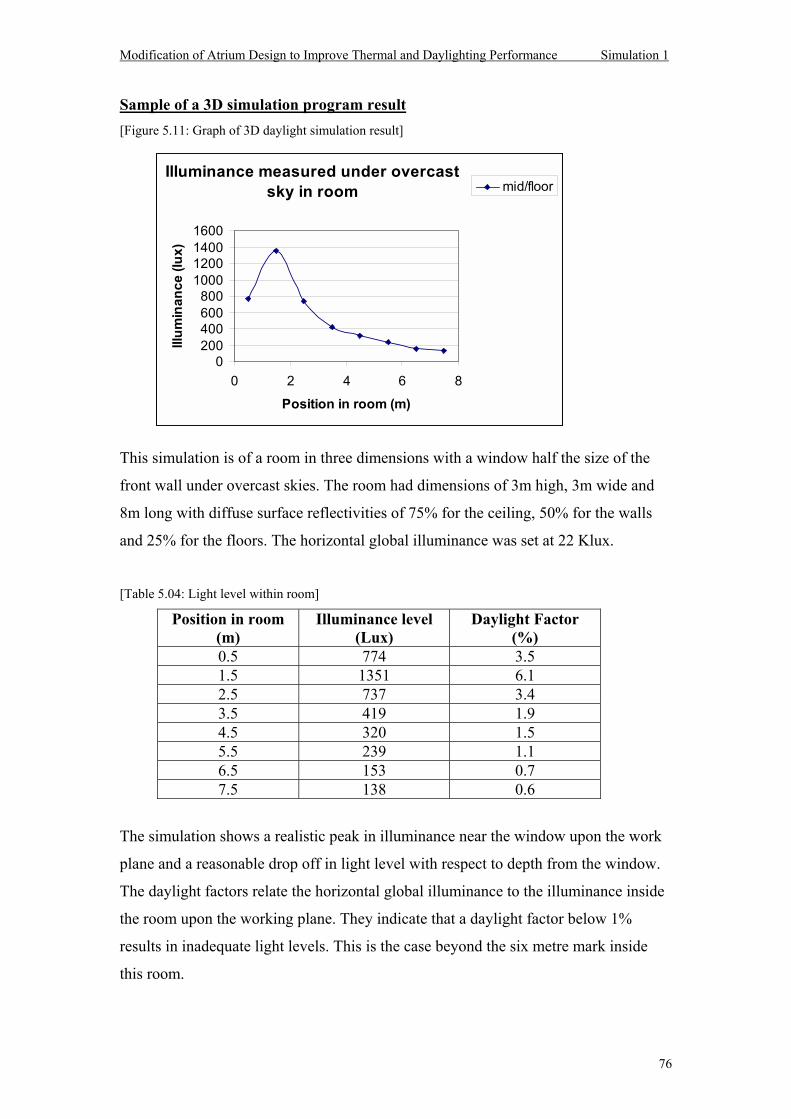
Modification of Atrium Design to Improve Thermal and Daylighting Performance Simulation 1
76
Sample of a 3D simulation program result [Figure 5.11: Graph of 3D daylight simulation result]
This simulation is of a room in three dimensions with a window half the size of the
front wall under overcast skies. The room had dimensions of 3m high, 3m wide and
8m long with diffuse surface reflectivities of 75% for the ceiling, 50% for the walls
and 25% for the floors. The horizontal global illuminance was set at 22 Klux.
[Table 5.04: Light level within room]
Position in room (m)
Illuminance level (Lux)
Daylight Factor (%)
0.5 774 3.5 1.5 1351 6.1 2.5 737 3.4 3.5 419 1.9 4.5 320 1.5 5.5 239 1.1 6.5 153 0.7 7.5 138 0.6
The simulation shows a realistic peak in illuminance near the window upon the work
plane and a reasonable drop off in light level with respect to depth from the window.
The daylight factors relate the horizontal global illuminance to the illuminance inside
the room upon the working plane. They indicate that a daylight factor below 1%
results in inadequate light levels. This is the case beyond the six metre mark inside
this room.
Illuminance measured under overcast sky in room
0200400600800
1000120014001600
0 2 4 6 8
Position in room (m)
Illum
inan
ce (l
ux)
mid/floor
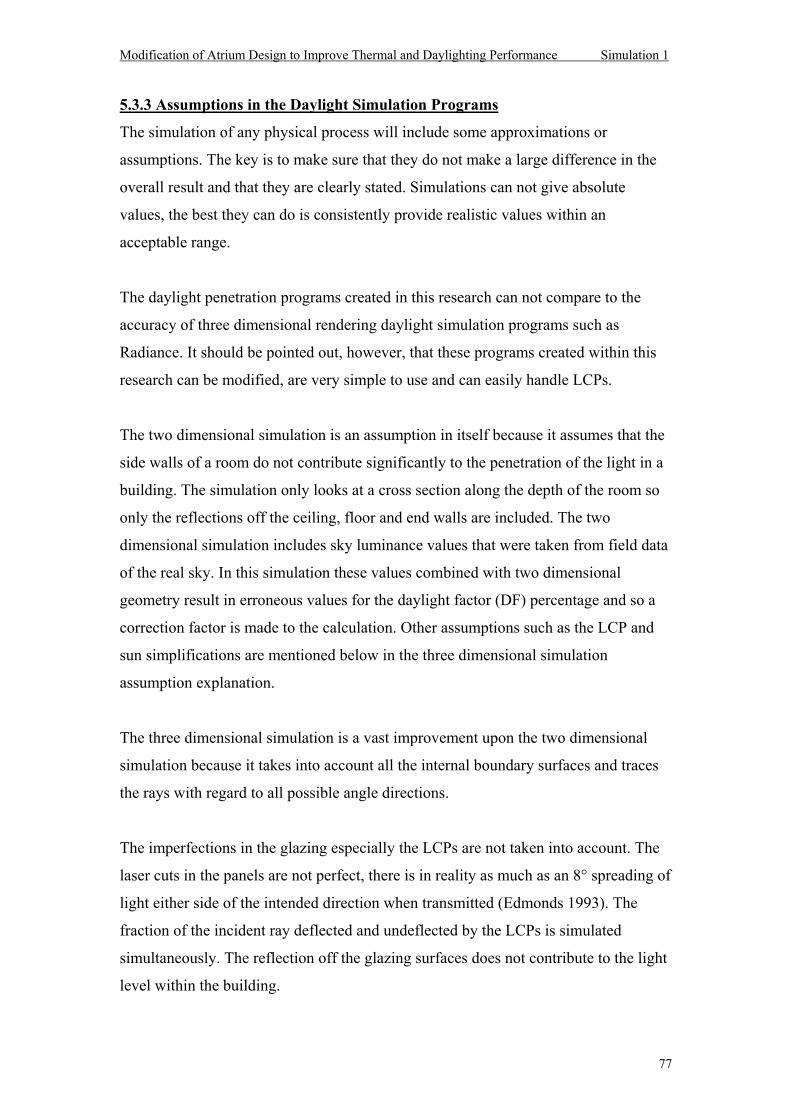
Modification of Atrium Design to Improve Thermal and Daylighting Performance Simulation 1
77
5.3.3 Assumptions in the Daylight Simulation Programs
The simulation of any physical process will include some approximations or
assumptions. The key is to make sure that they do not make a large difference in the
overall result and that they are clearly stated. Simulations can not give absolute
values, the best they can do is consistently provide realistic values within an
acceptable range.
The daylight penetration programs created in this research can not compare to the
accuracy of three dimensional rendering daylight simulation programs such as
Radiance. It should be pointed out, however, that these programs created within this
research can be modified, are very simple to use and can easily handle LCPs.
The two dimensional simulation is an assumption in itself because it assumes that the
side walls of a room do not contribute significantly to the penetration of the light in a
building. The simulation only looks at a cross section along the depth of the room so
only the reflections off the ceiling, floor and end walls are included. The two
dimensional simulation includes sky luminance values that were taken from field data
of the real sky. In this simulation these values combined with two dimensional
geometry result in erroneous values for the daylight factor (DF) percentage and so a
correction factor is made to the calculation. Other assumptions such as the LCP and
sun simplifications are mentioned below in the three dimensional simulation
assumption explanation.
The three dimensional simulation is a vast improvement upon the two dimensional
simulation because it takes into account all the internal boundary surfaces and traces
the rays with regard to all possible angle directions.
The imperfections in the glazing especially the LCPs are not taken into account. The
laser cuts in the panels are not perfect, there is in reality as much as an 8° spreading of
light either side of the intended direction when transmitted (Edmonds 1993). The
fraction of the incident ray deflected and undeflected by the LCPs is simulated
simultaneously. The reflection off the glazing surfaces does not contribute to the light
level within the building.
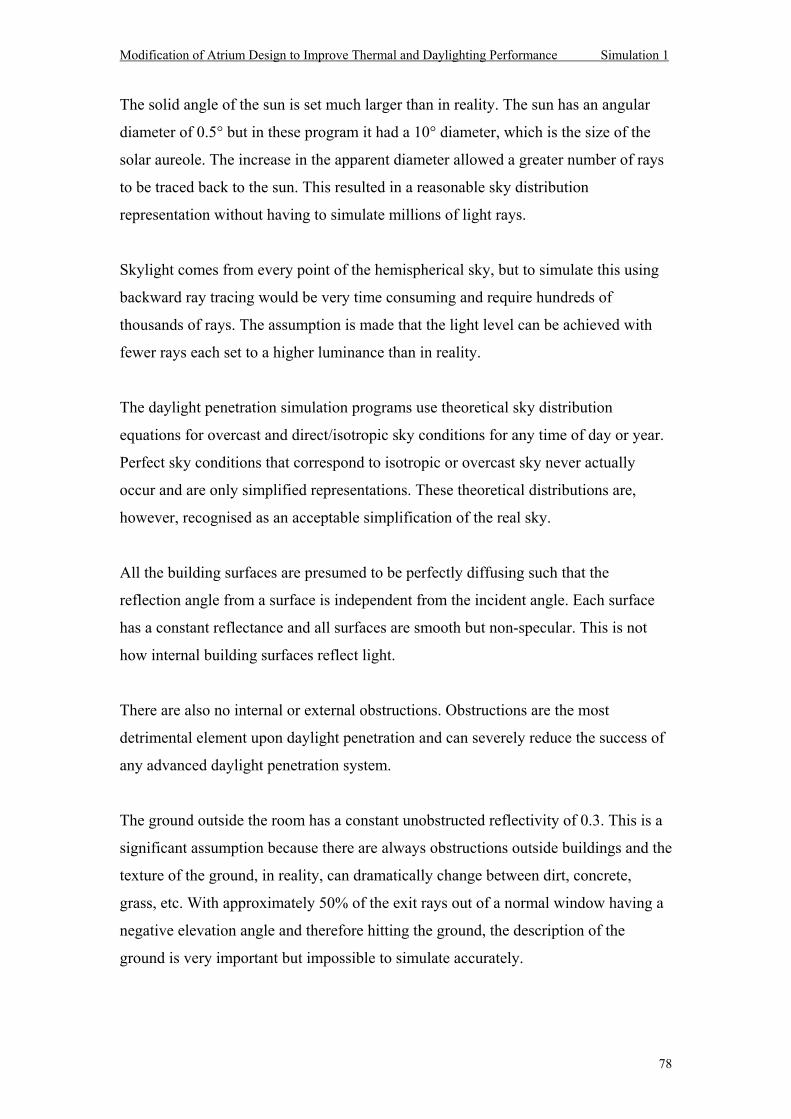
Modification of Atrium Design to Improve Thermal and Daylighting Performance Simulation 1
78
The solid angle of the sun is set much larger than in reality. The sun has an angular
diameter of 0.5° but in these program it had a 10° diameter, which is the size of the
solar aureole. The increase in the apparent diameter allowed a greater number of rays
to be traced back to the sun. This resulted in a reasonable sky distribution
representation without having to simulate millions of light rays.
Skylight comes from every point of the hemispherical sky, but to simulate this using
backward ray tracing would be very time consuming and require hundreds of
thousands of rays. The assumption is made that the light level can be achieved with
fewer rays each set to a higher luminance than in reality.
The daylight penetration simulation programs use theoretical sky distribution
equations for overcast and direct/isotropic sky conditions for any time of day or year.
Perfect sky conditions that correspond to isotropic or overcast sky never actually
occur and are only simplified representations. These theoretical distributions are,
however, recognised as an acceptable simplification of the real sky.
All the building surfaces are presumed to be perfectly diffusing such that the
reflection angle from a surface is independent from the incident angle. Each surface
has a constant reflectance and all surfaces are smooth but non-specular. This is not
how internal building surfaces reflect light.
There are also no internal or external obstructions. Obstructions are the most
detrimental element upon daylight penetration and can severely reduce the success of
any advanced daylight penetration system.
The ground outside the room has a constant unobstructed reflectivity of 0.3. This is a
significant assumption because there are always obstructions outside buildings and the
texture of the ground, in reality, can dramatically change between dirt, concrete,
grass, etc. With approximately 50% of the exit rays out of a normal window having a
negative elevation angle and therefore hitting the ground, the description of the
ground is very important but impossible to simulate accurately.
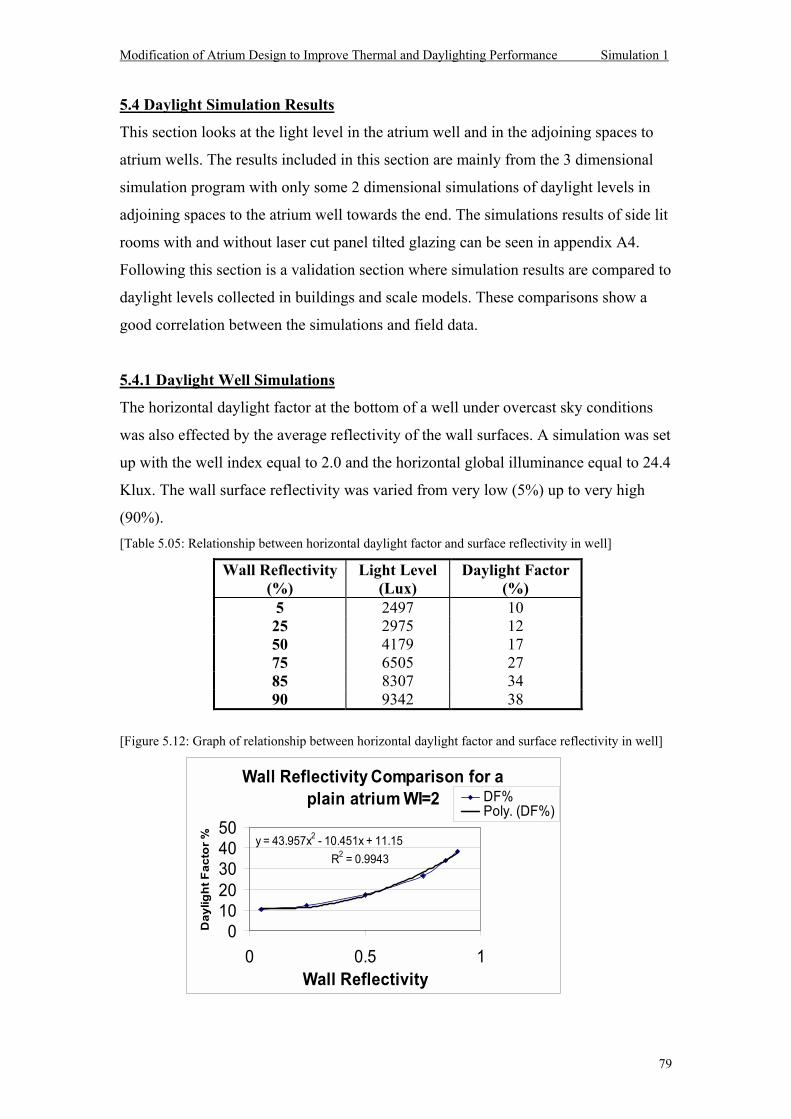
Modification of Atrium Design to Improve Thermal and Daylighting Performance Simulation 1
79
5.4 Daylight Simulation Results
This section looks at the light level in the atrium well and in the adjoining spaces to
atrium wells. The results included in this section are mainly from the 3 dimensional
simulation program with only some 2 dimensional simulations of daylight levels in
adjoining spaces to the atrium well towards the end. The simulations results of side lit
rooms with and without laser cut panel tilted glazing can be seen in appendix A4.
Following this section is a validation section where simulation results are compared to
daylight levels collected in buildings and scale models. These comparisons show a
good correlation between the simulations and field data.
5.4.1 Daylight Well Simulations
The horizontal daylight factor at the bottom of a well under overcast sky conditions
was also effected by the average reflectivity of the wall surfaces. A simulation was set
up with the well index equal to 2.0 and the horizontal global illuminance equal to 24.4
Klux. The wall surface reflectivity was varied from very low (5%) up to very high
(90%). [Table 5.05: Relationship between horizontal daylight factor and surface reflectivity in well]
Wall Reflectivity (%)
Light Level (Lux)
Daylight Factor (%)
5 2497 10 25 2975 12 50 4179 17 75 6505 27 85 8307 34 90 9342 38
[Figure 5.12: Graph of relationship between horizontal daylight factor and surface reflectivity in well]
Wall Reflectivity Comparison for a plain atrium WI=2
y = 43.957x2 - 10.451x + 11.15 R2 = 0.9943
01020304050
0 0.5 1Wall Reflectivity
Day
light
Fac
tor %
DF%Poly. (DF%)
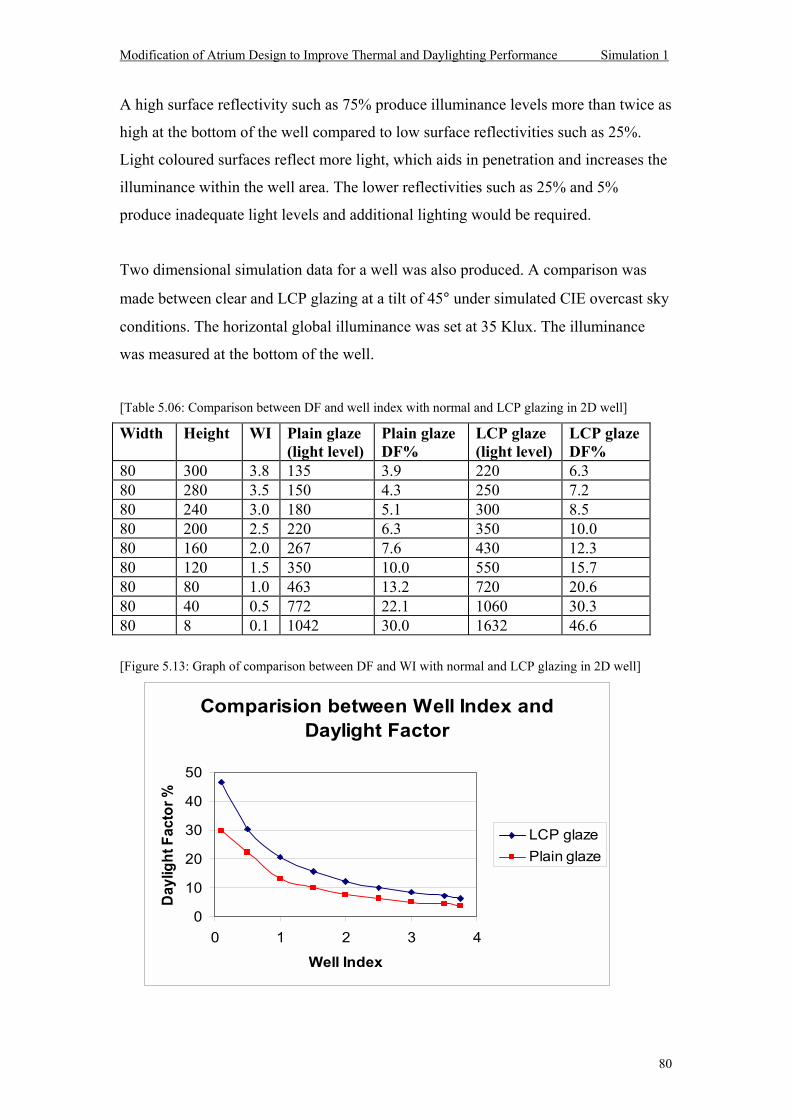
Modification of Atrium Design to Improve Thermal and Daylighting Performance Simulation 1
80
A high surface reflectivity such as 75% produce illuminance levels more than twice as
high at the bottom of the well compared to low surface reflectivities such as 25%.
Light coloured surfaces reflect more light, which aids in penetration and increases the
illuminance within the well area. The lower reflectivities such as 25% and 5%
produce inadequate light levels and additional lighting would be required.
Two dimensional simulation data for a well was also produced. A comparison was
made between clear and LCP glazing at a tilt of 45° under simulated CIE overcast sky
conditions. The horizontal global illuminance was set at 35 Klux. The illuminance
was measured at the bottom of the well.
[Table 5.06: Comparison between DF and well index with normal and LCP glazing in 2D well]
Width Height WI Plain glaze (light level)
Plain glaze DF%
LCP glaze (light level)
LCP glaze DF%
80 300 3.8 135 3.9 220 6.3 80 280 3.5 150 4.3 250 7.2 80 240 3.0 180 5.1 300 8.5 80 200 2.5 220 6.3 350 10.0 80 160 2.0 267 7.6 430 12.3 80 120 1.5 350 10.0 550 15.7 80 80 1.0 463 13.2 720 20.6 80 40 0.5 772 22.1 1060 30.3 80 8 0.1 1042 30.0 1632 46.6
[Figure 5.13: Graph of comparison between DF and WI with normal and LCP glazing in 2D well]
Comparision between Well Index and Daylight Factor
0
10
20
30
40
50
0 1 2 3 4
Well Index
Dayl
ight
Fac
tor %
LCP glazePlain glaze
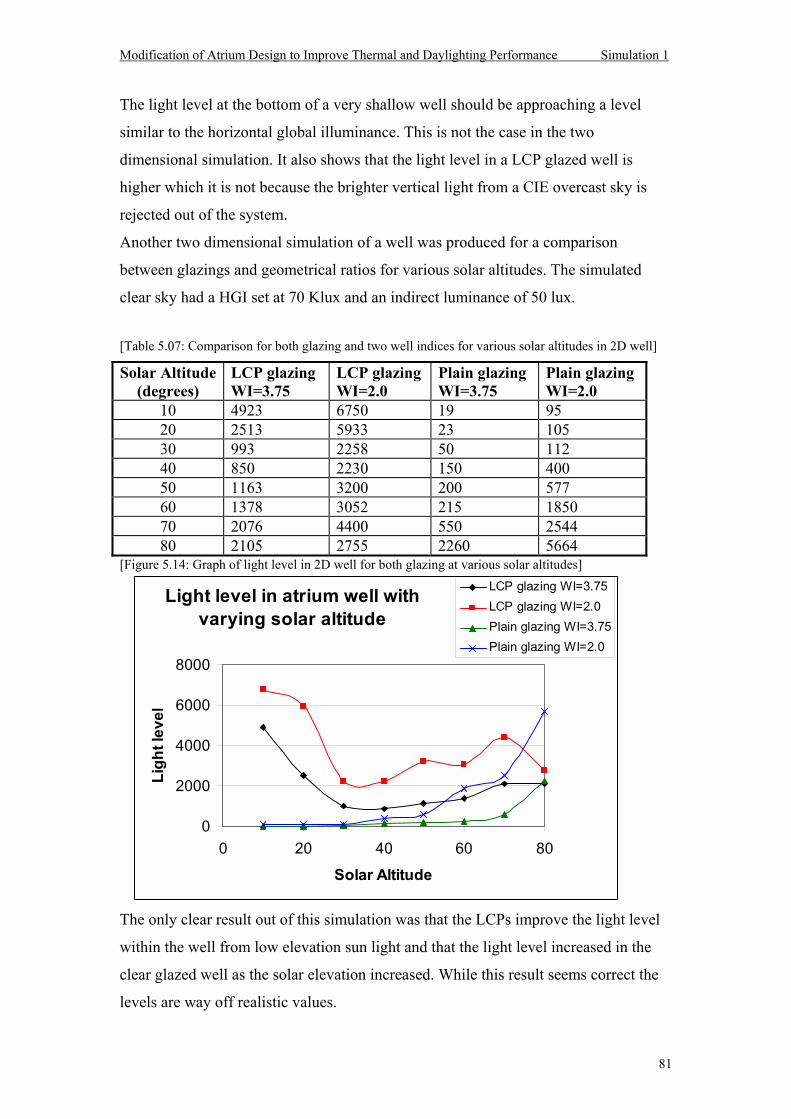
Modification of Atrium Design to Improve Thermal and Daylighting Performance Simulation 1
81
The light level at the bottom of a very shallow well should be approaching a level
similar to the horizontal global illuminance. This is not the case in the two
dimensional simulation. It also shows that the light level in a LCP glazed well is
higher which it is not because the brighter vertical light from a CIE overcast sky is
rejected out of the system.
Another two dimensional simulation of a well was produced for a comparison
between glazings and geometrical ratios for various solar altitudes. The simulated
clear sky had a HGI set at 70 Klux and an indirect luminance of 50 lux.
[Table 5.07: Comparison for both glazing and two well indices for various solar altitudes in 2D well]
Solar Altitude (degrees)
LCP glazing WI=3.75
LCP glazing WI=2.0
Plain glazing WI=3.75
Plain glazing WI=2.0
10 4923 6750 19 95 20 2513 5933 23 105 30 993 2258 50 112 40 850 2230 150 400 50 1163 3200 200 577 60 1378 3052 215 1850 70 2076 4400 550 2544 80 2105 2755 2260 5664
[Figure 5.14: Graph of light level in 2D well for both glazing at various solar altitudes]
The only clear result out of this simulation was that the LCPs improve the light level
within the well from low elevation sun light and that the light level increased in the
clear glazed well as the solar elevation increased. While this result seems correct the
levels are way off realistic values.
Light level in atrium well with varying solar altitude
0
2000
4000
6000
8000
0 20 40 60 80
Solar Altitude
Ligh
t lev
el
LCP glazing WI=3.75LCP glazing WI=2.0Plain glazing WI=3.75Plain glazing WI=2.0
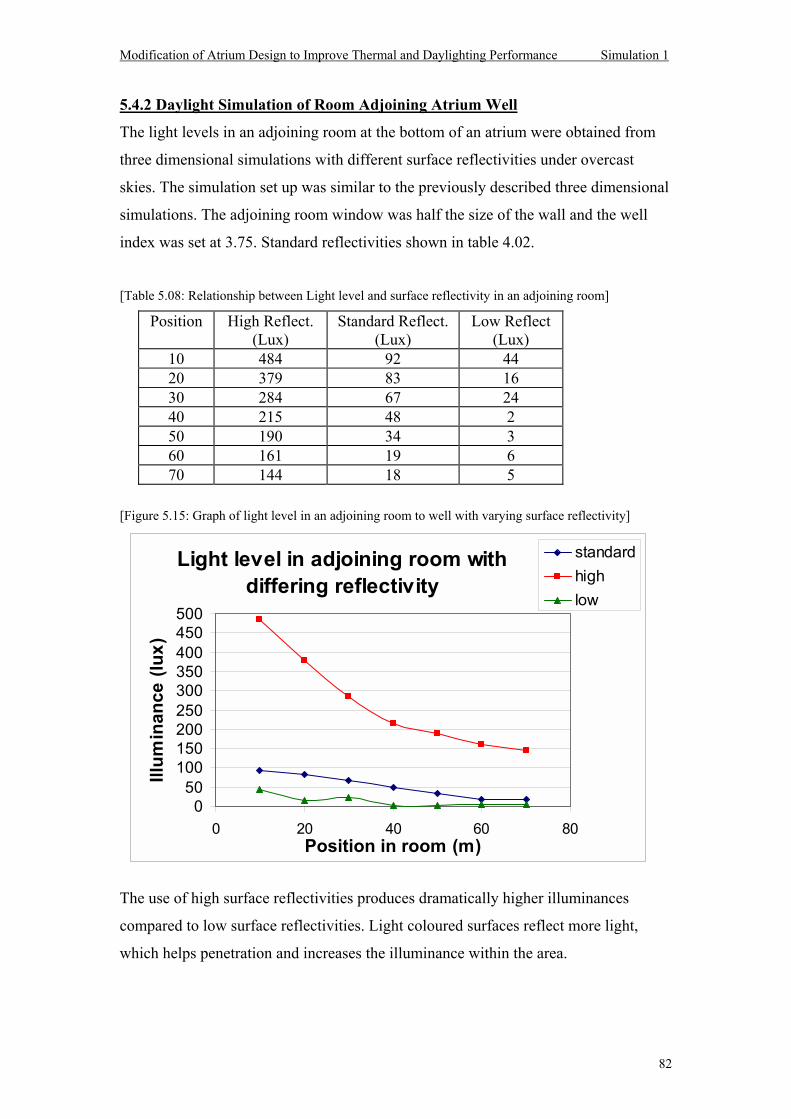
Modification of Atrium Design to Improve Thermal and Daylighting Performance Simulation 1
82
5.4.2 Daylight Simulation of Room Adjoining Atrium Well
The light levels in an adjoining room at the bottom of an atrium were obtained from
three dimensional simulations with different surface reflectivities under overcast
skies. The simulation set up was similar to the previously described three dimensional
simulations. The adjoining room window was half the size of the wall and the well
index was set at 3.75. Standard reflectivities shown in table 4.02.
[Table 5.08: Relationship between Light level and surface reflectivity in an adjoining room]
Position High Reflect. (Lux)
Standard Reflect. (Lux)
Low Reflect (Lux)
10 484 92 44 20 379 83 16 30 284 67 24 40 215 48 2 50 190 34 3 60 161 19 6 70 144 18 5
[Figure 5.15: Graph of light level in an adjoining room to well with varying surface reflectivity]
The use of high surface reflectivities produces dramatically higher illuminances
compared to low surface reflectivities. Light coloured surfaces reflect more light,
which helps penetration and increases the illuminance within the area.
Light level in adjoining room with differing reflectivity
050
100150200250300350400450500
0 20 40 60 80Position in room (m)
Illum
inan
ce (l
ux)
standardhighlow
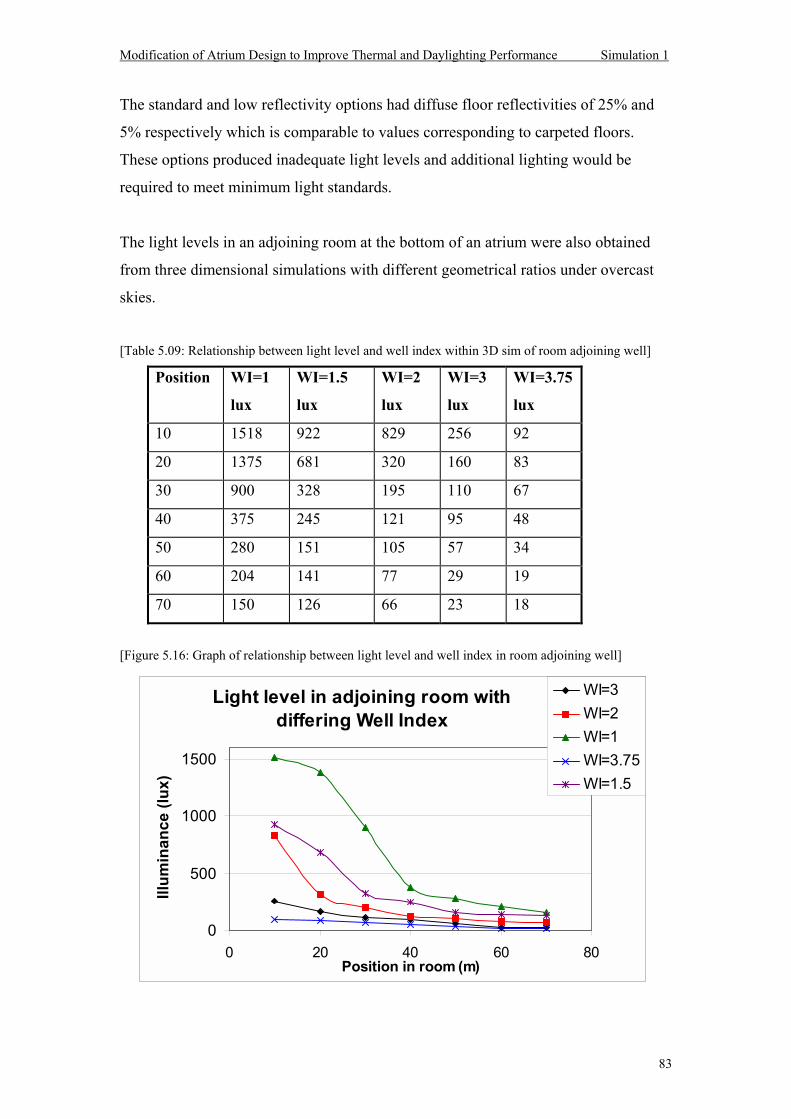
Modification of Atrium Design to Improve Thermal and Daylighting Performance Simulation 1
83
The standard and low reflectivity options had diffuse floor reflectivities of 25% and
5% respectively which is comparable to values corresponding to carpeted floors.
These options produced inadequate light levels and additional lighting would be
required to meet minimum light standards.
The light levels in an adjoining room at the bottom of an atrium were also obtained
from three dimensional simulations with different geometrical ratios under overcast
skies.
[Table 5.09: Relationship between light level and well index within 3D sim of room adjoining well]
Position WI=1
lux
WI=1.5
lux
WI=2
lux
WI=3
lux
WI=3.75
lux
10 1518 922 829 256 92
20 1375 681 320 160 83
30 900 328 195 110 67
40 375 245 121 95 48
50 280 151 105 57 34
60 204 141 77 29 19
70 150 126 66 23 18
[Figure 5.16: Graph of relationship between light level and well index in room adjoining well]
Light level in adjoining room with differing Well Index
0
500
1000
1500
0 20 40 60 80Position in room (m)
Illum
inan
ce (l
ux)
WI=3WI=2WI=1WI=3.75WI=1.5
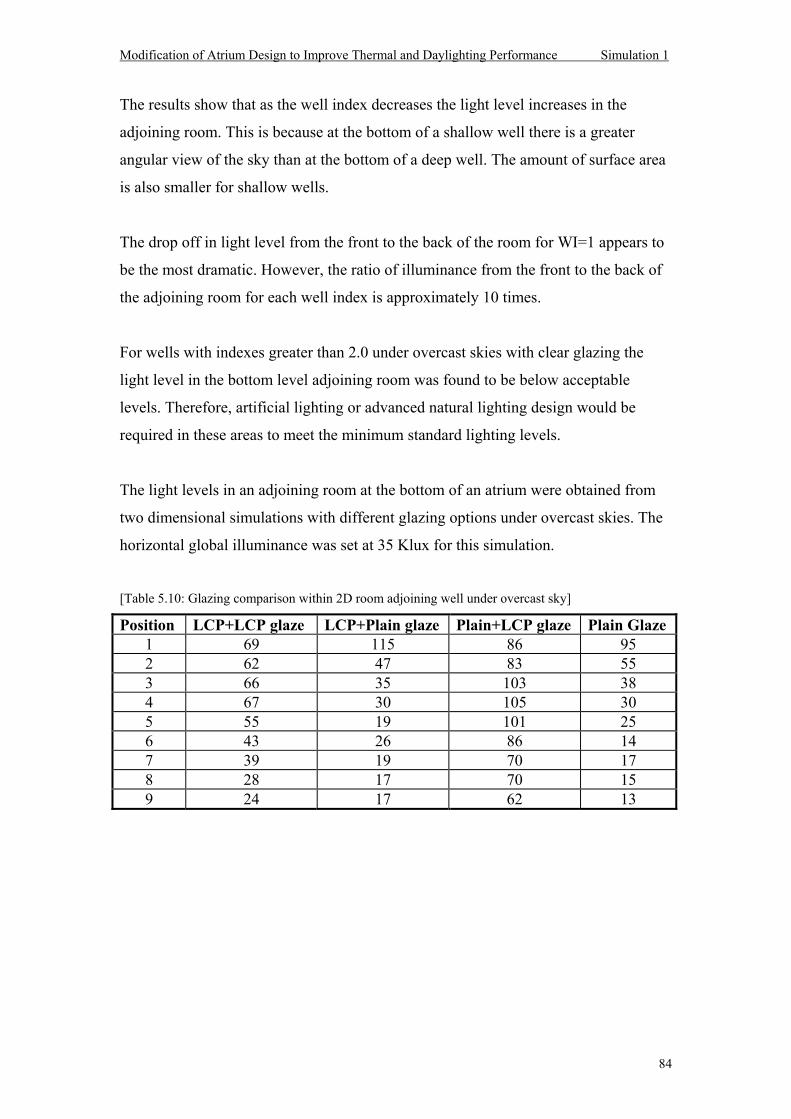
Modification of Atrium Design to Improve Thermal and Daylighting Performance Simulation 1
84
The results show that as the well index decreases the light level increases in the
adjoining room. This is because at the bottom of a shallow well there is a greater
angular view of the sky than at the bottom of a deep well. The amount of surface area
is also smaller for shallow wells.
The drop off in light level from the front to the back of the room for WI=1 appears to
be the most dramatic. However, the ratio of illuminance from the front to the back of
the adjoining room for each well index is approximately 10 times.
For wells with indexes greater than 2.0 under overcast skies with clear glazing the
light level in the bottom level adjoining room was found to be below acceptable
levels. Therefore, artificial lighting or advanced natural lighting design would be
required in these areas to meet the minimum standard lighting levels.
The light levels in an adjoining room at the bottom of an atrium were obtained from
two dimensional simulations with different glazing options under overcast skies. The
horizontal global illuminance was set at 35 Klux for this simulation.
[Table 5.10: Glazing comparison within 2D room adjoining well under overcast sky]
Position LCP+LCP glaze LCP+Plain glaze Plain+LCP glaze Plain Glaze 1 69 115 86 95 2 62 47 83 55 3 66 35 103 38 4 67 30 105 30 5 55 19 101 25 6 43 26 86 14 7 39 19 70 17 8 28 17 70 15 9 24 17 62 13
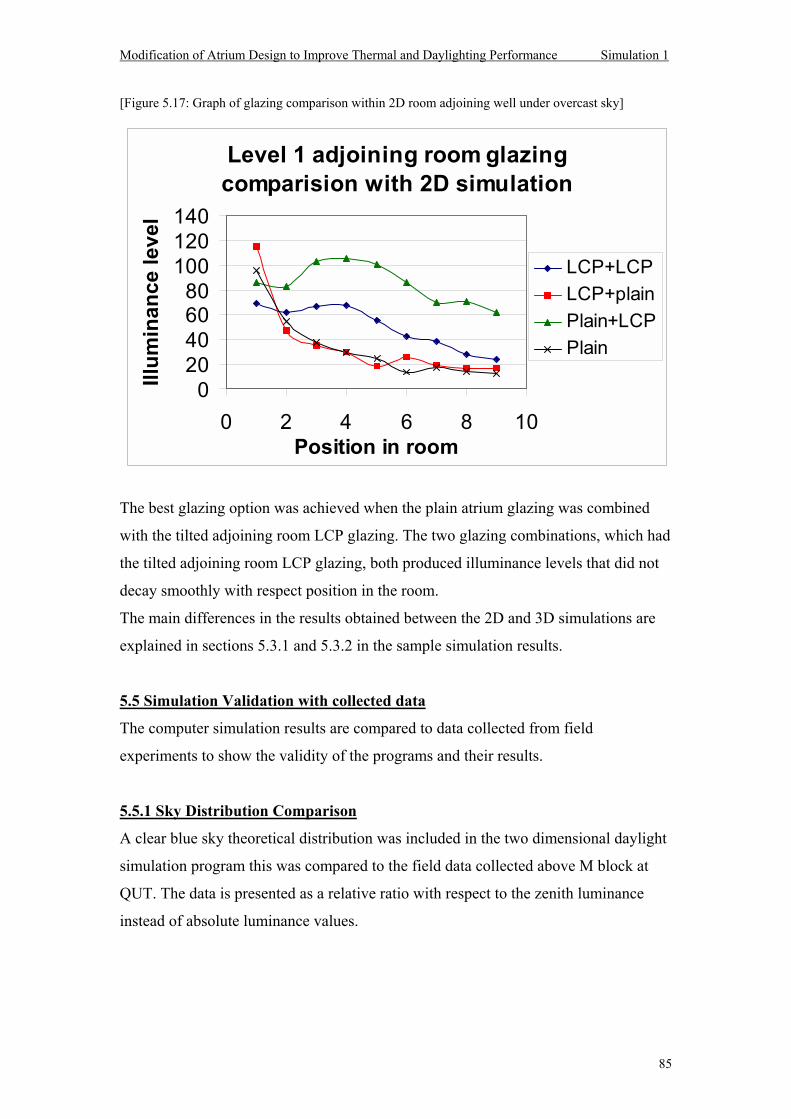
Modification of Atrium Design to Improve Thermal and Daylighting Performance Simulation 1
85
[Figure 5.17: Graph of glazing comparison within 2D room adjoining well under overcast sky]
The best glazing option was achieved when the plain atrium glazing was combined
with the tilted adjoining room LCP glazing. The two glazing combinations, which had
the tilted adjoining room LCP glazing, both produced illuminance levels that did not
decay smoothly with respect position in the room.
The main differences in the results obtained between the 2D and 3D simulations are
explained in sections 5.3.1 and 5.3.2 in the sample simulation results.
5.5 Simulation Validation with collected data
The computer simulation results are compared to data collected from field
experiments to show the validity of the programs and their results.
5.5.1 Sky Distribution Comparison
A clear blue sky theoretical distribution was included in the two dimensional daylight
simulation program this was compared to the field data collected above M block at
QUT. The data is presented as a relative ratio with respect to the zenith luminance
instead of absolute luminance values.
Level 1 adjoining room glazing comparision with 2D simulation
020406080
100120140
0 2 4 6 8 10Position in room
Illum
inan
ce le
vel
LCP+LCPLCP+plainPlain+LCPPlain
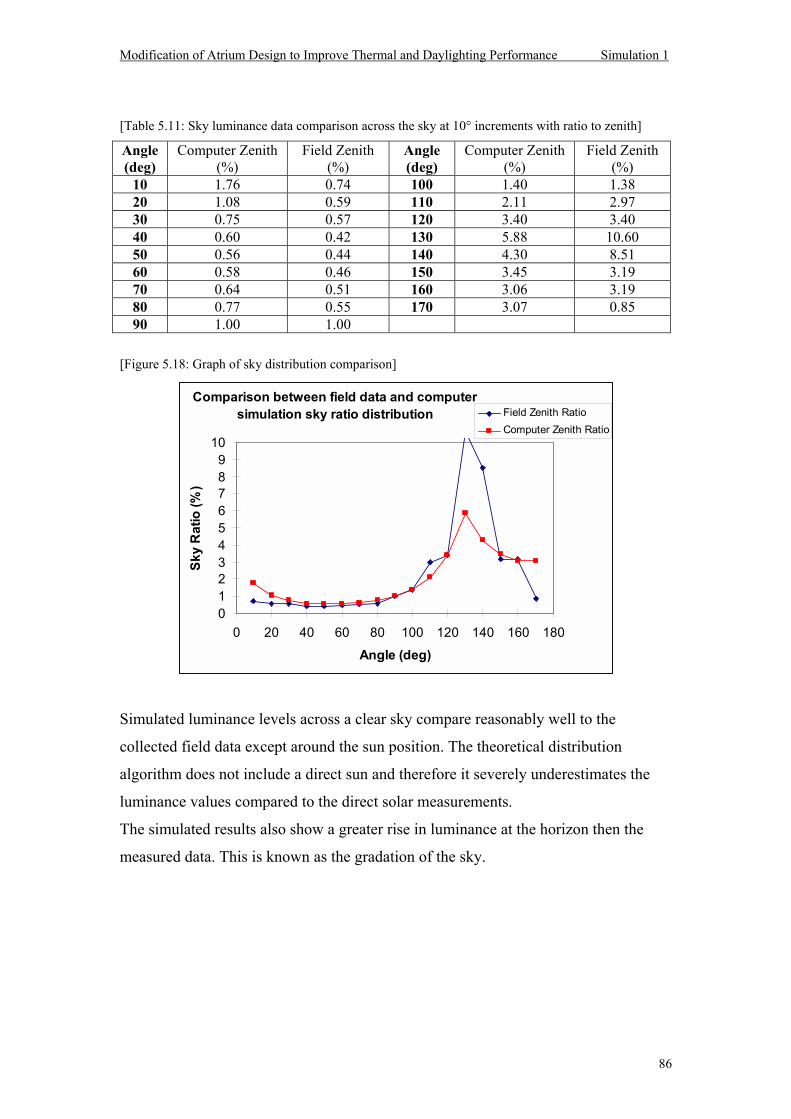
Modification of Atrium Design to Improve Thermal and Daylighting Performance Simulation 1
86
[Table 5.11: Sky luminance data comparison across the sky at 10° increments with ratio to zenith]
Angle (deg)
Computer Zenith (%)
Field Zenith (%)
Angle (deg)
Computer Zenith (%)
Field Zenith (%)
10 1.76 0.74 100 1.40 1.38 20 1.08 0.59 110 2.11 2.97 30 0.75 0.57 120 3.40 3.40 40 0.60 0.42 130 5.88 10.60 50 0.56 0.44 140 4.30 8.51 60 0.58 0.46 150 3.45 3.19 70 0.64 0.51 160 3.06 3.19 80 0.77 0.55 170 3.07 0.85 90 1.00 1.00
[Figure 5.18: Graph of sky distribution comparison]
Simulated luminance levels across a clear sky compare reasonably well to the
collected field data except around the sun position. The theoretical distribution
algorithm does not include a direct sun and therefore it severely underestimates the
luminance values compared to the direct solar measurements.
The simulated results also show a greater rise in luminance at the horizon then the
measured data. This is known as the gradation of the sky.
Comparison between field data and computer simulation sky ratio distribution
0123456789
10
0 20 40 60 80 100 120 140 160 180
Angle (deg)
Sky
Rat
io (%
)
Field Zenith RatioComputer Zenith Ratio
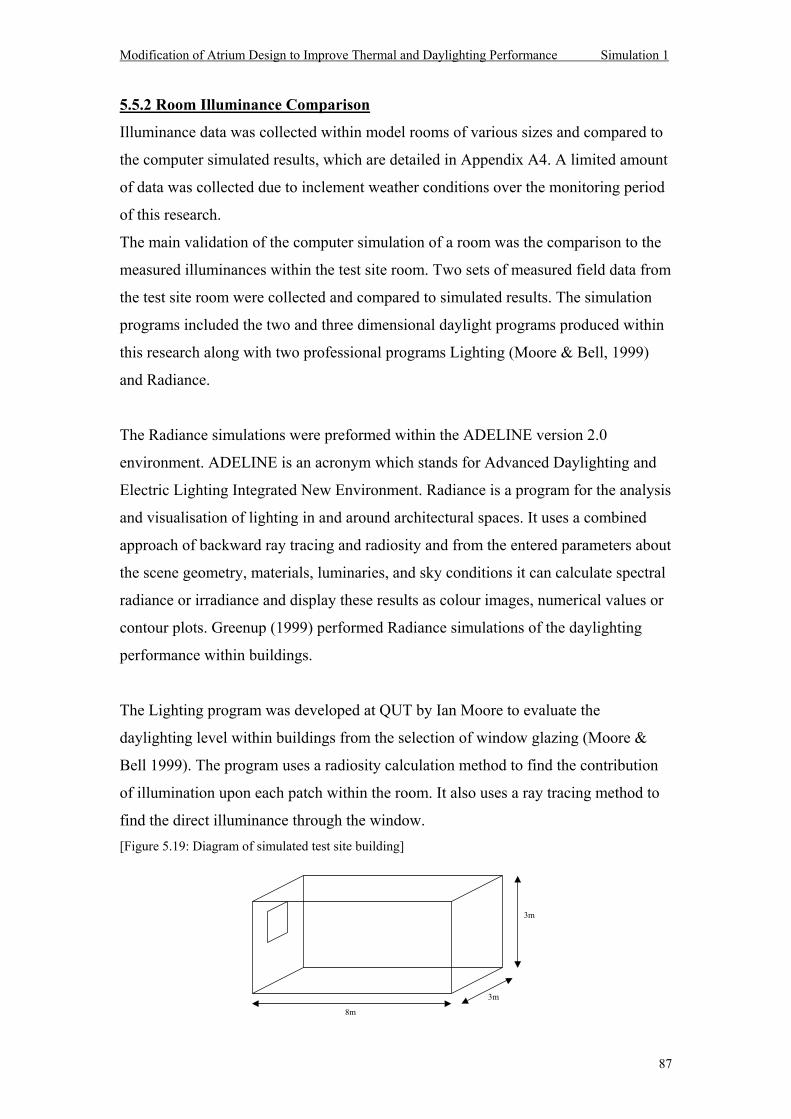
Modification of Atrium Design to Improve Thermal and Daylighting Performance Simulation 1
87
5.5.2 Room Illuminance Comparison
Illuminance data was collected within model rooms of various sizes and compared to
the computer simulated results, which are detailed in Appendix A4. A limited amount
of data was collected due to inclement weather conditions over the monitoring period
of this research.
The main validation of the computer simulation of a room was the comparison to the
measured illuminances within the test site room. Two sets of measured field data from
the test site room were collected and compared to simulated results. The simulation
programs included the two and three dimensional daylight programs produced within
this research along with two professional programs Lighting (Moore & Bell, 1999)
and Radiance.
The Radiance simulations were preformed within the ADELINE version 2.0
environment. ADELINE is an acronym which stands for Advanced Daylighting and
Electric Lighting Integrated New Environment. Radiance is a program for the analysis
and visualisation of lighting in and around architectural spaces. It uses a combined
approach of backward ray tracing and radiosity and from the entered parameters about
the scene geometry, materials, luminaries, and sky conditions it can calculate spectral
radiance or irradiance and display these results as colour images, numerical values or
contour plots. Greenup (1999) performed Radiance simulations of the daylighting
performance within buildings.
The Lighting program was developed at QUT by Ian Moore to evaluate the
daylighting level within buildings from the selection of window glazing (Moore &
Bell 1999). The program uses a radiosity calculation method to find the contribution
of illumination upon each patch within the room. It also uses a ray tracing method to
find the direct illuminance through the window. [Figure 5.19: Diagram of simulated test site building]
8m
3m
3m
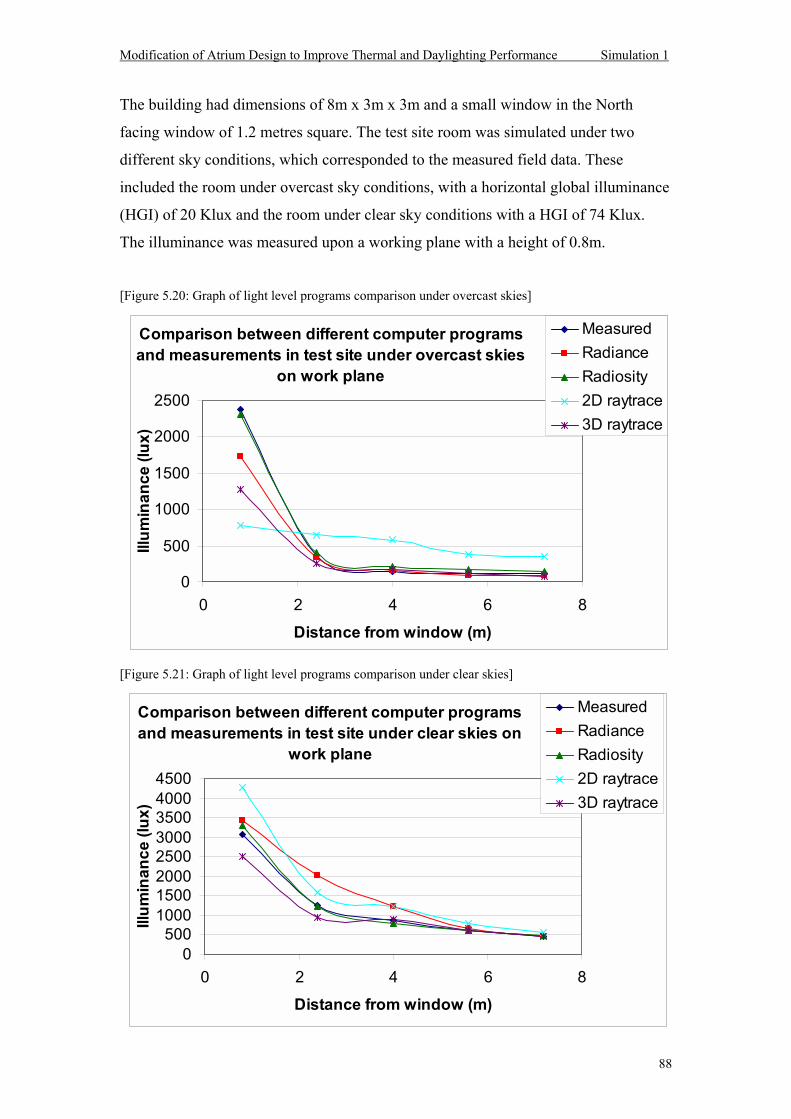
Modification of Atrium Design to Improve Thermal and Daylighting Performance Simulation 1
88
The building had dimensions of 8m x 3m x 3m and a small window in the North
facing window of 1.2 metres square. The test site room was simulated under two
different sky conditions, which corresponded to the measured field data. These
included the room under overcast sky conditions, with a horizontal global illuminance
(HGI) of 20 Klux and the room under clear sky conditions with a HGI of 74 Klux.
The illuminance was measured upon a working plane with a height of 0.8m.
[Figure 5.20: Graph of light level programs comparison under overcast skies]
[Figure 5.21: Graph of light level programs comparison under clear skies]
Comparison between different computer programs and measurements in test site under overcast skies
on work plane
0
500
1000
1500
2000
2500
0 2 4 6 8
Distance from window (m)
Illum
inan
ce (l
ux)
MeasuredRadianceRadiosity2D raytrace3D raytrace
Comparison between different computer programs and measurements in test site under clear skies on
work plane
0500
10001500200025003000350040004500
0 2 4 6 8
Distance from window (m)
Illum
inan
ce (l
ux)
MeasuredRadianceRadiosity2D raytrace3D raytrace
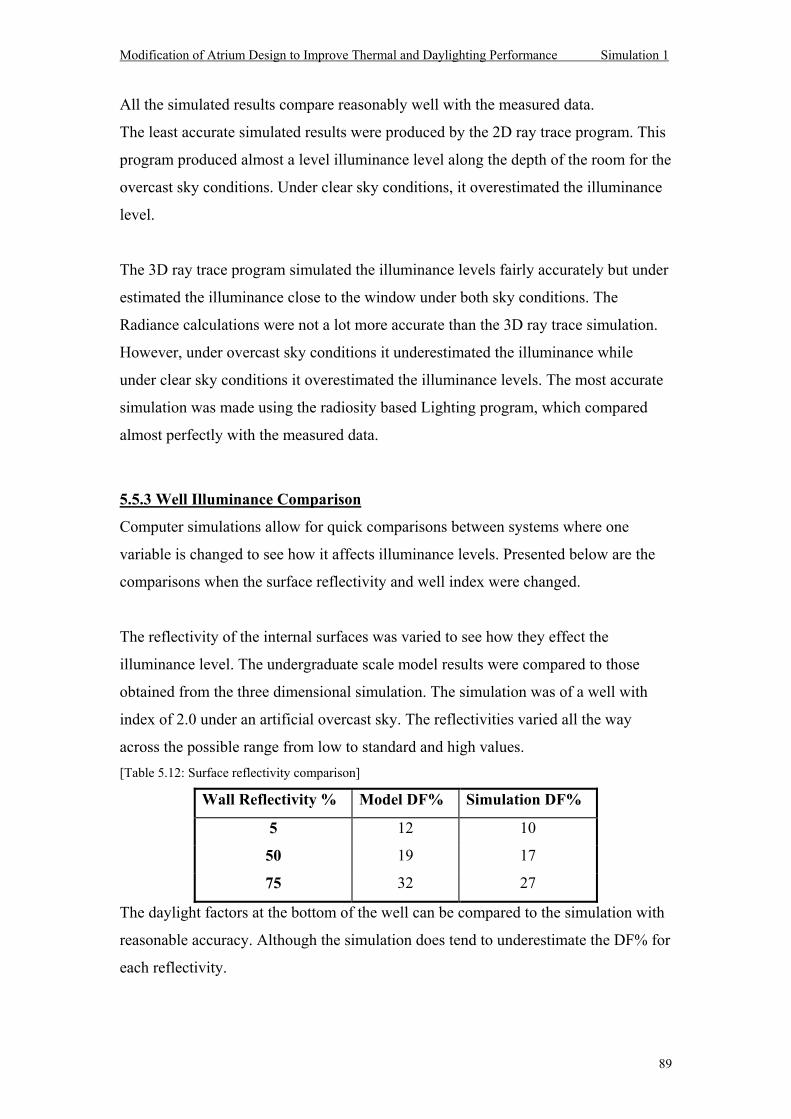
Modification of Atrium Design to Improve Thermal and Daylighting Performance Simulation 1
89
All the simulated results compare reasonably well with the measured data.
The least accurate simulated results were produced by the 2D ray trace program. This
program produced almost a level illuminance level along the depth of the room for the
overcast sky conditions. Under clear sky conditions, it overestimated the illuminance
level.
The 3D ray trace program simulated the illuminance levels fairly accurately but under
estimated the illuminance close to the window under both sky conditions. The
Radiance calculations were not a lot more accurate than the 3D ray trace simulation.
However, under overcast sky conditions it underestimated the illuminance while
under clear sky conditions it overestimated the illuminance levels. The most accurate
simulation was made using the radiosity based Lighting program, which compared
almost perfectly with the measured data.
5.5.3 Well Illuminance Comparison
Computer simulations allow for quick comparisons between systems where one
variable is changed to see how it affects illuminance levels. Presented below are the
comparisons when the surface reflectivity and well index were changed.
The reflectivity of the internal surfaces was varied to see how they effect the
illuminance level. The undergraduate scale model results were compared to those
obtained from the three dimensional simulation. The simulation was of a well with
index of 2.0 under an artificial overcast sky. The reflectivities varied all the way
across the possible range from low to standard and high values. [Table 5.12: Surface reflectivity comparison]
Wall Reflectivity % Model DF% Simulation DF%
5 12 10
50 19 17
75 32 27
The daylight factors at the bottom of the well can be compared to the simulation with
reasonable accuracy. Although the simulation does tend to underestimate the DF% for
each reflectivity.
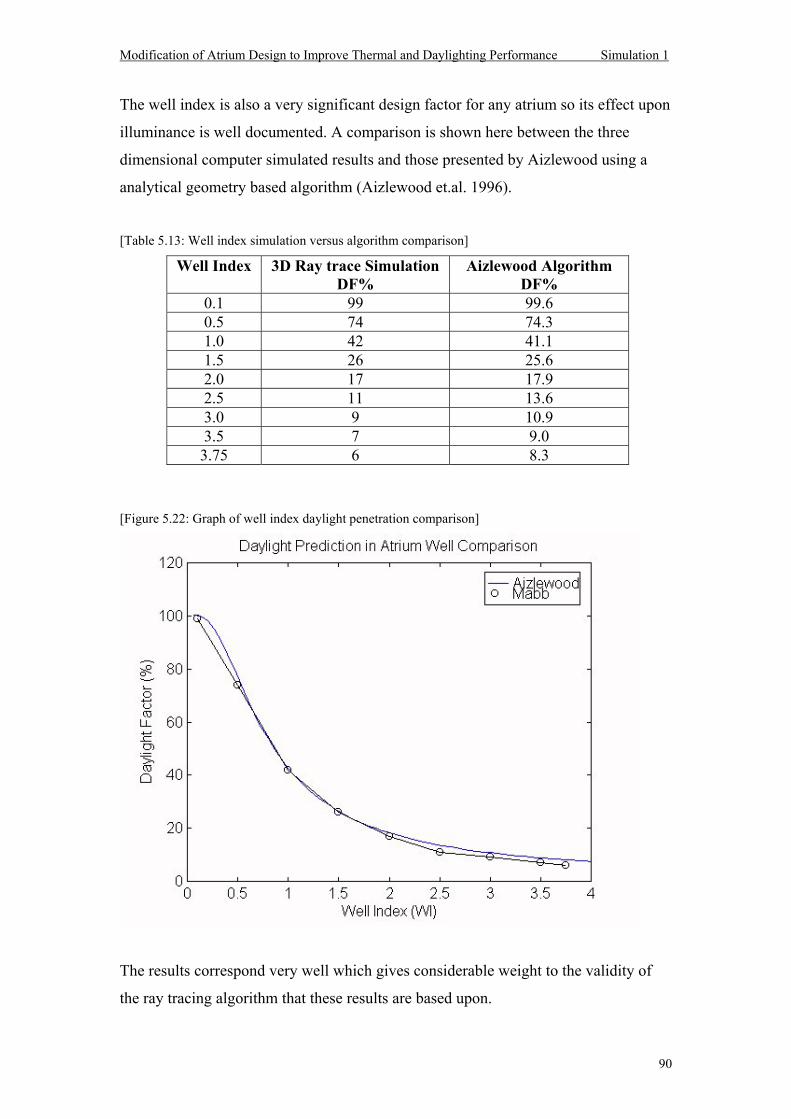
Modification of Atrium Design to Improve Thermal and Daylighting Performance Simulation 1
90
The well index is also a very significant design factor for any atrium so its effect upon
illuminance is well documented. A comparison is shown here between the three
dimensional computer simulated results and those presented by Aizlewood using a
analytical geometry based algorithm (Aizlewood et.al. 1996).
[Table 5.13: Well index simulation versus algorithm comparison]
Well Index 3D Ray trace Simulation DF%
Aizlewood Algorithm DF%
0.1 99 99.6 0.5 74 74.3 1.0 42 41.1 1.5 26 25.6 2.0 17 17.9 2.5 11 13.6 3.0 9 10.9 3.5 7 9.0 3.75 6 8.3
[Figure 5.22: Graph of well index daylight penetration comparison]
The results correspond very well which gives considerable weight to the validity of
the ray tracing algorithm that these results are based upon.
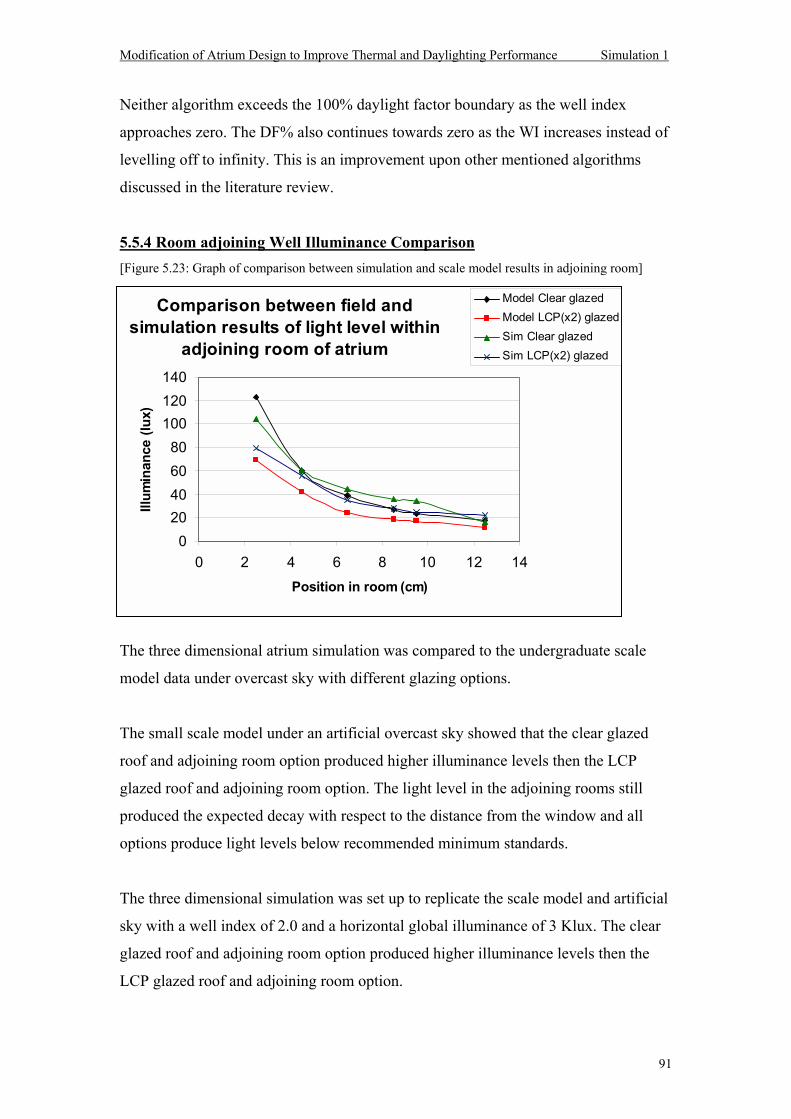
Modification of Atrium Design to Improve Thermal and Daylighting Performance Simulation 1
91
Neither algorithm exceeds the 100% daylight factor boundary as the well index
approaches zero. The DF% also continues towards zero as the WI increases instead of
levelling off to infinity. This is an improvement upon other mentioned algorithms
discussed in the literature review.
5.5.4 Room adjoining Well Illuminance Comparison [Figure 5.23: Graph of comparison between simulation and scale model results in adjoining room]
The three dimensional atrium simulation was compared to the undergraduate scale
model data under overcast sky with different glazing options.
The small scale model under an artificial overcast sky showed that the clear glazed
roof and adjoining room option produced higher illuminance levels then the LCP
glazed roof and adjoining room option. The light level in the adjoining rooms still
produced the expected decay with respect to the distance from the window and all
options produce light levels below recommended minimum standards.
The three dimensional simulation was set up to replicate the scale model and artificial
sky with a well index of 2.0 and a horizontal global illuminance of 3 Klux. The clear
glazed roof and adjoining room option produced higher illuminance levels then the
LCP glazed roof and adjoining room option.
Comparison between field and simulation results of light level within
adjoining room of atrium
020406080
100120140
0 2 4 6 8 10 12 14Position in room (cm)
Illum
inan
ce (l
ux)
Model Clear glazedModel LCP(x2) glazedSim Clear glazedSim LCP(x2) glazed
Modification of Atrium Design to Improve Thermal and Daylighting Performance Simulation 1
92
The light level in the adjoining rooms still produced the expected decay with respect
to the distance from the window and all options produce light levels below
recommended minimum standards.
The three dimensional simulation was found to have a very good correlation between
the simulation and the scale model though the simulation generally overestimated the
light levels.
Overall, the three dimensional daylight penetration simulation has proven to be
reasonably accurate with respect to the collected experimental data. The program was
compared to full scale field data, scale model experimental data and previously
established theoretical models. It has shown to be adequate in producing realistic
illuminance levels under a range of building and environmental conditions.
Modification of Atrium Design to Improve Thermal and Daylighting Performance Simulation 2
93
Chapter 6: THERMAL SIMULATION
6.1 Introduction
The thermal computer simulation program was created as part of this research to
predict the thermal performance within the model atrium wells.
The modifications to the building parameters that can be varied within the program
include the glazing, the geometrical ratios and the surface reflectivities of the well.
The thermal simulation was initially produced to investigate the radiative heat gain
and loss. This was designed and developed as a learning tool. Later the simulation
was improved to include the convection and conduction losses, which made the
program more realistic.
The thermal simulation program includes two different algorithms for the different
glazing types and two different sources of input data. The program Therm4 and
Therm5 simulated two atrium wells to find the average zonal temperature in each.
Each well had different glazing. The external environmental temperatures could be
entered in from collected field and test reference year (TRY) data. The program used
geometrical fraction transmitted to find the heat transfer input and only investigated
the radiation heat transfer output.
The program Therm59.m simulated two atrium wells to find the average zonal
temperature in each. Each well had different glazing. The external environmental
temperatures could be entered in from collected field and TRY data. The program
used experimental relative transmittance equation to find the heat transfer input and
investigated the convection, conduction and radiation heat transfer process to find the
thermal output.
The simulations should show that with the inclusion of the modified angular selective
glazing upon the atrium well that the temperature would be more consistent across the
day and lower in the middle of the day when the solar altitude was high compared to
normal clear glazing. It should be able to predict the temperature within the atrium
well at any hour of the day during the year. The analysis of the simulation results will
be discussed in Chapter 8.
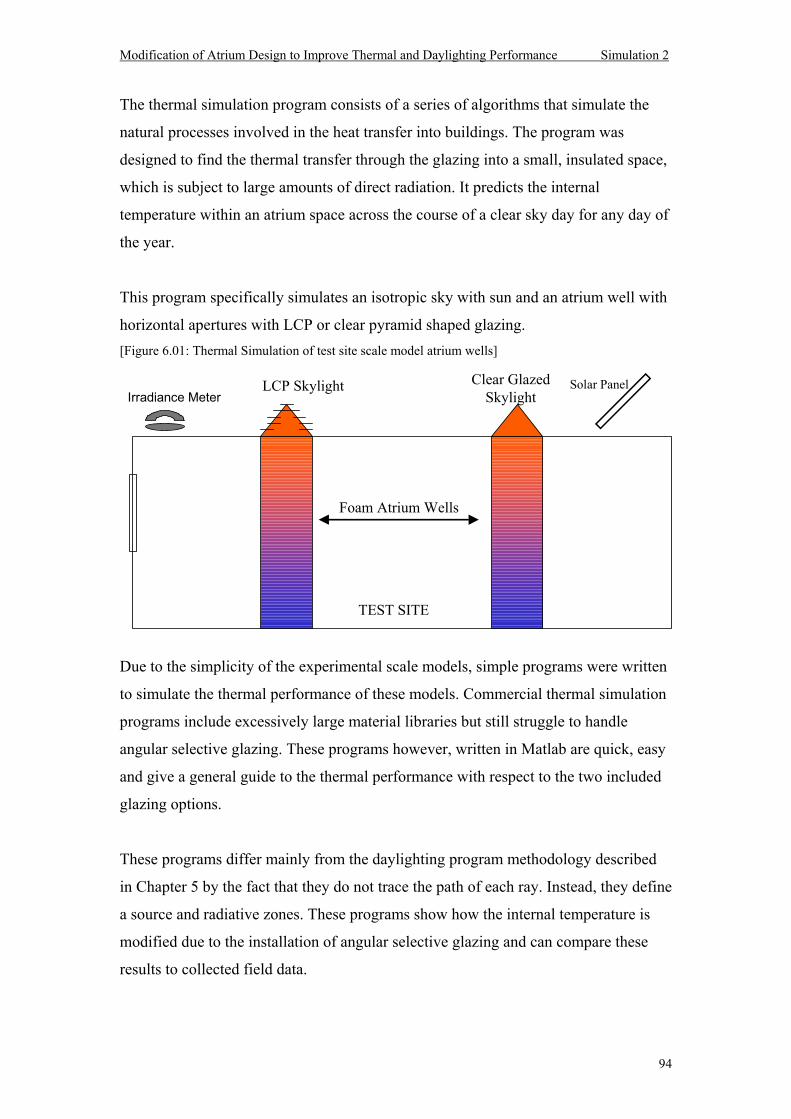
Modification of Atrium Design to Improve Thermal and Daylighting Performance Simulation 2
94
The thermal simulation program consists of a series of algorithms that simulate the
natural processes involved in the heat transfer into buildings. The program was
designed to find the thermal transfer through the glazing into a small, insulated space,
which is subject to large amounts of direct radiation. It predicts the internal
temperature within an atrium space across the course of a clear sky day for any day of
the year.
This program specifically simulates an isotropic sky with sun and an atrium well with
horizontal apertures with LCP or clear pyramid shaped glazing. [Figure 6.01: Thermal Simulation of test site scale model atrium wells]
Due to the simplicity of the experimental scale models, simple programs were written
to simulate the thermal performance of these models. Commercial thermal simulation
programs include excessively large material libraries but still struggle to handle
angular selective glazing. These programs however, written in Matlab are quick, easy
and give a general guide to the thermal performance with respect to the two included
glazing options.
These programs differ mainly from the daylighting program methodology described
in Chapter 5 by the fact that they do not trace the path of each ray. Instead, they define
a source and radiative zones. These programs show how the internal temperature is
modified due to the installation of angular selective glazing and can compare these
results to collected field data.
Irradiance MeterClear Glazed
Skylight
Foam Atrium Wells
Solar Panel
TEST SITE
LCP Skylight
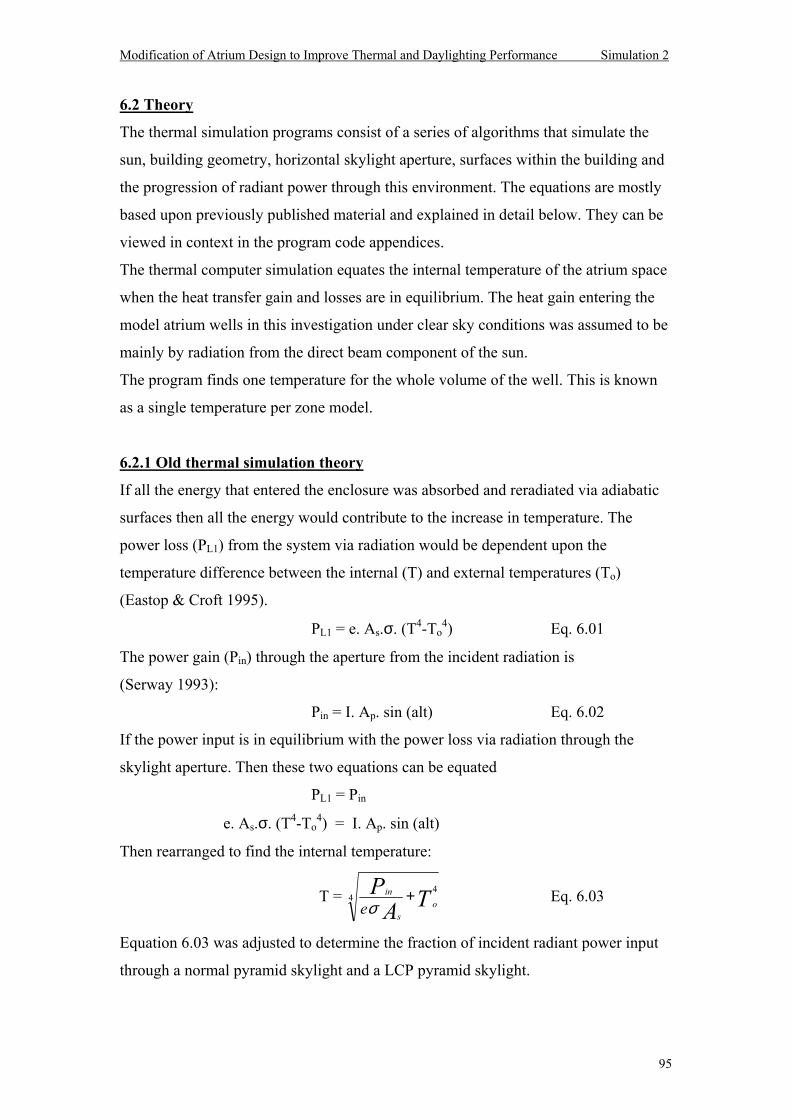
Modification of Atrium Design to Improve Thermal and Daylighting Performance Simulation 2
95
6.2 Theory
The thermal simulation programs consist of a series of algorithms that simulate the
sun, building geometry, horizontal skylight aperture, surfaces within the building and
the progression of radiant power through this environment. The equations are mostly
based upon previously published material and explained in detail below. They can be
viewed in context in the program code appendices.
The thermal computer simulation equates the internal temperature of the atrium space
when the heat transfer gain and losses are in equilibrium. The heat gain entering the
model atrium wells in this investigation under clear sky conditions was assumed to be
mainly by radiation from the direct beam component of the sun.
The program finds one temperature for the whole volume of the well. This is known
as a single temperature per zone model.
6.2.1 Old thermal simulation theory
If all the energy that entered the enclosure was absorbed and reradiated via adiabatic
surfaces then all the energy would contribute to the increase in temperature. The
power loss (PL1) from the system via radiation would be dependent upon the
temperature difference between the internal (T) and external temperatures (To)
(Eastop & Croft 1995).
PL1 = e. As.σ. (T4-To4) Eq. 6.01
The power gain (Pin) through the aperture from the incident radiation is
(Serway 1993):
Pin = I. Ap. sin (alt) Eq. 6.02
If the power input is in equilibrium with the power loss via radiation through the
skylight aperture. Then these two equations can be equated
PL1 = Pin
e. As.σ. (T4-To4) = I. Ap. sin (alt)
Then rearranged to find the internal temperature:
T = 44TA
Po
s
in
e+
σ Eq. 6.03
Equation 6.03 was adjusted to determine the fraction of incident radiant power input
through a normal pyramid skylight and a LCP pyramid skylight.
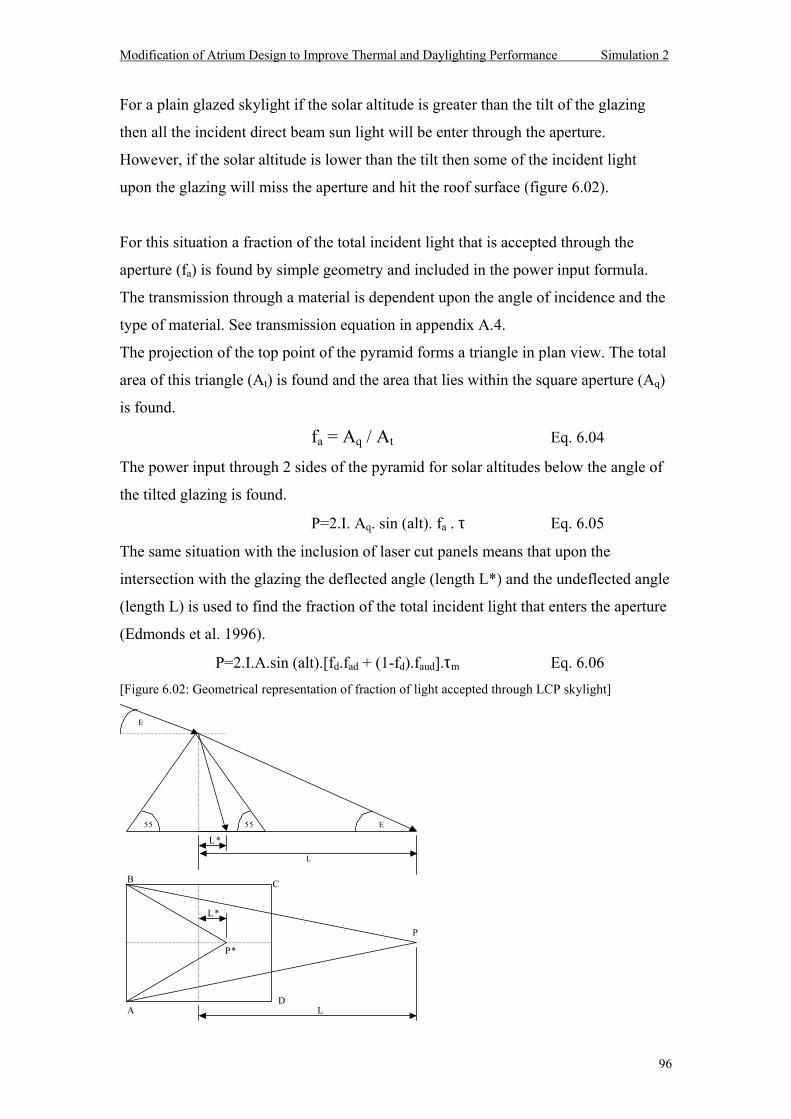
Modification of Atrium Design to Improve Thermal and Daylighting Performance Simulation 2
96
For a plain glazed skylight if the solar altitude is greater than the tilt of the glazing
then all the incident direct beam sun light will be enter through the aperture.
However, if the solar altitude is lower than the tilt then some of the incident light
upon the glazing will miss the aperture and hit the roof surface (figure 6.02).
For this situation a fraction of the total incident light that is accepted through the
aperture (fa) is found by simple geometry and included in the power input formula.
The transmission through a material is dependent upon the angle of incidence and the
type of material. See transmission equation in appendix A.4.
The projection of the top point of the pyramid forms a triangle in plan view. The total
area of this triangle (At) is found and the area that lies within the square aperture (Aq)
is found.
fa = Aq / At Eq. 6.04
The power input through 2 sides of the pyramid for solar altitudes below the angle of
the tilted glazing is found.
P=2.I. Aq. sin (alt). fa . τ Eq. 6.05
The same situation with the inclusion of laser cut panels means that upon the
intersection with the glazing the deflected angle (length L*) and the undeflected angle
(length L) is used to find the fraction of the total incident light that enters the aperture
(Edmonds et al. 1996).
P=2.I.A.sin (alt).[fd.fad + (1-fd).faud].τm Eq. 6.06 [Figure 6.02: Geometrical representation of fraction of light accepted through LCP skylight]
55
E
E55
L
L
L*
P*
P
B
A
C
D
L*
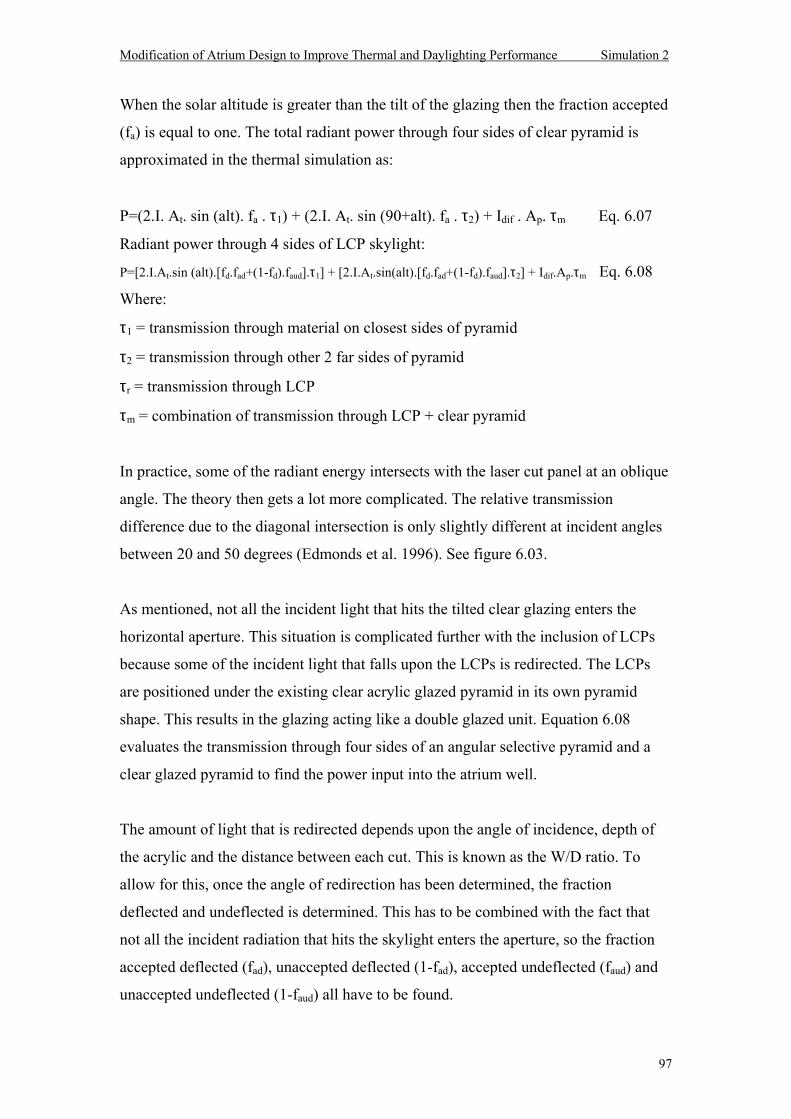
Modification of Atrium Design to Improve Thermal and Daylighting Performance Simulation 2
97
When the solar altitude is greater than the tilt of the glazing then the fraction accepted
(fa) is equal to one. The total radiant power through four sides of clear pyramid is
approximated in the thermal simulation as:
P=(2.I. At. sin (alt). fa . τ1) + (2.I. At. sin (90+alt). fa . τ2) + Idif . Ap. τm Eq. 6.07
Radiant power through 4 sides of LCP skylight:
P=[2.I.At.sin (alt).[fd.fad+(1-fd).faud].τ1] + [2.I.At.sin(alt).[fd.fad+(1-fd).faud].τ2] + Idif.Ap.τm Eq. 6.08
Where:
τ1 = transmission through material on closest sides of pyramid
τ2 = transmission through other 2 far sides of pyramid
τr = transmission through LCP
τm = combination of transmission through LCP + clear pyramid
In practice, some of the radiant energy intersects with the laser cut panel at an oblique
angle. The theory then gets a lot more complicated. The relative transmission
difference due to the diagonal intersection is only slightly different at incident angles
between 20 and 50 degrees (Edmonds et al. 1996). See figure 6.03.
As mentioned, not all the incident light that hits the tilted clear glazing enters the
horizontal aperture. This situation is complicated further with the inclusion of LCPs
because some of the incident light that falls upon the LCPs is redirected. The LCPs
are positioned under the existing clear acrylic glazed pyramid in its own pyramid
shape. This results in the glazing acting like a double glazed unit. Equation 6.08
evaluates the transmission through four sides of an angular selective pyramid and a
clear glazed pyramid to find the power input into the atrium well.
The amount of light that is redirected depends upon the angle of incidence, depth of
the acrylic and the distance between each cut. This is known as the W/D ratio. To
allow for this, once the angle of redirection has been determined, the fraction
deflected and undeflected is determined. This has to be combined with the fact that
not all the incident radiation that hits the skylight enters the aperture, so the fraction
accepted deflected (fad), unaccepted deflected (1-fad), accepted undeflected (faud) and
unaccepted undeflected (1-faud) all have to be found.
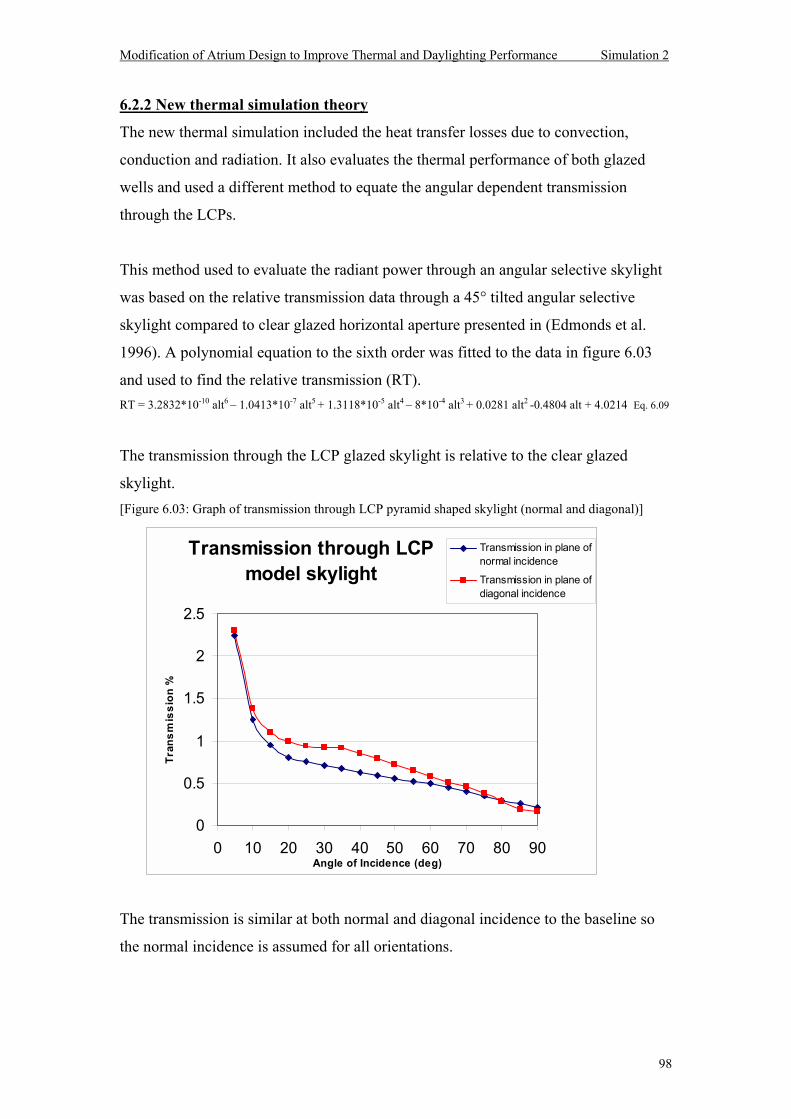
Modification of Atrium Design to Improve Thermal and Daylighting Performance Simulation 2
98
6.2.2 New thermal simulation theory
The new thermal simulation included the heat transfer losses due to convection,
conduction and radiation. It also evaluates the thermal performance of both glazed
wells and used a different method to equate the angular dependent transmission
through the LCPs.
This method used to evaluate the radiant power through an angular selective skylight
was based on the relative transmission data through a 45° tilted angular selective
skylight compared to clear glazed horizontal aperture presented in (Edmonds et al.
1996). A polynomial equation to the sixth order was fitted to the data in figure 6.03
and used to find the relative transmission (RT). RT = 3.2832*10-10 alt6 1.0413*10-7 alt5 + 1.3118*10-5 alt4 8*10-4 alt3 + 0.0281 alt2 -0.4804 alt + 4.0214 Eq. 6.09
The transmission through the LCP glazed skylight is relative to the clear glazed
skylight. [Figure 6.03: Graph of transmission through LCP pyramid shaped skylight (normal and diagonal)]
The transmission is similar at both normal and diagonal incidence to the baseline so
the normal incidence is assumed for all orientations.
Transmission through LCP model skylight
0
0.5
1
1.5
2
2.5
0 10 20 30 40 50 60 70 80 90Angle of Incidence (deg)
Tran
smis
sion
%
Transmission in plane ofnormal incidence
Transmission in plane ofdiagonal incidence
Modification of Atrium Design to Improve Thermal and Daylighting Performance Simulation 2
99
The new simulation constructed finds the heat loss via conduction, convection and
radiation and equates it to the heat gain via radiation.
Pin = PL1 + PL2 + PL3 Eq. 6.10
An incremented test internal temperature is substituted into the equation and increased
until the heat loss and gain reaches equilibrium. At this equilibrium point, the tested
temperature is the predicted internal temperature.
0 = Pin (PL1 + PL2 + PL3) Eq. 6.11
[Figure 6.04 Diagram of atrium well with basic heat flow directions]
H o tterA ir
C o lderA ir
C on duc tion / C on vec tion L oss
C o nv ec tion L o ss
R ad ia tio n L oss
R ad ian t H ea t G a in
The heat transfer loss via radiation is equated for the glazed aperture and is equal to
Power Loss1 = Qrad = e. As. σ. (Tg4-To
4) Eq. 6.12
Where σ is the Stefan-Boltzmann thermal conductivity constant 5.67 x 10⁻⁸ W/m2.K4
The emissivity of glass, e, is equal to 0.85.
The surface area of the atrium dome aperture As is found by finding the hypotenuse of
one side of the pyramid dome, which is 5.05.0 22 + .
The area of one triangular side is found At = 2baseheight × which is multiplied by the
number of sides. As = 1.4 m2 = 42
15.05.0 22
××+
Eq. 6.13
Modification of Atrium Design to Improve Thermal and Daylighting Performance Simulation 2
100
The heat transfer via conduction is equated for all the surface area of the atrium well
and is equal to:
Power Loss2 = Qcond = k. Aa. (T- To) / L Eq. 6.14
Where the thermal conductivity of the foam atrium walls (k) = 0.033 W/m.K
The surface area of the foam walls Aa = 0.8x3x4 = 9.6 m2
The depth of the foam walls L = 0.05 m
The heat transfer loss via convection is equated for the glazed aperture and is equal to:
Power Loss3 = Qconv = hc. As. (Tg - To) Eq. 6.15
The loss due to the convection is complicated because it depends upon the properties
of the fluid and the interaction with the boundary surface.
The surface area of the atrium dome aperture As is the same as equation 6.13.
The basic heat transfer model that this simulation is based upon is diagrammed in
figure 6.04. It includes heat gain via radiation only and heat loss via conduction,
radiation and convection. The convection loss through the glazing is considered to be
a loss of heat through an inclined plane via laminar flowing fluid.
The temperature difference in the convection and radiation equations is found from
the difference between the glazing temperature (Tg) and the external temperature (To).
The glazing temperature in the clear glazed normal atrium is taken as being the same
as the internal temperature (Tin). Tg = Tin
However, the glazing temperature in the LCP glazed atrium is taken as Tg = 2
oin TT +
Therefore, Tg is half way between the internal and external temperatures because the
LCP glazing actually consisted of a clear glazed shell and laser cut panels.
The heat transfer coefficient due to convection, hc, is expressed non-dimensionally as
the Nusselt number, Nu = hc.x/k, where x is the length dimension and k is the thermal
conductivity of the fluid.
Rearranged, xkNu
hc×= Eq. 6.16
The Nusselt number is dependent upon the orientation of the surface and the type of
flow. The Nusselt number can be found for one of the following situations.
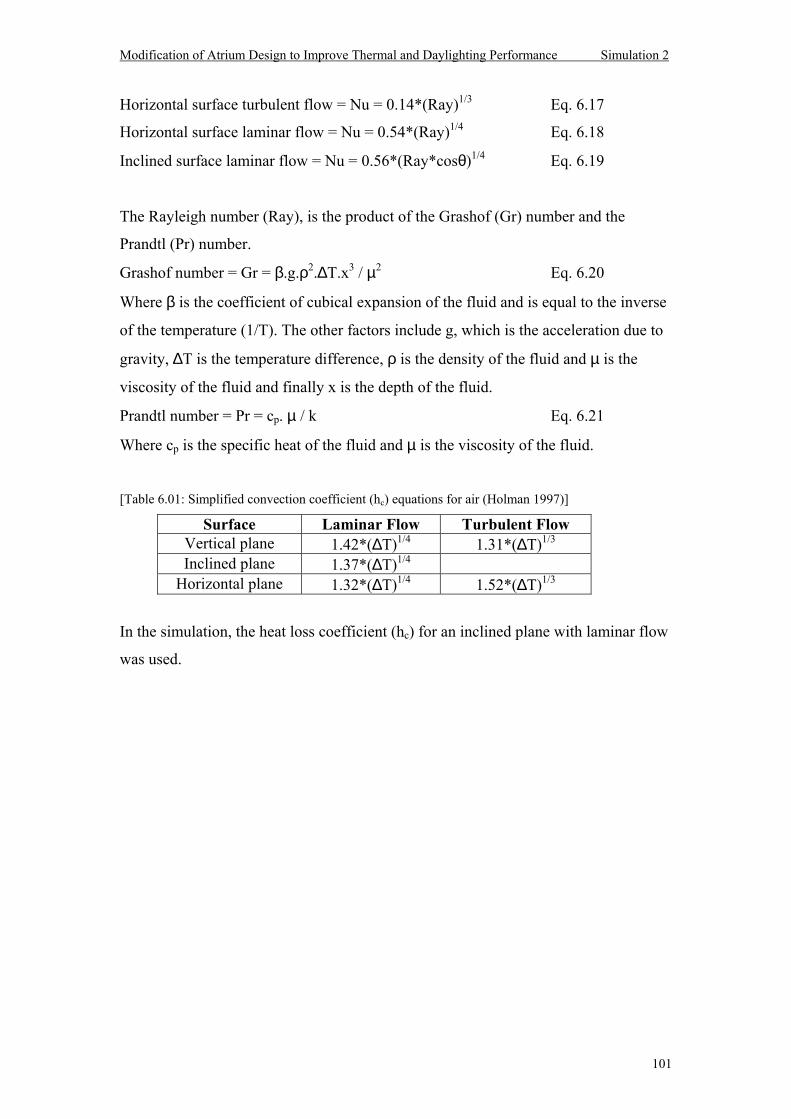
Modification of Atrium Design to Improve Thermal and Daylighting Performance Simulation 2
101
Horizontal surface turbulent flow = Nu = 0.14*(Ray)1/3 Eq. 6.17
Horizontal surface laminar flow = Nu = 0.54*(Ray)1/4 Eq. 6.18
Inclined surface laminar flow = Nu = 0.56*(Ray*cosθ)1/4 Eq. 6.19
The Rayleigh number (Ray), is the product of the Grashof (Gr) number and the
Prandtl (Pr) number.
Grashof number = Gr = β.g.ρ2.∆T.x3 / µ2 Eq. 6.20
Where β is the coefficient of cubical expansion of the fluid and is equal to the inverse
of the temperature (1/T). The other factors include g, which is the acceleration due to
gravity, ∆T is the temperature difference, ρ is the density of the fluid and µ is the
viscosity of the fluid and finally x is the depth of the fluid.
Prandtl number = Pr = cp. µ / k Eq. 6.21
Where cp is the specific heat of the fluid and µ is the viscosity of the fluid.
[Table 6.01: Simplified convection coefficient (hc) equations for air (Holman 1997)]
Surface Laminar Flow Turbulent Flow Vertical plane 1.42*(∆T)1/4 1.31*(∆T)1/3 Inclined plane 1.37*(∆T)1/4
Horizontal plane 1.32*(∆T)1/4 1.52*(∆T)1/3
In the simulation, the heat loss coefficient (hc) for an inclined plane with laminar flow
was used.
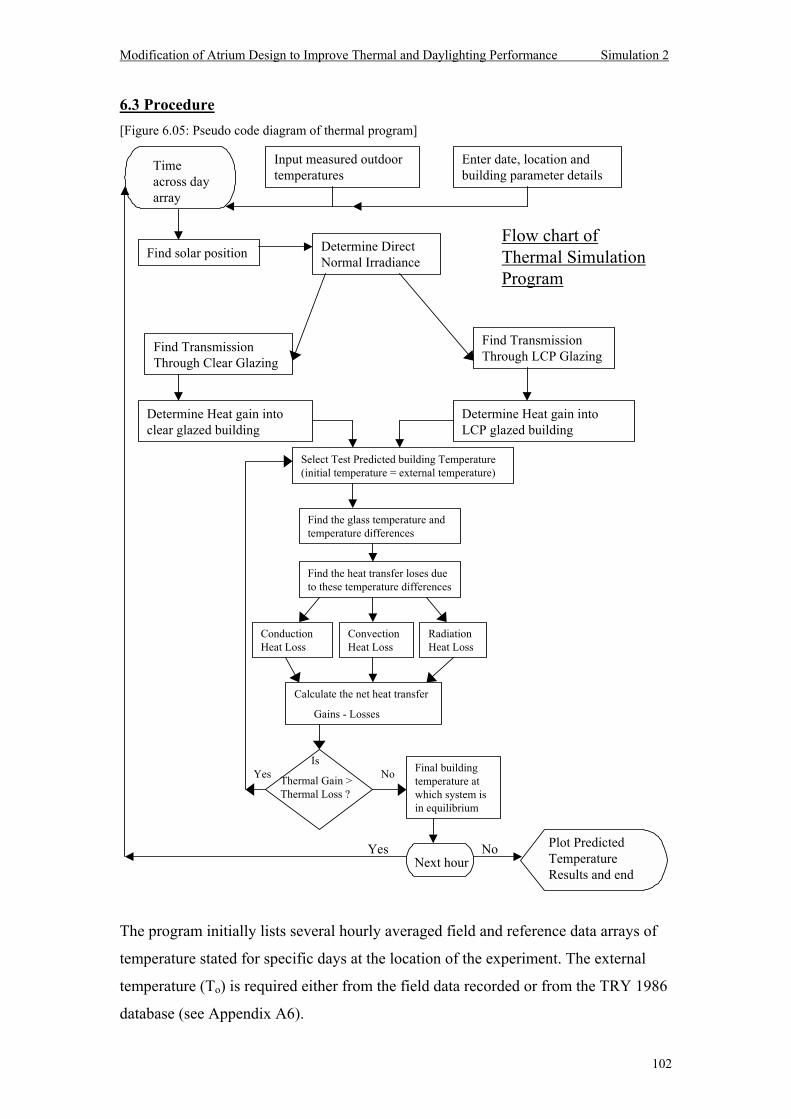
Modification of Atrium Design to Improve Thermal and Daylighting Performance Simulation 2
102
6.3 Procedure [Figure 6.05: Pseudo code diagram of thermal program]
The program initially lists several hourly averaged field and reference data arrays of
temperature stated for specific days at the location of the experiment. The external
temperature (To) is required either from the field data recorded or from the TRY 1986
database (see Appendix A6).
Timeacross dayarray
Input measured outdoortemperatures
Enter date, location andbuilding parameter details
Find solar position Determine DirectNormal Irradiance
Find TransmissionThrough Clear Glazing
Find TransmissionThrough LCP Glazing
Determine Heat gain intoclear glazed building
Plot PredictedTemperatureResults and end
Determine Heat gain intoLCP glazed building
Flow chart ofThermal SimulationProgram
Next hourNoYes
Yes Is
Thermal Gain >Thermal Loss ?
Final buildingtemperature atwhich system isin equilibrium
No
Select Test Predicted building Temperature(initial temperature = external temperature)
Find the glass temperature andtemperature differences
Find the heat transfer loses dueto these temperature differences
Calculate the net heat transfer
Gains - Losses
ConductionHeat Loss
ConvectionHeat Loss
RadiationHeat Loss
Modification of Atrium Design to Improve Thermal and Daylighting Performance Simulation 2
103
The atrium well measured field data temperatures are included as a comparison to see
if the predicted temperature lies between the upper and lower temperature boundaries.
An hour array across the day from 700 hours to 1700 hours is initiated for which all
other variables will be calculated.
The simulation finds the position of the sun (azimuth and altitude) with respect to the
declination, latitude, Julian date and time of day (See section 4.3). The zenith angle of
the sun, which is the complement of the altitude, is also found. The optical air mass
equation 4.07 is used to determine the direct normal irradiance (4.06) incident upon
the glazing aperture. The theoretical irradiance values are used instead of the field
data to eliminate inaccurate values recorded at solar altitudes below 10°.
The simulation is only valid for clear sky days, which are simulated using an
isotropic/direct sky distribution.
Two different methods were used to determine the transmission through the glazing.
The old simulation equated the fraction transmitted through the glazing based upon
the Fresnel transmission equation 4.28 and the fraction of power transmitted equations
(6.04 - 6.08) through either the clear glazed or both the LCP and clear glazed
pyramid.
The other method used to determine the transmission through the atrium well glazing
was to use a polynomial fit to the experimental relative transmittance through a scale
model pyramid data instead of using the trigonometric geometry of the pyramid
shaped glazing (shown above). Two data sets of relative transmittance were
investigated for incident radiation normal to the pyramid baseline and diagonal to the
pyramid baseline. The polynomial fits to this data are shown in equation 6.09
Edmonds (1996).
The power of the incident radiation through the aperture is based upon the standard
formula in equation 6.02. This equation takes into account the incident irradiance, the
surface area, angle of incidence from the radiation source and the transmission
through.
Modification of Atrium Design to Improve Thermal and Daylighting Performance Simulation 2
104
The original temperature prediction program established an equilibrium between the
reradiated energy and the input energy. The temperature within the atrium space was
found by rearranging the equation 6.03. The input data, equations and power
equilibrium enables a theoretical internal temperature to be equated hourly across the
course of a clear sky day and compared to the field temperatures recorded in the
model.
The new temperature prediction program uses a different method. Once the power
input into the atrium wells had been determined then the heat transfer losses were
calculated. These were based upon the amount of surface area and the temperature
differences between one side of the surface and the other side of the surface. The heat
losses include radiation (6.12), conduction (6.14) and convection (6.15) but the only
heat gain into the system is by direct radiation. The losses are calculated for both
atrium wells.
The heat losses are summed (6.10) and compared to the heat gains using an iteration
style method. The initial temperature is set at the external temperature, which is
assumed to be lower. The iteration is completed and the internal temperature is found
for the situation when the heat losses and gains are equal (6.11).
The input data, equations and power equilibrium enables a theoretical internal
temperature to be equated hourly across the course of a clear sky day and compared to
the field temperatures recorded in the model.
Modification of Atrium Design to Improve Thermal and Daylighting Performance Simulation 2
105
Assumptions in the Thermal Simulation Program
The thermal simulation program is a very basic set of algorithms that is reasonably
accurate even with the following assumptions.
The program only equates one temperature per zone and can not take into account the
obvious thermal stratification in the model atrium wells. The analysis does look at the
heat transfer losses due to conduction, convection and radiation. However, it only
includes heat transfer gains via direct solar radiation.
The input radiation is assumed to be in the plane of normal incidence to base line of
the pyramid shaped skylight aperture and that all the radiation goes to increasing the
internal temperature of the well. Theoretical direct normal incident irradiance was
calculated instead of using the measured field data to determine the power input into
the enclosure because the irradiance field data was not collected over a whole year
and the data was inaccurate for solar elevations below 10° (Middleton 1994). A
comparison between the theoretical and measured values will be shown in Chapter 7.
All the surfaces within the atrium wells are assumed to be adiabatic and the re-emitted
radiation is assumed to only radiate out of the input aperture.
The transmittance through the LCPs is based upon equation 6.09, which is a
polynomial fit to theoretically generated relative transmission plots (Edmonds 1996).
The plots are based upon equations 6.06 to 6.08 and figure 6.02, which are also
explained within Edmonds (1996).
The temperature of the double glazed LCP skylight material is assumed to be equal to
half way between the internal atrium well temperature and external ambient
temperature. The temperature of the clear glazed skylight material, however, is
assumed to be equal to the internal atrium well temperature.
Other assumptions and simplifications in the thermal simulation program such as the
sky distribution are mentioned in Chapter 5 in the daylight simulation assumption
section.
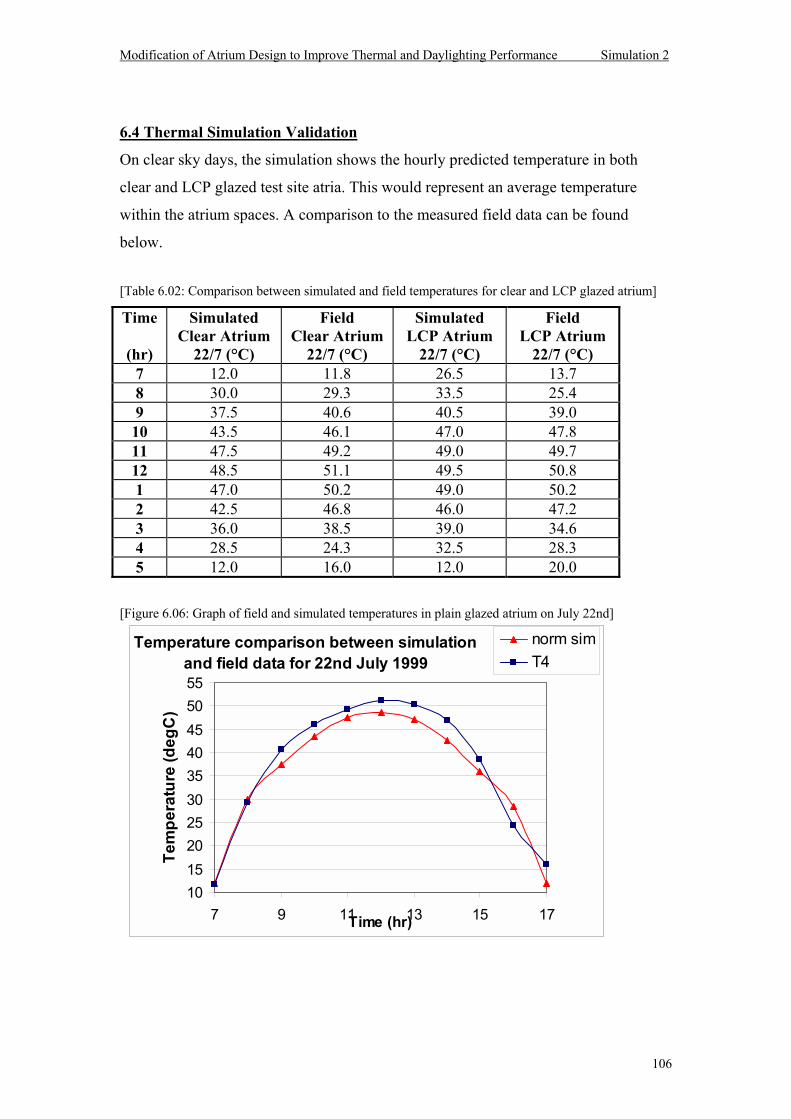
Modification of Atrium Design to Improve Thermal and Daylighting Performance Simulation 2
106
6.4 Thermal Simulation Validation
On clear sky days, the simulation shows the hourly predicted temperature in both
clear and LCP glazed test site atria. This would represent an average temperature
within the atrium spaces. A comparison to the measured field data can be found
below.
[Table 6.02: Comparison between simulated and field temperatures for clear and LCP glazed atrium]
Time
(hr)
Simulated Clear Atrium
22/7 (°C)
Field Clear Atrium
22/7 (°C)
Simulated LCP Atrium
22/7 (°C)
Field LCP Atrium
22/7 (°C) 7 12.0 11.8 26.5 13.7 8 30.0 29.3 33.5 25.4 9 37.5 40.6 40.5 39.0 10 43.5 46.1 47.0 47.8 11 47.5 49.2 49.0 49.7 12 48.5 51.1 49.5 50.8 1 47.0 50.2 49.0 50.2 2 42.5 46.8 46.0 47.2 3 36.0 38.5 39.0 34.6 4 28.5 24.3 32.5 28.3 5 12.0 16.0 12.0 20.0
[Figure 6.06: Graph of field and simulated temperatures in plain glazed atrium on July 22nd]
Temperature comparison between simulation and field data for 22nd July 1999
10152025303540455055
7 9 11 13 15 17Time (hr)
Tem
pera
ture
(deg
C)
norm simT4
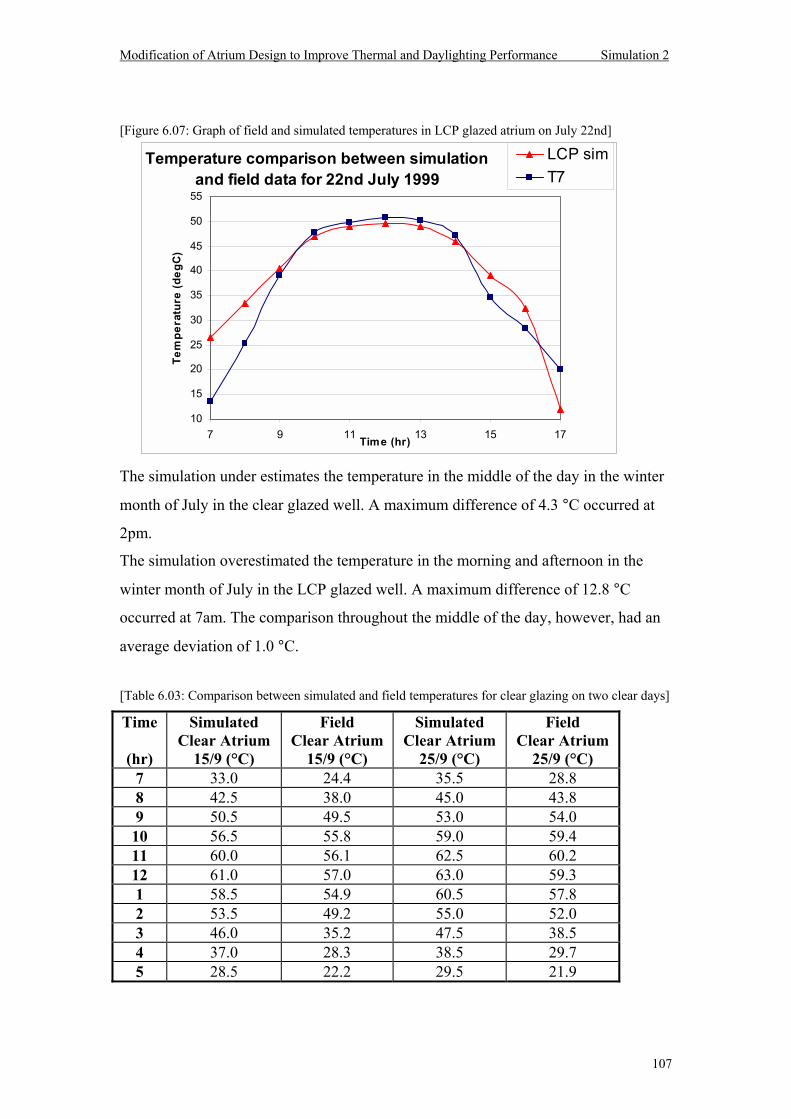
Modification of Atrium Design to Improve Thermal and Daylighting Performance Simulation 2
107
[Figure 6.07: Graph of field and simulated temperatures in LCP glazed atrium on July 22nd]
The simulation under estimates the temperature in the middle of the day in the winter
month of July in the clear glazed well. A maximum difference of 4.3 °C occurred at
2pm.
The simulation overestimated the temperature in the morning and afternoon in the
winter month of July in the LCP glazed well. A maximum difference of 12.8 °C
occurred at 7am. The comparison throughout the middle of the day, however, had an
average deviation of 1.0 °C.
[Table 6.03: Comparison between simulated and field temperatures for clear glazing on two clear days]
Time
(hr)
Simulated Clear Atrium
15/9 (°C)
Field Clear Atrium
15/9 (°C)
Simulated Clear Atrium
25/9 (°C)
Field Clear Atrium
25/9 (°C) 7 33.0 24.4 35.5 28.8 8 42.5 38.0 45.0 43.8 9 50.5 49.5 53.0 54.0 10 56.5 55.8 59.0 59.4 11 60.0 56.1 62.5 60.2 12 61.0 57.0 63.0 59.3 1 58.5 54.9 60.5 57.8 2 53.5 49.2 55.0 52.0 3 46.0 35.2 47.5 38.5 4 37.0 28.3 38.5 29.7 5 28.5 22.2 29.5 21.9
Temperature comparison between simulation and field data for 22nd July 1999
10
15
20
25
30
35
40
45
50
55
7 9 11 13 15 17Time (hr)
Tem
pera
ture
(deg
C)
LCP simT7
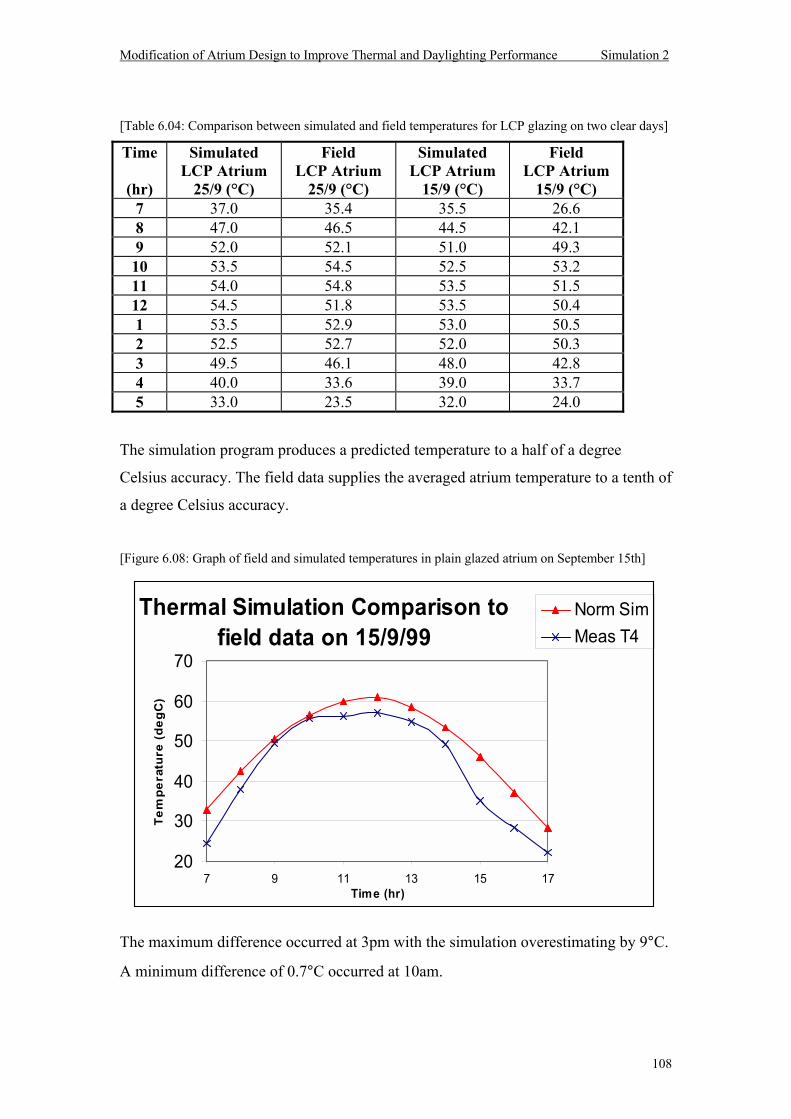
Modification of Atrium Design to Improve Thermal and Daylighting Performance Simulation 2
108
[Table 6.04: Comparison between simulated and field temperatures for LCP glazing on two clear days]
Time
(hr)
Simulated LCP Atrium
25/9 (°C)
Field LCP Atrium
25/9 (°C)
Simulated LCP Atrium
15/9 (°C)
Field LCP Atrium
15/9 (°C) 7 37.0 35.4 35.5 26.6 8 47.0 46.5 44.5 42.1 9 52.0 52.1 51.0 49.3 10 53.5 54.5 52.5 53.2 11 54.0 54.8 53.5 51.5 12 54.5 51.8 53.5 50.4 1 53.5 52.9 53.0 50.5 2 52.5 52.7 52.0 50.3 3 49.5 46.1 48.0 42.8 4 40.0 33.6 39.0 33.7 5 33.0 23.5 32.0 24.0
The simulation program produces a predicted temperature to a half of a degree
Celsius accuracy. The field data supplies the averaged atrium temperature to a tenth of
a degree Celsius accuracy.
[Figure 6.08: Graph of field and simulated temperatures in plain glazed atrium on September 15th]
The maximum difference occurred at 3pm with the simulation overestimating by 9°C.
A minimum difference of 0.7°C occurred at 10am.
Thermal Simulation Comparison to field data on 15/9/99
20
30
40
50
60
70
7 9 11 13 15 17Time (hr)
Tem
pera
ture
(deg
C)
Norm SimMeas T4
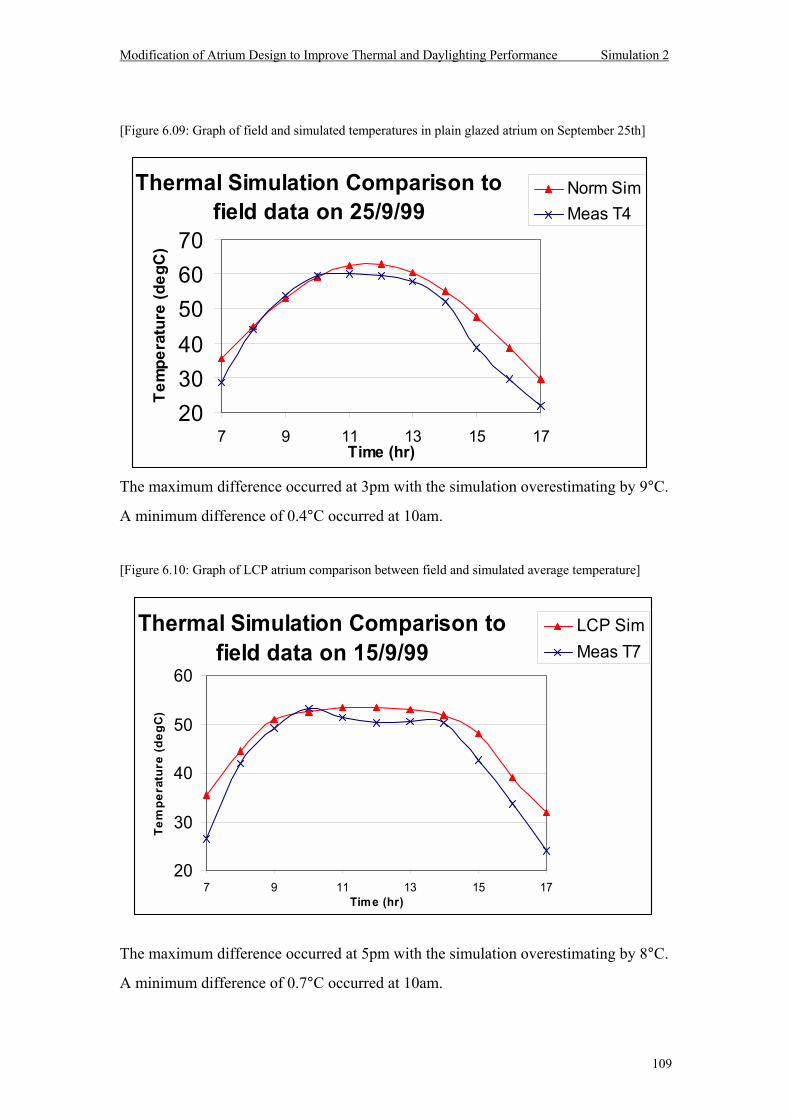
Modification of Atrium Design to Improve Thermal and Daylighting Performance Simulation 2
109
[Figure 6.09: Graph of field and simulated temperatures in plain glazed atrium on September 25th]
The maximum difference occurred at 3pm with the simulation overestimating by 9°C.
A minimum difference of 0.4°C occurred at 10am.
[Figure 6.10: Graph of LCP atrium comparison between field and simulated average temperature]
The maximum difference occurred at 5pm with the simulation overestimating by 8°C.
A minimum difference of 0.7°C occurred at 10am.
Thermal Simulation Comparison to field data on 25/9/99
203040506070
7 9 11 13 15 17Time (hr)
Tem
pera
ture
(deg
C)
Norm SimMeas T4
Thermal Simulation Comparison to field data on 15/9/99
20
30
40
50
60
7 9 11 13 15 17Time (hr)
Tem
pera
ture
(deg
C)
LCP SimMeas T7
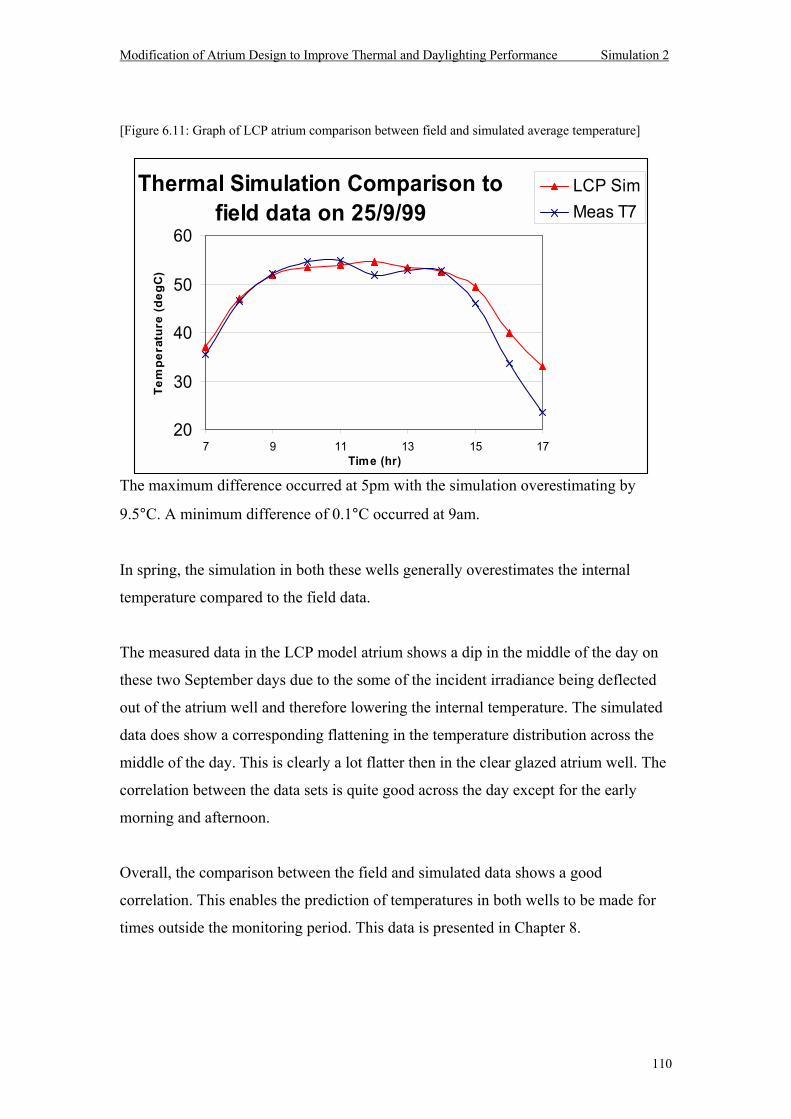
Modification of Atrium Design to Improve Thermal and Daylighting Performance Simulation 2
110
[Figure 6.11: Graph of LCP atrium comparison between field and simulated average temperature]
The maximum difference occurred at 5pm with the simulation overestimating by
9.5°C. A minimum difference of 0.1°C occurred at 9am.
In spring, the simulation in both these wells generally overestimates the internal
temperature compared to the field data.
The measured data in the LCP model atrium shows a dip in the middle of the day on
these two September days due to the some of the incident irradiance being deflected
out of the atrium well and therefore lowering the internal temperature. The simulated
data does show a corresponding flattening in the temperature distribution across the
middle of the day. This is clearly a lot flatter then in the clear glazed atrium well. The
correlation between the data sets is quite good across the day except for the early
morning and afternoon.
Overall, the comparison between the field and simulated data shows a good
correlation. This enables the prediction of temperatures in both wells to be made for
times outside the monitoring period. This data is presented in Chapter 8.
Thermal Simulation Comparison to field data on 25/9/99
20
30
40
50
60
7 9 11 13 15 17Time (hr)
Tem
pera
ture
(deg
C)
LCP SimMeas T7
Modification of Atrium Design to Improve Thermal and Daylighting Performance Simulation 2
111
6.5 Thermal Simulation Comparison
Yvonne Wolring was a visiting researcher who worked closely with the project during
the period from July 1999 to September 1999. She simulated the thermal performance
of the test site atria & room using the program CAPSOL Version 3.0 (Wolring 1999,
Physibel 1999). The results and accuracy of this program could be compared to that
obtained by the thermal simulation written within this research.
CAPSOL is a computer program that calculates the multi-zone transient heat transfer,
and was developed by Physibel Company in Belgium. The program is based upon the
physical laws of heat and mass transfer in relation to the behaviour of buildings. It is
used to calculate the temperature within each building zone due to the input climate
data. CAPSOL uses the Crank Nicolson finite difference method and equivalent
electrical circuit modelling with a network of thermal resistors and capacitors (RC
network). Boundary conditions define each zone and heat flows in and between each
zone in each time step. Walls separate each zone and each wall is represented by a
series of resistors and capacitors.
Climate data entered into the program includes the location of the site, the outside air
temperature, ground temperature and the irradiance (direct and diffuse). The
simulation of the test site was divided into four zones. One external zone, one zone
for each of the two atria wells and one zone for the internal room area. The only heat
gain into the building simulated is that by direct and diffuse solar irradiation through
the skylights and the northern window.
The heat transfer model used to simulate the infra-red radiation and convection in the
internal zone is simplified by assuming that both are coupled and therefore only one
resistance between each zone is needed.
The output file gives a measure of the average temperature within the room and the
normal and LCP glazed atriums. Each program outputs one average temperature per
zone per hour across the course of the day.
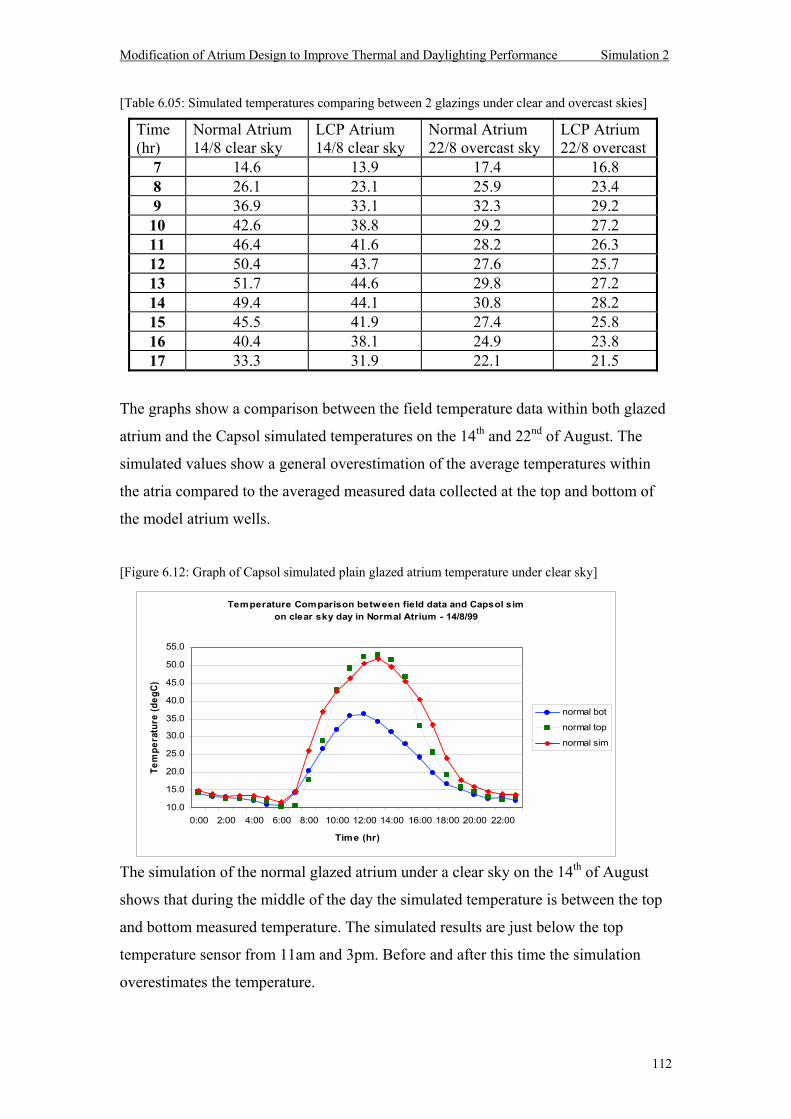
Modification of Atrium Design to Improve Thermal and Daylighting Performance Simulation 2
112
[Table 6.05: Simulated temperatures comparing between 2 glazings under clear and overcast skies]
Time (hr)
Normal Atrium 14/8 clear sky
LCP Atrium 14/8 clear sky
Normal Atrium 22/8 overcast sky
LCP Atrium 22/8 overcast
7 14.6 13.9 17.4 16.8 8 26.1 23.1 25.9 23.4 9 36.9 33.1 32.3 29.2 10 42.6 38.8 29.2 27.2 11 46.4 41.6 28.2 26.3 12 50.4 43.7 27.6 25.7 13 51.7 44.6 29.8 27.2 14 49.4 44.1 30.8 28.2 15 45.5 41.9 27.4 25.8 16 40.4 38.1 24.9 23.8 17 33.3 31.9 22.1 21.5
The graphs show a comparison between the field temperature data within both glazed
atrium and the Capsol simulated temperatures on the 14th and 22nd of August. The
simulated values show a general overestimation of the average temperatures within
the atria compared to the averaged measured data collected at the top and bottom of
the model atrium wells.
[Figure 6.12: Graph of Capsol simulated plain glazed atrium temperature under clear sky]
The simulation of the normal glazed atrium under a clear sky on the 14th of August
shows that during the middle of the day the simulated temperature is between the top
and bottom measured temperature. The simulated results are just below the top
temperature sensor from 11am and 3pm. Before and after this time the simulation
overestimates the temperature.
Temperature Comparison between field data and Capsol simon clear sky day in Normal Atrium - 14/8/99
10.0
15.0
20.0
25.0
30.0
35.0
40.0
45.0
50.0
55.0
0:00 2:00 4:00 6:00 8:00 10:00 12:00 14:00 16:00 18:00 20:00 22:00
Time (hr)
Tem
pera
ture
(deg
C)
normal bot
normal top
normal sim
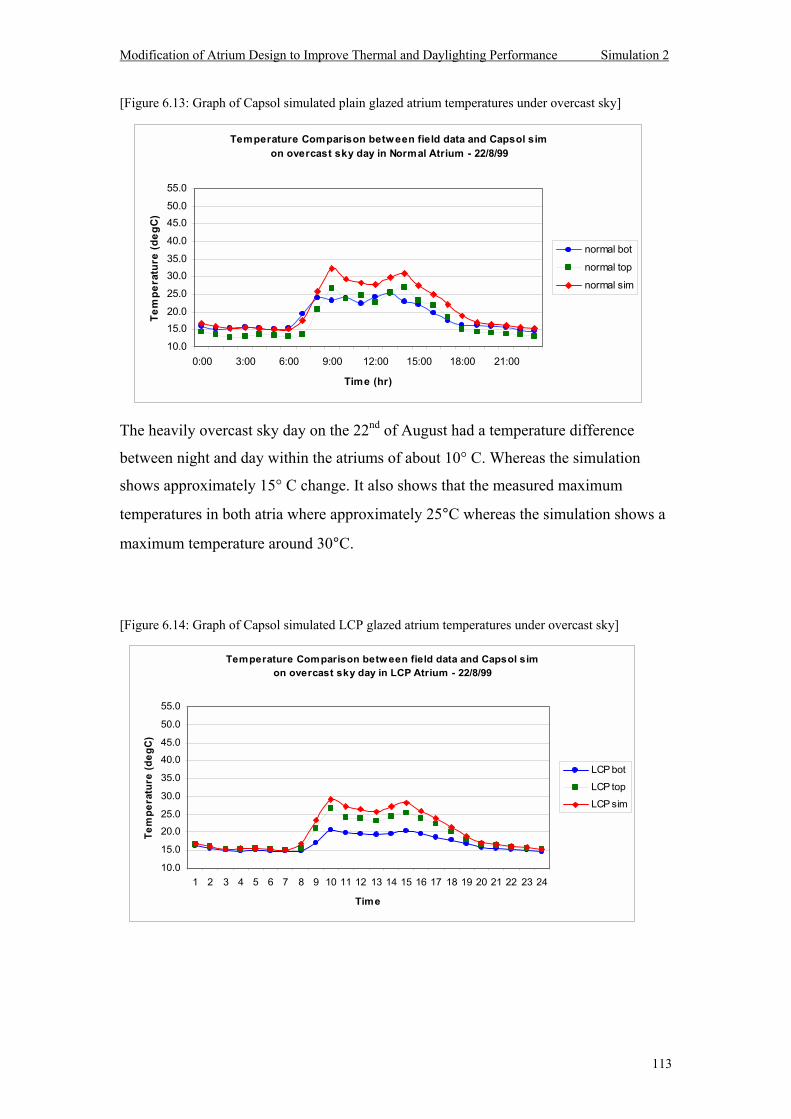
Modification of Atrium Design to Improve Thermal and Daylighting Performance Simulation 2
113
[Figure 6.13: Graph of Capsol simulated plain glazed atrium temperatures under overcast sky]
The heavily overcast sky day on the 22nd of August had a temperature difference
between night and day within the atriums of about 10° C. Whereas the simulation
shows approximately 15° C change. It also shows that the measured maximum
temperatures in both atria where approximately 25°C whereas the simulation shows a
maximum temperature around 30°C.
[Figure 6.14: Graph of Capsol simulated LCP glazed atrium temperatures under overcast sky]
Temperature Comparison between field data and Capsol simon overcast sky day in Normal Atrium - 22/8/99
10.0
15.020.0
25.0
30.035.0
40.0
45.050.0
55.0
0:00 3:00 6:00 9:00 12:00 15:00 18:00 21:00
Time (hr)
Tem
pera
ture
(deg
C)
normal bot
normal top
normal sim
Temperature Comparison between field data and Capsol simon overcast sky day in LCP Atrium - 22/8/99
10.0
15.0
20.0
25.0
30.0
35.0
40.0
45.0
50.0
55.0
1 2 3 4 5 6 7 8 9 10 11 12 13 14 15 16 17 18 19 20 21 22 23 24
Time
Tem
pera
ture
(deg
C)
LCP bot
LCP top
LCP sim
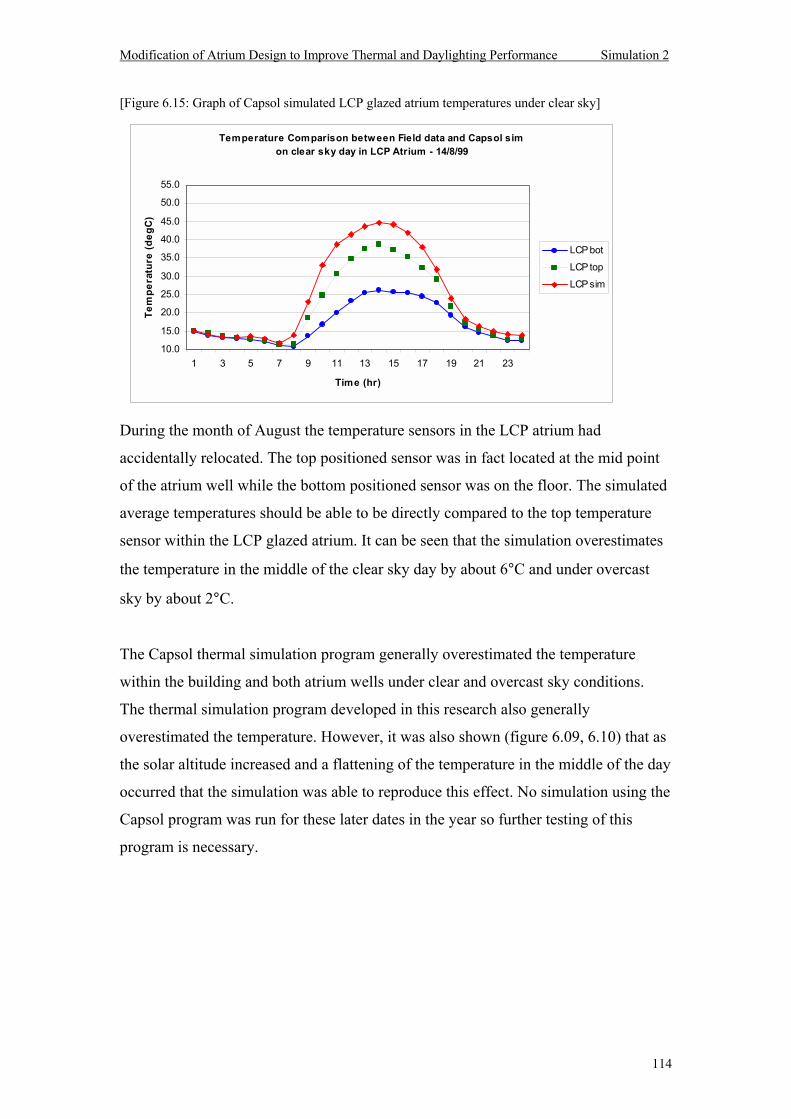
Modification of Atrium Design to Improve Thermal and Daylighting Performance Simulation 2
114
[Figure 6.15: Graph of Capsol simulated LCP glazed atrium temperatures under clear sky]
During the month of August the temperature sensors in the LCP atrium had
accidentally relocated. The top positioned sensor was in fact located at the mid point
of the atrium well while the bottom positioned sensor was on the floor. The simulated
average temperatures should be able to be directly compared to the top temperature
sensor within the LCP glazed atrium. It can be seen that the simulation overestimates
the temperature in the middle of the clear sky day by about 6°C and under overcast
sky by about 2°C.
The Capsol thermal simulation program generally overestimated the temperature
within the building and both atrium wells under clear and overcast sky conditions.
The thermal simulation program developed in this research also generally
overestimated the temperature. However, it was also shown (figure 6.09, 6.10) that as
the solar altitude increased and a flattening of the temperature in the middle of the day
occurred that the simulation was able to reproduce this effect. No simulation using the
Capsol program was run for these later dates in the year so further testing of this
program is necessary.
Temperature Comparison between Field data and Capsol simon clear sky day in LCP Atrium - 14/8/99
10.0
15.0
20.0
25.0
30.0
35.0
40.0
45.0
50.0
55.0
1 3 5 7 9 11 13 15 17 19 21 23
Time (hr)
Tem
pera
ture
(deg
C)
LCP bot
LCP top
LCP sim
Modification of Atrium Design to Improve Thermal and Daylighting Performance Experiment
115
Chapter 7: FIELD EXPERIMENTS
7.1 Introduction
In order to monitor, analyse and simulate the thermal performance of the model wells,
it was necessary to measure various environmental parameters including temperature
outside and inside the model, global and diffuse irradiance, and ventilation.
This was collected over a period of four months in the winter and spring of 1999.
To analyse and simulate the lighting performance of the model, illuminance levels
were collected within the model as well as within smaller model rooms and atriums
(2D & 3D). Luminance measurements of the sky were also recorded at various
locations during the research period. This data will be discussed further at the end of
this chapter.
These experiments were conducted to investigate the penetration of radiation into a
modified model atrium well. This was compared to the penetration of radiation into a
reference model atrium well. The modification within one well was in the form of a
second glazing layer made of laser cut panels (LCPs). Due to the redirecting effect of
the LCPs the hypothesis was that the thermal stratification and temperature would be
reduced and that the light level would be more constant over the course of a clear sky
day. Measurements were recorded of temperature, irradiance, light level and airflow
within a three month period of the winter and spring of 1999 in the temperate climate
of Brisbane.
It was the intention of the research to monitor the temperature and lighting within the
model over a period of 12 months but due to the denial of permission to locate the
model on campus, the relocation and set up of the experiment was not completed until
June 1999. The experiment was to be conducted within a 4.5 metre tall by 1.5 metre
square atrium with a steel frame and colorbond steel covered polystyrene sheet walls
on the top of the S block building at QUT. Due to safety regulations the experiment
was relocated to our test facility at the Brisbane airport. It was then the intention to
monitor the model for 6 months and extrapolate over the 12 month period. Due to
severe weather conditions, the monitoring was unexpectedly stopped after only 3
months.
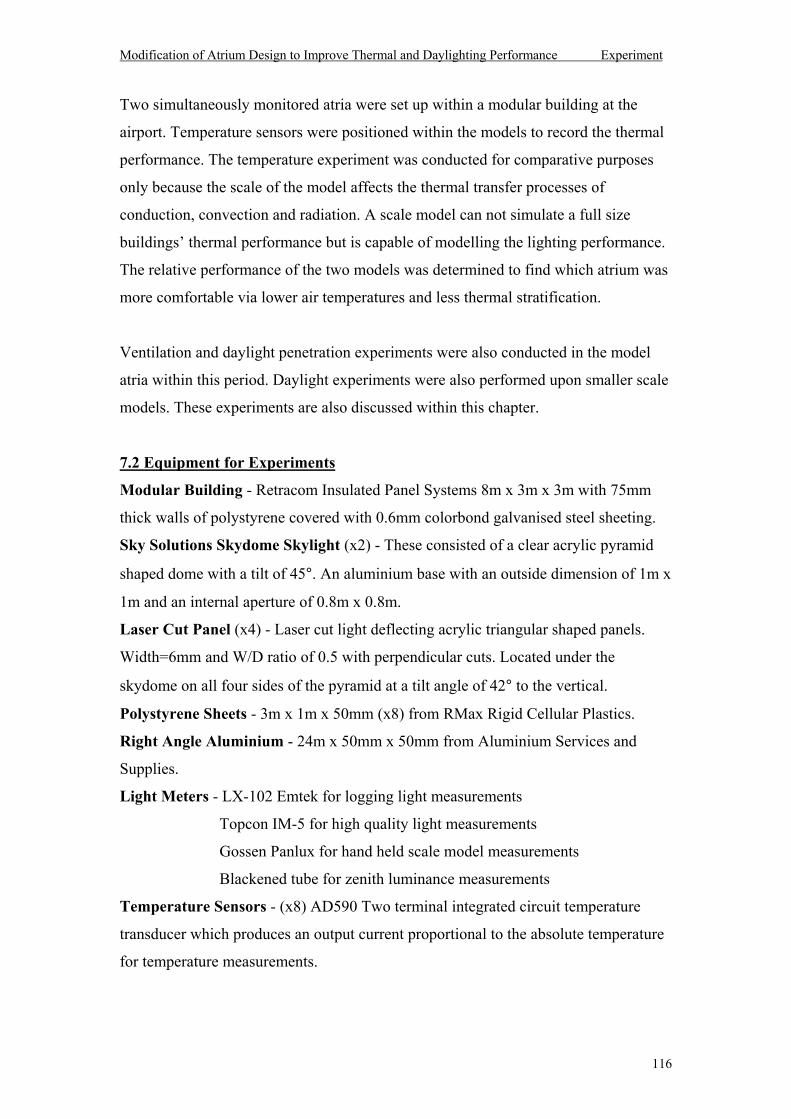
Modification of Atrium Design to Improve Thermal and Daylighting Performance Experiment
116
Two simultaneously monitored atria were set up within a modular building at the
airport. Temperature sensors were positioned within the models to record the thermal
performance. The temperature experiment was conducted for comparative purposes
only because the scale of the model affects the thermal transfer processes of
conduction, convection and radiation. A scale model can not simulate a full size
buildings thermal performance but is capable of modelling the lighting performance.
The relative performance of the two models was determined to find which atrium was
more comfortable via lower air temperatures and less thermal stratification.
Ventilation and daylight penetration experiments were also conducted in the model
atria within this period. Daylight experiments were also performed upon smaller scale
models. These experiments are also discussed within this chapter.
7.2 Equipment for Experiments
Modular Building - Retracom Insulated Panel Systems 8m x 3m x 3m with 75mm
thick walls of polystyrene covered with 0.6mm colorbond galvanised steel sheeting.
Sky Solutions Skydome Skylight (x2) - These consisted of a clear acrylic pyramid
shaped dome with a tilt of 45°. An aluminium base with an outside dimension of 1m x
1m and an internal aperture of 0.8m x 0.8m.
Laser Cut Panel (x4) - Laser cut light deflecting acrylic triangular shaped panels.
Width=6mm and W/D ratio of 0.5 with perpendicular cuts. Located under the
skydome on all four sides of the pyramid at a tilt angle of 42° to the vertical.
Polystyrene Sheets - 3m x 1m x 50mm (x8) from RMax Rigid Cellular Plastics.
Right Angle Aluminium - 24m x 50mm x 50mm from Aluminium Services and
Supplies.
Light Meters - LX-102 Emtek for logging light measurements
Topcon IM-5 for high quality light measurements
Gossen Panlux for hand held scale model measurements
Blackened tube for zenith luminance measurements
Temperature Sensors - (x8) AD590 Two terminal integrated circuit temperature
transducer which produces an output current proportional to the absolute temperature
for temperature measurements.
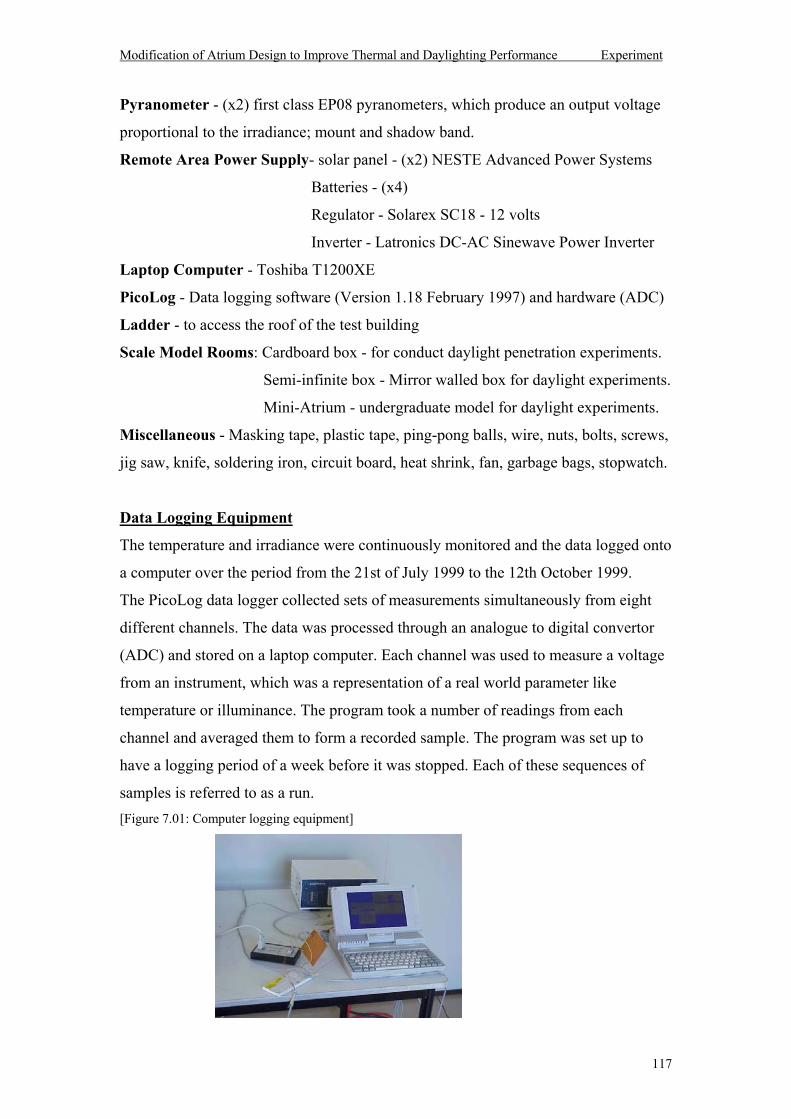
Modification of Atrium Design to Improve Thermal and Daylighting Performance Experiment
117
Pyranometer - (x2) first class EP08 pyranometers, which produce an output voltage
proportional to the irradiance; mount and shadow band.
Remote Area Power Supply- solar panel - (x2) NESTE Advanced Power Systems
Batteries - (x4)
Regulator - Solarex SC18 - 12 volts
Inverter - Latronics DC-AC Sinewave Power Inverter
Laptop Computer - Toshiba T1200XE
PicoLog - Data logging software (Version 1.18 February 1997) and hardware (ADC)
Ladder - to access the roof of the test building
Scale Model Rooms: Cardboard box - for conduct daylight penetration experiments.
Semi-infinite box - Mirror walled box for daylight experiments.
Mini-Atrium - undergraduate model for daylight experiments.
Miscellaneous - Masking tape, plastic tape, ping-pong balls, wire, nuts, bolts, screws,
jig saw, knife, soldering iron, circuit board, heat shrink, fan, garbage bags, stopwatch.
Data Logging Equipment
The temperature and irradiance were continuously monitored and the data logged onto
a computer over the period from the 21st of July 1999 to the 12th October 1999.
The PicoLog data logger collected sets of measurements simultaneously from eight
different channels. The data was processed through an analogue to digital convertor
(ADC) and stored on a laptop computer. Each channel was used to measure a voltage
from an instrument, which was a representation of a real world parameter like
temperature or illuminance. The program took a number of readings from each
channel and averaged them to form a recorded sample. The program was set up to
have a logging period of a week before it was stopped. Each of these sequences of
samples is referred to as a run. [Figure 7.01: Computer logging equipment]
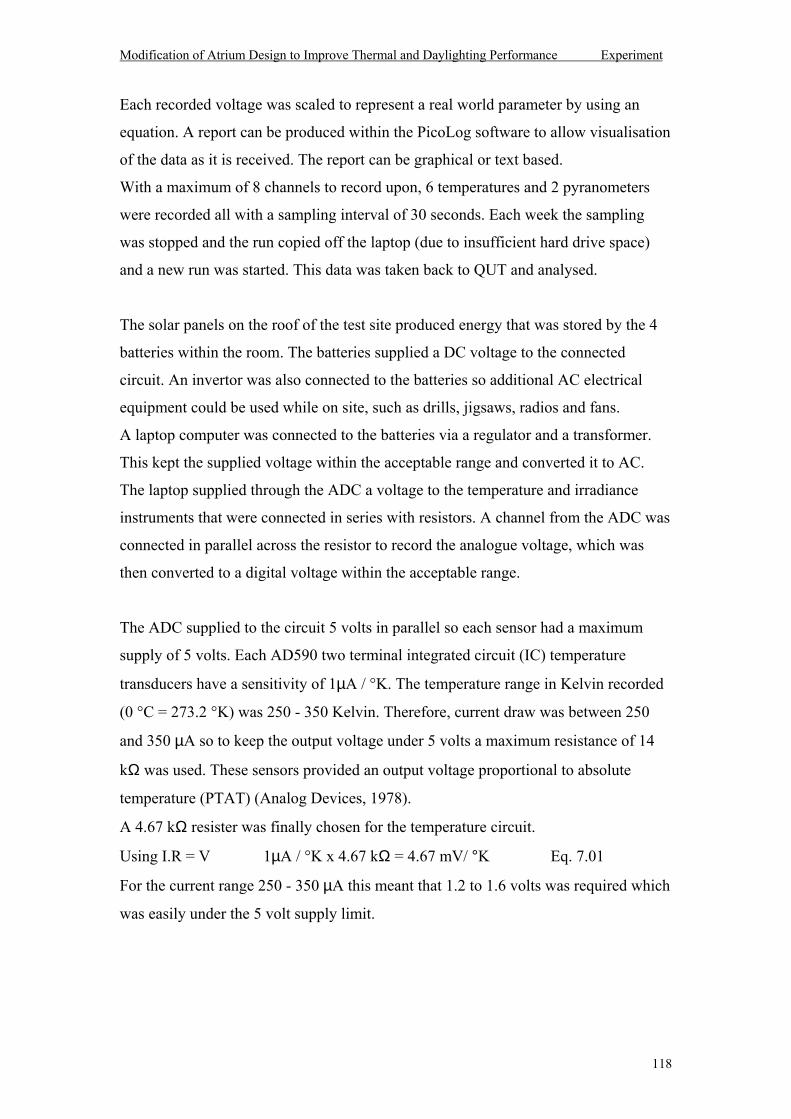
Modification of Atrium Design to Improve Thermal and Daylighting Performance Experiment
118
Each recorded voltage was scaled to represent a real world parameter by using an
equation. A report can be produced within the PicoLog software to allow visualisation
of the data as it is received. The report can be graphical or text based.
With a maximum of 8 channels to record upon, 6 temperatures and 2 pyranometers
were recorded all with a sampling interval of 30 seconds. Each week the sampling
was stopped and the run copied off the laptop (due to insufficient hard drive space)
and a new run was started. This data was taken back to QUT and analysed.
The solar panels on the roof of the test site produced energy that was stored by the 4
batteries within the room. The batteries supplied a DC voltage to the connected
circuit. An invertor was also connected to the batteries so additional AC electrical
equipment could be used while on site, such as drills, jigsaws, radios and fans.
A laptop computer was connected to the batteries via a regulator and a transformer.
This kept the supplied voltage within the acceptable range and converted it to AC.
The laptop supplied through the ADC a voltage to the temperature and irradiance
instruments that were connected in series with resistors. A channel from the ADC was
connected in parallel across the resistor to record the analogue voltage, which was
then converted to a digital voltage within the acceptable range.
The ADC supplied to the circuit 5 volts in parallel so each sensor had a maximum
supply of 5 volts. Each AD590 two terminal integrated circuit (IC) temperature
transducers have a sensitivity of 1µA / °K. The temperature range in Kelvin recorded
(0 °C = 273.2 °K) was 250 - 350 Kelvin. Therefore, current draw was between 250
and 350 µA so to keep the output voltage under 5 volts a maximum resistance of 14
kΩ was used. These sensors provided an output voltage proportional to absolute
temperature (PTAT) (Analog Devices, 1978).
A 4.67 kΩ resister was finally chosen for the temperature circuit.
Using I.R = V 1µA / °K x 4.67 kΩ = 4.67 mV/ °K Eq. 7.01
For the current range 250 - 350 µA this meant that 1.2 to 1.6 volts was required which
was easily under the 5 volt supply limit.
Modification of Atrium Design to Improve Thermal and Daylighting Performance Experiment
119
The AD590s were soldered onto lengths of wire and encased within heat shrink
tubing. They were then placed within blackened plastic integrating spheres.
Similar circuits were constructed for the pyranometer and illuminance monitoring.
[Figure 7.02: AD590 temperature sensor electrical circuit]
7.3 Building Description [Figure 7.03: Test site building side]
The atriums were placed inside the QUT Daylighting Research Modular Building,
which was located at the Bureau of Meteorology airport site on Lomandra Drive,
Eagle Farm, in Brisbane. The geographical co-ordinates of this location was
27° 25 S, 153° 07 E and elevation four metres (www.bom.gov.au/cgi-bin/climate,
2001).
AD590
ADC
Laptop Computer
Batteries
Solar Panel
Regulator Invertor4.67 KΩ
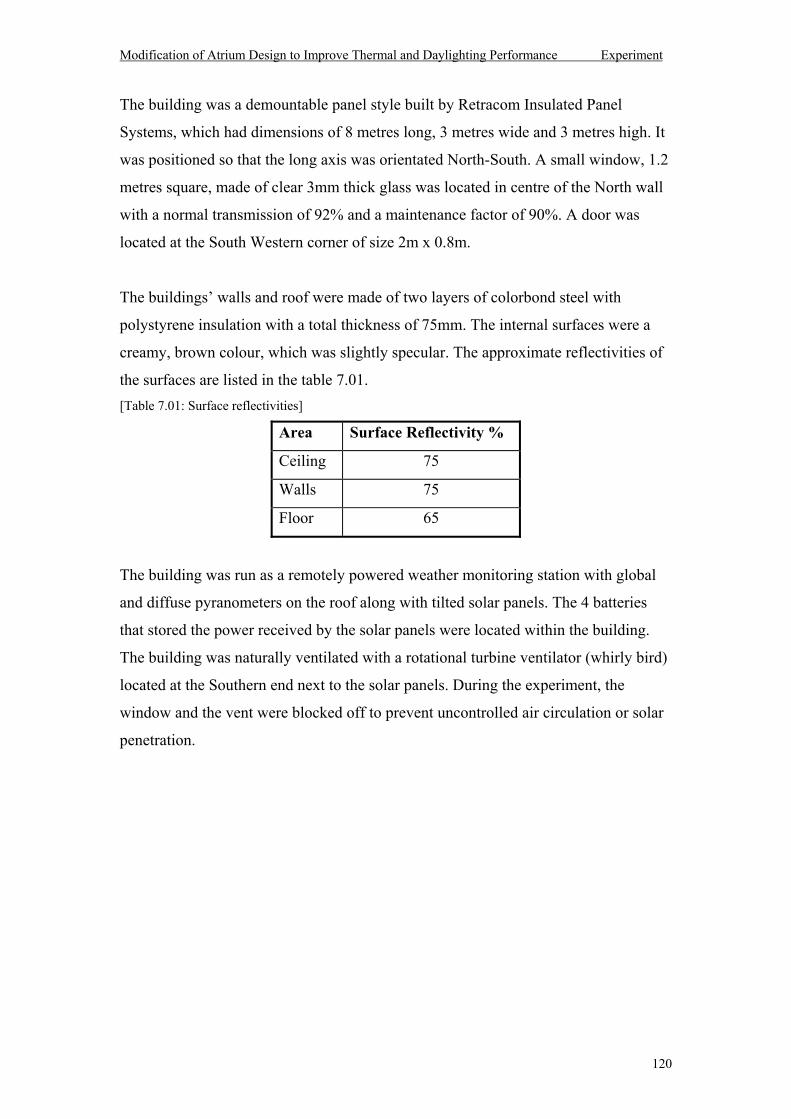
Modification of Atrium Design to Improve Thermal and Daylighting Performance Experiment
120
The building was a demountable panel style built by Retracom Insulated Panel
Systems, which had dimensions of 8 metres long, 3 metres wide and 3 metres high. It
was positioned so that the long axis was orientated North-South. A small window, 1.2
metres square, made of clear 3mm thick glass was located in centre of the North wall
with a normal transmission of 92% and a maintenance factor of 90%. A door was
located at the South Western corner of size 2m x 0.8m.
The buildings walls and roof were made of two layers of colorbond steel with
polystyrene insulation with a total thickness of 75mm. The internal surfaces were a
creamy, brown colour, which was slightly specular. The approximate reflectivities of
the surfaces are listed in the table 7.01. [Table 7.01: Surface reflectivities]
Area Surface Reflectivity %
Ceiling 75
Walls 75
Floor 65
The building was run as a remotely powered weather monitoring station with global
and diffuse pyranometers on the roof along with tilted solar panels. The 4 batteries
that stored the power received by the solar panels were located within the building.
The building was naturally ventilated with a rotational turbine ventilator (whirly bird)
located at the Southern end next to the solar panels. During the experiment, the
window and the vent were blocked off to prevent uncontrolled air circulation or solar
penetration.
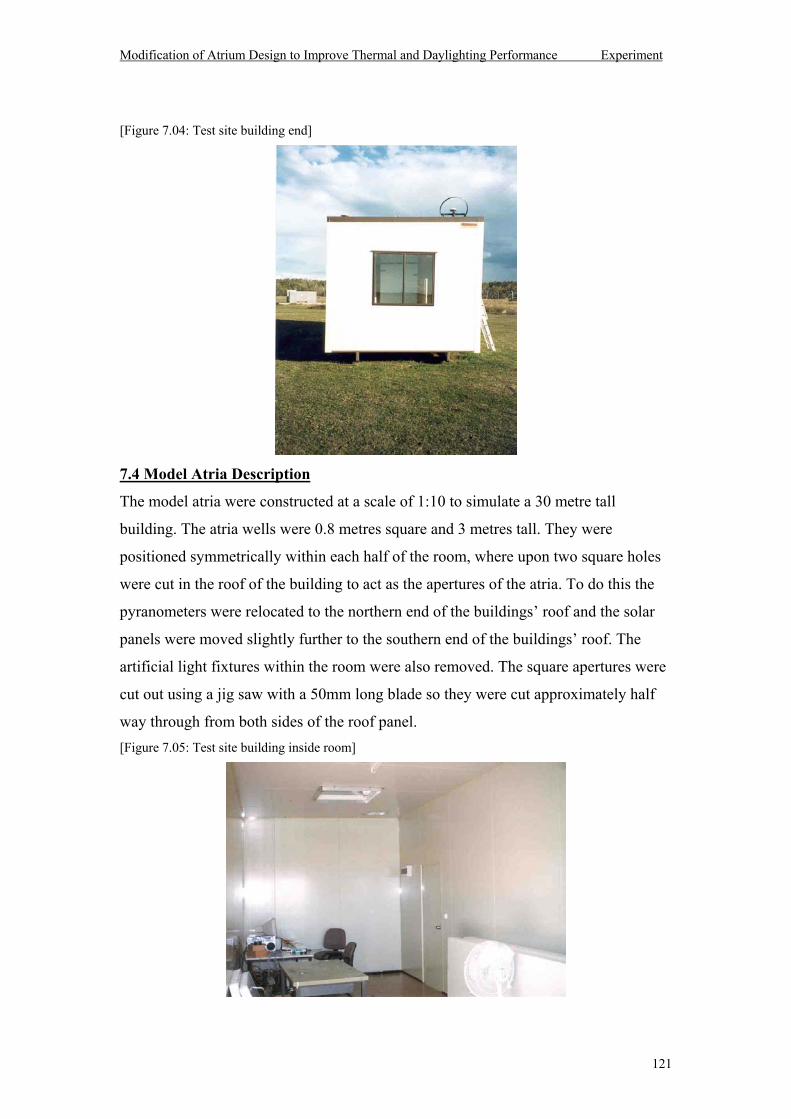
Modification of Atrium Design to Improve Thermal and Daylighting Performance Experiment
121
[Figure 7.04: Test site building end]
7.4 Model Atria Description
The model atria were constructed at a scale of 1:10 to simulate a 30 metre tall
building. The atria wells were 0.8 metres square and 3 metres tall. They were
positioned symmetrically within each half of the room, where upon two square holes
were cut in the roof of the building to act as the apertures of the atria. To do this the
pyranometers were relocated to the northern end of the buildings roof and the solar
panels were moved slightly further to the southern end of the buildings roof. The
artificial light fixtures within the room were also removed. The square apertures were
cut out using a jig saw with a 50mm long blade so they were cut approximately half
way through from both sides of the roof panel. [Figure 7.05: Test site building inside room]
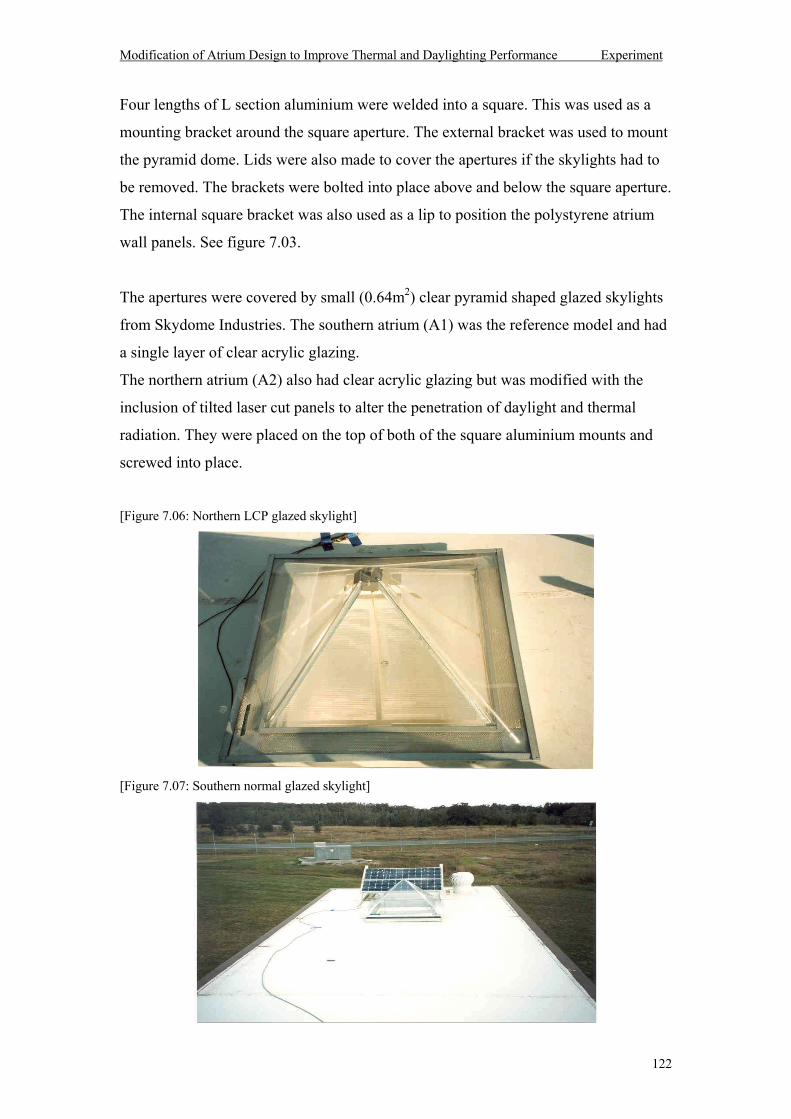
Modification of Atrium Design to Improve Thermal and Daylighting Performance Experiment
122
Four lengths of L section aluminium were welded into a square. This was used as a
mounting bracket around the square aperture. The external bracket was used to mount
the pyramid dome. Lids were also made to cover the apertures if the skylights had to
be removed. The brackets were bolted into place above and below the square aperture.
The internal square bracket was also used as a lip to position the polystyrene atrium
wall panels. See figure 7.03.
The apertures were covered by small (0.64m2) clear pyramid shaped glazed skylights
from Skydome Industries. The southern atrium (A1) was the reference model and had
a single layer of clear acrylic glazing.
The northern atrium (A2) also had clear acrylic glazing but was modified with the
inclusion of tilted laser cut panels to alter the penetration of daylight and thermal
radiation. They were placed on the top of both of the square aluminium mounts and
screwed into place.
[Figure 7.06: Northern LCP glazed skylight]
[Figure 7.07: Southern normal glazed skylight]
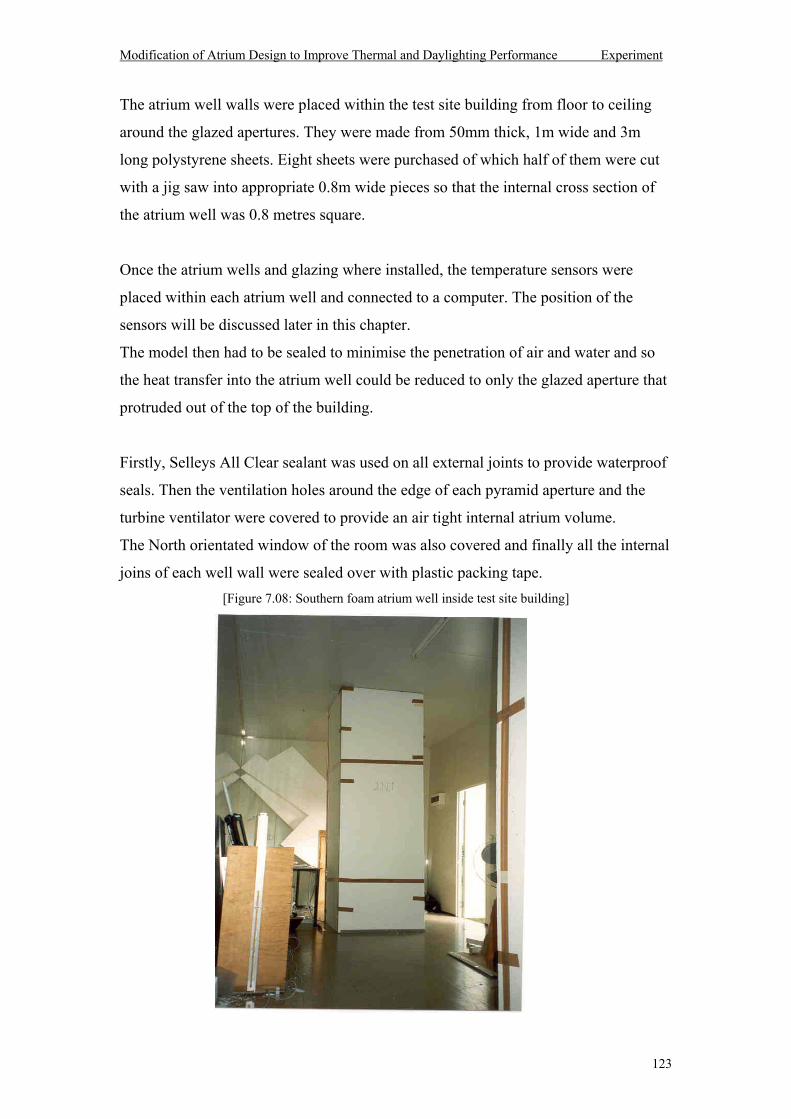
Modification of Atrium Design to Improve Thermal and Daylighting Performance Experiment
123
The atrium well walls were placed within the test site building from floor to ceiling
around the glazed apertures. They were made from 50mm thick, 1m wide and 3m
long polystyrene sheets. Eight sheets were purchased of which half of them were cut
with a jig saw into appropriate 0.8m wide pieces so that the internal cross section of
the atrium well was 0.8 metres square.
Once the atrium wells and glazing where installed, the temperature sensors were
placed within each atrium well and connected to a computer. The position of the
sensors will be discussed later in this chapter.
The model then had to be sealed to minimise the penetration of air and water and so
the heat transfer into the atrium well could be reduced to only the glazed aperture that
protruded out of the top of the building.
Firstly, Selleys All Clear sealant was used on all external joints to provide waterproof
seals. Then the ventilation holes around the edge of each pyramid aperture and the
turbine ventilator were covered to provide an air tight internal atrium volume.
The North orientated window of the room was also covered and finally all the internal
joins of each well wall were sealed over with plastic packing tape. [Figure 7.08: Southern foam atrium well inside test site building]
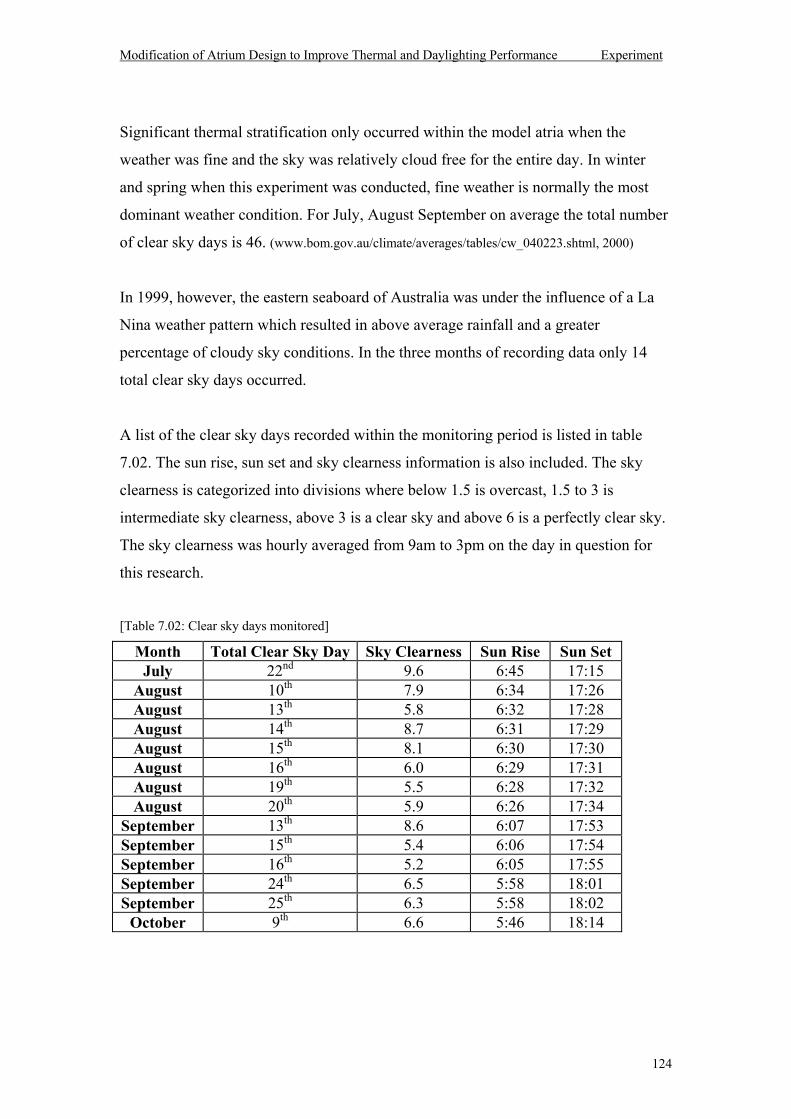
Modification of Atrium Design to Improve Thermal and Daylighting Performance Experiment
124
Significant thermal stratification only occurred within the model atria when the
weather was fine and the sky was relatively cloud free for the entire day. In winter
and spring when this experiment was conducted, fine weather is normally the most
dominant weather condition. For July, August September on average the total number
of clear sky days is 46. (www.bom.gov.au/climate/averages/tables/cw_040223.shtml, 2000)
In 1999, however, the eastern seaboard of Australia was under the influence of a La
Nina weather pattern which resulted in above average rainfall and a greater
percentage of cloudy sky conditions. In the three months of recording data only 14
total clear sky days occurred.
A list of the clear sky days recorded within the monitoring period is listed in table
7.02. The sun rise, sun set and sky clearness information is also included. The sky
clearness is categorized into divisions where below 1.5 is overcast, 1.5 to 3 is
intermediate sky clearness, above 3 is a clear sky and above 6 is a perfectly clear sky.
The sky clearness was hourly averaged from 9am to 3pm on the day in question for
this research.
[Table 7.02: Clear sky days monitored]
Month Total Clear Sky Day Sky Clearness Sun Rise Sun Set July 22nd 9.6 6:45 17:15
August 10th 7.9 6:34 17:26 August 13th 5.8 6:32 17:28 August 14th 8.7 6:31 17:29 August 15th 8.1 6:30 17:30 August 16th 6.0 6:29 17:31 August 19th 5.5 6:28 17:32 August 20th 5.9 6:26 17:34
September 13th 8.6 6:07 17:53 September 15th 5.4 6:06 17:54 September 16th 5.2 6:05 17:55 September 24th 6.5 5:58 18:01 September 25th 6.3 5:58 18:02
October 9th 6.6 5:46 18:14
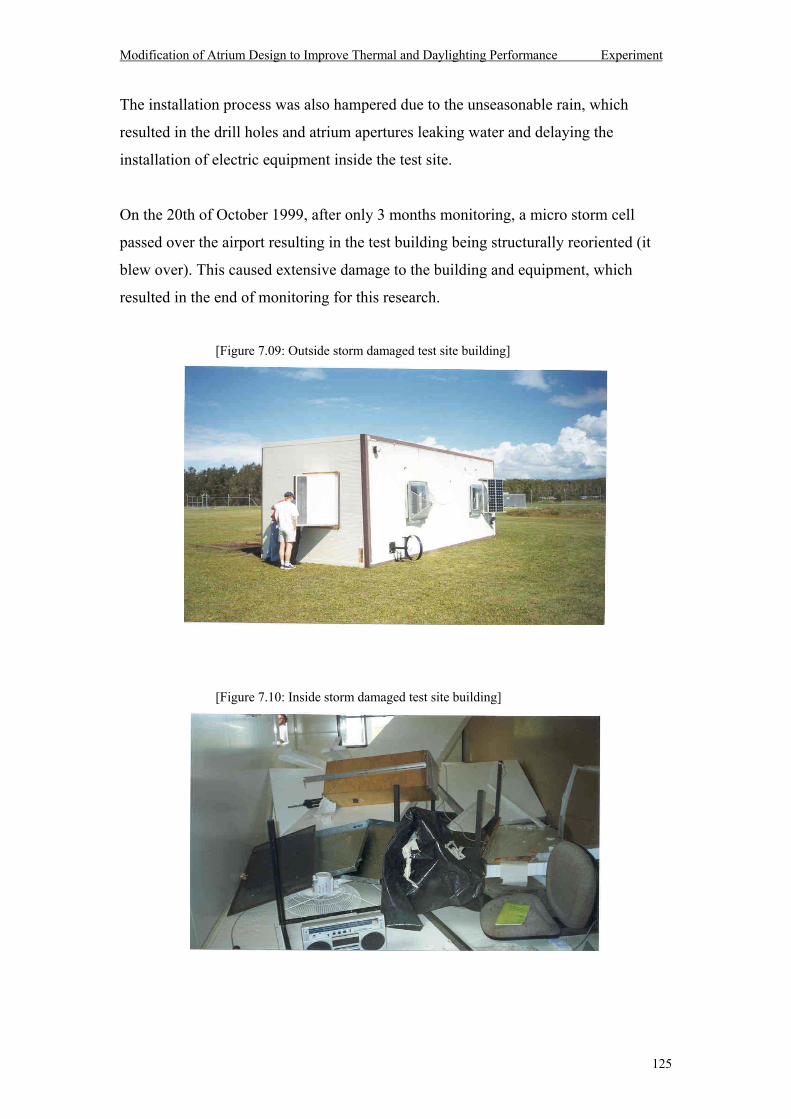
Modification of Atrium Design to Improve Thermal and Daylighting Performance Experiment
125
The installation process was also hampered due to the unseasonable rain, which
resulted in the drill holes and atrium apertures leaking water and delaying the
installation of electric equipment inside the test site.
On the 20th of October 1999, after only 3 months monitoring, a micro storm cell
passed over the airport resulting in the test building being structurally reoriented (it
blew over). This caused extensive damage to the building and equipment, which
resulted in the end of monitoring for this research.
[Figure 7.09: Outside storm damaged test site building]
[Figure 7.10: Inside storm damaged test site building]
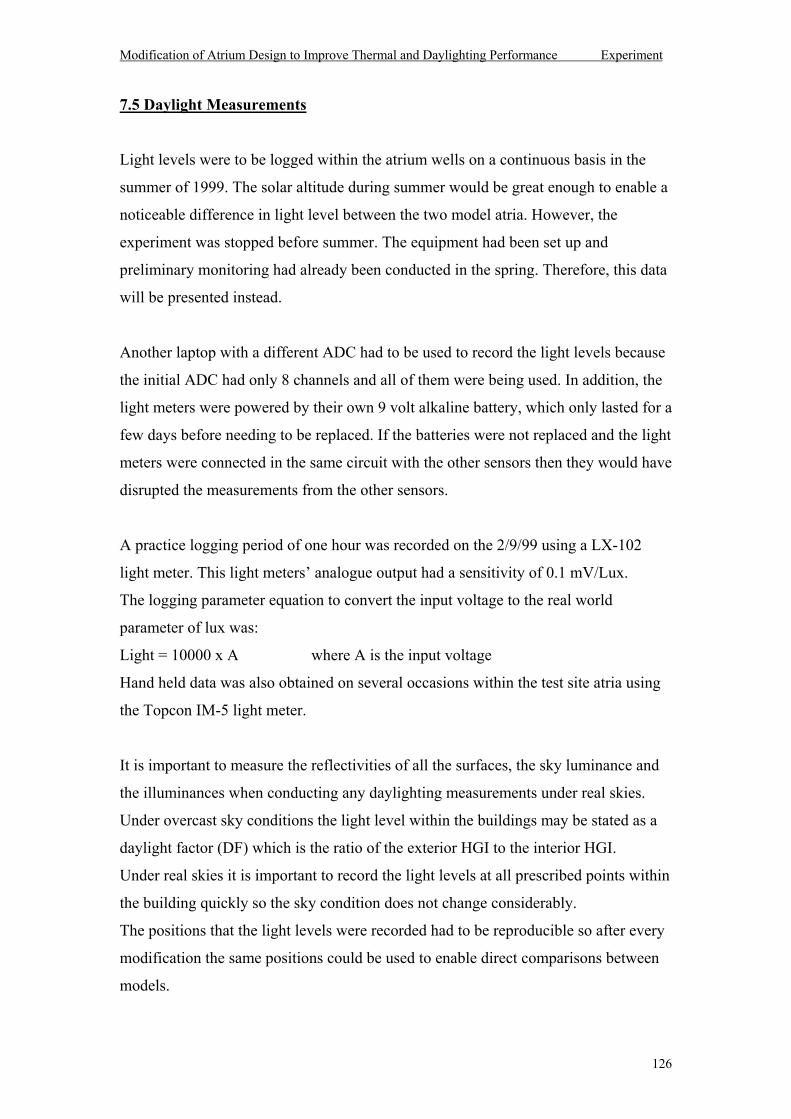
Modification of Atrium Design to Improve Thermal and Daylighting Performance Experiment
126
7.5 Daylight Measurements
Light levels were to be logged within the atrium wells on a continuous basis in the
summer of 1999. The solar altitude during summer would be great enough to enable a
noticeable difference in light level between the two model atria. However, the
experiment was stopped before summer. The equipment had been set up and
preliminary monitoring had already been conducted in the spring. Therefore, this data
will be presented instead.
Another laptop with a different ADC had to be used to record the light levels because
the initial ADC had only 8 channels and all of them were being used. In addition, the
light meters were powered by their own 9 volt alkaline battery, which only lasted for a
few days before needing to be replaced. If the batteries were not replaced and the light
meters were connected in the same circuit with the other sensors then they would have
disrupted the measurements from the other sensors.
A practice logging period of one hour was recorded on the 2/9/99 using a LX-102
light meter. This light meters analogue output had a sensitivity of 0.1 mV/Lux.
The logging parameter equation to convert the input voltage to the real world
parameter of lux was:
Light = 10000 x A where A is the input voltage
Hand held data was also obtained on several occasions within the test site atria using
the Topcon IM-5 light meter.
It is important to measure the reflectivities of all the surfaces, the sky luminance and
the illuminances when conducting any daylighting measurements under real skies.
Under overcast sky conditions the light level within the buildings may be stated as a
daylight factor (DF) which is the ratio of the exterior HGI to the interior HGI.
Under real skies it is important to record the light levels at all prescribed points within
the building quickly so the sky condition does not change considerably.
The positions that the light levels were recorded had to be reproducible so after every
modification the same positions could be used to enable direct comparisons between
models.
Modification of Atrium Design to Improve Thermal and Daylighting Performance Experiment
127
Daylight measurements were taken in the test site building on the floor and work
height under clear (14/7/99) and overcast (9/7/99) skies across the whole floor area.
The floor was divided up into a grid of 15 squares with 1 measurement taken within
each square. The squares were 1.6m x 1m and the meter was placed at the centre of
each square. The work height measurement was recorded with the meter attached to a
tripod set to 0.8 metres off the floor. The floor height measurement was recorded with
the meter on the floor. Lawrence Leong assisted with the recording of the
measurements on both days. The position of the table in the back south-east corner of
the room, which covered the batteries and supported the computer and electrical
logging equipment meant that the corner floor points could not be recorded.
Many daylighting measurements were taken within smaller basic box models to
validate the daylight simulation programs. The results of these experiments are
included in Appendix 6.
A square cardboard box was used on the roof of M Block at QUT. All the internal
surfaces had the reflectivity (0.3) due to being made of the same brown cardboard
material. The box represented a room with an aperture of half the wall. The cardboard
box had dimensions of 0.26m long, 0.22m high, 0.3m wide.
A long thin model room was used in the park near L Block at QUT. The side vertical
walls of the model have removable sliding mirrors on them. This allows a
representation of a semi-infinite 2 dimensional room that can be compared to the 2
dimensional theoretical computer simulation. Upon the removal of these mirrors the
room represents a normal 3 dimensional model. The model had an aperture of half the
end wall. The model room has dimensions of 1m long, 0.3m high, 0.3m wide and the
reflectivities of the surfaces were floor (0.1), ceiling (0.7), end walls (0.4), side walls
(0.4 or mirrored). This room was also stood on its end to simulate an atrium well.
Measurements were taken down the middle of the room at 0.1m intervals at the floor
height.
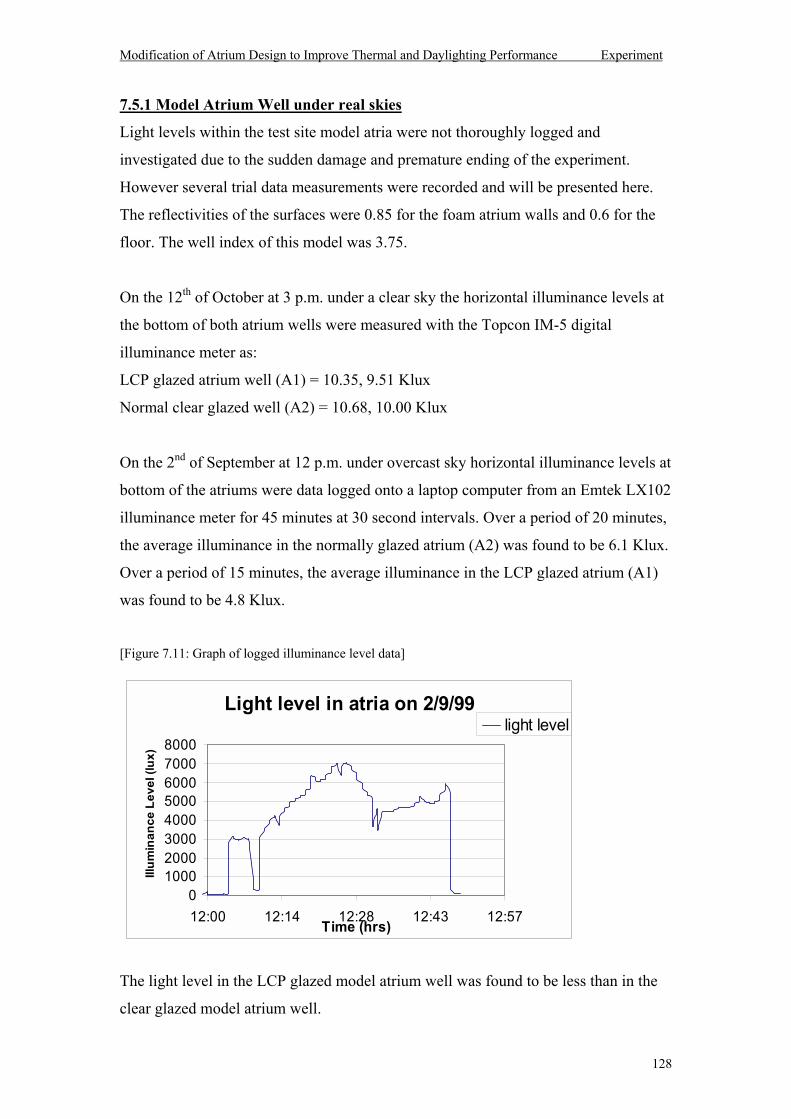
Modification of Atrium Design to Improve Thermal and Daylighting Performance Experiment
128
7.5.1 Model Atrium Well under real skies
Light levels within the test site model atria were not thoroughly logged and
investigated due to the sudden damage and premature ending of the experiment.
However several trial data measurements were recorded and will be presented here.
The reflectivities of the surfaces were 0.85 for the foam atrium walls and 0.6 for the
floor. The well index of this model was 3.75.
On the 12th of October at 3 p.m. under a clear sky the horizontal illuminance levels at
the bottom of both atrium wells were measured with the Topcon IM-5 digital
illuminance meter as:
LCP glazed atrium well (A1) = 10.35, 9.51 Klux
Normal clear glazed well (A2) = 10.68, 10.00 Klux
On the 2nd of September at 12 p.m. under overcast sky horizontal illuminance levels at
bottom of the atriums were data logged onto a laptop computer from an Emtek LX102
illuminance meter for 45 minutes at 30 second intervals. Over a period of 20 minutes,
the average illuminance in the normally glazed atrium (A2) was found to be 6.1 Klux.
Over a period of 15 minutes, the average illuminance in the LCP glazed atrium (A1)
was found to be 4.8 Klux.
[Figure 7.11: Graph of logged illuminance level data]
The light level in the LCP glazed model atrium well was found to be less than in the
clear glazed model atrium well.
Light level in atria on 2/9/99
010002000300040005000600070008000
12:00 12:14 12:28 12:43 12:57Time (hrs)
Illum
inan
ce L
evel
(lux
)
light level
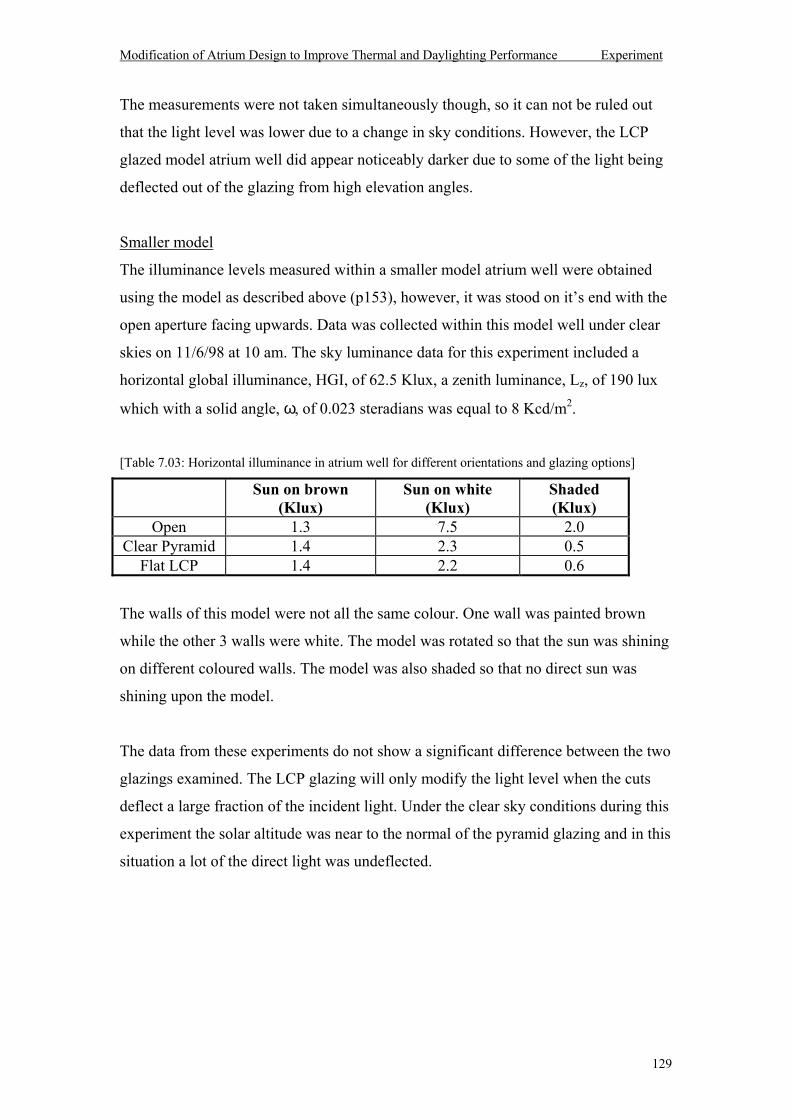
Modification of Atrium Design to Improve Thermal and Daylighting Performance Experiment
129
The measurements were not taken simultaneously though, so it can not be ruled out
that the light level was lower due to a change in sky conditions. However, the LCP
glazed model atrium well did appear noticeably darker due to some of the light being
deflected out of the glazing from high elevation angles.
Smaller model
The illuminance levels measured within a smaller model atrium well were obtained
using the model as described above (p153), however, it was stood on its end with the
open aperture facing upwards. Data was collected within this model well under clear
skies on 11/6/98 at 10 am. The sky luminance data for this experiment included a
horizontal global illuminance, HGI, of 62.5 Klux, a zenith luminance, Lz, of 190 lux
which with a solid angle, ω, of 0.023 steradians was equal to 8 Kcd/m2.
[Table 7.03: Horizontal illuminance in atrium well for different orientations and glazing options]
Sun on brown (Klux)
Sun on white (Klux)
Shaded (Klux)
Open 1.3 7.5 2.0 Clear Pyramid 1.4 2.3 0.5
Flat LCP 1.4 2.2 0.6
The walls of this model were not all the same colour. One wall was painted brown
while the other 3 walls were white. The model was rotated so that the sun was shining
on different coloured walls. The model was also shaded so that no direct sun was
shining upon the model.
The data from these experiments do not show a significant difference between the two
glazings examined. The LCP glazing will only modify the light level when the cuts
deflect a large fraction of the incident light. Under the clear sky conditions during this
experiment the solar altitude was near to the normal of the pyramid glazing and in this
situation a lot of the direct light was undeflected.
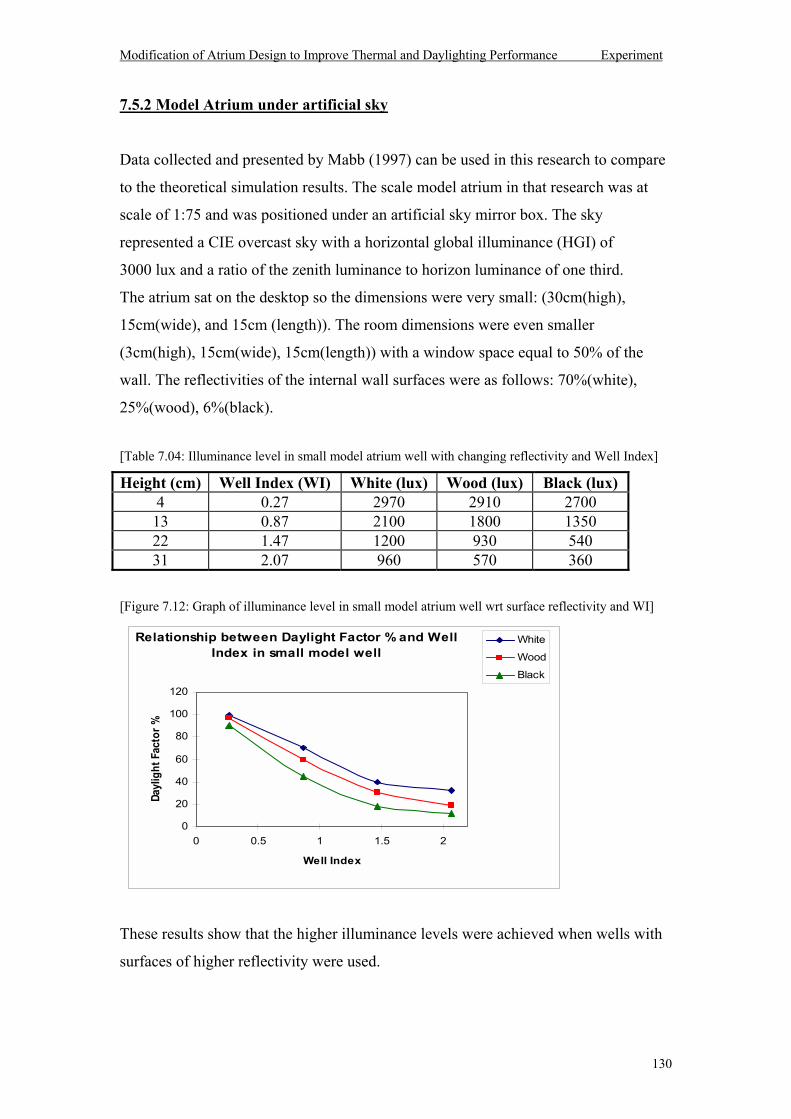
Modification of Atrium Design to Improve Thermal and Daylighting Performance Experiment
130
7.5.2 Model Atrium under artificial sky
Data collected and presented by Mabb (1997) can be used in this research to compare
to the theoretical simulation results. The scale model atrium in that research was at
scale of 1:75 and was positioned under an artificial sky mirror box. The sky
represented a CIE overcast sky with a horizontal global illuminance (HGI) of
3000 lux and a ratio of the zenith luminance to horizon luminance of one third.
The atrium sat on the desktop so the dimensions were very small: (30cm(high),
15cm(wide), and 15cm (length)). The room dimensions were even smaller
(3cm(high), 15cm(wide), 15cm(length)) with a window space equal to 50% of the
wall. The reflectivities of the internal wall surfaces were as follows: 70%(white),
25%(wood), 6%(black).
[Table 7.04: Illuminance level in small model atrium well with changing reflectivity and Well Index]
Height (cm) Well Index (WI) White (lux) Wood (lux) Black (lux) 4 0.27 2970 2910 2700 13 0.87 2100 1800 1350 22 1.47 1200 930 540 31 2.07 960 570 360
[Figure 7.12: Graph of illuminance level in small model atrium well wrt surface reflectivity and WI]
These results show that the higher illuminance levels were achieved when wells with
surfaces of higher reflectivity were used.
Relationship between Daylight Factor % and Well Index in small model well
0
20
40
60
80
100
120
0 0.5 1 1.5 2
Well Index
Dayl
ight
Fac
tor %
White
Wood
Black
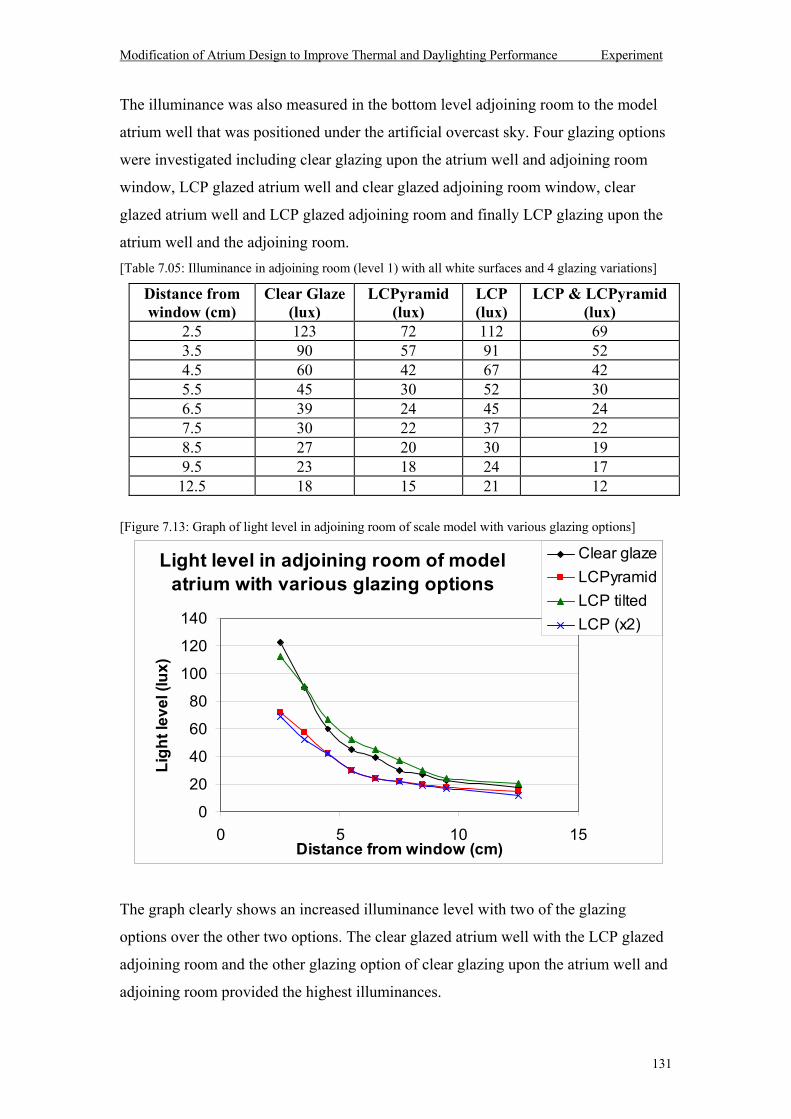
Modification of Atrium Design to Improve Thermal and Daylighting Performance Experiment
131
The illuminance was also measured in the bottom level adjoining room to the model
atrium well that was positioned under the artificial overcast sky. Four glazing options
were investigated including clear glazing upon the atrium well and adjoining room
window, LCP glazed atrium well and clear glazed adjoining room window, clear
glazed atrium well and LCP glazed adjoining room and finally LCP glazing upon the
atrium well and the adjoining room. [Table 7.05: Illuminance in adjoining room (level 1) with all white surfaces and 4 glazing variations]
Distance from window (cm)
Clear Glaze (lux)
LCPyramid (lux)
LCP (lux)
LCP & LCPyramid (lux)
2.5 123 72 112 69 3.5 90 57 91 52 4.5 60 42 67 42 5.5 45 30 52 30 6.5 39 24 45 24 7.5 30 22 37 22 8.5 27 20 30 19 9.5 23 18 24 17 12.5 18 15 21 12
[Figure 7.13: Graph of light level in adjoining room of scale model with various glazing options]
The graph clearly shows an increased illuminance level with two of the glazing
options over the other two options. The clear glazed atrium well with the LCP glazed
adjoining room and the other glazing option of clear glazing upon the atrium well and
adjoining room provided the highest illuminances.
Light level in adjoining room of model atrium with various glazing options
0
20
40
60
80
100
120
140
0 5 10 15Distance from window (cm)
Ligh
t lev
el (l
ux)
Clear glazeLCPyramidLCP tiltedLCP (x2)
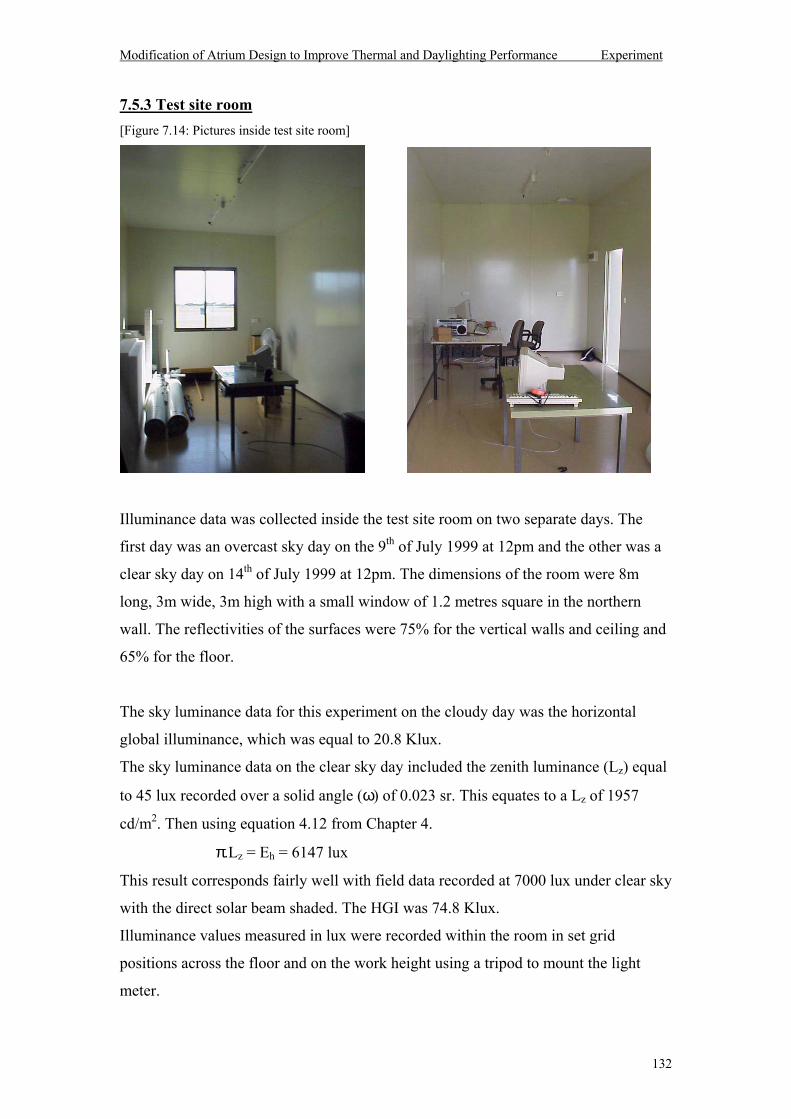
Modification of Atrium Design to Improve Thermal and Daylighting Performance Experiment
132
7.5.3 Test site room [Figure 7.14: Pictures inside test site room]
Illuminance data was collected inside the test site room on two separate days. The
first day was an overcast sky day on the 9th of July 1999 at 12pm and the other was a
clear sky day on 14th of July 1999 at 12pm. The dimensions of the room were 8m
long, 3m wide, 3m high with a small window of 1.2 metres square in the northern
wall. The reflectivities of the surfaces were 75% for the vertical walls and ceiling and
65% for the floor.
The sky luminance data for this experiment on the cloudy day was the horizontal
global illuminance, which was equal to 20.8 Klux.
The sky luminance data on the clear sky day included the zenith luminance (Lz) equal
to 45 lux recorded over a solid angle (ω) of 0.023 sr. This equates to a Lz of 1957
cd/m2. Then using equation 4.12 from Chapter 4.
π.Lz = Eh = 6147 lux
This result corresponds fairly well with field data recorded at 7000 lux under clear sky
with the direct solar beam shaded. The HGI was 74.8 Klux.
Illuminance values measured in lux were recorded within the room in set grid
positions across the floor and on the work height using a tripod to mount the light
meter.
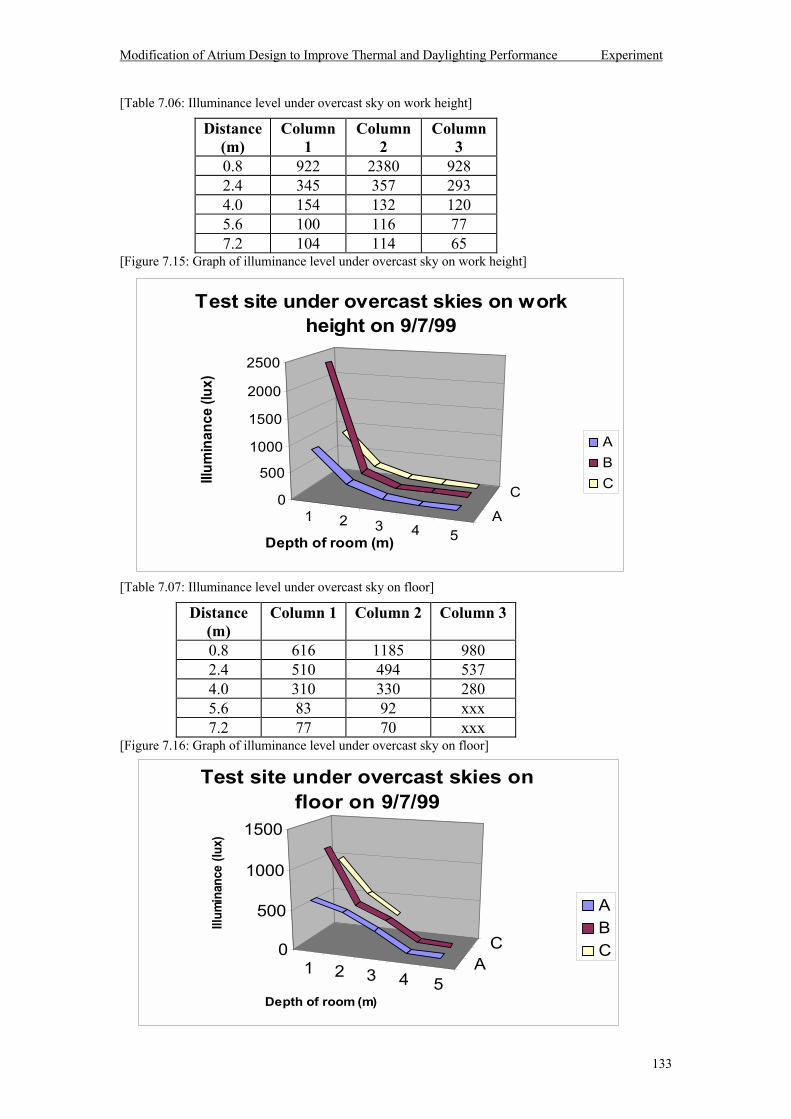
Modification of Atrium Design to Improve Thermal and Daylighting Performance Experiment
133
[Table 7.06: Illuminance level under overcast sky on work height]
Distance (m)
Column 1
Column 2
Column 3
0.8 922 2380 928 2.4 345 357 293 4.0 154 132 120 5.6 100 116 77 7.2 104 114 65
[Figure 7.15: Graph of illuminance level under overcast sky on work height]
[Table 7.07: Illuminance level under overcast sky on floor]
Distance (m)
Column 1 Column 2 Column 3
0.8 616 1185 980 2.4 510 494 537 4.0 310 330 280 5.6 83 92 xxx 7.2 77 70 xxx
[Figure 7.16: Graph of illuminance level under overcast sky on floor]
1 2 3 4 5A
C0
500
1000
1500
2000
2500
Illum
inan
ce (l
ux)
Depth of room (m)
Test site under overcast skies on work height on 9/7/99
ABC
1 2 3 4 5A
C0
500
1000
1500
Illum
inan
ce (l
ux)
Depth of room (m)
Test site under overcast skies on floor on 9/7/99
ABC
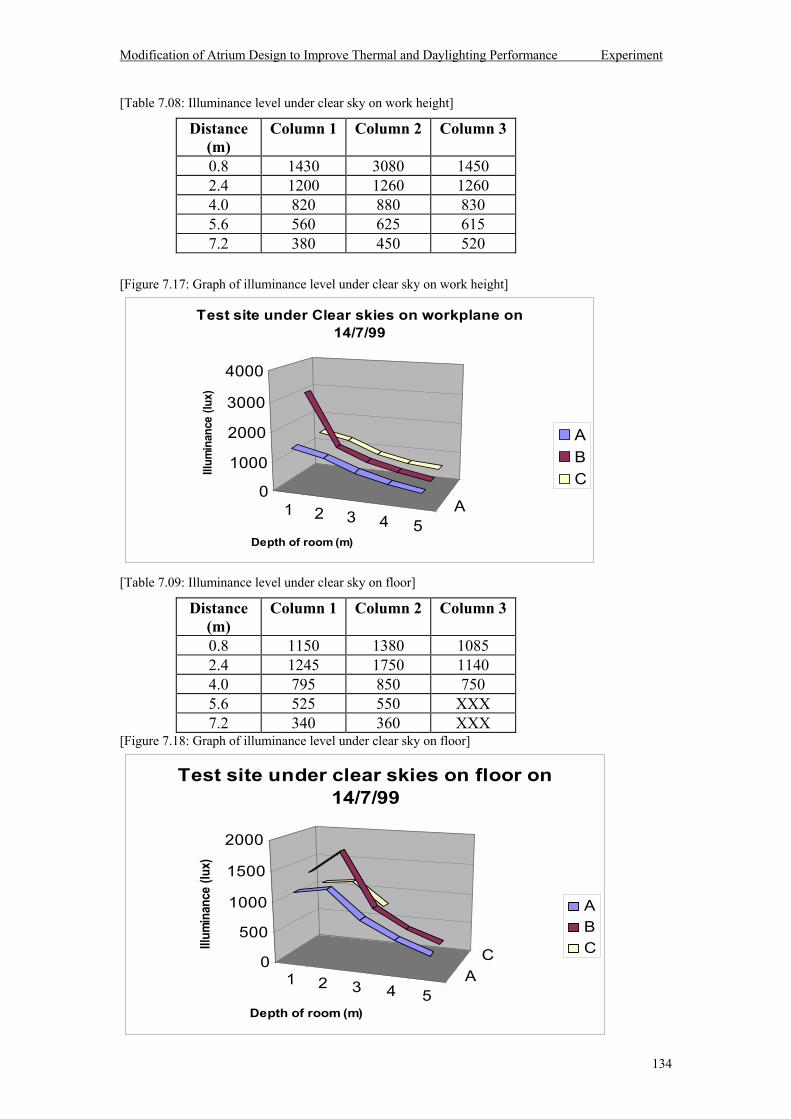
Modification of Atrium Design to Improve Thermal and Daylighting Performance Experiment
134
[Table 7.08: Illuminance level under clear sky on work height]
Distance (m)
Column 1 Column 2 Column 3
0.8 1430 3080 1450 2.4 1200 1260 1260 4.0 820 880 830 5.6 560 625 615 7.2 380 450 520
[Figure 7.17: Graph of illuminance level under clear sky on work height]
[Table 7.09: Illuminance level under clear sky on floor]
Distance (m)
Column 1 Column 2 Column 3
0.8 1150 1380 1085 2.4 1245 1750 1140 4.0 795 850 750 5.6 525 550 XXX 7.2 340 360 XXX
[Figure 7.18: Graph of illuminance level under clear sky on floor]
1 2 3 4 5A
0
1000
2000
3000
4000
Illum
inan
ce (l
ux)
Depth of room (m)
Test site under Clear skies on workplane on 14/7/99
ABC
1 2 3 4 5A
C0
500
1000
1500
2000
Illumi
nanc
e (lu
x)
Depth of room (m)
Test site under clear skies on floor on 14/7/99
ABC
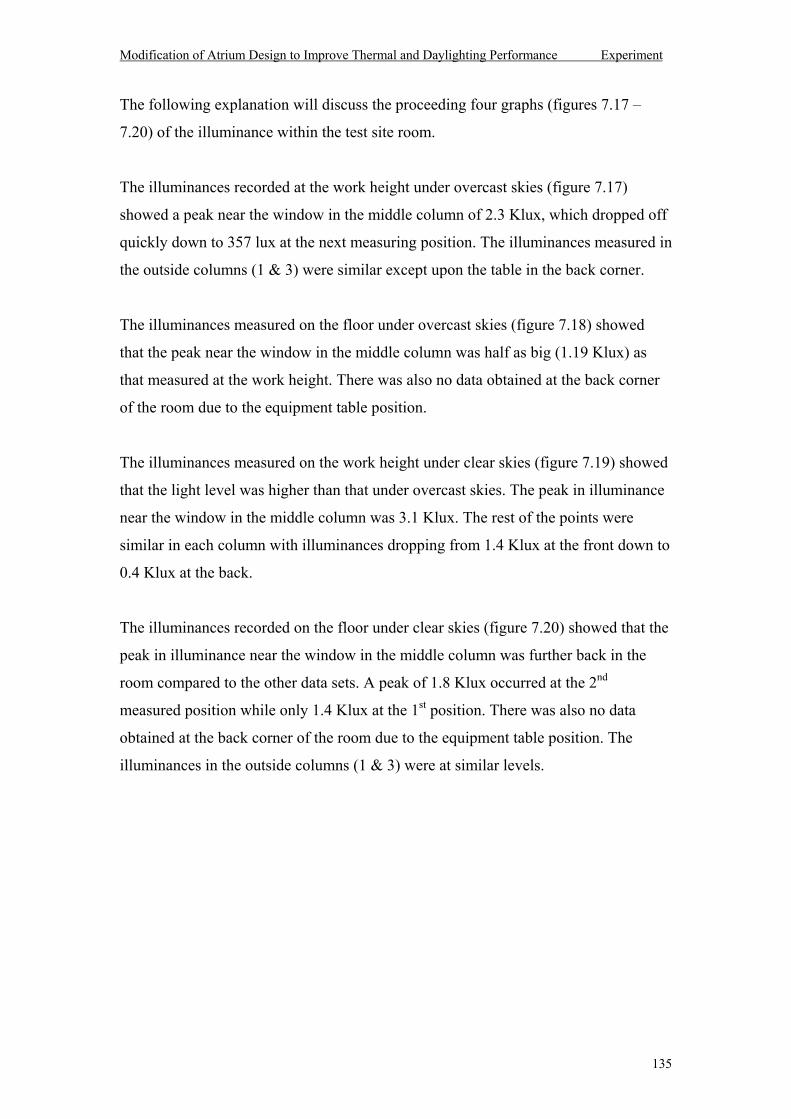
Modification of Atrium Design to Improve Thermal and Daylighting Performance Experiment
135
The following explanation will discuss the proceeding four graphs (figures 7.17
7.20) of the illuminance within the test site room.
The illuminances recorded at the work height under overcast skies (figure 7.17)
showed a peak near the window in the middle column of 2.3 Klux, which dropped off
quickly down to 357 lux at the next measuring position. The illuminances measured in
the outside columns (1 & 3) were similar except upon the table in the back corner.
The illuminances measured on the floor under overcast skies (figure 7.18) showed
that the peak near the window in the middle column was half as big (1.19 Klux) as
that measured at the work height. There was also no data obtained at the back corner
of the room due to the equipment table position.
The illuminances measured on the work height under clear skies (figure 7.19) showed
that the light level was higher than that under overcast skies. The peak in illuminance
near the window in the middle column was 3.1 Klux. The rest of the points were
similar in each column with illuminances dropping from 1.4 Klux at the front down to
0.4 Klux at the back.
The illuminances recorded on the floor under clear skies (figure 7.20) showed that the
peak in illuminance near the window in the middle column was further back in the
room compared to the other data sets. A peak of 1.8 Klux occurred at the 2nd
measured position while only 1.4 Klux at the 1st position. There was also no data
obtained at the back corner of the room due to the equipment table position. The
illuminances in the outside columns (1 & 3) were at similar levels.
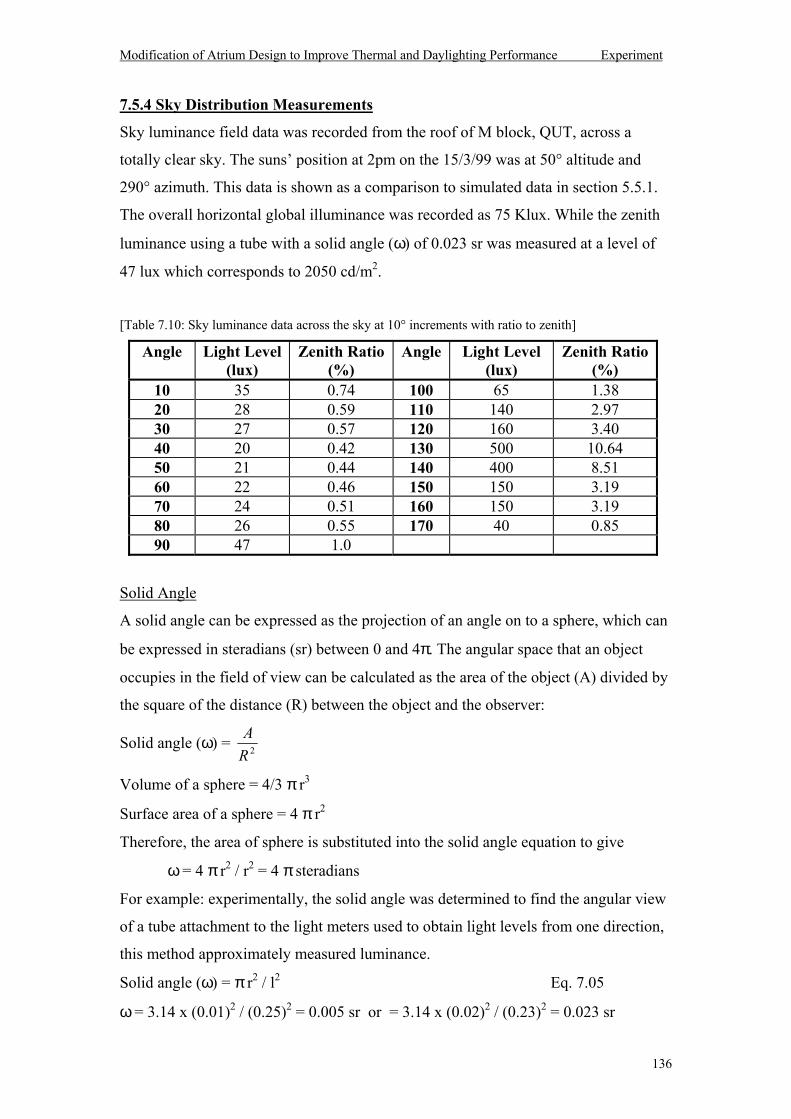
Modification of Atrium Design to Improve Thermal and Daylighting Performance Experiment
136
7.5.4 Sky Distribution Measurements
Sky luminance field data was recorded from the roof of M block, QUT, across a
totally clear sky. The suns position at 2pm on the 15/3/99 was at 50° altitude and
290° azimuth. This data is shown as a comparison to simulated data in section 5.5.1.
The overall horizontal global illuminance was recorded as 75 Klux. While the zenith
luminance using a tube with a solid angle (ω) of 0.023 sr was measured at a level of
47 lux which corresponds to 2050 cd/m2.
[Table 7.10: Sky luminance data across the sky at 10° increments with ratio to zenith]
Angle Light Level (lux)
Zenith Ratio (%)
Angle Light Level (lux)
Zenith Ratio (%)
10 35 0.74 100 65 1.38 20 28 0.59 110 140 2.97 30 27 0.57 120 160 3.40 40 20 0.42 130 500 10.64 50 21 0.44 140 400 8.51 60 22 0.46 150 150 3.19 70 24 0.51 160 150 3.19 80 26 0.55 170 40 0.85 90 47 1.0
Solid Angle
A solid angle can be expressed as the projection of an angle on to a sphere, which can
be expressed in steradians (sr) between 0 and 4π. The angular space that an object
occupies in the field of view can be calculated as the area of the object (A) divided by
the square of the distance (R) between the object and the observer:
Solid angle (ω) = 2RA
Volume of a sphere = 4/3 π r3
Surface area of a sphere = 4 π r2
Therefore, the area of sphere is substituted into the solid angle equation to give
ω = 4 π r2 / r2 = 4 π steradians
For example: experimentally, the solid angle was determined to find the angular view
of a tube attachment to the light meters used to obtain light levels from one direction,
this method approximately measured luminance.
Solid angle (ω) = π r2 / l2 Eq. 7.05
ω = 3.14 x (0.01)2 / (0.25)2 = 0.005 sr or = 3.14 x (0.02)2 / (0.23)2 = 0.023 sr
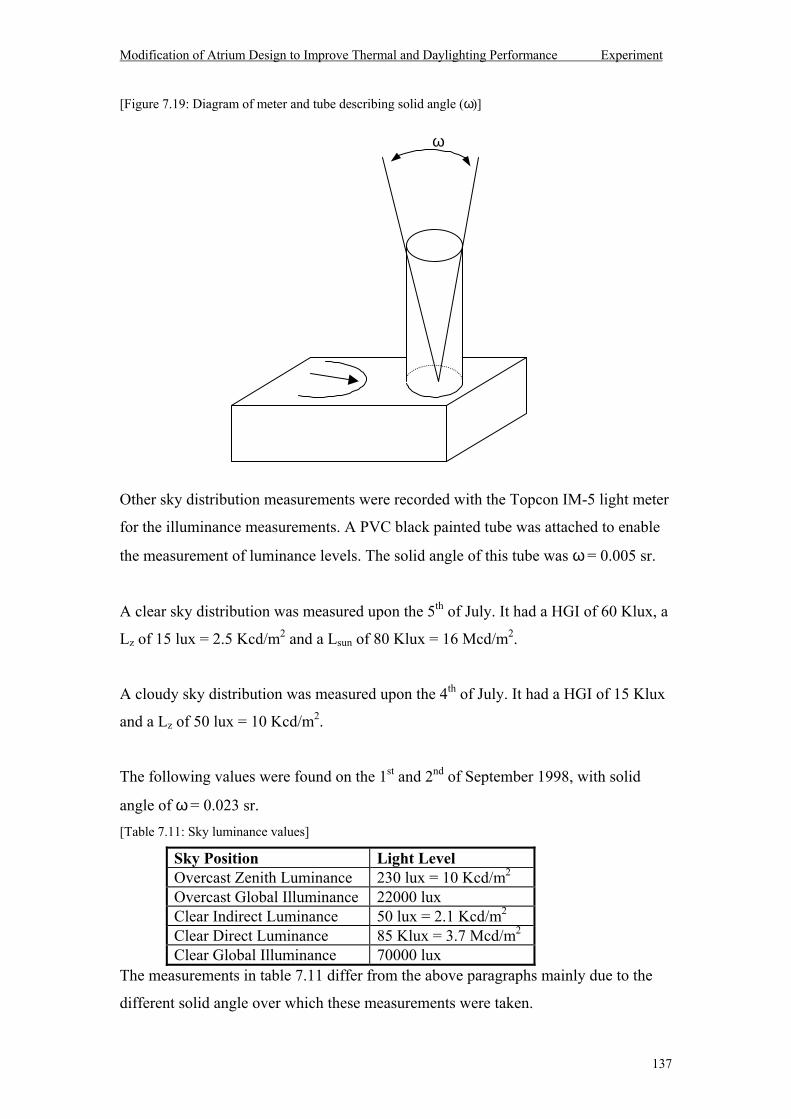
Modification of Atrium Design to Improve Thermal and Daylighting Performance Experiment
137
[Figure 7.19: Diagram of meter and tube describing solid angle (ω)]
Other sky distribution measurements were recorded with the Topcon IM-5 light meter
for the illuminance measurements. A PVC black painted tube was attached to enable
the measurement of luminance levels. The solid angle of this tube was ω = 0.005 sr.
A clear sky distribution was measured upon the 5th of July. It had a HGI of 60 Klux, a
Lz of 15 lux = 2.5 Kcd/m2 and a Lsun of 80 Klux = 16 Mcd/m2.
A cloudy sky distribution was measured upon the 4th of July. It had a HGI of 15 Klux
and a Lz of 50 lux = 10 Kcd/m2.
The following values were found on the 1st and 2nd of September 1998, with solid
angle of ω = 0.023 sr. [Table 7.11: Sky luminance values]
Sky Position Light Level Overcast Zenith Luminance 230 lux = 10 Kcd/m2 Overcast Global Illuminance 22000 lux Clear Indirect Luminance 50 lux = 2.1 Kcd/m2 Clear Direct Luminance 85 Klux = 3.7 Mcd/m2 Clear Global Illuminance 70000 lux
The measurements in table 7.11 differ from the above paragraphs mainly due to the
different solid angle over which these measurements were taken.
ω
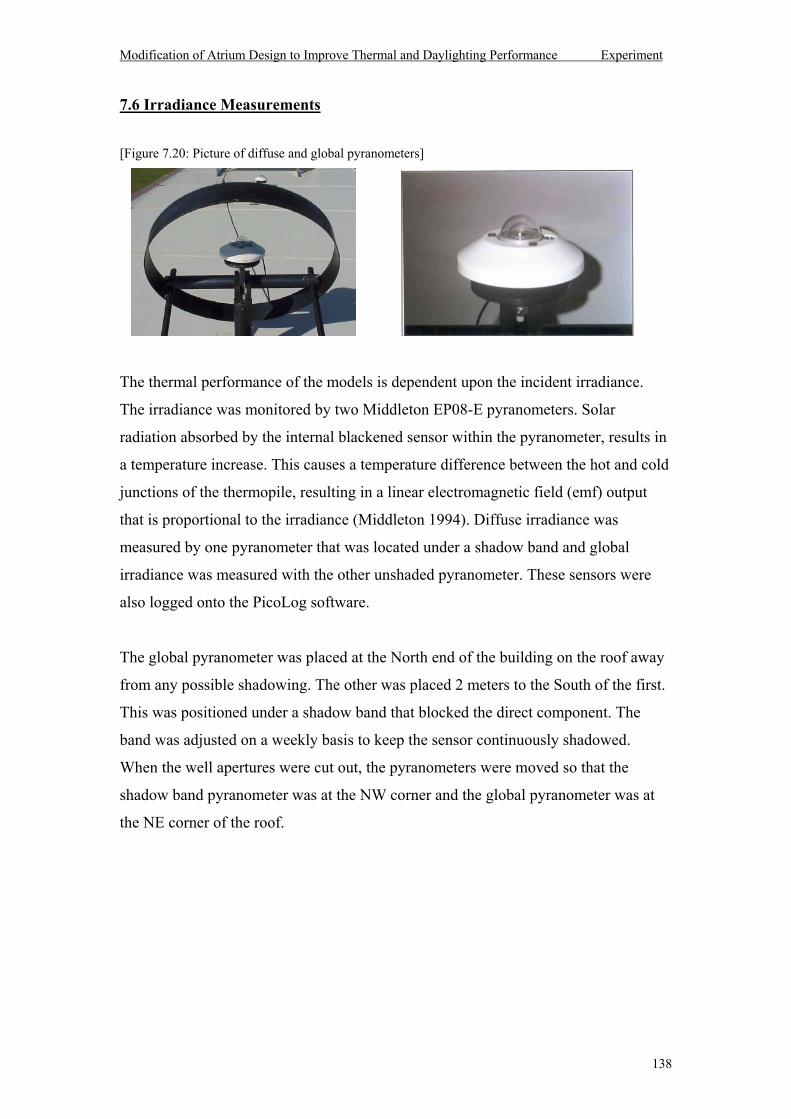
Modification of Atrium Design to Improve Thermal and Daylighting Performance Experiment
138
7.6 Irradiance Measurements
[Figure 7.20: Picture of diffuse and global pyranometers]
The thermal performance of the models is dependent upon the incident irradiance.
The irradiance was monitored by two Middleton EP08-E pyranometers. Solar
radiation absorbed by the internal blackened sensor within the pyranometer, results in
a temperature increase. This causes a temperature difference between the hot and cold
junctions of the thermopile, resulting in a linear electromagnetic field (emf) output
that is proportional to the irradiance (Middleton 1994). Diffuse irradiance was
measured by one pyranometer that was located under a shadow band and global
irradiance was measured with the other unshaded pyranometer. These sensors were
also logged onto the PicoLog software.
The global pyranometer was placed at the North end of the building on the roof away
from any possible shadowing. The other was placed 2 meters to the South of the first.
This was positioned under a shadow band that blocked the direct component. The
band was adjusted on a weekly basis to keep the sensor continuously shadowed.
When the well apertures were cut out, the pyranometers were moved so that the
shadow band pyranometer was at the NW corner and the global pyranometer was at
the NE corner of the roof.
Modification of Atrium Design to Improve Thermal and Daylighting Performance Experiment
139
The equation within the PicoLog software to convert the input voltages from the
sensors into the real world parameter of irradiance in Watts per metre squared were:
Global = 1000 x A / 0.91 Eq. 7.06
Diffuse = 1000 x A / 1.07 Eq. 7.07
Where A is the input voltage.
The irradiance data logging began several months before the temperature logging and
concluded at the same time when the building was damaged.
Diffuse and global irradiance data was collected over a period of 10 months at the
daylighting research test site. Within the 4 month period of July to October 1999, 6
separate days are presented below that represent the 3 different sky cloud cover
conditions of clear, intermediate and overcast.
A series of corrections were applied to the raw irradiance data that was collected from
the instruments monitored at the test site. These corrections included the initial
calibration between the meters to allow for slightly different sensitivities between the
sensors.
The initial correction was:
Diffuse (correction 1) = 1.0217 x diffuse - 2.0235 Eq. 7.08
The diffuse irradiance must also be corrected for the effect of the shadow band which
blocks out more than just the view of the sun.
The correction factor (cf) is added to the diffuse measurement, where:
cf = 1/(1-X) Eq. 7.09
and X is found from Drummond and Roche (1965):
X = (2w/π.r). cos3 (dec).[t. sin(lat).sin(dec) + cos(lat).cos(dec).sin(hra)] Eq. 7.10
where:
hra = hour angle of sun
w = width of shadow band (80 mm)
r = radius of shadow band (310 mm)
lat = latitude of site
dec = declination of site
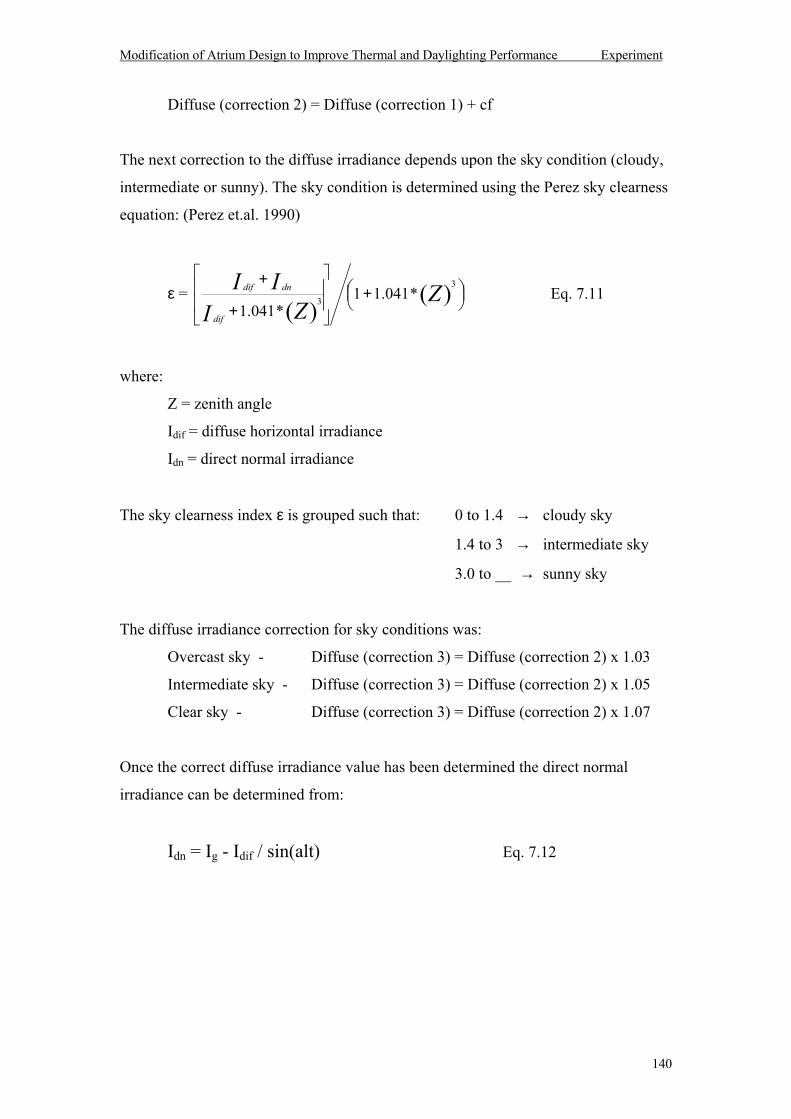
Modification of Atrium Design to Improve Thermal and Daylighting Performance Experiment
140
Diffuse (correction 2) = Diffuse (correction 1) + cf
The next correction to the diffuse irradiance depends upon the sky condition (cloudy,
intermediate or sunny). The sky condition is determined using the Perez sky clearness
equation: (Perez et.al. 1990)
ε =
+
+
+)(
)(3
3 *041.11*041.1
ZZI
IIdif
dndif Eq. 7.11
where:
Z = zenith angle
Idif = diffuse horizontal irradiance
Idn = direct normal irradiance
The sky clearness index ε is grouped such that: 0 to 1.4 → cloudy sky
1.4 to 3 → intermediate sky
3.0 to __ → sunny sky
The diffuse irradiance correction for sky conditions was:
Overcast sky - Diffuse (correction 3) = Diffuse (correction 2) x 1.03
Intermediate sky - Diffuse (correction 3) = Diffuse (correction 2) x 1.05
Clear sky - Diffuse (correction 3) = Diffuse (correction 2) x 1.07
Once the correct diffuse irradiance value has been determined the direct normal
irradiance can be determined from:
Idn = Ig - Idif / sin(alt) Eq. 7.12
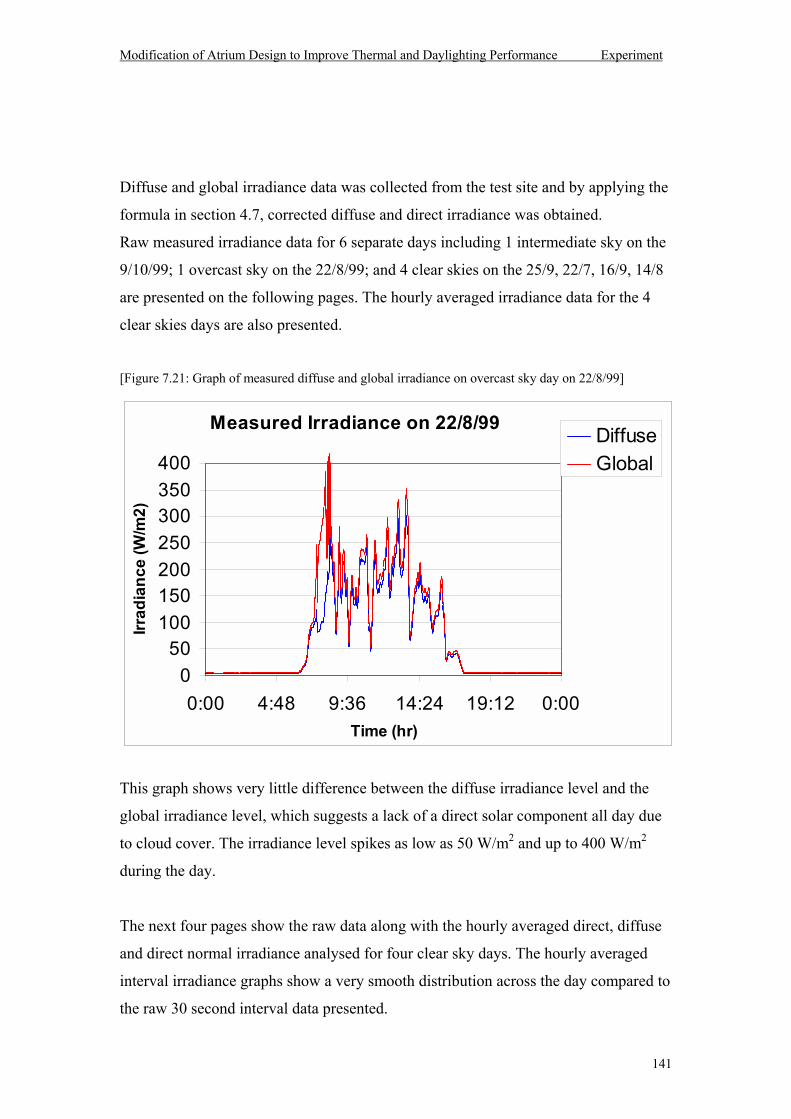
Modification of Atrium Design to Improve Thermal and Daylighting Performance Experiment
141
Diffuse and global irradiance data was collected from the test site and by applying the
formula in section 4.7, corrected diffuse and direct irradiance was obtained.
Raw measured irradiance data for 6 separate days including 1 intermediate sky on the
9/10/99; 1 overcast sky on the 22/8/99; and 4 clear skies on the 25/9, 22/7, 16/9, 14/8
are presented on the following pages. The hourly averaged irradiance data for the 4
clear skies days are also presented.
[Figure 7.21: Graph of measured diffuse and global irradiance on overcast sky day on 22/8/99]
This graph shows very little difference between the diffuse irradiance level and the
global irradiance level, which suggests a lack of a direct solar component all day due
to cloud cover. The irradiance level spikes as low as 50 W/m2 and up to 400 W/m2
during the day.
The next four pages show the raw data along with the hourly averaged direct, diffuse
and direct normal irradiance analysed for four clear sky days. The hourly averaged
interval irradiance graphs show a very smooth distribution across the day compared to
the raw 30 second interval data presented.
Measured Irradiance on 22/8/99
050
100150200250300350400
0:00 4:48 9:36 14:24 19:12 0:00Time (hr)
Irrad
ianc
e (W
/m2)
DiffuseGlobal
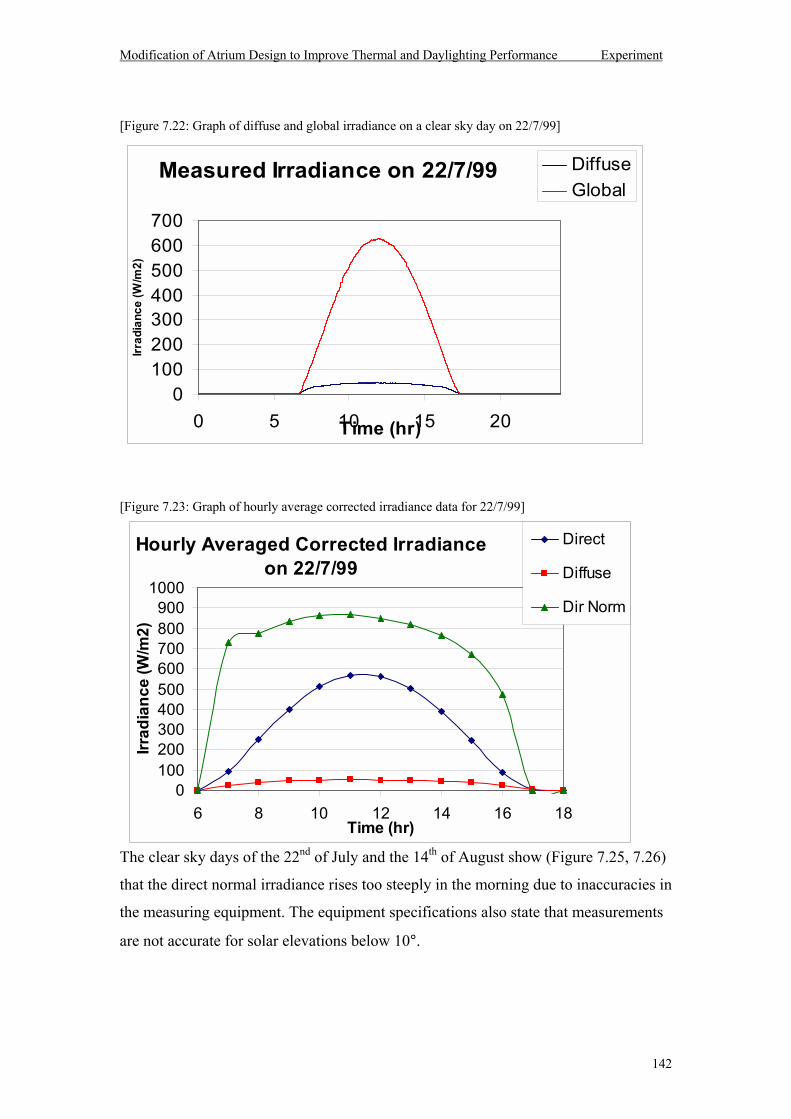
Modification of Atrium Design to Improve Thermal and Daylighting Performance Experiment
142
[Figure 7.22: Graph of diffuse and global irradiance on a clear sky day on 22/7/99]
[Figure 7.23: Graph of hourly average corrected irradiance data for 22/7/99]
The clear sky days of the 22nd of July and the 14th of August show (Figure 7.25, 7.26)
that the direct normal irradiance rises too steeply in the morning due to inaccuracies in
the measuring equipment. The equipment specifications also state that measurements
are not accurate for solar elevations below 10°.
Measured Irradiance on 22/7/99
0100200300400500600700
0 5 10 15 20Time (hr)
Irrad
ianc
e (W
/m2)
DiffuseGlobal
Hourly Averaged Corrected Irradiance on 22/7/99
0100200300400500600700800900
1000
6 8 10 12 14 16 18Time (hr)
Irrad
ianc
e (W
/m2)
Direct
Diffuse
Dir Norm
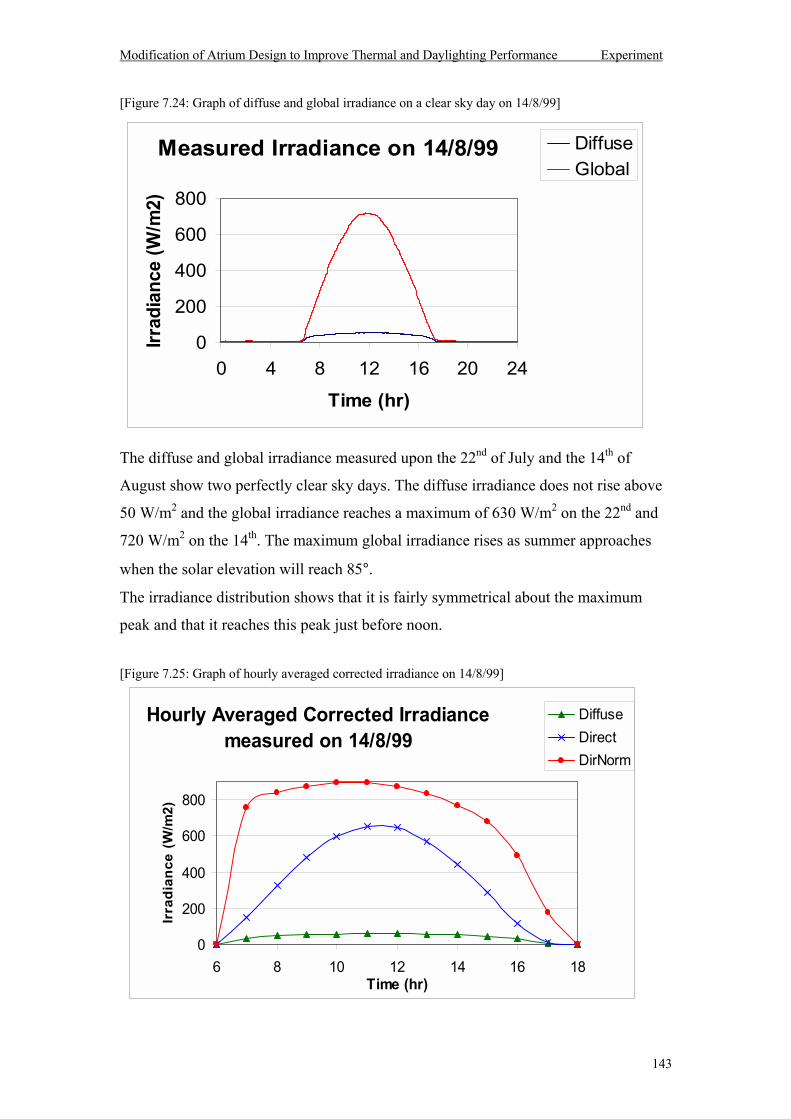
Modification of Atrium Design to Improve Thermal and Daylighting Performance Experiment
143
[Figure 7.24: Graph of diffuse and global irradiance on a clear sky day on 14/8/99]
The diffuse and global irradiance measured upon the 22nd of July and the 14th of
August show two perfectly clear sky days. The diffuse irradiance does not rise above
50 W/m2 and the global irradiance reaches a maximum of 630 W/m2 on the 22nd and
720 W/m2 on the 14th. The maximum global irradiance rises as summer approaches
when the solar elevation will reach 85°.
The irradiance distribution shows that it is fairly symmetrical about the maximum
peak and that it reaches this peak just before noon.
[Figure 7.25: Graph of hourly averaged corrected irradiance on 14/8/99]
Measured Irradiance on 14/8/99
0
200
400
600
800
0 4 8 12 16 20 24
Time (hr)
Irrad
ianc
e (W
/m2)
DiffuseGlobal
Hourly Averaged Corrected Irradiance measured on 14/8/99
0
200
400
600
800
6 8 10 12 14 16 18Time (hr)
Irra
dian
ce (W
/m2)
DiffuseDirectDirNorm
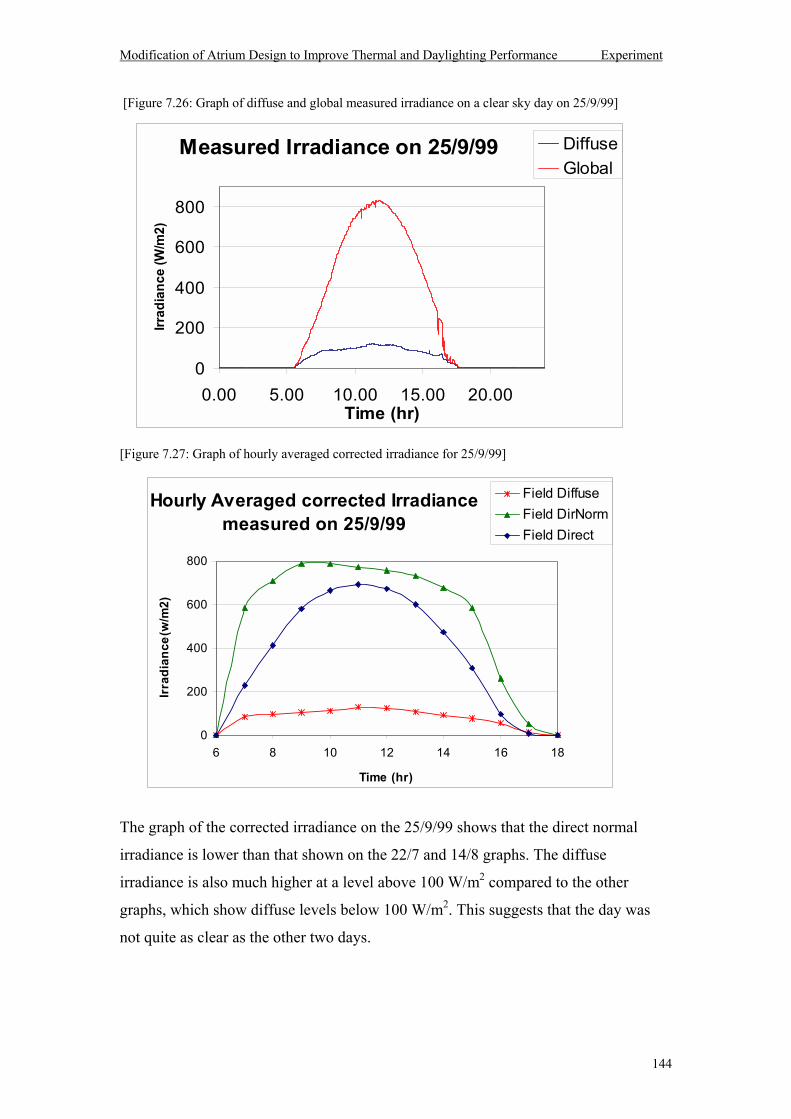
Modification of Atrium Design to Improve Thermal and Daylighting Performance Experiment
144
[Figure 7.26: Graph of diffuse and global measured irradiance on a clear sky day on 25/9/99]
[Figure 7.27: Graph of hourly averaged corrected irradiance for 25/9/99]
The graph of the corrected irradiance on the 25/9/99 shows that the direct normal
irradiance is lower than that shown on the 22/7 and 14/8 graphs. The diffuse
irradiance is also much higher at a level above 100 W/m2 compared to the other
graphs, which show diffuse levels below 100 W/m2. This suggests that the day was
not quite as clear as the other two days.
Measured Irradiance on 25/9/99
0
200
400
600
800
0.00 5.00 10.00 15.00 20.00Time (hr)
Irrad
ianc
e (W
/m2)
DiffuseGlobal
Hourly Averaged corrected Irradiance measured on 25/9/99
0
200
400
600
800
6 8 10 12 14 16 18
Time (hr)
Irra
dian
ce(w
/m2)
Field DiffuseField DirNormField Direct
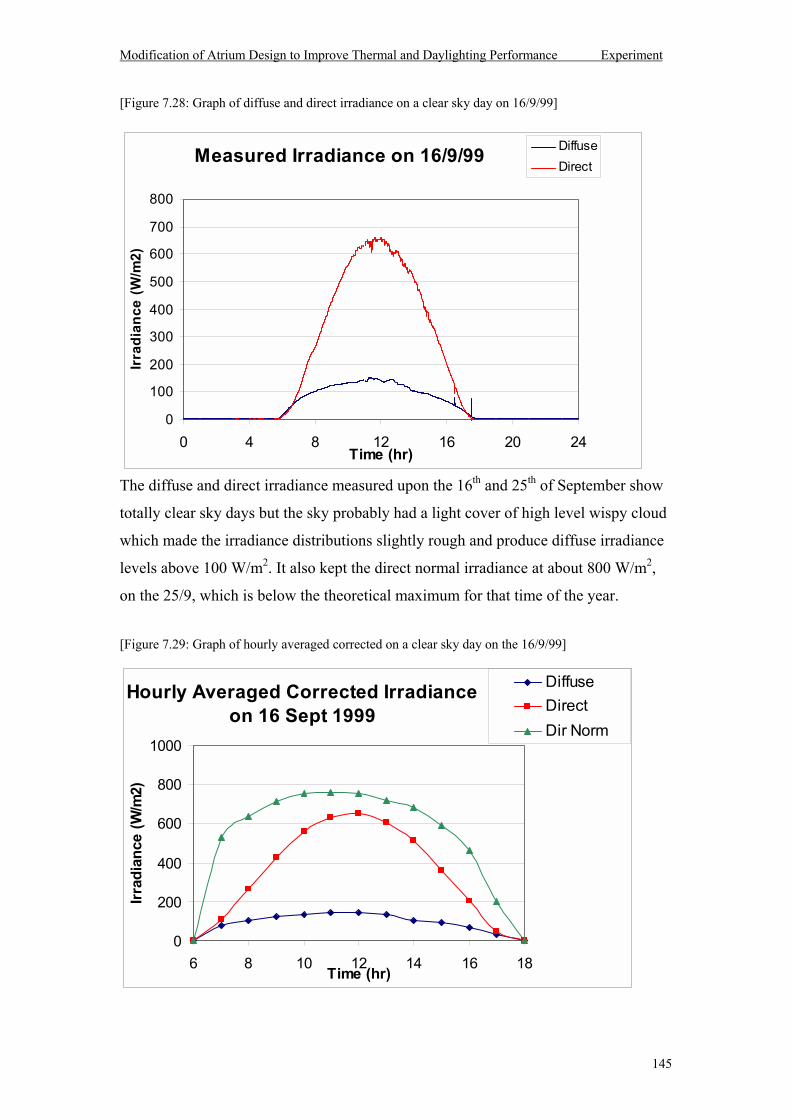
Modification of Atrium Design to Improve Thermal and Daylighting Performance Experiment
145
[Figure 7.28: Graph of diffuse and direct irradiance on a clear sky day on 16/9/99]
The diffuse and direct irradiance measured upon the 16th and 25th of September show
totally clear sky days but the sky probably had a light cover of high level wispy cloud
which made the irradiance distributions slightly rough and produce diffuse irradiance
levels above 100 W/m2. It also kept the direct normal irradiance at about 800 W/m2,
on the 25/9, which is below the theoretical maximum for that time of the year.
[Figure 7.29: Graph of hourly averaged corrected on a clear sky day on the 16/9/99]
Measured Irradiance on 16/9/99
0
100
200
300
400
500
600
700
800
0 4 8 12 16 20 24Time (hr)
Irra
dian
ce (W
/m2)
DiffuseDirect
Hourly Averaged Corrected Irradiance on 16 Sept 1999
0
200
400
600
800
1000
6 8 10 12 14 16 18Time (hr)
Irrad
ianc
e (W
/m2)
DiffuseDirectDir Norm
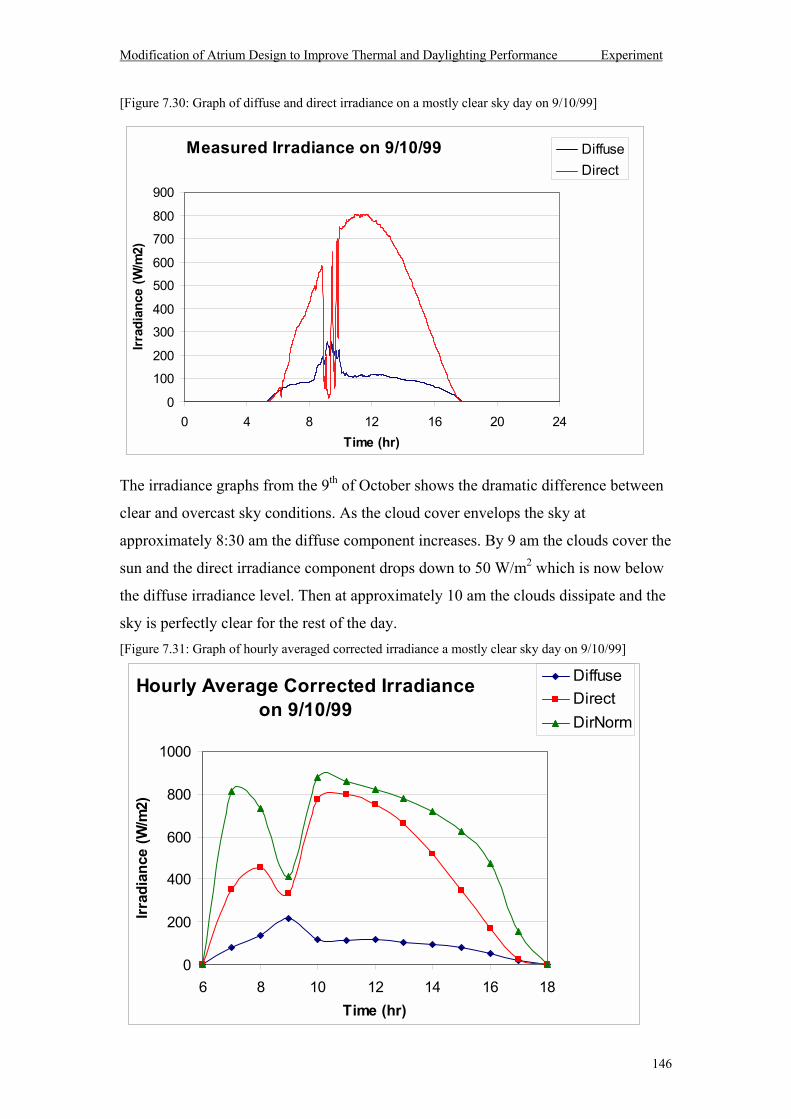
Modification of Atrium Design to Improve Thermal and Daylighting Performance Experiment
146
[Figure 7.30: Graph of diffuse and direct irradiance on a mostly clear sky day on 9/10/99]
The irradiance graphs from the 9th of October shows the dramatic difference between
clear and overcast sky conditions. As the cloud cover envelops the sky at
approximately 8:30 am the diffuse component increases. By 9 am the clouds cover the
sun and the direct irradiance component drops down to 50 W/m2 which is now below
the diffuse irradiance level. Then at approximately 10 am the clouds dissipate and the
sky is perfectly clear for the rest of the day. [Figure 7.31: Graph of hourly averaged corrected irradiance a mostly clear sky day on 9/10/99]
Measured Irradiance on 9/10/99
0
100
200
300
400
500
600
700
800
900
0 4 8 12 16 20 24Time (hr)
Irrad
ianc
e (W
/m2)
DiffuseDirect
Hourly Average Corrected Irradiance on 9/10/99
0
200
400
600
800
1000
6 8 10 12 14 16 18Time (hr)
Irrad
ianc
e (W
/m2)
DiffuseDirectDirNorm
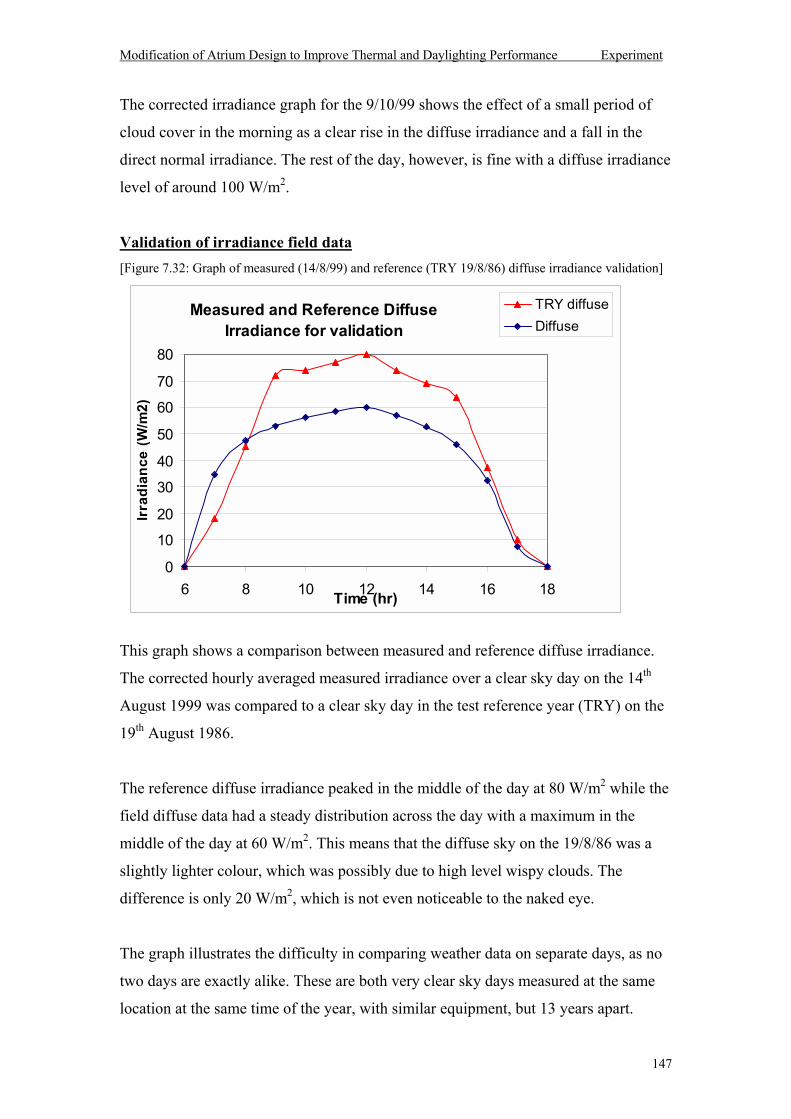
Modification of Atrium Design to Improve Thermal and Daylighting Performance Experiment
147
The corrected irradiance graph for the 9/10/99 shows the effect of a small period of
cloud cover in the morning as a clear rise in the diffuse irradiance and a fall in the
direct normal irradiance. The rest of the day, however, is fine with a diffuse irradiance
level of around 100 W/m2.
Validation of irradiance field data [Figure 7.32: Graph of measured (14/8/99) and reference (TRY 19/8/86) diffuse irradiance validation]
This graph shows a comparison between measured and reference diffuse irradiance.
The corrected hourly averaged measured irradiance over a clear sky day on the 14th
August 1999 was compared to a clear sky day in the test reference year (TRY) on the
19th August 1986.
The reference diffuse irradiance peaked in the middle of the day at 80 W/m2 while the
field diffuse data had a steady distribution across the day with a maximum in the
middle of the day at 60 W/m2. This means that the diffuse sky on the 19/8/86 was a
slightly lighter colour, which was possibly due to high level wispy clouds. The
difference is only 20 W/m2, which is not even noticeable to the naked eye.
The graph illustrates the difficulty in comparing weather data on separate days, as no
two days are exactly alike. These are both very clear sky days measured at the same
location at the same time of the year, with similar equipment, but 13 years apart.
Measured and Reference Diffuse Irradiance for validation
0
10
20
30
40
50
60
70
80
6 8 10 12 14 16 18Time (hr)
Irra
dian
ce (W
/m2)
TRY diffuseDiffuse
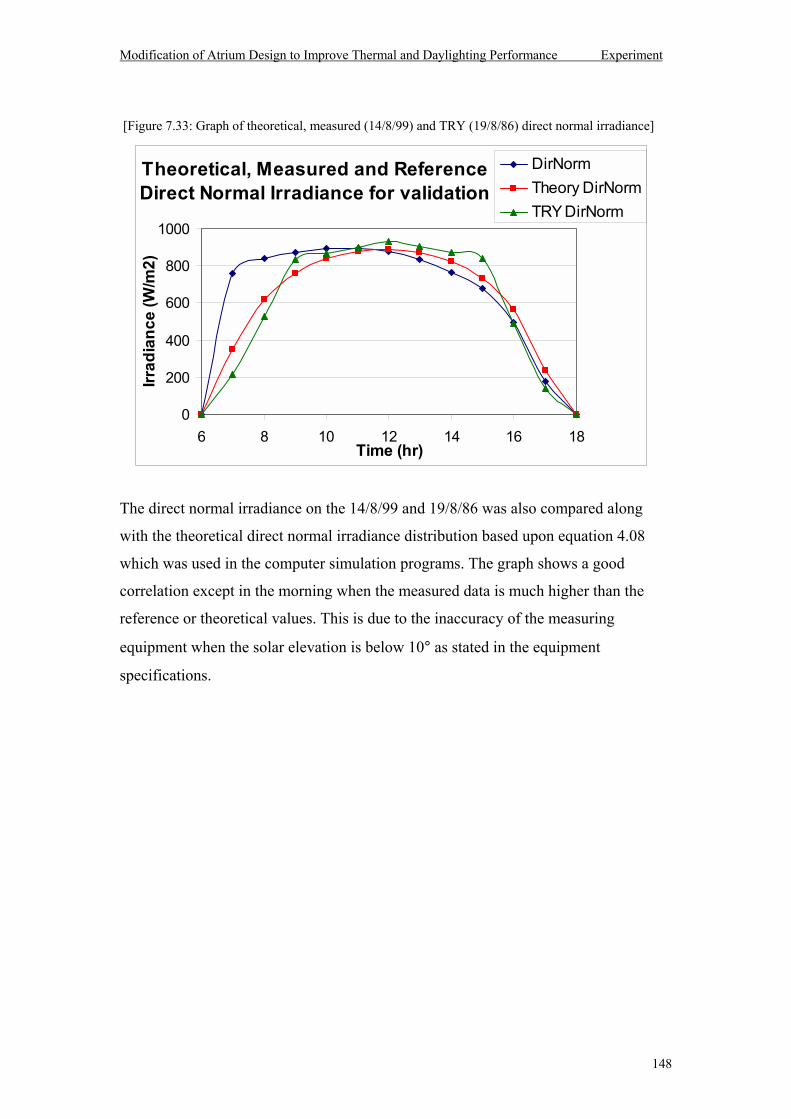
Modification of Atrium Design to Improve Thermal and Daylighting Performance Experiment
148
[Figure 7.33: Graph of theoretical, measured (14/8/99) and TRY (19/8/86) direct normal irradiance]
The direct normal irradiance on the 14/8/99 and 19/8/86 was also compared along
with the theoretical direct normal irradiance distribution based upon equation 4.08
which was used in the computer simulation programs. The graph shows a good
correlation except in the morning when the measured data is much higher than the
reference or theoretical values. This is due to the inaccuracy of the measuring
equipment when the solar elevation is below 10° as stated in the equipment
specifications.
Theoretical, Measured and Reference Direct Normal Irradiance for validation
0
200
400
600
800
1000
6 8 10 12 14 16 18Time (hr)
Irrad
ianc
e (W
/m2)
DirNormTheory DirNormTRY DirNorm
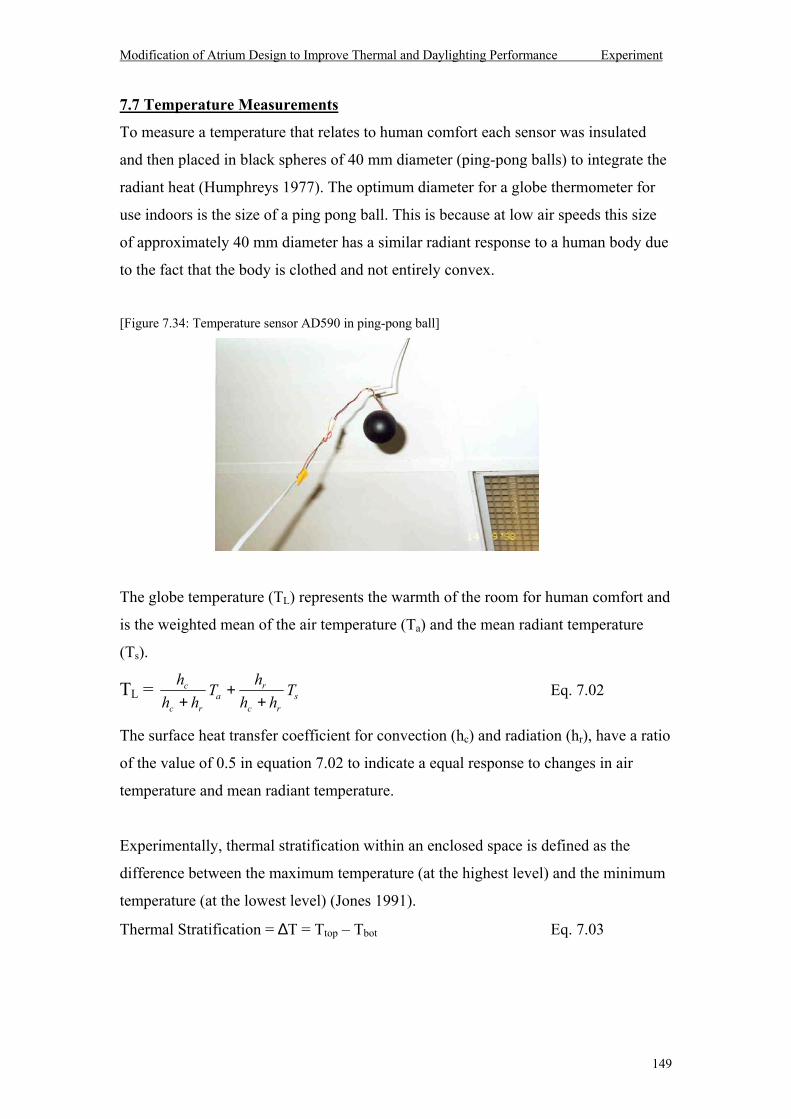
Modification of Atrium Design to Improve Thermal and Daylighting Performance Experiment
149
7.7 Temperature Measurements
To measure a temperature that relates to human comfort each sensor was insulated
and then placed in black spheres of 40 mm diameter (ping-pong balls) to integrate the
radiant heat (Humphreys 1977). The optimum diameter for a globe thermometer for
use indoors is the size of a ping pong ball. This is because at low air speeds this size
of approximately 40 mm diameter has a similar radiant response to a human body due
to the fact that the body is clothed and not entirely convex.
[Figure 7.34: Temperature sensor AD590 in ping-pong ball]
The globe temperature (TL) represents the warmth of the room for human comfort and
is the weighted mean of the air temperature (Ta) and the mean radiant temperature
(Ts).
TL = hh h
Th
h hTc
c ra
r
c rs+
++
Eq. 7.02
The surface heat transfer coefficient for convection (hc) and radiation (hr), have a ratio
of the value of 0.5 in equation 7.02 to indicate a equal response to changes in air
temperature and mean radiant temperature.
Experimentally, thermal stratification within an enclosed space is defined as the
difference between the maximum temperature (at the highest level) and the minimum
temperature (at the lowest level) (Jones 1991).
Thermal Stratification = ∆T = Ttop Tbot Eq. 7.03
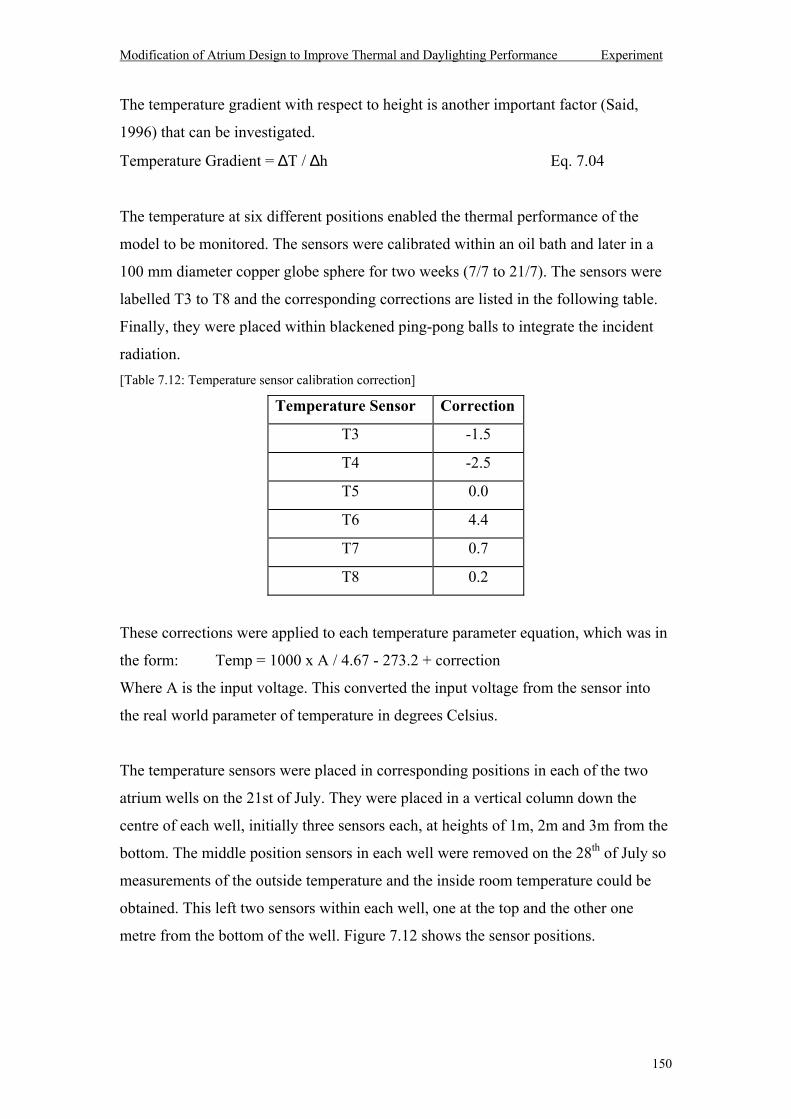
Modification of Atrium Design to Improve Thermal and Daylighting Performance Experiment
150
The temperature gradient with respect to height is another important factor (Said,
1996) that can be investigated.
Temperature Gradient = ∆T / ∆h Eq. 7.04
The temperature at six different positions enabled the thermal performance of the
model to be monitored. The sensors were calibrated within an oil bath and later in a
100 mm diameter copper globe sphere for two weeks (7/7 to 21/7). The sensors were
labelled T3 to T8 and the corresponding corrections are listed in the following table.
Finally, they were placed within blackened ping-pong balls to integrate the incident
radiation. [Table 7.12: Temperature sensor calibration correction]
Temperature Sensor Correction
T3 -1.5
T4 -2.5
T5 0.0
T6 4.4
T7 0.7
T8 0.2
These corrections were applied to each temperature parameter equation, which was in
the form: Temp = 1000 x A / 4.67 - 273.2 + correction
Where A is the input voltage. This converted the input voltage from the sensor into
the real world parameter of temperature in degrees Celsius.
The temperature sensors were placed in corresponding positions in each of the two
atrium wells on the 21st of July. They were placed in a vertical column down the
centre of each well, initially three sensors each, at heights of 1m, 2m and 3m from the
bottom. The middle position sensors in each well were removed on the 28th of July so
measurements of the outside temperature and the inside room temperature could be
obtained. This left two sensors within each well, one at the top and the other one
metre from the bottom of the well. Figure 7.12 shows the sensor positions.
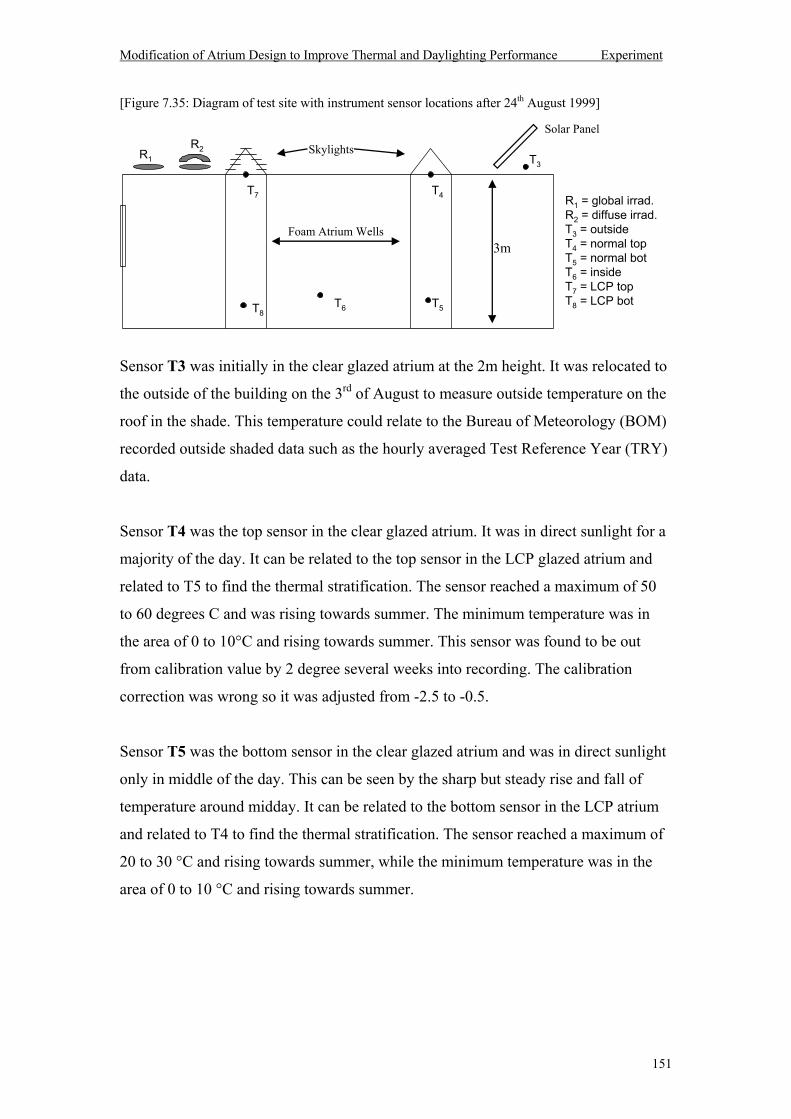
Modification of Atrium Design to Improve Thermal and Daylighting Performance Experiment
151
[Figure 7.35: Diagram of test site with instrument sensor locations after 24th August 1999]
Sensor T3 was initially in the clear glazed atrium at the 2m height. It was relocated to
the outside of the building on the 3rd of August to measure outside temperature on the
roof in the shade. This temperature could relate to the Bureau of Meteorology (BOM)
recorded outside shaded data such as the hourly averaged Test Reference Year (TRY)
data.
Sensor T4 was the top sensor in the clear glazed atrium. It was in direct sunlight for a
majority of the day. It can be related to the top sensor in the LCP glazed atrium and
related to T5 to find the thermal stratification. The sensor reached a maximum of 50
to 60 degrees C and was rising towards summer. The minimum temperature was in
the area of 0 to 10°C and rising towards summer. This sensor was found to be out
from calibration value by 2 degree several weeks into recording. The calibration
correction was wrong so it was adjusted from -2.5 to -0.5.
Sensor T5 was the bottom sensor in the clear glazed atrium and was in direct sunlight
only in middle of the day. This can be seen by the sharp but steady rise and fall of
temperature around midday. It can be related to the bottom sensor in the LCP atrium
and related to T4 to find the thermal stratification. The sensor reached a maximum of
20 to 30 °C and rising towards summer, while the minimum temperature was in the
area of 0 to 10 °C and rising towards summer.
T3
T5
T4
T8
T7
T6
R1 = global irrad.R2 = diffuse irrad.T3 = outsideT4 = normal topT5 = normal botT6 = insideT7 = LCP topT8 = LCP bot
R2R1Skylights
Foam Atrium Wells
Solar Panel
3m
Modification of Atrium Design to Improve Thermal and Daylighting Performance Experiment
152
Sensor T6 was initially positioned in the LCP glazed atrium at the 2m height until the
28th of July when it was placed inside the test room to measure inside temperature. It
was placed at the work height in shade in the room. It was used to find the convection
through the foam atrium well walls found in the thermal simulation program. The
maximum had a distinct thermal mass time lag due to the mass of the building.
Sensor T7 was initially positioned at the bottom of LCP glazed atrium until the 4th of
August when the sensors in the LCP atrium fell down. The sensor was repositioned to
the top of the LCP atrium on the 24th of August and stayed there for the duration of
the measuring period. It can be related to the sensors in the normal glazed atrium and
related to sensor T8 to find the thermal stratification.
Sensor T8 was initially positioned at the top of LCP glazed atrium until the 4th of
August when the sensors in that well fell down. During that period, 4th to 24th of
August, this sensor was in a position to approximate the average temperature in the
well. The sensor was then repositioned to the bottom of the LCP atrium for the
duration of the measuring period. It can be related to the sensors in the normal glazed
atrium and related to sensor T7 to find the thermal stratification.
Experimentally, thermal stratification within a tall, narrow, enclosed space is defined
as the difference between the maximum (highest point) and the minimum (lowest
point) temperature. The goal of monitoring vertically orientated temperature sensors
is to build up a database of field data that enables you to predict the stratification
based upon other variables, see the analysis in Chapter 8.
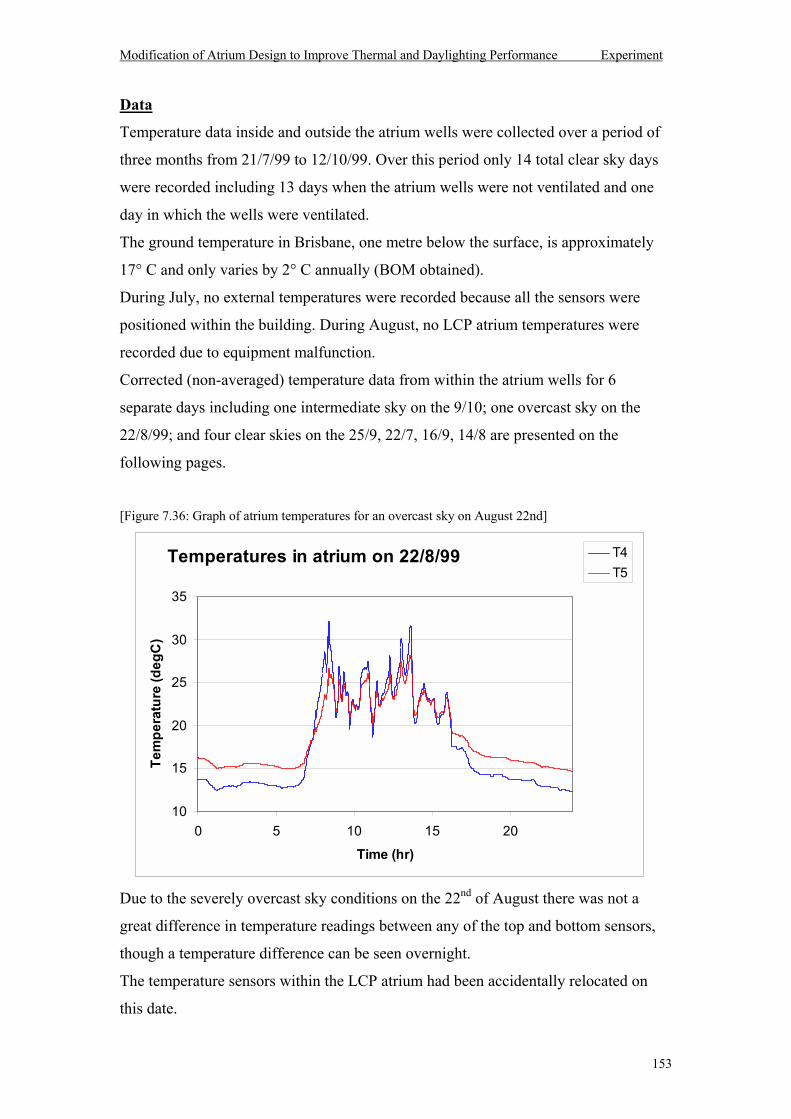
Modification of Atrium Design to Improve Thermal and Daylighting Performance Experiment
153
Data
Temperature data inside and outside the atrium wells were collected over a period of
three months from 21/7/99 to 12/10/99. Over this period only 14 total clear sky days
were recorded including 13 days when the atrium wells were not ventilated and one
day in which the wells were ventilated.
The ground temperature in Brisbane, one metre below the surface, is approximately
17° C and only varies by 2° C annually (BOM obtained).
During July, no external temperatures were recorded because all the sensors were
positioned within the building. During August, no LCP atrium temperatures were
recorded due to equipment malfunction.
Corrected (non-averaged) temperature data from within the atrium wells for 6
separate days including one intermediate sky on the 9/10; one overcast sky on the
22/8/99; and four clear skies on the 25/9, 22/7, 16/9, 14/8 are presented on the
following pages.
[Figure 7.36: Graph of atrium temperatures for an overcast sky on August 22nd]
Due to the severely overcast sky conditions on the 22nd of August there was not a
great difference in temperature readings between any of the top and bottom sensors,
though a temperature difference can be seen overnight.
The temperature sensors within the LCP atrium had been accidentally relocated on
this date.
Temperatures in atrium on 22/8/99
10
15
20
25
30
35
0 5 10 15 20
Time (hr)
Tem
pera
ture
(deg
C)
T4T5
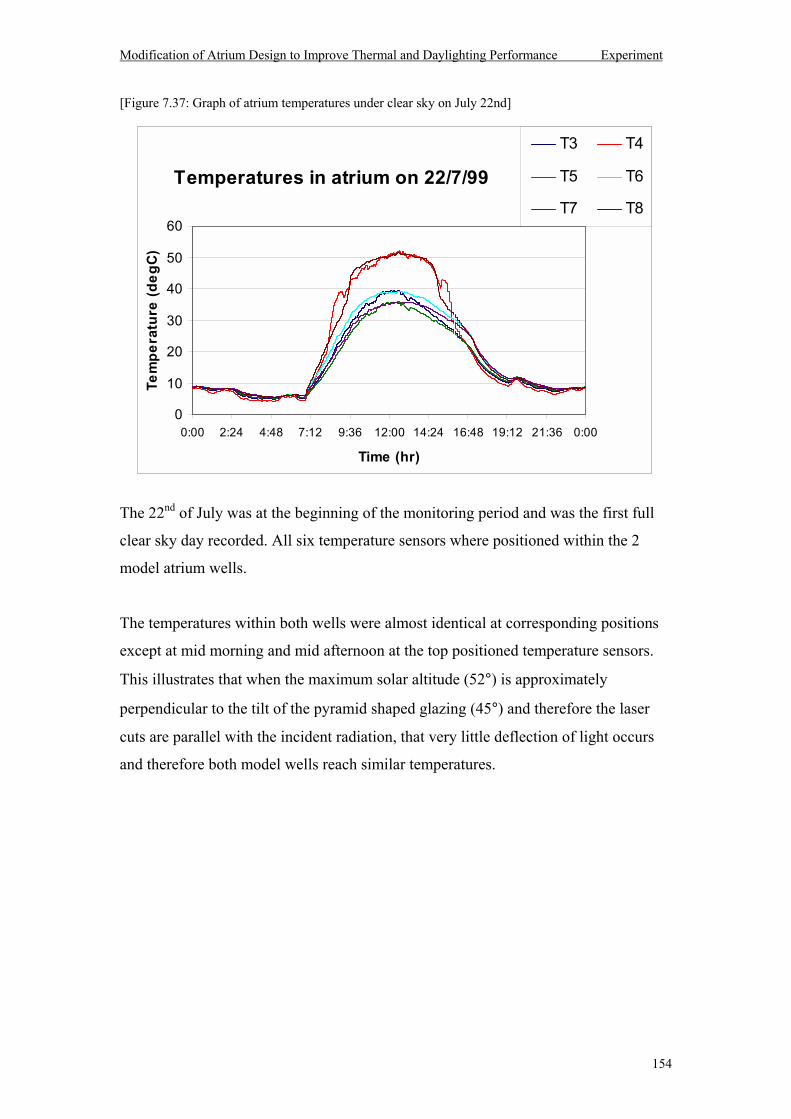
Modification of Atrium Design to Improve Thermal and Daylighting Performance Experiment
154
[Figure 7.37: Graph of atrium temperatures under clear sky on July 22nd]
The 22nd of July was at the beginning of the monitoring period and was the first full
clear sky day recorded. All six temperature sensors where positioned within the 2
model atrium wells.
The temperatures within both wells were almost identical at corresponding positions
except at mid morning and mid afternoon at the top positioned temperature sensors.
This illustrates that when the maximum solar altitude (52°) is approximately
perpendicular to the tilt of the pyramid shaped glazing (45°) and therefore the laser
cuts are parallel with the incident radiation, that very little deflection of light occurs
and therefore both model wells reach similar temperatures.
Temperatures in atrium on 22/7/99
0
10
20
30
40
50
60
0:00 2:24 4:48 7:12 9:36 12:00 14:24 16:48 19:12 21:36 0:00
Time (hr)
Tem
pera
ture
(deg
C)
T3 T4
T5 T6
T7 T8
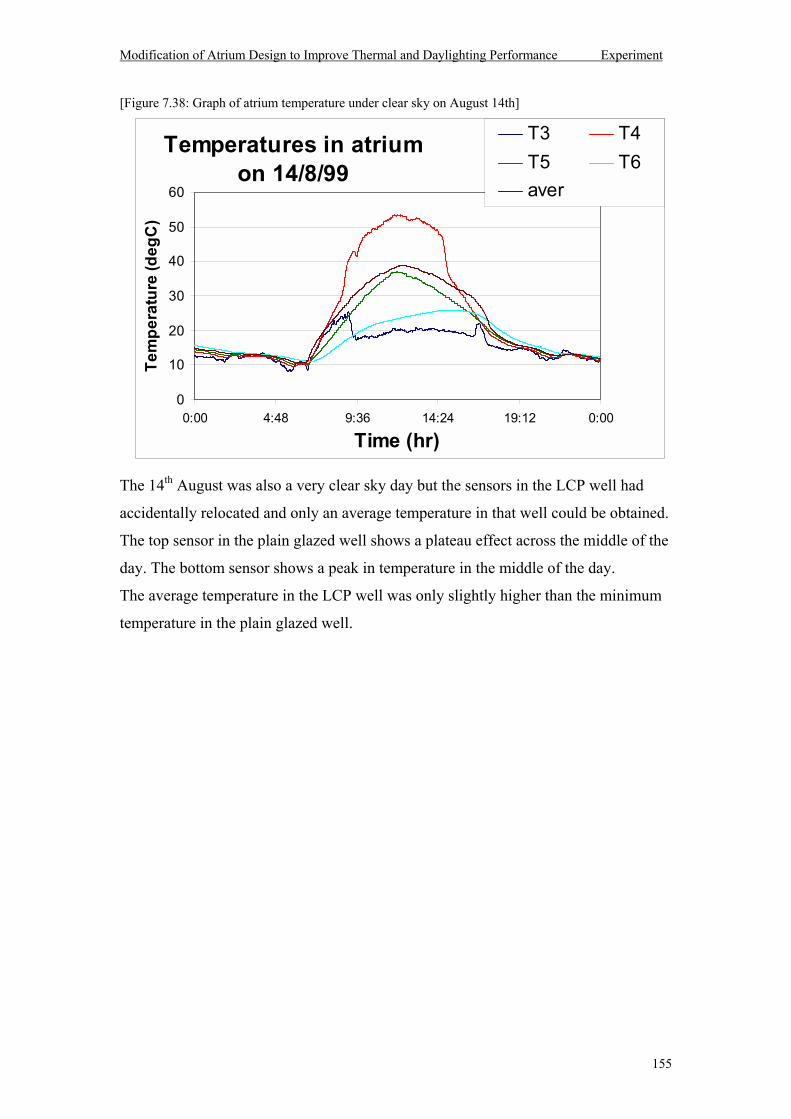
Modification of Atrium Design to Improve Thermal and Daylighting Performance Experiment
155
[Figure 7.38: Graph of atrium temperature under clear sky on August 14th]
The 14th August was also a very clear sky day but the sensors in the LCP well had
accidentally relocated and only an average temperature in that well could be obtained.
The top sensor in the plain glazed well shows a plateau effect across the middle of the
day. The bottom sensor shows a peak in temperature in the middle of the day.
The average temperature in the LCP well was only slightly higher than the minimum
temperature in the plain glazed well.
Temperatures in atrium on 14/8/99
0
10
20
30
40
50
60
0:00 4:48 9:36 14:24 19:12 0:00
Time (hr)
Tem
pera
ture
(deg
C)
T3 T4T5 T6aver
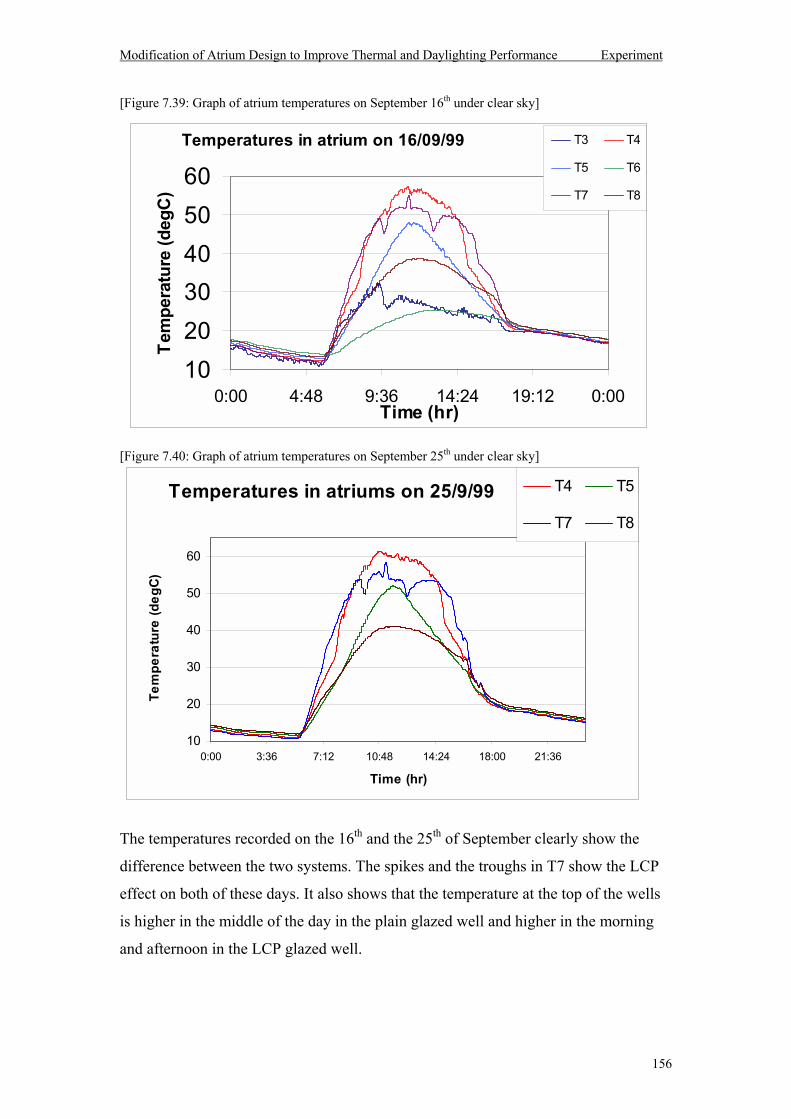
Modification of Atrium Design to Improve Thermal and Daylighting Performance Experiment
156
[Figure 7.39: Graph of atrium temperatures on September 16th under clear sky]
[Figure 7.40: Graph of atrium temperatures on September 25th under clear sky]
The temperatures recorded on the 16th and the 25th of September clearly show the
difference between the two systems. The spikes and the troughs in T7 show the LCP
effect on both of these days. It also shows that the temperature at the top of the wells
is higher in the middle of the day in the plain glazed well and higher in the morning
and afternoon in the LCP glazed well.
Temperatures in atriums on 25/9/99
10
20
30
40
50
60
0:00 3:36 7:12 10:48 14:24 18:00 21:36
Time (hr)
Tem
pera
ture
(deg
C)
T4 T5
T7 T8
Temperatures in atrium on 16/09/99
102030405060
0:00 4:48 9:36 14:24 19:12 0:00Time (hr)
Tem
pera
ture
(deg
C)
T3 T4
T5 T6
T7 T8
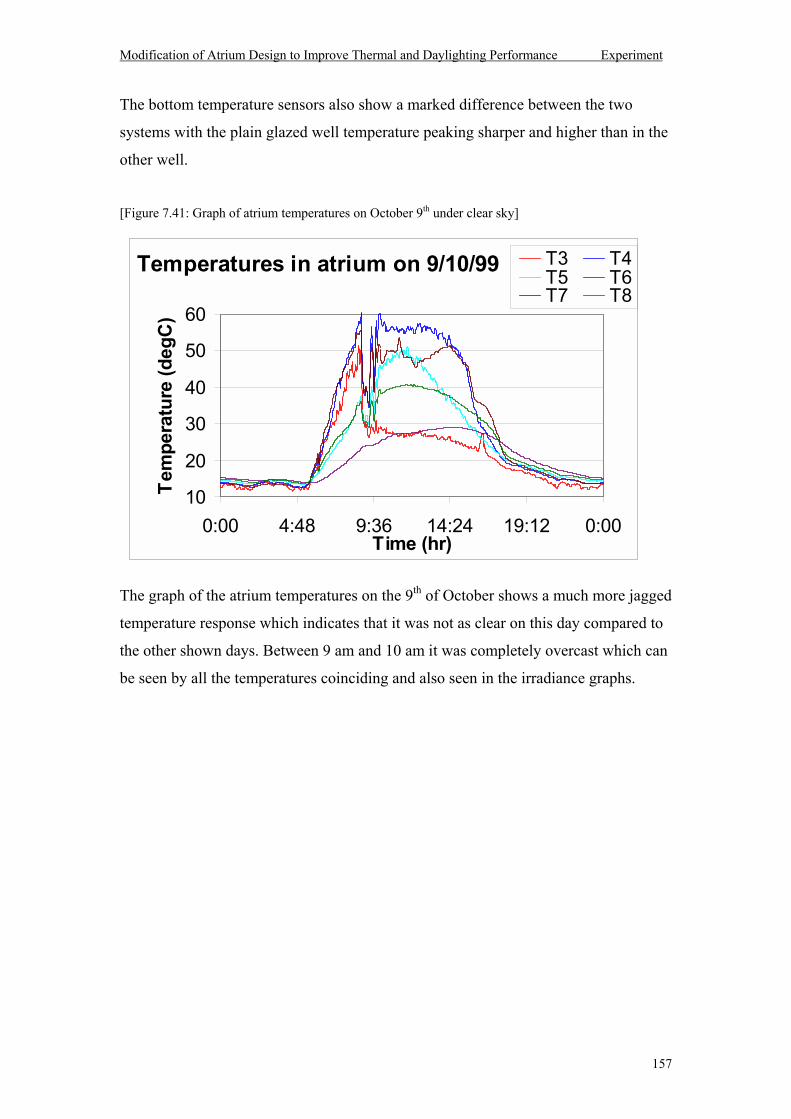
Modification of Atrium Design to Improve Thermal and Daylighting Performance Experiment
157
The bottom temperature sensors also show a marked difference between the two
systems with the plain glazed well temperature peaking sharper and higher than in the
other well.
[Figure 7.41: Graph of atrium temperatures on October 9th under clear sky]
The graph of the atrium temperatures on the 9th of October shows a much more jagged
temperature response which indicates that it was not as clear on this day compared to
the other shown days. Between 9 am and 10 am it was completely overcast which can
be seen by all the temperatures coinciding and also seen in the irradiance graphs.
Temperatures in atrium on 9/10/99
10
20
30
40
50
60
0:00 4:48 9:36 14:24 19:12 0:00Time (hr)
Tem
pera
ture
(deg
C)
T3 T4T5 T6T7 T8
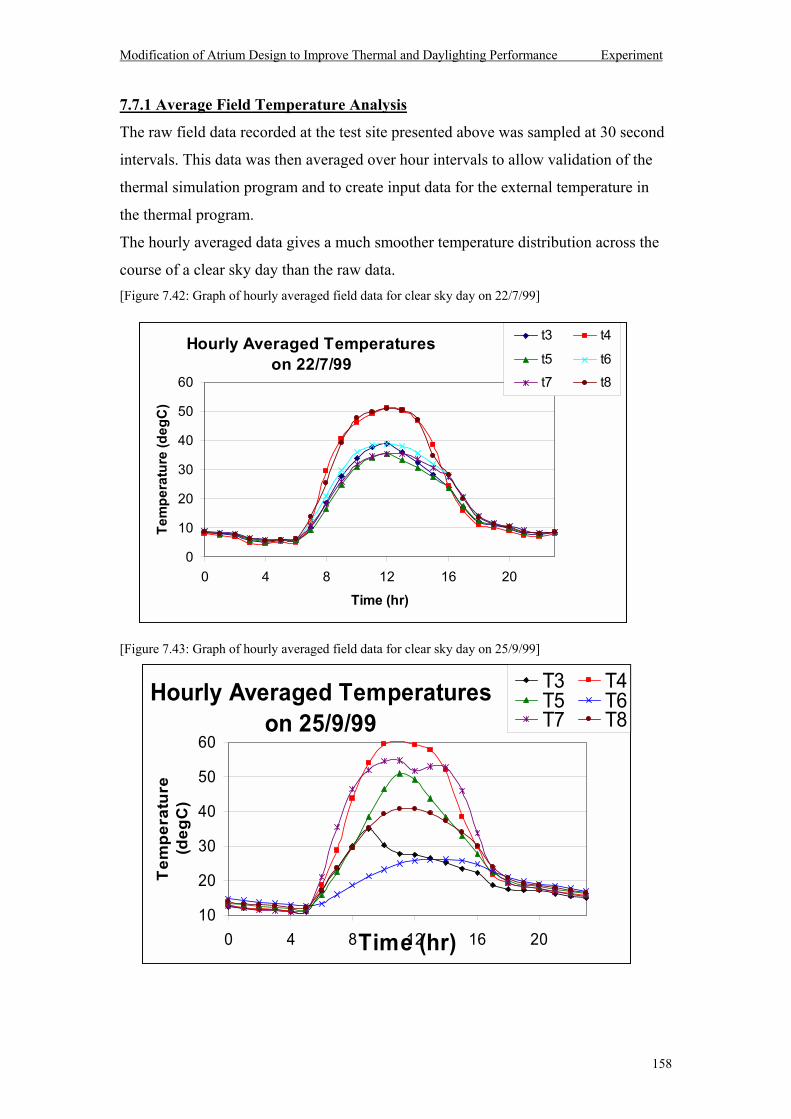
Modification of Atrium Design to Improve Thermal and Daylighting Performance Experiment
158
7.7.1 Average Field Temperature Analysis
The raw field data recorded at the test site presented above was sampled at 30 second
intervals. This data was then averaged over hour intervals to allow validation of the
thermal simulation program and to create input data for the external temperature in
the thermal program.
The hourly averaged data gives a much smoother temperature distribution across the
course of a clear sky day than the raw data. [Figure 7.42: Graph of hourly averaged field data for clear sky day on 22/7/99]
[Figure 7.43: Graph of hourly averaged field data for clear sky day on 25/9/99]
Hourly Averaged Temperatures on 25/9/99
10
20
30
40
50
60
0 4 8 12 16 20Time (hr)
Tem
pera
ture
(d
egC
)
T3 T4T5 T6T7 T8
Hourly Averaged Temperatures on 22/7/99
0
10
20
30
40
50
60
0 4 8 12 16 20
Time (hr)
Tem
pera
ture
(deg
C)
t3 t4
t5 t6t7 t8
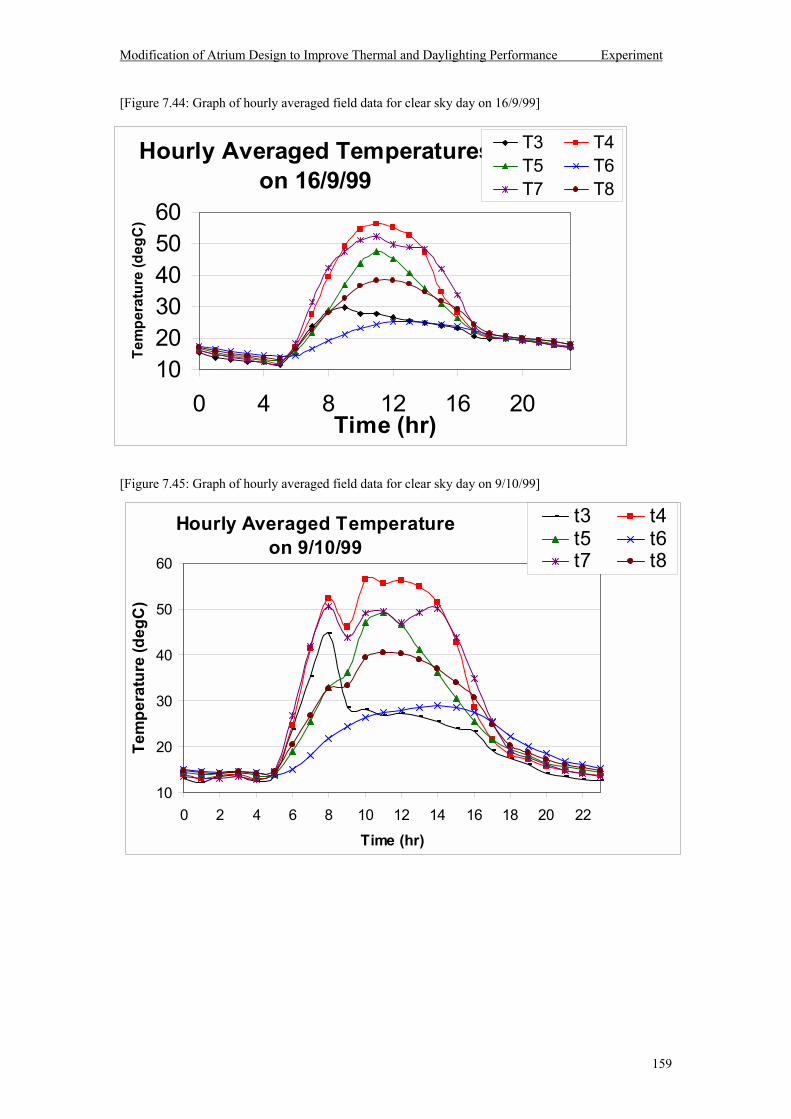
Modification of Atrium Design to Improve Thermal and Daylighting Performance Experiment
159
[Figure 7.44: Graph of hourly averaged field data for clear sky day on 16/9/99]
[Figure 7.45: Graph of hourly averaged field data for clear sky day on 9/10/99]
Hourly Averaged Temperatures on 16/9/99
102030405060
0 4 8 12 16 20Time (hr)
Tem
pera
ture
(deg
C)
T3 T4T5 T6T7 T8
Hourly Averaged Temperature on 9/10/99
10
20
30
40
50
60
0 2 4 6 8 10 12 14 16 18 20 22Time (hr)
Tem
pera
ture
(deg
C)
t3 t4t5 t6t7 t8
Modification of Atrium Design to Improve Thermal and Daylighting Performance Experiment
160
The hourly averaged data does not show as clearly as the raw data the various changes
(spikes) across the day with respect to the amount of light that is redirected through
the glazing. Generally, the temperature data from the sensors positioned within the
atrium wells shows a steady increase in the morning; a plateau during the middle of
the day and a rapid drop off in the afternoon. The bottom temperature sensor in the
plain glazed atrium (T5) shows a lot more peaked temperature response at midday
then the bottom sensor in the LCP glazed atrium (T8). The top temperature sensor in
the LCP glazed atrium (T7) is generally lower in the middle of the day.
The external temperature sensor, T3, was unfortunately placed in a position where it
was exposed to direct sunshine for a period of time each day and therefore gave a
peak in temperature in the morning around 9 am. This peak due to direct radiation
gain was less significant when averaged over the whole hour.
The temperature sensor, T6, was repositioned at the start of August to a place within
the test site room, which surrounded the atrium model wells. The room was
considerably insulated and therefore a time lag occurred before the maximum
temperature was reached which was around two hours after the other sensors reached
their peaks.
The temperature sensors at the start of the monitoring period were all located within
the atrium wells and so the temperature graph from the 22nd of July does not have
room or external temperature data. Due to the winter solar elevation, there is not a lot
of difference between the two model wells on this date.
The measured temperatures on the 16th and 25th of September show the clearest
differences in the thermal response of both atrium wells. Each graph shows a dip in
the temperature around midday at the top of the LCP atrium well. This is due to the
redirecting effect of the glazing. These well defined thermal responses indicate clear
sky distributions, which are confirmed from figures 7.30 and 7.28.
The cloud cover on the morning of the 9/10 can still be seen to effect the internal
temperature at the top of both atrium wells but to a less extent then seen in the raw
data.
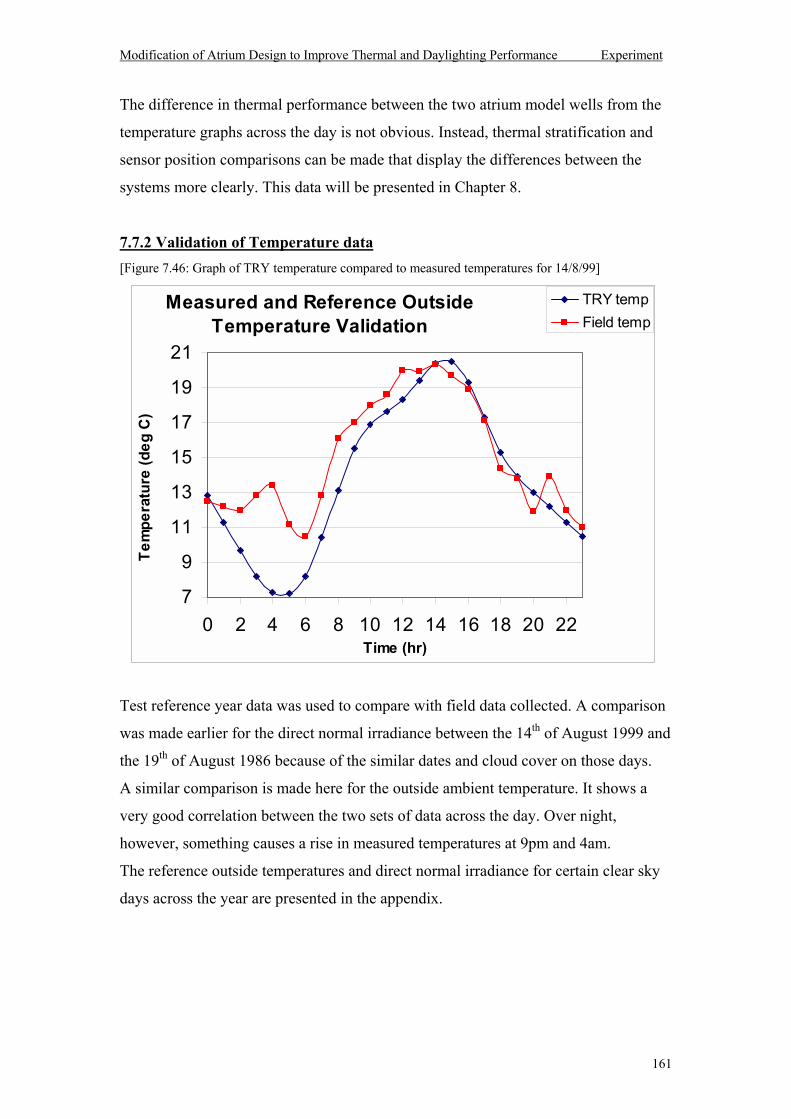
Modification of Atrium Design to Improve Thermal and Daylighting Performance Experiment
161
The difference in thermal performance between the two atrium model wells from the
temperature graphs across the day is not obvious. Instead, thermal stratification and
sensor position comparisons can be made that display the differences between the
systems more clearly. This data will be presented in Chapter 8.
7.7.2 Validation of Temperature data [Figure 7.46: Graph of TRY temperature compared to measured temperatures for 14/8/99]
Test reference year data was used to compare with field data collected. A comparison
was made earlier for the direct normal irradiance between the 14th of August 1999 and
the 19th of August 1986 because of the similar dates and cloud cover on those days.
A similar comparison is made here for the outside ambient temperature. It shows a
very good correlation between the two sets of data across the day. Over night,
however, something causes a rise in measured temperatures at 9pm and 4am.
The reference outside temperatures and direct normal irradiance for certain clear sky
days across the year are presented in the appendix.
Measured and Reference Outside Temperature Validation
7
9
11
13
15
17
19
21
0 2 4 6 8 10 12 14 16 18 20 22Time (hr)
Tem
pera
ture
(deg
C)
TRY tempField temp
Modification of Atrium Design to Improve Thermal and Daylighting Performance Experiment
162
7.8 Ventilation Measurements
The thermal performance of the model is greatly affected by the air circulation and
ventilation to outside areas. All ventilation was blocked off from inside the test room
and the atrium wells for the most of the monitoring period. In the last two weeks, the
ventilation grid around the edge of each aperture was uncovered and a small inlet hole
cut in the bottom of each atrium on the 29/9/99.
This resulted in only obtaining 2 weeks (29/9 - 12/10) of ventilated data of which only
one clear sky day occurred on the 10/10 and an almost clear day occurred on the 9/10.
The air flow rate was measured using a plastic bag and a stop watch on the 7th and
12th of October. Both of these days were considered to have intermediate sky
clearness conditions with patches of clear weather and patches of cloudy weather. The
rate at which the air was sucked out of the bag when placed over the inlet hole in the
bottom of the atrium well was recorded and related to the volume of the bag and the
volume of the well.
Two situations were measured, (1) when the door to the building was open which it
only was when the room was occupied, and (2) when the door was closed which it
was most of the time. The number of air changes per hour (ac/hr) was calculated for
both these scenarios.
Volume of air in bag = 0.3 m x 0.4 m x 0.5 m = 0.06 m2
Volume of air in atrium well = 0.8 m x 0.8 m x 3.0 m = 1.92 m2
Density of air = 1.2 kg/m3
Weight of air in bag = 0.06 m2 x 1.2 kg/m3 = 0.072 kg
Weight of air in atria = 1.92 m2 x 1.2 kg/m3 = 2.304 kg
Unit of flow rate = kg/second or air changes/hour
Modification of Atrium Design to Improve Thermal and Daylighting Performance Experiment
163
Door open so unimpeded air flow rate
Rate of air sucked out of bag into atria = 30 sec (sunny), 60 sec (cloudy)
Flow rate of bag
Sunny flow rate = 0.072 / 30 = 2.4 x10⁻³ kg/sec
Cloudy flow rate = 0.072 / 60 = 1.2 x10⁻³ kg/sec
A complete air change of the atrium well means that 2.3 kg of air is vented out.
Sunny conditions: 2.3/2.4x10-3 = 960 sec = 16 minutes ≈ 4 ac/hr
Cloudy conditions: 2.3/1.2x10-3 = 1917 sec = 32 minutes ≈ 2 ac/hr
Door closed so impeded air flow rate - normal condition
Rate of air sucked out of bag into atria = 120 seconds
Flow rate of bag = 0.072 / 120 = 6 x 10⁻⁴ kg/sec
A complete air change of the atrium well means that 2.3 kg of air is vented out.
2.3/ 6 x 10-4 = 3833 sec = 64 minutes ≈ 1 ac/hr
When the door was open an unimpeded air flow rate was calculated. This rate of air
sucked out of bag into atria was equal to 30 seconds in sunny sky conditions and 1
minute in cloudy sky conditions.
When the door was closed an impeded air flow rate was calculated. This was the
normal condition of the test site and such the rate of air sucked out of bag into atria
was equal to 2 minutes.
One air change per hour is a fairly low ventilation rate but it is a lot greater than no air
changes per hour, which was the condition within the model wells during the majority
of the monitoring period. This change in ventilation did have a noticeable effect upon
the temperatures within the atrium wells. Upon the 9th and 10th of October which were
the only clear sky days during the ventilated set up the bottom temperature sensors
were found to be 1-2°C cooler during the middle of the day compared to those
recorded on the 25th of September. The top temperature sensors were also found to be
3-5°C cooler. This must be due to ventilation because the temperatures should
increase towards the end of the year (summer).
Modification of Atrium Design to Improve Thermal and Daylighting Performance Analysis
164
Chapter 8: DATA ANALYSIS
This chapter illustrates through computer simulation and field results how the laser cut
panel glazing modifies the thermal and daylighting performance of an atrium and its
adjoining spaces in a sub tropical climate.
The field data included in this chapter was collected at the daylighting research test site at
Brisbane Airport and is detailed and described in Chapter 7.
The computer simulation data included in this chapter was obtained from programs
created by the author in Matlab and are detailed and described in Chapter 5 (daylighting),
Chapter 6 (Thermal) and the appendix (program code).
Included in this chapter is the simulated comparison between the LCP and the clear
glazing across a clear sky day upon an atrium well. The relationship between daylight
factor and well index under overcast sky conditions is also investigated for both types of
glazing.
The light level in an adjoining room to an atrium well at the bottom of the well is also
investigated for all possible glazing combinations using both clear and LCP glazing.
Also in this chapter is an analysis of the collected field temperature data to find a
comparison in the temperature difference and thermal gradient.
Rounding out this chapter is the predicted temperature measurements using the simulation
program shows the comparison between the two glazed systems in summer and winter.
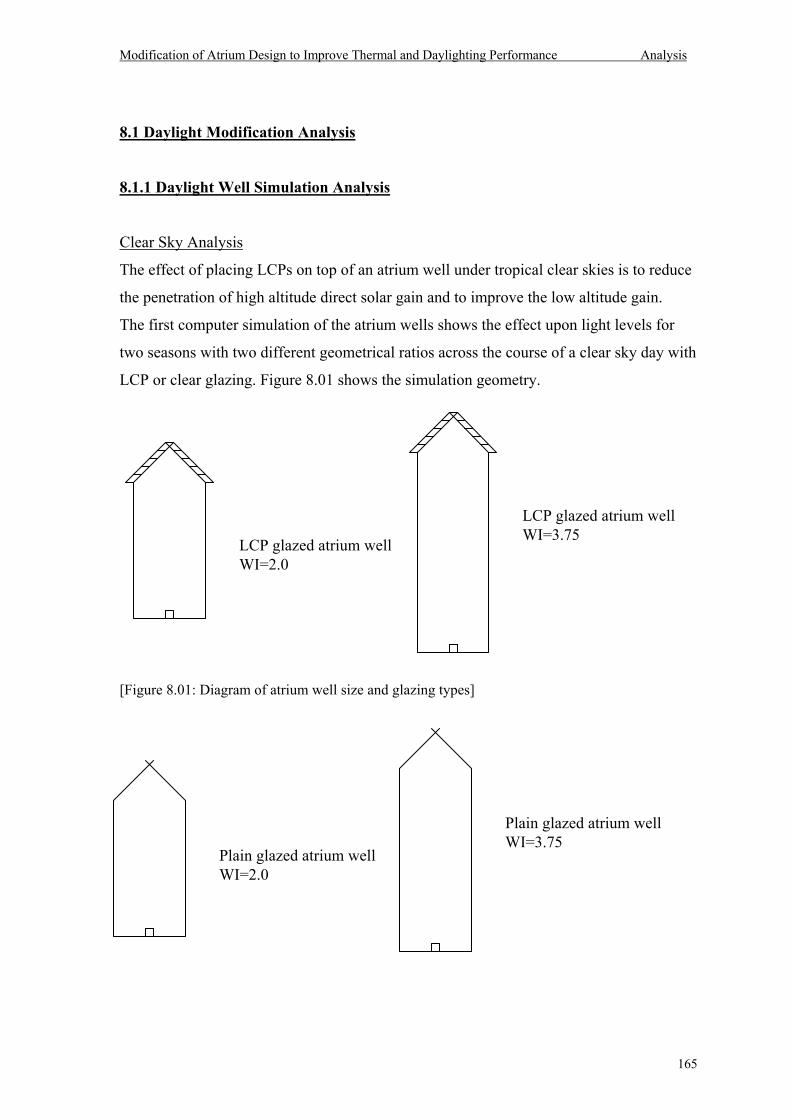
Modification of Atrium Design to Improve Thermal and Daylighting Performance Analysis
165
8.1 Daylight Modification Analysis
8.1.1 Daylight Well Simulation Analysis
Clear Sky Analysis
The effect of placing LCPs on top of an atrium well under tropical clear skies is to reduce
the penetration of high altitude direct solar gain and to improve the low altitude gain.
The first computer simulation of the atrium wells shows the effect upon light levels for
two seasons with two different geometrical ratios across the course of a clear sky day with
LCP or clear glazing. Figure 8.01 shows the simulation geometry.
[Figure 8.01: Diagram of atrium well size and glazing types]
LCP glazed atrium wellWI=2.0
LCP glazed atrium wellWI=3.75
Plain glazed atrium wellWI=3.75
Plain glazed atrium wellWI=2.0
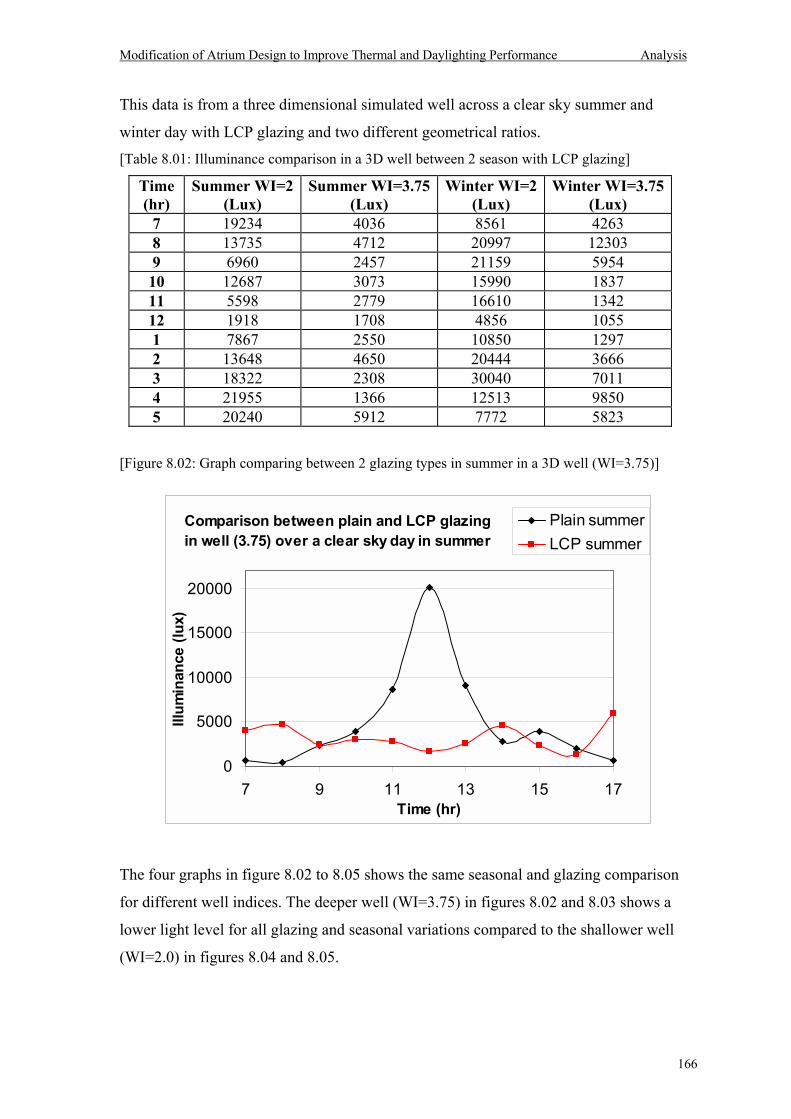
Modification of Atrium Design to Improve Thermal and Daylighting Performance Analysis
166
This data is from a three dimensional simulated well across a clear sky summer and
winter day with LCP glazing and two different geometrical ratios.
[Table 8.01: Illuminance comparison in a 3D well between 2 season with LCP glazing]
Time (hr)
Summer WI=2 (Lux)
Summer WI=3.75(Lux)
Winter WI=2(Lux)
Winter WI=3.75(Lux)
7 19234 4036 8561 4263 8 13735 4712 20997 12303 9 6960 2457 21159 5954 10 12687 3073 15990 1837 11 5598 2779 16610 1342 12 1918 1708 4856 1055 1 7867 2550 10850 1297 2 13648 4650 20444 3666 3 18322 2308 30040 7011 4 21955 1366 12513 9850 5 20240 5912 7772 5823
[Figure 8.02: Graph comparing between 2 glazing types in summer in a 3D well (WI=3.75)]
The four graphs in figure 8.02 to 8.05 shows the same seasonal and glazing comparison
for different well indices. The deeper well (WI=3.75) in figures 8.02 and 8.03 shows a
lower light level for all glazing and seasonal variations compared to the shallower well
(WI=2.0) in figures 8.04 and 8.05.
Comparison between plain and LCP glazing in well (3.75) over a clear sky day in summer
0
5000
10000
15000
20000
7 9 11 13 15 17Time (hr)
Illum
inan
ce (l
ux)
Plain summerLCP summer
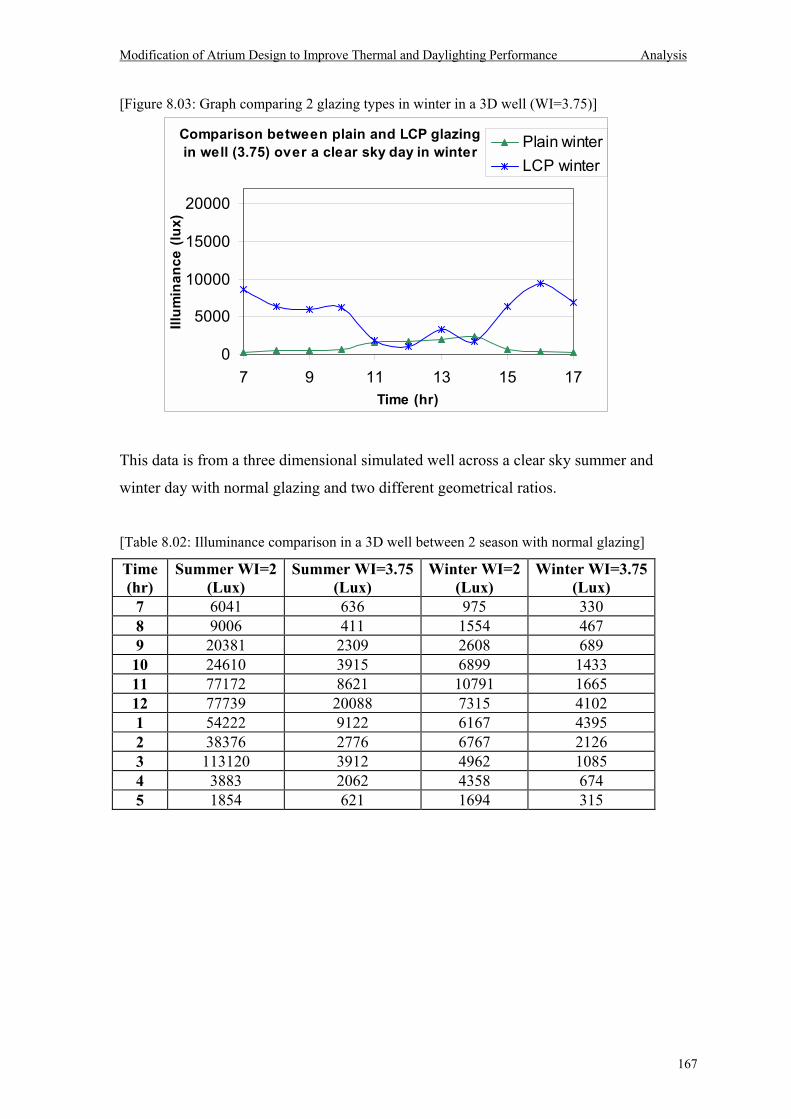
Modification of Atrium Design to Improve Thermal and Daylighting Performance Analysis
167
[Figure 8.03: Graph comparing 2 glazing types in winter in a 3D well (WI=3.75)]
This data is from a three dimensional simulated well across a clear sky summer and
winter day with normal glazing and two different geometrical ratios.
[Table 8.02: Illuminance comparison in a 3D well between 2 season with normal glazing]
Time (hr)
Summer WI=2 (Lux)
Summer WI=3.75(Lux)
Winter WI=2(Lux)
Winter WI=3.75 (Lux)
7 6041 636 975 330 8 9006 411 1554 467 9 20381 2309 2608 689 10 24610 3915 6899 1433 11 77172 8621 10791 1665 12 77739 20088 7315 4102 1 54222 9122 6167 4395 2 38376 2776 6767 2126 3 113120 3912 4962 1085 4 3883 2062 4358 674 5 1854 621 1694 315
Comparison between plain and LCP glazing in well (3.75) over a clear sky day in winter
0
5000
10000
15000
20000
7 9 11 13 15 17Time (hr)
Illum
inan
ce (l
ux)
Plain winterLCP winter
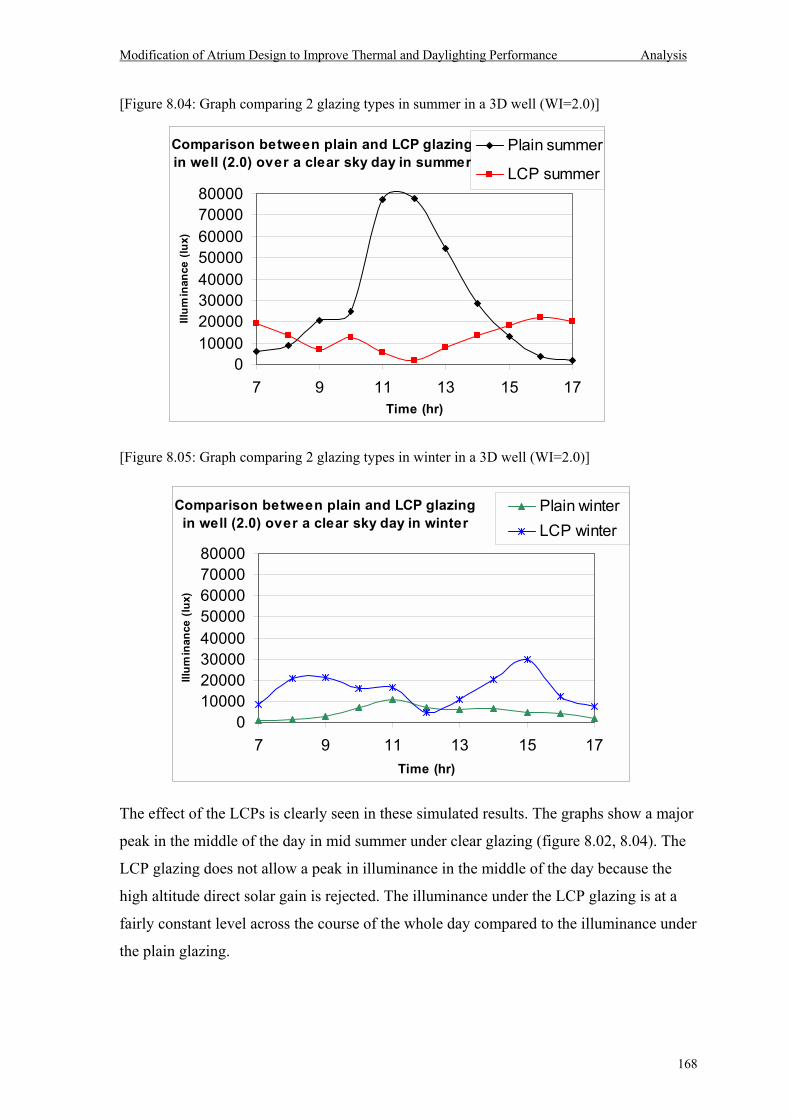
Modification of Atrium Design to Improve Thermal and Daylighting Performance Analysis
168
[Figure 8.04: Graph comparing 2 glazing types in summer in a 3D well (WI=2.0)]
[Figure 8.05: Graph comparing 2 glazing types in winter in a 3D well (WI=2.0)]
The effect of the LCPs is clearly seen in these simulated results. The graphs show a major
peak in the middle of the day in mid summer under clear glazing (figure 8.02, 8.04). The
LCP glazing does not allow a peak in illuminance in the middle of the day because the
high altitude direct solar gain is rejected. The illuminance under the LCP glazing is at a
fairly constant level across the course of the whole day compared to the illuminance under
the plain glazing.
Comparison between plain and LCP glazing in well (2.0) over a clear sky day in summer
01000020000300004000050000600007000080000
7 9 11 13 15 17Time (hr)
Illum
inan
ce (l
ux)
Plain summer
LCP summer
Comparison between plain and LCP glazing in well (2.0) over a clear sky day in winter
01000020000300004000050000600007000080000
7 9 11 13 15 17Time (hr)
Illum
inan
ce (l
ux)
Plain winterLCP winter
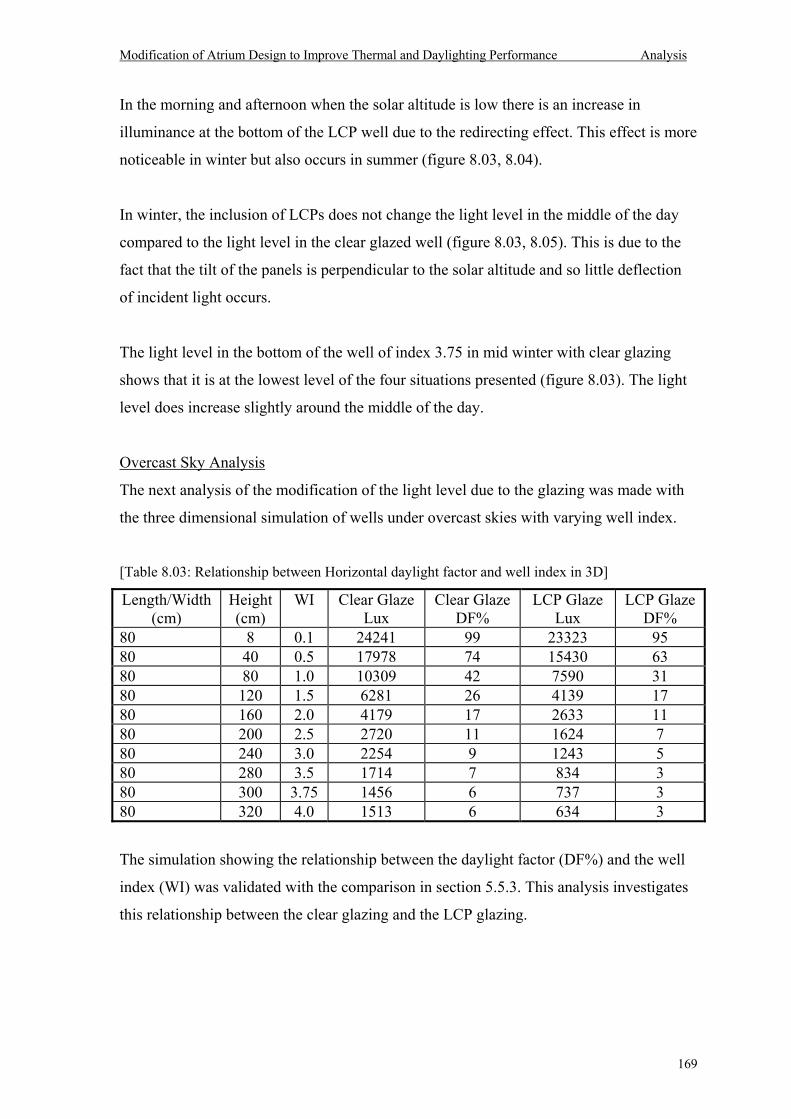
Modification of Atrium Design to Improve Thermal and Daylighting Performance Analysis
169
In the morning and afternoon when the solar altitude is low there is an increase in
illuminance at the bottom of the LCP well due to the redirecting effect. This effect is more
noticeable in winter but also occurs in summer (figure 8.03, 8.04).
In winter, the inclusion of LCPs does not change the light level in the middle of the day
compared to the light level in the clear glazed well (figure 8.03, 8.05). This is due to the
fact that the tilt of the panels is perpendicular to the solar altitude and so little deflection
of incident light occurs.
The light level in the bottom of the well of index 3.75 in mid winter with clear glazing
shows that it is at the lowest level of the four situations presented (figure 8.03). The light
level does increase slightly around the middle of the day.
Overcast Sky Analysis
The next analysis of the modification of the light level due to the glazing was made with
the three dimensional simulation of wells under overcast skies with varying well index.
[Table 8.03: Relationship between Horizontal daylight factor and well index in 3D]
Length/Width (cm)
Height (cm)
WI Clear Glaze Lux
Clear Glaze DF%
LCP Glaze Lux
LCP Glaze DF%
80 8 0.1 24241 99 23323 95 80 40 0.5 17978 74 15430 63 80 80 1.0 10309 42 7590 31 80 120 1.5 6281 26 4139 17 80 160 2.0 4179 17 2633 11 80 200 2.5 2720 11 1624 7 80 240 3.0 2254 9 1243 5 80 280 3.5 1714 7 834 3 80 300 3.75 1456 6 737 3 80 320 4.0 1513 6 634 3
The simulation showing the relationship between the daylight factor (DF%) and the well
index (WI) was validated with the comparison in section 5.5.3. This analysis investigates
this relationship between the clear glazing and the LCP glazing.
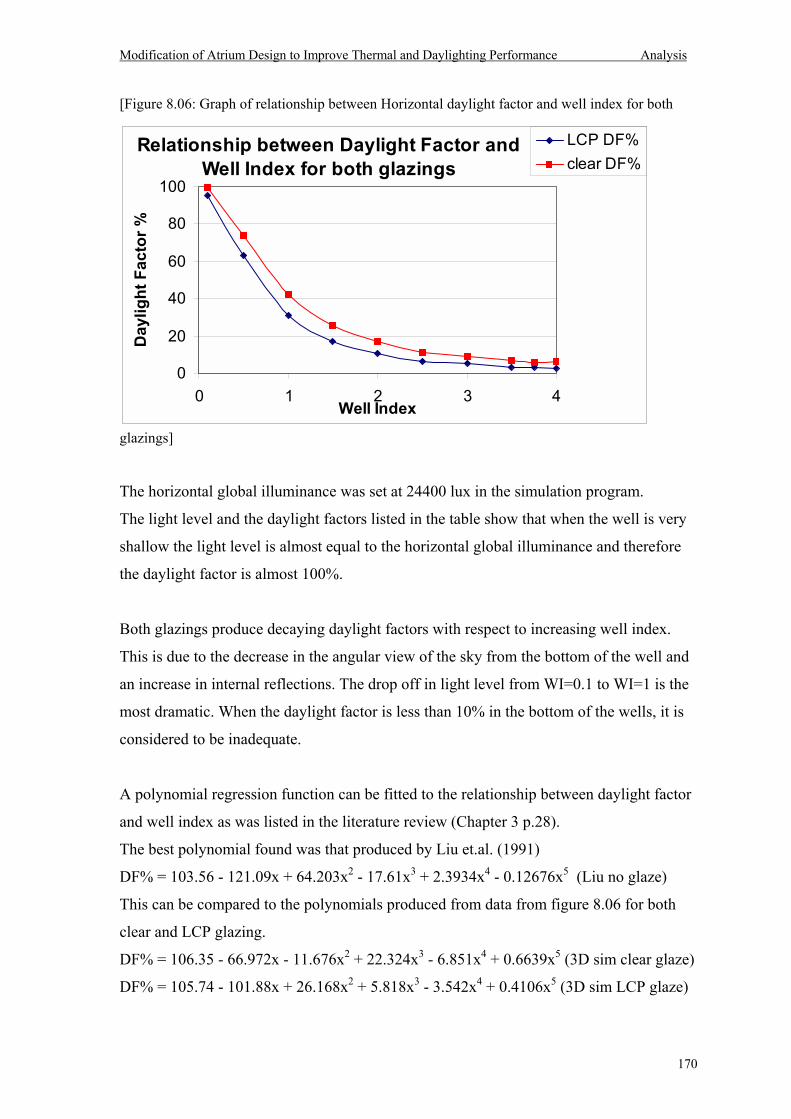
Modification of Atrium Design to Improve Thermal and Daylighting Performance Analysis
170
[Figure 8.06: Graph of relationship between Horizontal daylight factor and well index for both
glazings]
The horizontal global illuminance was set at 24400 lux in the simulation program.
The light level and the daylight factors listed in the table show that when the well is very
shallow the light level is almost equal to the horizontal global illuminance and therefore
the daylight factor is almost 100%.
Both glazings produce decaying daylight factors with respect to increasing well index.
This is due to the decrease in the angular view of the sky from the bottom of the well and
an increase in internal reflections. The drop off in light level from WI=0.1 to WI=1 is the
most dramatic. When the daylight factor is less than 10% in the bottom of the wells, it is
considered to be inadequate.
A polynomial regression function can be fitted to the relationship between daylight factor
and well index as was listed in the literature review (Chapter 3 p.28).
The best polynomial found was that produced by Liu et.al. (1991)
DF% = 103.56 - 121.09x + 64.203x2 - 17.61x3 + 2.3934x4 - 0.12676x5 (Liu no glaze)
This can be compared to the polynomials produced from data from figure 8.06 for both
clear and LCP glazing.
DF% = 106.35 - 66.972x - 11.676x2 + 22.324x3 - 6.851x4 + 0.6639x5 (3D sim clear glaze)
DF% = 105.74 - 101.88x + 26.168x2 + 5.818x3 - 3.542x4 + 0.4106x5 (3D sim LCP glaze)
Relationship between Daylight Factor and Well Index for both glazings
0
20
40
60
80
100
0 1 2 3 4Well Index
Day
light
Fac
tor %
LCP DF%clear DF%
Modification of Atrium Design to Improve Thermal and Daylighting Performance Analysis
171
The clear glazing allows unrestricted penetration of light from the whole overcast
hemisphere. The LCP glazing however, rejects the light rays from high elevation angles,
thereby eliminating light penetration from the brightest part of the overcast sky. The LCP
glazing system also reduces the intensity of the light rays due to the added layer of
glazing.
The investigation leads to the theory that a LCP glazed atrium roof would be
inappropriate for buildings with deep wells under skies, which were predominantly
overcast.
8.1.2 Daylight Adjoining Room to Well Simulation Analysis
The light level in an adjoining room to a well is greatly affected by the amount of direct
light falling upon the adjoining rooms glazing, known as the sky component, which is
subsequently affected by the angular view of the sky.
In the 3D simulations the only adjoining room investigated was that at the bottom of the
well because this is the area, which normally receives the least amount of natural
illuminance. The simulation was based upon an experimental model set up where a tilted
LCP was placed outside the window aperture of the adjoining room as well as the
pyramid shaped LCP glazing upon the atrium well.
Four different glazing system combinations were investigated. These are all described in
figure 8.07 on the next page.
1. The plain glazed atrium well was combined with the plain glazed adjoining room.
2. The LCP glazed atrium well was combined with the plain glazed adjoining room.
3. The plain glazed atrium well was combined with the LCP glazed adjoining room.
4. The LCP glazed atrium well was combined with the LCP glazed adjoining room.
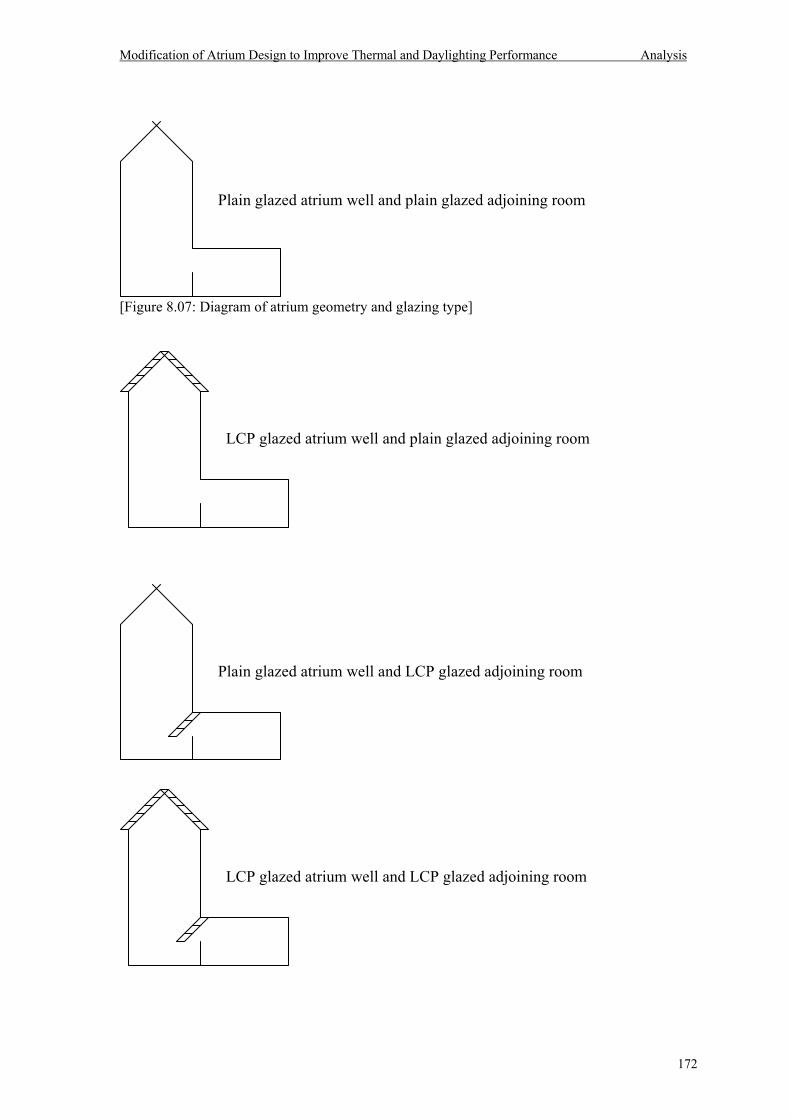
Modification of Atrium Design to Improve Thermal and Daylighting Performance Analysis
172
[Figure 8.07: Diagram of atrium geometry and glazing type]
Plain glazed atrium well and plain glazed adjoining room
LCP glazed atrium well and plain glazed adjoining room
Plain glazed atrium well and LCP glazed adjoining room
LCP glazed atrium well and LCP glazed adjoining room
Modification of Atrium Design to Improve Thermal and Daylighting Performance Analysis
173
The simulations showed a natural exponential decay in light level as the distance from the
adjoining rooms window increased. In the three dimensional simulation of the atrium well
the backward traced rays underwent a collimation effect as they were traced from the
bottom of the well to the sky. Resulting in more rays exiting the top of the well at near
zenith elevation angles. This resulted in higher light level within these atrium spaces then
conventional spaces with side light windows whose light mainly comes from the horizon.
The tilted adjoining rooms LCP glazing effected the path of the backward traced light
rays by reducing the number of reflections that the rays underwent in the atrium well
before reaching the sky. Therefore, the reduction in luminance intensity was reduced
which gave higher light levels.
A similar observation was deduced with the light levels in the adjoining room under
overcast skies as was established in section 8.1.1 with light levels in the atrium well. The
majority of light rays exit the atrium well at near zenith angles and are therefore
redirected through the LCP towards the horizon. As the horizon is only one third as bright
as the zenith under overcast skies, the illuminance obtained via this glazing selection
provides lower light levels then if clear glazing was used under overcast sky conditions.
A simulation of the adjoining space at the bottom of an atrium well was conducted with a
clear sky distribution. The surfaces were of standard reflectivity and a window to the
adjoining room was half the size of the rooms' wall. The well index was set at 2.0 and the
illuminance was measured from a point directly in the middle of the room using 5000 rays
for each illuminance measurement. The sky had a 10° diameter sun with a direct
luminance of 3.4 Mcd/m2, while the sky had a diffuse luminance of 2.1 Kcd/m2.
The illuminance was equated across a clear sky summer and winter day. Only two glazing
system combinations were investigated in this simulation. The plain glazed atrium well
combined with the plain glazed adjoining room was investigated. In addition, the LCP
glazed atrium well combined with the LCP glazed adjoining room was also investigated.
Both of these glazing combinations were simulated across a clear sky day in summer and
winter so a comparison could be made.
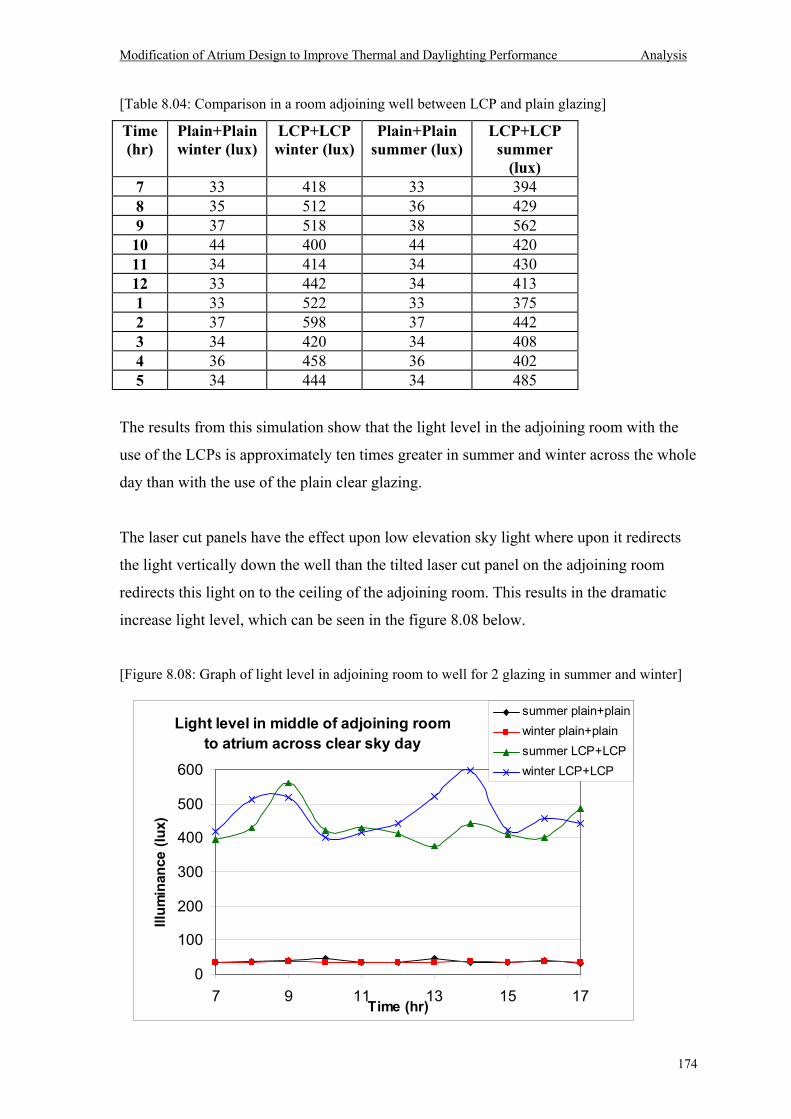
Modification of Atrium Design to Improve Thermal and Daylighting Performance Analysis
174
[Table 8.04: Comparison in a room adjoining well between LCP and plain glazing]
Time (hr)
Plain+Plain winter (lux)
LCP+LCP winter (lux)
Plain+Plain summer (lux)
LCP+LCP summer
(lux) 7 33 418 33 394 8 35 512 36 429 9 37 518 38 562 10 44 400 44 420 11 34 414 34 430 12 33 442 34 413 1 33 522 33 375 2 37 598 37 442 3 34 420 34 408 4 36 458 36 402 5 34 444 34 485
The results from this simulation show that the light level in the adjoining room with the
use of the LCPs is approximately ten times greater in summer and winter across the whole
day than with the use of the plain clear glazing.
The laser cut panels have the effect upon low elevation sky light where upon it redirects
the light vertically down the well than the tilted laser cut panel on the adjoining room
redirects this light on to the ceiling of the adjoining room. This results in the dramatic
increase light level, which can be seen in the figure 8.08 below.
[Figure 8.08: Graph of light level in adjoining room to well for 2 glazing in summer and winter]
Light level in middle of adjoining room to atrium across clear sky day
0
100
200
300
400
500
600
7 9 11 13 15 17Time (hr)
Illum
inan
ce (l
ux)
summer plain+plainwinter plain+plainsummer LCP+LCPwinter LCP+LCP
Modification of Atrium Design to Improve Thermal and Daylighting Performance Analysis
175
The light level in figure 8.08 achieved in the adjoining room with the use of plain glazing
was found to be inadequate and additional artificial lighting would be required to achieve
minimum standards. The light levels in the middle of the room was found to be fairly
constant across the day because no direct light could reach this point and therefore the
light level was less dependent upon the position of the sun.
The next simulation was of an atrium well with adjoining room under clear sky conditions
with all four glazing system combinations. The simulation was conducted at midday in
summer and winter conditions at positions along the length of the adjoining room.
The adjoining room had dimensions of 8x8x3 metres and the well was 16 metres tall. This
produced a WI = 2.0. The surfaces were all of standard average reflectance. The atrium
glazing was in the form of a pyramid with a 45° tilt and the adjoining room glazing was
either clear glazed or 40° tilted LCP. Each illuminance measurement was the average of
5000 rays. The sky had a 10° diameter sun with a direct luminance of 3.4 Mcd/m2, while
the sky had an indirect luminance of 3.4 Kcd/m2.
[Table 8.05: Illuminances within adjoining room in summer with various glazing options]
Position (m)
Plain + Plain summer (lux)
LCP + LCP summer (lux)
LCP + Plain Summer (lux)
Plain + LCP Summer (lux)
1 356 800 213 539 2 170 892 84 548 3 87 760 51 507 4 54 594 37 445 5 40 589 43 391 6 35 474 22 310 7 28 460 17 277
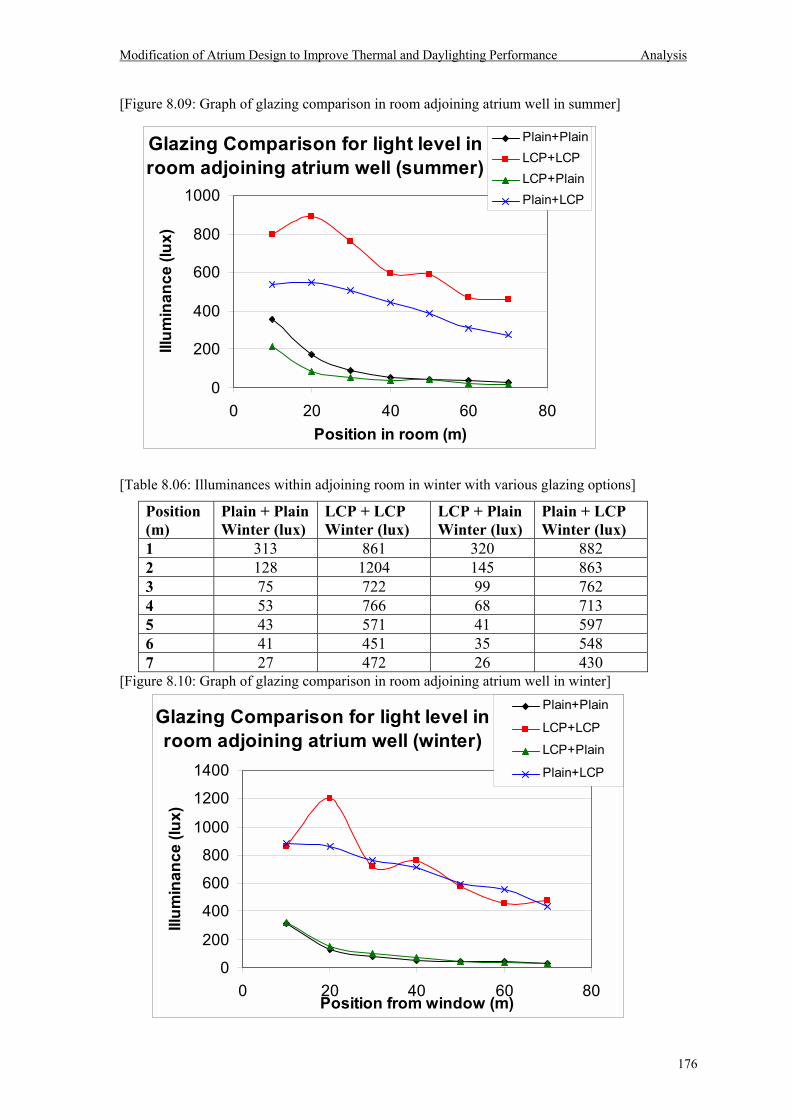
Modification of Atrium Design to Improve Thermal and Daylighting Performance Analysis
176
[Figure 8.09: Graph of glazing comparison in room adjoining atrium well in summer]
[Table 8.06: Illuminances within adjoining room in winter with various glazing options]
Position (m)
Plain + Plain Winter (lux)
LCP + LCP Winter (lux)
LCP + Plain Winter (lux)
Plain + LCP Winter (lux)
1 313 861 320 882 2 128 1204 145 863 3 75 722 99 762 4 53 766 68 713 5 43 571 41 597 6 41 451 35 548 7 27 472 26 430
[Figure 8.10: Graph of glazing comparison in room adjoining atrium well in winter]
Glazing Comparison for light level in room adjoining atrium well (summer)
0
200
400
600
800
1000
0 20 40 60 80Position in room (m)
Illum
inan
ce (l
ux)
Plain+PlainLCP+LCPLCP+PlainPlain+LCP
Glazing Comparison for light level in room adjoining atrium well (winter)
0
200
400
600
800
1000
1200
1400
0 20 40 60 80Position from window (m)
Illum
inan
ce (l
ux)
Plain+Plain
LCP+LCPLCP+Plain
Plain+LCP
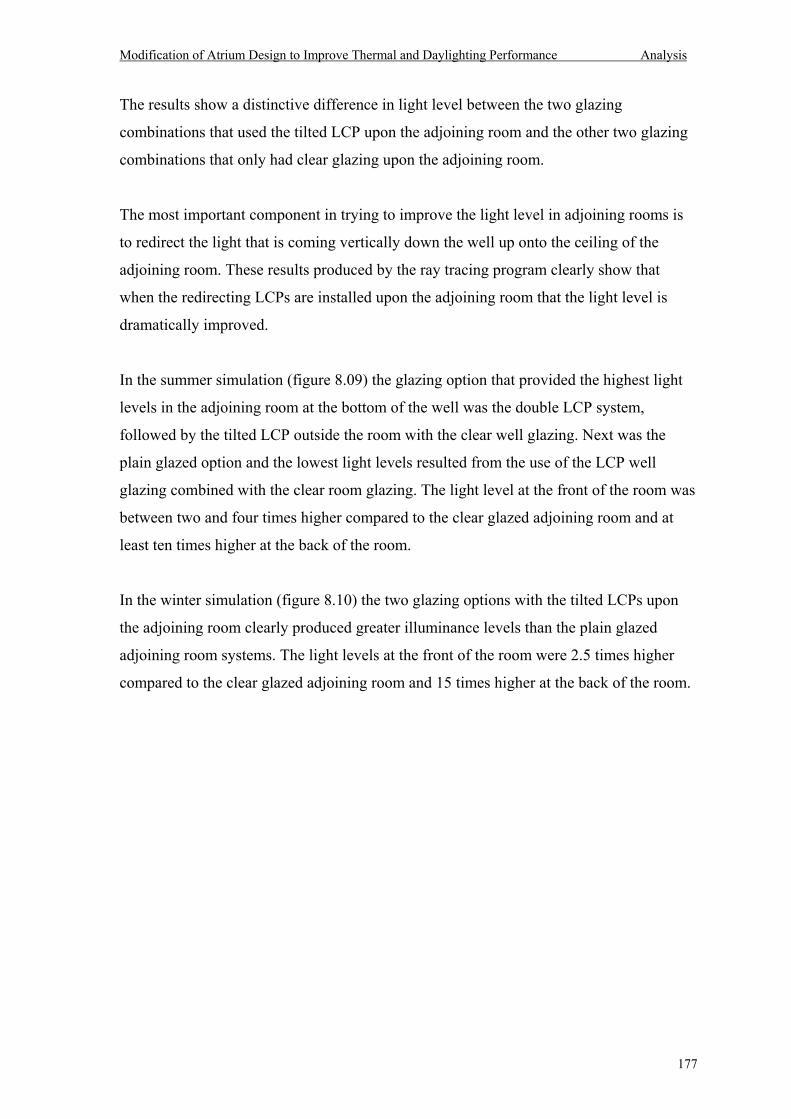
Modification of Atrium Design to Improve Thermal and Daylighting Performance Analysis
177
The results show a distinctive difference in light level between the two glazing
combinations that used the tilted LCP upon the adjoining room and the other two glazing
combinations that only had clear glazing upon the adjoining room.
The most important component in trying to improve the light level in adjoining rooms is
to redirect the light that is coming vertically down the well up onto the ceiling of the
adjoining room. These results produced by the ray tracing program clearly show that
when the redirecting LCPs are installed upon the adjoining room that the light level is
dramatically improved.
In the summer simulation (figure 8.09) the glazing option that provided the highest light
levels in the adjoining room at the bottom of the well was the double LCP system,
followed by the tilted LCP outside the room with the clear well glazing. Next was the
plain glazed option and the lowest light levels resulted from the use of the LCP well
glazing combined with the clear room glazing. The light level at the front of the room was
between two and four times higher compared to the clear glazed adjoining room and at
least ten times higher at the back of the room.
In the winter simulation (figure 8.10) the two glazing options with the tilted LCPs upon
the adjoining room clearly produced greater illuminance levels than the plain glazed
adjoining room systems. The light levels at the front of the room were 2.5 times higher
compared to the clear glazed adjoining room and 15 times higher at the back of the room.
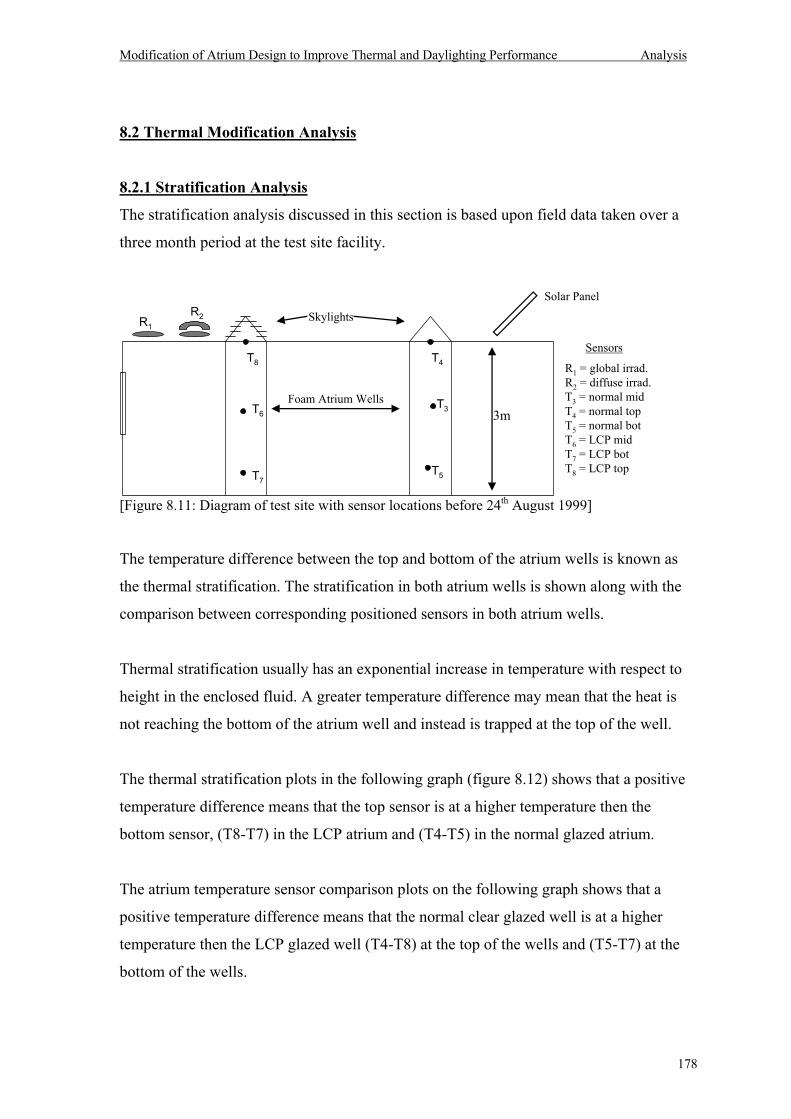
Modification of Atrium Design to Improve Thermal and Daylighting Performance Analysis
178
8.2 Thermal Modification Analysis
8.2.1 Stratification Analysis
The stratification analysis discussed in this section is based upon field data taken over a
three month period at the test site facility.
[Figure 8.11: Diagram of test site with sensor locations before 24th August 1999]
The temperature difference between the top and bottom of the atrium wells is known as
the thermal stratification. The stratification in both atrium wells is shown along with the
comparison between corresponding positioned sensors in both atrium wells.
Thermal stratification usually has an exponential increase in temperature with respect to
height in the enclosed fluid. A greater temperature difference may mean that the heat is
not reaching the bottom of the atrium well and instead is trapped at the top of the well.
The thermal stratification plots in the following graph (figure 8.12) shows that a positive
temperature difference means that the top sensor is at a higher temperature then the
bottom sensor, (T8-T7) in the LCP atrium and (T4-T5) in the normal glazed atrium.
The atrium temperature sensor comparison plots on the following graph shows that a
positive temperature difference means that the normal clear glazed well is at a higher
temperature then the LCP glazed well (T4-T8) at the top of the wells and (T5-T7) at the
bottom of the wells.
T3
T5
T4
T7
T8
T6
R1 = global irrad.R2 = diffuse irrad.T3 = normal midT4 = normal topT5 = normal botT6 = LCP midT7 = LCP botT8 = LCP top
R2R1Skylights
Foam Atrium Wells
Solar Panel
3m
Sensors
Modification of Atrium Design to Improve Thermal and Daylighting Performance Analysis
179
[Figure 8.12: Graph of hourly temperature comparison between atria and stratification on the
22/7/99]
The first clear sky day analysed was on the 22nd of July (figure 8.12). The stratification
comparison between the two atria shows that the temperature difference was less in the
LCP glazed atrium in the morning and afternoon compared to the normal glazed atrium
and at a similar level in both atria in the middle of the day.
In winter, the vertical temperature difference in both model atrium wells over a distance
of two meters is approximately 15 degrees Celsius under clear skies in the middle of the
day with an open aperture of 0.64 square metres. The difference in thermal stratification
between systems is as much as 5 degrees in the morning at 8 am and 7 degrees in the
afternoon at 3 p.m.
The atrium temperature sensor comparison for the top positioned sensors (T4-T8) shows
that in the morning (7:30-9:30 am) and the afternoon (2:00-3:30 p.m.) the normal glazed
atrium is hotter than the LCP glazed atrium. This corresponds to when the cuts are
deflecting the direct sun light deep down into the atrium. The atrium temperature sensor
comparison for the bottom positioned sensors (T5-T7) show that the bottom of the LCP
atrium is hotter in the morning and afternoon, this also corresponds to the previously
mentioned redirection of the direct light.
Hourly Atrium Temperature Comparison on 22/7/99
-5
0
5
10
15
20
0 4 8 12 16 20
Time (hr)
Tem
pera
ture
(deg
C)
T4-T8T5-T7T4-T5T8-T7
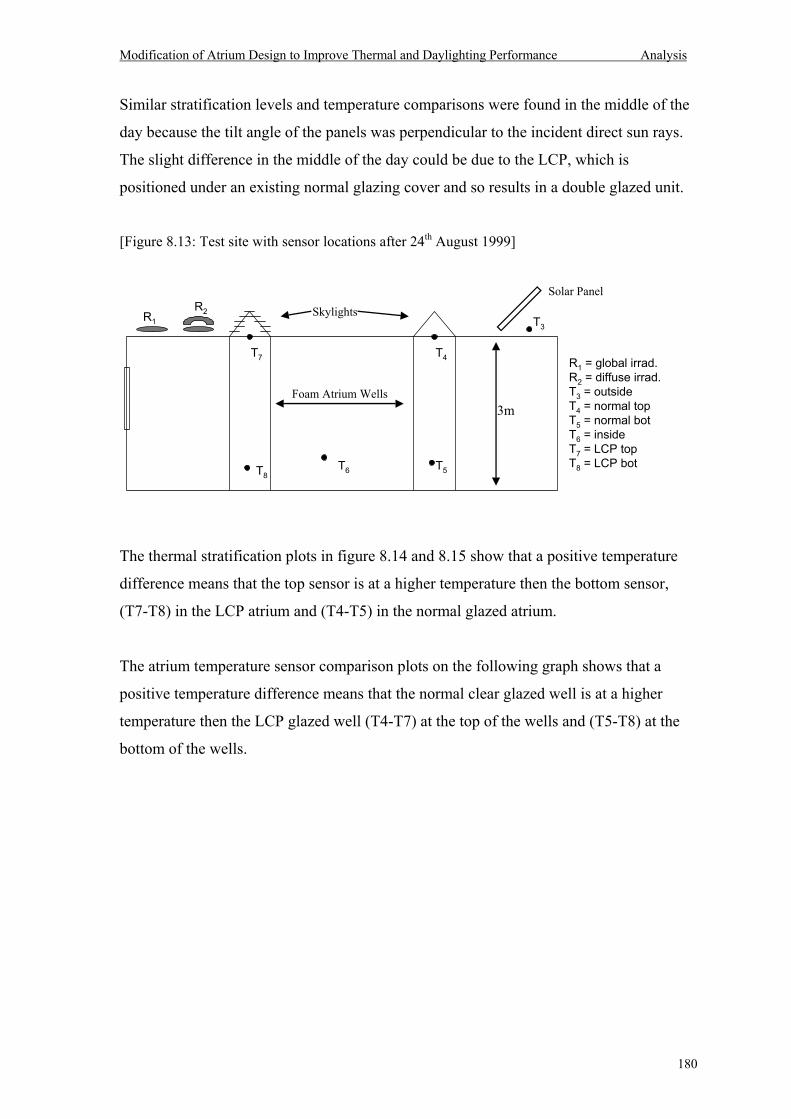
Modification of Atrium Design to Improve Thermal and Daylighting Performance Analysis
180
Similar stratification levels and temperature comparisons were found in the middle of the
day because the tilt angle of the panels was perpendicular to the incident direct sun rays.
The slight difference in the middle of the day could be due to the LCP, which is
positioned under an existing normal glazing cover and so results in a double glazed unit.
[Figure 8.13: Test site with sensor locations after 24th August 1999]
The thermal stratification plots in figure 8.14 and 8.15 show that a positive temperature
difference means that the top sensor is at a higher temperature then the bottom sensor,
(T7-T8) in the LCP atrium and (T4-T5) in the normal glazed atrium.
The atrium temperature sensor comparison plots on the following graph shows that a
positive temperature difference means that the normal clear glazed well is at a higher
temperature then the LCP glazed well (T4-T7) at the top of the wells and (T5-T8) at the
bottom of the wells.
T3
T5
T4
T8
T7
T6
R1 = global irrad.R2 = diffuse irrad.T3 = outsideT4 = normal topT5 = normal botT6 = insideT7 = LCP topT8 = LCP bot
R2R1Skylights
Foam Atrium Wells
Solar Panel
3m
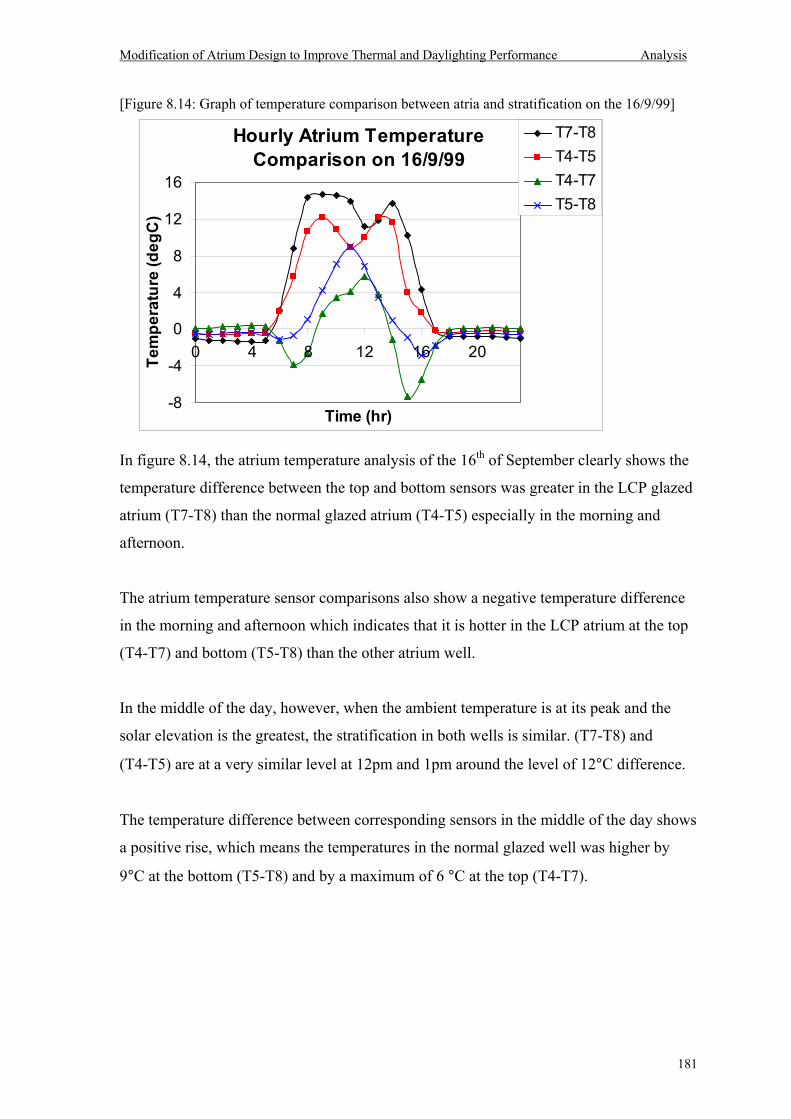
Modification of Atrium Design to Improve Thermal and Daylighting Performance Analysis
181
[Figure 8.14: Graph of temperature comparison between atria and stratification on the 16/9/99]
In figure 8.14, the atrium temperature analysis of the 16th of September clearly shows the
temperature difference between the top and bottom sensors was greater in the LCP glazed
atrium (T7-T8) than the normal glazed atrium (T4-T5) especially in the morning and
afternoon.
The atrium temperature sensor comparisons also show a negative temperature difference
in the morning and afternoon which indicates that it is hotter in the LCP atrium at the top
(T4-T7) and bottom (T5-T8) than the other atrium well.
In the middle of the day, however, when the ambient temperature is at its peak and the
solar elevation is the greatest, the stratification in both wells is similar. (T7-T8) and
(T4-T5) are at a very similar level at 12pm and 1pm around the level of 12°C difference.
The temperature difference between corresponding sensors in the middle of the day shows
a positive rise, which means the temperatures in the normal glazed well was higher by
9°C at the bottom (T5-T8) and by a maximum of 6 °C at the top (T4-T7).
Hourly Atrium TemperatureComparison on 16/9/99
-8
-4
0
4
8
12
16
0 4 8 12 16 20
Time (hr)
Tem
pera
ture
(deg
C)
T7-T8T4-T5T4-T7T5-T8
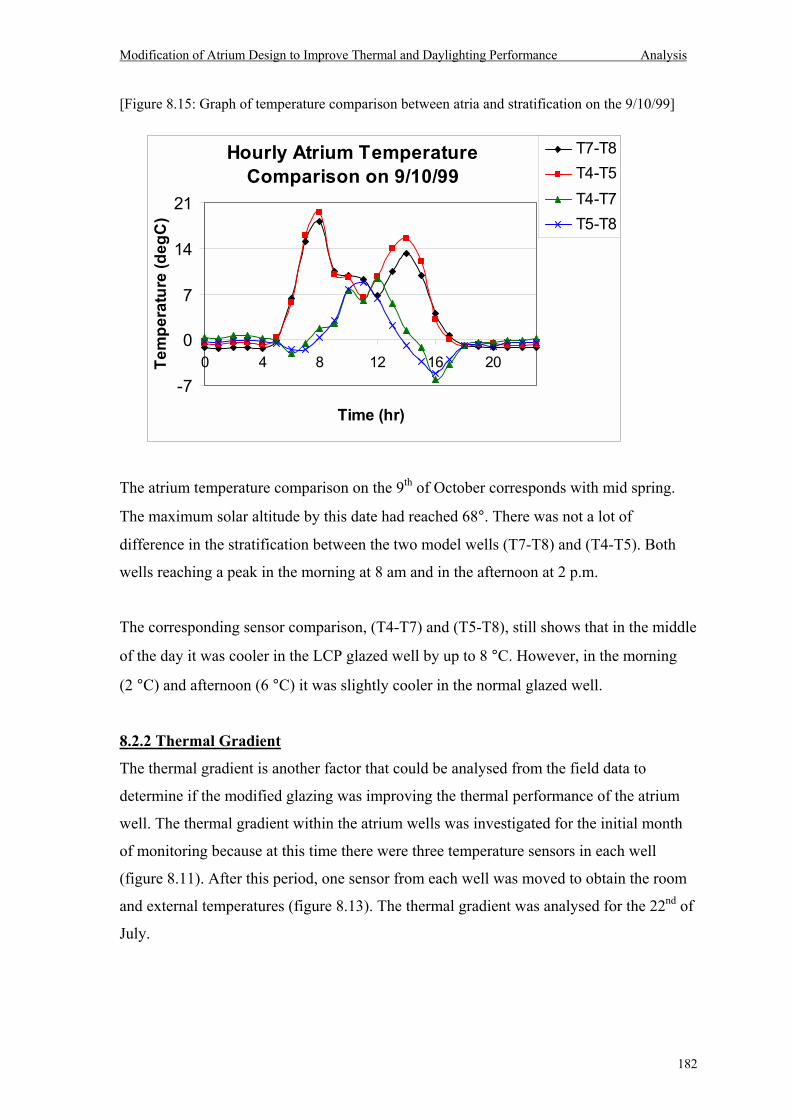
Modification of Atrium Design to Improve Thermal and Daylighting Performance Analysis
182
[Figure 8.15: Graph of temperature comparison between atria and stratification on the 9/10/99]
The atrium temperature comparison on the 9th of October corresponds with mid spring.
The maximum solar altitude by this date had reached 68°. There was not a lot of
difference in the stratification between the two model wells (T7-T8) and (T4-T5). Both
wells reaching a peak in the morning at 8 am and in the afternoon at 2 p.m.
The corresponding sensor comparison, (T4-T7) and (T5-T8), still shows that in the middle
of the day it was cooler in the LCP glazed well by up to 8 °C. However, in the morning
(2 °C) and afternoon (6 °C) it was slightly cooler in the normal glazed well.
8.2.2 Thermal Gradient
The thermal gradient is another factor that could be analysed from the field data to
determine if the modified glazing was improving the thermal performance of the atrium
well. The thermal gradient within the atrium wells was investigated for the initial month
of monitoring because at this time there were three temperature sensors in each well
(figure 8.11). After this period, one sensor from each well was moved to obtain the room
and external temperatures (figure 8.13). The thermal gradient was analysed for the 22nd of
July.
Hourly Atrium Temperature Comparison on 9/10/99
-7
0
7
14
21
0 4 8 12 16 20
Time (hr)
Tem
pera
ture
(deg
C)
T7-T8T4-T5T4-T7T5-T8
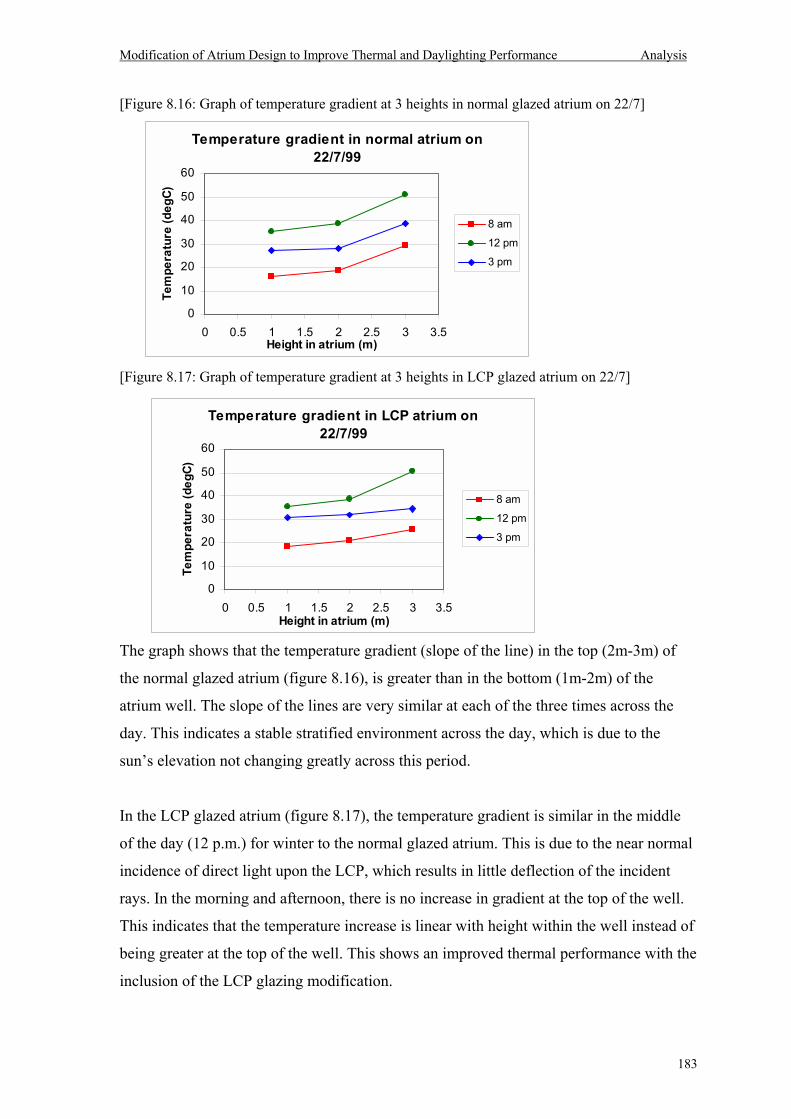
Modification of Atrium Design to Improve Thermal and Daylighting Performance Analysis
183
[Figure 8.16: Graph of temperature gradient at 3 heights in normal glazed atrium on 22/7]
[Figure 8.17: Graph of temperature gradient at 3 heights in LCP glazed atrium on 22/7]
The graph shows that the temperature gradient (slope of the line) in the top (2m-3m) of
the normal glazed atrium (figure 8.16), is greater than in the bottom (1m-2m) of the
atrium well. The slope of the lines are very similar at each of the three times across the
day. This indicates a stable stratified environment across the day, which is due to the
suns elevation not changing greatly across this period.
In the LCP glazed atrium (figure 8.17), the temperature gradient is similar in the middle
of the day (12 p.m.) for winter to the normal glazed atrium. This is due to the near normal
incidence of direct light upon the LCP, which results in little deflection of the incident
rays. In the morning and afternoon, there is no increase in gradient at the top of the well.
This indicates that the temperature increase is linear with height within the well instead of
being greater at the top of the well. This shows an improved thermal performance with the
inclusion of the LCP glazing modification.
Temperature gradient in normal atrium on 22/7/99
0
10
20
30
40
50
60
0 0.5 1 1.5 2 2.5 3 3.5Height in atrium (m)
Tem
pera
ture
(deg
C)
8 am
12 pm
3 pm
Temperature gradient in LCP atrium on 22/7/99
0
10
20
30
40
50
60
0 0.5 1 1.5 2 2.5 3 3.5Height in atrium (m)
Tem
pera
ture
(deg
C)
8 am
12 pm
3 pm
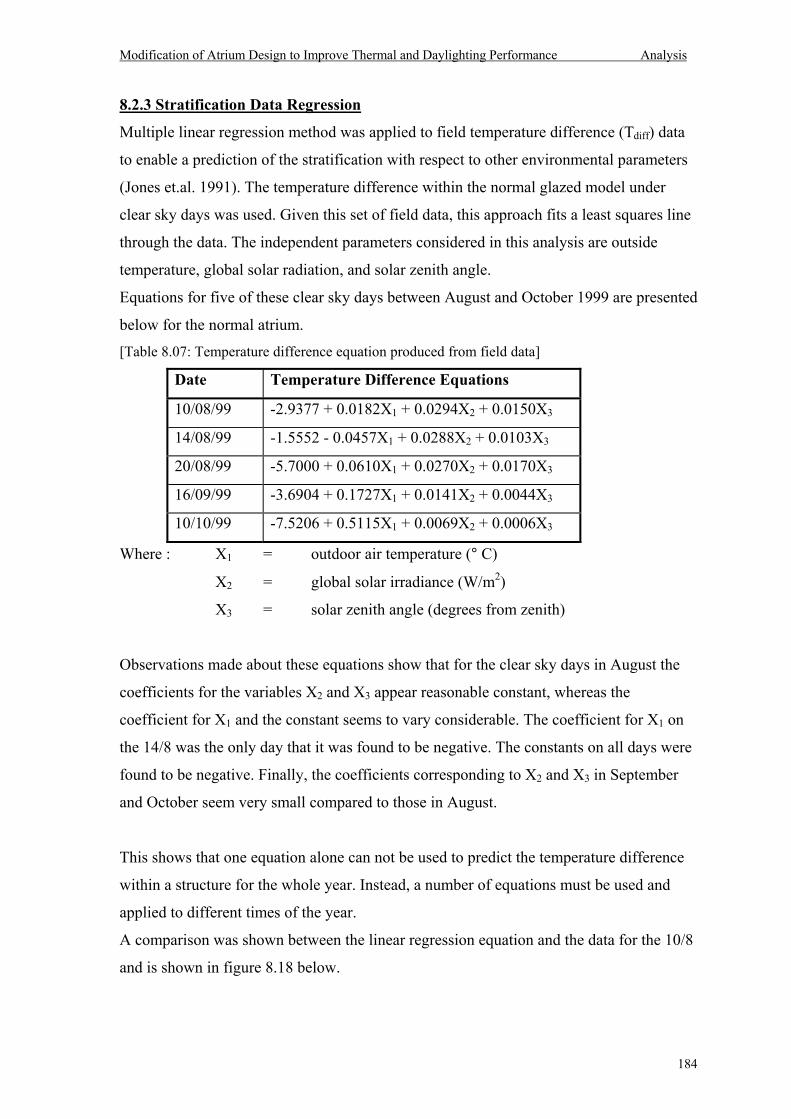
Modification of Atrium Design to Improve Thermal and Daylighting Performance Analysis
184
8.2.3 Stratification Data Regression
Multiple linear regression method was applied to field temperature difference (Tdiff) data
to enable a prediction of the stratification with respect to other environmental parameters
(Jones et.al. 1991). The temperature difference within the normal glazed model under
clear sky days was used. Given this set of field data, this approach fits a least squares line
through the data. The independent parameters considered in this analysis are outside
temperature, global solar radiation, and solar zenith angle.
Equations for five of these clear sky days between August and October 1999 are presented
below for the normal atrium.
[Table 8.07: Temperature difference equation produced from field data]
Date Temperature Difference Equations
10/08/99 -2.9377 + 0.0182X1 + 0.0294X2 + 0.0150X3
14/08/99 -1.5552 - 0.0457X1 + 0.0288X2 + 0.0103X3
20/08/99 -5.7000 + 0.0610X1 + 0.0270X2 + 0.0170X3
16/09/99 -3.6904 + 0.1727X1 + 0.0141X2 + 0.0044X3
10/10/99 -7.5206 + 0.5115X1 + 0.0069X2 + 0.0006X3
Where : X1 = outdoor air temperature (° C)
X2 = global solar irradiance (W/m2)
X3 = solar zenith angle (degrees from zenith)
Observations made about these equations show that for the clear sky days in August the
coefficients for the variables X2 and X3 appear reasonable constant, whereas the
coefficient for X1 and the constant seems to vary considerable. The coefficient for X1 on
the 14/8 was the only day that it was found to be negative. The constants on all days were
found to be negative. Finally, the coefficients corresponding to X2 and X3 in September
and October seem very small compared to those in August.
This shows that one equation alone can not be used to predict the temperature difference
within a structure for the whole year. Instead, a number of equations must be used and
applied to different times of the year.
A comparison was shown between the linear regression equation and the data for the 10/8
and is shown in figure 8.18 below.
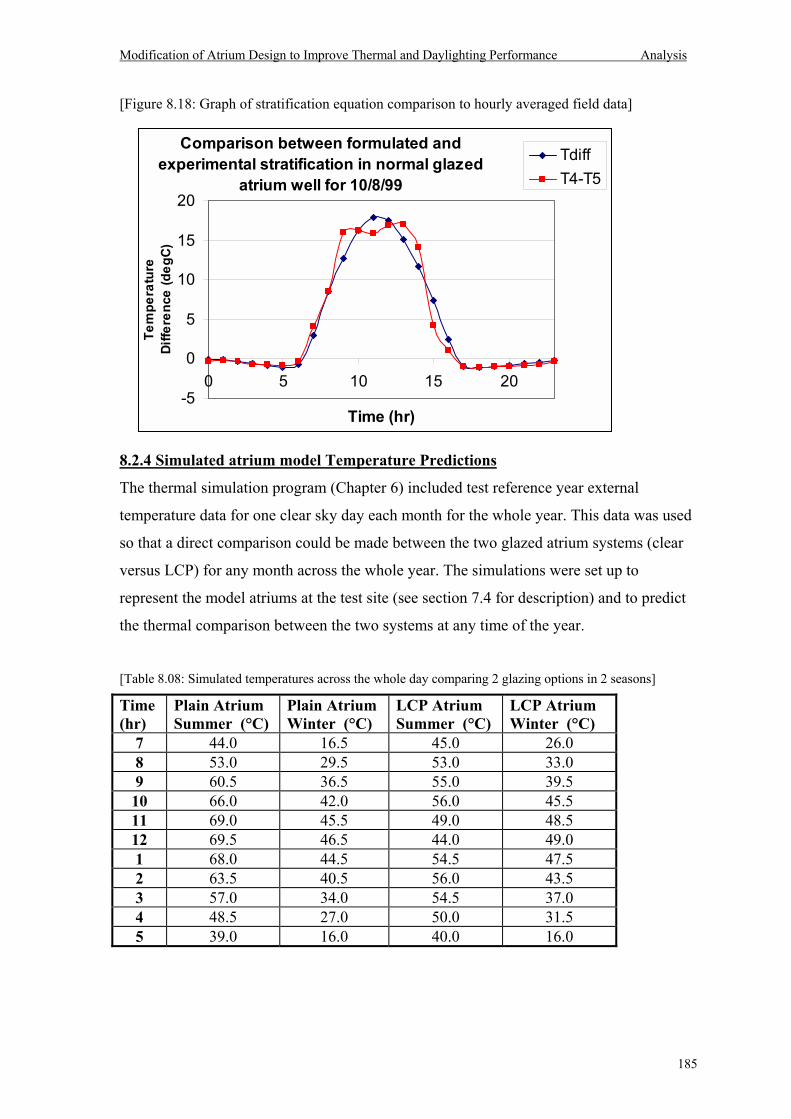
Modification of Atrium Design to Improve Thermal and Daylighting Performance Analysis
185
[Figure 8.18: Graph of stratification equation comparison to hourly averaged field data]
8.2.4 Simulated atrium model Temperature Predictions
The thermal simulation program (Chapter 6) included test reference year external
temperature data for one clear sky day each month for the whole year. This data was used
so that a direct comparison could be made between the two glazed atrium systems (clear
versus LCP) for any month across the whole year. The simulations were set up to
represent the model atriums at the test site (see section 7.4 for description) and to predict
the thermal comparison between the two systems at any time of the year.
[Table 8.08: Simulated temperatures across the whole day comparing 2 glazing options in 2 seasons]
Time (hr)
Plain Atrium Summer (°C)
Plain Atrium Winter (°C)
LCP Atrium Summer (°C)
LCP Atrium Winter (°C)
7 44.0 16.5 45.0 26.0 8 53.0 29.5 53.0 33.0 9 60.5 36.5 55.0 39.5 10 66.0 42.0 56.0 45.5 11 69.0 45.5 49.0 48.5 12 69.5 46.5 44.0 49.0 1 68.0 44.5 54.5 47.5 2 63.5 40.5 56.0 43.5 3 57.0 34.0 54.5 37.0 4 48.5 27.0 50.0 31.5 5 39.0 16.0 40.0 16.0
Comparison between formulated and experimental stratification in normal glazed
atrium well for 10/8/99
-5
0
5
10
15
20
0 5 10 15 20
Time (hr)
Tem
pera
ture
Di
ffere
nce
(deg
C)TdiffT4-T5
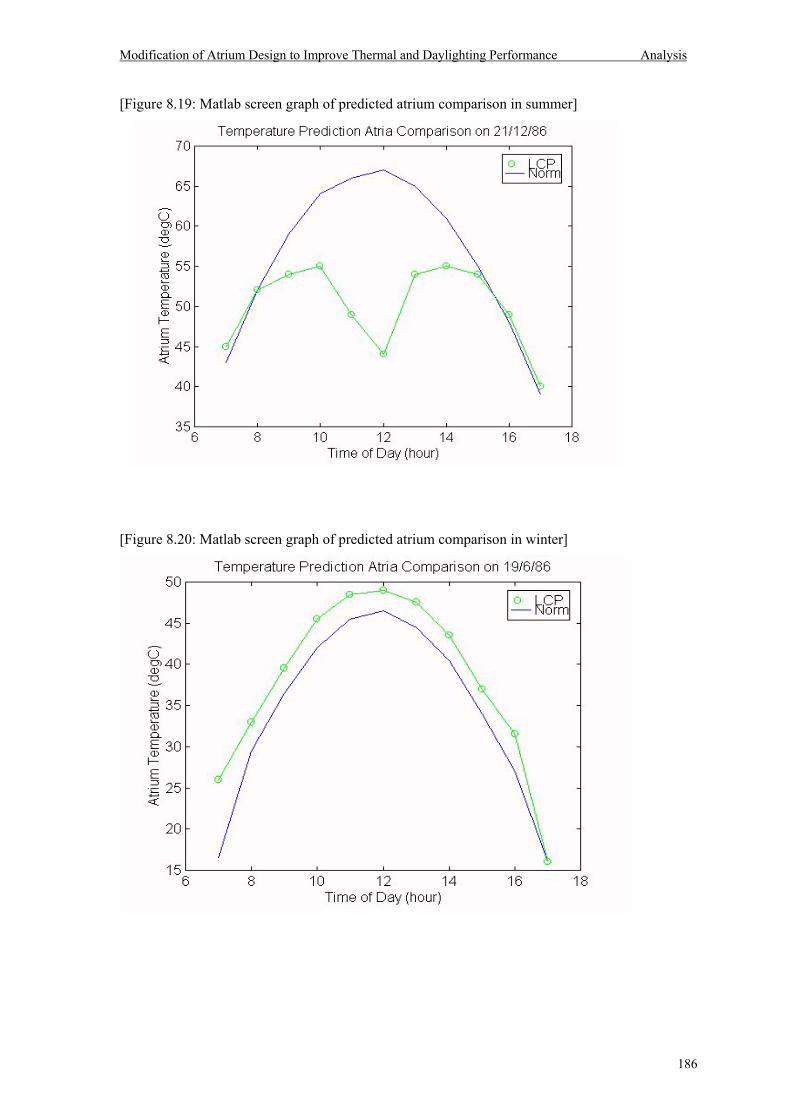
Modification of Atrium Design to Improve Thermal and Daylighting Performance Analysis
186
[Figure 8.19: Matlab screen graph of predicted atrium comparison in summer]
[Figure 8.20: Matlab screen graph of predicted atrium comparison in winter]
Modification of Atrium Design to Improve Thermal and Daylighting Performance Analysis
187
The first simulation looked at the thermal comparison between both glazed systems across
a clear sky summer and winter day. The domed shape of the predicted temperature
distribution curve for the normal glazed atrium is clearly apparent in both the summer and
winter simulations though the maximum temperature reached is approximately 20 °C
different between summer and winter.
The predicted temperature profile for the LCP glazed atrium is vastly different between
summer and winter due to its angular selective nature. In winter when the solar elevation
is parallel with the angle of the cuts then there is little difference in the temperature
comparison between the two systems. In summer, however, a large dip in temperature can
be seen in the middle of the day when the solar elevation reaches a maximum of 85°. As
the solar elevation increases to an angle near that of the zenith, an increasing amount of
direct radiation is redirected out of the system. With less radiation gain, the temperature in
fact decreases (see figure 1.01).
In spring and autumn, a plateau effect in observed in the predicted temperature in the LCP
glazed atrium in the middle of the day. This midday temperature dips in summer
[Table 8.09: Atrium temperature comparison across year at 12pm]
Month Normal Atrium TemperatureAt midday (deg C)
LCP Atrium Temperature At midday (deg C)
1 70.0 44.5 2 68.5 50.5 3 65.0 55.0 4 59.5 54.0 5 53.0 52.0 6 46.5 49.0 7 48.0 49.5 8 53.0 51.0 9 60.0 53.0 10 66.0 52.5 11 65.5 45.5 12 69.5 44.0
The thermal simulation program was also run for every month of the year at mid day in
both atriums. It shows that at the middle of the year when the maximum solar altitude is
approximately 42° which is similar to the tilt angle of the cuts in the LCP so only a small
amount of incident light is deflected. This results in only a small temperature difference.
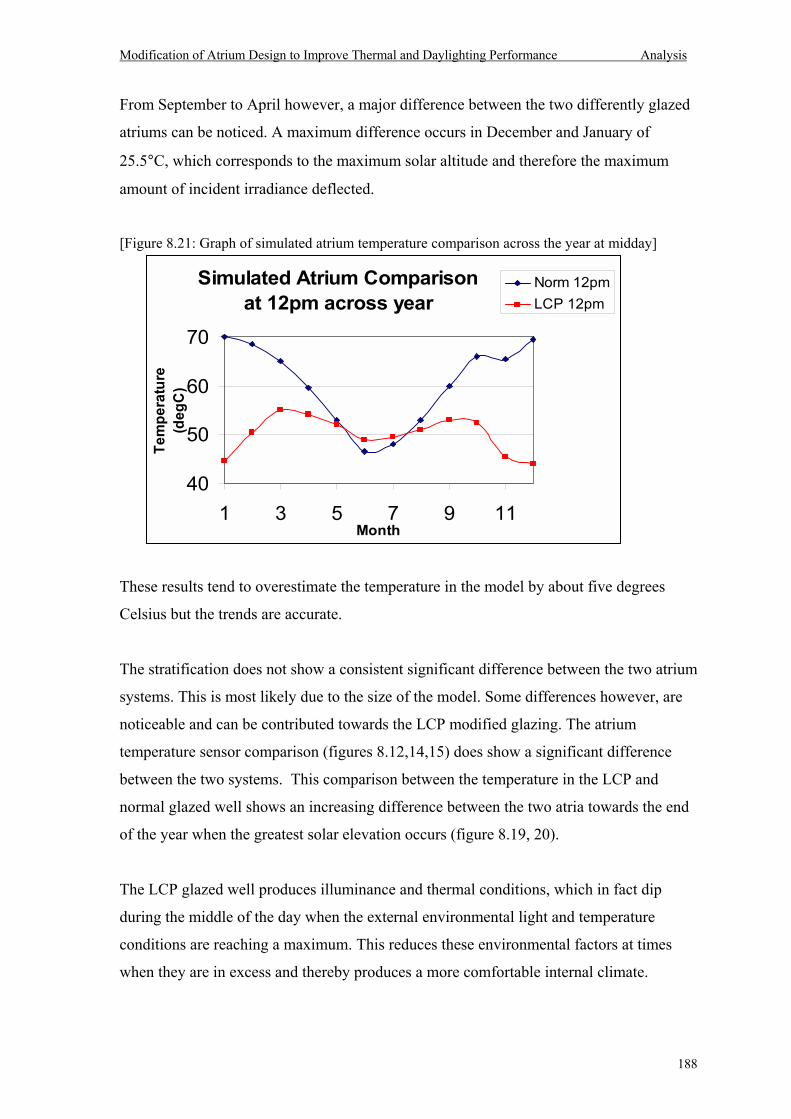
Modification of Atrium Design to Improve Thermal and Daylighting Performance Analysis
188
From September to April however, a major difference between the two differently glazed
atriums can be noticed. A maximum difference occurs in December and January of
25.5°C, which corresponds to the maximum solar altitude and therefore the maximum
amount of incident irradiance deflected.
[Figure 8.21: Graph of simulated atrium temperature comparison across the year at midday]
These results tend to overestimate the temperature in the model by about five degrees
Celsius but the trends are accurate.
The stratification does not show a consistent significant difference between the two atrium
systems. This is most likely due to the size of the model. Some differences however, are
noticeable and can be contributed towards the LCP modified glazing. The atrium
temperature sensor comparison (figures 8.12,14,15) does show a significant difference
between the two systems. This comparison between the temperature in the LCP and
normal glazed well shows an increasing difference between the two atria towards the end
of the year when the greatest solar elevation occurs (figure 8.19, 20).
The LCP glazed well produces illuminance and thermal conditions, which in fact dip
during the middle of the day when the external environmental light and temperature
conditions are reaching a maximum. This reduces these environmental factors at times
when they are in excess and thereby produces a more comfortable internal climate.
Simulated Atrium Comparison at 12pm across year
40
50
60
70
1 3 5 7 9 11Month
Tem
pera
ture
(d
egC
)
Norm 12pmLCP 12pm
Modification of Atrium Design to Improve Thermal and Daylighting Performance Conclusion
189
Chapter 9: CONCLUSION
9.1 Conclusion
The research aimed to show that by modifying the glazing with the inclusion of laser cut
panels (LCPs), that there could be an improvement in the overall thermal and daylighting
performance of atrium wells and their respective adjoining spaces. Achieving this would
reduce the energy load of the building whilst maintaining occupancy comfort.
The simulation analysis and collected field data were able to determine that the laser cut
panels are a superior glazing option compared to clear glazing. The LCPs did improve the
temperature and light level in atrium wells and their adjoining spaces in a sub tropical
climate at certain times of the year under certain sky conditions.
The light level was improved under clear sky conditions in both the LCP well and
adjoining spaces by being at a higher level and at a steadier level across the day.
The temperature in the LCP glazed well compared to the clear glazed well was found to
be lower in the middle of the day but higher in the afternoon and morning. It was also
found to be at a similar level in winter and dramatically lower in summer.
This research accomplished its objectives in several areas both experimentally and
theoretically. The computer simulation algorithms were produced and successfully
validated with respect to the experimental field data.
Simulations
The daylight simulation program, described in Chapter 5, achieved a level of accuracy
when validated with field data that was above expectation. The program still produces
noisy results with a significant uncertainty if a low number of rays are included in the
simulation.
The program accurately simulated the effect that LCPs have upon the resultant daylight
penetration into spaces such as atrium wells, side lit rooms and adjoining spaces to atrium
wells. It was able to find the illuminance level at any point upon the working surface of
the building type investigated.
The program showed that the illuminance level within the buildings was increased but
that the light level still dropped off exponentially with respect to distance from the
aperture.
Modification of Atrium Design to Improve Thermal and Daylighting Performance Conclusion
190
The light level within the well and adjoining room across the day and year was
investigated. An analysis under overcast sky conditions of the relationship between
daylight factor and well index showed that a shallow well has greater illuminance level at
the bottom as expected. It also showed that the clear glazed well resulted in illuminance at
a greater level compared to the LCP glazed well. Under clear skies, the LCP glazing
eliminated the excessive peak in illuminance in the middle of the day in summer.
The thermal simulation program, described in Chapter 6, was a simple thermal heat
transfer algorithm to find the resultant temperature within the model atrium well located
at the test site. This program was written to find the temperature within the well in mid
summer because the damage to the test site prevented physical monitoring. The program
was validated (Section 6.4) with the collected field data from both the clear and LCP
glazed model wells and compared better to the field data than did the commercial Capsol
simulation program.
The temperature within the well across the day and year was also investigated to show the
effect of the LCP glazing under clear sky conditions. In summer, the effect was quite
dramatic with a significantly lower temperature in the middle of the day in the LCP
glazed well. In winter the temperature was shown to be slightly greater in the LCP glazed
well which is also an advantage.
Experiment
The experiment was successful considering the length of the collection period. The data
shows that the light levels in the building with the modified glazing were not always
greater. In overcast sky conditions, the modification actually results in lower light levels
in the atrium well and the adjoining space. Even under clear sky conditions little
difference in light level could be detected due to near normal incident direct solar
irradiance, which occur in the morning and afternoon and in winter at midday.
The temperature within the LCP glazed well was found to be lower than the clear glazed
model atrium well but at times in the morning and afternoon the temperatures within the
LCP glazed well were higher.
Thermal stratification was shown to be in existence in tropical model atriums but the
results did not show a clear reduction in stratification with the inclusion of laser cut light
redirecting panels.
Modification of Atrium Design to Improve Thermal and Daylighting Performance Conclusion
191
In winter, the stratification was greater in the clear glazed well but in spring, the LCP
glazed well had greater stratification. The difference in stratification between the systems
was not significant and could be due to either the LCP glazing acting as a double glazed
unit or the light redirecting effect. The small size of the models could have also
contributed to the variation in stratification with respect to the time of the day and year.
The temperature difference over a vertical distance of 2 meters was on average in the
middle of the day approximately 15 degrees Celsius under clear skies with a LCP glazed
aperture of 0.64 square metres.
The effect that the ventilation made upon the temperature and thermal stratification was
also impossible to conclude upon due to the severely limited amount of experimental data.
The effect of ventilation on stratification and seasonable changes is yet to be fully
investigated.
Analysis
Atrium buildings in sub tropical climates suffer from overheating and with the use of LCP
glazing the internal temperature and overheating of the atrium well space can be reduced
at times when the sun is at its greatest altitude which is when the reduction is needed
most.
Thermal stratification within atrium wells is difficult to reduce by mechanical air
conditioning and so a reduction by passive means in the temperature difference with
respect to height within an atrium well would reduce the electrical load upon the air
conditioning system and therefore lower the cost of the electricity.
The use of simulation programs in this project has been highly beneficial due to the
inconsistent nature of the environment and weather making actual measurements difficult.
Simulation programs can not generally give you absolute data applicable to the real world.
However, they are very useful when comparing similar systems and can give meaningful
data as to which is the better system.
Atrium spaces are transient and relaxed meeting spaces which can be regarded as visually
comfortable over a wide range of illuminance levels. Improved illuminance in the
morning and afternoon can result in less reliance upon artificial lighting at the start and
end of the day.
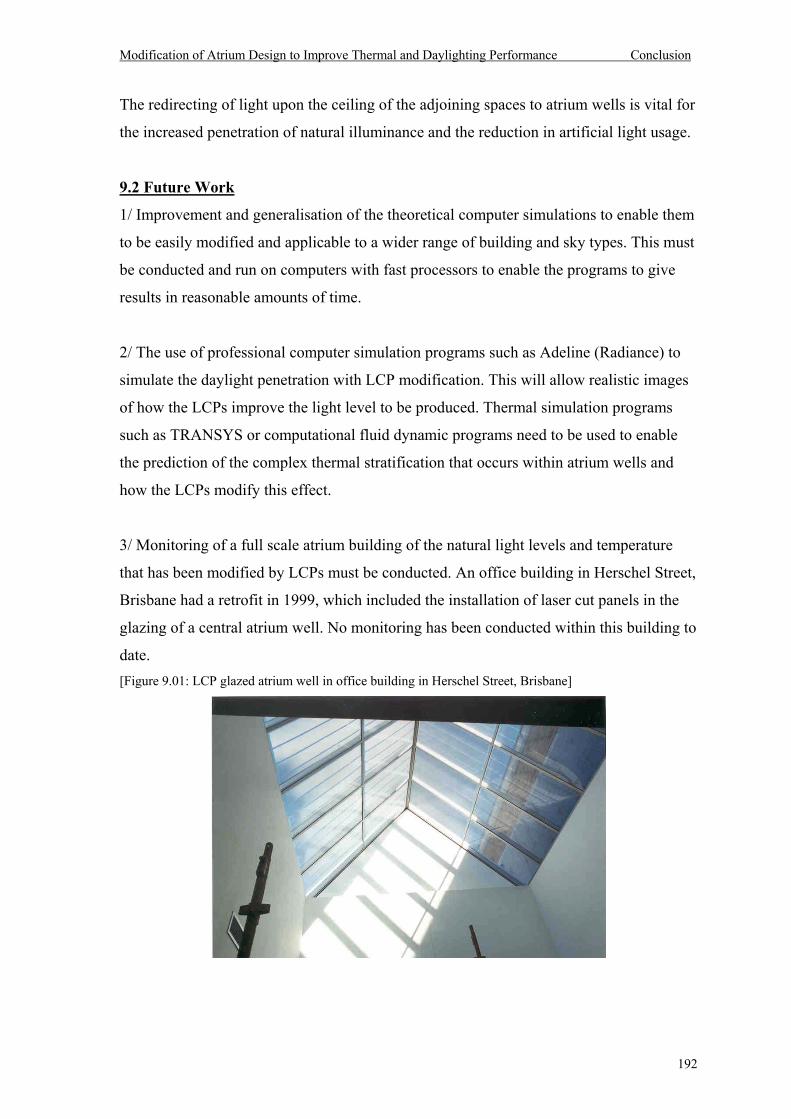
Modification of Atrium Design to Improve Thermal and Daylighting Performance Conclusion
192
The redirecting of light upon the ceiling of the adjoining spaces to atrium wells is vital for
the increased penetration of natural illuminance and the reduction in artificial light usage.
9.2 Future Work
1/ Improvement and generalisation of the theoretical computer simulations to enable them
to be easily modified and applicable to a wider range of building and sky types. This must
be conducted and run on computers with fast processors to enable the programs to give
results in reasonable amounts of time.
2/ The use of professional computer simulation programs such as Adeline (Radiance) to
simulate the daylight penetration with LCP modification. This will allow realistic images
of how the LCPs improve the light level to be produced. Thermal simulation programs
such as TRANSYS or computational fluid dynamic programs need to be used to enable
the prediction of the complex thermal stratification that occurs within atrium wells and
how the LCPs modify this effect.
3/ Monitoring of a full scale atrium building of the natural light levels and temperature
that has been modified by LCPs must be conducted. An office building in Herschel Street,
Brisbane had a retrofit in 1999, which included the installation of laser cut panels in the
glazing of a central atrium well. No monitoring has been conducted within this building to
date. [Figure 9.01: LCP glazed atrium well in office building in Herschel Street, Brisbane]
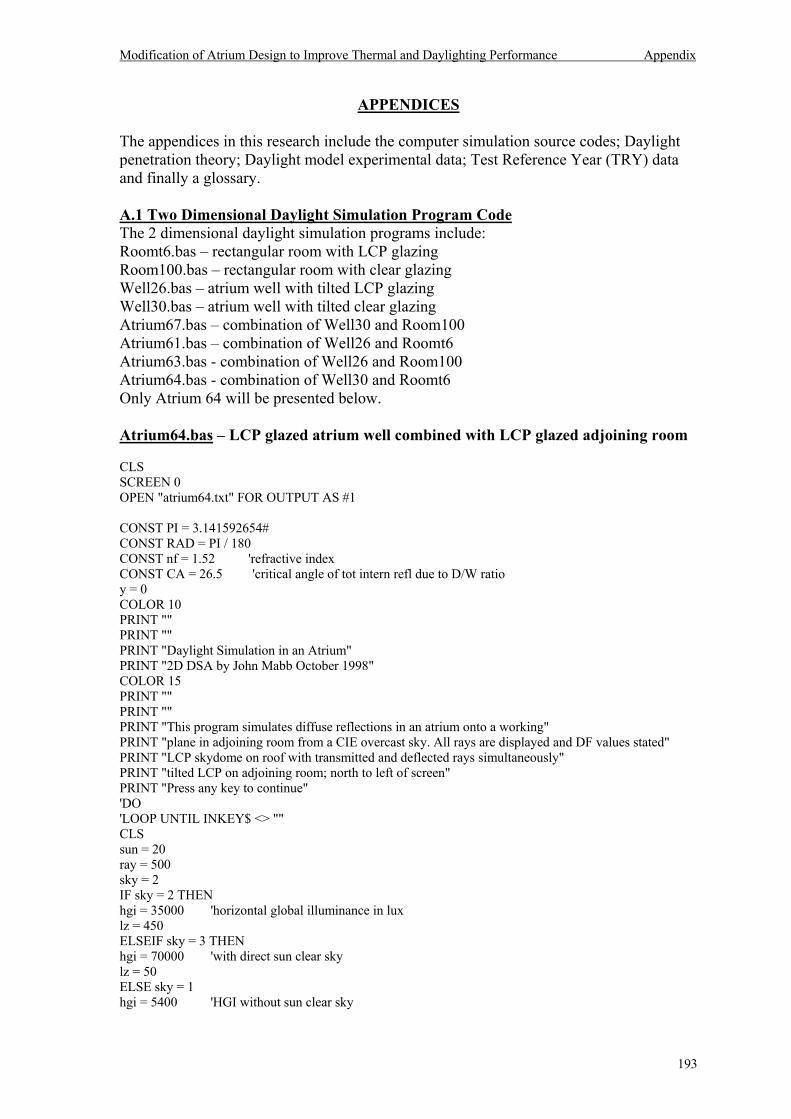
Modification of Atrium Design to Improve Thermal and Daylighting Performance Appendix
193
APPENDICES The appendices in this research include the computer simulation source codes; Daylight penetration theory; Daylight model experimental data; Test Reference Year (TRY) data and finally a glossary. A.1 Two Dimensional Daylight Simulation Program Code The 2 dimensional daylight simulation programs include: Roomt6.bas rectangular room with LCP glazing Room100.bas rectangular room with clear glazing Well26.bas atrium well with tilted LCP glazing Well30.bas atrium well with tilted clear glazing Atrium67.bas combination of Well30 and Room100 Atrium61.bas combination of Well26 and Roomt6 Atrium63.bas - combination of Well26 and Room100 Atrium64.bas - combination of Well30 and Roomt6 Only Atrium 64 will be presented below. Atrium64.bas LCP glazed atrium well combined with LCP glazed adjoining room CLS SCREEN 0 OPEN "atrium64.txt" FOR OUTPUT AS #1 CONST PI = 3.141592654# CONST RAD = PI / 180 CONST nf = 1.52 'refractive index CONST CA = 26.5 'critical angle of tot intern refl due to D/W ratio y = 0 COLOR 10 PRINT "" PRINT "" PRINT "Daylight Simulation in an Atrium" PRINT "2D DSA by John Mabb October 1998" COLOR 15 PRINT "" PRINT "" PRINT "This program simulates diffuse reflections in an atrium onto a working" PRINT "plane in adjoining room from a CIE overcast sky. All rays are displayed and DF values stated" PRINT "LCP skydome on roof with transmitted and deflected rays simultaneously" PRINT "tilted LCP on adjoining room; north to left of screen" PRINT "Press any key to continue" 'DO 'LOOP UNTIL INKEY$ <> "" CLS sun = 20 ray = 500 sky = 2 IF sky = 2 THEN hgi = 35000 'horizontal global illuminance in lux lz = 450 ELSEIF sky = 3 THEN hgi = 70000 'with direct sun clear sky lz = 50 ELSE sky = 1 hgi = 5400 'HGI without sun clear sky
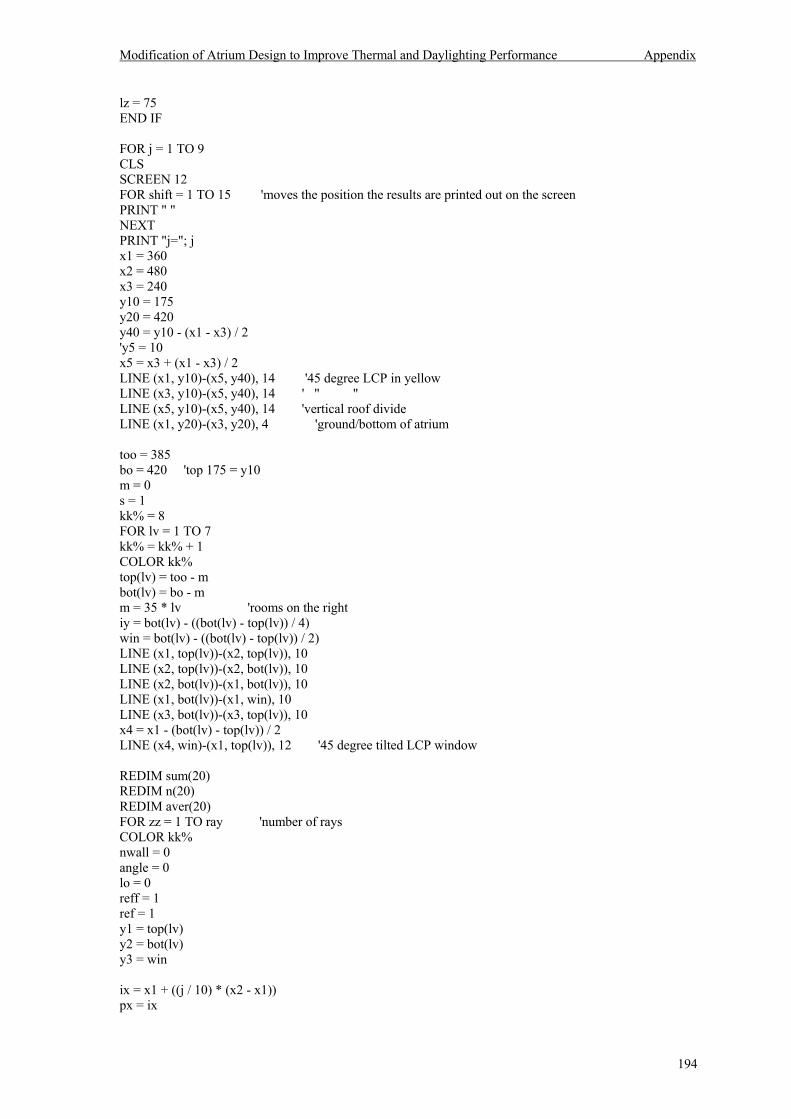
Modification of Atrium Design to Improve Thermal and Daylighting Performance Appendix
194
lz = 75 END IF FOR j = 1 TO 9 CLS SCREEN 12 FOR shift = 1 TO 15 'moves the position the results are printed out on the screen PRINT " " NEXT PRINT "j="; j x1 = 360 x2 = 480 x3 = 240 y10 = 175 y20 = 420 y40 = y10 - (x1 - x3) / 2 'y5 = 10 x5 = x3 + (x1 - x3) / 2 LINE (x1, y10)-(x5, y40), 14 '45 degree LCP in yellow LINE (x3, y10)-(x5, y40), 14 ' " " LINE (x5, y10)-(x5, y40), 14 'vertical roof divide LINE (x1, y20)-(x3, y20), 4 'ground/bottom of atrium too = 385 bo = 420 'top 175 = y10 m = 0 s = 1 kk% = 8 FOR lv = 1 TO 7 kk% = kk% + 1 COLOR kk% top(lv) = too - m bot(lv) = bo - m m = 35 * lv 'rooms on the right iy = bot(lv) - ((bot(lv) - top(lv)) / 4) win = bot(lv) - ((bot(lv) - top(lv)) / 2) LINE (x1, top(lv))-(x2, top(lv)), 10 LINE (x2, top(lv))-(x2, bot(lv)), 10 LINE (x2, bot(lv))-(x1, bot(lv)), 10 LINE (x1, bot(lv))-(x1, win), 10 LINE (x3, bot(lv))-(x3, top(lv)), 10 x4 = x1 - (bot(lv) - top(lv)) / 2 LINE (x4, win)-(x1, top(lv)), 12 '45 degree tilted LCP window REDIM sum(20) REDIM n(20) REDIM aver(20) FOR zz = 1 TO ray 'number of rays COLOR kk% nwall = 0 angle = 0 lo = 0 reff = 1 ref = 1 y1 = top(lv) y2 = bot(lv) y3 = win ix = x1 + ((j / 10) * (x2 - x1)) px = ix
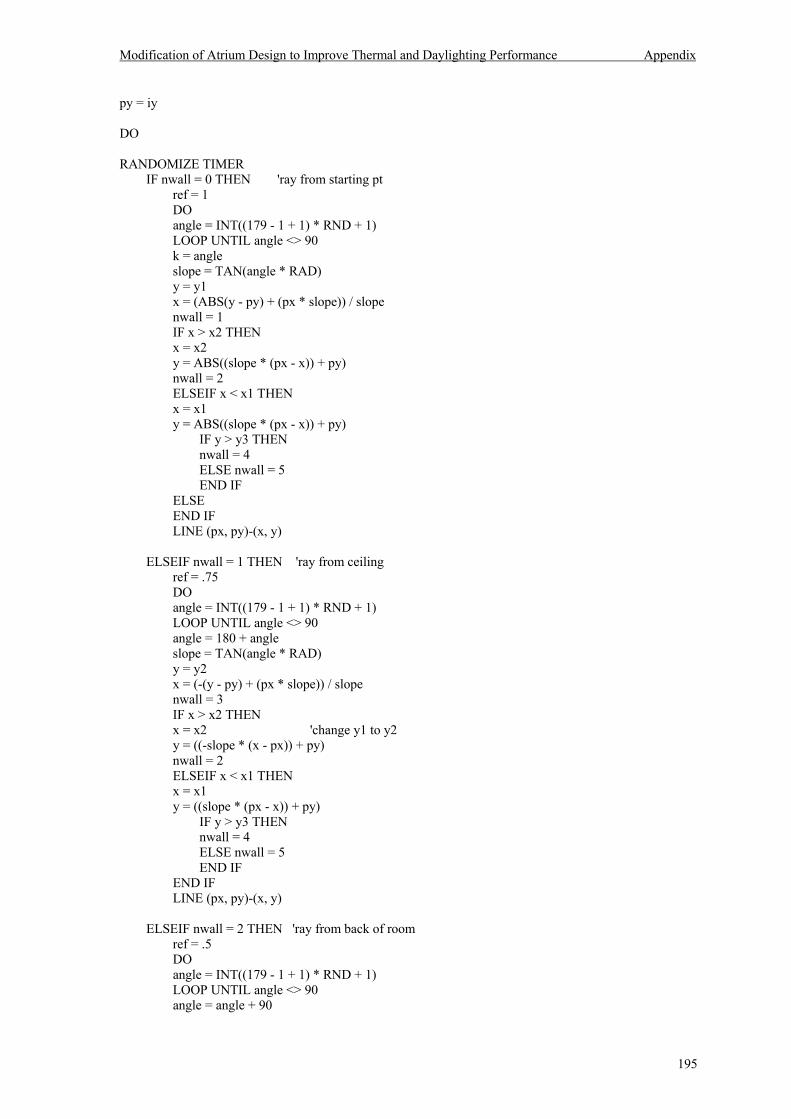
Modification of Atrium Design to Improve Thermal and Daylighting Performance Appendix
195
py = iy DO RANDOMIZE TIMER IF nwall = 0 THEN 'ray from starting pt ref = 1 DO angle = INT((179 - 1 + 1) * RND + 1) LOOP UNTIL angle <> 90 k = angle slope = TAN(angle * RAD) y = y1 x = (ABS(y - py) + (px * slope)) / slope nwall = 1 IF x > x2 THEN x = x2 y = ABS((slope * (px - x)) + py) nwall = 2 ELSEIF x < x1 THEN x = x1 y = ABS((slope * (px - x)) + py) IF y > y3 THEN nwall = 4 ELSE nwall = 5 END IF ELSE END IF LINE (px, py)-(x, y) ELSEIF nwall = 1 THEN 'ray from ceiling ref = .75 DO angle = INT((179 - 1 + 1) * RND + 1) LOOP UNTIL angle <> 90 angle = 180 + angle slope = TAN(angle * RAD) y = y2 x = (-(y - py) + (px * slope)) / slope nwall = 3 IF x > x2 THEN x = x2 'change y1 to y2 y = ((-slope * (x - px)) + py) nwall = 2 ELSEIF x < x1 THEN x = x1 y = ((slope * (px - x)) + py) IF y > y3 THEN nwall = 4 ELSE nwall = 5 END IF END IF LINE (px, py)-(x, y) ELSEIF nwall = 2 THEN 'ray from back of room ref = .5 DO angle = INT((179 - 1 + 1) * RND + 1) LOOP UNTIL angle <> 90 angle = angle + 90

Modification of Atrium Design to Improve Thermal and Daylighting Performance Appendix
196
slope = TAN(angle * RAD) x = x1 y = (slope * (-x + px)) + py IF y > y1 AND y < y3 THEN nwall = 5 ELSEIF y > y3 AND y < y2 THEN nwall = 4 ELSEIF y < y1 THEN y = y1 x = (-(ABS((y - py) / slope))) + px nwall = 1 ELSEIF y > y2 THEN y = y2 x = (-((y - py) / slope)) + px nwall = 3 ELSE END IF LINE (px, py)-(x, y) ELSEIF nwall = 3 THEN 'ray bounce from floor ref = .25 DO angle = INT((179 - 1 + 1) * RND + 1) LOOP UNTIL angle <> 90 slope = TAN(angle * RAD) y = y1 x = ((py - y) + (px * slope)) / slope nwall = 1 IF x > x2 THEN x = x2 y = (-(slope * (x - px)) + py) nwall = 2 ELSEIF x < x1 THEN x = x1 y = (-(-slope * (px - x)) + py) IF y > y3 THEN nwall = 4 ELSE nwall = 5 END IF END IF LINE (px, py)-(x, y) ELSEIF nwall = 4 THEN 'ray from front wall ref = .5 DO angle = INT((179 - 1 + 1) * RND + 1) LOOP UNTIL angle <> 90 angle = 270 + angle 'ray come off wall 4 slope = TAN(angle * RAD) x = x2 y = -(slope * (x - px)) + py nwall = 2 IF y < y1 THEN y = y1 x = ((ABS((y - py) / slope))) + px nwall = 1 ELSEIF y > y2 THEN y = y2 x = (ABS((y - py) / slope)) + px nwall = 3

Modification of Atrium Design to Improve Thermal and Daylighting Performance Appendix
197
ELSE END IF LINE (px, py)-(x, y) ELSEIF nwall = 5 THEN 'window ray will hit window IF lang < 225 THEN ref = .95 lange = 180 - lang slope = TAN(lange * RAD) x = (py - y1) / (1 + slope) 'sim equ to find pt on angled window y = x 'cause 45 degrees x = x1 - x y = y1 + y ia = ABS(135 - lang) 'cause at 45 deg then incidence angle changes r2 = ia 'r1 = asin(SIN(r2) / n) 'no arcsin in basic so u = SIN((r2 * RAD)) / nf 'find r1 from r2 v = ATN(u / (SQR(1 - u ^ 2))) 'atan swop cause no asin in basic programming v = v * 180 / PI r1 = v IF r1 < CA THEN fd = 2 * TAN(r1 * RAD) ELSEIF r1 > CA THEN fd = 2 - 2 * TAN(r1 * RAD) ELSE r1 = CA fd = 1 END IF fdr = RND IF fd > fdr THEN 'if fract deflect > random no. then deflects 'COLOR 9 IF lang > 135 AND lang < 224 THEN angle = -(2 * ia) + lang ELSEIF lang < 135 THEN angle = (2 * ia) + lang ELSE angle = lang END IF ELSEIF fd < fdr THEN 'COLOR 15 angle = lang ELSE END IF IF y < win THEN LINE (px, py)-(x, y) px = x py = y ELSE x = px y = py angle = lang END IF ELSEIF lang > 224 THEN 'nwall = 6 'it can hit at 210 and not hit tilted window? x = px y = py angle = lang ELSE 'nwall = 7

Modification of Atrium Design to Improve Thermal and Daylighting Performance Appendix
198
END IF slope = TAN(angle * RAD) IF angle < 180 THEN y = y10 x = (ABS(y - py) + (px * slope)) / slope nwall = 9 'roof IF x > x5 THEN nwall = 9 'right LCP ELSE nwall = 10 'left LCP END IF IF x > x1 THEN x = x1 y = ABS((slope * (px - x)) + py) nwall = 6 'window wall ELSEIF x < x3 THEN x = x3 y = ABS((slope * (px - x)) + py) nwall = 8 'opposite wall ELSE END IF ELSEIF angle > 180 THEN y = y20 x = (-(y - py) + (px * slope)) / slope nwall = 7 'floor IF x > x1 THEN x = x1 y = ((-slope * (x - px)) + py) nwall = 6 'window wall ELSEIF x < x3 THEN x = x3 y = ABS((slope * (px - x)) + py) nwall = 8 'opposite wall ELSE END IF ELSE END IF 'PRINT lang; angle; px; py; nwall; x; y LINE (px, py)-(x, y) ELSEIF nwall = 6 THEN 'ray off front/window wall of atrium ref = .5 DO angle = INT((179 - 1 + 1) * RND + 1) LOOP UNTIL angle <> 90 angle = angle + 90 slope = TAN(angle * RAD) x = x3 y = (slope * (-x + px)) + py nwall = 8 IF y < y10 THEN y = y10 x = (-(ABS((y - py) / slope))) + px IF x > x5 THEN nwall = 9 'right LCP ELSE
Modification of Atrium Design to Improve Thermal and Daylighting Performance Appendix
199
nwall = 10 'left LCP END IF ELSEIF y > bo THEN y = bo x = (-((y - py) / slope)) + px nwall = 7 ELSE END IF LINE (px, py)-(x, y) ELSEIF nwall = 7 THEN 'ray bounce from floor of atrium ref = .25 DO angle = INT((179 - 1 + 1) * RND + 1) '150 LOOP UNTIL angle <> 90 slope = TAN(angle * RAD) y = y10 x = (ABS(y - py) + (px * slope)) / slope IF x > x5 THEN nwall = 9 'right LCP ELSE nwall = 10 'left LCP END IF IF x > x1 THEN x = x1 'change y1 to y2 y = (-(slope * (x - px)) + py) nwall = 6 ELSEIF x < x3 THEN x = x3 y = (-(-slope * (px - x)) + py) nwall = 8 END IF LINE (px, py)-(x, y) 'PRINT "w= "; nwall; "a="; angle; "s= "; slope; " y= "; y; " x= "; x ELSEIF nwall = 8 THEN 'ray from opposite wall of atrium ref = .5 DO angle = INT((179 - 1 + 1) * RND + 1) LOOP UNTIL angle <> 90 angle = 270 + angle 'ray come off wall 4 slope = TAN(angle * PI / 180) x = x1 y = -(slope * (x - px)) + py nwall = 6 IF y < y10 THEN y = y10 x = ((ABS((y - py) / slope))) + px IF x < x5 THEN nwall = 10 'left LCP ELSE nwall = 9 'right LCP END IF ELSEIF y > bo THEN y = bo x = (ABS((y - py) / slope)) + px nwall = 7 ELSE END IF LINE (px, py)-(x, y)
Modification of Atrium Design to Improve Thermal and Daylighting Performance Appendix
200
ELSEIF nwall = 9 THEN 'rightside of skydome window IF lang > 360 THEN lang = lang - 360 ELSEIF lang = 135 THEN 'to eliminate div by zero lang = lang + 1 END IF COLOR 15 ref = .95 'put in fresnel nwall = 11 h = lang wslope = TAN(135 * RAD) 'tilt at 45 degrees slope = TAN(lang * RAD) y = ((x1 - px) * TAN(lang * RAD)) / (wslope - slope) x = y x = x1 - (-x) '? y = y10 - (-y) IF lang > 135 THEN 'if lines diverge x = x5 - 1 END IF IF x < x5 THEN x = x5 y = ((slope * (px - x))) + py LINE (px, py)-(x, y), 14 px = x py = y lange = 180 - h slope = TAN(lange * RAD) x = (py - y40) / (-wslope + slope) 'sim equ to find pt on angled window y = x 'cause 45 degrees x = x5 - x y = y40 + y LINE (px, py)-(x, y), 14 ia = ABS(135 - h) ELSE LINE (px, py)-(x, y), 15 ia = ABS(45 - h) END IF r2 = ia 'r1 = asin(SIN(r2) / n) 'no arcsin in basic so w = SIN(r2 * RAD) / nf 'find r1 from r2 v = ATN(w / (SQR(1 - w ^ 2))) 'atan swop cause no asin v = v / RAD r1 = v IF r1 < CA THEN fd = 2 * TAN(r1 * RAD) ELSEIF r1 > CA THEN fd = 2 - 2 * TAN(r1 * RAD) ELSE r1 = CA fd = 1 END IF fud = 1 - fd COLOR 9 IF x > x5 THEN IF h > 45 THEN angle = -(2 * ia) + h ELSE

Modification of Atrium Design to Improve Thermal and Daylighting Performance Appendix
201
angle = (2 * ia) + h END IF END IF IF x < x5 THEN IF h > 135 THEN angle = -(2 * ia) + h ELSE angle = (2 * ia) + h END IF END IF ELSEIF nwall = 10 THEN 'leftside of LCP skydome IF lang > 360 THEN lang = lang - 360 END IF IF lang = 45 THEN 'to eliminate div by zero lang = lang + 1 END IF COLOR 15 ref = .95 'put in fresnel nwall = 11 h = lang wslope = TAN(45 * RAD) 'tilt at 45 degrees lange = 180 - h slope = TAN(lang * RAD) y = ((px - x3) * TAN(lange * RAD)) / (wslope + (-slope)) 'still have div by zero but why at 45' x = y x = x3 + x y = y10 - y IF lang < 45 THEN x = x5 + 1 END IF IF x > x5 THEN x = x5 y = ((slope * (px - x))) + py LINE (px, py)-(x, y), 14 px = x py = y slope = TAN(lang * RAD) x = (py - y40) / (wslope + slope) 'sim equ to find pt on angled window y = x 'cause 45 degrees x = x5 + x y = y40 + y LINE (px, py)-(x, y), 14 ia = ABS(45 - h) ELSE LINE (px, py)-(x, y), 15 ia = ABS(135 - h) END IF r2 = ia 'r1 = asin(SIN(r2) / n) 'no arcsin in basic so w = SIN(r2 * RAD) / nf 'find r1 from r2 v = ATN(w / (SQR(1 - w ^ 2))) 'atan swop cause no asin v = v / RAD r1 = v IF r1 < CA THEN fd = 2 * TAN(r1 * RAD) ELSEIF r1 > CA THEN fd = 2 - 2 * TAN(r1 * RAD)
Modification of Atrium Design to Improve Thermal and Daylighting Performance Appendix
202
ELSE r1 = CA fd = 1 END IF fud = 1 - fd COLOR 9 IF h > 135 AND x < x5 THEN angle = -(2 * ia) + h ELSE angle = (2 * ia) + h END IF IF h > 45 AND x > x5 THEN angle = -(2 * ia) + h ELSE angle = (2 * ia) + h END IF ELSEIF nwall = 11 THEN 'sky ref = 1 'transmitted ray slope = TAN(h * RAD) ptx = COS(h * RAD) pty = SIN(h * RAD) pt = SIN(h * RAD) x = px + (ptx * px) y = py - (pty * py) LINE (px, py)-(x, y), 15 nwall = 13 'deflected ray ref = 1 wall = nwall IF lang > 180 OR lang < 0 THEN 'to ground lange = lang slope = TAN(lange * RAD) ptx = COS(lange * RAD) pty = SIN(lange * RAD) pt = SIN(lang * RAD) x = px + (ptx * px) y = py - (pty * py) LINE (px, py)-(x, y), 14 nwall = 12 ELSEIF angle < 180 THEN ref = 1 wall = nwall lange = lang slope = TAN(lange * RAD) ptx = COS(lange * RAD) pty = SIN(lange * RAD) pt = SIN(lang * RAD) x = px + (ptx * px) y = py - (pty * py) LINE (px, py)-(x, y), 9 nwall = 13 ELSE END IF ELSEIF nwall = 12 THEN 'ground ref = .2 pt = ABS(SIN(lange * RAD))

Modification of Atrium Design to Improve Thermal and Daylighting Performance Appendix
203
l = ((hgi / 2) * ref * pt) 'cosine correction loo = l * fd * tpp * PI * PI / 20 * tp * reff 'meter and solid angle nwall = 14 'to end IF sky = 1 THEN t = h * RAD '10 to 90 degrees in 10' increments measure pt z = sun * RAD 'angle of sun to zenith eg42 a = -1 b = -.32 c = 10 d = -3 e = .45 f = .91 IF h > 90 AND h < 180 THEN g = ABS((t - (PI / 2)) + z) og = 1 + a * EXP(b / COS(t - (PI / 2))) ELSEIF h < 90 THEN g = ABS(((PI / 2) - t) - z) og = 1 + a * EXP(b / COS((PI / 2) - t)) ELSE PRINT stuffed END IF fas = f + (c * EXP(d * g)) + (e * COS(g) * COS(g)) IF h < (sun + 5) AND h > (sun - 5) THEN fas = fas * 20 'sun position width END IF op = 1 + a * EXP(b) fpg = f + (c * EXP(d * z)) + (e * COS(z) * COS(z)) ol = lz * ((fas * og) / (fpg * op)) 'pt = SIN(lang * RAD) lao = ol * fud * tpp * PI * PI / 20 * tp * reff 'meter and solid angle loo = lao + lo ELSEIF sky = 2 THEN pt = SIN(h * RAD) ol = (lz / 3) * (1 + (2 * pt)) loo = ol * reff * fud * tp * PI * PI / 20 * tpp loo = loo + lo ELSE 'direct sky END IF ELSEIF nwall = 13 THEN 'choose sky type nwall = 14 'to end ref = 1 IF sky = 1 THEN 'clear sky w = lang t = w * RAD '10 to 90 degrees in 10' increments measure pt z = sun * RAD 'angle of sun to zenith eg42 a = -1 b = -.32 c = 10 d = -3 e = .45 f = .91 IF w > 90 AND w < 180 THEN g = ABS((t - (PI / 2)) + z) og = 1 + a * EXP(b / COS(t - (PI / 2))) ELSEIF w < 90 THEN g = ABS(((PI / 2) - t) - z)
Modification of Atrium Design to Improve Thermal and Daylighting Performance Appendix
204
og = 1 + a * EXP(b / COS((PI / 2) - t)) ELSE PRINT stuffed END IF fas = f + (c * EXP(d * g)) + (e * COS(g) * COS(g)) IF w < (sun + 5) AND w > (sun - 5) THEN fas = fas * 20 'sun position width END IF op = 1 + a * EXP(b) fpg = f + (c * EXP(d * z)) + (e * COS(z) * COS(z)) ol = lz * ((fas * og) / (fpg * op)) pt = SIN(lang * RAD) lao = ol * reff * fd * tp * PI * PI / 20 * tpp t = h * RAD IF h > 90 AND h < 180 THEN g = ABS((t - (PI / 2)) + z) og = 1 + a * EXP(b / COS(t - (PI / 2))) ELSEIF h < 90 THEN g = ABS(((PI / 2) - t) - z) og = 1 + a * EXP(b / COS((PI / 2) - t)) ELSE END IF fas = f + (c * EXP(d * g)) + (e * COS(g) * COS(g)) IF h < (sun + 5) AND h > (sun - 5) THEN fas = fas * 20 'sun position width END IF op = 1 + a * EXP(b) fpg = f + (c * EXP(d * z)) + (e * COS(z) * COS(z)) ool = lz * ((fas * og) / (fpg * op)) pt = SIN(lang * RAD) lo = ool * reff * fud * tp * PI * PI / 20 * tpp loo = lo + lao ELSEIF sky = 2 THEN 'overcast sky pt = SIN(lang * RAD) lo = (lz / 3) * (1 + (2 * pt)) loo = lo * reff * fd * tp * PI * PI / 20 * tpp 'put in pt cause angle of incidence on meter is at angle pt = SIN(h * RAD) ol = (lz / 3) * (1 + (2 * pt)) lo = ol * reff * fud * tp * PI * PI / 20 * tpp loo = loo + lo ELSE sky = 3 'direct/clear sky w = lang sunn = 180 - (90 - sun) IF w > (sunn - 5) AND w < (sunn + 5) THEN l = 85000 ELSE l = 50 END IF pt = ABS(SIN(lang * RAD)) lo = l * reff * fd * tp * PI * PI / 20 * tpp w = h sunn = 180 - (90 - sun) IF w > (sunn - 5) AND w < (sunn + 5) THEN l = 85000 ELSE l = 50
Modification of Atrium Design to Improve Thermal and Daylighting Performance Appendix
205
END IF pt = ABS(SIN(lang * RAD)) loo = l * fud * reff * tp * PI * PI / 20 * tpp loo = loo + lo 'pi*tpp*PI/20 is for solid angle 'put in tp cause angle of incidence on meter is at angle END IF END IF reff = reff * ref px = x py = y tp = SIN(k * RAD) 'solid angle tpp = ABS(COS(k * RAD)) 'cosine correction lslope = slope lang = angle LOOP UNTIL nwall = 14 p = INT(k / 9) + 1 '20 divisions of 9' each n(p) = n(p) + 1 sum(p) = sum(p) + loo aver(p) = sum(p) / n(p) NEXT 'next ray choose a increment angle and find aver E in each then sum up maver = 0 FOR p = 1 TO 20 maver = maver + aver(p) NEXT lux = maver df = (lux / hgi) * 1000 PRINT lux; df PRINT #1, lux; df NEXT 'next room above last NEXT 'initial position CLOSE #1 END
Modification of Atrium Design to Improve Thermal and Daylighting Performance Appendix
206
A.2 Three Dimensional Daylight Simulation Program Code The three dimensional daylight simulation programs include: Room12.m - rectangular room with clear glazing Room10.m - rectangular room LCP glazing Well04.m - atrium well clear pyramid glazing Well05.m - atrium well LCP pyramid glazing Atrium3 - room adjoining atrium well with normal room and well Atrium5 - room adjoining atrium well with LCP on room and normal well Atrium4 - room adjoining atrium well with LCP on room and well Atrium6 - room adjoining atrium well with normal room and LCP well Room12.m Rectangular room with clear glazing % Daylight Simulation in a Room (DSR) % 3D DSR by John Mabb June 2000 % This ray tracing program simulates the daylight penetration into a 3D room onto a working plane. % A graph is displayed showing the light level along the work plane in lux. % This program includes a clear glazed north oriented window, diffuse interior surfaces, exterior ground % and 2 sky distribution models. rad=pi/180; % degree to radian conversion % boundary distances b6=0; b5=300; b4=0; b3=0; b2=300; b1=800; % perpendicular distance from origin to plane p6=-b6; p5=-b5; p4=-b4; p3=-b3; p2=-b2; p1=-b1; s=1; for ixp=80:160:720 % for h=7:1:17 q=0; % no. of indirect rays to sun j=0; % no. of rays to ground av=0; avref=0; nu=0; solang=20; % solid angle divisions over pi sol=1:20; ray=1000; % number of rays per point sky=2; % type of sky distribution 1=overcast, 2=direct %ixp=400; % initial position iyp=150; izp=80; % height of work plane (0 or 80) m=zeros(size(sol)); su=zeros(size(sol)); avlux=zeros(size(sol)); for light=1:ray % no of rays per pt reff=1; iw=0; % initial wall num=0; x2=ixp; % initial coordinate position y2=iyp; z2=izp; % on work plane

Modification of Atrium Design to Improve Thermal and Daylighting Performance Appendix
207
% Ray tracing algorithm within rectangular prism while iw~=7 % loop until hit exit aperture x1=x2; y1=y2; z1=z2; ref=1; % reflectivities of the surfaces t=1; % transmission of the glass % Random altitude and azimuth angles % Simulation diffuse reflections off surfaces if iw==6 az=360*rand; alt=asin(rand)/rad; ref=0.65; % reflectivity of the surface elseif iw==5 az=360*rand; alt=asin(-rand)/rad; ref=0.75; elseif iw==0 % work plane az=360*rand; alt=asin(rand)/rad; ref=1; elseif iw==4 az=180*rand; alt=asin((2*rand)-1)/rad; ref=0.75; elseif iw==3 az=180*rand-90; alt=asin((2*rand)-1)/rad; ref=0.75; elseif iw==2 az=180*rand+180; alt=asin((2*rand)-1)/rad; ref=0.75; elseif iw==1 az=180*rand+90; alt=asin((2*rand)-1)/rad; ref=0.75; else end zen=(90-alt)*rad; azi=az*rad; % Geometrical Framework - (Tregenza 1994) % Direction Cosines c1=cos(azi)*sin(zen); c2=sin(azi)*sin(zen); c3=cos(zen); % Distance to Planes r6=-(-z1+p6)/(-c3); r5=-(z1+p5)/(c3); r4=-(-y1+p4)/(-c2); r3=-(-x1+p3)/(-c1); r2=-(y1+p2)/(c2); r1=-(x1+p1)/(c1); r=[r1,r2,r3,r4,r5,r6]; % Distance array
Modification of Atrium Design to Improve Thermal and Daylighting Performance Appendix
208
% Select the smallest positive element in distance array for n=1:6 if sign(r(n))==-1 r(n)=r(n)*(-inf); elseif r(n)==0 r(n)=r(n)+inf; else r(n)=r(n)*1; end end i=min(r); for n=1:6 if r(n)==min(r) iw=n; % Intercept Wall end end % Find initial angle for cosine correction if num==0 k=alt; tp=sin(k*rad); tpp=cos(k*rad); end % Find Interest Coordinates x2=x1+min(r).*c1; y2=y1+min(r).*c2; z2=z1+min(r).*c3; if iw==1 & z2>120 & y2>120 & z2<240 & y2<240 % exit aperture boundary values iw=7; % intercept wall to exit loop z=abs(az)*rad; % az for ray to hit window wrt 0deg v=alt; if alt<0; j=j+1; end zr=z/rad; tit=0; % tilt of window zen=abs(alt*rad); % Incident angle off axis - (IES 1995) hh=acos(sin(zen)*sin(tit*rad)+cos(zen)*cos(tit*rad)*cos(z)); g=hh/rad; % angle between the plane of panel and ray n1=1.0003; % refractive index of air n2=1.523; % acrylic=1.50 glass=1.523 % Effective Refractive Index due to angle - (Whitehead 1982) n2=sqrt(n2^2-(n1^2*sin(g*rad)^2)); % Transmission through transparent medium - (Hardy 1932) rfa=(asin((n1/n2)*sin(g*rad)))/rad; % angle of refraction zt=g-rfa; zs=g+rfa; oi=(sin(zt*rad))^2/(sin(zs*rad))^2; io=(tan(zt*rad))^2/(tan(zs*rad))^2; re=(0.5*oi)+(0.5*io); % reflection through medium t=(1-re)^2*0.9; % transmission through two surfaces end % window
Modification of Atrium Design to Improve Thermal and Daylighting Performance Appendix
209
reff=reff*ref*t; num=num+1; end % while exit loop new ray nu=nu+num; avref=avref+reff; % does reff have value outside loop % Sky Luminance Distribution if sky==1 % overcast sky lz=9000; % zenith luminance cd/m2 hgi=(7*pi*lz)/9; % horizontal global illuminance %hgi=25000; %lz=(hgi*9)/(7*pi); if alt<0 % find if exit ray hits ground l=hgi*0.3*abs(sin(alt*rad)); else % find luminance of ray if hits sky l=(lz/3)*(1+2*sin(alt*rad)); % - (IES 1995) end elseif sky==2 % direct/isotropic sky % Day number of year - (Pearce 1999) h=11; % hour of day day=14; % day of month month=7; % month of year if month<3 ndy=31*(month-1)+day; elseif month<9 & month>2 ndy=59+31*(month-3)-floor(((month-3)/2)+0.1)+day; elseif month<13 & month>8 ndy=243+31*(month-9)-floor(((month-8)/2)+0.1)+day; else end % Solar Position (IES 1995) lat=-27.5*r; % latitude of Brisbane rlong=150; % standard nearest longitude meridian slong=153.1; % local longitude of Brisbane et1=0.17*sin(4*pi*(ndy-80)/373); % equation of time et2=0.129*sin(2*pi*(ndy-8)/355); % " " et=et1-et2; % " " dec=0.4093*sin(2*pi*(ndy-81)/368); % solar declination hr=h+et+(slong-rlong)/15; % solar time hra=15*(hr-12)*r; % hour angle srh=(acos(-tan(dec)*tan(lat)))/r; % sunrise hour angle srt=12-(srh/15); % sunrise time % 15 degrees/hr is movement of sun sst=12+(srh/15); % sunset time % solar time % Solar altitude (wrt ground) & solar azimuth (wrt North) - (Szokolay 1996) salt=180/pi*asin(sin(lat)*sin(dec)+cos(lat)*cos(dec)*cos(hra)); sazi=180/pi*acos((cos(lat)*sin(dec)-cos(dec)*sin(lat)*cos(hra))./cos(rad*salt)); if h>12 aft=h>12; sazi=360+(sazi-2*aft.*sazi); end szen=90-salt; % angle of sun to zenith w=0.023; % solid angle
Modification of Atrium Design to Improve Thermal and Daylighting Performance Appendix
210
lz=70; % cd/m2 zenith luminance hgi=75000; % horizontal global illuminance dl=90000/w; % direct illumiance idl=lz/w; % indirect illuminance if alt<0 % find if exit ray hits sky or ground l=hgi*0.3*abs(sin(alt*rad)); % reflected rays to sun elseif alt<salt+5 & alt>salt-5 & az<sazi+5 & az>sazi-5 % size of sun 10deg l=dl; % cd/m2 (reflected direct for pos in shade) q=q+1; % number of rays to sun else l=idl; % cd/m2 end else end % Find illuminance level loo=l*reff*tpp*tp*pi*(pi/solang); p=ceil(k/(180/solang)); m(p)=m(p)+1; su(p)=su(p)+loo; avlux(p)=su(p)/m(p); end % for light loop end position lux=sum(avlux); av=nu/ray; avf=avref/ray; df=(lux/hgi)*100; % daylight factor ew=[ixp,lux,q,av] % light level, direct rays, ground rays % Plot illuminance upon work plane ee(s)=lux; ff(s)=ixp; % time (h) or position (ixp) s=s+1; end plot(ff,ee) % plot of the light level end % program Room10.m Rectangular room with LCP glazing % Daylight Simulation in a Room (DSR) % 3D DSR by John Mabb June 2000 % This ray tracing program simulates the daylight penetration into a 3D room onto a working plane. % A graph is displayed showing the light level along the work plane in lux. % This program includes an LCP glazed north oriented window, diffuse interior surfaces, exterior ground % and 2 sky distribution models. This simulation has the same boundary conditions, arrays, counters and ray tracing technique as those shown in the base program. refer to room12.m code. The differences in the code are shown below. if iw==1 & z2>120 & y2>120 & z2<240 & y2<240 % exit aperture boundary values iw=7; % intersect wall to exit loop z=abs(az)*rad; %az for ray to hit window (wrt 180deg) valt=alt; % undeflected angle
Modification of Atrium Design to Improve Thermal and Daylighting Performance Appendix
211
v=180-alt; zr=z/rad; tit=40; %tilt of lcp window (not greater than 45deg so not deflect to floor) ntit=180-tit; a=abs(ntit-v); ia=a*rad; % Intersect angle off axis - (IES 1995) hh=acos(sin(ia)*sin(tit*rad)+cos(ia)*cos(tit*rad)*cos(z)); g=hh/rad; % angle between the plane of panel and ray n1=1.0003; % refractive index of air n2=1.500; % acrylic=1.50 glass=1.523 % Effective Refractive Index due to angle - (Whitehead 1982) n2=sqrt(n2^2-(n1^2*sin(g*rad)^2)); % Transmission of light through laser cut panel - (Edmonds 199?) % critical angle of total deflection in LCP D/W=0.5 ca=asin((n2/n1)*atan(0.5))/rad; rfa=(asin((n1/n2)*sin(g*rad)))/rad; % angle of refraction r1=rfa; r2=(asin(n2*sin(r1*rad)))/rad; if v>ntit r3=-(2*g)+v; else r3=(2*g)+v; end alt=180-r3; % deflected angle if valt<-(90-tit) % if ray miss panel due to tilt alt=valt; t=1; % transmission if miss and go to ground else % Transmission through transparent medium - (Hardy 1932) zt=g-rfa; zs=g+rfa; oi=(sin(zt*rad))^2/(sin(zs*rad))^2; io=(tan(zt*rad))^2/(tan(zs*rad))^2; re=(0.5*oi)+(0.5*io); t=(1-re)^2*0.9; end % fraction deflected by LCP - send out 2 rays if g<ca % a=nom (angle between normal and ray) fd=tan(rfa*rad)/0.5; else fd=2-tan(rfa*rad)/0.5; end fud=1-fd; % fraction undeflected by lcp end % window reff=reff*ref*t; num=num+1; end % while exit loop new ray nu=nu+num; avref=avref+reff; % Sky Luminance Distribution if sky==1 % overcast sky lz=9000; % zenith luminance cd/m2
Modification of Atrium Design to Improve Thermal and Daylighting Performance Appendix
212
hgi=(7*pi*lz)/9; % horizontal global illuminance if alt<0 % if exit rays hit ground l=hgi*0.3*abs(sin(alt*rad)); % ground reflectance of 30% else % fraction deflected and undeflected contribution to luminance lu=(lz/3)*(1+2*sin(alt*rad))*fd; ul=(lz/3)*(1+2*sin(valt*rad))*fud; l=lu+ul; end elseif sky==2 % direct/indirect sky Day number of year - (Pearce 1999) Refer to room12.m code Solar Position - (IES 1995) with solar Altitude (wrt ground) & Solar Azimuth (wrt North) - (Szokolay 1996) Refer to room12.m code w=0.023; % solid angle lz=7000; % cd/m2 zenith luminance hgi=75000; % horizontal global illuminance dl=90000/w; % direct luminance cd/m2 idl=70/w; % indirect luminance cd/m2 % fraction deflected and undeflected contribution to luminance if valt<0 % if undeflect exit rays hit ground ld=idl*fd; % then deflect to sky lu=hgi*0.3*abs(sin(valt*rad))*fud; j=j+1; if alt<salt+5 & alt>salt-5 & zr<sazi+5 & zr>sazi-5 & num>1 % size of sun 10deg ld=dl*fd; % cd/m2 (reflected deflected direct ray) q=q+1; %(when middau some of sun -ve so less rays hit sun) end elseif valt>0 % if undeflect to sky ld=hgi*0.3*abs(sin(alt*rad))*fd; % then deflect to ground lu=idl*fud; if valt<salt+5 & valt>salt-5 & zr<sazi+5 & zr>sazi-5 & num==1 & qq==0 % size of sun 10deg lu=dl*fud; % cd/m2 = 110klux (direct ray to sun) qq=qq+1; elseif valt<salt+5 & valt>salt-5 & zr<sazi+5 & zr>sazi-5 & num>1 % size of sun 10deg lu=dl*fud; % cd/m2 (reflected undeflect direct for pos in shade) q=q+1; else end else end % direct ray direction loop l=lu+ld; else end % sky distribution loop % Find illuminance level Refer to room12.m code % Plot illuminance across the work plane Refer to room12.m code end % program
Modification of Atrium Design to Improve Thermal and Daylighting Performance Appendix
213
Well04.m Clear glazed atrium well % Daylight Simulation in a Well (DSW) % 3D DSW by John Mabb May 2000 % This ray tracing program simulates the daylight penetration into a 3D well onto a working plane. % A graph is displayed showing the light level along the work plane in lux. % This program includes a clear glazed horizontal oriented window, diffuse interior surfaces % and 2 sky distribution models. rad=pi/180; % degree to radian conversion % boundary distances b6=0; b5=160; b4=0; b3=0; b2=80; b1=80; % perpendicular distance from origin to plane p6=-b6; p5=-b5; p4=-b4; p3=-b3; p2=-b2; p1=-b1; s=1; for h=11:13 q=0; % counter for direct rays av=0; avref=0; nu=0; solang=20; % solid angle divisions over pi sol=1:20; ray=1000; % number of rays per point sky=2; % type of sky distribution 1=overcast, 2=direct ixp=40; % initial position iyp=40; izp=0; m=zeros(size(sol)); su=zeros(size(sol)); avlux=zeros(size(sol)); for light=1:ray % no of rays per pt reff=1; iw=0; % initial wall num=0; x2=ixp; % initial coordinate position y2=iyp; z2=izp; Ray tracing algorithm within rectangular prism while iw~=15 % loop until hit exit aperture iw=iw; x1=x2; y1=y2; z1=z2; ref=1; % reflectivities of the surfaces t=1; % Random altitude and azimuth angles % Simulates diffuse reflections off surfaces if iw==16 % floor az=360*rand; alt=asin(rand)/rad; ref=0.25; % reflectivity of the surface
Modification of Atrium Design to Improve Thermal and Daylighting Performance Appendix
214
%elseif iw==15 % use if exit aperture is smaller than ceiling %az=360*rand; %alt=asin(-rand)/rad; %ref=1; elseif iw==10 % work plane az=360*rand; alt=asin(rand)/rad; ref=1; elseif iw==14 % vertical wall az=180*rand; alt=asin((2*rand)-1)/rad; ref=0.5; elseif iw==13 % vertical wall az=180*rand-90; alt=asin((2*rand)-1)/rad; ref=0.5; elseif iw==12 % vertical wall az=180*rand+180; alt=asin((2*rand)-1)/rad; ref=0.5; elseif iw==11 % vertical wall az=180*rand+90; alt=asin((2*rand)-1)/rad; ref=0.5; else end zen=(90-alt)*rad; % zenith and azimuth angles in radians if az<0 az=360+az; end azi=az*rad; % Geometrical Framework - (Tregenza 1994) Refer to room12.m code if iw==15 % glazing aperature - ceiling azi=az*rad; tit=45; % tilt of aperture glazing zen=alt*rad; g=abs(tit-alt); n1=1.0003; % refractive index of air n2=1.5; % acrylic=1.50 glass=1.523 % Effective refractive index due to angle - refer to room12.m code
% Transmission through transparent medium - refer to room12.m code end % window reff=reff*ref*t; num=num+1; end % while exit loop new ray nu=nu+num; avref=avref+reff; % Sky Luminance Distribution refer to room12.m code % Find illuminance level refer to room12.m code
Modification of Atrium Design to Improve Thermal and Daylighting Performance Appendix
215
% Plot the illuminance level across work plane refer to room12.m code end % program Well05.m LCP glazed atrium well % Daylight Simulation in a Well (DSW) % 3D DSW by John Mabb May 2000 % This ray tracing program simulates the daylight penetration into a 3D well onto a working plane. % A graph is displayed showing the light level along the work plane in lux. % This program includes an LCP glazed horizontal oriented window, diffuse interior surfaces % and 2 sky distribution models. rad=pi/180; % degree to radian conversion This simulation has boundary conditions, arrays, counters and ray tracing technique as those shown in the well04.m program code. The differences in code are shown below. if iw==15 % aperature area on ceiling azi=az*rad; ti=45; % tilt of window tit=ti*rad; zen=alt*rad; % incident angle off axis - (IES 1995) hh=acos(sin(zen)*sin(tit)+cos(zen)*cos(tit)*cos(azi)); gg=hh/rad; % angle between the plane of panel and ray % transmission through clear pyramid skydome n1=1; % refractive index of air n2=1.5; % acrylic=1.50 glass=1.523
% Effective refractive index due to angle - (Whitehead 1982) n2=sqrt(n2^2-(n1^2*sin(g*rad)^2)); rfa=(asin((n1/n2)*sin(g*rad)))/rad; % angle of refraction
% Transmission through LCP - (Edmonds 199?) wd=0.5; ca=asin((n2/n1)*sin(atan(wd)))/rad; %crit angle of total deflect through LCP r2=asin(n2*sin(rfa*rad))/rad; % angle of deflected beam through LCP if alt>ti r3=ti-r2; else r3=ti+r2; end at=r3; % deflected ray altitude % Tranmission through transparent medium zt=g-rfa; % incident angle - refracted angle zs=g+rfa; oi=(sin(zt*rad))^2/(sin(zs*rad))^2; io=(tan(zt*rad))^2/(tan(zs*rad))^2; re=(0.5*oi)+(0.5*io); t=(1-re)^4; % 2 surfaces % fraction deflected by LCP - send out 2 rays if g<ca % a=nom (angle between normal and ray) fd=tan(rfa*rad)/0.5; else fd=2-tan(rfa*rad)/0.5; end fud=1-fd; % fraction undeflected by lcp end % window

Modification of Atrium Design to Improve Thermal and Daylighting Performance Appendix
216
reff=reff*ref*t; num=num+1; end % while exit loop new ray nu=nu+num; avref=avref+reff; % Sky Luminance Distribution if sky==1 % overcast sky lz=10000; % zenith luminance cd/m2 hgi=(7*pi*lz)/9; % horizontal global illuminance %80,3000 for artificial sky lu=(lz/3)*(1+2*sin(at*rad))*fd; ul=(lz/3)*(1+2*sin(alt*rad))*fud; l=lu+ul; elseif sky==2 % direct/isotropic sky Day number of year (Pearce 1999) refer to room12.m code Solar position - (IEA 1995) including solar Altitude (wrt ground) & Solar Azimuth (wrt North) - (Szokolay 1996) refer to room12.m code w=0.023; % solid angle lz=1500; % cd/m2 zenith luminance hgi=80000; % not need horizontal global illuminance dl=110000/w; % cd/m2 = 110klux change value wrt position of sun (size of sun 20 deg) idl=50/w; % cd/m2 if alt<salt+10 & alt>salt-10 & az<sazi+10 & az>sazi-10 & num==1 & qq==0 lu=dl*fud; % cd/m2 = 110klux (direct ray to sun) ld=idl*fd; qq=qq+1; elseif alt<salt+10 & alt>salt-10 & az<sazi+10 & az>sazi-10 & num>1 lu=dl*fud; % cd/m2 (reflected undeflect direct) ld=idl*fd; q=q+1; elseif at<salt+10 & at>salt-10 & az<sazi+10 & az>sazi-10 & num>1 ld=dl*fd; % cd/m2 (reflected deflect direct) lu=idl*fud; q=q+1; else lu=idl*fud; ld=idl*fd; end % direct ray direction loop l=lu+ld; else end % sky distribution loop % Find illuminance level - refer to room12.m code % Plot illuminance across day refer to room12.m code end % program
Modification of Atrium Design to Improve Thermal and Daylighting Performance Appendix
217
Atrium3.m Clear glazed atrium well combined with clear glazed adjoining room % Daylight Simulation in an Atria (DSA) % 3D DSA by John Mabb June 2000 % This 3D ray tracing program simulates the daylight penetration into a room adjoining an atrium onto a % working plane. % A graph is displayed showing the light level along the work plane in lux. % This program includes a clear glazed atrium well and adjoining room, diffuse interior surfaces % and 2 sky distribution models. rad=pi/180; %degree to radian conversion % boundary distances b6=0; b5=30; b4=0; b3=0; b2=80; b1=80; % perpendicular distance from origin to plane p6=-b6; p5=-b5; p4=-b4; p3=-b3; p2=-b2; p1=-b1; s=1; for ixp=10:10:70 % initial position array qq=0; % no. of direct rays to sun q=0; % no. of indirect rays to sun av=0; avref=0; nu=0; solang=20; % solid angle divisions over pi sol=1:20; ray=1000; % number of rays per point sky=2; % type of sky distribution 1=overcast, 2=direct % ixp=40; iyp=40; m=zeros(size(sol)); su=zeros(size(sol)); avlux=zeros(size(sol)); for light=1:ray % no of rays per pt reff=1; iw=0; % initial wall num=0; x2=ixp; % initial coordinate position y2=iyp; z2=b6; % on floor or at prescribed height above floor on work plane % Ray tracing technique for any rectangular prism as seen in base room program if iw==3 & z2>15 & y2>0 & z2<30 & y2<80 % window area on wall 3 iw=7; %glass on wall 3 so angle wrt 180 deg z=abs(180-az)*rad; %az for ray to hit window? v=alt; zr=z/rad; tit=0; %tilt of window zen=abs(alt*rad); %eliminate ground rays for transmission calculation hh=acos(sin(zen)*sin(tit*rad)+cos(zen)*cos(tit*rad)*cos(z)); g=hh/rad; % angle between the plane of panel and ray g=alt; n1=1; %refractive index of air n2=1.523; %acrylic=1.50 glass=1.523 % Effective Refractive Index due to angle - (Whitehead 1982)
Modification of Atrium Design to Improve Thermal and Daylighting Performance Appendix
218
n2=sqrt(n2^2-(n1^2*sin(g*rad)^2)); rfa=(asin((n1/n2)*sin(g*rad)))/rad; %angle of refraction zt=g-rfa; zs=g+rfa; oi=(sin(zt*rad))^2/(sin(zs*rad))^2; io=(tan(zt*rad))^2/(tan(zs*rad))^2; re=(0.5*oi)+(0.5*io); t=(1-re)^2*0.9; %t=1; %if no glass end % window reff=reff*ref*t; num=num+1; end % while exit loop Refer to well04.m program code 3D ray tracing of a well to find light level with initial starting position at the bottom of the North orientated vertical wall end % program Atrium4.m LCP glazed atrium well combined with LCP glazed adjoining room % Daylight Simulation in an Atria (DSA) % 3D DSA by John Mabb June 2000 % This 3D ray tracing program simulates the daylight penetration into a room adjoining an atrium onto a % working plane. % A graph is displayed showing the light level along the work plane in lux. % This program includes LCP glazed atrium well and adjoining room, diffuse interior surfaces % and 2 sky distribution models. The boundary conditions, counters and arrays are all the same for this program as those set out in the base program and can be viewed in the first program. The ray tracing technique is standard for all the programs as well. if iw==3 & z2>15 & y2>120 & z2<240 & y2<240 % window area on wall 3 iw=7; %glass on wall 3 so angle wrt 180 deg z=abs(180-az)*rad; %az for ray to hit window? valt=alt; v=180-alt; zr=z/rad; tit=40; %tilt of window ntit=180-tit; zen=abs(alt*rad); %eliminate ground rays for transmission calculation hh=acos(sin(zen)*sin(tit*rad)+cos(zen)*cos(tit*rad)*cos(z)); g=hh/rad; % angle between the plane of panel and ray g=abs(ntit-v); n1=1.0003; %refractive index of air n2=1.523; %acrylic=1.50 glass=1.523 % Effective Refractive Index due to angle - (Whitehead 1982) n2=sqrt(n2^2-(n1^2*sin(g*rad)^2)); rfa=(asin((n1/n2)*sin(g*rad)))/rad; %angle of refraction % Transmission of light through laser cut panel - (Edmonds 199?) % critical angle of total deflection in LCP D/W=0.5 ca=asin((n2/n1)*atan(0.5))/rad; %rfa=(asin((n1/n2)*sin(g*rad)))/rad; % angle of refraction
Modification of Atrium Design to Improve Thermal and Daylighting Performance Appendix
219
r1=rfa; r2=(asin(n2*sin(r1*rad)))/rad; if v>ntit r3=-(2*g)+v; else r3=(2*g)+v; end alt=180-r3; % deflected angle if valt<-(90-tit) % if ray miss panel due to tilt alt=valt; t=1; % transmission if miss and go to ground else % Transmission through transparent medium - (Hardy 1932) zt=g-rfa; zs=g+rfa; oi=(sin(zt*rad))^2/(sin(zs*rad))^2; io=(tan(zt*rad))^2/(tan(zs*rad))^2; re=(0.5*oi)+(0.5*io); t=(1-re)^2; end % fraction deflected by LCP - send out 1 ray determined by random number if g<ca % a=nom (angle between normal and ray) fd=tan(rfa*rad)/0.5; else fd=2-tan(rfa*rad)/0.5; end fud=1-fd; % fraction undeflected by lcp o=[valt,alt,t,fd]; end % window reff=reff*ref*t; num=num+1; end % while exit loop Refer to well05.m program code 3D ray tracing of a well with LCP glazing to find light level with initial starting position at the bottom of the North orientated vertical wall end % program Atrium5.m LCP glazed well combined with clear glazed adjoining room % Daylight Simulation in an Atria (DSA) % 3D DSA by John Mabb June 2000 % This 3D ray tracing program simulates the daylight penetration into a room adjoining an atrium onto a % working plane. % A graph is displayed showing the light level along the work plane in lux. % This program includes a clear glazed adjoining room and a LCP glazed atrium well, diffuse interior % surfaces and 2 sky distribution models. The boundary conditions, loops, counters, arrays, reflectivities, and ray tracing technique are all the same for this program as those set out in the base program and can be viewed in the first program. if iw==3 & z2>15 & y2>0 & z2<30 & y2<80 % window area on wall 3 iw=7; %glass on wall 3 so angle wrt 180 deg z=abs(180-az)*rad; %az for ray to hit window? v=alt;
Modification of Atrium Design to Improve Thermal and Daylighting Performance Appendix
220
zr=z/rad; tit=0; %tilt of window zen=abs(alt*rad); %eliminate ground rays for transmission calculation h=acos(sin(zen)*sin(tit*rad)+cos(zen)*cos(tit*rad)*cos(z)); g=h/rad; % angle between the plane of panel and ray n1=1.0003; %refractive index of air n2=1.523; %acrylic=1.50 glass=1.523 % Effective Refractive Index due to angle - (Whitehead 1982) n2=sqrt(n2^2-(n1^2*sin(g*rad)^2)); rfa=(asin((n1/n2)*sin(g*rad)))/rad; % angle of refraction % Transmission through transparent medium - (Hardy 1932) zt=g-rfa; zs=g+rfa; oi=(sin(zt*rad))^2/(sin(zs*rad))^2; io=(tan(zt*rad))^2/(tan(zs*rad))^2; re=(0.5*oi)+(0.5*io); t=(1-re)^2; %end %o=[reff,valt,alt,t,fd]; end % window reff=reff*ref*t; num=num+1; end % while exit loop Refer to well05.m program code 3D ray tracing of a well with LCP glazing to find light level with initial starting position at the bottom of the North orientated vertical wall end % program Atrium6.m Clear glazed atrium well combined with LCP glazed adjoining room % Daylight Simulation in an Atria (DSA) % 3D DSA by John Mabb June 2000 % This 3D ray tracing program simulates the daylight penetration into a room adjoining an atrium % onto a working plane. % A graph is displayed showing the light level along the work plane in lux. % This program includes a clear glazed atrium well and LCP glazed adjoining room, diffuse % interior surfaces and 2 sky distribution models. The boundary conditions, loops, counters, arrays, reflectivities, and ray tracing technique are all the same for this program as those set out in the base program and can be viewed in the first program. if iw==3 & z2>15 y2>0 & z2<30 & y2<80 % window area on wall 3 iw=7; %glass on wall 3 so angle wrt 180 deg z=abs(180-az)*rad; %az for ray to hit window? valt=alt; v=180-alt; zr=z/rad; tit=40; %tilt of window ntit=180-tit; zen=abs(alt*rad); %eliminate ground rays for transmission calculation h=acos(sin(zen)*sin(tit*rad)+cos(zen)*cos(tit*rad)*cos(z)); g=h/rad; % angle between the plane of panel and ray g=abs(v-ntit); n1=1.0003; %refractive index of air n2=1.523; %acrylic=1.50 glass=1.523
Modification of Atrium Design to Improve Thermal and Daylighting Performance Appendix
221
% Effective Refractive Index due to angle - (Whitehead 1982) n2=sqrt(n2^2-(n1^2*sin(g*rad)^2)); rfa=(asin((n1/n2)*sin(g*rad)))/rad; %angle of refraction % Transmission of light through laser cut panel - (Edmonds 199?) % critical angle of total deflection in LCP D/W=0.5 ca=asin((n2/n1)*atan(0.5))/rad; rfa=(asin((n1/n2)*sin(g*rad)))/rad; % angle of refraction r1=rfa; r2=(asin(n2*sin(r1*rad)))/rad; if v>ntit r3=-(2*g)+v; else r3=(2*g)+v; end alt=180-r3; % deflected angle if valt<-(90-tit) % if ray miss panel due to tilt alt=valt; t=1; % transmission if miss and go to ground else % Transmission through transparent medium - (Hardy 1932) zt=g-rfa; zs=g+rfa; oi=(sin(zt*rad))^2/(sin(zs*rad))^2; io=(tan(zt*rad))^2/(tan(zs*rad))^2; re=(0.5*oi)+(0.5*io); t=(1-re)^2; end % fraction deflected by LCP - send out 1 ray determined by random number if g<ca % a=nom (angle between normal and ray) fd=tan(rfa*rad)/0.5; else fd=2-tan(rfa*rad)/0.5; end fud=1-fd; % fraction undeflected by lcp % o=[reff,valt,alt,t,fd]; end % window reff=reff*ref*t; num=num+1; end % while exit loop Refer to well04.m program code 3D ray tracing of a well to find light level with initial starting position at the bottom of the North orientated vertical wall end % program
Modification of Atrium Design to Improve Thermal and Daylighting Performance Appendix
222
A.3 Thermal Simulation Program Code
Program code for thermal transfer with model atrium well (plain and LCP glazed).
The codes include 2 old and 1 new code program (therm2, therm4 and therm59).
Therm2.m - heat transfer into an atrium with a normal clear glazed well % This program is design to simulate the thermal transfer via radiation through the plain glazing into a model atrium well and evaluate the resultant internal temperature across the course of a clear sky day. r=pi/180; % degrees to radians conversion h=7:1:17; % hour array % Measured field temperature outside hourly data to=[17.0 21.0 22.0 24.0 24.2 24.7 23.9 23.6 20.8 20.2 19.6]; % temp outside % Hourly averaged TRY 1986 temperature data for Brisbane - (GSL 1999) to = [15.5 15.2 15.3 16.0 17.1 18.4 19.6 20.4 20.5 19.7 18.4]; % 19/6/86 temp % Measured field temperature inside normal atrium hourly averaged data T5 = [15.2 20.2 26.4 33.0 38.2 41.4 39.6 36.5 30.9 26.5 22.0]; % temp bot atrium T4 = [17.4 25.0 41.2 49.0 52.1 54.1 53.3 50.5 36.1 28.7 21.7]; % temp top atrium % Input global and diffuse hourly averaged raw irradiance data dif = [12 45 60 65 69 81 75 65 59 40 8]; % diffuse irrad glob= [180 366 552 692 775 794 738 618 453 268 78]; % global irrad % Day number of the year (Pearce 1999) (without the hour variable) Refer to room12.m code Solar Position - (IES 1995) with solar Altitude (wrt ground) & Solar Azimuth (wrt North) - (Szokolay 1996) Refer to room12.m code % Optical air mass (Pirsel 1991) m=sqrt(626.08.^2.*cos(zen*r).^2+1253.16)-(626.08.*cos(zen*r)); % Extraterrestrial solar illuminance ext=128*(1+0.034*cos(2*pi*(ndy-2)/365)); % direct normal illuminance in Klux edn=ext.*exp(-0.2.*m); % Direct normal Irradiance (Edmonds 1996) eo=1367; % extraterrestrial direct solar irradiance W/m2 ei=eo*(exp(-0.65*m)+exp(-0.095*m))/2; % Transmission through clear pyramid skydome n1=1.0003; %refractive index of air n2=1.50; %acrylic=1.50 glass=1.523 tit=45; % tilt of skylight pyramid nor1=abs(45-zen); %angle of sun to norm to surface 1 & 2 nor2=abs(45+zen); %angle of sun to norm to surface 3 & 4 % Fresnels law for transmission through medium (Hardy 1932) rfa=(asin((n1/n2)*sin(nor1*r)))./r; % angle of refraction zt=nor1-rfa; zs=nor1+rfa; oi=(sin(zt*r).^2)./(sin(zs*r).^2); io=(tan(zt*r).^2)./(tan(zs*r).^2); re=(0.5*oi)+(0.5*io); % reflection off surface t1=(1-re).^2; % transmission through material rfa2=(asin((n1/n2).*sin(nor2*r)))./r; % angle of refraction
Modification of Atrium Design to Improve Thermal and Daylighting Performance Appendix
223
ut=nor2-rfa2; us=nor2+rfa2; oi2=(sin(ut*r).^2)./(sin(us*r).^2); io2=(tan(ut*r).^2)./(tan(us*r).^2); re2=(0.5*oi2)+(0.5*io2); % reflection off surfaces t2=(1-re2).^2; % transmission through other 2 faces % Power through normal skylight b=0.8; bb=b/2; he=3; as=he*b*4; % area of atrium ap=b*b; %cross section area of input aperture as=as/3; % assumed surface area of radiated output L=(b*tan(tit*r))./(tan(alt*r)); % length of projected undeflect ray rv=bb./(L+bb); cg=b.*tan(rv); Aq=ap-(b.*cg); At=bb.*(L+(bb)); f=Aq./At; % this is not correct when alt>tit f=1 for n=1:11 if L(n)<bb f(n)=1; % all incident light enters atrium % power input from 4 sides of pyramid skydome Aq(n)=At(n); p(n)=(2.*ei(n).*Aq(n).*sin(alt(n).*r).*f(n).*t1(n))+(2.*ei(n).*Aq(n).*sin(alt(n).*r).*f(n).*t2(n))+(dif(n).*ap.*t1(n)); else % power input from 2 sides of pyramid skydome p(n)=2.*ei(n).*Aq(n).*sin(alt(n).*r).*f(n).*t1(n)+(dif(n).*ap.*t1(n)); end % Power output P=e.as.co.(T^4-To^4) due to radiation (Serway 1992) % rearrange to find T, average internal atrium temperature co=5.67*10^(-8); % thermal conductivity constant to=to+273.2; % external temp in Kelvin e=0.85; % emissivity of glass tt=p./(co*as*e); % difference in temp^4 temp=(to.^4)+tt; % internal temp^4 tem=sqrt(sqrt(temp)); % temp in atrium due to radiation tem=tem-273.2; % temp in atrium in Celsius to=to-273.2; % temp outside in Celsius % Plot the temperatures % If the day corresponds to a day when field data was measured then the internal % atrium temperature data can be presented for comparison. % or plot the outside temperature plot(h,T4) hold on plot(h,T5) plot(h,to) plot(h,tem,'g',h,tem,'go') title(['Temperature Prediction in Normal Atrium on ',num2str(day),'/',num2str(month)]) ylabel('Temperature (deg C)') xlabel('Time of Day (hour)') end
Modification of Atrium Design to Improve Thermal and Daylighting Performance Appendix
224
Therm4.m - heat transfer into an atrium with an LCP glazed well % This program simulates the process of thermal transfer via radiation through LCP glazing into an atrium well on clear sky days in Brisbane. The input is outside temperature and the output is average internal atrium temperature. r=pi/180; % degrees to radians conversion h=7:1:17; % clock time array % Hourly averaged TRY 1986 temperature data for Brisbane - (GSL 1999) to = [15.5 15.2 15.3 16.0 17.1 18.4 19.6 20.4 20.5 19.7 18.4]; % 19/6/86 temp % Measured field temperature outside hourly averaged data to = [13.5 24.0 25.0 26.0 27.8 27.5 26.4 25.3 23.4 22.4 18.8]; % 25/9/99 temp % Measured field temperature inside LCP atrium hourly averaged data T8 = [20.2 26.9 32.6 36.8 37.3 38.0 37.5 35.5 32.4 29.5 24.2]; % temp bot atrium T7 = [26.6 42.1 49.3 53.2 51.5 50.4 50.5 50.3 42.8 33.7 24.0]; % temp top atrium % Input global and diffuse hourly averaged raw irradiance data dif = [70 97 98 104 128 123 122 98 84 70 27]; % diffuse irrad glob = [221 409 612 745 806 824 754 646 474 294 42]; % global irrad % Day number of the year (Pearce 1999) (without the hour variable) Refer to room12.m code Solar Position - (IES 1995) with solar Altitude (wrt ground) & Solar Azimuth (wrt North) - (Szokolay 1996) Refer to room12.m code % Optical air mass - (Pirsel 1991) - refer to therm2.m code % Direct normal Irradiance - (Edmonds 1996) - refer to therm2.m code % Transmission through clear pyramid skydome - refer to therm2.m code % Fresnel's law for transmission through medium - refer to therm2.m code % Direction through lcp pyramid skydome - (Edmonds 1991) ca=asin((n2/n1)*atan(0.5))/r; % critical angle of total deflection D/W=0.5 nom=abs(tit-zen); % angle of sun to norm to surface norm=zen; rfa=(asin((n1/n2)*sin(nom*r)))/r; % angle of refraction r1=rfa; r2=(asin(n2*sin(r1*r)))/r; % angle of deflected beam through lcp for n=1:11; if alt(n)>tit r3(n)=180-r2(n)+tit; else r3(n)=180+r2(n)+tit; end end % Transmission through lcp zt=nom-rfa; zs=nom+rfa; oi=(sin(zt.*r).^2)./(sin(zs.*r).^2); io=(tan(zt.*r).^2)./(tan(zs.*r).^2); ref=(0.5.*oi)+(0.5.*io); tr=(1-ref).^2;
Modification of Atrium Design to Improve Thermal and Daylighting Performance Appendix
225
if nom<ca fd=tan(rfa*r)/0.5; % fraction deflected by lcp - (Edmonds 1991) else fd=2-tan(rfa*r)/0.5; end fud=1-fd; % fraction undeflected by lcp % Transmittance through skydome 2 layers tm=t1.*tr; t2=t2.*tr; % Power through LCP skylight - (Edmonds 1996) b=0.8; % base of atrium bb=b/2; % half of base of atrium he=3; % height of atrium as=he*b*4; % area of atrium ap=b*b; % cross section area of input aperture as=as/3; % assumed surface area of radiated output L=(bb*tan(tit*r))./(tan(alt*r)); % length of projected undeflect ray rv=bb./(L+bb); cg=b.*tan(rv); Aq=ap-(b.*cg); At=bb.*(L+bb); % area undeflect of front side Aw=bb.*(b-(L+bb)); % area accept undeflect of back side faud=Aq./At; % fract accepted undeflet Ls=(bb*tan(tit*r))./(tan((r3-180)*r)); % length of projected deflect ray sv=bb./(Ls+bb); dg=b.*tan(sv); Ar=ap-(b.*dg); Au=bb.*(Ls+(bb)); fad=Ar./Au; % fract accepted deflect % Power input P=I.A.sin(alt).f.t due to radiation for n=1:11 if alt(n)>tit+10 Aq(n)=At(n); faud(n)=1; % all incident light enters atrium % power input from 4 sides of pyramid skydome p(n)=(2.*ei(n).*Aq(n).*sin(alt(n).*r).*[fd(n).*fad(n)+fud(n).*faud(n)].*tm(n))+(2.*ei(n).*Aw(n).*sin(alt(n).*r).*[fd(n).*fad(n)+fud(n).*faud(n)].*t2(n)); else % power input from 2 sides of pyramid skydome p(n)=2.*ei(n).*Aq(n).*sin(alt(n).*r).*[fd(n).*fad(n)+fud(n).*faud(n)].*tm(n); end end % Power output P=e.as.co.(T^4-To^4) due to radiation (Serway 1992) % rearrange to find T, average internal atrium temperature - refer to therm2.m code % Plot the temperatures % If the day corresponds to a day when field data was measured then the internal % atrium temperature data can be presented for comparison. % or plot the outside temperature plot(h,T7) hold on plot(h,T8) plot(h,to)
Modification of Atrium Design to Improve Thermal and Daylighting Performance Appendix
226
plot(h,tem,'g',h,tem,'go') title(['Temperature Prediction in LCP Atrium on ',num2str(day),'/',num2str(month)]) ylabel('Temperature (deg C)') xlabel('Time of Day (hour)') end Therm59.m - Thermal transfer into a well with LCP and clear glazing comparison % Copyright January 2001 % This program simulates the process of thermal transfer via radiation, conduction and convection through clear and LCP glazing in an atrium well on clear sky days in Brisbane. The input is outside temperature and the output is the predicted average internal atrium radiant temperature. The temperatures collected at the test site in the model wells are used to compare to the predicted temperatures. hh=1; for h=7:17; T6=[15.7 17.5 19.8 22.2 23.4 24.2 24.8 25.1 24.7 23.8 22.4]; % 15/9 in room temp % Hourly averaged TRY86 data for Brisbane - (GSL 1999) (See appendix A.6) % Test site data (from Winter/Spring 1999) o2007=[11.7 12.8 14.5 16.7 18.9 20.4 20.7 20.0 18.9 17.8 16.8]; % 20/7 temp o1308=[17.0 21.0 22.0 23.6 24.6 24.1 23.9 22.4 20.4 20.0 17.9]; % 13/8 temp out o1609=[23.8 24.2 26.7 27.8 27.7 26.7 25.4 24.7 23.9 23.2 20.7]; % 16/9 temp out o1509=[19.6 22.3 23.4 24.8 26.4 26.6 25.6 24.7 22.9 22.5 20.5]; % 15/9 temp o2509=[13.5 24.0 25.0 26.0 27.8 27.5 26.4 25.3 23.4 22.4 18.8]; % 25/9 temp o0910=[15.1 26.6 28.4 28.0 26.8 27.1 26.4 25.5 23.9 23.2 19.1]; % 9/10 temp o1010=[16.4 19.8 22.5 24.8 25.2 25.3 25.1 24.0 22.9 22.6 20.0]; % 10/10 out temp T52207=[9.2 16.4 24.6 30.7 34.2 35.3 33.2 30.5 27.4 23.5 17.4]; % 22/7 bot norm atria T42207=[11.8 29.3 40.6 46.1 49.2 51.1 50.2 46.8 38.5 24.3 16.0]; % 22/7 top norm atria T51308=[17.6 23.2 29.8 35.6 39.5 40.4 38.1 33.8 28.6 24.2 20.2]; % bot norm atria 13/8 T41308=[20.9 30.9 45.8 51.0 52.7 52.9 51.9 45.8 31.9 25.1 19.7]; % top norm atria 13/8 T51509=[20.2 26.9 34.6 42.5 46.2 45.7 41.5 36.8 31.1 26.4 22.4]; % 15/9 bot norm atria T41509=[24.4 38.0 49.5 55.8 56.1 57.0 54.9 49.2 35.2 28.3 22.2]; % 15/9 top norm atria T51609=[21.9 28.8 36.9 43.6 47.5 45.2 40.5 35.6 30.8 26.3 22.4]; % 16/9 bot norm atria T41609=[27.6 39.6 49.1 54.6 55.2 56.4 52.7 47.2 34.7 28.1 22.2]; % 16/9 top norm atria T42509=[28.8 43.8 54.0 59.4 60.2 59.3 57.8 52.0 38.5 29.7 21.9]; % 25/9 top norm atria T52509=[22.6 29.8 38.6 46.4 51.0 49.3 43.8 38.4 33.1 27.7 22.4]; % 25/9 bot norm atria T40910=[41.3 52.4 46.1 56.6 55.6 56.2 55.0 51.6 42.5 28.6 21.6]; % top norm atria 9/10 T50910=[25.3 32.9 36.1 47.0 49.1 46.5 41.1 36.1 30.5 25.5 21.6]; % bot norm atria 9/10 T41010=[36.5 45.2 46.3 50.8 52.5 53.1 52.2 48.3 40.3 27.5 21.7]; % top norm atria 10/10 T51010=[24.4 30.2 34.6 42.1 46.6 43.7 38.6 32.8 28.4 24.6 21.5]; % bot norm atria 10/10 T72207=[13.7 25.4 39.0 47.8 49.7 50.8 50.2 47.2 34.6 28.3 20.0]; % 22/7 top LCP atria T82207=[10.7 18.1 25.9 31.9 34.5 35.3 35.2 33.5 30.5 27.2 20.6]; % 22/7 bot LCP atria T81308=[20.7 27.0 33.6 37.9 40.3 41.6 40.8 37.9 33.6 28.9 21.8]; % aver LCP atria 13/8 T71308=[20.7 27.0 33.6 37.9 40.3 41.6 40.8 37.9 33.6 28.9 21.8]; % aver LCP atria 13/8 T71309=[29.4 43.1 47.7 52.7 54.8 53.7 52.2 51.2 44.0 34.0 23.8]; %top LCP atria 13/9 T81309=[19.5 25.7 28.6 30.5 35.9 37.4 38.4 35.6 32.0 29.0 23.0]; %bot LCP atria 13/9 T71509=[26.6 42.1 49.3 53.2 51.5 50.4 50.5 50.3 42.8 33.7 24.0]; %15/9 top LCP atria T81509=[20.2 26.9 32.6 36.8 37.3 38.0 37.5 35.5 32.4 29.5 24.2]; %15/9 bot LCP atria T71609=[31.4 42.2 47.4 51.2 52.3 49.6 49.0 48.3 42.0 33.6 24.0]; %16/9 top LCP atria T81609=[22.6 27.9 32.7 36.5 38.4 38.3 37.1 34.6 31.7 29.3 24.2]; %16/9 bot LCP atria T82509=[23.6 29.5 35.2 39.3 40.8 40.7 39.4 37.2 34.1 30.0 23.9]; % bot LCP atria 25/9 T72509=[35.4 46.5 52.1 54.5 54.8 51.8 52.9 52.7 46.1 33.6 23.5]; % top LCP atria 25/9 T70910=[41.8 50.7 43.6 49.1 49.6 46.9 49.4 50.1 43.7 34.7 25.4]; %top LCP atria 9/10 T80910=[26.8 32.6 33.2 39.2 40.5 40.1 38.9 37.0 33.9 30.6 24.7]; %bot LCP atria 9/10 T71010=[36.3 45.0 44.2 44.6 47.5 44.8 48.1 48.7 43.0 34.1 25.0]; %top LCP atria 10/10 T81010=[24.5 30.3 33.4 37.5 39.5 39.6 38.3 35.6 32.4 29.6 24.2]; %bot LCP atria 10/10
Modification of Atrium Design to Improve Thermal and Daylighting Performance Appendix
227
% Day number of the year - (Pearce 1999) day=12; month=5; year=86; if month<3 ndy=31*(month-1)+day; elseif month<9 & month>2 ndy=59+31*(month-3)-floor(((month-3)/2)+0.1)+day; elseif month<13 & month>8 ndy=243+31*(month-9)-floor(((month-8)/2)+0.1)+day; else end r=pi/180; % degrees to radians conversion kel=273.2; % zero degrees Celcius in Kelvin lat=-27.5*r; % latitude of Brisbane rlong=150; % standard nearest longitude meridian slong=153.1; % longitude of Brisbane % Solar Position - (Szokolay 1996, IES 1995) et1=0.17*sin(4*pi*(ndy-80)/373); et2=0.129*sin(2*pi*(ndy-8)/355); et=et1-et2; % equation of time dec=0.4093*sin(2*pi*(ndy-81)/368); % solar declination hr=h+et+(slong-rlong)/15; % solar time hra=15*(hr-12)*r; % hour angle % Altitude=angle of sun to ground; Azimuth=angle of sun to north alt=180/pi*asin(sin(lat)*sin(dec)+cos(lat)*cos(dec)*cos(hra)); azi=180/pi*acos((cos(lat)*sin(dec)-cos(dec)*sin(lat)*cos(hra))./cos(r*alt)); if h>12 aft=h>12; azi=360+(azi-2*aft.*azi); % azimuth after midday end zen=90-alt; % angle of sun to zenith % Relative Optical Air Mass - (Pirsel 1991) m=sqrt(626.08.^2.*cos(zen*r).^2+1253.16)-(626.08.*cos(zen*r)); % Direct Normal Irradiance - (Edmonds 1996) eo=1367; % extraterrestrial direct solar irradiance W/m2 ei=eo*(exp(-0.65*m)+exp(-0.095*m))/2; % Transmission through clear pyramid skydome n1=1.003; % refractive index of air n2=1.50; % acrylic=1.50 glass=1.523 tit=45; % tilt of skylight pyramid nor1=abs(tit-zen); % angle of sun to norm to surface 1 & 2 rfa=(asin((n1/n2)*sin(nor1*r)))./r; % angle of refraction % Fresnel's law for transmission through medium - (Hardy 1932) zt=nor1-rfa; zs=nor1+rfa; oi=(sin(zt*r).^2)./(sin(zs*r).^2); io=(tan(zt*r).^2)./(tan(zs*r).^2); re=(0.5*oi)+(0.5*io); % reflection off surface t1=(1-re).^2; % transmission through material % Transmission through lcp pyramid skydome - (Edmonds 1991) xrt=(5:5:90)';
Modification of Atrium Design to Improve Thermal and Daylighting Performance Appendix
228
yrt=[2.25 1.25 0.95 0.8 0.75 0.71 0.67 0.63 0.59 0.55 0.52 0.5 0.45 0.4 0.35 0.29 0.25 0.21]'; %normal incidence to base line %yrt=[2.3 1.38 1.1 1 0.94 0.93 0.92 0.85 0.79 0.72 0.65 0.58 0.51 0.46 0.38 0.28 0.19 0.16]'; % diagonal incidence to base line prt=polyfit(xrt,yrt,6); rt=polyval(prt,alt); % polynomial equation fit % Area of surfaces within atrium b=1; % base of atrium bb=b/2; % half of base of atrium he=3; % height of atrium aa=he*b*4; % area of atrium ap=b*b; % cross section area of input aperture as=sqrt(0.5)*0.5*4; % surface area of pyramid dome % Heat input into atrium well via radiation p=ei.*ap.*sin(alt.*r).*t1; % Power through a clear pyramid pp=ei.*ap.*sin(alt.*r).*rt; % Power through LCP pyramid elsum=1; tl=1; eqsum=1; ta=1; o=o+kel; % external temp in Kelvin T6=T6+kel; % room temp in Kelvin % Thermal losses from clear glazed atrium for ta=ceil(o-kel):0.5:100 % pre temp of normal atrium taa=ta+kel; % internal temp in Kelvin tg=taa; % approximate temp of glass in Kelvin delT=abs(tg-o); % temp difference % Heat transfer via radiation through tilted glazing Q=e.as.co.(T^4-To^4) -(Serway 1992) co=5.67*10^(-8); % W/m2.K4 thermal conductivity constant e=0.85; % emissivity of glass s=co.*e.*as; l1=s.*abs(tg.^4-o.^4); % heat loss via radiation % Heat transfer via conduction through atrium walls Q = kA/L*delT k=(0.033.*aa)./0.05; % conductivity of foam atrium walls l2=(k.*abs(taa-T6)); % heat loss via conduction % Heat transfer via convection through tilted glazing hc=1.37; % convective heat transfer coefficient (Holman) l3=hc.*as.*(delT).^(5/4); % heat loss via convection eqsum=p-l1-l2-l3; % at the point that it is zero that is the normal atrium temp at equilibrium pop=[ta,l1,l2,l3,eqsum]; if eqsum <= 0, break, end end % end atrium temp for loop % Thermal losses from LCP glazed atrium for tl=ceil(o-kel):0.5:100 % pre temp of LCP atrium tll=tl+kel; % internal temp in Kelvin tgg=(tll+o)./2; % approximate temp of glass in Kel
Modification of Atrium Design to Improve Thermal and Daylighting Performance Appendix
229
deT=abs(tgg-o); % temp difference % Heat transfer via radiation through tilted glazing Q=e.as.co.(T^4-To^4) -(Serway 1992) co=5.67*10^(-8); % W/m2.K4 thermal conductivity constant e=0.85; % emissivity of glass s=co.*e.*as; l1=s.*abs(tgg.^4-o.^4); % heat loss via radiation % Heat transfer via conduction through atrium walls Q = kA/L*delT k=(0.033.*aa)./0.05; % conductivity of foam atrium walls l2=(k.*abs(tll-T6)); % heat loss via conduction % Heat transfer via convection through tilted glazing hc=1.37; % convective heat transfer coefficient (Holman) l3=hc.*as.*(deT).^(5/4); % heat loss via convection elsum=pp-l1-l2-l3; % at the point that it is zero that is the LCP atrium temp at equilibrium pop=[tl,l1,l2,l3,elsum]; if elsum <= 0, break, end end % end atrium temp for loop al(hh)=tl; % predicted temp in LCP atrium at(hh)=ta; % predicted temp in normal atrium ff(hh)=h; % hour array across day hh=hh+1; % array position counter end % hour loop % Plot of the predicted internal average atrium temperature plot(ff,at,ff,T4,'wo',ff,T4,'w') % comparison to test site data title(['Temperature Prediction in normal Atria on', num2str(day),'/',num2str(month),'/',num2str(year)]) xlabel('Time of Day (hour)') ylabel('Atrium Temperature (degC)') legend('Sim','Field') pause plot(ff,al,'g',ff,T7,'wo',ff,T7,'w') % comparison to test site data title(['Temperature Prediction in LCP Atria on ',num2str(day),'/',num2str(month),'/',num2str(year)]) xlabel('Time of Day (hour)') ylabel('Atrium Temperature (degC)') legend('Sim','Field') plot(ff,al,'go',ff,at,'b',ff,al,'g') % Atrium comparison using TRY data title(['Temperature Prediction Atria Comparison on ',num2str(day), '/', num2str(month),'/',num2str(year)]) xlabel('Time of Day (hour)') ylabel('Atrium Temperature (degC)') legend('LCP','Norm') end
Modification of Atrium Design to Improve Thermal and Daylighting Performance Appendix
230
A.4 Daylight Theory
The magnitude of daylight penetration into building structures, especially atriums, is
dependent upon several factors: (Szokolay 1975)
1/ Sky distribution
2/ Type and transmissivity of glazing material.
3/ The geometrical proportions.
4/ Reflectivity of the surfaces.
5/ Properties of adjoining spaces.
These factors have been all investigated previously as seen in the literature review. Some
of the theory behind these factors will be discussed in this section.
There are many methods used to predict the daylight level within spaces these include:
• the total flux method
• the split flux method - protractors
• simplified daylight tables
• daylight graphs
• Waldram diagrams
• pepper-plot diagram
• model studies
• computer simulations
A.4.1 Dependence upon Sky Distribution
Daylight levels within buildings are difficult to predict. Under overcast sky conditions the
light levels within buildings can be stated via a daylight factor (DF) which is calculated to
measure the penetration of the external light into the internal spaces. The DF is the ratio
of the illuminance at a point indoors on the work plane (Eh) with respect to the
simultaneous illuminance on an unobstructed horizontal plane outside the building (HGI).
DF % = HGIEh x 100 Eq. A.4.01
Modification of Atrium Design to Improve Thermal and Daylighting Performance Appendix
231
The natural daylight that enters our buildings and finally lands upon our work surface is a
summation of light from 3 different areas: the sky (direct and diffuse) component (SC),
the externally reflected component (ERC) and the internally reflected component (IRC).
Daylight = SC + ERC + IRC Eq. A.4.02
Atriums, unlike side lit rooms, receive a lot of light from the zenith due to their vertical
orientation.
For example, a 30m deep atrium well with a square cross section of 8m by 8m will have a
well index of 3.75 and only allow a view of the sky 8° around the zenith.
The external reflected component does not exist for atriums because generally there are
no external surfaces in view for light rays to reflect off. The internally reflected
component for atria is referred to as the atrium reflected component (ARC) and is more
important for deep atria because the number of interreflections increases as the depth of
the well increases.
Therefore: Daylight = SC + ARC Eq. A.4.03
If the sun is near to that viewing angle such as in mid summer, mid day in tropical
locations then a lot of near normal direct radiation will enter the atrium well and penetrate
all the way to the bottom. A very high direct sky component will result in higher light
levels than any conventional side light room, which is why the atrium is potentially such a
useful structure to reduce artificial lighting.
A.4.2 Transmission of the Glazing
The transmittance through glazing of light rays is dependent upon the incident angle.
Glass transmits both light and heat and due to the horizontal or tilted glazing in atriums,
near normal incident angles with high elevation direct sun can result. This can cause
overheating unless the glazing is modified to reduce the penetration. Most modifications
take the form of tinting, double-glazing or shading.
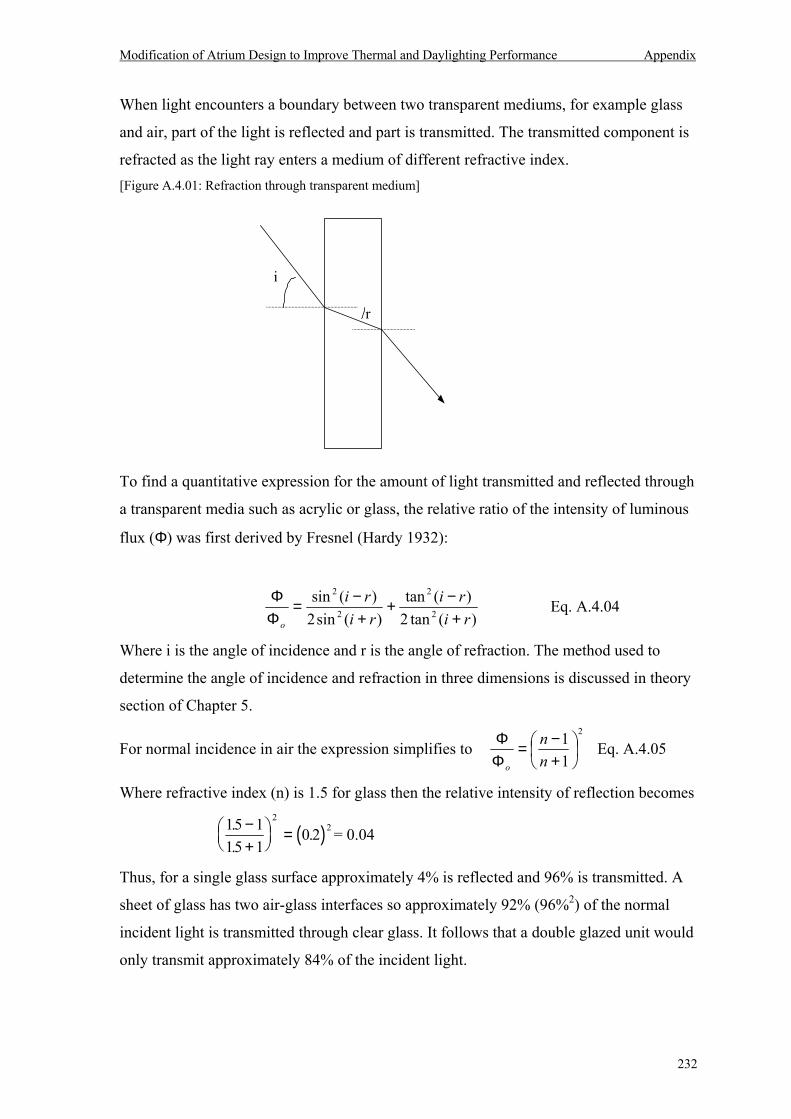
Modification of Atrium Design to Improve Thermal and Daylighting Performance Appendix
232
When light encounters a boundary between two transparent mediums, for example glass
and air, part of the light is reflected and part is transmitted. The transmitted component is
refracted as the light ray enters a medium of different refractive index. [Figure A.4.01: Refraction through transparent medium]
To find a quantitative expression for the amount of light transmitted and reflected through
a transparent media such as acrylic or glass, the relative ratio of the intensity of luminous
flux (Φ) was first derived by Fresnel (Hardy 1932):
)(tan2)(tan
)(sin2)(sin
2
2
2
2
riri
riri
o +−+
+−=
ΦΦ Eq. A.4.04
Where i is the angle of incidence and r is the angle of refraction. The method used to
determine the angle of incidence and refraction in three dimensions is discussed in theory
section of Chapter 5.
For normal incidence in air the expression simplifies to 2
11
+−=
ΦΦ
nn
o
Eq. A.4.05
Where refractive index (n) is 1.5 for glass then the relative intensity of reflection becomes
( )15 115 1
0 22
2..
.−+
= = 0.04
Thus, for a single glass surface approximately 4% is reflected and 96% is transmitted. A
sheet of glass has two air-glass interfaces so approximately 92% (96%2) of the normal
incident light is transmitted through clear glass. It follows that a double glazed unit would
only transmit approximately 84% of the incident light.
i
r
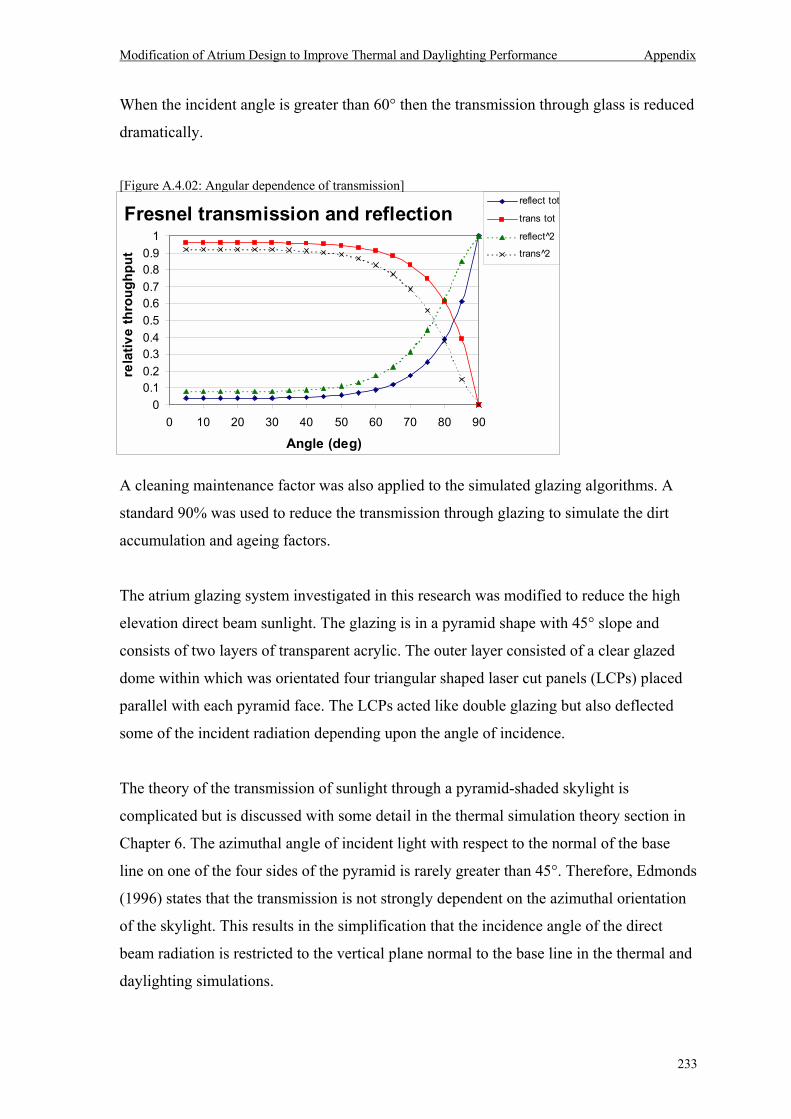
Modification of Atrium Design to Improve Thermal and Daylighting Performance Appendix
233
When the incident angle is greater than 60° then the transmission through glass is reduced
dramatically.
[Figure A.4.02: Angular dependence of transmission]
A cleaning maintenance factor was also applied to the simulated glazing algorithms. A
standard 90% was used to reduce the transmission through glazing to simulate the dirt
accumulation and ageing factors.
The atrium glazing system investigated in this research was modified to reduce the high
elevation direct beam sunlight. The glazing is in a pyramid shape with 45° slope and
consists of two layers of transparent acrylic. The outer layer consisted of a clear glazed
dome within which was orientated four triangular shaped laser cut panels (LCPs) placed
parallel with each pyramid face. The LCPs acted like double glazing but also deflected
some of the incident radiation depending upon the angle of incidence.
The theory of the transmission of sunlight through a pyramid-shaded skylight is
complicated but is discussed with some detail in the thermal simulation theory section in
Chapter 6. The azimuthal angle of incident light with respect to the normal of the base
line on one of the four sides of the pyramid is rarely greater than 45°. Therefore, Edmonds
(1996) states that the transmission is not strongly dependent on the azimuthal orientation
of the skylight. This results in the simplification that the incidence angle of the direct
beam radiation is restricted to the vertical plane normal to the base line in the thermal and
daylighting simulations.
Fresnel transmission and reflection
00.10.20.30.40.50.60.70.80.9
1
0 10 20 30 40 50 60 70 80 90
Angle (deg)
rela
tive
thro
ughp
ut
reflect tot
trans tot
reflect 2
trans^2
Modification of Atrium Design to Improve Thermal and Daylighting Performance Appendix
234
A.4.3 Geometrical Shape
The natural diffuse light penetration into atrium buildings under overcast sky conditions
has a characteristic exponential decay with respect to depth (x). It is this decrease in light
level that results in need for artificial lights (Aizlewood 1995).
Percentage Light Level = 100. e-K.X Eq. A.4.06
K is the unknown constant that determines the rate at which the light level falls off. K will
vary with surface reflectance. X can be substituted with room index (RI) or well index
(WI) as expressed below.
As the room or well index increases the light level decreases.
RI = ( )WLHLW
+ Eq. A.4.07
WI = ( )H L WLW+
2 Eq. A.4.08
Where L = length of room, W = width of room, H = height of room.
Lighting levels in rooms are often achieved using artificial lights but natural lighting can
be sufficient if greater penetration of daylight can be achieved by redirecting the incident
illuminance to surfaces with higher reflectivity such as the ceiling instead of the floor.
An atrium is essentially a large light well that can have multi-storeyed adjoining spaces,
usually with a glazed roof and glazing onto the adjoining spaces. Atria can be designed to
be any shape and size: linear, square, triangular, round, short, tall or hemispherical. They
can include plants, lifts, staircases or statues. And are used as places to eat, shop, relax,
entertain, work or just as transition areas.
The most common cross sectional shape of an atrium well is square or rectangular. The
well index (WI) that is stated in equation A.4.08 is a very useful unit. It relates the light
admitting area of the atrium to the surface area of the atrium walls. One way to increase
the illuminance level is to keep the WI small by increasing the floor area or by decreasing
the depth of the well. A shallow, wide atrium is a bright atrium.
The well index usually ranges between 0.5 and 5 for most buildings depending upon their
use.
This relationship, between daylight factor and well index, has been investigated
extensively. For the case when the well index was 2.0, the daylight factors have been
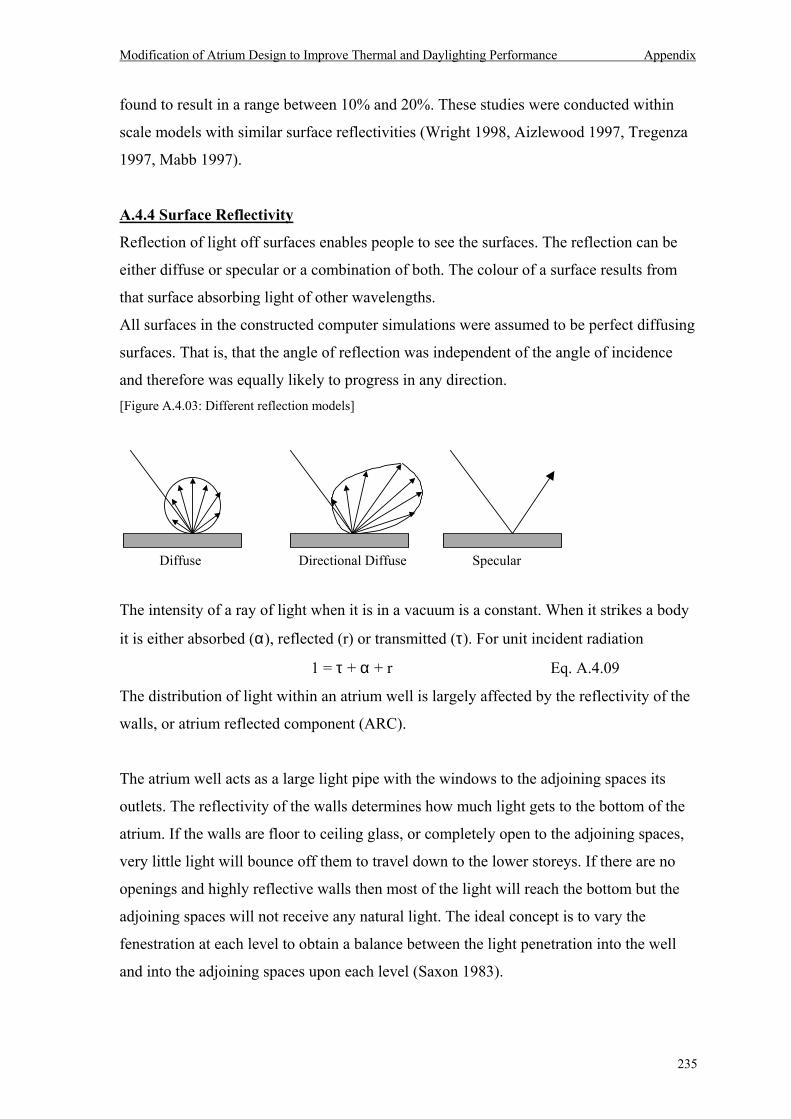
Modification of Atrium Design to Improve Thermal and Daylighting Performance Appendix
235
found to result in a range between 10% and 20%. These studies were conducted within
scale models with similar surface reflectivities (Wright 1998, Aizlewood 1997, Tregenza
1997, Mabb 1997).
A.4.4 Surface Reflectivity
Reflection of light off surfaces enables people to see the surfaces. The reflection can be
either diffuse or specular or a combination of both. The colour of a surface results from
that surface absorbing light of other wavelengths.
All surfaces in the constructed computer simulations were assumed to be perfect diffusing
surfaces. That is, that the angle of reflection was independent of the angle of incidence
and therefore was equally likely to progress in any direction. [Figure A.4.03: Different reflection models]
The intensity of a ray of light when it is in a vacuum is a constant. When it strikes a body
it is either absorbed (α), reflected (r) or transmitted (τ). For unit incident radiation
1 = τ + α + r Eq. A.4.09
The distribution of light within an atrium well is largely affected by the reflectivity of the
walls, or atrium reflected component (ARC).
The atrium well acts as a large light pipe with the windows to the adjoining spaces its
outlets. The reflectivity of the walls determines how much light gets to the bottom of the
atrium. If the walls are floor to ceiling glass, or completely open to the adjoining spaces,
very little light will bounce off them to travel down to the lower storeys. If there are no
openings and highly reflective walls then most of the light will reach the bottom but the
adjoining spaces will not receive any natural light. The ideal concept is to vary the
fenestration at each level to obtain a balance between the light penetration into the well
and into the adjoining spaces upon each level (Saxon 1983).
Diffuse Directional Diffuse Specular
Modification of Atrium Design to Improve Thermal and Daylighting Performance Appendix
236
A.4.5 Penetration of light into adjoining space
Unlike normal rooms, rooms adjoining atrium spaces have a very small view of the sky.
Advanced glazing systems are required to collect the maximum amount of light possible
and direct it into the adjoining room efficiently. The window should allow a general view
but direct much of its light upward onto the ceiling, to bounce further into the room and
reduce contrasts.
The light level within an adjoining room to an atrium well will be lowest in the rooms
towards the bottom of the well. Due to multiple wall reflections within the atrium well the
intensity of these light rays are significantly decreased by the time they reach the bottom
of the well. The only rays that contribute to the light level at the base of a well are those
that come directly from the sky and those reflected off the floor of the well. The light
from the sky is travelling in the vertical direction downwards and therefore will not
penetrate far into the adjoining room horizontally.
The success of raising the light level within the adjoining rooms depends upon the ability
to decrease the number of reflections that the light ray makes before it reaches the work
plane in the space.
Advanced glazing systems such as light shelves, light guides and bi-directional panels can
all be used to improve light levels in these adjoining spaces by redirecting the vertical
light rays horizontally.
The size of the opening to adjoining spaces, the height of the ceiling and the reflectivity of
the surfaces are all critical to the amount of light that penetrates into the adjoining areas.
The light level anywhere in adjoining rooms is relatively low and uniform due to the
number of reflections that the light makes before it reaches the floor in the adjoining
space. The number of reflections can be reduced by up to 10 with the installation of the
appropriate tilted advanced glazing system.
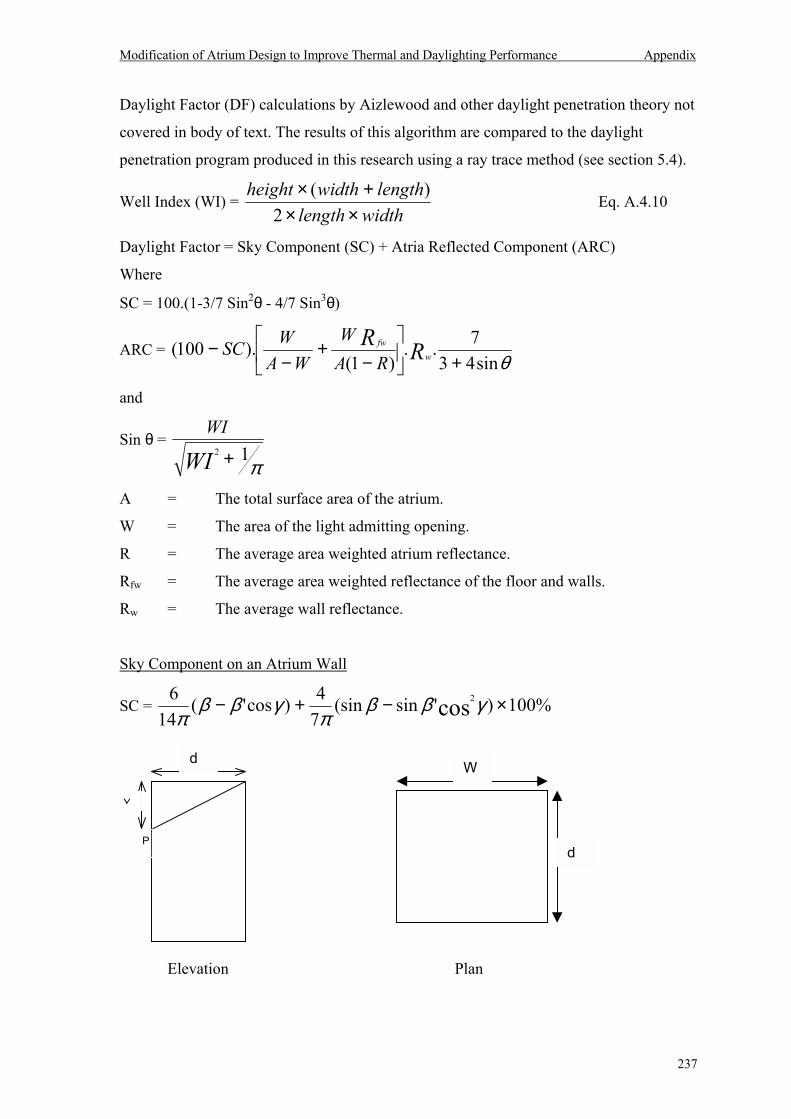
Modification of Atrium Design to Improve Thermal and Daylighting Performance Appendix
237
Daylight Factor (DF) calculations by Aizlewood and other daylight penetration theory not
covered in body of text. The results of this algorithm are compared to the daylight
penetration program produced in this research using a ray trace method (see section 5.4).
Well Index (WI) = widthlengthlengthwidthheight
××+×
2)(
Eq. A.4.10
Daylight Factor = Sky Component (SC) + Atria Reflected Component (ARC)
Where
SC = 100.(1-3/7 Sin2θ - 4/7 Sin3θ)
ARC = θsin43
7..)1(
).100(+
−
+−
− RRw
fw
RAW
WAWSC
and
Sin θ =
π12 +WI
WI
A = The total surface area of the atrium.
W = The area of the light admitting opening.
R = The average area weighted atrium reflectance.
Rfw = The average area weighted reflectance of the floor and walls.
Rw = The average wall reflectance.
Sky Component on an Atrium Wall
SC = %100)'sin(sin74)cos'(
146
cos2 ×−+− γββπ
γββπ
Elevation Plan
W
d
Y
d
P
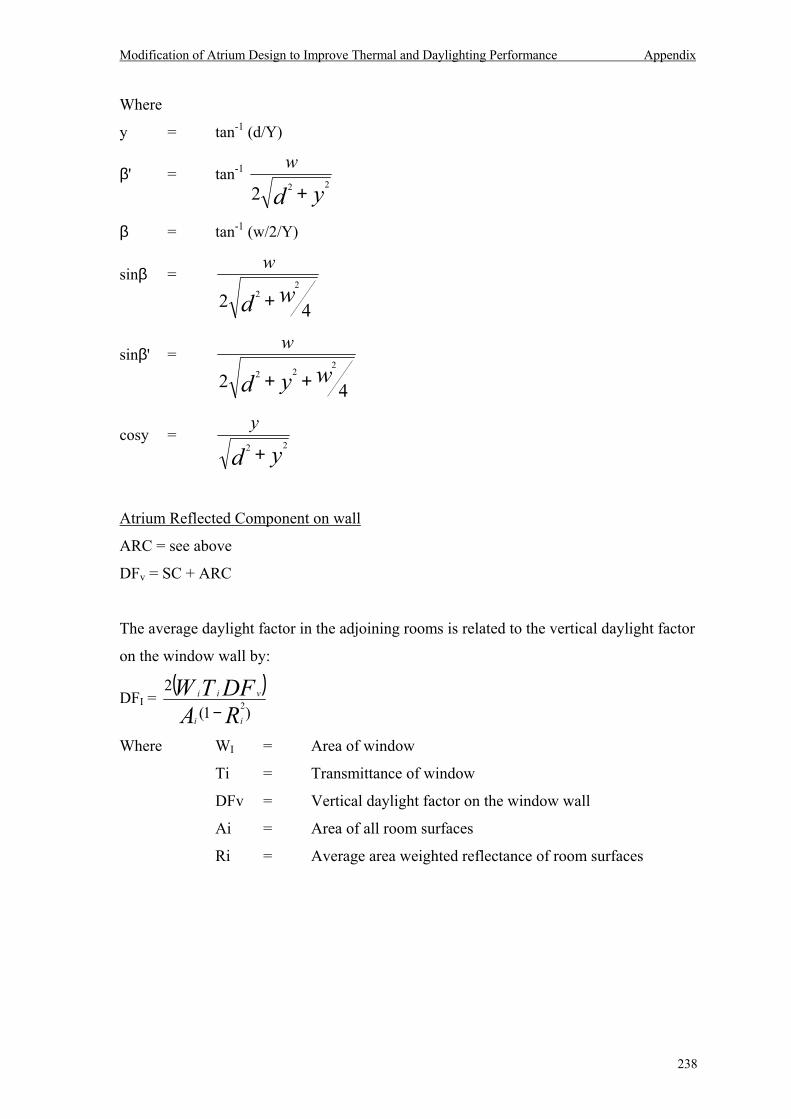
Modification of Atrium Design to Improve Thermal and Daylighting Performance Appendix
238
Where
y = tan-1 (d/Y)
β' = tan-1 yd
w222 +
β = tan-1 (w/2/Y)
sinβ =
422
2 wd
w
+
sinβ' =
422
22 wyd
w
++
cosy = yd
y22 +
Atrium Reflected Component on wall
ARC = see above
DFv = SC + ARC
The average daylight factor in the adjoining rooms is related to the vertical daylight factor
on the window wall by:
DFI = ( )
)1(
22RADFTW
ii
vii
−
Where WI = Area of window
Ti = Transmittance of window
DFv = Vertical daylight factor on the window wall
Ai = Area of all room surfaces
Ri = Average area weighted reflectance of room surfaces
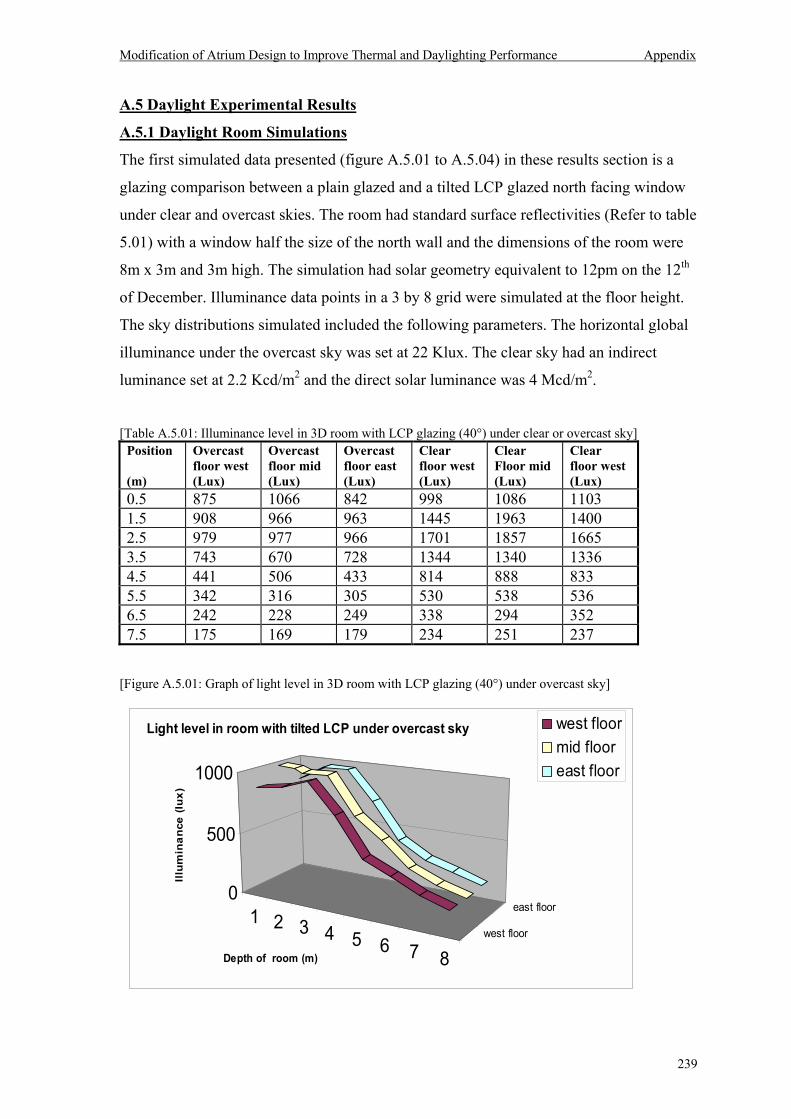
Modification of Atrium Design to Improve Thermal and Daylighting Performance Appendix
239
A.5 Daylight Experimental Results
A.5.1 Daylight Room Simulations
The first simulated data presented (figure A.5.01 to A.5.04) in these results section is a
glazing comparison between a plain glazed and a tilted LCP glazed north facing window
under clear and overcast skies. The room had standard surface reflectivities (Refer to table
5.01) with a window half the size of the north wall and the dimensions of the room were
8m x 3m and 3m high. The simulation had solar geometry equivalent to 12pm on the 12th
of December. Illuminance data points in a 3 by 8 grid were simulated at the floor height.
The sky distributions simulated included the following parameters. The horizontal global
illuminance under the overcast sky was set at 22 Klux. The clear sky had an indirect
luminance set at 2.2 Kcd/m2 and the direct solar luminance was 4 Mcd/m2.
[Table A.5.01: Illuminance level in 3D room with LCP glazing (40°) under clear or overcast sky]
Position (m)
Overcast floor west (Lux)
Overcast floor mid (Lux)
Overcast floor east (Lux)
Clear floor west (Lux)
Clear Floor mid (Lux)
Clear floor west (Lux)
0.5 875 1066 842 998 1086 1103 1.5 908 966 963 1445 1963 1400 2.5 979 977 966 1701 1857 1665 3.5 743 670 728 1344 1340 1336 4.5 441 506 433 814 888 833 5.5 342 316 305 530 538 536 6.5 242 228 249 338 294 352 7.5 175 169 179 234 251 237
[Figure A.5.01: Graph of light level in 3D room with LCP glazing (40°) under overcast sky]
1 2 3 4 5 6 7 8west floor
east floor0
500
1000
Illum
inan
ce (l
ux)
Depth of room (m)
Light level in room with tilted LCP under overcast sky west floormid flooreast floor
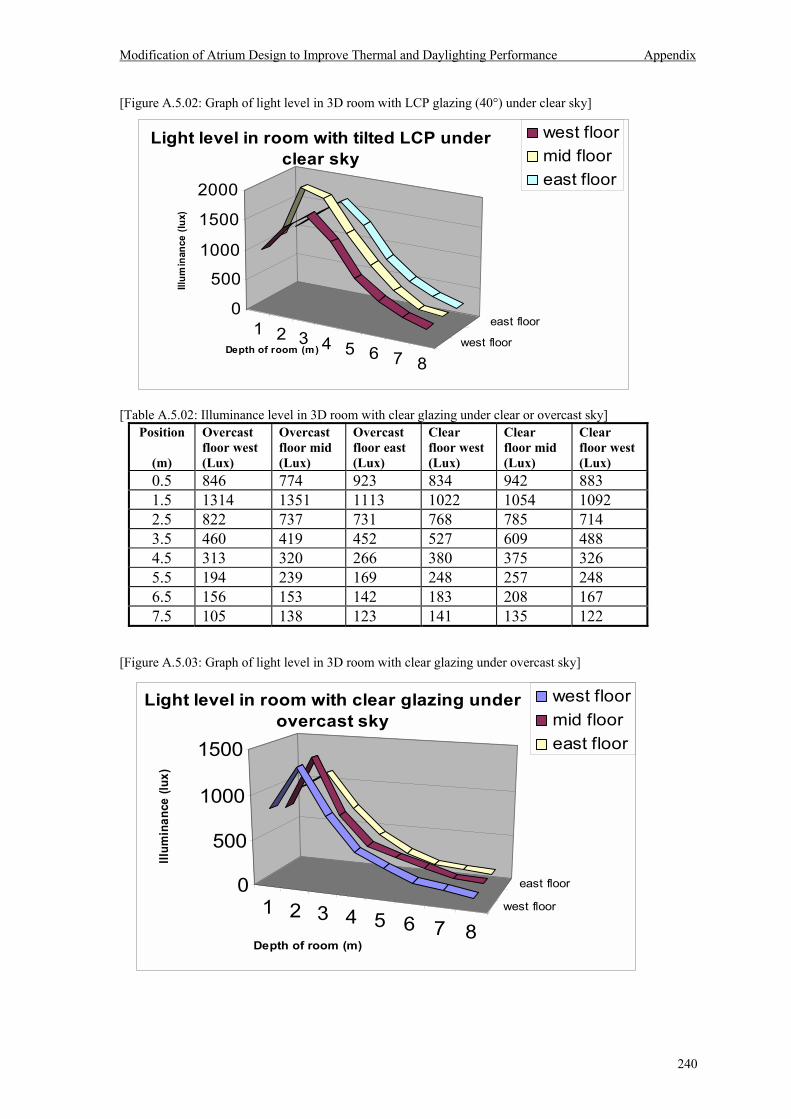
Modification of Atrium Design to Improve Thermal and Daylighting Performance Appendix
240
[Figure A.5.02: Graph of light level in 3D room with LCP glazing (40°) under clear sky] [Table A.5.02: Illuminance level in 3D room with clear glazing under clear or overcast sky]
Position
(m)
Overcast floor west (Lux)
Overcast floor mid (Lux)
Overcast floor east (Lux)
Clear floor west (Lux)
Clear floor mid (Lux)
Clear floor west (Lux)
0.5 846 774 923 834 942 883 1.5 1314 1351 1113 1022 1054 1092 2.5 822 737 731 768 785 714 3.5 460 419 452 527 609 488 4.5 313 320 266 380 375 326 5.5 194 239 169 248 257 248 6.5 156 153 142 183 208 167 7.5 105 138 123 141 135 122
[Figure A.5.03: Graph of light level in 3D room with clear glazing under overcast sky]
1 2 3 4 5 6 7 8west floor
east floor0
500
1000
1500
2000Ill
umin
ance
(lux
)
Depth of room (m)
Light level in room with tilted LCP under clear sky
west floormid flooreast floor
1 2 3 4 5 6 7 8west floor
east floor0
500
1000
1500
Illum
inan
ce (l
ux)
Depth of room (m)
Light level in room with clear glazing under overcast sky
west floormid flooreast floor
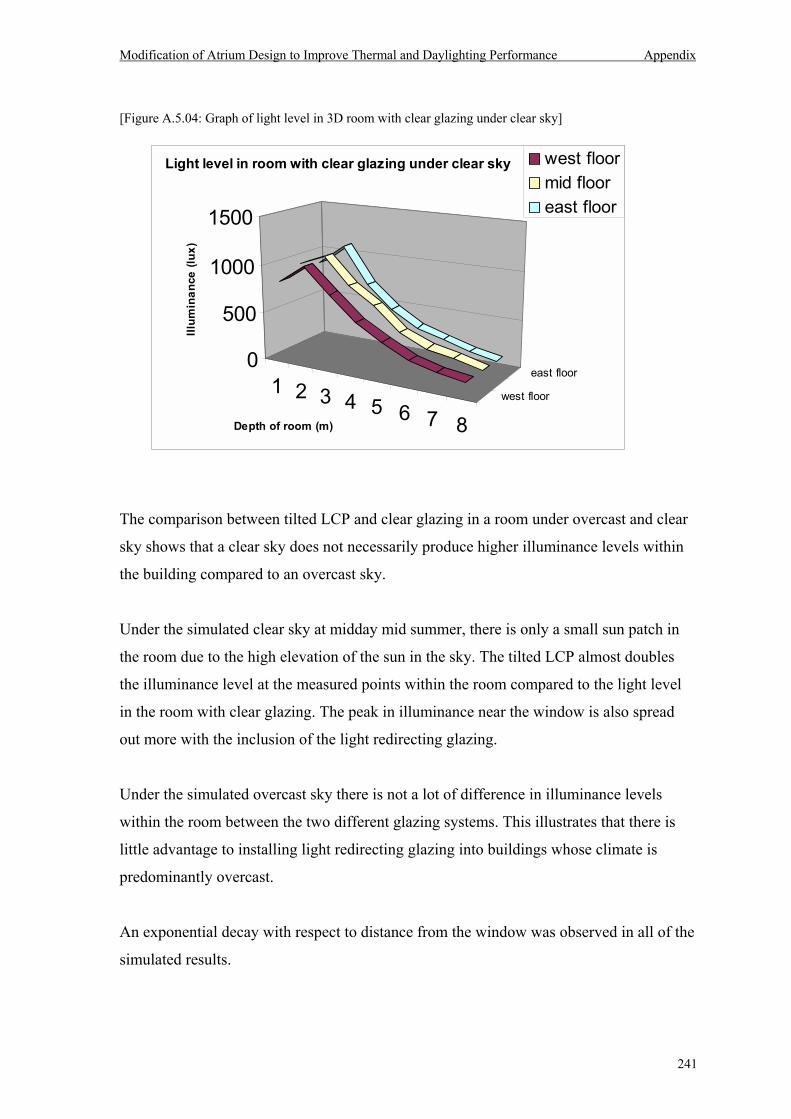
Modification of Atrium Design to Improve Thermal and Daylighting Performance Appendix
241
[Figure A.5.04: Graph of light level in 3D room with clear glazing under clear sky]
The comparison between tilted LCP and clear glazing in a room under overcast and clear
sky shows that a clear sky does not necessarily produce higher illuminance levels within
the building compared to an overcast sky.
Under the simulated clear sky at midday mid summer, there is only a small sun patch in
the room due to the high elevation of the sun in the sky. The tilted LCP almost doubles
the illuminance level at the measured points within the room compared to the light level
in the room with clear glazing. The peak in illuminance near the window is also spread
out more with the inclusion of the light redirecting glazing.
Under the simulated overcast sky there is not a lot of difference in illuminance levels
within the room between the two different glazing systems. This illustrates that there is
little advantage to installing light redirecting glazing into buildings whose climate is
predominantly overcast.
An exponential decay with respect to distance from the window was observed in all of the
simulated results.
1 2 3 4 5 6 7 8west floor
east floor0
500
1000
1500Ill
umin
ance
(lux
)
Depth of room (m)
Light level in room with clear glazing under clear sky west floormid flooreast floor
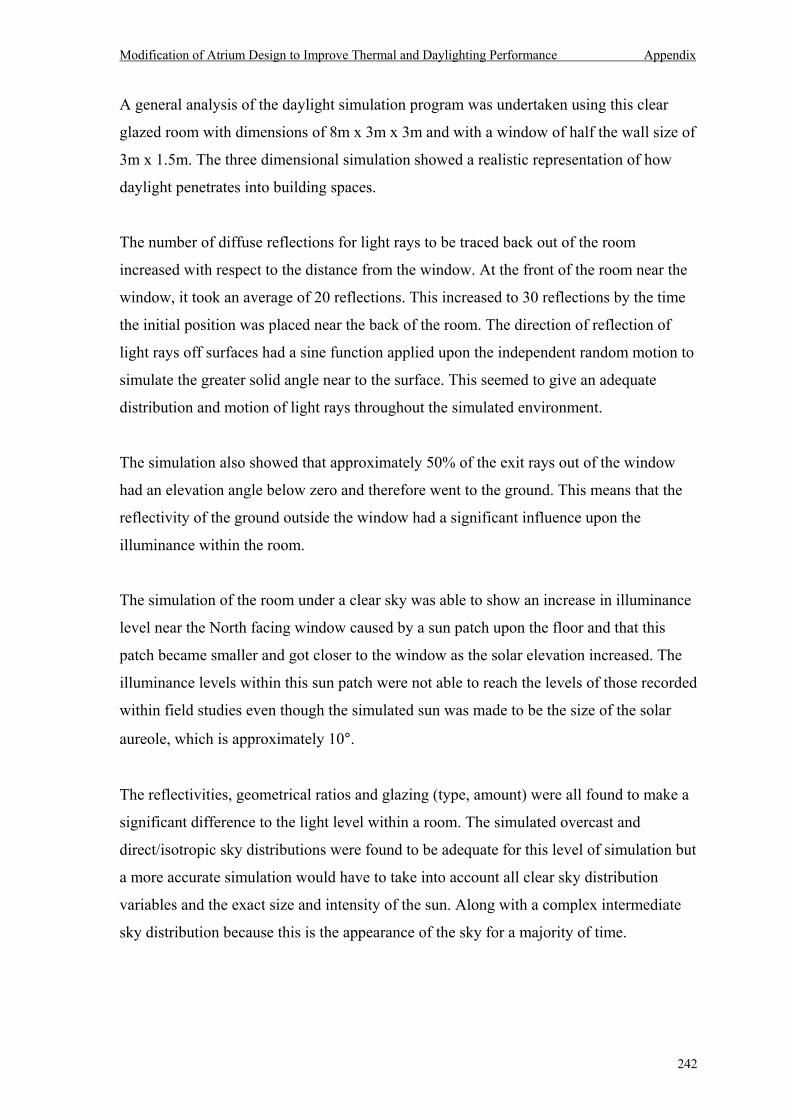
Modification of Atrium Design to Improve Thermal and Daylighting Performance Appendix
242
A general analysis of the daylight simulation program was undertaken using this clear
glazed room with dimensions of 8m x 3m x 3m and with a window of half the wall size of
3m x 1.5m. The three dimensional simulation showed a realistic representation of how
daylight penetrates into building spaces.
The number of diffuse reflections for light rays to be traced back out of the room
increased with respect to the distance from the window. At the front of the room near the
window, it took an average of 20 reflections. This increased to 30 reflections by the time
the initial position was placed near the back of the room. The direction of reflection of
light rays off surfaces had a sine function applied upon the independent random motion to
simulate the greater solid angle near to the surface. This seemed to give an adequate
distribution and motion of light rays throughout the simulated environment.
The simulation also showed that approximately 50% of the exit rays out of the window
had an elevation angle below zero and therefore went to the ground. This means that the
reflectivity of the ground outside the window had a significant influence upon the
illuminance within the room.
The simulation of the room under a clear sky was able to show an increase in illuminance
level near the North facing window caused by a sun patch upon the floor and that this
patch became smaller and got closer to the window as the solar elevation increased. The
illuminance levels within this sun patch were not able to reach the levels of those recorded
within field studies even though the simulated sun was made to be the size of the solar
aureole, which is approximately 10°.
The reflectivities, geometrical ratios and glazing (type, amount) were all found to make a
significant difference to the light level within a room. The simulated overcast and
direct/isotropic sky distributions were found to be adequate for this level of simulation but
a more accurate simulation would have to take into account all clear sky distribution
variables and the exact size and intensity of the sun. Along with a complex intermediate
sky distribution because this is the appearance of the sky for a majority of time.
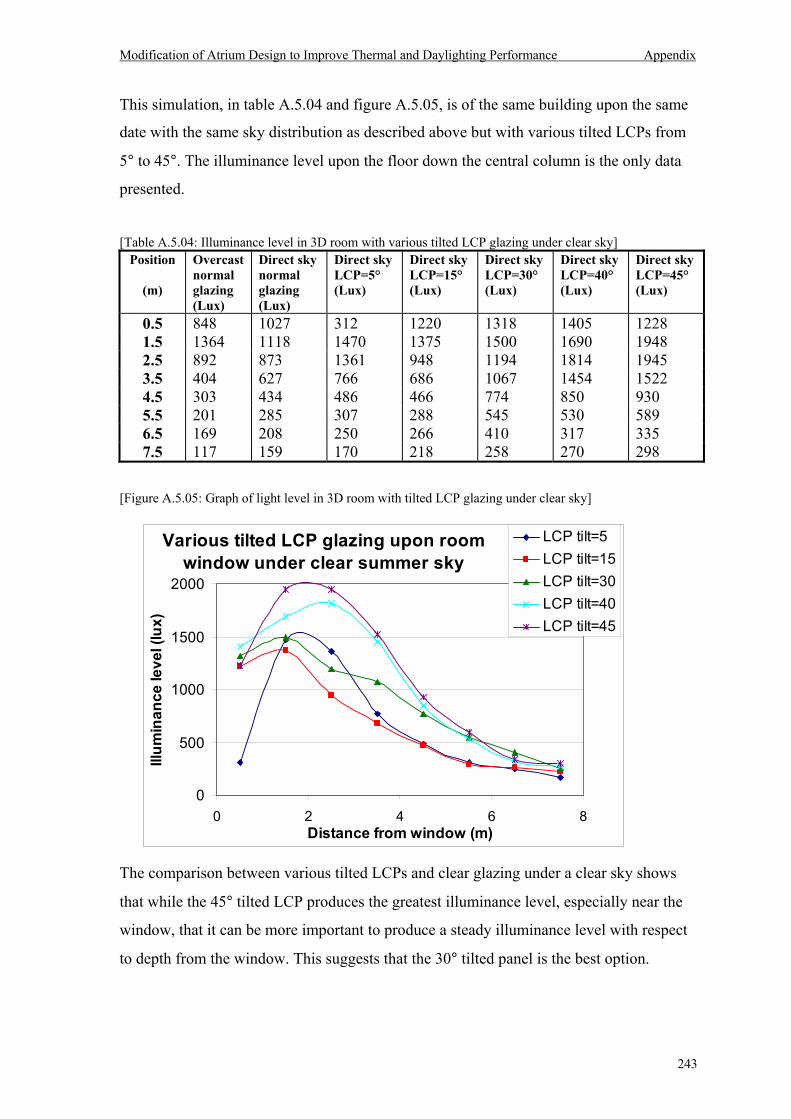
Modification of Atrium Design to Improve Thermal and Daylighting Performance Appendix
243
This simulation, in table A.5.04 and figure A.5.05, is of the same building upon the same
date with the same sky distribution as described above but with various tilted LCPs from
5° to 45°. The illuminance level upon the floor down the central column is the only data
presented.
[Table A.5.04: Illuminance level in 3D room with various tilted LCP glazing under clear sky]
Position
(m)
Overcast normal glazing (Lux)
Direct sky normal glazing (Lux)
Direct sky LCP=5° (Lux)
Direct sky LCP=15° (Lux)
Direct sky LCP=30° (Lux)
Direct sky LCP=40° (Lux)
Direct sky LCP=45° (Lux)
0.5 848 1027 312 1220 1318 1405 1228 1.5 1364 1118 1470 1375 1500 1690 1948 2.5 892 873 1361 948 1194 1814 1945 3.5 404 627 766 686 1067 1454 1522 4.5 303 434 486 466 774 850 930 5.5 201 285 307 288 545 530 589 6.5 169 208 250 266 410 317 335 7.5 117 159 170 218 258 270 298
[Figure A.5.05: Graph of light level in 3D room with tilted LCP glazing under clear sky]
The comparison between various tilted LCPs and clear glazing under a clear sky shows
that while the 45° tilted LCP produces the greatest illuminance level, especially near the
window, that it can be more important to produce a steady illuminance level with respect
to depth from the window. This suggests that the 30° tilted panel is the best option.
Various tilted LCP glazing upon room window under clear summer sky
0
500
1000
1500
2000
0 2 4 6 8Distance from window (m)
Illum
inan
ce le
vel (
lux)
LCP tilt=5LCP tilt=15LCP tilt=30LCP tilt=40LCP tilt=45
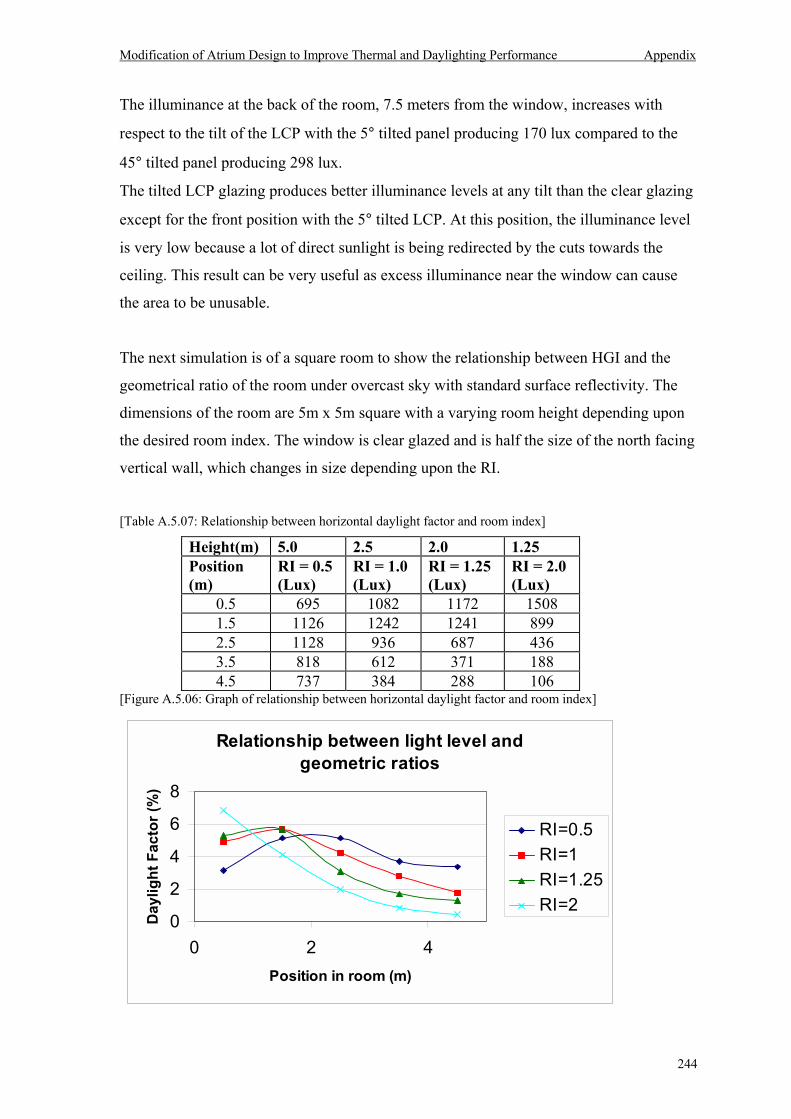
Modification of Atrium Design to Improve Thermal and Daylighting Performance Appendix
244
The illuminance at the back of the room, 7.5 meters from the window, increases with
respect to the tilt of the LCP with the 5° tilted panel producing 170 lux compared to the
45° tilted panel producing 298 lux.
The tilted LCP glazing produces better illuminance levels at any tilt than the clear glazing
except for the front position with the 5° tilted LCP. At this position, the illuminance level
is very low because a lot of direct sunlight is being redirected by the cuts towards the
ceiling. This result can be very useful as excess illuminance near the window can cause
the area to be unusable.
The next simulation is of a square room to show the relationship between HGI and the
geometrical ratio of the room under overcast sky with standard surface reflectivity. The
dimensions of the room are 5m x 5m square with a varying room height depending upon
the desired room index. The window is clear glazed and is half the size of the north facing
vertical wall, which changes in size depending upon the RI.
[Table A.5.07: Relationship between horizontal daylight factor and room index]
Height(m) 5.0 2.5 2.0 1.25 Position (m)
RI = 0.5 (Lux)
RI = 1.0 (Lux)
RI = 1.25 (Lux)
RI = 2.0 (Lux)
0.5 695 1082 1172 1508 1.5 1126 1242 1241 899 2.5 1128 936 687 436 3.5 818 612 371 188 4.5 737 384 288 106
[Figure A.5.06: Graph of relationship between horizontal daylight factor and room index]
Relationship between light level and geometric ratios
0
2
4
6
8
0 2 4Position in room (m)
Day
light
Fac
tor (
%)
RI=0.5RI=1RI=1.25RI=2
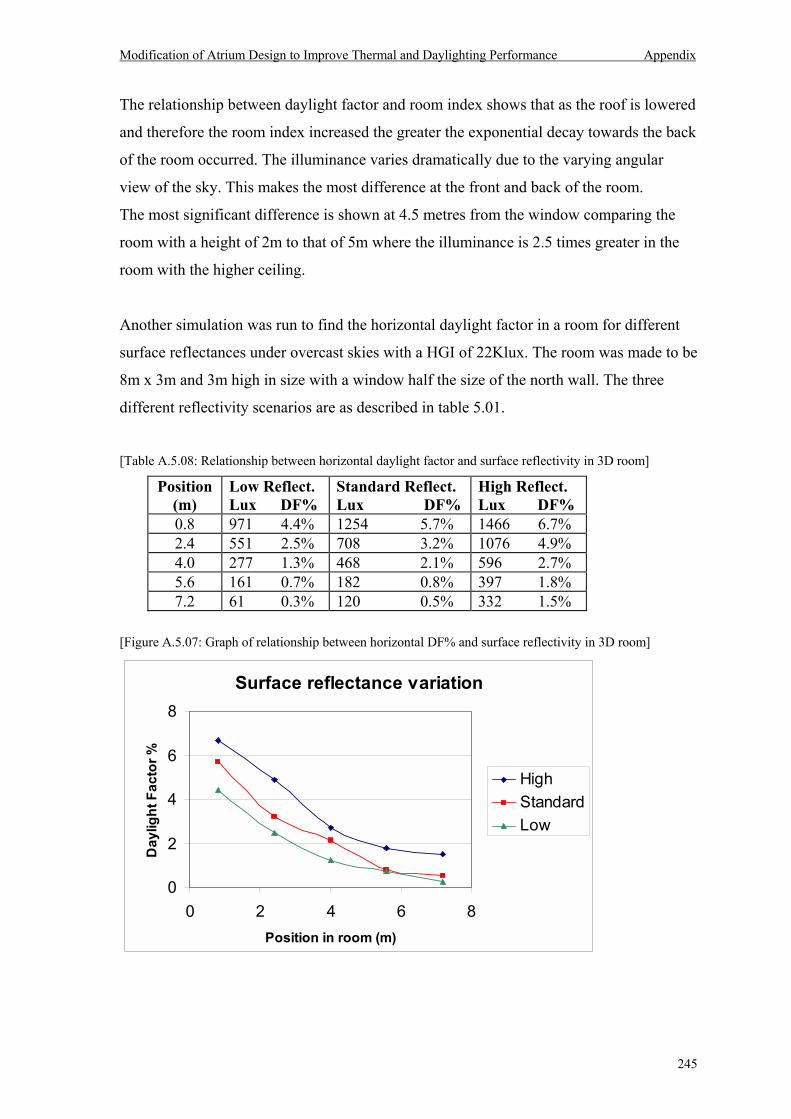
Modification of Atrium Design to Improve Thermal and Daylighting Performance Appendix
245
The relationship between daylight factor and room index shows that as the roof is lowered
and therefore the room index increased the greater the exponential decay towards the back
of the room occurred. The illuminance varies dramatically due to the varying angular
view of the sky. This makes the most difference at the front and back of the room.
The most significant difference is shown at 4.5 metres from the window comparing the
room with a height of 2m to that of 5m where the illuminance is 2.5 times greater in the
room with the higher ceiling.
Another simulation was run to find the horizontal daylight factor in a room for different
surface reflectances under overcast skies with a HGI of 22Klux. The room was made to be
8m x 3m and 3m high in size with a window half the size of the north wall. The three
different reflectivity scenarios are as described in table 5.01.
[Table A.5.08: Relationship between horizontal daylight factor and surface reflectivity in 3D room]
Position (m)
Low Reflect. Lux DF%
Standard Reflect. Lux DF%
High Reflect. Lux DF%
0.8 971 4.4% 1254 5.7% 1466 6.7% 2.4 551 2.5% 708 3.2% 1076 4.9% 4.0 277 1.3% 468 2.1% 596 2.7% 5.6 161 0.7% 182 0.8% 397 1.8% 7.2 61 0.3% 120 0.5% 332 1.5%
[Figure A.5.07: Graph of relationship between horizontal DF% and surface reflectivity in 3D room]
Surface reflectance variation
0
2
4
6
8
0 2 4 6 8Position in room (m)
Day
light
Fac
tor %
HighStandardLow
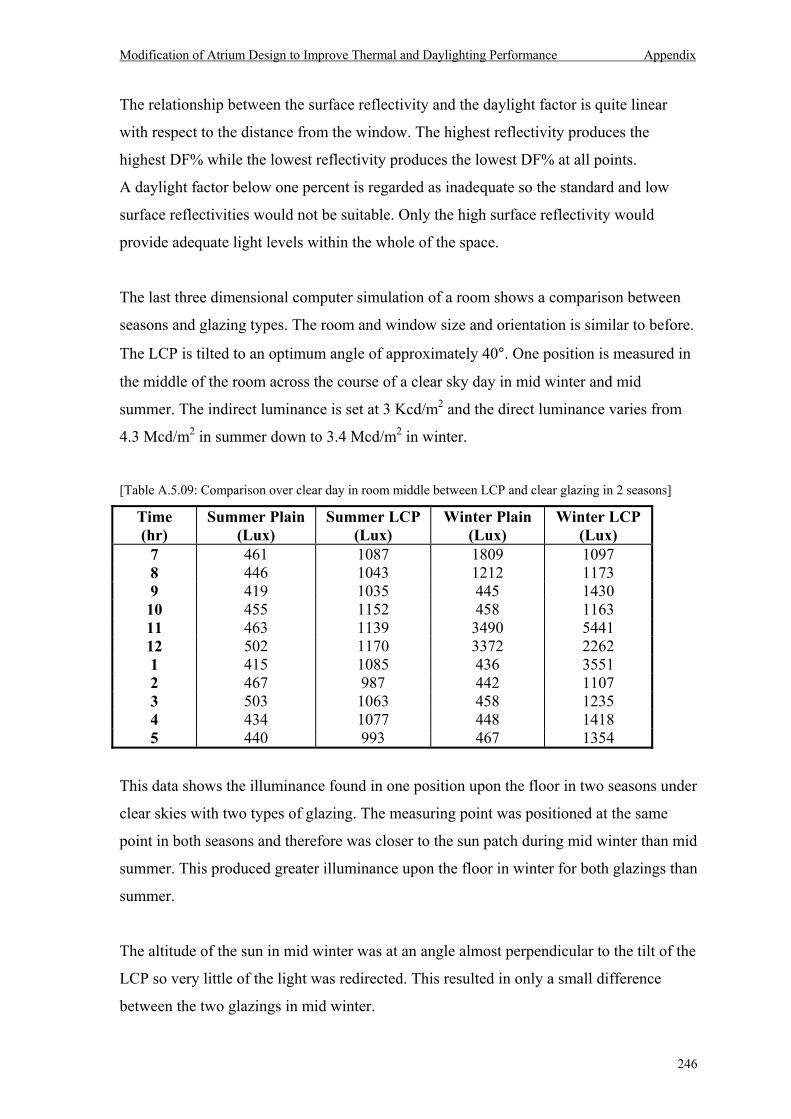
Modification of Atrium Design to Improve Thermal and Daylighting Performance Appendix
246
The relationship between the surface reflectivity and the daylight factor is quite linear
with respect to the distance from the window. The highest reflectivity produces the
highest DF% while the lowest reflectivity produces the lowest DF% at all points.
A daylight factor below one percent is regarded as inadequate so the standard and low
surface reflectivities would not be suitable. Only the high surface reflectivity would
provide adequate light levels within the whole of the space.
The last three dimensional computer simulation of a room shows a comparison between
seasons and glazing types. The room and window size and orientation is similar to before.
The LCP is tilted to an optimum angle of approximately 40°. One position is measured in
the middle of the room across the course of a clear sky day in mid winter and mid
summer. The indirect luminance is set at 3 Kcd/m2 and the direct luminance varies from
4.3 Mcd/m2 in summer down to 3.4 Mcd/m2 in winter.
[Table A.5.09: Comparison over clear day in room middle between LCP and clear glazing in 2 seasons]
Time (hr)
Summer Plain (Lux)
Summer LCP (Lux)
Winter Plain (Lux)
Winter LCP (Lux)
7 461 1087 1809 1097 8 446 1043 1212 1173 9 419 1035 445 1430 10 455 1152 458 1163 11 463 1139 3490 5441 12 502 1170 3372 2262 1 415 1085 436 3551 2 467 987 442 1107 3 503 1063 458 1235 4 434 1077 448 1418 5 440 993 467 1354
This data shows the illuminance found in one position upon the floor in two seasons under
clear skies with two types of glazing. The measuring point was positioned at the same
point in both seasons and therefore was closer to the sun patch during mid winter than mid
summer. This produced greater illuminance upon the floor in winter for both glazings than
summer.
The altitude of the sun in mid winter was at an angle almost perpendicular to the tilt of the
LCP so very little of the light was redirected. This resulted in only a small difference
between the two glazings in mid winter.
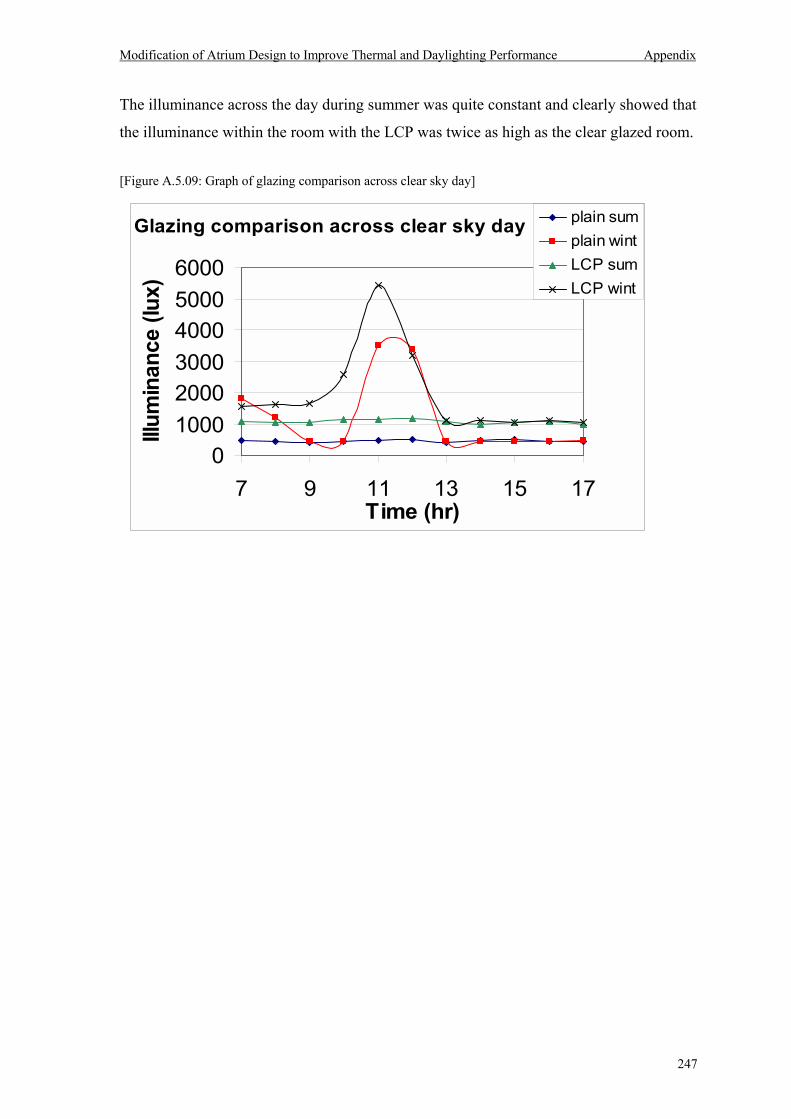
Modification of Atrium Design to Improve Thermal and Daylighting Performance Appendix
247
The illuminance across the day during summer was quite constant and clearly showed that
the illuminance within the room with the LCP was twice as high as the clear glazed room.
[Figure A.5.09: Graph of glazing comparison across clear sky day]
Glazing comparison across clear sky day
0100020003000400050006000
7 9 11 13 15 17Time (hr)
Illum
inan
ce (l
ux)
plain sumplain wintLCP sumLCP wint
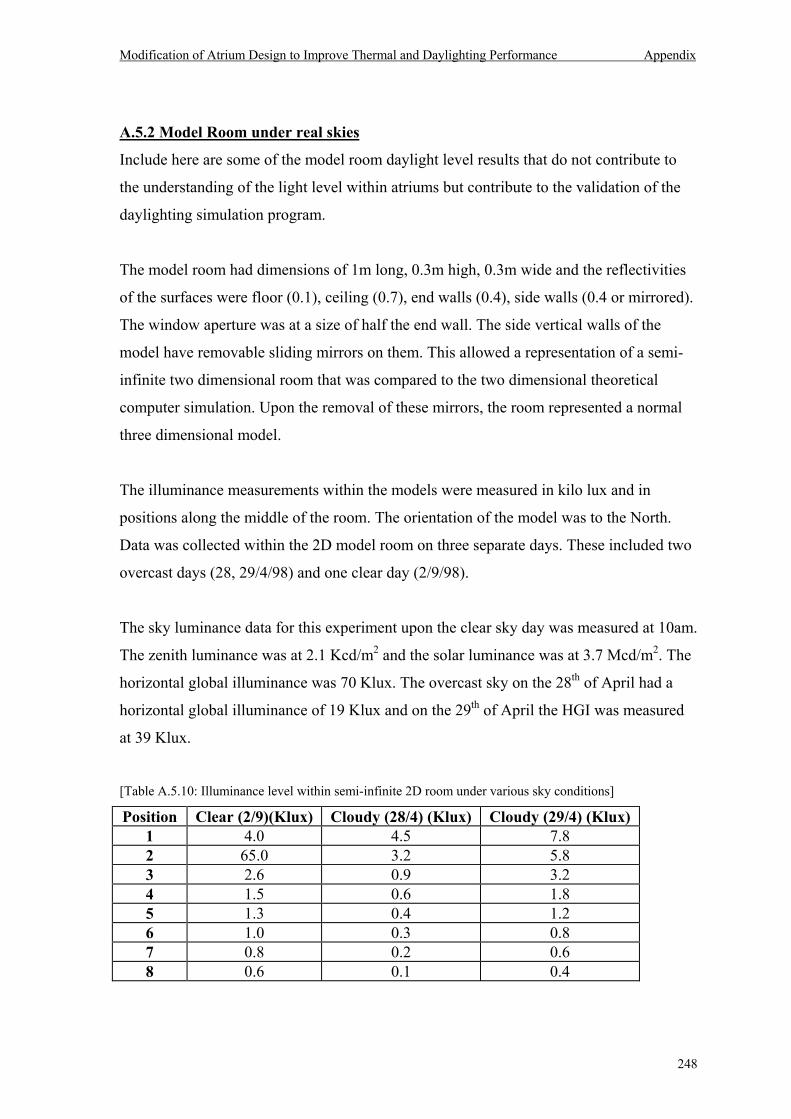
Modification of Atrium Design to Improve Thermal and Daylighting Performance Appendix
248
A.5.2 Model Room under real skies
Include here are some of the model room daylight level results that do not contribute to
the understanding of the light level within atriums but contribute to the validation of the
daylighting simulation program.
The model room had dimensions of 1m long, 0.3m high, 0.3m wide and the reflectivities
of the surfaces were floor (0.1), ceiling (0.7), end walls (0.4), side walls (0.4 or mirrored).
The window aperture was at a size of half the end wall. The side vertical walls of the
model have removable sliding mirrors on them. This allowed a representation of a semi-
infinite two dimensional room that was compared to the two dimensional theoretical
computer simulation. Upon the removal of these mirrors, the room represented a normal
three dimensional model.
The illuminance measurements within the models were measured in kilo lux and in
positions along the middle of the room. The orientation of the model was to the North.
Data was collected within the 2D model room on three separate days. These included two
overcast days (28, 29/4/98) and one clear day (2/9/98).
The sky luminance data for this experiment upon the clear sky day was measured at 10am.
The zenith luminance was at 2.1 Kcd/m2 and the solar luminance was at 3.7 Mcd/m2. The
horizontal global illuminance was 70 Klux. The overcast sky on the 28th of April had a
horizontal global illuminance of 19 Klux and on the 29th of April the HGI was measured
at 39 Klux.
[Table A.5.10: Illuminance level within semi-infinite 2D room under various sky conditions]
Position Clear (2/9)(Klux) Cloudy (28/4) (Klux) Cloudy (29/4) (Klux) 1 4.0 4.5 7.8 2 65.0 3.2 5.8 3 2.6 0.9 3.2 4 1.5 0.6 1.8 5 1.3 0.4 1.2 6 1.0 0.3 0.8 7 0.8 0.2 0.6 8 0.6 0.1 0.4
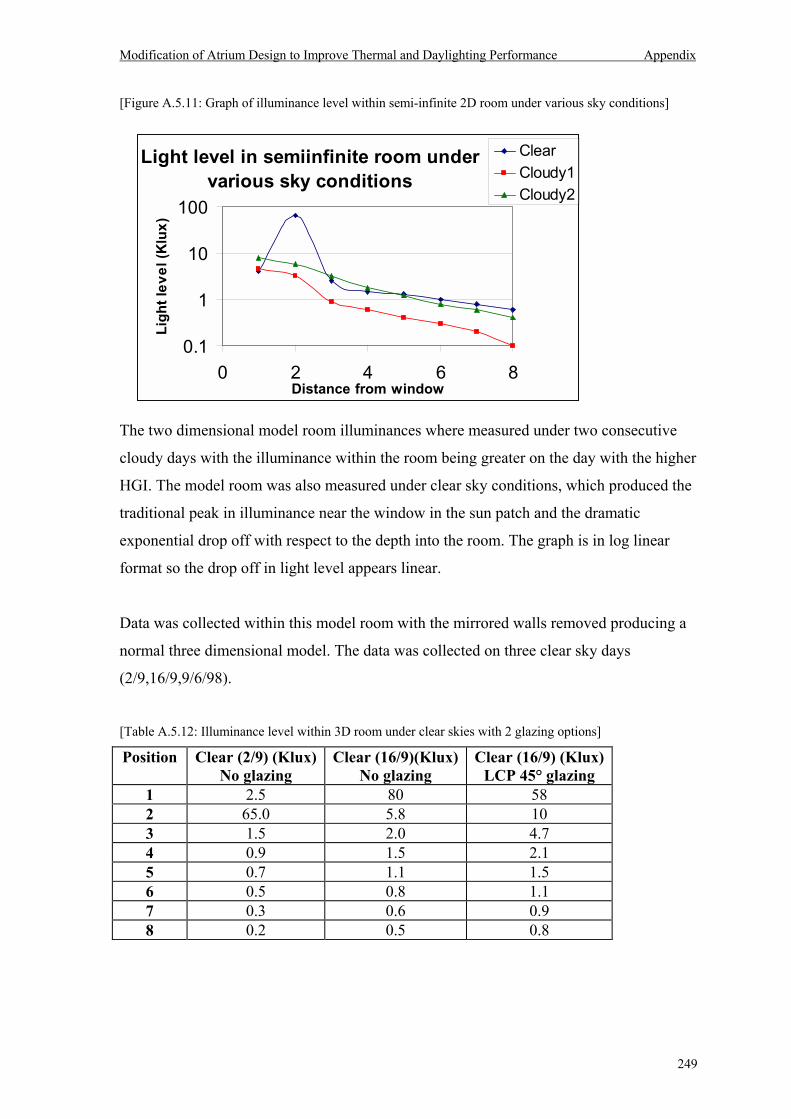
Modification of Atrium Design to Improve Thermal and Daylighting Performance Appendix
249
[Figure A.5.11: Graph of illuminance level within semi-infinite 2D room under various sky conditions]
The two dimensional model room illuminances where measured under two consecutive
cloudy days with the illuminance within the room being greater on the day with the higher
HGI. The model room was also measured under clear sky conditions, which produced the
traditional peak in illuminance near the window in the sun patch and the dramatic
exponential drop off with respect to the depth into the room. The graph is in log linear
format so the drop off in light level appears linear.
Data was collected within this model room with the mirrored walls removed producing a
normal three dimensional model. The data was collected on three clear sky days
(2/9,16/9,9/6/98).
[Table A.5.12: Illuminance level within 3D room under clear skies with 2 glazing options]
Position Clear (2/9) (Klux) No glazing
Clear (16/9)(Klux)No glazing
Clear (16/9) (Klux) LCP 45° glazing
1 2.5 80 58 2 65.0 5.8 10 3 1.5 2.0 4.7 4 0.9 1.5 2.1 5 0.7 1.1 1.5 6 0.5 0.8 1.1 7 0.3 0.6 0.9 8 0.2 0.5 0.8
Light level in semiinfinite room under various sky conditions
0.1
1
10
100
0 2 4 6 8Distance from window
Ligh
t lev
el (K
lux)
ClearCloudy1Cloudy2
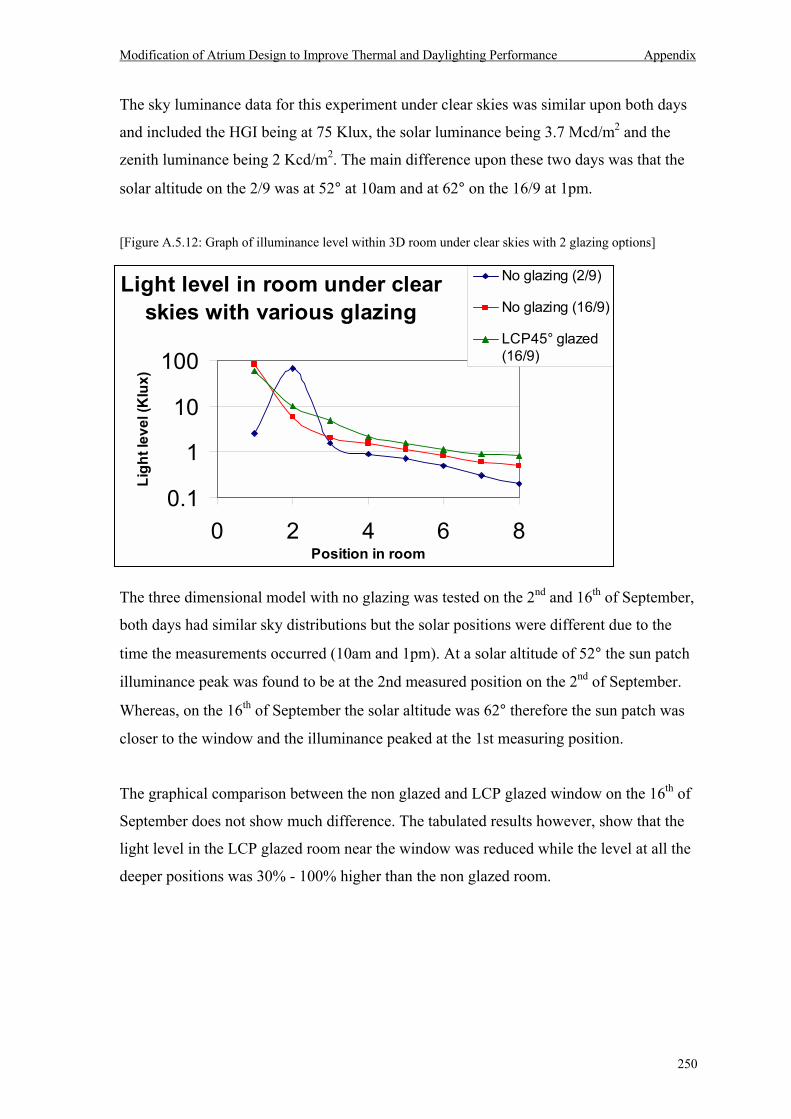
Modification of Atrium Design to Improve Thermal and Daylighting Performance Appendix
250
The sky luminance data for this experiment under clear skies was similar upon both days
and included the HGI being at 75 Klux, the solar luminance being 3.7 Mcd/m2 and the
zenith luminance being 2 Kcd/m2. The main difference upon these two days was that the
solar altitude on the 2/9 was at 52° at 10am and at 62° on the 16/9 at 1pm.
[Figure A.5.12: Graph of illuminance level within 3D room under clear skies with 2 glazing options]
The three dimensional model with no glazing was tested on the 2nd and 16th of September,
both days had similar sky distributions but the solar positions were different due to the
time the measurements occurred (10am and 1pm). At a solar altitude of 52° the sun patch
illuminance peak was found to be at the 2nd measured position on the 2nd of September.
Whereas, on the 16th of September the solar altitude was 62° therefore the sun patch was
closer to the window and the illuminance peaked at the 1st measuring position.
The graphical comparison between the non glazed and LCP glazed window on the 16th of
September does not show much difference. The tabulated results however, show that the
light level in the LCP glazed room near the window was reduced while the level at all the
deeper positions was 30% - 100% higher than the non glazed room.
Light level in room under clear skies with various glazing
0.1
1
10
100
0 2 4 6 8Position in room
Ligh
t lev
el (K
lux)
No glazing (2/9)
No glazing (16/9)
LCP45° glazed(16/9)
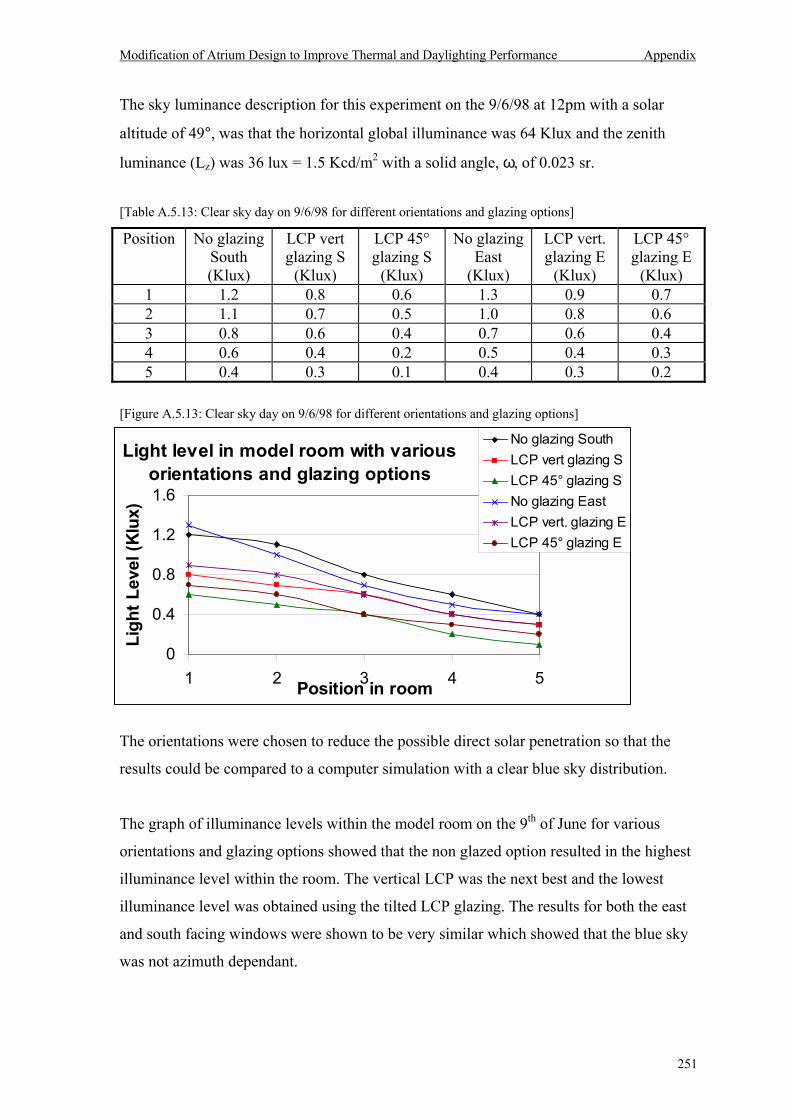
Modification of Atrium Design to Improve Thermal and Daylighting Performance Appendix
251
The sky luminance description for this experiment on the 9/6/98 at 12pm with a solar
altitude of 49°, was that the horizontal global illuminance was 64 Klux and the zenith
luminance (Lz) was 36 lux = 1.5 Kcd/m2 with a solid angle, ω, of 0.023 sr.
[Table A.5.13: Clear sky day on 9/6/98 for different orientations and glazing options]
Position No glazing South (Klux)
LCP vert glazing S
(Klux)
LCP 45° glazing S
(Klux)
No glazing East
(Klux)
LCP vert. glazing E
(Klux)
LCP 45° glazing E
(Klux) 1 1.2 0.8 0.6 1.3 0.9 0.7 2 1.1 0.7 0.5 1.0 0.8 0.6 3 0.8 0.6 0.4 0.7 0.6 0.4 4 0.6 0.4 0.2 0.5 0.4 0.3 5 0.4 0.3 0.1 0.4 0.3 0.2
[Figure A.5.13: Clear sky day on 9/6/98 for different orientations and glazing options]
The orientations were chosen to reduce the possible direct solar penetration so that the
results could be compared to a computer simulation with a clear blue sky distribution.
The graph of illuminance levels within the model room on the 9th of June for various
orientations and glazing options showed that the non glazed option resulted in the highest
illuminance level within the room. The vertical LCP was the next best and the lowest
illuminance level was obtained using the tilted LCP glazing. The results for both the east
and south facing windows were shown to be very similar which showed that the blue sky
was not azimuth dependant.
Light level in model room with various orientations and glazing options
0
0.4
0.8
1.2
1.6
1 2 3 4 5Position in room
Ligh
t Lev
el (K
lux)
No glazing SouthLCP vert glazing SLCP 45° glazing SNo glazing EastLCP vert. glazing ELCP 45° glazing E
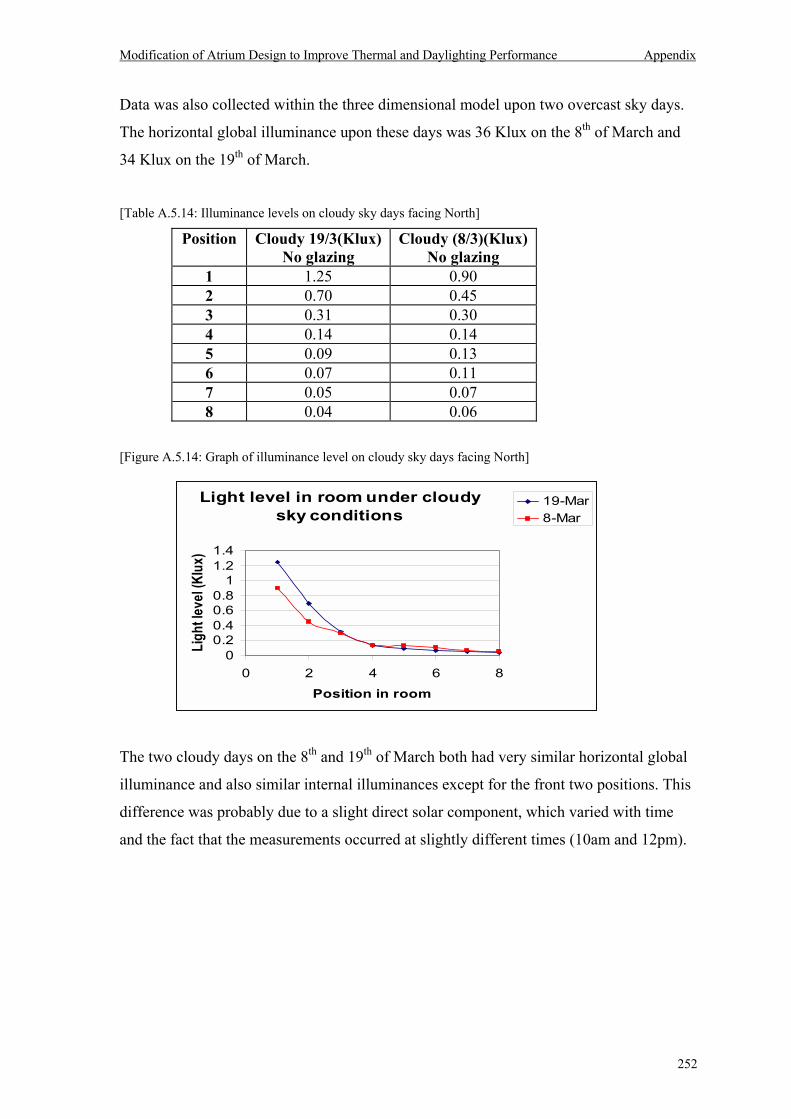
Modification of Atrium Design to Improve Thermal and Daylighting Performance Appendix
252
Data was also collected within the three dimensional model upon two overcast sky days.
The horizontal global illuminance upon these days was 36 Klux on the 8th of March and
34 Klux on the 19th of March.
[Table A.5.14: Illuminance levels on cloudy sky days facing North]
Position Cloudy 19/3(Klux)No glazing
Cloudy (8/3)(Klux)No glazing
1 1.25 0.90 2 0.70 0.45 3 0.31 0.30 4 0.14 0.14 5 0.09 0.13 6 0.07 0.11 7 0.05 0.07 8 0.04 0.06
[Figure A.5.14: Graph of illuminance level on cloudy sky days facing North]
The two cloudy days on the 8th and 19th of March both had very similar horizontal global
illuminance and also similar internal illuminances except for the front two positions. This
difference was probably due to a slight direct solar component, which varied with time
and the fact that the measurements occurred at slightly different times (10am and 12pm).
Light level in room under cloudy sky conditions
00.20.40.60.8
11.21.4
0 2 4 6 8
Position in room
Ligh
t leve
l (Klu
x)
19-Mar8-Mar
Modification of Atrium Design to Improve Thermal and Daylighting Performance Appendix
253
A.5.3 Cardboard box under real skies
Illuminance data was collected within this model under clear (20/1/00) and overcast skies
(13/12/99). The box represented a room with an aperture of half the wall. The cardboard
box had dimensions of 0.26m long, 0.22m high, 0.3m wide and all surface reflectivities
were 30%.
The sky luminance data for this experiment under a clear sky on the 20th of January was
that the HGI was 110 Klux. The Lz was 5 Kcd/m2, Lsun 10 Mcd/m2 with a solid angle of
0.005 steradians.
The sky luminance data for this experiment under an overcast sky on the 13th of
December was that the HGI was 19 Klux and the zenith luminance was 7.7 Kcd/m2 with a
solid angle of 0.023 steradians.
[Table A.5.15: Illuminance level within box under various sky conditions]
Position Clear sky (Klux) Cloudy sky (Klux)
1 75.0 1.3
2 2.5 2.0
3 1.9 1.3
This box model was fairly small so there was only enough room for 3 measuring
positions. Under the overcast sky conditions, this resulted in the illuminance
measurements peaking at the middle position and equal at the front and back position.
Under the sunny sky conditions the front position was located within the sun patch and
therefore was extremely high. Due to the low reflectivity of the internal surfaces of the
model there was very little light penetration so the illuminance at the other two positions
was low.
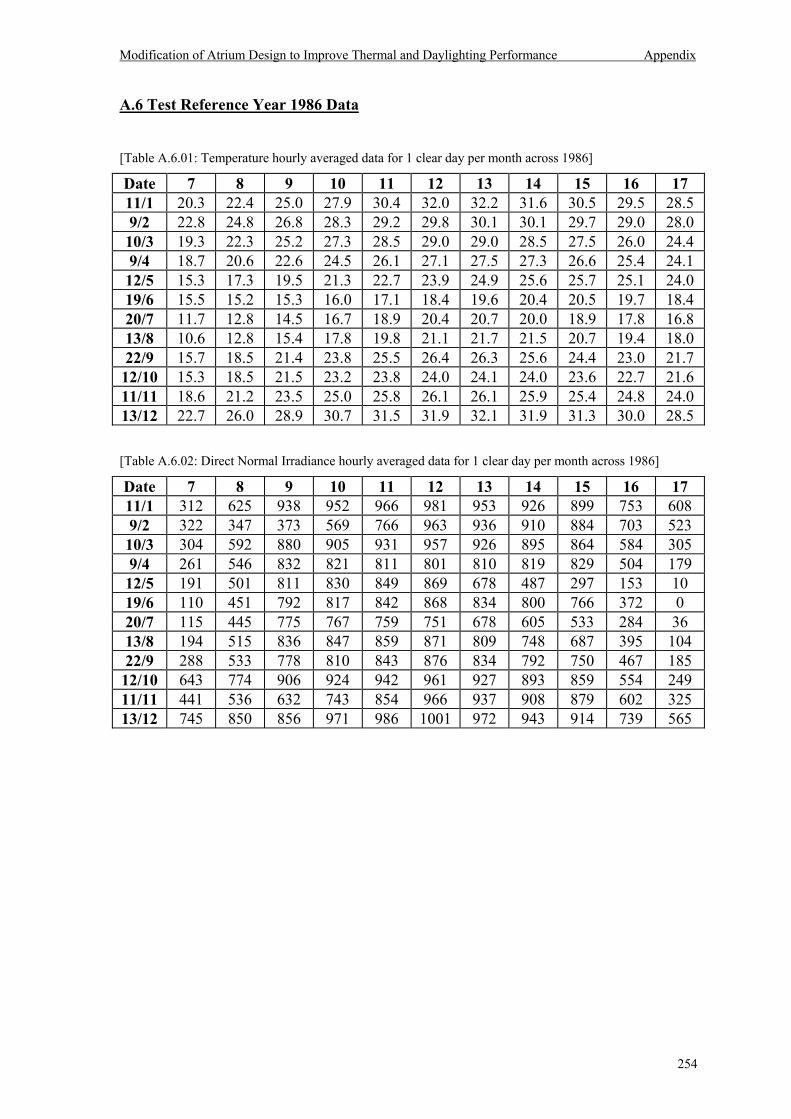
Modification of Atrium Design to Improve Thermal and Daylighting Performance Appendix
254
A.6 Test Reference Year 1986 Data
[Table A.6.01: Temperature hourly averaged data for 1 clear day per month across 1986]
Date 7 8 9 10 11 12 13 14 15 16 17 11/1 20.3 22.4 25.0 27.9 30.4 32.0 32.2 31.6 30.5 29.5 28.5 9/2 22.8 24.8 26.8 28.3 29.2 29.8 30.1 30.1 29.7 29.0 28.0 10/3 19.3 22.3 25.2 27.3 28.5 29.0 29.0 28.5 27.5 26.0 24.4 9/4 18.7 20.6 22.6 24.5 26.1 27.1 27.5 27.3 26.6 25.4 24.1 12/5 15.3 17.3 19.5 21.3 22.7 23.9 24.9 25.6 25.7 25.1 24.0 19/6 15.5 15.2 15.3 16.0 17.1 18.4 19.6 20.4 20.5 19.7 18.4 20/7 11.7 12.8 14.5 16.7 18.9 20.4 20.7 20.0 18.9 17.8 16.8 13/8 10.6 12.8 15.4 17.8 19.8 21.1 21.7 21.5 20.7 19.4 18.0 22/9 15.7 18.5 21.4 23.8 25.5 26.4 26.3 25.6 24.4 23.0 21.7 12/10 15.3 18.5 21.5 23.2 23.8 24.0 24.1 24.0 23.6 22.7 21.6 11/11 18.6 21.2 23.5 25.0 25.8 26.1 26.1 25.9 25.4 24.8 24.0 13/12 22.7 26.0 28.9 30.7 31.5 31.9 32.1 31.9 31.3 30.0 28.5 [Table A.6.02: Direct Normal Irradiance hourly averaged data for 1 clear day per month across 1986]
Date 7 8 9 10 11 12 13 14 15 16 17 11/1 312 625 938 952 966 981 953 926 899 753 608 9/2 322 347 373 569 766 963 936 910 884 703 523 10/3 304 592 880 905 931 957 926 895 864 584 305 9/4 261 546 832 821 811 801 810 819 829 504 179 12/5 191 501 811 830 849 869 678 487 297 153 10 19/6 110 451 792 817 842 868 834 800 766 372 0 20/7 115 445 775 767 759 751 678 605 533 284 36 13/8 194 515 836 847 859 871 809 748 687 395 104 22/9 288 533 778 810 843 876 834 792 750 467 185 12/10 643 774 906 924 942 961 927 893 859 554 249 11/11 441 536 632 743 854 966 937 908 879 602 325 13/12 745 850 856 971 986 1001 972 943 914 739 565
Modification of Atrium Design to Improve Thermal and Daylighting Performance Appendix
255
A.7 Glossary Appendix
Absorptance: The ratio of absorbed radiant energy to incident radiant energy. Compare
with Reflectance and Transmittance.
Absorption: Incorporation of incident light, heat or noise into a body of an object. The
absorption of heat causes the temperature of the object to rise. Compare with Reflection
and Transmission.
Adiabatic: Unable to pass heat from one side to the other. Process of no heat transfer
between systems Q = 0.
Air Conditioning: Artificial cooling in buildings used to bring interior air to a
temperature and humidity that is comfortable.
Air Flow Rate: A measure of the time it takes for the air in a volume to exchange with
the external air. It has units of air changes per hour (ac/hr).
Air Temperature: The temperature of the ambient air, measured by placing an
uncovered thermometer or other temperature sensing device, in the air. Also known as
Dry Bulb Temperature.
Air-to-Air Heat Transfer: The total thermal heat transfer across the window, not
incorporating radiation. Includes thermal conduction through the glazing and frame, and
convective heat transfers between the glazing and the air on both sides of the window.
Air Velocity: The speed at which air moves in an environment.
Altitude: Arc from horizon to zenith, height above ground of heavenly body.
Angular Selective Glazing: Glazing which has transmittance, reflectance and
absorptance properties that vary with the direction from which radiation is incident.
Useful to reject solar heat gains while transmitting daylight from other directions.
Artificial Cooling: Man-made elements, which extract heat from the environment, for the
provision of thermal comfort.
Artificial Heating: Heat produced by man-made elements, for the provision of thermal
comfort.
Artificial Lighting: Light emitted by man-made elements, for the purpose of providing
illumination that allows building occupants to view and satisfactorily perform tasks.
Atrium: A court, central hall in Roman house. In modern house, a central hall or glassed
in court that may be used as a sitting room, having rooms opening off it, sometimes at
more than 1 level. In public buildings, a skylit central court rising through several storeys
and surrounded by galleries at each level with rooms opening off them.
Azimuth: Arc of horizon around sky in degrees.
Modification of Atrium Design to Improve Thermal and Daylighting Performance Appendix
256
Background Lighting: General illumination not for the purpose of workplace or mood
lighting, nor used for artistic purposes. Compare with Mood Lighting and Workplace
Lighting.
Blackouts: When energy demand out ways energy supply and the grid is overloaded so it
shuts down causing loss of supply of electricity.
Blinds: Shading construction placed on the inside of a window consisting of numerous
parallel parts that are moveable and tiltable. Common types include vertical blinds and
venetian blinds.
Building: Permanent structure to house occupants, usually with roof, walls and apertures.
Building Simulation Tool: A computer tool, which simulates some aspects of a building
and its interaction with the environment. Typical tools simulate the thermal, lighting
and/or energy performance of buildings.
Clerestory Window: A window placed in the upper wall to provide additional daylight
and/or ventilation.
Climate: Prevailing conditions of temperature, humidity, wind, radiation, etc., and
variation in each of these with time.
Comfort: The satisfaction and sense of well being of building occupants, due to
favourable environmental and other conditions.
Comfort band: A range of environmental conditions in which building occupants will be
comfortable. Comfort bands are often expressed in terms of a range of temperatures,
humidities, mean radiant temperatures, or some combination of each.
Commercial Building: Structure for occupants to conduct business within. Eg., Offices,
hospitals, shopping centres, schools, stores, restaurants, accommodation, etc.,
Condensation: The transformation of the water vapour content of the air into water, on
cold surfaces. The beads or drops of water that accumulate on the inside covering of a
building when warm, moist air reaches a point where the temperature no longer permits
the air to sustain the moisture it holds.
Conduction: Heat transfer through a solid material, by the transfer of thermal energy
between adjacent molecules. Heat flows from a region of high temperature to a region of
low temperature. Compare to Convection and Radiation.
Conductivity: Ability of a material to transfer heat by conduction. Generally, metals have
high conductivitys.
Modification of Atrium Design to Improve Thermal and Daylighting Performance Appendix
257
Contrast: The relative level of difference between brightness of adjacent objects in a
field of view. High contrast is experienced when the brightness (luminance) of adjacent
objects is very different.
Convection: Heat transfer by the motion of molecules in a gas or liquid, caused by
density differences and the action of gravity. Has a significant impact on the transfer of
heat from window surfaces to internal and external environments. Compare with
Conduction and Radiation.
Cooling: The act of withdrawing heat from a body, leading to a decrease in its
temperature.
Cross-Ventilation: The flow of air from one side of an enclosure, through the enclosure,
to exit the enclosure on the other side. Useful way of removing excess heat from a warm
building by convection.
Curtains: Suspended cloth used as screen in window usually movable horizontal or
vertical.
Daylight: Light originally emitted by the sun. Daylight consists of sunlight, skylight, and
reflections of sunlight and skylight off other bodies.
Daylight Factor (DF): Measure of the daylight illuminance at a point on a plane,
expressed as the ratio of the illuminance on that plane at that point to the simultaneous
exterior illuminance on a horizontal plane from the whole of an unobstructed sky of
assumed or known luminance distribution. Direct sunlight is excluded from both interior
and exterior values of illuminance.
Daylighting: The process or degree of the illumination of buildings by daylight.
Declination: Angular distance of heavenly body from the celestial equator.
Deflection: Bending of rays of light from a straight line.
Diffuse Light: Light, which is spread in many directions. That light which is transmitted
by translucent materials, and reflected by matt coated materials.
Diffuse Irradiance: Radiation not received directly from the sun. Measured with a
pyranometer and a shadow band.
Direct Irradiance: Radiation received directly from the sun. Also known as Beam
Radiation and Solar Radiation. Measured as the difference between the global and diffuse.
Disability Glare: Reduction of contrast resulting from light scattered within the eye,
which will lead to a decrease in visual performance.
Modification of Atrium Design to Improve Thermal and Daylighting Performance Appendix
258
Discomfort Glare: The sensation of discomfort, distraction and annoyance caused by
high contrast in the field of view, or by saturation of the field of view by the intensity of a
visible light source.
Double Glazing: Two sheets of glass separated by an air space. Commonly used to
improve insulation, reducing the transmission of heat and sound. Compare to Single
Glazing.
Equinox: Sun crosses equator; day and night equal length (autumn and spring).
Emissivity: Amount of radiation emitted from a surface, compared to that, which would
be radiated by a perfect black body. Compare with Low Emittance Coating.
Energy: The ability of matter or radiation to do work.
Energy Consumption: The energy consumed in a building in operations, and in
maintaining comfort conditions for building occupants.
Exfiltration: The uncontrolled motion of interior air to the outside of a building through
cracks in and around windows, doors, walls, roofs and floors. Compare to Infiltration.
Facade: Face of a building towards street or open space.
Fenestration: Arrangement of windows in a building.
Glare: A psycho-physical sensation associated with the visual system, which is perceived
either as discomfort, annoyance, eye fatigue, or a reduction in visual performance.
Compare with Discomfort and Disability Glare and Visual Comfort.
Glass: An inorganic transparent material composed of silica (sand), soda (sodium
carbonate), and lime (calcium carbonate) with small quantities of alumina, boric, or
magnesia oxides.
Glazed Fraction: The fraction of the area of a buildings facade that is comprised of
windows.
Glazing: Glass or plastic panes in a window, door, or skylight. Clear, normal or plain
glazing are all descriptions of flat 3mm glass.
Glazing Strategy: Decisions made about how to glaze a building. Decisions include the
number and sizes of windows installed, framing, shading, glass types and orientation
dependence.
Global Irradiance: Radiation from the whole sky. Measured using a pyranometer.
Heat: Thermal energy flowing between bodies of different temperature. A flow of heat is
associated with a change of temperature or phase of the bodies involved. Heat can flow by
conduction, convection or radiation.
Modification of Atrium Design to Improve Thermal and Daylighting Performance Appendix
259
Heat Capacity: The heat required to raise the temperature of a body. A body with a high
heat capacity requires a large amount of heat to raise its temperature, and so does not
easily or rapidly change its temperature. Determined by the mass and thermal
conductivity of the body.
Heat Gain: The transfer of heat from outside to inside by means of conduction,
convection, and radiation through all surfaces of a building. Compare to Heat Loss.
Heating: The act of providing heat gain to a body, leading to a rise in its temperature.
Heat Loss: The transfer of heat from inside to outside by means of conduction,
convection, and radiation through all surfaces of a building. Compare with Heat Gain.
High-rise Building: Multi-storey structure regarded as too high to walk up and therefore
the need for mechanical vertical transportation.
Horizontal Global Illuminance (HGI): Exterior illuminance on a horizontal plane from
the whole of an unobstructed sky.
Humidity: A measure of how much moisture is in the air. Conditions of high humidity
are considered muggy, clammy or sultry.
Illuminance: Measure of how much light falls on a surface. The luminous flux incident
upon a unit area of the surface due to the entire visible surrounding luminous
environment.
Illumination: Light falling on, and reflected off by, bodies, making them visible.
Infiltration: The uncontrolled motion of external air to the inside of a building through
cracks around windows, doors, walls, roofs and floors. Compare with Exfiltration.
Infra-red: Solar radiation at a wavelength longer than that of visible radiation; not
transfer through glass.
Insulation: Construction materials used for the purpose of protection from heat, noise and
other external factors. Reflects or absorbs heat or noise, such that it does not pass between
the exterior and interior of a building.
Irradiance: See global, diffuse or direct irradiance.
Kelvin: A measure of the absolute temperature.
Laser Cut Panel (LCP): A transparent light deflecting solid material cut in a series of
parallel lines using a laser cutting tool to produce a row of rectangular parallelepipes that
causes total internal reflection of some of the incident light. This TIR causes a fraction of
the light to exit the material in a new direction. The panel is categorised as a bi-directional
glazing. See Angular Selective Glazing.
Modification of Atrium Design to Improve Thermal and Daylighting Performance Appendix
260
Latitude: Angular distance north or south from the equator of a point on the earths
surface.
Light: Radiation at a particular wavelength, which is visible to the human eye and
stimulates sight.
Lighting Control: The control of artificial lighting such that it responds to daylight levels
and occupants needs.
Longitude: Angular distance east or west on the earths surface.
Louvre Window: Window consisting of overlapping strips of glass, wood, metal or other
materials which can be tilted within the window frame for variable window opening
widths. Useful to provide natural cross-ventilation in warm climates.
Low Emittance Coating: A very thin layer coated onto a sheet of glass that is reflective
to thermal radiation and transmissive to visible radiation. Useful to reduce the flow of
heat through windows.
Luminance: The brightness of an object in a particular direction in the field of view.
Defined as the luminous flux received from a given direction, per unit area of the
receiving surface, per unit solid angle.
Luminous Intensity: The luminous flux per unit solid angle in the direction in question.
Expressed in candelas or lumens per steradian.
Luminous efficacy: The quotient of the total luminous flux by the total radiant flux
expressed in lumens per watt. Solar efficacy is 94.2 lm/W.
Lux: Unit of illumination = 1 lumen/square metre
Lumen: Unit of light flux, flux per unit solid angle from a uniform source of 1 candle.
candela = unit of luminous intensity, L. lambert = unit of surface brightness, = emission
of 1 lumen/square centimetre.
Mean Radiant Temperature: The average temperature of surrounding surfaces. Since
these surfaces radiate thermal energy, the mean radiant temperature is a measure of the
total radiant energy received from the surroundings. This measure includes the effect of
solar radiation incident through windows.
Occupant: People who inhabit a building or structure.
Octal: Division or increments by eighths. 1/8 of the whole thing.
Okta: Meteorological unit for amount of octals of cloud cover equivalent to 1/8 of sky.
Orientation: The direction in which an object is facing. Normally expressed in terms of
cardinal co-ordinates (north, east, south, west) or azimuthal co-ordinates (0 to 360
degrees).
Modification of Atrium Design to Improve Thermal and Daylighting Performance Appendix
261
Overhang: A construction placed above and extending beyond a window which shades
the window from external illumination from above.
Picolog: Data logging software used to record and display instrument measurements from
test site.
Power: Time rate of energy transfer. The unit of power is called the Watt.
Prevailing Breeze: Described by the direction and strength of wind or breeze that occurs
most often at a given location.
Pyranometer: Instrument designed to measure the irradiance of the sky.
Radiation: The transfer of heat, in the form of electromagnetic waves, from the surface of
one object to the surface of another. Energy from the sun reaches the earth by radiation.
Ray: A single line or narrow beam of light.
Ray trace: The calculation of the path taken by a ray of light through an optical system.
Reflectance: The ratio of reflected radiant energy to incident radiant energy. Compare
with Absorptance and Transmittance.
Reflected Radiation: Radiation which has been reflected off objects including the
ground, other buildings and vegetation. Building surfaces are described as having high,
low or standard level of reflectivity.
Reflected Component: The portion of the light arriving at the work plane after being
reflected by internal surfaces.
Reflection: Light, heat or noise rebounded by a surface such that it does not enter the
object.
Reflective Glass: Glass coated with thin metallic coating, which reflects a fraction of the
radiation incident upon the glass, thus reducing the transmission of heat and light through
the window.
Refraction: Angle made by deflected ray with perpendicular to surface.
Relative Optical Air Mass: How many times the sunbeams path through the atmosphere
in the direction described by the zenith angle is longer than that in the direction towards
the zenith from a point at sea level. Simplified to be the secant of the solar zenith angle.
Room Index: Ratio of the height of the room to the cross sectional area.
R-Value: A measure of the thermal resistance of a material or assembly to heat transfer. It
is the reciprocal of the U-factor (R=1/U) and is expressed in units of m2K/W. A window
with a high R-value has a large resistance to heat flow and a higher insulating value.
Compare with U-value.
Modification of Atrium Design to Improve Thermal and Daylighting Performance Appendix
262
Secondary Heat Gain: Heat gain due to radiation absorption in glazing materials, and
subsequent reradiation and convection of some of this absorbed heat into the building.
Glass heats up as it absorbs radiation, and can become significantly hotter than the interior
of the room. Heat from the interior surface of the glass is then convected and radiated to
the interior of the room.
Semi-infinite: Two mirrors facing each other creating an optical infinite depth.
Shade: An opaque body placed on or near a window, which provides the function of
shading.
Shade Angle: Angle measured from the normal to a window to the furthest edge of a
shade. Indication of how much of the external environment from which the window is
shaded. A shade angle of 90° implies no shading.
Shading Coefficient: A measure of the ability of a window or skylight to transmit solar
heat, relative to that ability for a 3 mm clear, double-strength, single glass window. It is
equal to the Solar Heat Gain Coefficient multiplied by 1.15, and is expressed as a number
without units between 0 and 1. The lower a windows SC, the less solar heat it transmits,
and the greater is its shading ability.
Sine: Ratio of length of arc to radius. From the Latin curve and Arabic bosom.
Single Glazing: Single sheet of glass in a window.
Sky: The apparent arch or vault above horizon whether covered by with cloud or clear.
Skylight: Framework and glass fitted to a small opening in a roof or ceiling to provide
daylight to a room.
Sky Component (SC): The portion of light, which arrives at the work plane without
being reflected. See reflected component.
Solar Heat Gain Coefficient (SHGC): The fraction of incident radiation that is admitted
through a window or skylight. The transmitted energy may be both directly transmitted,
and absorbed and subsequently released inward (secondary heat gain). The SHGC has
replaced the shading coefficient as the standard indicator of a windows inherent shading
ability. It is expressed as a number without units between 0 and 1. The lower a windows
SHGC, the less solar heat it transmits, and the greater is its shading ability. Also known as
Total Solar Energy Transmittance (TSET). Compare with Shading Coefficient.
Solstice: Sun farthest from equator; either winter or summer. Compare to Equinox.
Spectrally Selective Glass: Glass tinted or coated with specially designed materials such
that it is transmissive to some forms of radiation and non-transmissive to others.
Modification of Atrium Design to Improve Thermal and Daylighting Performance Appendix
263
Spectrally selective windows have a higher transmission to light than heat. Compare with
Spectrum.
Spectrum: The components of a source of electromagnetic radiation, described in terms
of the amount of radiation emitted at a range of different wavelengths. Determines the
colour of a light source, and the efficiency of a light source in providing illumination, as
opposed to heat. Visible light, ultra-violet light and infra-red thermal radiation occupy
different regions of the electromagnetic spectrum.
Stratification: Layers of fluid where hot will rise and cold will sink.
Temperature Gradient: A change in temperature with a change in position. Defined as
the difference in temperature between two regions divided by the separation of the
regions. Heat transfer by conduction occurs where a temperature gradient exists across an
object.
Thermal Break: An element of high thermal resistance placed between elements of low
thermal resistance in order to slow the conduction of heat through an object.
Thermal Comfort: A condition in which current thermal conditions provide occupants
with comfort. It is influenced by many factors including air temperature, mean radiant
temperature, air humidity and air velocity.
Thermal Energy: That form of energy related to the temperature of a body, and to the
heat transferred between objects.
Thermal mass: Components of a building with high heat capacity, which are able to
absorb and store heat gains through the day and release the heat later as the building space
cools.
Thermal Radiation: Radiation emitted by objects due to their stored thermal energy. An
object emits more thermal radiation if it is at a higher temperature.
Thermal Resistance: A measure of the inability of a body to transfer heat by conduction.
Generally, plastics and organic compounds have high thermal resistance. Compare with
Conductivity.
Thermal Stratification: The arrangement of a fluid into vertical layers depending upon
its temperature gradient.
Tinted Glass: Glass coloured by incorporating some form of minerals into the material
on the energy that is incident upon the glass. Offers lower transmittance of heat and light,
by absorbing a fraction of the energy that is incident upon the glass.
Total Internal Reflection (TIR): Reflection that does not transmit from medium of
higher refractive index to lower refractive index due to angle of incidence.
Modification of Atrium Design to Improve Thermal and Daylighting Performance Appendix
264
Translucent: Allowing the transmission of light but not view. Light is diffusely scattered
upon transmission. Compare with Transparent.
Transmission: Passing heat, light or noise through an object from one side to another.
Compare with Absorption and Reflection.
Transmittance: The ratio of transmitted radiant energy to incident radiant energy. Can be
expressed as visible transmittance, solar transmittance or heat transmittance, for the
respective different forms of radiant energy. Compare with Absorptance and Reflectance.
Transparent: Allowing the transmission of light and view. Light is not scattered or
redirected upon transmission. Compare with Translucent.
Turbidity: Thick, unclear, disturbed sky with lots of particles.
Ultraviolet: Solar radiation of a wavelength shorter than visible; burns skin.
U-Value (U-factor): A measure of the rate of heat transfer through a material or
assembly. It is expressed in units of W/m2K. Common use of U-factor is to describe the
rate of non-solar heat loss or gain through a window or skylight. Lower window U-factors
have greater resistance to heat flow and better insulating value. Compare with R-value.
Ventilation: The supply, movement or removal of air, which can be either mechanically
or naturally induced.
View: A visible scene, seen through a window. It is usually considered an important
function of a window.
Vision: Act or faculty of seeing, sight.
Visual Comfort: A condition in which the lit environment provides observers with
comfort. A combination of suitable illuminance level and luminance distribution,
adequate colour rendering and the absence of excessive contrast and glare. Conditions for
visual comfort may differ depending upon age and gender of the observer. Compare to
Thermal Comfort.
Well Index (WI): The ratio of the height of an atrium well to its cross sectional area.
Window: A glazed opening in a wall of a building. Complete body includes glazing,
frames, sash and any moving parts.
Work Height: Height at which tasks are performed on a bench or table.
Zenith: Point of sky directly above standing observer.
Modification of Atrium Design to Improve Thermal and Daylighting Performance References
265
REFERENCES
AGO; (1999); Executive Summary Report of the Australian Commercial Building Sector
Greenhouse Gas Emissions 1990-2010; Australian Greenhouse Office; Canberra.
www.greenhouse.gov.au
Aizlewood M.; (1995);The Daylighting of Atria: A Critical Review; ASHRAE
Technical Data Bulletin Vol. 11, No. 3 Aspects of Atrium Design.
Aizlewood M.E., Isaac K.A., Littlefair P.J.; (1996); A Scale Model Study of Daylighting
in Atrium Buildings.
Allard F. and Inard C.; (1995); Natural and Mixed Convection in Rooms: Prediction of
Thermal Stratification and Heat Transfer by Zonal Models Aspects in Atrium Design, an
ASHRAE publication.
Analog Devices; (1978); Data Acquisition Products Catalog; pp251; Analog Devices
Inc.
Andersen K.T.; (1998); Design of Natural Ventilation by Thermal Buoyancy with
Temperature Stratification; Roomvent 98; Sweden.
Andersen K.T.; (1995); Natural Ventilation in Atria; ASHRAE Atrium Symposium,
ASHRAE Technical Data Bulletin Vol. 11, No. 3, p30-38.
Apian-Bennewitz P., Goller M.; (1998); Computer-Oriented Building Design: Advances
in Daylighting and Thermal Simulation Tools; Renewable Energy Vol. 14 no 1-4 pp351-
356.
Aschehoug, O.; (1992); Daylight in glazed spaces; Building Research and Information
Vol.20 No.4.
Modification of Atrium Design to Improve Thermal and Daylighting Performance References
266
ASHRAE; (1995); CFD Analysis of Flow and Temperature Fields in Atrium with
Ceiling Height of 130m; ASHRAE Technical Data Bulletin Vol. 11 No 3 Aspects of
Atrium Design.
Atif M.R., Boyer L.L.; (1991); Effective Top-Glazing and Internal Wall Area for
Efficient Daylighting in Atria; Solar World Conference Proceeding Vol.3(1).
Atif M.R., Claridge D.E., Boyer L.L., Degelman L.O.; (1995); Atrium Buildings:
Thermal Performance and Climatic Factors; ASHRAE transaction.
Atif M.; (1996); Improving energy costs and the indoor environment of Canadian atrium
buildings; Construction Innovation Volume 1, No. 3.
Australian Renewable Energy; (2000); Passive Solar Architecture and energy efficient
houses; http://renewable.greenhouse.gov.au/home/passive_solar.html
Australian Standard 1680.2; (1990); Interior Lighting: Recommendations for specific
tasks and interiors; IHS Australian Standards Online.
Australian Window Council Inc.; (2000); Window Energy Rating Scheme 2; unpublished.
Awbi H.B.; (1996); Air Movement in Naturally - Ventilated Buildings; WREC 96.
Aynsley R., Edmonds I.; (1997); Daylighting in the Tropics; conference paper.
Baker N., Steemers K.; (1996); LT Method 3.0 - a strategic energy-design tool for
Southern Europe; Energy and Buildings Vol.23 p251-256.
Baker N., Fanchiotti A., Steemers K.; (1993); Daylight in Architecture - A European
Reference Book; Commission of European Communities; London.
Baker N.; Atrium Design Guidelines; University of Cambridge; UK.
Modification of Atrium Design to Improve Thermal and Daylighting Performance References
267
Bell J.M., Lim B.P., Greenup P.J.; (2000); Design Tools to improve Sustainability;
Sustainable Millennium Conference; Brisbane.
Bellia L., Cesarano A., Sibilio S.; (1994); Daylighting contribution in interior lighting:
Experimental verification of software simulation results; Lighting Research and
Technology vol. 26 p 99-105.
Beltran L.O., Lee E.S., Papamichael K.M., Selkowitz S.E.; (1994); The Design and
Evaluation of 3 Advanced Daylighting Systems: Light Shelves, Light Pipes and
Skylights; LBL-34458 Uni of California; USA.
Birrer W.A.; (1999); Economical Energy Efficient Large Scale Office Buildings;
PLEA 99 Conference Proceedings Vol.1, p7-14; Brisbane.
Blewitt C., Arden P., (1998); Radiosity Based Technology and the Lighting Design;
43rd Annual IES Lighting Conference 1998; Brisbane Australia.
Boubekri M. and Anninos W.Y.; (1996); Daylight Efficiency of an Atrium: Part 1 - The
Four-Sided Type; Architectural Science Review Vol.39, p75-81.
Boubekri M. and Anninos W.Y.; (1996); Daylight Efficiency of an Atrium: Part 2 - The
Three-Sided Type; Architectural Science Review Vol.39, p83-88.
Boubekri M. and Anninos W.Y.; (1996); Daylight Efficiency of an Atrium: Part 3 - The
Four-Sided Type; Architectural Science Review Vol.39, p179-186.
Boubekri M. (1995); The Effect of the Cover and Reflective Properties of A Four-Sided
Atrium on the Behaviour of Light; Architectural Science Review Vol.38.
Britannica Online Encyclopedia; (2000); www.britannica.com
Bystrica B.; (1999); Integrated Performance Assessment of Glazed Atrium Space;
Annual CIB W67 Meeting and Workshop; http://www.strathclyde.ac.uk; Slovakia.
Modification of Atrium Design to Improve Thermal and Daylighting Performance References
268
Carmody J., Selkowitz S., Heschong L.; (1996); Residential Windows; W.W. Norton &
Co.; USA.
Chastain J.P., Colliver D.G.; (1989); Influence of Temperature Stratification on Pressure
Differences Resulting from the Infiltration Stack Effect; ASHRAE Transactions; USA.
CIE Technical Report 110; (1994); Spatial distribution of daylight - Luminance
distribution of various reference skies.
Close J.; (1996); Optimising daylighting in high-rise commercial developments in SE
Asia and the use of computer programmes as a design tool; WREC.
Cooke G.; (2000); Freshen Up Your Life - Detox Your World; The Sunday Mail
23/7/00.
Cowling I., Coyne S., Reitsema N., Pejski P.; (1998); How Good is my Light Meter;
Lighting Volume 18, No 1.
Delsante A.E., Edmonds I.R., Reppel J.; (1997); Angular-Selective Glazing for Radiant
Heat Control in Buildings: Modelling Results; ANZSES Solar 97.
Drummond A.J. and Roche J.J.; (1965); Corrections to be Applied to Measurements
Made with Eppley Spectral Radiometers When used with Schott Colored Glass Filters;
Journal of Applied Meteorology Volume 4 December 1965 p741-744.
Eastop T.D., Croft D.R.; (1995); Energy Efficiency for Engineers and Technologists
Longman Group Ltd, England (Chapter 3,5,7)
Edmonds I.R; (1991); United States Patent: Transparent light deflecting panel for
daylighting rooms; No. 4989952.
Edmonds I.; (1993); Performance of laser cut light deflecting panels in daylighting
applications. Solar Energy Materials & Solar Cells Vol.29(1).
Modification of Atrium Design to Improve Thermal and Daylighting Performance References
269
Edmonds I.R; (1995); Transmission of light through right-angle corners in hollow light
guides; Applied Optics Vol. 34(28) p6522-26.
Edmonds I.R., Moore G.I., Smith G.B., Swift P.D.; (1995); Daylighting enhancement
with light pipes coupled to laser-cut light-deflecting panels; Lighting Research
Technology Vol. 27(1) p27-35.
Edmonds I., Jardine P.A., Rutledge G.; (1996); Daylighting with angular-selective
skylights: Predicted performance; Lighting Research Technology Vol.28(3) p122-130.
Edmonds I.R., Pearce D.J., Reppel J.; (1997); Improved winter performance of
greenhouses at high latitudes using a light deflecting double glazing; North Sun 97.
Edmonds I., Reppel J., Jardine P.; (1997); Extractors and Emitters for Light Distribution
from hollow light guides; Lighting Research Technology Vol.29(1) p23-32.
Edmonds I., Close J., Lim W., Mabb J.; (1998a); Daylighting Street Level Offices in
City Buildings with Light Deflecting Panels; Architectural Science Review Vol. 41,
p173-184.
Edmonds I., Greenup P., Mabb J.; (1998b); Performance of Advanced Daylighting
Systems; Proceedings of Solar 98; The 36th Conference of the Australian and New
Zealand Solar Energy Society; Auckland.
Egan M.D.; (1983); Concepts in Architectural Lighting; McGraw-Hill Book Co.; USA.
Enai M., Mori T., Yamamoto S., Aratani N.; (1996); A Simplified Numerical Simulation
for Estimating the Temperature Distribution in Atrium Spaces; Indoor Air 96 : The 7th
international conference.
Fowler H.W. & F.G.; (1982); The Concise Oxford Dictionary; Oxford University Press;
UK.
Modification of Atrium Design to Improve Thermal and Daylighting Performance References
270
Fritschen L.J., Gay L.W.; (1979); Environmental Instrumentation; Pringer-Verlag;
USA.
Gordon H.T., Kammerud R., Hestnes A.G.; (1991); International Atrium Research;
Solar World Conference Proceedings 3(1).
Goulding J.R., Lewis J.O., Steemers T.C.; (1992); Energy Conscious Design; London;
Batsford.
Greenup P.; (1995); Examination of thermal transmission of glass by solar calorimetry;
Undergraduate Physics Project Report; QUT.
Hardy A., Perrin F.; (1932); The Principles of Optics; McGraw-Hill Book Co. USA.
Hathaway W.E.; (1994); A Study Into the Effects of Types of Lighting on Children - A
Case of Daylight Robbery; IRC Internal Report No. 659;
Herzog T.; (1996); Solar Energy in Architecture and Urban Planning; Prestel Verlag;
Germany.
Helms R.N., Belcher M.C.; (1991); Lighting for energy-efficient luminous
environments; Prentice-Hall; Englewood Cliffs, N.J.
Holman P.J.; (1997); "Heat Transfer 8th edition; McGraw-Hill Companies; New York.
Humphreys M.A.; (1977); The Optimum Diameter for a Globe Thermometer for use
Indoors; Annals of Occupational Hygiene Vol. 20 p135-140.
Hyde R., Docherty M.; (1997); Thermal Performance of Housing in the Hot-Humid
Tropics of Australia Architectural Science Review Vol.40 p105-112.
International Energy Agency; (2000); Daylighting buildings in the 21st Century;
IES Lighting Handbook 8th Edition; (1995); Chapter 8 Daylighting pp359-381; USA.
Modification of Atrium Design to Improve Thermal and Daylighting Performance References
271
Iyer-Raniga U.; (1994); Daylighting in Atrium Spaces; Architectural Science Review
Vol.37 December p195-208.
Johnson R., Arasteh D., Connell D., Selkowitz S.; (1985); The Effect of daylighting
strategies on building cooling loads and overall energy performance; ASHRAE
Conference Lawrence Berkeley Laboratory, Uni of California.
Jones J., Luther M., Navvab M.; (1991); A comparative analysis for two Geometrically
Different Atria; Solar World Conference Proceeding Vol.3(1) Denver Colorado.
Jones J.R., Luther M.B., (1993); A Summary of Analytical Methods and Case Study
Monitoring of Atria, ASHRAE Winter Meeting, ASHRAE Transactions
Juluria Y.; (1980); Natural Convection Heat and Mass Transfer; Pergamon Press,
England. Chapter 6: Natural Convection in Stratified Media p173-208
Kato S., Murakami S., Shoya S., Hanyu F., Zeng J.; (1995); CFD Analysis of Flow and
Temperature Fields in Atrium with Ceiling Height of 130m; Aspects of Atrium Design
Technical Data Bulletin; p150-153; ASHRAE; USA.
Kainlauri E.; (1991); Comparative studies of five atriums on the effects of orientation,
exposure and design on daylighting, temperature, and stratification of air; Solar World
Conference Proceeding Vol.3(1).
Kittler R., Perez R., Darula S.; (1997); Clear Sky Luminance Patterns: Analysis,
Comparison and Modelling; Architectural Science Review Vol.40 p89-96.
Kolsaker K., Frydenlund F.; (1995); Simplified Models for Air Stratification and
Thermal Comfort in Atria; ASHRAE Technical Data Bulletin Vol. 11 No 3 Aspects of
Atrium Design Collection of Papers from ASHRAE Meeting at San Diego, Cal USA.
Kotake S., Hijikata H.; (1993); Numerical Simulations of Heat Transfer and Fluid Flow
on a Personal Computer.
Modification of Atrium Design to Improve Thermal and Daylighting Performance References
272
Kristensen P.E., Esbensen T.; (1989); Passive Solar Energy and Natural Daylight in
Office Buildings; Solar World Conference Proceeding Vol.3(1).
Kristl Z., Krainer A.; (1999); Light Wells in Residential Buildings as a Complementary
Daylight Source; Solar Energy Vol.65 No.3 pp197-206.
Kusuda T.; (1978); Simplified Analysis of Thermal and Lighting Characteristics of
Windows: Two Case Studies; National Bureau of Standards Building Science Series 109,
US Government Printing Office.
Lim B.L., Rao K.R., (1979); Environmental Factors in the Design of Building
Fenestration; Architectural Science Series. Applied Science Publishers Ltd, London.
Littlefair PJ.; (1994); A Comparison of sky luminance models with measured data from
Garston, United Kingdom; Solar Energy vol.53.no.4 p315-322.
Liu A., Navvab M., Jones J.; (1991); Geometric Shape Index for Daylight Distribution
Variations in Atrium Spaces. Solar World Conference Proceeding Vol.3(1).
Luther M.B.; (1998); Simulating Solar and Luminous Components for a Glazing
System;
Luther M.B., Li L.; (1996). Exploring Thermal Processes in an Atrium; Solar 97
Conference Proceedings 35th Annual Conference Australian and New Zealand Solar
Energy Society, Paper 62.
Luther M., Smith G.E.; (1995); Atrium Skylights: Strategies for Optimal Performance;
Proceedings of Solar 95 Australian and New Zealand Solar Energy Society Conference.
Mabb J.A.; (1997); Daylight Penetration in an Atrium Building and Adjoining Spaces;
QUT Undergraduate Thesis; Australia.
Modification of Atrium Design to Improve Thermal and Daylighting Performance References
273
Mabb J.A.; (1999); Modified Atrium Design to Improve Thermal Performance; Solar
99.
Mardaljevic J.; (1995); Validation of lighting simulation program under real sky
conditions; Lighting Research and Technology, Vol. 27(4) p 181-188.
Matusiak B., Littlefair P.; (1998a); Daylighting strategies for an infinite long atrium: an
experimental evaluation.
Matusiak B.; (1998b); Daylighting in linear atrium buildings at high latitudes; PhD
Thesis; Norwegian University of Science and Technology.
Merriam-Webster Online Collegiate Dictionary; (2001); Merriam-Webster Incorporated;
www.m-w.com.
Middleton; (1994); Instruction manual for Middleton EP08 & EP08-E Pyranometer;
version 2.3; Carter-Scott Design.
Moore F.; (1991); Concepts and practice of architectural daylighting; Van Nostrand
Reinhold; USA.
Moore I., Bell J., Willrath H.; (1998); Simplified Modelling of Window Glazing
Performance in Conditioned Buildings; Solar 98 ANZSES.
Moore I., Bell J.M.; (1999); A visual simulation tool for evaluating daylighting impacts
of glazing in buildings; Solar 99.
Moser A., Off F., Schalin A., Yuan X.; (1995); Numerical Modelling of Heat Transfer
by Radiation and Convection in an Atrium with Thermal Inertia; ASHRAE Technical
Data Bulletin Vol. 11 No 3 Aspects of Atrium Design; USA.
Moser A., Off F., Schalin A., Yuan X.; (1996); Numerical Modelling of Heat Transfer
by Radiation and Convection in an Atrium with Thermal Inertia; 5th International
Conference on Air Distribution in Rooms.
Modification of Atrium Design to Improve Thermal and Daylighting Performance References
274
Murdock J.; (1985); Illumination Engineering; Macmillian, New York.
National Geographic; (1999); National Geographic Atlas of the World.
http://plasma.nationalgeographic.com/mapmachine/plates.html
Navvab M.; (1990); Atrium Chapter; LD+A May 1990.
Navvab M.; (1989); Daylighting Techniques - Software for daylighting prediction and
design; Architectural Lighting.
Neilsen PV.; (1995); Airflow in a World Exposition Pavilion Studied by Scale-Model
Experiments and Computational Fluid Dynamics; ASHRAE Technical Data Bulletin
Vol. 11 No 3 Aspects of Atrium Design; USA.
Neumann D.; (1995); The Centurys Triumph in Lighting: The Luxfer Prism Companies
and their Contribution to Early Modern Architecture; Journal of the Society of
Architectural Historians.
Nicklas M., Bailey G.; (1996); Daylit students shine brighter; SunWorld Vol.20 No. 3
Noble D., Barthakur A.; (1998); Case Study Analysis of the Bradbury Building Atrium:
Correlating Measured Thermal Data with a Computational Fluid Dynamics Model;
Architectural Science Review Vol. 41 pp185-190.
Off F., Moser A., Suter P.; (1996); Transient Numerical Modelling of Heat Transfer by
Radiation and Convection in Atrium with Thermal Inertia; Roomvent 96; Tokyo.
Ozdamar M.; (1997); Daylighting in Atrium Spaces: A Commentary Bibliography;
www.art.bilkent.edu.tr/iaed/cb/Ozdamar.html.
Perez R., Ineichen P., Seals R., Michalsky J., Stewart R.; (1990); Modeling Daylight
Availability and Irradiance Components from Direct and Global Irradiance; Solar Energy
Vol. 44, No. 5, pp.271-289.
Modification of Atrium Design to Improve Thermal and Daylighting Performance References
275
Physibel; (1999); CAPSOL Version 3.0 - computer program to calculate multizonal
transient heat transfer; Holland.
Pirsel L.; (1991); New formulae for relative optical air mass determination in sky
models; Lighting Research Technology Vol.23(1) p85-88.
QUT Daylight Research Group; (1996); Mt-Cootha Herbarium Laser Cut Panel
Skylight; Case Study Report QUT.
Reid C.R.; (1989); Ray Tracing System; QUT Thesis Faculty of Engineering Final Year
Project;
Reppel J., Edmonds I.R.; (1998); Angular-selective glazing for radiant heat control in
buildings: Theory; Solar Energy Vol. 62(3) p245-53.
Roh H., Udagawa M., Ishida K.; (1998); Heat Load Simulation of Large Spaces
considering vertical air Temperature Distribution; EuroSun 98 II.2.23.
Ruck N.C.; (1982); Beaming Daylight into Deep Rooms - use of a Fresnel lens panel;
Cl/SfB number 11.
Ruck N.C.; (1989); Building Design and Human Performance; Chapter 3 Luminous
Environment; Van Nostrand Reinhold; USA.
Said M., MacDonald R.A., Durrant G.C.; (1996); Measurement of thermal stratification
in large single-cell buildings; Energy and Buildings Vol. 24 pp 105-115; USA.
Saxon R.; (1983); Atrium Buildings Development and Design. Van Nostrand Reinhold
Publishers, Chapter 8.
Schild P.G., Tjelflaat P.O., Aiulfi D.; (1995); Guidelines for CFD Modelling of Atria;
ASHRAE Technical Data Bulletin Vol. 11 No 3 Aspects of Atrium Design; USA.
Modification of Atrium Design to Improve Thermal and Daylighting Performance References
276
Serway R.A.; (1992); Physics for Scientists and Engineers with Modern Physics 3rd ed.
updated version; Saunders College Publishing; USA.
Sharples P., Shea A.D.; (1999); Roof obstructions and daylight levels in atria: a model
study under real skies; Unpublished.
SINTEF. Passive and Hybrid Solar Commercial Buildings IEA Task 11. Four Norwegian
Case Studies.
Standaert P.; (1999); CAPSOL; Physibel; Netherlands.
Steemers T.; (1994); Daylighting in Buildings; European Commission; Ireland.
Szerman M.; (1992) Daylighting in adjacent rooms connected to an atrium by artificial
sky measurements. IEA Task 11 Project.
Szokolay S.V.; (1975); Solar Energy and Building Ed. 2; Edward Arnold Pty; Australia.
Szokolay S.V.; (1996); Solar Geometry; PLEA; University of Queensland; Australia.
Thyholt M., Aschehoug O., Bryn I., Monsen P.; (1998); Glazed Atria Revisited - Energy
Savers or Wasters; EuroSun 98 II.2.2.
Togari S., Arai Y., Miura K.; (1993); A simplified model for predicting vertical
temperature distribution in a large space; ASHRAE Transactions 93.
Travers M., Edmonds IR.; (1996); Mirror Light pipes with rotating laser cut light
deflecting panels for daylighting and heating buildings.
Travers M; (1998); Daylighting via hollow mirror light guides; QUT Masters Thesis.
Tregenza P.R.; (1983); The Monte Carlo method in lighting calculations; Lighting
Research Technology, Vol.15(4) p163-170.
Modification of Atrium Design to Improve Thermal and Daylighting Performance References
277
Tregenza P.R.; (1994); Daylighting computation: Radiosity method using triangular
patches; Lighting Research Technology Vol.26(1) p1-7.
Tregenza P.R.; (1997); Daylight attenuation in top-lit atria; Lighting Research
Technology, Vol.29 (3) p151-157.
Wall M.; (1995); A Design Tool for Glazed Spaces - Part 1: Description;
ASHRAE Technical Data Bulletin Vol. 11 No 3 Aspects of Atrium Design.
Whitehead L.A; (1992); Simplified ray-tracing in cylindrical systems; Applied Optics
Vol. 21 No. 19.
Willrath H.; (1998); The Thermal Performance of Windows in Buildings Operating in
the Brisbane Climates; QUT.
Wolring Y.L.; (1999); Comparison of the thermal performance of a scale model atrium
to a computational simulation of an atrium; Group Report QUT.
Wright J.C., Letherman K.M.; (1998); Illuminance in atria: Review of prediction
methods; Lighting Res. Technol 30(1) 1-11.
Yoshino H., Kuniaki I., Aozasa K.; (1995); Trends in Thermal Environmental Design of
Atrium Building in Japan; ASHRAE Technical Data Bulletin Vol. 11 No 3 Aspects of
Atrium Design; USA.
Zeitler K.D.; (1987); Algorithms for Ray Tracing; University of Waterloo Thesis for
Masters of Mathematics in Computer Science.
Zumbo S.; (1997); Atrium Buildings: Daylight; QUT Thesis.


![ATRIUM - CDVI UK · 2019. 9. 9. · cdvigroup.com 3 EN ATRIUM Software V4.31 INSTALLATION MANUAL EN ATRIUM Software V4.31 INSTALLATION MANUAL 1] PRODUCT PRESENTATION The ATRIUM software](https://img.pdfslide.us/doc/110x75/60a6438c02c0700eda5e86c2/atrium-cdvi-uk-2019-9-9-3-en-atrium-software-v431-installation-manual-en.jpg)