Embed Size (px)
Citation preview
Modern Data Center needs 10th of April, 2014
Andrew Sedman, RCDD
Head of Training and Technical Service – R&M
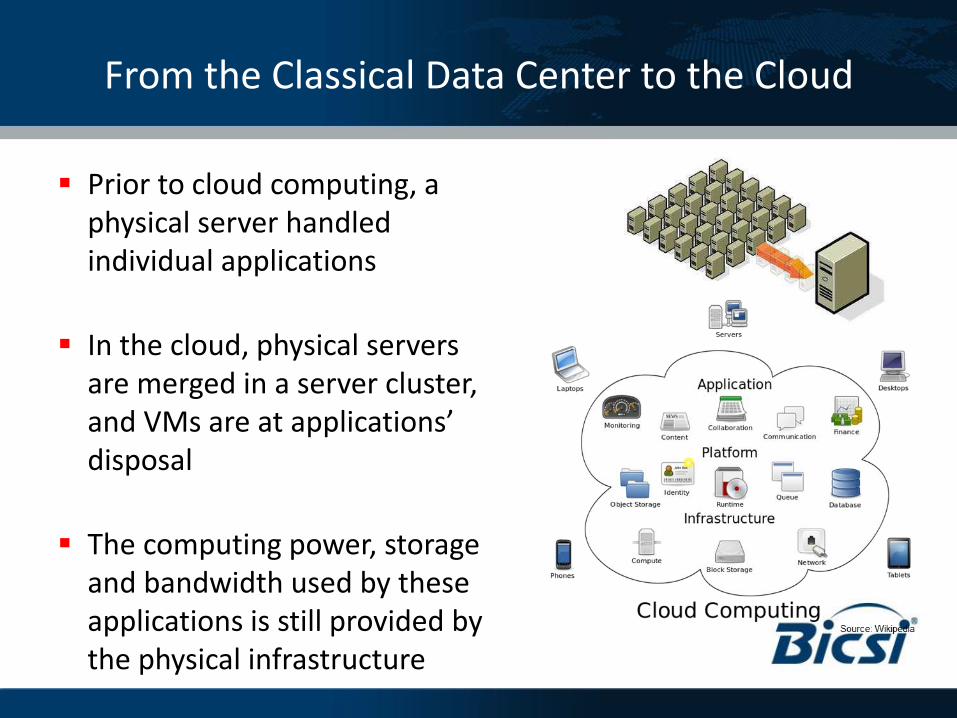
From the Classical Data Center to the Cloud
Prior to cloud computing, a physical server handled individual applications
In the cloud, physical servers are merged in a server cluster, and VMs are at applications’ disposal
The computing power, storage and bandwidth used by these applications is still provided by the physical infrastructure
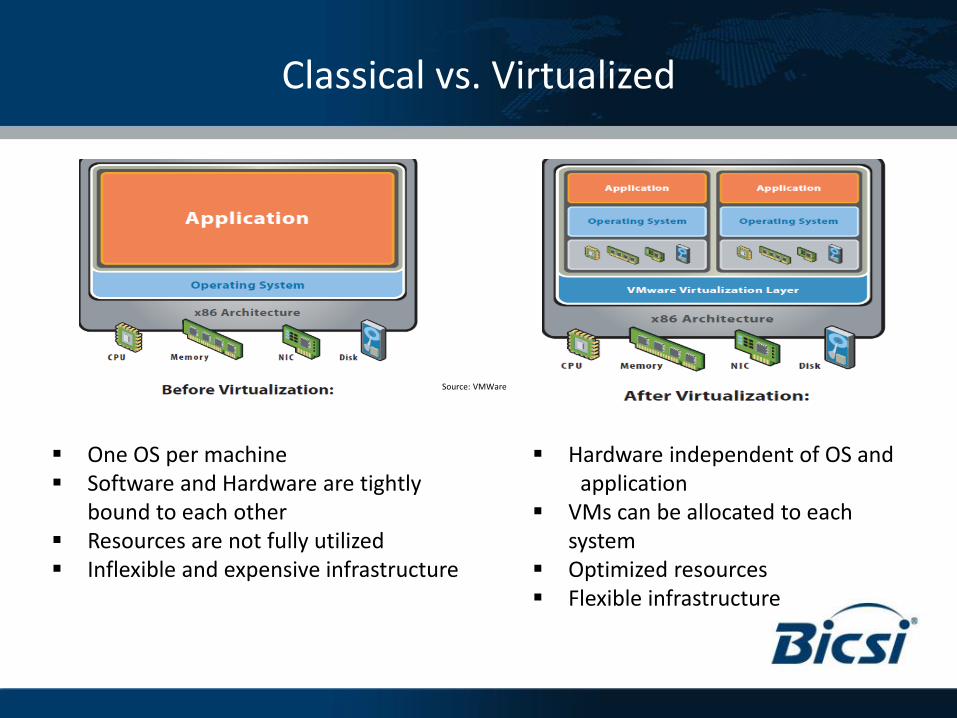
One OS per machine Software and Hardware are tightly
bound to each other Resources are not fully utilized Inflexible and expensive infrastructure
Hardware independent of OS and application
VMs can be allocated to each system
Optimized resources Flexible infrastructure
Classical vs. Virtualized
Source: VMWare
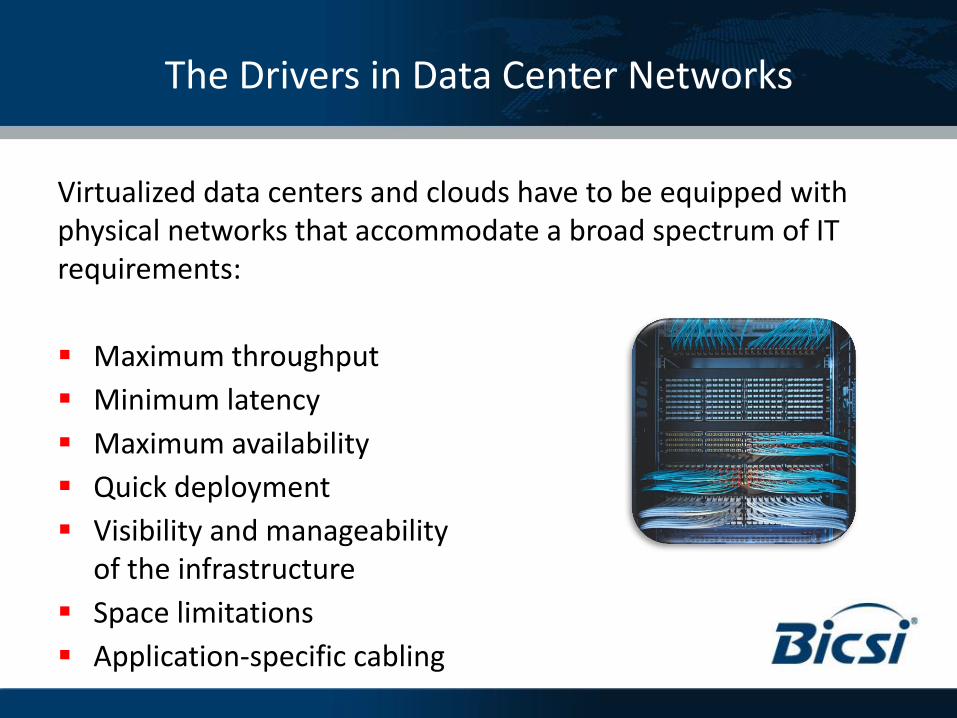
The Drivers in Data Center Networks
Virtualized data centers and clouds have to be equipped with physical networks that accommodate a broad spectrum of IT requirements:
Maximum throughput
Minimum latency
Maximum availability
Quick deployment
Visibility and manageability of the infrastructure
Space limitations
Application-specific cabling
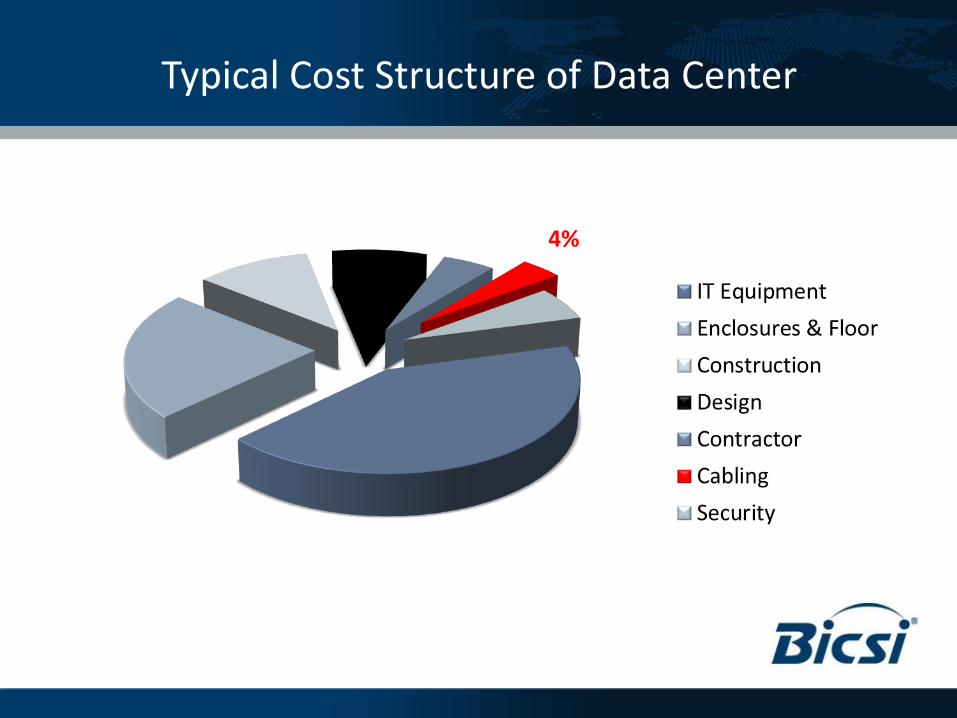
Typical Cost Structure of Data Center
4%
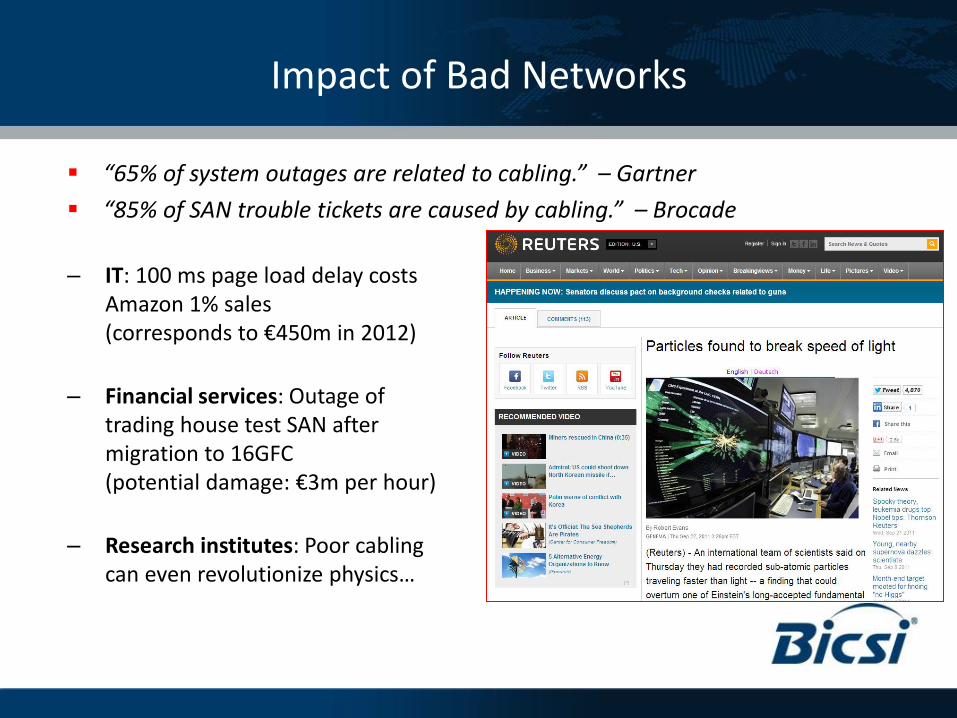
Impact of Bad Networks
“65% of system outages are related to cabling.” – Gartner
“85% of SAN trouble tickets are caused by cabling.” – Brocade
– IT: 100 ms page load delay costs Amazon 1% sales (corresponds to €450m in 2012)
– Financial services: Outage of trading house test SAN after migration to 16GFC (potential damage: €3m per hour)
– Research institutes: Poor cabling can even revolutionize physics…
Impact of Bad Networks
Cabling is about 4% of the overall network
cost
But these 4% can keep the remaining 96%
from operating properly and efficiently
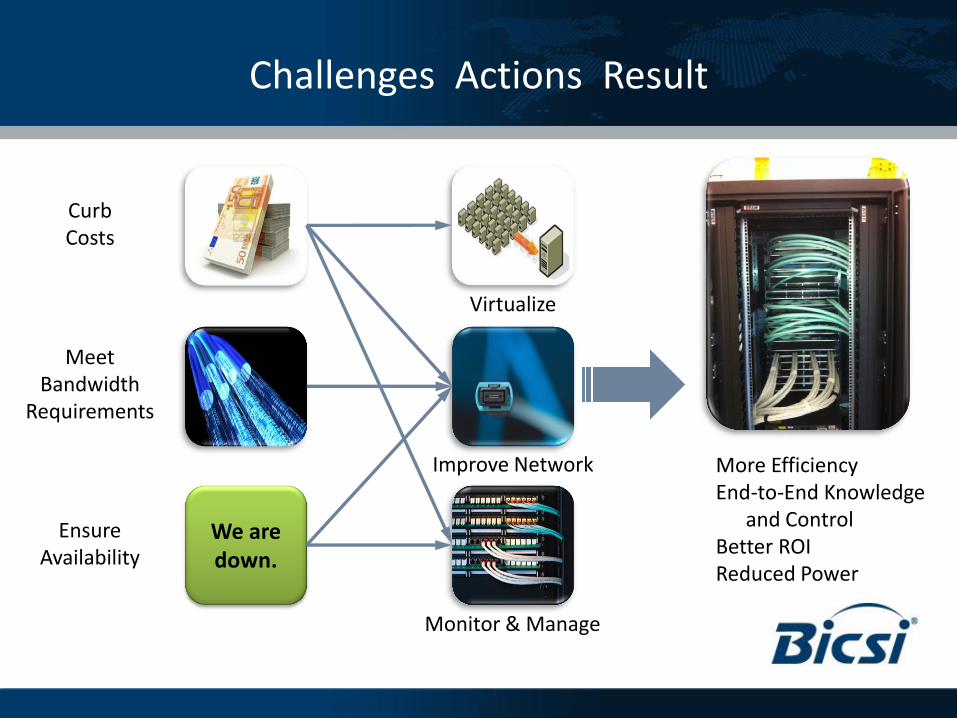
Challenges Actions Result
We are down.
Curb Costs
Meet Bandwidth
Requirements
Ensure Availability
Improve Network
Virtualize
Monitor & Manage
More Efficiency End-to-End Knowledge
and Control Better ROI Reduced Power
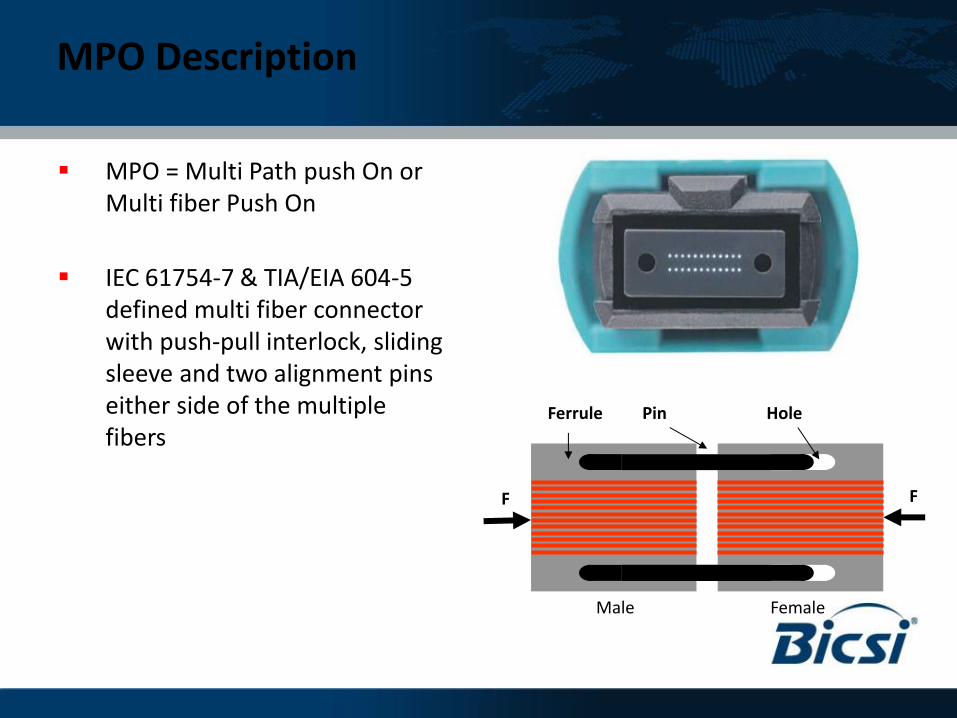
MPO = Multi Path push On or Multi fiber Push On
IEC 61754-7 & TIA/EIA 604-5 defined multi fiber connector with push-pull interlock, sliding sleeve and two alignment pins either side of the multiple fibers
Ferrule Pin Hole
F F
Male Female
MPO Description
MPO Description
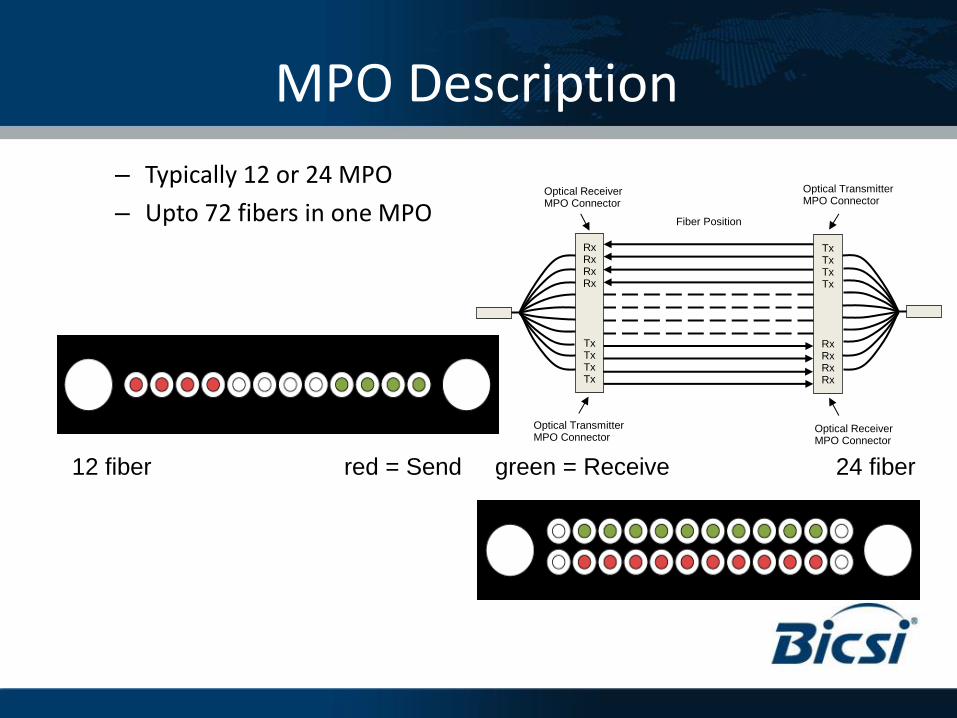
– Typically 12 or 24 MPO
– Upto 72 fibers in one MPO
12 fiber red = Send green = Receive 24 fiber
Rx Rx Rx Rx
Tx Tx Tx Tx
Fiber Position
Optical Receiver MPO Connector
Optical Transmitter MPO Connector
Tx Tx Tx Tx
Rx Rx Rx Rx
Optical Receiver MPO Connector
Optical Transmitter MPO Connector
MPO Description
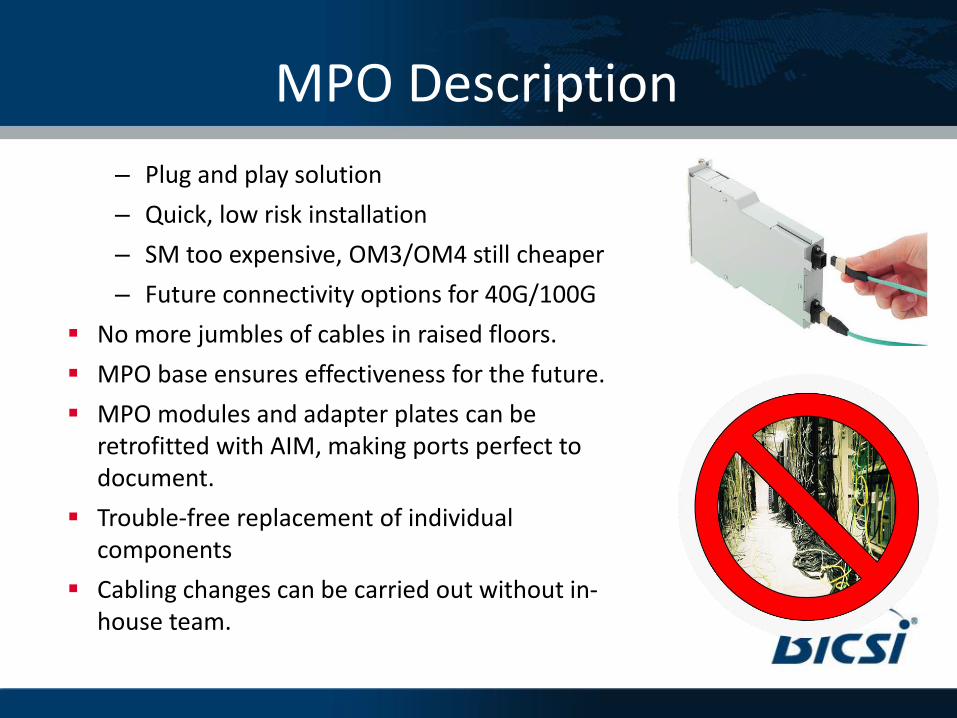
– Plug and play solution
– Quick, low risk installation
– SM too expensive, OM3/OM4 still cheaper
– Future connectivity options for 40G/100G
No more jumbles of cables in raised floors.
MPO base ensures effectiveness for the future.
MPO modules and adapter plates can be retrofitted with AIM, making ports perfect to document.
Trouble-free replacement of individual components
Cabling changes can be carried out without in-house team.
Quality requirements
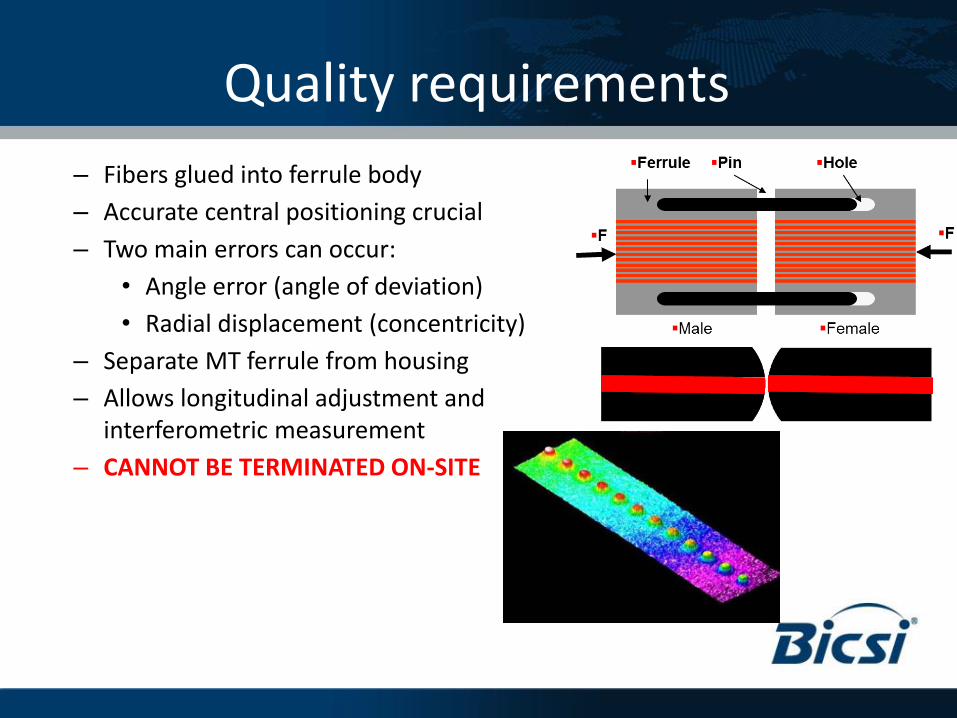
– Fibers glued into ferrule body
– Accurate central positioning crucial
– Two main errors can occur:
• Angle error (angle of deviation)
• Radial displacement (concentricity)
– Separate MT ferrule from housing
– Allows longitudinal adjustment and interferometric measurement
– CANNOT BE TERMINATED ON-SITE
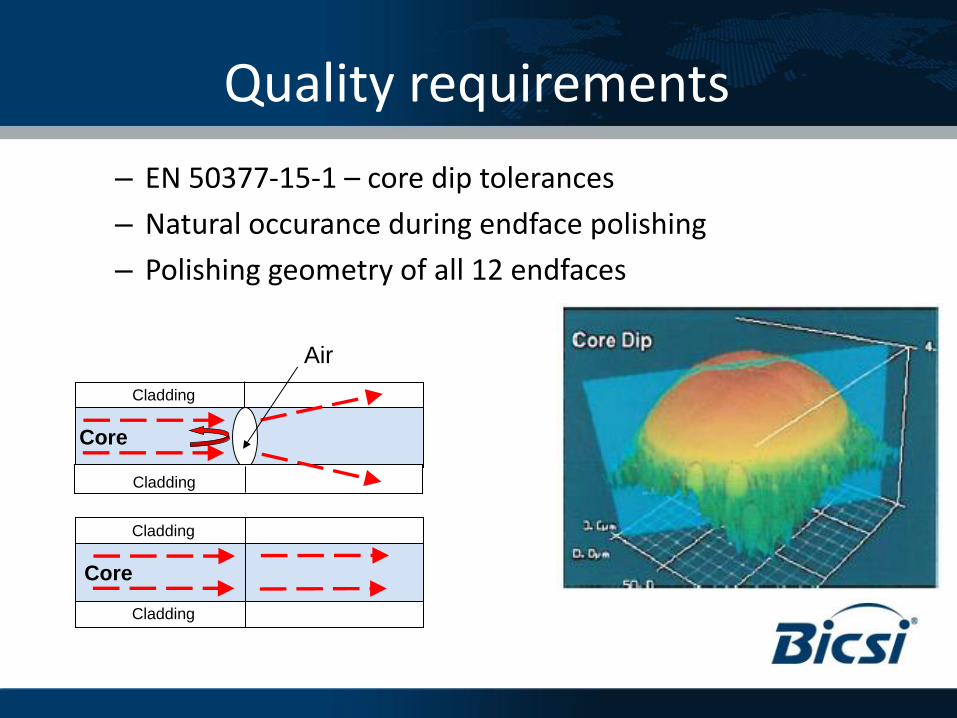
Quality requirements
– EN 50377-15-1 – core dip tolerances
– Natural occurance during endface polishing
– Polishing geometry of all 12 endfaces
Air
Core
Cladding
Cladding
Core
Cladding
Cladding
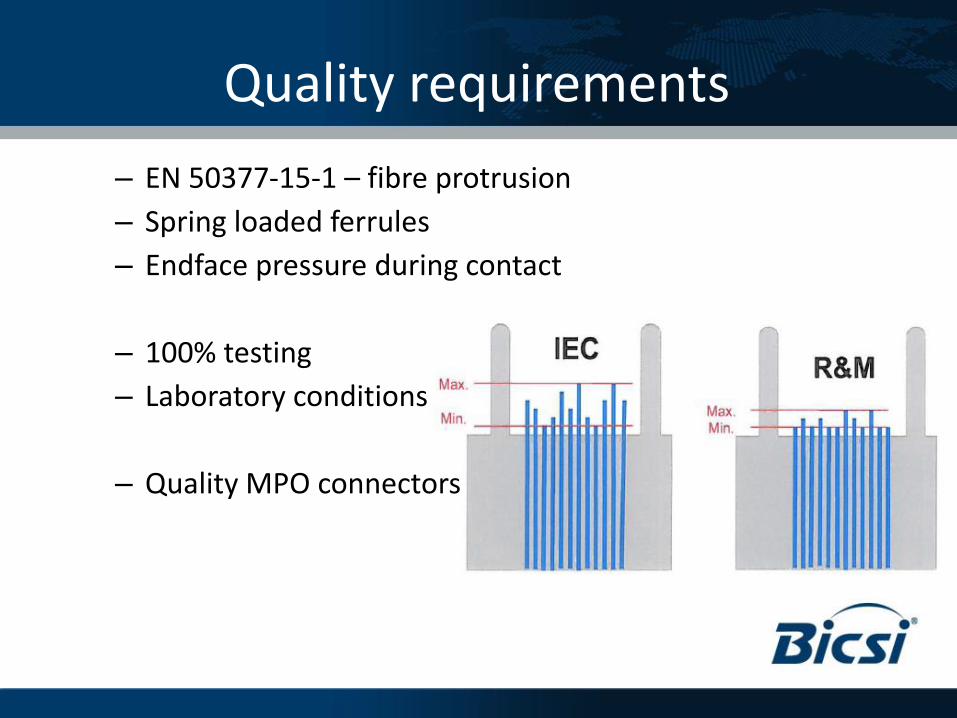
Quality requirements
– EN 50377-15-1 – fibre protrusion
– Spring loaded ferrules
– Endface pressure during contact
– 100% testing
– Laboratory conditions
– Quality MPO connectors
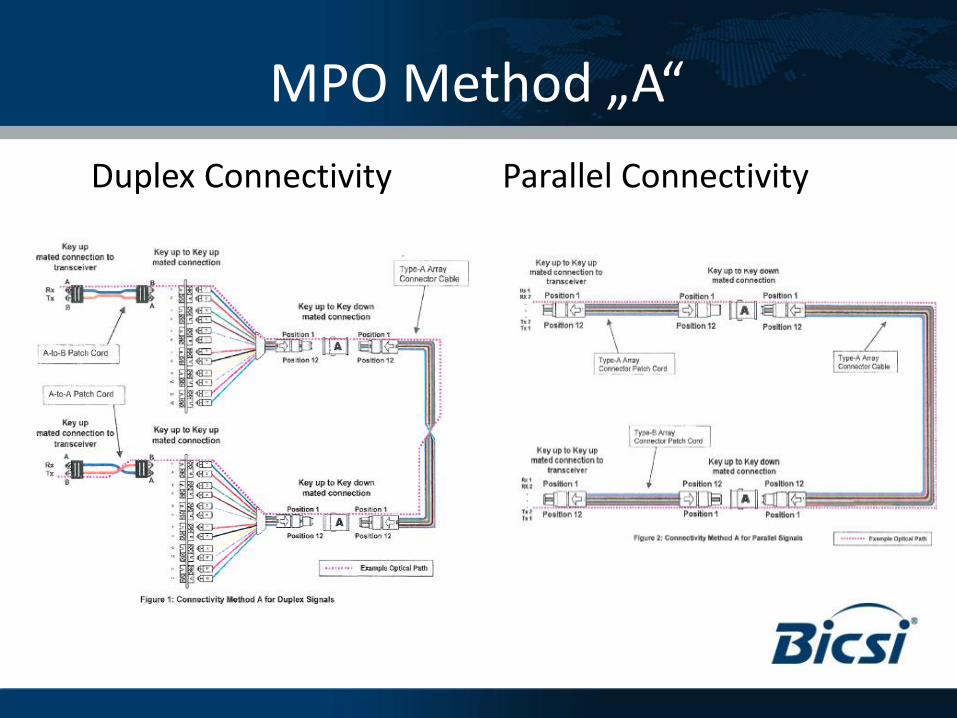
MPO Method „A“
Duplex Connectivity Parallel Connectivity
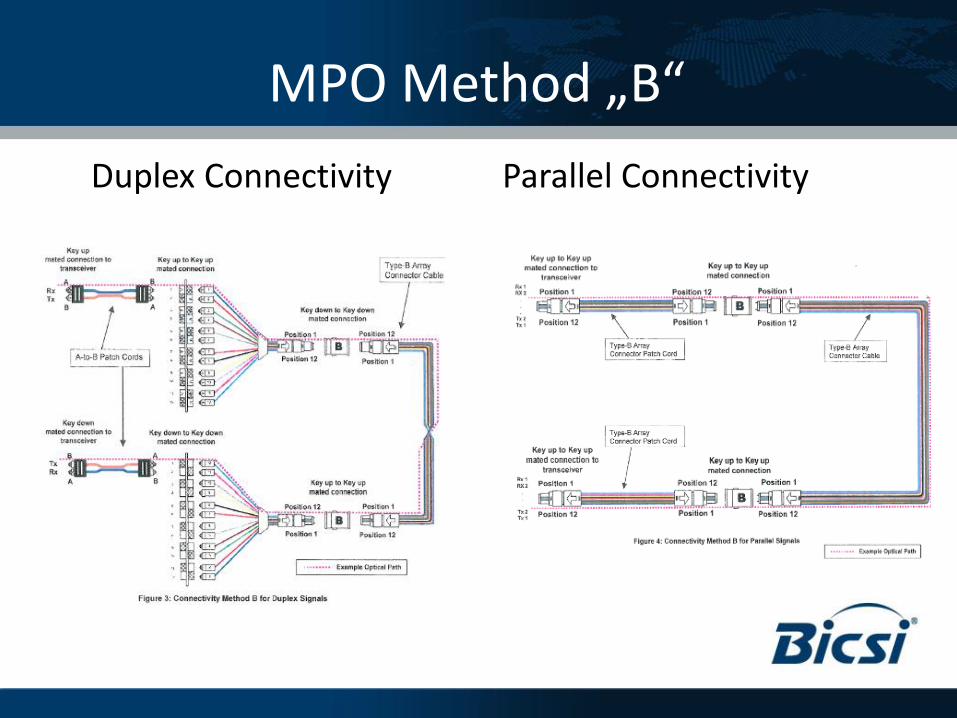
MPO Method „B“
Duplex Connectivity Parallel Connectivity
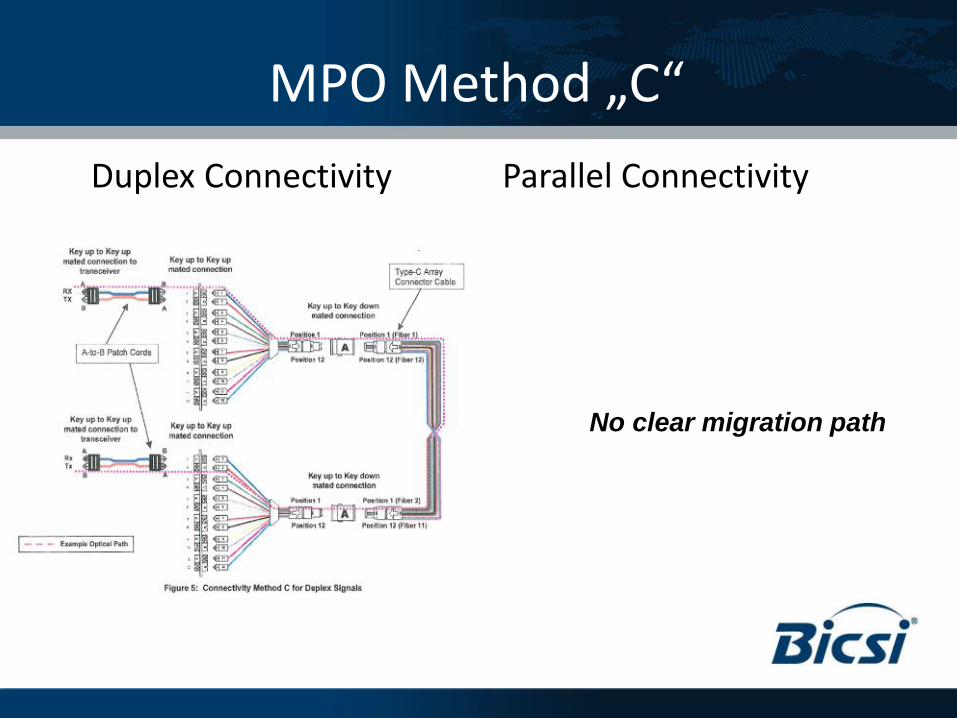
MPO Method „C“
No clear migration path
Duplex Connectivity Parallel Connectivity
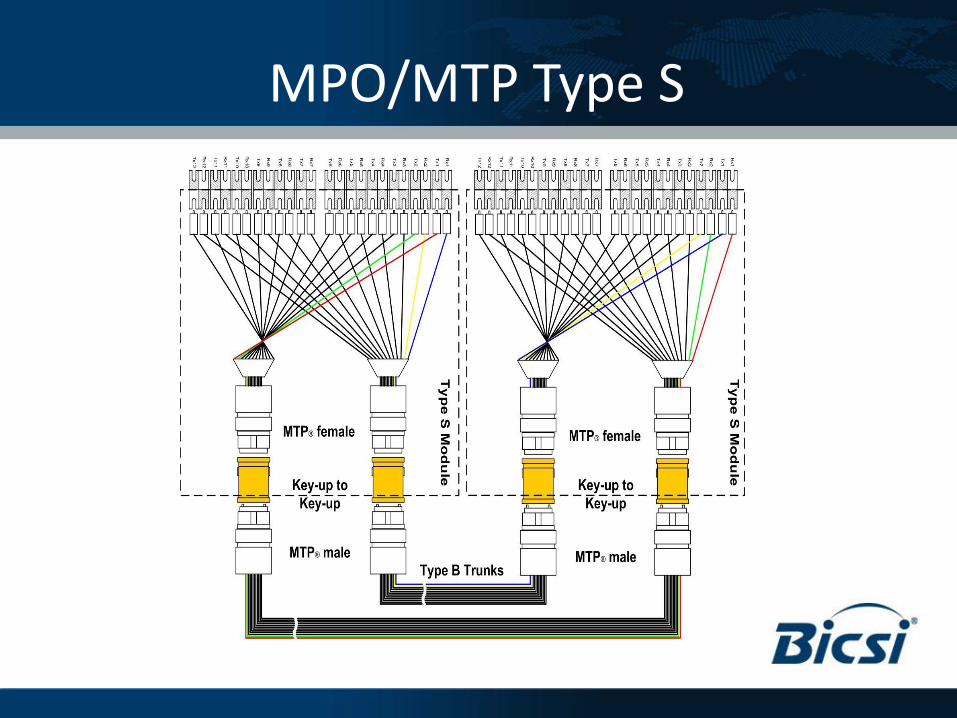
MPO/MTP Type S

MPO/MTP Type S
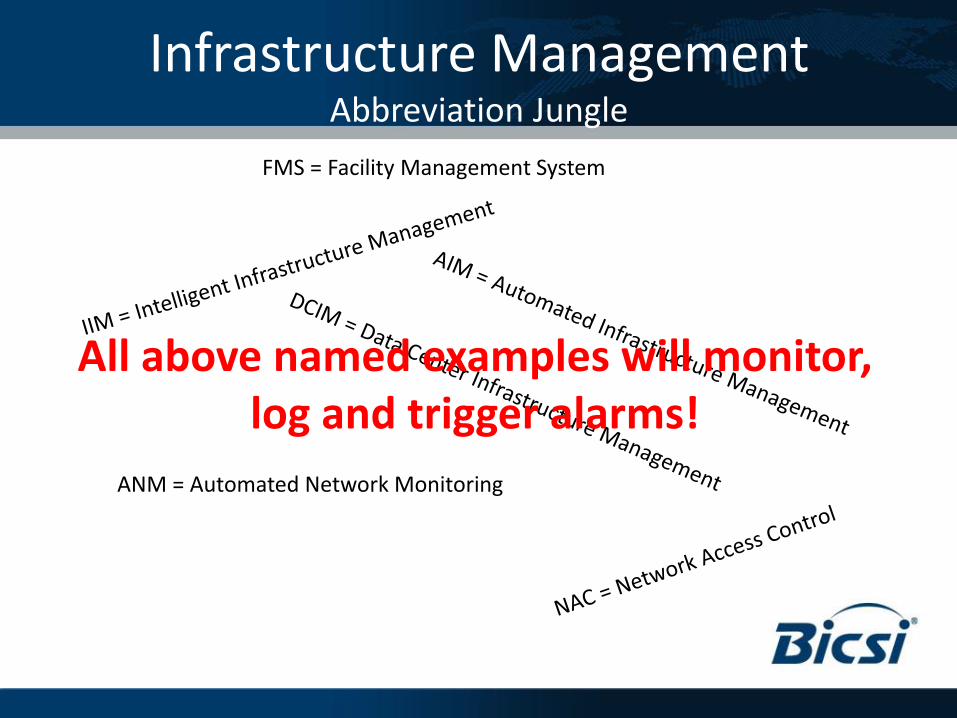
Infrastructure Management Abbreviation Jungle
ANM = Automated Network Monitoring
All above named examples will monitor, log and trigger alarms!
FMS = Facility Management System
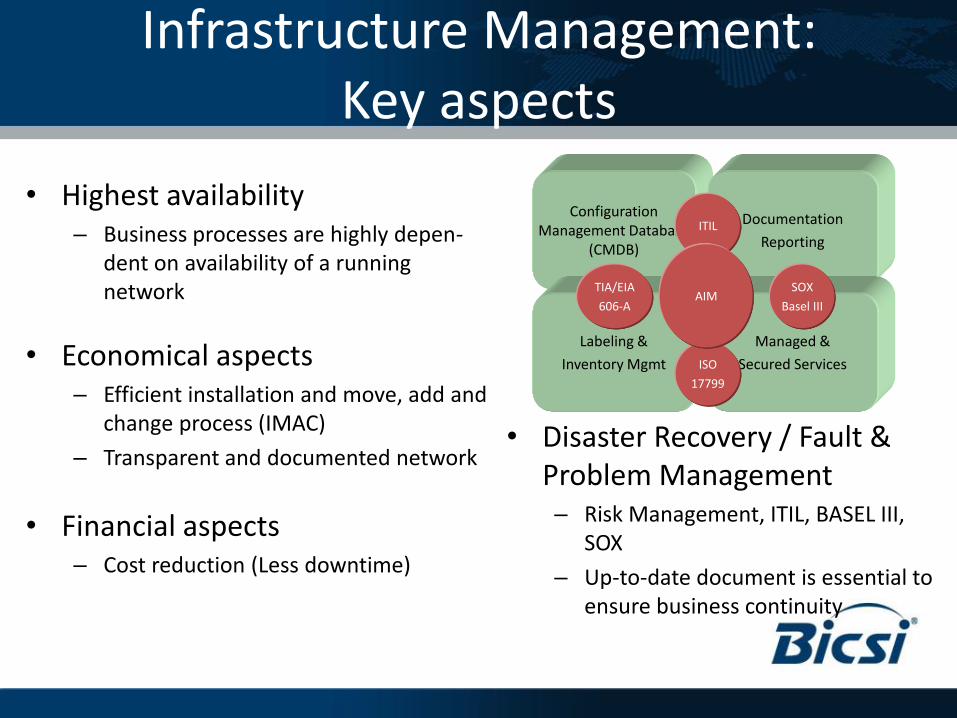
Infrastructure Management: Key aspects
• Highest availability – Business processes are highly depen-
dent on availability of a running network
• Economical aspects – Efficient installation and move, add and
change process (IMAC)
– Transparent and documented network
• Financial aspects – Cost reduction (Less downtime)
Configuration Management Database
(CMDB)
Documentation
Reporting ITIL
Labeling &
Inventory Mgmt
Managed &
Secured Services ISO
17799
TIA/EIA
606-A
SOX
Basel III AIM
• Disaster Recovery / Fault & Problem Management – Risk Management, ITIL, BASEL III,
SOX
– Up-to-date document is essential to ensure business continuity
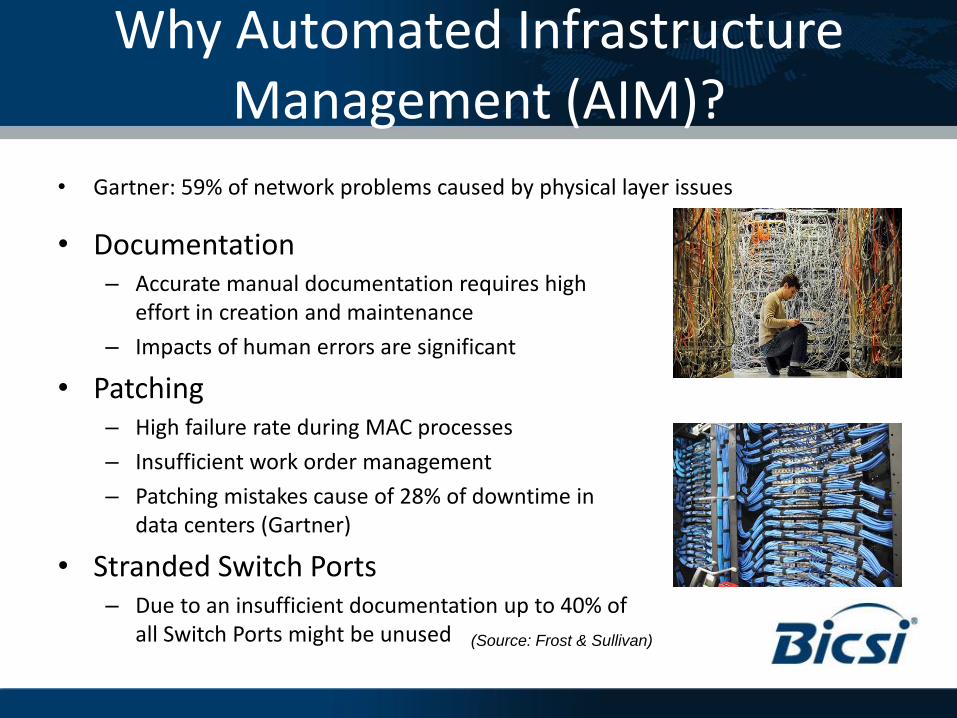
Why Automated Infrastructure Management (AIM)?
• Gartner: 59% of network problems caused by physical layer issues
• Documentation – Accurate manual documentation requires high
effort in creation and maintenance
– Impacts of human errors are significant
• Patching – High failure rate during MAC processes
– Insufficient work order management
– Patching mistakes cause of 28% of downtime in data centers (Gartner)
• Stranded Switch Ports – Due to an insufficient documentation up to 40% of
all Switch Ports might be unused
(Source: Frost & Sullivan)
Automated Infrastructure Management: Benefits
• Software Benefits – Centralized database with entire physical infrastructure
– Controlled changes based on work order management
– Graphical illustration of network
– Powerful search and reporting features
– User permission control
– Full compliance to ITIL processes
– Better use of installed capacity
• With monitoring hardware – Real-time physical connectivity monitoring
– Automatic update of database 100% accurate documentation
– Automatically keep track of all move, adds and changes
– Alerts on unsolicited changes
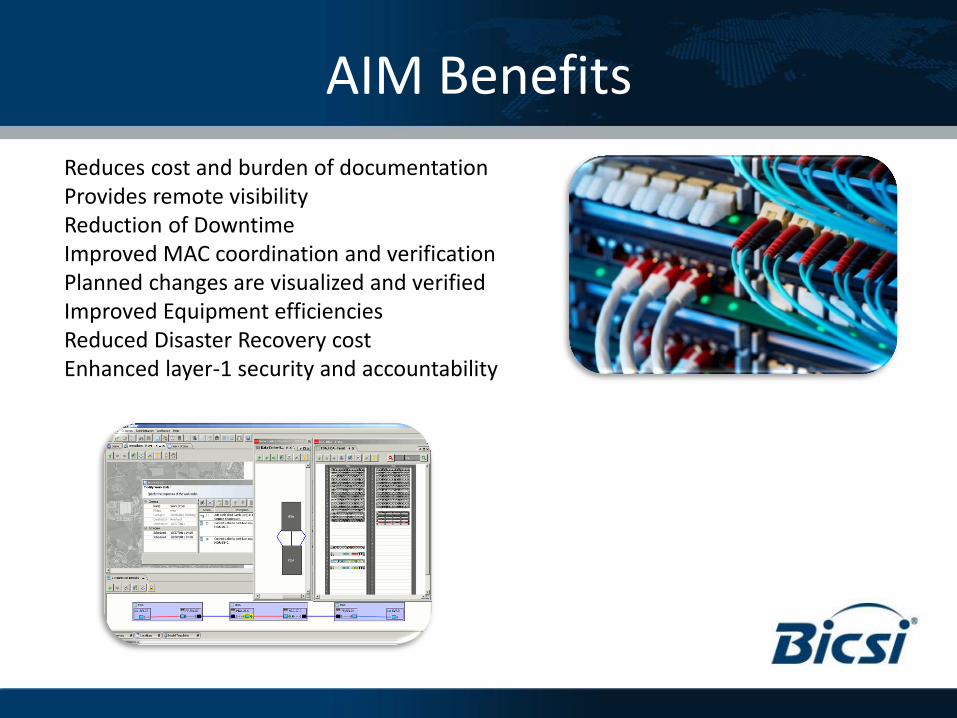
AIM Benefits
Reduces cost and burden of documentation Provides remote visibility Reduction of Downtime Improved MAC coordination and verification Planned changes are visualized and verified Improved Equipment efficiencies Reduced Disaster Recovery cost Enhanced layer-1 security and accountability
AIM Features
Improved and timely Diagnostics Holistic Physical Layer circuit traces Floor-plan Displays Graphical Rack Elevations Work-Order (MAC) processes Security enhancement and Rogue detection Network-Attached-Asset management ‘Instant Audits’ and structured reports Environmental Sensor Monitoring
Reduced cost of operation Full regulatory compliance
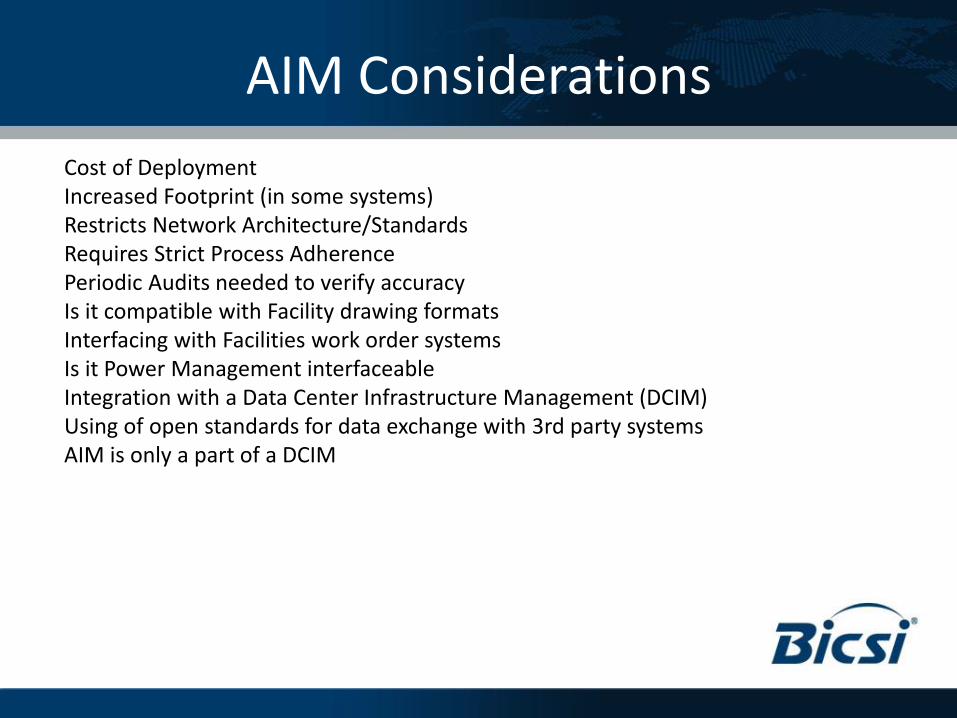
AIM Considerations
Cost of Deployment Increased Footprint (in some systems) Restricts Network Architecture/Standards Requires Strict Process Adherence Periodic Audits needed to verify accuracy Is it compatible with Facility drawing formats Interfacing with Facilities work order systems Is it Power Management interfaceable Integration with a Data Center Infrastructure Management (DCIM) Using of open standards for data exchange with 3rd party systems AIM is only a part of a DCIM
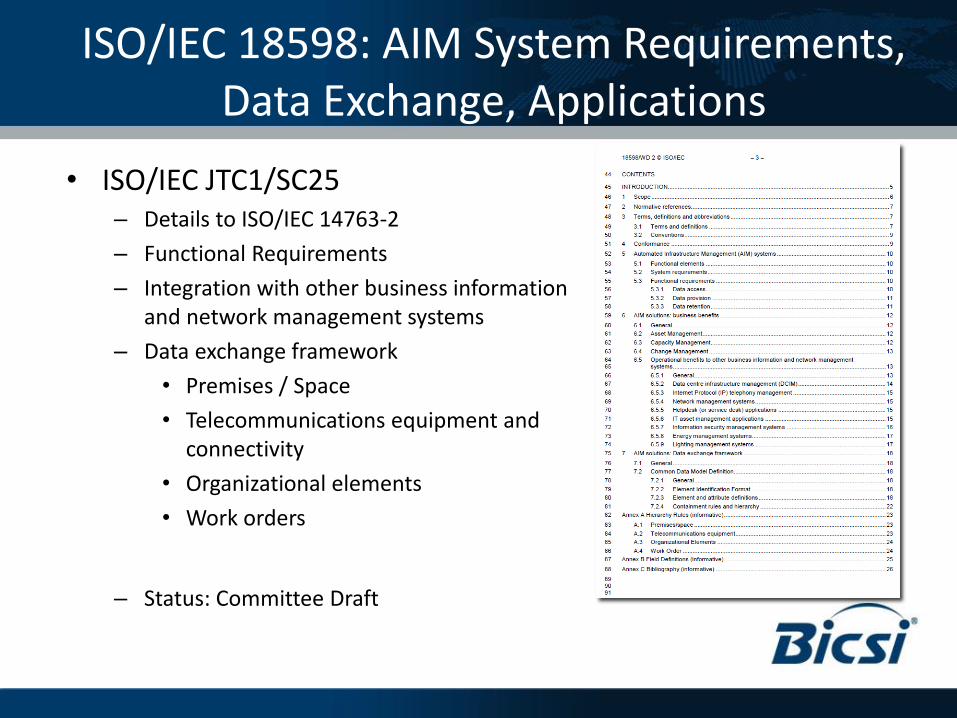
ISO/IEC 18598: AIM System Requirements, Data Exchange, Applications
• ISO/IEC JTC1/SC25 – Details to ISO/IEC 14763-2
– Functional Requirements
– Integration with other business information and network management systems
– Data exchange framework
• Premises / Space
• Telecommunications equipment and connectivity
• Organizational elements
• Work orders
– Status: Committee Draft
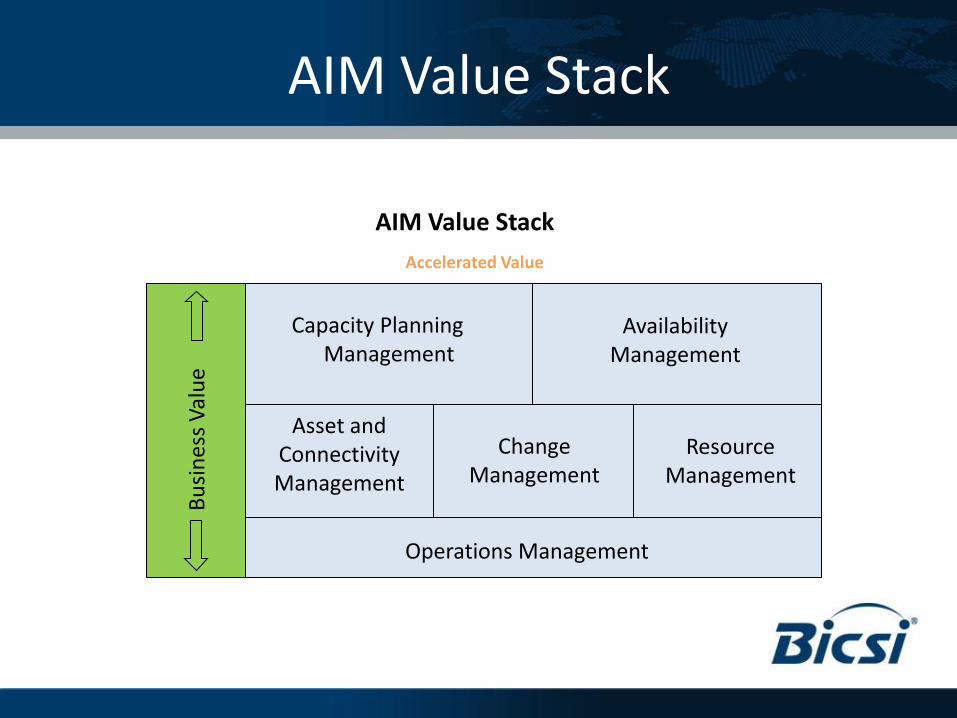
AIM Value Stack
AIM Value Stack B
usi
nes
s V
alu
e
Operations Management
Capacity Planning Management
Asset and Connectivity Management
Resource Management
Availability Management
Change Management
Accelerated Value
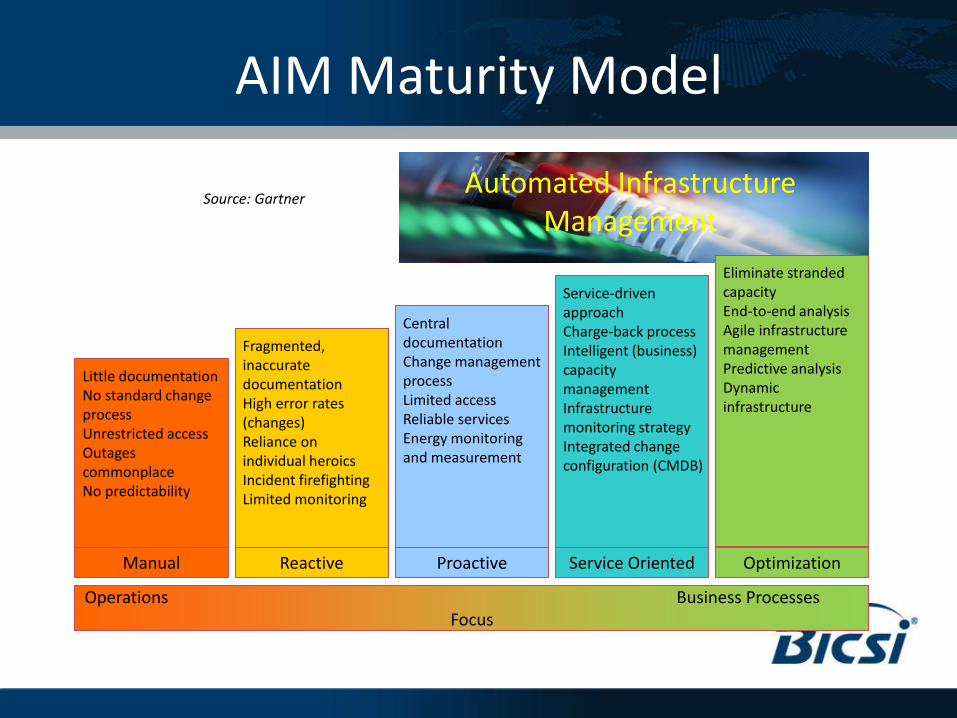
AIM Maturity Model
Automated Infrastructure Management
Little documentation No standard change process Unrestricted access Outages commonplace No predictability
Fragmented, inaccurate documentation High error rates (changes) Reliance on individual heroics Incident firefighting Limited monitoring
Central documentation Change management process Limited access Reliable services Energy monitoring and measurement
Service-driven approach Charge-back process Intelligent (business) capacity management Infrastructure monitoring strategy Integrated change configuration (CMDB)
Manual Reactive Proactive Service Oriented Optimization
Operations Business Processes Focus
Source: Gartner
Eliminate stranded capacity End-to-end analysis Agile infrastructure management Predictive analysis Dynamic infrastructure
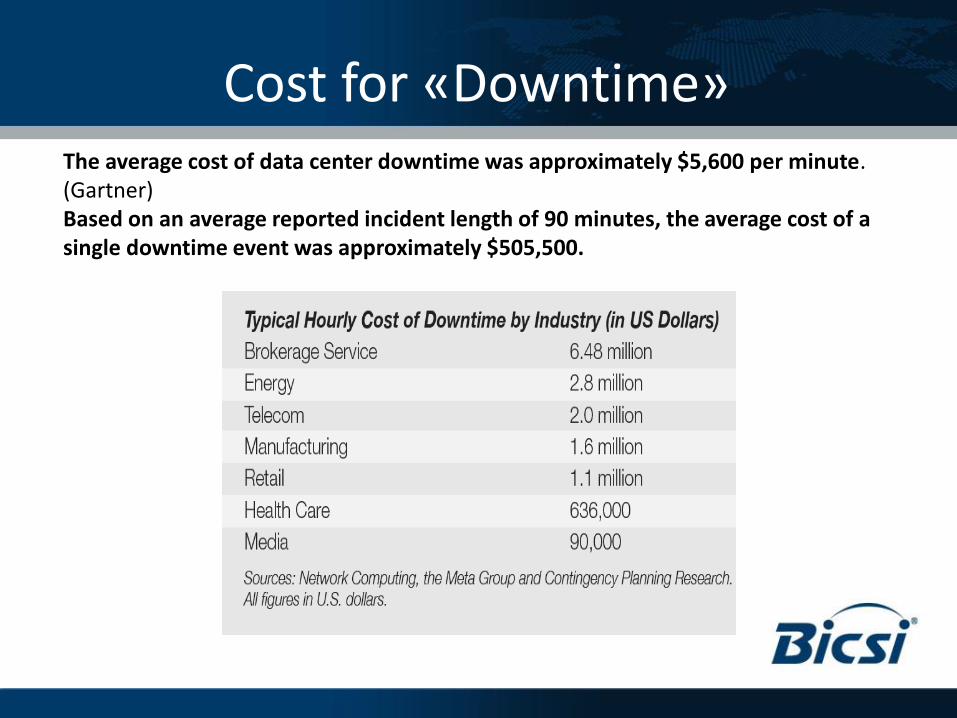
The average cost of data center downtime was approximately $5,600 per minute. (Gartner) Based on an average reported incident length of 90 minutes, the average cost of a single downtime event was approximately $505,500.
Cost for «Downtime»
AIM of old
• Bespoke system not easily adaptable
• Very costly • Not suited to
redundancy planning
• Space hungry • Incapable to
cooperate with other systems
• Not fit for purpose
AIM of New
• Retrofittable • Cost effective • Compact • Capable to interact
with other systems • Now fit for purpose

Questions?
Thank you!
Thank you
Andrew Sedman
Head of Training and Technical Support
www.rdm.com