Embed Size (px)
Citation preview

Modern CPU PerformanceAnalysis on Linux
Andi Kleen
Intel Corporation
June 2011

My first task in the Real World was to read andunderstand a 200,000 line Fortran program, thenspeed it up by a factor of two.
- Ed Post, Real programmers don’t use Pascal

Tools• oprofile• perf• perf wrappers: ocperf, perf+libpfm etc.• simple-pmu

Basics
• Sampling: oprofile, perf top, perf record/report• Counting: perf stat, simple-pmu

Basic operation of a PMU
• Number of counters in the CPU• or other devices like GPU, NIC, Uncore• Event code to enable counting for an event• Interrupt when threshold reached: allows sampling• Modern PMUs have additional features

Classic profiling• Follow the Pareto principle 80-20 (or 90-10 according to
Knuth)• Use sampling with cycle counter• Identify hottest code• Improve• Repeat

Problems• 90 percent of time in 10 percent of the code• Flat profile

Skid (or “instruction shadow”)
• Sampling inaccurracy• When sampling interrupt does not occur on the exact
instruction that caused the event.• But a few instructions later.• Can make it hard to analyze code.• Modern PMUs have (limited) ways around it

Standard CPU events in perf
% per f l i s t. . .
cpu−cyc les OR cyc les [ Hardware event ]s t a l l e d−cycles−f ron tend [ Hardware event ]s t a l l e d−cycles−backend [ Hardware event ]i n s t r u c t i o n s [ Hardware event ]cache−re ferences [ Hardware event ]cache−misses [ Hardware event ]branch−i n s t r u c t i o n s [ Hardware event ]branch−misses [ Hardware event ]bus−cyc les [ Hardware event ]
. . .

Raw events.
% per f l i s t. . .rNNN [ : EEE] ( see ’ pe r f l i s t −−help ’ on how to encode i t )
[Raw hardware event d e s c r i p t o r ]

Standard perf methood: not user friendly
Example :
I f the I n t e l docs f o r a QM720 Core i 7 descr ibe an event as :
Event Umask Event MaskNum. Value Mnemonic Desc r i p t i on
Comment
A8H 01H LSD.UOPS Counts the number o f micro−opsUse cmask=1 and
de l i ve red by loop stream de tec to ri n v e r t to count
cyc les
raw encoding o f 0x1A8 can be used :
pe r f s t a t −e r1a8 −a sleep 1pe r f record −e r1a8 . . .

ocperf
• Perf wrapper to support Intel specific events• Allows symbolic events and some additional events

ocperf demo

Simple NUMA system
CPU CPU
IO
DIMMDIMM
DIMM
DIMM
DIMMDIMM
DIMM
DIMM
Interconnect

Cache hierarchyexample, not necessarily a real system1x L1 cache6x L2 cache60-70x L3 cache (LLC)180x remote cache200x local DRAM300+x remote DRAM (NUMA)

Optimization goal:
• optimize access pattern to avoid expensive misses• Avoid remote misses on NUMA systems.• And cache misses everywhere• Profile for specific misses

Generic cache events in perf
L1−dcache−loadsL1−dcache−load−missesL1−dcache−s to resL1−dcache−store−missesL1−dcache−pre fe tchesL1−dcache−pre fe tch−missesL1−icache−loadsL1−icache−load−missesL1−icache−pre fe tchesL1−icache−pre fe tch−missesLLC−loadsLLC−load−missesLLC−s to resLLC−store−missesLLC−pre fe tchesLLC−pre fe tch−misses
dTLB−loadsdTLB−load−missesdTLB−s to resdTLB−store−missesdTLB−pre fe tchesdTLB−pre fe tch−missesiTLB−loadsiTLB−load−missesbranch−loadsbranch−load−misses

NUMA profiling
• Understand where remote memory access happens.• offcore events profile accesses outside a CPU core• Can be only profiled with ocperf currently!
( excerpt from >420)o f f co re reques t s . anyo f f co re reques t s . any . readof fcore response . any data . any cache dram 0of fcore response . any data . a n y l l c m i s s 0of fcore response . any data . remote dram 0of fcore response . any data . loca l cache 0. . .
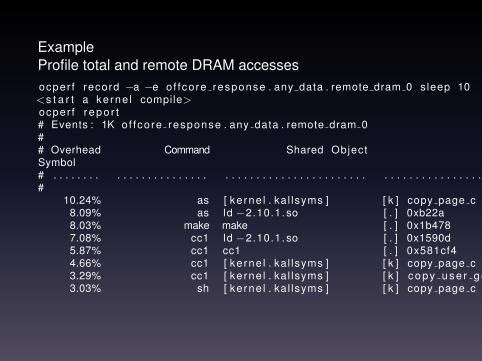
ExampleProfile total and remote DRAM accessesocper f record −a −e of fcore response . any data . remote dram 0 sleep 10<s t a r t a kerne l compile>ocper f r e p o r t# Events : 1K of fcore response . any data . remote dram 0## Overhead Command Shared ObjectSymbol# . . . . . . . . . . . . . . . . . . . . . . . . . . . . . . . . . . . . . . . . . . . . . . . . . . . . . . . . . . . . . . . . . . . . . . . . . . .#
10.24% as [ kerne l . ka l lsyms ] [ k ] copy page c8.09% as ld −2.10.1. so [ . ] 0xb22a8.03% make make [ . ] 0x1b4787.08% cc1 ld −2.10.1. so [ . ] 0x1590d5.87% cc1 cc1 [ . ] 0x581cf44.66% cc1 [ ke rne l . ka l lsyms ] [ k ] copy page c3.29% cc1 [ ke rne l . ka l lsyms ] [ k ] c o p y u s e r g e n e r i c s t r i n g3.03% sh [ kerne l . ka l lsyms ] [ k ] copy page c

Profiling NUMA behavior of IO devices
• Not counted by uncore core event (only CPU accesses)• Can be counted by uncore profiling driver.• Work in progress

Load latency
• Profile loads by latency• Provide the addresses and statistics• Precise – avoids skid.• But needs some way to map back addresses• Out of tree feature currently, see references
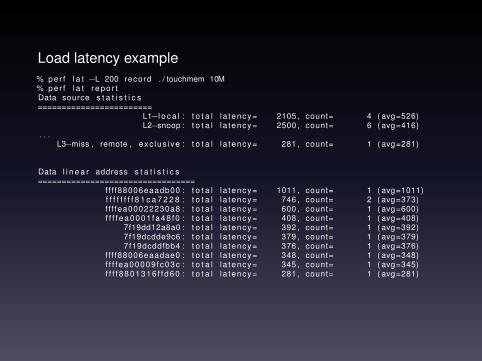
Load latency example% per f l a t −L 200 record . / touchmem 10M% per f l a t r e p o r tData source s t a t i s t i c s========================
L1−l o c a l : t o t a l l a tency= 2105 , count= 4 ( avg=526)L2−snoop : t o t a l l a tency= 2500 , count= 6 ( avg=416)
. . .L3−miss , remote , exc lus i ve : t o t a l l a tency= 281 , count= 1 ( avg=281)
Data l i n e a r address s t a t i s t i c s=================================
f f f f88006eaadb00 : t o t a l l a tency= 1011 , count= 1 ( avg=1011)f f f f f f f f 8 1 c a 7 2 2 8 : t o t a l l a tency= 746 , count= 2 ( avg=373)f f f fea00022230a8 : t o t a l l a tency= 600 , count= 1 ( avg=600)f f f f e a0 00 1 f a4 8 f 0 : t o t a l l a tency= 408 , count= 1 ( avg=408)
7f19dd12a8a0 : t o t a l l a tency= 392 , count= 1 ( avg=392)7f19dcdde9c6 : t o t a l l a tency= 379 , count= 1 ( avg=379)7f19dcddfbb4 : t o t a l l a tency= 376 , count= 1 ( avg=376)
f f f f88006eaadae0 : t o t a l l a tency= 348 , count= 1 ( avg=348)f f f f ea00009 fc03c : t o t a l l a tency= 345 , count= 1 ( avg=345)f f f f 8 80 13 16 f f d6 0 : t o t a l l a tency= 281 , count= 1 ( avg=281)

Different problem

• Measuring code inside a program• Need fast way to access cycles.

Measuring cycles of code - classical x86 way
a = rdtsc ();
for (i = 0; i < 100; i++)
my_function ();
b = rdtsc ();
printf (" cycles %llu\n", (b - a)/100);

Or better without loop overhead
#define R5(x) x; x; x; x; x
#define R25(x) R5(x); R5(x); R5(x); R5(x); R5(x)
#define R100(x) R25(x); R25(x); R25(x); R25(x)
static inline void mycode ()
{
...
}
a = rdtsc ();
R100(mycode () ...);
b = rdtsc ();
printf (" cycles %llu\n", (b - a)/100);

Problems of RDTSC• Designed to be a constant clock• Frequency constant but unclear:
• Hard to find current frequency• CPU frequency changes with cpufreq and Turbo mode• But RDTSC frequency stays the same (and is unclear)

SynchronizationRDTSC does not synchronize out of order CPU.Can cause inaccuracy in cycle measurement.
400876: 0 f 31 rd t sc400878: 48 89 d1 mov %rdx ,%rcx40087b : 89 c0 mov %eax,%eax40087d : 48 c1 e1 20 sh l $0x20,%rcx400881: 48 09 c1 or %rax ,%rcx400884: 4d 85 e4 t e s t %r12 ,%r12400887: 7e 13 j l e 40089c400889: 4c 89 e8 mov %r13 ,%rax40088c : 0 f 1 f 40 00 nopl 0x0(%rax )400890: c6 00 01 movb $0x1 ,(% rax )400893: 48 83 c0 01 add $0x1,%rax400897: 48 39 d8 cmp %rbx ,%rax40089a : 75 f4 jne 40089040089c : 0 f 31 rd t sc
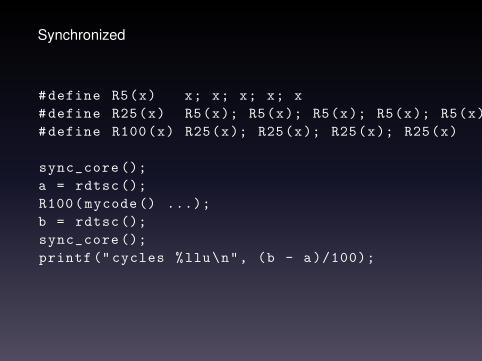
Synchronized
#define R5(x) x; x; x; x; x
#define R25(x) R5(x); R5(x); R5(x); R5(x); R5(x)
#define R100(x) R25(x); R25(x); R25(x); R25(x)
sync_core ();
a = rdtsc ();
R100(mycode () ...);
b = rdtsc ();
sync_core ();
printf (" cycles %llu\n", (b - a)/100);

Synchronized with RDTSCPOnly works on recent CPUs! (grep rdtscp /proc/cpuinfo)
#define R5(x) x; x; x; x; x
#define R25(x) R5(x); R5(x); R5(x); R5(x); R5(x)
#define R100(x) R25(x); R25(x); R25(x); R25(x)
a = rdtscp ();
R100(mycode () ...);
b = rdtscp ();
printf (" cycles %llu\n", (b - a)/100);

Frequency problem stillthere

simple-pmu
• Simple kernel driver that starts fixed Intel counters• Enable them for fast ring 3 read with RDPMC• Returns current cycles in whatever the frequency is

Simple PMU example
#include "cycles.h"
pin_cpu(NULL);
if (perfmon_available () < 0) error
sync_core ();
a = unhalted_core ();
R100(mycode ());
b = unhalted_core ();
sync_core ();
printf (" cycles %llu\n", (b - a)/100);

Also available:
• instruction retired();• unhalted ref()

simple-pmu caveats
• Does not tick in idle• Should not switch CPUs because they are unsynchronized
(use pin cpu())• Out of tree driver

Referencessimple-pmuhttp://halobates.de/simple-pmu
ocperfftp://ftp.kernel.org/pub/linux/kernel/people/ak/
ocperf/ocperf4.tgz
load-latencyhttp://git.kernel.org/?p=linux/kernel/git/ak/
linux-misc-2.6.git;a=shortlog;h=perf/load-latency
Intel Software Developer’s Manual: Volume 3 Chapter 30 andappendix Ahttp://www.intel.com/products/processor/manuals/

Backup

oprofile
% opcon t ro l − lo p r o f i l e : a v a i l a b l e events f o r CPU type ” I n t e l Westmere m i c r o a r c h i t e c t u r e ”
See I n t e l A r c h i t e c t u r e Developer ’ s Manual Volume 3B, Appendix A andI n t e l A r c h i t e c t u r e Opt im iza t ion Reference Manual (730795−001)
. . .
CPU CLK UNHALTED: ( counter : a l l )Clock cyc les when not ha l ted ( min count : 6000)
INST RETIRED : ( counter : a l l )number o f i n s t r u c t i o n s r e t i r e d ( min count : 6000)
LLC MISSES : ( counter : a l l )Last l e v e l cache demand requests from t h i s core t h a t missed the LLC ( min count : 6000). . .


![[03] Tribologia - Andi](https://img.pdfslide.us/doc/110x75/55cf9743550346d0339098a3/03-tribologia-andi.jpg)