Embed Size (px)
Citation preview

MODERATING ROLE OF PROJECT LEADERSHIP ON
THE INFLUENCE OF COMPLEXITY ON SUCCESS OF
PUBLIC INFRASTRUCTURAL MEGAPROJECTS IN
KENYA
AUSTEN BARAZA OMONYO
DOCTOR OF PHILOSOPHY
(PROJECT MANAGEMENT)
JOMO KENYATTA UNIVERSITY OF
AGRICULTURE AND TECHNOLOGY
2018

ii
Moderating Role of Project Leadership on the Influence of Complexity
on Success of Public Infrastructural Megaprojects in Kenya
Austen Baraza Omonyo
A Thesis Submitted in Partial Fulfillment for the Degree of
Doctor of Philosophy in Project Management in the Jomo Kenyatta
University of
Agriculture and Technology
2018
ii
DECLARATION
This research thesis is my original work and has not been presented for a degree in any
other University
Signature…………………………… Date……………………………..
Austen Baraza Omonyo
This thesis has been submitted for examination with my approval as University Supervisor
Signature………………………….. Date……………………………….
Prof. Roselyn Gakure
JKUAT, Kenya
This research thesis has been submitted for examination with my approval as University
Supervisor
Signature………………………….. Date…………………………………
Prof. Romanus Odhiambo Otieno
JKUAT, Kenya

iii
DEDICATION
To the almighty God, maker of heaven and earth and giver of life, strength and ingenuity,
I dedicate this work.

iv
ACKNOWLEDGEMENT
My supervisors, Prof. Roselyn Gakure and Prof. Romanus Odhiambo, your support and
advice were invaluable throughout this study. We started off with a teacher-student
relationship but we finished off as acquaintances and colleagues. What you have left in
me is a scholar capable of discharging effective supervision to many others. Only God can
reward you for this and I pray that He does so in abundance.
Dr. Levi Mbugua of Technical University of Kenya, Dr. Christopher Ngacho of Kisii
University and Prof. James Njihia of University of Nairobi, thank you for your technical
input and assistance that have made this work scholarly and appealing to practice.
Eng. Nyaga of Kenya Ports Authority, Arch. Odawo of Kenya Airports Authority, Eng.
Onyinkwa of Kenya Urban Roads Authority, Eng. Muchilwa of Kenya National
Highways Authority, Eng. Limo of Kenya Power and Lighting Company, Eng. Kones of
Kenya Pipeline Company, Dr. Aomo of Kenya Civil Aviation Authority, Eng. Chege of
Kenya Electricity Generating Company and Mr. Tocho of Geothermal Development
Company; if it were not for your assistance in coordinating data collection within your
respective organizations, this study would have been a nullity. God bless you abundantly.
To my wife Sheila, thank you for your emotional support. You are the only one capable
of narrating the ordeal I went through in the course of conducting this study.
v
TABLE OF CONTENTS
DECLARATION…………………………………………………………
ii
DEDICATION…………………………………………………………… iii
ACKNOWLEDGEMENT………………………………………………. iv
LIST OF TABLES……………………………………………………….. ix
LIST OF FIGURES AND CHARTS…………………………………… xi
LIST OF APPENDICES………………………………………………… xii
LIST OF EQUATIONS………………………………………………….. xiii
LIST OF ABBREVIATIONS AND ACRONYMS…………………….. xiv
DEFINITION OF TERMS………………………………………………. xv
ABSTRACT………………………………………………………………. xviii
CHAPTER ONE………………………………………………………….
1
INTRODUCTION………………………………………………………... 1
1.0 Chapter Overview 1
1.1 Background of the Study ……………………………………………… 1
1.1.1 Complexity and Megaproject Success…………………………….. 3
1.1.2 Project Leadership and Success of Megaprojects…………………. 6
1.2 Statement of the Problem……………………………………………… 7
1.3 Objectives of the Study………………………………………………... 8
1.3.1 General Objective…………………………………………………. 8
1.3.2 Specific Objectives………………………………………………... 8
1.4 Research Hypotheses………………………………………………….. 9
1.5 Justification of the Study………………………………………………. 9
1.6 Scope of the Study…………………………………………………….. 10
1.7 Limitation of the Study………………………………………………... 10
vi
CHAPTER TWO………………………………………………………… 12
LITERATURE REVIEW……………………………………………….. 12
2.1 Introduction……………………………………………………………. 12
2.2 Theoretical Framework………………………………………………... 12
2.2.1 Human Behavior…………………………………………………... 12
2.2.2 Ambiguity and System Behavior………………………………….. 14
2.2.3 Project Leadership…………………………………………………. 17
2.2.4 Megaproject Success………………………………………………. 20
2.3 Conceptual Framework………………………………………………... 21
2.4 Empirical Literature Review…………………………………………... 22
2.4.1 Human Behavior…………………………………………………... 22
2.4.2 Ambiguity…………………………………………………………. 26
2.4.3 System behavior………………………………………………........ 27
2.4.4 Project Leadership…………………………………………………. 30
2.4.5 Megaproject Success………………………………………………. 34
2.5 Critique of the Existing Literature…………………………………….. 36
2.6 Summary of Existing Literature……………………………………….. 38
2.7 Research Gaps…………………………………………………………. 39
CHAPTER THREE………………………………………………………
41
RESEARCH METHODOLOGY……………………………………….. 41
3.0 Introduction…………………………………………………………..... 41
3.1 Research Philosophy and Design……………………………………… 41
3.2 Target Population……………………………………………………… 42
3.3 Sampling Frame……………………………………………………….. 43
3.4 Sample and Sampling Technique……………………………………… 43
3.5 Instruments…………………………………………………………….. 44
3.5.1 Validity and Reliability of Instruments……………………………. 46
3.6 Data Collection Procedure…………………………………………….. 47
vii
3.7 Data Processing, Analysis and Presentation…………………………... 48
3.7.1 Data Processing……………………………………………………… 48
3.7.2 Data Analysis………………………………………………………... 48
3.7.3 Data Presentation……………………………………………………. 51
CHAPTER FOUR………………………………………………………...
52
RESEARCH FINDINGS AND DISCUSSION…………………………. 52
4.1 Introduction……………………………………………………………. 52
4.2 Projects Surveyed and Response Rate………………………………… 52
4.3 Results of Pilot Study…………………………………………………. 53
4.4 Findings of the Main Study…………………………………………… 54
4.4.1 Megaproject Success………………………………….................... 55
4.4.2 Human Behavior.……………...…………………………………... 62
4.4.3 Ambiguity…..……………………………………………………... 85
4.4.4 System Behavior…………………………………………………... 101
4.4.5 Project Leadership ………………………………………………… 115
4.5 Implications of the Findings and Optimal Model …………………….. 133
4.5.1 Implications for Theory and Practice……………………………… 133
4.5.2 Implications for Research…………………………………………. 134
4.5.3 Optimal/Revised Model of Study…………………………………. 135
CHAPTER FIVE………………………………………………………….
138
SUMMARY, CONCLUSIONS AND RECOMMENDATIONS……… 138
5.1 Introduction…………………………………………………………… 138
5.2 Summary of Findings…………………………………………………. 138
5.2.1 Megaproject Success……………………………………………… 139
5.2.2 Human Behavior………………………………………………….. 140
5.2.3 Ambiguity…………………………………………………………. 142
5.2.4 System Behavior…………………………………………………... 143
5.2.5 Project Leadership…………………………………………………. 145
viii
5.3 Conclusions…………………………………………………………… 146
5.4 Recommendations……………………………………………………... 149
5.4.1 Recommendations for Policy and Practice………………………... 149
5.4.2 Recommendations for Further Research………………………….. 150
REFERENCES……………………………………………………………
152
APPENDICES……………………………………………………………. 167
ix
LIST OF TABLES
Table 3.1: Distribution of Completed Megaprojects…………………………… 43
Table 3.2: Operationalization of Study Variables……………………………… 45
Table 4.1: Reliability of Individual Scales…………………………………….. 54
Table 4.2: Project Efficiency by Sector……………………………………….. 58
Table 4.3: Process Success Scores…………………………………………....... 58
Table 4.4: Project Success Scores……………………………………………… 60
Table 4.5: Descriptive Statistics for Success Scores…………………………… 61
Table 4.6: Project Success by Sector………………………………………….. 61
Table 4.7: Individual Behavior Responses……………………………………... 63
Table 4.8: Individual Behaviors and Performance…………………………….. 65
Table 4.9: Group Behavior Responses…………………………………………. 67
Table 4.10: Group Behavior and Performance………………………………… 70
Table 4.11: Alignment, Opacity and Process Maturity Responses……………. 71
Table 4.12: Delivery Based on Alignment, Opacity and Process Maturity…… 75
Table 4.13: Performance Based on Layers in Organogram…………………… 77
Table 4.14: Project Organization and Success…………………………………. 77
Table 4.15: Cognitive Biases Mapping………………………………………… 79
Table 4.16: Human Behavior Complexity Scores……………………………… 80
Table 4.17: Descriptive Statistics for Human Behavior………………………... 81
Table 4.18: Correlation Between Human Behavior and Success………………. 83
Table 4.19: Project Success by Contract Type…………………………………. 86
Table 4.20: Project Efficiency by Contract Type………………………………. 87
Table 4.21: Responses Based on Emergence…………………………………... 89
Table 4.22: Project Delivery Based on Emergence……………………………. 91
Table 4.23: Responses Based on Uncertainty………………………………...... 93
Table 4.24: Delivery Based on Uncertainty……………………………………. 96
Table 4.25: Ambiguity Complexity Scores…………………………………….. 98
x
Table 4.26: Correlation Between Ambiguity and Success…………………….. 99
Table 4.27: Aspects of Connectedness…………………………………………. 102
Table 4.28: Mean Performance Based on Connectedness……………………… 103
Table 4.29: Aspects of Dependency………………………………………….... 105
Table 4.30: Performance Based on Dependency………………………………. 105
Table 4.31: System Dynamics Responses……………………………………… 107
Table 4.32: Project Performance Based on System Dynamics………………… 109
Table 4.33: System Behavior Complexity Scores……………………………… 113
Table 4.34: Correlations Between System Behavior and Success……………… 114
Table 4.35: Mean STen Scores for Leader Behavior…………………………. 116
Table 4.36: Significance of Leadership Dimensions…………………………… 118
Table 4.37: Mapping of Leadership Styles…………………………………….. 119
Table 4.38: Descriptive Statistics for Leadership Scores……………………… 122
Table 4.39: Correlation Between Leadership and Success…………………….. 124
Table 4.40: Overall Complexity Scores………………………………………... 126
Table 4.41: Mean Complexity by Sector……………………………………….. 127
Table 4.42: Leadership and Interaction Scores………………………………… 129
Table 4.43: Moderated Model Summary………………………………………. 131
Table 4.44: Summary ANOVA Results……………………………………….. 132
Table 4.45: Mediation of Project Leadership ………………………………….. 136
xi
LIST OF FIGURES AND CHARTS
Figure 2.1: Conceptual Framework……………………………………………... 22
Chart 4.1: Distribution of Projects Surveyed…………………………………… 53
Figure 4.1: Major Causes of Cost Overrun……………………………………... 56
Figure 4.2: Major Causes of Schedule Delay…………………………………… 57
Figure 4.3: Revised Conceptual Model………………………………………..... 137
xii
LIST OF APPENDICES
Appendix I: Data Collection Instruments……………………………………….......167
Appendix II: List of Completed Megaprojects Surveyed………………………….182
Appendix III: Regression Results……………………………….............................183
xiii
LIST OF EQUATIONS
Equation 1: Cronbach’s Alpha……………………………………………...........47
Equation 2: Overall Moderated Model…………………………………………..49
Equation 6: Paired Connections………………………………………………...101
xiv
LIST OF ABBREVIATIONS AND ACRONYMS
CAQ Complexity Assessment Questionnaire
CAS Complex Adaptive Systems
CLT Complexity Leadership Theory
HA Alternative or Research Hypothesis
HIV/AIDS Acquired immunodeficiency syndrome/human immunodeficiency virus
ICCPM International Centre for Complex Project Management
ICT Information Communication Technology
KNBS Kenya National Bureau of Statistics
LAPSSET Lamu Port-South Sudan-Ethiopia Transport
LBQ Leadership Behavior Questionnaire
LDQ Leadership Dimensions Questionnaire
LPI Leadership Practices Inventory
MLDQ Modified Leadership Dimensions Questionnaire
MODeST Mission, Organization, Delivery, Stakeholders and Team
NASA National Aeronautics and Space Administration
OLS Ordinary Least Squares
PIP Project Implementation Profile
PMI Project Management Institute
PMM Project Management Maturity
PMP Project Management Profile
PPPs Private-Public-Partnerships
PSQ Project Success Questionnaire
SPSS Statistical Package for Social Sciences
xv
DEFINITION OF KEY TERMS
Adaptive Leadership: Informal leadership process that occurs in intentional interactions of interdependent human agents (individuals or collectives) working to generate novel solutions to the adaptive needs of the organization (Marion & Uhl-Bien, 2007).
Administrative
Leadership: Managerial leadership that addresses the bureaucratic functions of the organization while not stifling the complex dynamics (Marion & Uhl-Bien, 2007).
Ambiguity: The state of not knowing what to expect or how to comprehend a situation (PMI, 2014).
Anchoring: Cognitive bias attaching great significance to information acquired early in programs or projects (PMI, 2014).
Complex Adaptive
Systems:
Networks of interacting, interdependent agents bonded in a collective dynamic by common need (Marion, 1999).
Complexity Leadership: Multi-level, processual, contextual and interactive leadership meant to enhance innovation, learning, adaptability and new organizational forms (Uhl-Bien & Marion, 2009).
Conceptual Framework: System of concepts, assumptions, expectations, beliefs, and theories that supports and informs the research (Miles & Huberman, 1994).
Connectedness:
Number of connections among project components, stakeholders or team members (PMI, 2014).
Context: Unplanned and uncontrolled mechanisms that emerge naturally in complex adaptive systems (Marion & Uhl-Bien, 2007).
Differentiation: The number of components in a project (Baccarini, 1996).
xvi
Emergence: The anticipated change, spontaneous or gradual, that occurs within the context of a program or project (PMI, 2014).
Framing Effect: The manner in which an individual presents information (PMI, 2014).
Generative Leadership: Leadership style that acts in the interface between adaptive and administrative leadership to foster conditions conducive to the complex interactive dynamics of adaptive leadership and manages the administrative-to-adaptive and innovation-to-organization interfaces (Uhl-Bien, Marion, & Mckelvey, 2007).
Human behavior: The source of complexity that may arise from the interplay of conducts, demeanors and attitudes of people (PMI, 2014).
Interdependence: The degree of interrelatedness among components in a project (Baccarini, 1996).
Involving Leadership: A style that is based on a transitional organization that faces significant but not radical changes in its business model or “modus operandi” (Dulewicz & Higgs, 2005).
Iron Law:
A phrase used to characterize delivery of megaprojects with budget overrun, behind schedule, with benefit shortfalls, over and over again (Flyvbjerg, 2014).
Leadership: The process whereby an individual influences a group of individuals to achieve a common goal (Northouse, 2016).
Leadership Style: The behavior pattern of a person who attempts to influence others (Northouse, 2016).
Loss Aversion: Reluctance to terminate a failing program or project despite clear indications that recovery may be impossible particularly when great deal of energy, emotion and resources have been invested (PMI, 2014).
xvii
Megaproject: A temporary multiparty organization established to create large scale, complex and multibillion dollar physical assets and services such as healthcare, transport, energy, water, waste and ICT systems (Altshuler & Luberoff, 2003; Flyvbjerg, 2014).
Misrepresentation: Deliberate overestimation of costs and schedules or knowingly conveying false information to achieve desired ends (PMI, 2014).
Optimism Bias: The natural tendency of individuals to believe that they are less likely than others to experience negative outcomes (PMI, 2014).
Planning Fallacy: The tendency to underestimate probable costs and time and overestimate probable benefits of efforts in which they or their organizations will be involved (PMI, 2014).
Postmodernism: A position that displays distaste for master-narratives and for a realist orientation (Bryman & Bell, 2007).
Project Complexity: A characteristic of a project that manifests in the interplay among human behavior, systems behavior and ambiguity (PMI, 2014).
Project Success: The criteria, both qualitative and quantitative, against which a project is judged to be successful (Turner, 2007).
Sublime: Rationale for implementing megaproject (Flyvbjerg, 2014).
System Behavior: The source of complexity that arises from interdependencies through connections among their parts or components (PMI, 2014).
System Dynamics: Connectedness and interdependency of many components that interact to cause change over time (PMI, 2014).
Theory: A body of knowledge, which may or may not be associated with particular explanatory models (Thomas, 2007).
xviii
ABSTRACT
The main objective of this study was to investigate the moderating role of project leadership on the influence of project complexity on success of public infrastructural megaprojects in Kenya. This was operationalized through a set of four specific objectives with human behavior, ambiguity, system behavior, project leadership and project success being the main variables. The need for this study arose from the thesis that complexity is the main cause of waste and failure that results in infrastructural megaprojects being delivered over budget, behind schedule, with benefit shortfalls; and that leadership skill is the most important for successful navigation of this complexity. The study was designed as multiple-method research, based on virtual constructionist ontology recognizing that complexity is the mid-point between order and disorder. A census survey of 124 respondents based on 31 completed public infrastructural megaprojects was conducted using three interlinked questionnaires. Quantitative data analysis was conducted using both descriptive and inferential statistics, while qualitative data analysis was done through scenario mapping and triangulation. Almost all the projects surveyed utilized some form of fixed price contract with a consequence that more of these projects were delivered within budget than within schedule. Whereas the context in which public infrastructural megaprojects are implemented reflects considerable uncertainty, emergence, dependency and rapid change, the current project leadership is largely goal-oriented. In fact, analysis of individual behaviors revealed a project culture characterized by internal focus and stability. The study showed that in practice, stakeholder satisfaction was not managed as a key project objective and in some cases it was considered as a front-end activity that was only important during project planning. Consistent with the developments in the success school of project management, the study showed that project management success had no significant relationship with product and organizational success. Inferentially, the study confirmed that complexity had significant influence on success of public infrastructural megaprojects (R2=58.3% with P=0.000). Individually, all the dimensions of project complexity had significant negative influence on success of public infrastructural megaprojects, with human behavior having the greatest influence (R2=0.463 with P<0.025). However, ambiguity dimension ceased to be significant when the complexity dimensions were combined into one model. Interestingly, when project leadership was introduced into the combined model, human behavior completely ceased to predict success but the interaction effect of project leadership with both system behavior and ambiguity remained significant (R2=72.7% with P=0.000). On its own, project leadership had significant positive influence on project success (R2=0.48 with P=0.000) in such a way that success rate increased as leadership style tended towards complexity leadership. In effect, the findings underscored the significance and application of complexity leadership theory, structural contingency theory and complex adaptive systems theory, in the delivery of public infrastructural megaprojects. Consequently, in order to navigate the complexity inherent in these projects, this study recommends adoption of a leadership style anchored on both complexity science and context. Such leadership is expected to be long on both generative and adaptive behaviors.
1
CHAPTER ONE
INTRODUCTION
1.0 Chapter Overview
This chapter introduces the background of the study in which main concepts of the
study are presented. Each of these concepts is discussed briefly with their
interrelationship being explained in the statement of the problem. This is followed by
a list of the study objectives and research hypotheses. The rest of the chapter explains
the justification of the study, its scope and limitations.
1.1 Background of the Study
The International Centre for Complex Project Management (ICCPM) describes
complex projects as those characterized by uncertainty, ambiguity, with emergent
dynamic interfaces, influenced by significant political or external change; are run over
a period which exceeds the product life cycles of the technologies involved or where
significant integration issues exist; are defined by effect (benefit and value) but not by
solution (product) at inception (Hayes & Bennet, 2011). This definition is important
in distinguishing complex systems from complicated ones, which have many moving
parts but they operate in patterned ways. Organizational complicatedness is usually
measured based on the number of procedures, vertical layers, interface structures,
coordination bodies and decision approvals (Morieux, 2011).
Complex systems by contrast are imbued with features that may operate in patterned
ways but whose interactions are continually changing. According to Sargut and
McGrath (2011), three properties determine the complexity of the environment
namely; multiplicity, interdependence and diversity. The inability to manage
complexity has been recognized as a major factor in project failure for a number of
years. However, complexity remains ambiguous and ill-defined in much of the project
2
management literature (Geraldi, 2008) and there has not been sufficient attention paid
to early studies of complex projects.
Based on a review of literature covering research results on project complexity from
late 1960s to mid-1990s, Baccarini (1996) proposed two dimensions of complexity,
namely; differentiation and interdependence, to help distinguish between
organizational and technological complexity. Remington and Pollack (2011) classify
project complexity into four categories namely; structural, technical, directional and
temporal complexity. Cooke-Davies (2011) lists various causes of complexity in
projects, namely; unhelpful behavior, failure to appreciate systemicity, use of abstract
models, simplistic project management and over-ambitious strategic management.
In response to an identified gap in the literature for a grounded framework of
managerial complexity, Maylor, Vidgen, and Carver (2008) carried out a multistage
empirical study in order to determine what makes project or program complex to
manage. The results established a grounded model of structural managerial complexity
commonly referred to as the MODeST model in which Mission, Organization,
Delivery, Stakeholders and Team evolved as high level headings for groups of
characteristics. This study further indicated that there was an additional dimension of
complexity, namely, dynamic complexity which resulted when the elements of
structural complexity were not stable and changed over time (Carver & Maylor, 2011).
The MODeST framework was later reviewed to integrate elements of the literature
based on a categorization framework defined by scale, uncertainty, pace, and socio-
political (Geraldi, Maylor, & Williams, 2011). The result was a highly comprehensive
instrument for assessing complexities which comprised 140 questions measuring both
structural and dynamic complexity. In a comparative study of the Heathrow Terminal
5 and the London 2012 Olympics projects, Brady and Davies (2014) used this model
to illustrate how structural and dynamic complexities were managed in both projects.
To underscore the importance of complexity in determining project outcomes, Project
Management Institute (PMI) published a global practice standard on navigating
complexity in 2014. According to this standard, the causes of complexity in projects
3
and programs are grouped into human behavior, system behavior and ambiguity. The
standard also includes a questionnaire that can be used to assess the causes of
complexity in any given project. The questionnaire is based on a reduced number of
items (cf. Geraldi, Maylor, & Williams, 2011; Maylor, Vidgen, & Carver, 2008) which
makes it more usable.
Human behavior may be the result of factors such as changing power relationships,
political influence, and individuals’ experiences and perspectives. These factors may
hinder the clear identification of project goals and objectives. The human behavior
factors that cause project complexity are usually grouped into four categories namely;
individual behavior, group behavior and organizational design and development.
Based on system behavior, project complexity can also occur as a result of component
connections and when there are disconnects among these components. As a result of
these connections, changes at the component level may create unintended
consequences throughout the program or project thus affecting project success.
Interdependence among the component tasks and stakeholder relationships (Loch, De
Meyer, & Pich, 2006, p.52) is also a key factor explaining project complexity.
Unclear or misleading events, cause and effect confusion, emergent issues or situations
open to more than one interpretation in programs and projects lead to ambiguity (PMI,
2014). As a result of this emergence, the whole is always greater than the sum of the
parts leading to uncertainty in performance of the project metrics. Uncertainty
increases with the number of interdependent actions, the existence of unknowable
unknowns, conflicting perspectives of stakeholders regarding the project deliverables,
inability to fix the scope of the project so as to derive an accurate estimate and the
emergence of new untested technology.
1.1.1 Complexity and Success of Megaprojects
Project success has received considerable attention within project management
research literature over the last decades (Ika, 2009; Pinto & Slevin, 1988b). This
attention has enabled understanding of project success to evolve and reach maturity
4
(Jugdev & Muller, 2005). Project success is now regarded as a multidimensional
construct, with interrelated technical, economic, behavioral, business and strategic
dimensions (Bannerman, 2008; Cao & Hoffman, 2011; Ika, 2009; Jugdev & Muller,
2005; Jugdev, Thomas, & Delisle, 2001; Thomas & Fernandez, 2008).
Most of the researches on this subject often cite operational excellence (i.e. time, cost,
quality) and product success as key measures of project success. However, there has
been little attention given to contextual measures of project success. For instance, very
few researchers (Shenhar & Dvir, 2007a; Hoegl & Gemuenden, 2001) consider the
outcomes of complexity leadership in defining project success measures. As a result,
project success measures are presented in a one-size-fits-all manner without
considering the typology, type or size of the project.
Perhaps this lack of applying contextual measures of project success explains the “iron
law” of megaprojects. Whereas the project landscape has consistently shifted from
simple projects to major- to mega- and now to giga- and terra-projects, project success
theory has not kept the pace. There is need for these measures to reflect the sublimes
of megaprojects (Flyvbjerg, 2014). It is noted however that all the critical success
factors and success measures for a project are aspects of project complexity (see Pinto
& Slevin, 1988b). In their third global survey on the current state of project
management, Price Waterhouse Coopers (2012) identified eleven factors that
contribute to poor project performance. All these factors are explained by project
complexity causes of human behavior, system behavior and ambiguity.
Megaprojects are usually large-scale, complex ventures that cost billions of money,
take many years to develop and build, involve multiple public and private stakeholders,
are transformational, and impact millions of people (Flyvbjerg, 2014). These projects
are generally “greenfield” in nature as they often create new assets and utilize a variety
of delivery models depending on their inherent complexity.
Accordingly, megaprojects are not just magnified versions of smaller projects but
are a completely different breed of project in terms of their level of aspiration, lead
times, complexity, and stakeholder involvement (Flyvbjerg, 2014); implying
5
that they are also a very different type of project to manage. As noted by Brady and
Davies (2014), megaprojects are among the most complex category of project.
Inherent complexity in megaprojects is the main source of contextual risk which is
usually referred to as typological risk (Omonyo, 2015). The magnitude of this risk
increases as we move from an environment of low complexity towards high
complexity. The effectiveness of project control is usually affected by typological risk
in such a way that as the value of the typological risk increases, exercising project
control becomes more difficult. This explains why complex megaprojects are usually
delivered over budget, behind schedule, with benefit shortfalls, over and over again.
Flyvbjerg (2014) characterizes this phenomenon as the “iron law of megaprojects”.
Indeed, several studies linking complexity with project success have confirmed that
complexity predominantly determines project success (Meyer, 2014; Hargen & Park,
2013; O’Donnell, 2010; Shermon, 2011, Flyvbjerg, Holm, & Buhl, 2004; Vanston &
Vanston, 2004).
Projects such as the Boston Big Dig, Denver International Airport and the Sydney
Opera House were delivered in conformity with the “iron law of megaprojects” (PMI,
2011). Flyvbjerg (2014) added to this calamitous list several projects with the Egyptian
Suez Canal reporting the greatest cost overrun of 1900%, and noted that there was no
end in sight for such overruns in megaprojects across the world.
Despite these data, the growth in the use of megaprojects to deliver public products,
services and results has been phenomenal over the past few years. Using the words of
Flyvbjerg (2014), what we are witnessing is a consistent movement from
“megaprojects” such as the Thika Superhighway to “gigaprojects” such as the Konza
Technology City and the Standard Gauge Railway, and finally to “teraprojects” such
as the LAPSSET Corridor project. In the Government of Kenya (2013) Medium Term
Plan, infrastructure was allocated Ksh. 7.5 trillion in project funding for a period of 5
years, more than twice the amount allocated to all the other foundations of national
transformation. Therefore, the main challenge on organizations is to find enough talent
with the right skills to manage the complexity in megaprojects so as to reverse this
inherent trend (PMI, 2013b).
6
1.1.2 Interaction of Project Leadership and Complexity in Success of
Megaprojects
Throughout history, the difference between success and failure, whether in a war,
business, a protest movement, or a basketball game, has been attributed to leadership
(Luthans, 2002). Project managers in early documented achievements such as the
construction of monuments or biblical narratives had to think and practice their
leadership systematically to be successful (Cooke-Davies, 2011). Therefore, in order
to respond positively to complexity in megaprojects, there is need for transformational
leadership (Cooke-Davies, 2011). This is based on the highlights of the 2009 ICCPM
round table series on complex project management which recommended that in future,
managers of complex projects need to be developed and selected based on a range of
leadership skills that enables them to operate in uncertain and ambiguous
environments (Hayes & Bennett, 2011).
Project managers and project leaders consider leadership as the dominant determinant
of project success (Zimmerer & Yasin, 1998). A global survey of 697 project
management practitioners indicated that 75 percent of organizations rank leadership
skills as the most important for successful navigation of complexity (PMI, 2013a) in
megaprojects. The Chaos reports by the Standish Group (2009) suggested that
problems related to successful project outcomes and inevitably the solution to
achieving project objectives that meet stakeholders’ expectations, originates with
people in leadership roles.
A research study by Cambridge University’s School of Business and Economics
concluded that 80% of projects failed because of poor leadership (Zhang & Faerman,
2007). As Hauschildt, Gesche, and Medcof (2000) reported, the success of a project
depended more on human factors, such as project leadership, top management support,
and project team, rather than on technical factors. They also found that the human
factors increased in importance as projects increased in complexity, risk, and
innovation. Further, the researchers found that the critical role of the project manager's
leadership ability had a direct correlation to project outcomes.
7
A project manager is not necessarily a leader. Whereas project leaders conquer the
context-the volatile, turbulent and ambiguous surroundings that sometimes seem to
conspire against us, project managers surrender to the context (Warren, 1989).
Leadership style consists of the behavior pattern of a person who attempts to influence
others (Northouse 2016). The behavior pattern of leaders is in itself defined by a set of
leadership competences (Dulewicz & Higgs, 2005).
All too often, (project) managers rely on common leadership styles that work well in
one set of circumstances but fall short in others (Snowden & Boone, 2007). The reason
why these approaches fail even when logic indicates they should prevail is based on a
fundamental assumption of organizational theory and practice: that a certain level of
predictability and order exists in the world. This assumption, grounded in the
Newtonian science that underlies scientific management, encourages simplifications
that are useful in ordered circumstances. Circumstances change, however, and as they
become more complex, the simplifications can fail. According to Snowden and Boone
(2007), time has come to broaden the traditional approach to leadership and decision
making and form a new perspective based on complexity science with the main
outcomes being innovation, learning, adaptability and new organizational forms (Uhl-
Bien & Marion, 2009).
1.2 Statement of the Problem
Generally, fewer than two-thirds of all projects fail to meet their original goal and
business intent which puts US$135 million at risk for every US$1 billion spent on a
project (PMI, 2013a). The trend becomes more troubling for projects with added
complexity such as public infrastructural megaprojects. In a study of 258 infrastructure
projects, Flyvbjerg et al. (2004) found that nine out of ten such projects had cost
overruns; overruns of up to 50 percent in real terms were common, over 50 percent
were not uncommon. Despite these data, the growth in the use of infrastructural
megaprojects in Kenya to deliver goods and services has been phenomenal. The
complexity inherent in the megaproject environment is often cited as the main cause
of this poor performance (Bain & Company, 2013; Cooke-Davies, Crawford, &
8
Stephens, 2011). Therefore, without a coherent research agenda to understand both its
causes and navigation strategies, complexity continues to result in problems, waste,
economic and social failure (Remington & Zolin, 2011).
A global survey of 697 project management practitioners indicated that 75 percent of
organizations ranked leadership skill as the most important for successful navigation
of complexity (PMI, 2013a) in megaprojects. Unfortunately, existing studies on
project leadership cannot be generalized to complex megaprojects since these studies
assume fairly orderly and stable organizational settings (Chen, Donahue, & Klimoski,
2004; Packendorff, 1995). Further, these studies have treated project leadership as the
main determinant of project success rather than as a variable that becomes depending
on the level of project complexity.
Using managers, team members and sponsors of completed public infrastructural
megaprojects as respondents, this multiple-method research based on virtual
constructionist ontology sought to address these gaps through a deeper understanding
of the extent to which complexity influences success of public infrastructural
megaprojects; and the role of project leadership in moderating that influence
considering the context of megaprojects.
1.3 Objectives of the Study
1.3.1 General Objective
The main objective of this study was to investigate the moderating role of project
leadership on the influence of project complexity on success of public infrastructural
megaprojects in Kenya.
1.3.2 Specific Objectives
The specific objectives of this study were to:
9
i. Determine the influence of human behavior on success of public infrastructural megaprojects;
ii. Determine the influence of ambiguity on success of public infrastructural megaprojects;
iii. Determine the influence of system behavior on success of public infrastructural megaprojects;
iv. Explore the moderating role of project leadership on complexity and success of public infrastructural megaprojects;
1.4 Research Hypotheses
Hypotheses for this study were derived based on review of relevant literature. The
explanation for the direction of each hypothesis is shown in section 2.3 of this thesis.
This study tested the following research hypotheses:
i. HA: Human behavior has significant influence on success of public
infrastructural megaprojects.
ii. HA: Ambiguity has significant influence on success of public infrastructural megaprojects.
iii. HA: System behavior has significant influence on success of public infrastructural megaprojects.
iv. HA: Project leadership has significant moderating effect on complexity and success of public infrastructural megaprojects
1.5 Justification of the Study
In the Project Management Talent Gap Report, PMI (2013b) reports that from 2010
through 2020, 1.57 million project management jobs will be created each year
globally. Given that complex megaprojects are now the preferred model to deliver
products, services and results across a range of businesses, sectors and major events,
it is highly probable that most of these jobs will involve management of such projects.
This study contributes to the raging contemporary debate on how this iron law of
complex megaprojects can be reversed through project leadership.
10
As far as Kenya is concerned, this study is pioneering in nature and opens up this area
for further research in order to ensure that the delivery capability of megaprojects is
enhanced. The findings of this study are of benefit to megaproject managers, sponsors
and donors, contextual stakeholders, policy makers and researchers focusing on
megaproject success. In line with Turner, Huemann, Anbari, and Bredillet (2010)
classification of project management research, this study contributes to the
governance, behavior, success, contingency and decision schools of project
management.
1.6 Scope of the Study
This study was carried out within the context of the postmodern social world which is
characterized by discourse, rhetoric and reflexivity. For that matter, only
infrastructural projects implemented within the complex context were included in this
study. The choice of projects to include in this study was guided by the definition of
complex projects as provided by the ICCPM. A further criterion that projects in this
study satisfied related to their budget.
The population of projects in this study comprised completed complex infrastructural
megaprojects implemented by the government of Kenya over the last 10 years with a
minimum budget of approximately Ksh. 1 billion. Infrastructure was selected because
of its huge actual and projected expenditure when compared to the other foundations
of national transformation (Government of Kenya, 2013). This sector was allocated
Ksh. 7.5 trillion in the Government of Kenya 2013 Medium Term Plan, more than
twice the Ksh. 3.4 trillion allocated to all the other foundations of national
transformation.
1.7 Limitation of the Study
Data collection for this study fell behind by about five months as a result of the busy
schedule of project managers of the surveyed projects, as most of them were always
away on other assignments. Patience finally paid off. Getting the project leadership
questionnaire filled was particularly difficult because it involved project team
11
members assessing the leadership behavior of their project managers and some of them
did not feel at ease with this. The use of various organizational departmental heads to
coordinate the study helped overcome this fear. In some instances, there was no team-
the client organization had just a project manager overseeing the work by the
contractors. Under such circumstances, employees within the same functional area as
the project manager assisted in conducting this assessment. This study only considered
the issue of benefits from a short run point of view because the project appraisal
documents for these projects showed that the project benefits shall be realized
gradually over a longer time horizon.
12
CHAPTER TWO
LITERATURE REVIEW
2.1 Introduction
This chapter presents the theoretical and conceptual frameworks governing the study
together with empirical review of literature relevant to the variables contained in the
conceptual framework. A critical review of the existing literature is also presented
followed by a summary of both theoretical and empirical literature review. The last
section in this chapter identifies the research gaps that were addressed by this study.
2.2 Theoretical Framework
This study was operationalized through cognitive bias theory, structural contingency
theory, complex adaptive systems theory, agency theory, Cynefin Framework,
complexity leadership theory and project success theory. Project success theory was
presented as a body of knowledge while cognitive bias, structural contingency, Cynefin
Framework, agency, complex adaptive systems, and complexity leadership theories,
were presented as prescriptive theories.
2.2.1 Human Behavior
Human behavior was studied at three levels namely; micro, meso and macro. The first
level involved the study of individuals in organization, the second level involved the
study of work groups and the third level involved the study of how organizations
behave (Wagner & Hollenbeck, 2010). The study used the Cognitive Bias Theory was
used to explain individual behavior and group behavior while Structural Contingency
Theory was used to explain organizational design and development.
13
Cognitive Bias Theory
This theory stems from the broader family of Cognitive Psychology theories with its
main proponents being Amos Tversky and Daniel Kahneman. The theory
demonstrates several replicable ways in which human judgments and decisions differ
from rational choice theory. Accordingly, individuals create their own subjective
social reality from their perception of the input; and this construction of social reality,
not the objective input, may dictate their behavior in the social world (Bless, Fiedler,
& Strack, 2004).
According to this theory, a cognitive bias is a systematic pattern of deviation from
norm or rationality in judgment (Haselton, Nettle, & Andrews, 2005). The notion of
cognitive biases developed out of people's innumeracy, or inability to reason
intuitively with the greater orders of magnitude. Thus, cognitive biases may sometimes
lead to perceptual distortion, inaccurate judgment, illogical interpretation, or what is
broadly called irrationality (Ariely, 2008). Not all cognitive biases are bad since some
cognitive biases may lead to more effective actions in a given context. Psychologists
believe that many of these biases serve an adaptive purpose by allowing us to reach
decisions quickly, which can be vital if we are facing a dangerous or threatening
situation. Furthermore, cognitive biases enable faster decisions when timeliness is
more valuable than accuracy, as illustrated in heuristics (Tversky & Kahneman, 1974).
Following this theory, biases arise from various processes including: information-
processing shortcuts, also referred to as heuristics which involves mental shortcuts that
provide swift estimates about the possibility of uncertain occurrences (Baumeister &
Bushman, 2010); distortions in the process of storage in and retrieval of information
from memory; the brain's limited information processing capacity; emotional and
moral motivations; and social influence.
Biases can be distinguished on a number of dimensions. For example, there are biases
specific to groups (such as the risky shift, groupthink, groupshift) as well as biases at
the individual level (such as optimism bias, anchoring, framing effect,
misrepresentation); some biases affect decision-making, where the desirability of
options has to be considered (e.g., sunk costs fallacy); others such as illusory
14
correlation affect judgment of how likely something is, or of whether one thing is the
cause of another; a distinctive class of biases affect memory such as consistency bias
(remembering one's past attitudes and behavior as more similar to one's present
attitudes); some biases reflect a subject's motivation, for example, the desire for a
positive self-image leading to egocentric bias and the avoidance of unpleasant
cognitive dissonance.
The postulations of this theory are significant in defining the constructs and measures
of individual as well as group behavior.
Structural Contingency Theory
The main premise in structural contingency theory is that there is no one best
organizational structure; rather, the appropriate organizational structure depends
on the contingencies facing the organization (Burns & Stalker, 1961; Chandler,
1962). The theory posits that organizations will be effective if managers fit
characteristics of the organization, such as its structure, with contingencies in
their environment (Donaldson, 2001). One of the most important concepts in the
theory is alignment. An organization whose characteristics align with the
contingencies in its situation will perform more effectively compared to an
organization whose characteristics do not fit with the contingencies in its situation.
According to the theory, there are two main contingencies: organizational size and
organizational task.
2.2.2 Ambiguity and System Behavior
Complex Adaptive Systems Theory
Complex Adaptive Systems (CAS) theory also referred to as Complexity theory, states
that critically interacting components self-organize to form potentially evolving
structures exhibiting a hierarchy of emergent system properties (Lucas, 2009). The rise
of CAS as a school of thought is usually attributed to the mid-1980’s formation of the
Santa Fe Institute, a New Mexico think tank formed in part by the former members of
the nearby Los Alamos National Laboratory. The scientists here claimed that through
15
the study of complexity theory, one can see both laws of chaos and that of order;
through which an explanation for how any collection of components will organize
itself can be generated.
This theory takes the view that systems are best regarded as wholes, and studied as
such, thus rejecting the traditional emphasis on simplification and reduction as
inadequate techniques. Complexity theory is concerned with the study of how order,
structure, pattern, and novelty arise from extremely complicated, apparently chaotic
systems and conversely, how complex behavior and structure emerges from simple
underlying rules. The theory attempts to discover how the many disparate elements of
a system work with each other to shape the system and its outcomes, as well as how
each component changes over time (PMI, 2014).
Insights from the study of complexity in the life sciences suggests that there is a natural
tendency for all organisms (including human kind and social organisms such as project
teams) to evolve complex responses to challenges that they encounter in their
environment. This provides a compelling argument for why there is a pressing need
for a coherent research agenda to understand both the causes of complexity, and what
can be done to prevent it resulting in problems, waste, economic and social failure
(Remington & Zolin, 2011).
Another important concept in complexity theory is that there is no master controller of
any system. Rather, coherent system behavior is generated by the competition and
cooperation between actors that is always present. The components of a system have
different levels of organization-made up of divisions, which contain different
departments, which in turn comprise different workers. But the important
differentiation from this organization is that complex adaptive systems are constantly
revising and rearranging their building blocks as they gain experience (Caldart & Joan,
2004).
In summary, CAS theory identifies key distinguishing characteristics of a complex
system namely; context, emergence, uncertainty, connectedness, dependency and
system dynamics. The first three characteristics define the ambiguity dimension of
complexity while the last three define the system behavior dimension.
16
Agency Theory
Agency theory, also referred to as principal-agent problem or agency dilemma, has its
roots in behavioral economics and has been used extensively in organization behavior
(Eisenhardt, 1985; 1988). This theory relates to risk sharing among groups that are in
a contractual relationship. According to this theory, agency problem occurs when
cooperating parties have different goals and vision of labor (Jensen & Meckling,
1976).
Agency theory is concerned with resolving two problems that can occur in agency
relationships. The first is the agency problem that arises when (a) the desires or goals
of the principal and agent conflict and (b) it is difficult or expensive for the principal
to verify what the agent is actually doing. The second is the problem of risk sharing
that arises when the principal and agent have different attitudes toward risk. The
problem here is that the principal and the agent may prefer different actions because
of their different risk preferences (Eisenhardt, 1989). For instance, in a cost-plus
percentage fee contract, a contractor may have no incentive to reduce costs since the
higher the delivery cost, the higher their fee.
Using the contract as the unit of analysis that governs the relationship between the
principal and the agent, this theory is concerned with determining the most efficient
contract to be used in governing the agency relationship given the assumptions made
about people, organizations and information. The fundamental concern of this theory
is whether a behavior-oriented contract (e.g., salaries, hierarchical governance) is more
efficient than an outcome-oriented contract (e.g., commissions, stock options, transfer
of property rights, market governance) (Eisenhardt, 1989).
This theory provides key insight into how to structure the context of the project in
order to align the interests of both the client and contractor so as to minimize the risk
of cost overruns, schedule delays and benefit shortfalls.
17
2.2.3 Project Leadership
Cynefin Framework
This theory is attributed to Snowden and Boone. It stems from the philosophical
positions held about what is a project and project management. According to this
theory, the social world of projects can be divided into pre-modern, modern,
postmodern and hypermodern/late modern (Gauthier & Ika, 2012). Snowden and
Boone (2007) referred to these worlds respectively as; simple, complicated, complex
and chaos.
Each of these social worlds of projects see project management and the project
manager differently. For instance, the theory conceives the simple world to
philosophize projects and project management before the onset of modernity. These
projects are driven by the need to stimulate the economy and to serve the glory of a
god or his representative, or a religion (Kozak-Holland, 2011). The project manager
figure is a priest (Gauthier & Ika, 2012). Project management is relatively simple since
best practices exist, and there is stability with clear cause-and-effect relationships. In
this realm of known knowns, the approach to leadership is sense, categorize and
respond. To do this, the leader ensures that proper processes are in place, delegates,
uses best practices and communicates in clear, direct ways (Snowden & Boone, 2007).
The modern project management is closely linked to the scientific management
approach (Joffre, Auregan, Chedotel, & Tellier, 2006). These projects have a core
belief in progress, through knowledge and reason, thus challenging religion, myth, and
tradition (Habermas, 1997). In this world, a project is a temporary endeavor
undertaken to create a unique product, service or result, and project management is the
application of skills, knowledge, tools and techniques to project activities to produce
results (PMI, 2013c). The approach to leadership in this context is to sense, analyze
and respond. The leader does this by using co-located and expert teams and by
listening to conflicting advice (Snowden and Boone, 2007).
18
The postmodern and the hypermodern social worlds have evolved with the
development of socio-technical objects such as the internet (Giddens, 1990) (see also.
Beck, 1992; Beck, Giddens, & Lash, 1994; Charles, 2009). This world emphasizes
constant redefinition as a means of avoiding the pitfalls experienced by modernity
(Dery, 2009). In this world, reflexivity and rhetoric thrive over reason and the project
is either a network of actors embedded in a social context and in constant
transformation, or, a discourse of legitimation and an arena of social and power plays
serving the interests of powerful stakeholders (George & Thomas, 2010; Hodgson &
Cicmil, 2006).
Depending on whether the postmodern world is predominantly characterized by rapid
change or by emergence, the approach to leadership is either to act or probe before
sensing and responding (Snowden & Boone, 2007). The leader does this by either;
looking for what works instead of searching for right answers, taking immediate action
to reestablish order and providing clear direct communication, or by creating
environments and experiments that allow patterns to emerge, increasing levels of
interaction and communication, using methods that can help generate ideas,
encouraging dissent and diversity and managing starting conditions and monitoring
them for emergence.
This theory is important to this study as it spells out the contexts in which a leader can
apply fact-based leadership (i.e., simple and complicated) and those in which
mechanism-based or pattern-based leadership can be applied (i.e., complex and chaos).
Of essence to this study is the theory’s proposition that leadership is processual and
becoming depending on the context of the project. Thus, the theory is key in explaining
how leadership style interacts with the project context to determine desired outcomes.
Complexity Leadership Theory
Given the centrality of complexity in determining organizational outcomes,
researchers have developed new approaches to leadership grounded in complexity
theory (Lord, 2008; Uhl-Bien, Marion, & McKelvey, 2007; Surie & Hazy, 2006).
These approaches are motivated by the desire to develop leadership models that more
19
accurately reflect the complex nature of leadership as it occurs in practice (Uhl-Bien
& Marion, 2009). They represent a growing concern that traditional models of
leadership are insufficient for understanding the dynamic, distributed, and contextual
nature of leadership in organizations (McKelvey, 2008; Johannessen & Stacey, 2005).
These approaches to leadership are consistent with the central assertion of the meso
argument that leadership is multi-level, processual, contextual, and interactive (Uhl-
Bien & Marion, 2009). One such approach is the Complexity Leadership Theory
(CLT). CLT is a “framework for leadership that enables the learning, creative, and
adaptive capacity of complex adaptive systems (CAS) in knowledge producing
organizations or organizational units”. CLT entails the study of the interactive
dynamics of complex adaptive systems embedded within contexts of larger organizing
systems.
CLT is a contextual theory of leadership that describes leadership as necessarily
embedded in context and to study it requires consideration and examination of context
in both theorizing and operationalization (Uhl-Bien & Marion, 2009). Unlike other
models of leadership such as Transformational Leadership Theory (TLT), CLT does
not view change as only, or even primarily, top-down; it does not see change as being
“led” in the traditional sense of the word. Rather, a core premise of CLT is that change
is emergent, unpredictable, and essentially uncontrollable (Marion & Uhl-Bien,
2007).The main outcomes of Complexity Leadership Theory are innovation, learning,
adaptability and new organizational forms.
CLT seems to combine three styles of leadership namely, adaptive, generative and
administrative. The purpose of adaptive leadership based on behaviors such as
stepping back, identifying adaptive challenges, regulating distress, maintaining
disciplined attention, giving the work back to the people, protecting leadership voices
from below (Heifetz, 1994).
The purpose of generative leadership is to embrace informal leadership that fuels
entrepreneurial system within the organization. The leader behaviors that characterize
this style include harnessing interaction experience, aligning interactions towards
20
achievement of system goal, enhancing interaction speed, interaction partitioning to
manage resource allocation and interfaces, interaction leveraging through
documenting and communicating lessons and establishing centers of excellence (Surie
& Hazy, 2006).
The purpose of administrative leadership is to loosen administrative systems in order
to create an enabling environment for complexity leadership to thrive. The leader
behaviors that characterize this style include: solving problems, understanding people
and social systems, envisioning, managing resources, motivating, achieving,
influencing, and adhering to rules and regulations (Katz, 1955; Mumford, Zaccaro,
Harding, Jacobs, & Fleishman, 2000).
2.2.4 Megaproject Success
Project Success Theory
There have been various attempts over the history of project management to define
suitable criteria against which to anchor and measure project success (McLeod,
Doolin, & MacDonell, 2012). The most recognized of these measures is the long
established and widely used “iron triangle” of time, cost and quality (Atkinson, 1999;
Cooke-Davies, 2002; Ika, 2009; Jugdev, Thomas, & Delisle, 2001). However, the
“iron triangle” dimensions are inherently limited in scope. As such, a project that
satisfies these criteria may still be considered a failure; conversely a project that does
not satisfy them may be considered successful (Ika, 2009). The “iron triangle” only
focuses on the project management process and does not incorporate the views and
objectives of all stakeholders (Bannerman, 2008; Jugdev & Muller, 2005).
Researchers have progressively widened the scope and constituency of what is meant
by project success, recognizing that project success is more than project management
success and that it needs to be measured against overall objectives of the project thus
reflecting a distinction between the success of a project’s process and that of its product
(Markus & Mao, 2004). Product success involves such criteria as product use, client
satisfaction and client benefits (McLeod et al., 2012).
21
Researchers are also increasingly advocating for project success criteria that
incorporates achievement of broader set of organizational objectives involving
benefits to the wider stakeholder base (Shenhar & Dvir, 2007b). This is plausible given
that projects are a means of delivering the organization’s strategic objectives.
Proponents of this school of thought advocate for inclusion of success criteria such as
business and strategic benefits. This study considered project success using this
broader definition that includes process, product and organizational success.
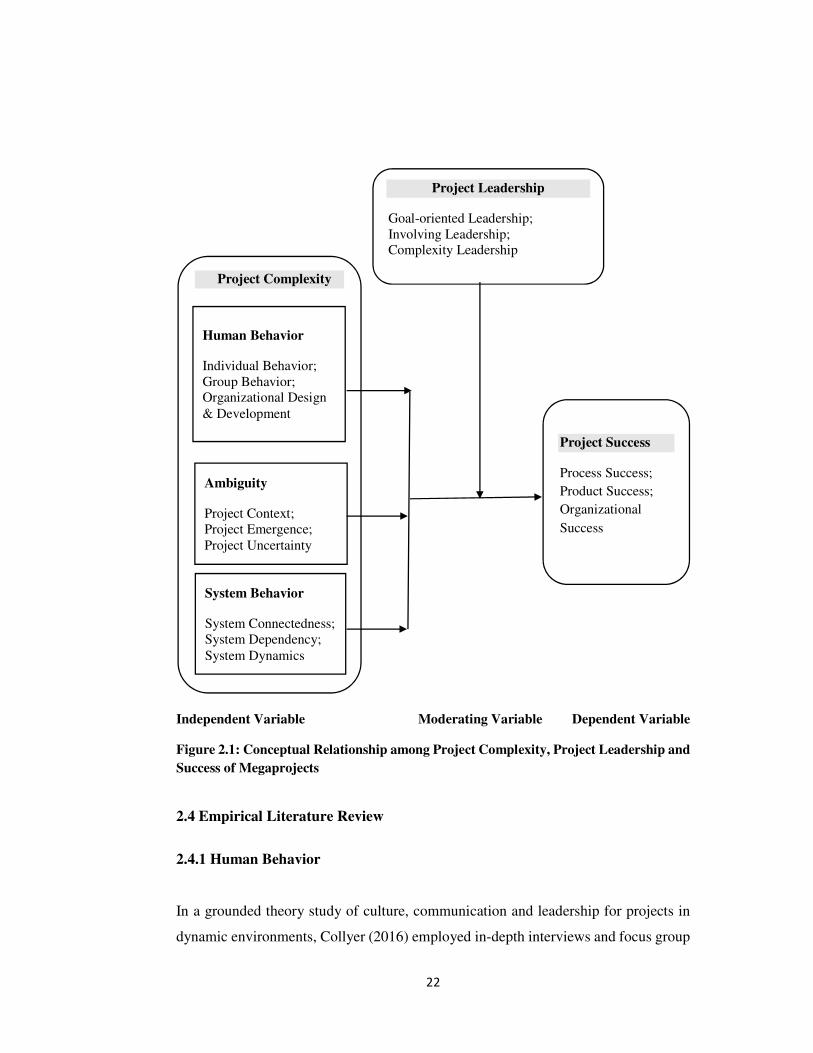
2.3 Conceptual Framework
Based on the review of extant literature, complexity (caused by human behavior,
ambiguity and system behavior) was identified as the independent variable that
influences success of infrastructural megaprojects. Success of infrastructural
megaprojects (defined as process, product and organizational) was identified as the
dependent variable, while project leadership (defined by leader behaviors i.e., goal-
oriented, involving and complexity) was identified as the moderating variable. The
moderation model tests whether the prediction of a dependent variable from an
independent variable differs across levels of a third variable (Aiken & West, 1991).
Figure 2.1 presents the research conceptual model followed by this study.
22
Independent Variable Moderating Variable Dependent Variable
Figure 2.1: Conceptual Relationship among Project Complexity, Project Leadership and
Success of Megaprojects
2.4 Empirical Literature Review
2.4.1 Human Behavior
In a grounded theory study of culture, communication and leadership for projects in
dynamic environments, Collyer (2016) employed in-depth interviews and focus group
Project Complexity
Human Behavior
Individual Behavior; Group Behavior; Organizational Design & Development
Ambiguity
Project Context; Project Emergence; Project Uncertainty
System Behavior
System Connectedness; System Dependency; System Dynamics
Project Leadership
Goal-oriented Leadership; Involving Leadership; Complexity Leadership
Project Success
Process Success;
Product Success;
Organizational
Success
23
discussions involving practitioners across 10 industries. The themes that emerged out
of this study related to vision-led, egalitarian, goal-oriented culture supporting
experimentation; timely and efficient communication; and flexible leadership with
rapid decision making. These themes define critical human behaviors that are required
to navigate complexity that abounds infrastructural megaprojects. In another study
involving a critical review of extant literature, Olaniran, Love, Edwards, Olatunji, and
Mathews (2015) conclude that complex interactions between project characteristics,
people, technology, and structure and culture contribute to the occurrence of cost
overruns in hydrocarbon megaprojects. This supports the thesis that human behavior
(as identified by people, structure and culture) have an effect on the success of
megaprojects.
In a study to establish the effect of optimism bias on the decision to terminate failing
projects, Meyer (2014) used an experimental design in which a five-group, post-test-
only, randomized experiment jointly varied invested amount and project progress and
then read the scenario with regard to return on investment and salvage value. Using a
combination of Chi-Square test of association and Correlation analysis, the results of
the study indicated that decision makers believe that their own managerial efforts will
affect the time and cost overruns on the project. Additionally, the findings led to the
conclusion that the estimated business benefit from the project will exceed the
calculated business benefit. According to this study, in-project optimism bias is a
significant contributor to decision maker’s motivation to continue with a failing
project. For post-project optimism bias, the study showed that it is prevalent
throughout the project and increases as the project approaches the end. The
conclusions of this study are in line with the findings of Lovallo and Kahnemann
(2003) whose research concluded that optimism and risk aversion were the main biases
in forecasting and risk taking and that these two undermine executives’ decision-
making. Mackie and Preston (1998) also found optimism to be among the 21 sources
of error and bias in appraisal of transport projects.
In exploring the role of project management maturity (PMM) and organizational
culture in perceived performance, Yazici (2009) conducted a survey-based research
24
with 86 project professionals from the manufacturing and service sectors in the United
States of America. This study revealed that PMM is significantly related to business
performance but not to project performance. According to this study, organizational
culture change towards sharing, collaboration and empowerment, is required in order
to deal with (overruns) in project time, cost and expectations.
In a study to identify systematic biases in project failures, Shore (2008) conducted
research on 8 large projects and wrote case studies on each failure to demonstrate how
organizational and project culture could contribute to those biases. The findings of the
study confirmed that there are indeed systematic biases and culture in project failure
that is worth exploring. The main premise of this study was the fact that systematic
biases are common in the human decision-making process and this provides a
fundamental reason why project failure should not be an unexpected result.
In a study of the causes of cost overruns in 258 transport infrastructure projects across
20 nations, Flyvbjerg, Holm, and Buhl (2004) used Regression Analysis and found a
statistically significant relationship between cost escalation and schedule delay
(implementation sluggishness). They also found a statistically significant relationship
between cost escalation and project size. This study examined four kinds of
explanation of cost underestimation: technical, economic, psychological, and political.
The study concluded that underestimation cannot be explained by error and is best
explained by strategic misrepresentation, that is, lying, which is an aspect of individual
behavior. This is in line with the findings in Bruzelius, Flyvbjerg, and Rothengatter
(2002) who in a study on improving accountability in megaprojects, argued that
differences between forecasts and actual costs could only be explained by the strategic
behavior of the project proponents. They identify lack of long-term commitment, rent
seeking behavior for special interest groups and the tendency to underestimate in
tenders to get proposals accepted, as the main strategic behaviors of project proponents
that adversely affect project outcomes.
In a study of cost and time overruns in public sector projects, Morris (1990) identified
bureaucratic indecision and a lack of coordination between enterprises to be among
the main causes of cost and time overruns in large public sector projects. Both these
25
factors map onto organizational design and development as an aspect of human
behavior. In a similar study, Kaliba, Muya, and Mumba (2008) conducted a study on
cost escalation and schedule delays in road construction projects in Zambia and found
that administrative structures and inexperienced administrative personnel were among
the factors that explained cost overruns.
The totality of this empirical review is to suggest that human behavior can have either
positive or negative outcomes depending on the context. For instance, some positive
psychologists postulate that optimism could be a very positive force at the workplace
as it could motivate project teams to work harder, have high levels of inspiration and
set stretch goals (Luthans, 2002). In the same veil, negative psychologists believe that
optimism has a downside effect that could lead to dysfunctional outcomes. As
Hauschildt, Gesche, and Medcof (2000) report, the success of a project depend more
on human factors, such as project leadership, top management support, and project
team, rather than on technical factors. They also found that the human factors increased
in importance as projects increased in complexity, risk, and innovation. Further, the
researchers found that the critical role of the project manager's leadership ability had
a direct correlation to project outcomes. With this understanding, this study tested a
non-directional research hypothesis that:
HA1: Human behavior has significant influence on success of public infrastructural
megaprojects.
2.4.2 Ambiguity
In a study on managing structural and dynamic complexity, Brady and Davis (2014)
use a comparative study of two successful megaprojects to illustrate the importance of
handling ambiguity in order to deliver such projects successfully. The study
underscores the need for: integrated project teams which are expected to come up with
innovative solutions in the face of uncertainty and emergence; prototyping and testing
new technology offsite prior to introduction on site; and an integrated change control
system to deal with progressive elaboration in scope and its consequences.
26
To determine the relationship between ambiguity acceptance and project outcomes,
Hargen and Park (2013) conducted an online survey of 2 Fortune 100 and 2 Fortune
500 companies, all of which had implemented Six Sigma and used teams as the core
deployment tool for improvement projects. The companies selected had annual sales
in the range of US$ 4 billion-US$ 51 billion with the total number of employees
ranging between 34,000-122,000. In total, 123 team leaders and 125 team members
responded to the survey. Using a combination of Principal Component Analysis,
Correlation Analysis and Regression Analysis, the study confirmed that there is a
curvilinear relationship between open communication and customer outcomes of a Six
Sigma project in the team leader group but found a linear relationship in the team
member group. The study also established a significant positive relationship between
ambiguity and both customer and organizational outcomes, underscoring the
relationship between ambiguity as a dimension of complexity and outcomes.
In a study of the antecedents and impacts of ambidexterity in project teams, Liu and
Leitner (2012) used an in-depth case study of a complex infrastructure project facing
unique challenges and tight budget and schedule to demonstrate the need for
simultaneous pursuit of innovation and efficiency in complex engineering projects.
They argue that both exploration and exploitation are likely to be needed for complex
engineering projects to succeed. The study found that ambidexterity at the project team
level is a significant contributor to project performance; the effects of temporal
separation and project context on project performance are mediated by the project
team's degree of ambidexterity.
A key contribution of the study by Liu and Leitner (2012) is the characterization of
contextual ambidexterity as that which utilizes behavioral and social means of
integrating exploration and exploitation. Contextual ambidexterity is achieved through
empowering individuals to decide on the time spent on exploration activities or
exploitation activities. To achieve contextual ambidexterity, alignment and
adaptability of organizational activities and capabilities must be ensured so as to meet
changing demands. In the case of the present study, we utilize contractual
arrangements as one way of ensuring contextual ambidexterity in infrastructural
27
megaprojects. As Ghosh, Williams, Askew, and Mulgund (2012) rightly observe,
contracting strategy of a project is a driving force that gives stimulus to project pace.
In a study to investigate the importance and usefulness of stability (i.e., ability of
schedules to absorb emerging disruption) to project outcomes, Swartz (2008)
conducted a survey with managers involved in aviation systems development. The
study established that stability was perceived to be as important as the more common
measures of project performance (time, cost, quality) and that perceptions differed
depending on program size, scope (both could be used to explain complexity) and stage
of completion and between managers based on their levels of experience and training.
In a study to examine the influence of product requirements ambiguity on new product
development task structures, Duimering, Ran, Derbentseva, and Poile (2006) used
interview data from new product development project managers in a large telecom
firm to show that knowledge of how the task structures evolve (emergence) can lead
to improved strategies for managing projects with ambiguous requirements. These
strategies include decomposition of project tasks to reduce interdependence among
tasks and flexible adaptation of the task structures. The study also underscores the role
of communication, coordination, knowledge and problem solving in resolving
ambiguity.
From the foregoing, it is clear that ambiguity plays a major role in success of projects.
The direction of the relationship of ambiguity and success is not apparent as there are
instances when it leads to negative consequences and others when it leads to positive
consequences. It is on this basis that this study sought to test a non-directional
hypothesis that:
HA2: Ambiguity has significant influence on success of public infrastructural
megaprojects.
2.4.3 System Behavior
In a study titled, “Toward a Systemic View to Cost Overrun Causation in Infrastructure
Projects”, Ahiaga-Dagbui, Love, Smith, and Ackermann (2017) posit that a poor
28
understanding and treatment of project complexity and systemicity is the most
common shortcoming of cost overrun research undertaken thus far. They further
contend that a vast majority of infrastructure overrun studies utilizing systems thinking
frame the overrun problem in a manner that ignores the typological context of the
projects. Thus, singular and independent causes of overruns that are identified through
techniques such as multiple regression and correlation do not reflect the becoming
nature of the infrastructural megaproject environment. The study recommends
understanding overruns through an understanding of the entire system in which the
project is implemented by using techniques such as cognitive mapping, retrospective
sense-making and systems dynamics.
In a comparative study of two successful megaprojects, Brady and Davies (2014)
provide a conceptualization of project complexity and its management following
literature review. They categorize complexity into two, namely; Structural and
dynamic. Dynamic complexity has already been explored under ambiguity. Structural
complexity involves arrangement of components and subsystems into an overall
system architecture and is a key determinant of system behavior. In their study, Brady
and Davies (2014) advise that decomposition of the project into more manageable
components is critical in handling structural complexity arising from systems
hierarchy and interdependence among components, using a systems integrator to
manage technical and organizational interfaces is useful for systems integration while
collaborative arrangements such as the use of integrated project teams, co-location,
transparency and proactive stakeholder engagement, is important in managing
structural complexity arising from stakeholder relationships.
Using a non-experimental, quantitative approach, O’Donnell (2010) conducted a study
with the objective of providing insight into the relationships among project
management leadership practices, project complexity, and measurements of project
success within a variety of projects across six different organizations. The primary
population for the study comprised 105 project managers and approximately 300
project stakeholders (management, team members, sponsors, customers) within the
United USA. In this study, project success was measured from two perspectives:
29
internal metrics of cost and time actual versus plan and an external survey of project
stakeholder perceptions of success. Using Structural Equation Modelling, this study
found that increasing project complexity had a strong, negative correlation to internal
success but no relationship to external success. Also, complexity was shown to
moderate the relationship between leadership and internal success, but again, did not
moderate the relationship between leadership and external success, which remained
strong throughout all levels of project complexity.
In an attempt to understand the impact of complexity on cost and schedule estimates,
Shermon (2011) asked the question, “how accurate is a parametric model?” To
determine the relative accuracy of estimates for a complex project, a data set was
employed containing more than 90 fighter aircraft. The approach was to normalize the
cost and technical data. Costs were normalized against currency, economics,
economics and quantity. The technical data were normalized for metric, imperial and
other such anomalies. After normalization, the fighter aircraft data were subjected to
the analysis process and a simple parametric model was created. The historical projects
then had their costs predicted based on this parametric model. To assess the accuracy
of this technique, the predictions were plotted against the historical data and the
coefficient of determination (R2) calculated through a series of the graphs. The system
provided a poor model with R2=0.23. However, there was an immediate increase in
accuracy when the complexity of the systems, indicated by the time dependent residual
was added to the Cost Estimating Relationship (R2=0.87) (Shermon, 2011).
The empirical literature for the studies reviewed show that system behavior has a
relationship with project success. However, the direction of that relationship is not
apparent even though one study expressly states that it could have negative effect on
internal success. The present study takes the apriori view that depending on the
context, system behavior can provide an opportunity to innovate and enhance
outcomes. It is thus hypothesized that:
HA3: System behavior has significant influence on success of public infrastructural
megaprojects.
30
2.4.4 Project Leadership
In a comparative study of two megaprojects, Brady and Davies (2014) demonstrated
how complexity leadership was applied by the British Airports Authority and the
Olympic Delivery Authority to manage both structural and dynamic complexity. The
two projects are the over US$ 7 billion Terminal 5 project and the over US$ 13 billion
London 2012 Olympic Park, respectively. Both these projects were system of systems
(array projects) with very high levels of complexity. In both projects there was
deliberate effort to create collaborative culture and integrated teams were used to come
up with innovative solutions to emergent problems. In the case of the London
Olympics project, the overall leadership approach was tight-loose. Loosening
behaviors (exploration) involve enabling conditions for interaction, search,
experimentation and information flows whereas tightening behaviors (exploitation)
involve reducing variance through choice, execution, standardization, and restricting
information flows (Uhl-Bien, 2012).
In order to identify a leadership style which can maximize the potential for project
managers to achieve project success, Blaskovics (2014) used a mixture of library
search (archiving) and field research (using qualitative interview of four project
managers from one Information Technology company) to prove that project managers
use a special combination of leadership style based on emotional intelligence and
leadership style based on behavior. The study showed that the more democratic
elements like communication, empowerment or creating an atmosphere which
supports generating innovative ideas contribute to project success to a greater extent.
The results of the study showed that classic elements are very important to achieve
project success and cannot be neglected, but it should be enhanced by a more
democratic leadership style. These results are more important for the project managers
in an agile project environment.
In a study to examine leadership and adaptability in the healthcare industry using a
complexity lens, Uhl-Bien (2012) conducted qualitative investigation in 6 hospitals to
examine leadership processes in the context of a strategic initiative. In this research,
each hospital was visited twice-first with the executive team to identify the strategic
31
initiative and second to snowball the sample. A total of 195 interviews were conducted
between April 2008-July 2009. The study found that Healthcare is “in” complexity,
which is evidenced by increasing variety in (and pressures from) the environment and
the traditional leadership is inadequate for operating in these contexts because it
generates an “ordered” response that does not meet the needs of complexity (Uhl-Bien,
2012). Despite the importance of “complex” responses, the study found that only 2 of
the 6 hospitals engaged in leadership styles appropriate to a complex response. The
other 4 hospitals responded using traditional leadership approaches. Of the two who
engaged in complex responses, one was reported to be thriving but the other
overwhelmed the system resulting in the leadership team being ejected. Of the 4 who
engaged in traditional responses, 2 used overpowering administrative leadership that
stifled or suppressed adaptive dynamics. The leadership teams of these hospitals were
either completely turned over or in leadership transition. The other 2 were either in
status quo or steady state.
In exploring the question as to whether successful leaders of large-scale complex
projects have an internal process leading to a display of administrative, adaptive, and
enabling behaviors that foster adaptive processes and enabling behaviors within their
teams and with external stakeholders, Pisarski et al. (2011) developed a model in
which they proposed interactions of key attributes, namely cognitive flexibility, affect,
and emotional intelligence. The result of these cognitive-affective attribute
interactions is leadership leading to enhanced likelihood of complex project success.
According to this model, a project leader’s cognitive flexibility; affect, and emotional
intelligence determine a project leader’s adaptive and maladaptive behaviors that, in
turn, create adaptive or maladaptive structures and processes at the project level.
Ultimately, it is these structures and processes that determine project outputs,
outcomes and impact (Pisarski et al., 2011).
In a study designed to determine to what extent servant leadership can contribute to
project success, Thompson (2010) used a quantitative descriptive research approach
involving electronic online survey of 308 members of the Project Management
Institute. The study used Chi-square tests to determine the relationship between the
32
dependent variable, successful project outcomes and the independent variable, servant
leadership. The results of the tests led to the rejection of all ten null hypotheses,
indicating a relationship between successful project outcomes and servant leadership.
Using a non-experimental, quantitative approach, O’Donnell (2010) conducted a study
with the objective of providing insight into the relationships among project
management leadership practices, project complexity, and measurements of project
success within a variety of projects across six different organizations. The primary
population for the study comprised 105 project managers and approximately 300
project stakeholders (management, team members, sponsors, customers) within the
United USA. In this study, individual leadership practices were determined using
Kouzes and Posners’ (1988) 360º Leadership Practices Inventory (LPI) whereas
demographic, project type, and internal success data were gathered through project
leader surveys. The study found positive and medium to strong correlations between
leadership and external and internal project success. A limitation of this study is that
it failed to revise the leadership instrument to reflect the complex context of projects.
In a study to determine whether a project manager’s leadership competences contribute
to project success, Geoghegan and Dulewicz (2008) utilized the Leadership
Dimensions Questionnaire (LDQ) (Dulewicz & Higgs, 2005) and the Project Success
Questionnaire (PSQ) (Pinto & Slevin, 1988a, 1988b) to prove that there is a
statistically significant relationship between a project manager’s leadership
competences and project success. Based on the survey results of 52 project managers
and 52 sponsors working within the same company, the study correlated the scores
from the LDQ survey with those of the PSQ survey and found a statistically significant
relationship between leadership and project success at both 99 percent and 95 percent
confidence levels.
In a study of project managers, Sunindijo, Hadikusumo, and Ogunlana (2007) found
that Emotional Intelligence (EI) affected project leadership and organizational
outcomes. According to this study, project managers with higher scores on an EI
assessment tended to use open communication and proactive leadership styles. The
study also found that these Project Managers exhibited greater tendencies towards
33
delegating and were perceived as bringing more positive outcomes to projects and the
organization.
In meta-study of project management leadership research, Turner and Muller (2005)
summarized the literature observing that project manager competence is related to
success, different project styles are appropriate at each stage of the project life-cycle,
multi-cultural projects require specific leadership styles, project managers have an
important role in creating an effective work environment for team members, project
managers prefer task-oriented behavior to people-oriented, and leadership style
influences perceptions of success.
In a landmark study to assess leadership styles and organizational context, Dulewicz
and Higgs (2005) conducted a review of the literature covering different leader
behaviors in differing contexts of change and identified three distinct leadership styles
namely, engaging leadership (focused on producing radical change with high levels of
engagement and commitment), involving leadership (based on a transitional
organization which faces significant, but not necessarily radical changes in its business
model) and goal-oriented leadership (a Leader-led style aligned to a stable
organization delivering clearly understood results). They also developed the
Leadership Dimensions Questionnaire (LDQ) containing 15 dimensions made up of 3
Intellectual Dimensions (IQ), 5 Managerial Dimensions (MQ) and 7 Emotional and
Social Dimensions (EQ) using a combination of content and item analysis.
Further analyses on leadership style and organizational context using the final version
of LDQ was conducted by Dulewicz and Higgs (2005) on data from the combined
sample from two pilot studies. The sample consisted of 222 managers and officers.
The profile for each style, based upon the range (high, medium, or low) of scores
obtained on the 15 LDQ dimensions were then developed based on content analysis of
the literature on leadership. Initially, this focused on the transformational and
transactional behaviors which were context-based (Bass, Avolio, & Berson, 2003) and
subsequently expanded to encompass the change leadership and broader change
literature. The engaging style was informed by authors working in the transformational
and change leadership fields (Higgs & Rowland, 2003; Kouznes & Posner, 1998). The
34
traditional and the transactional leadership literature informed the development of the
goal-oriented style (Bass, 1995). The involving style was again informed by both more
traditional and change leadership literature (Higgs & Rowland, 2003).
Empirical literature reviewed thus far indicates that project leadership could impact
outcomes and depending on the context, a leadership style may enhance or impede
successful delivery of a project. It is on this basis that this study hypothesized that:
HA4: Project leadership has significant moderating effect on complexity and success
of public infrastructural megaprojects
2.4.5 Project Success
Based on PMI (2013a) study, fewer than two-thirds of all projects fail to meet their
original goal and business intent which puts US$135 million at risk for every US$1
billion spent on a project. The trend becomes more troubling for projects with added
complexity (such as megaprojects), which, on average, have budgets nearly twice as
large. In a survey of 1,208 executives around the world, Bain and Company (2013)
found that 63 percent of global executives reported that excessive complexity is raising
their costs and hindering their growth. Research conducted by Flyvbjerg, Holm, and
Buhl (2002) pointed to the fact that transport infrastructure projects were reported to
have an 86% probability of incurring cost overrun and the overruns could be as high
as 70% and 183% more than the initial estimates (Love, Sing, Wang, Irani, & Thwala,
2012; Odeck, 2004).
In a study of 258 transport infrastructure projects, Flyvbjerg et al. (2004) found that
nine out of ten such projects had cost overruns; overruns of up to 50 percent in
real terms are common, over 50 percent are not uncommon. Flyvbjerg (2014) lists
several megaprojects across the world that have been delivered in conformity with the
Iron Law. In Africa, the Egyptian Suez Canal recorded the largest cost overrun at
1,900%; the Chad-Cameroon Oil Pipeline project which was originally estimated to
cost US$ 3.7 billion but was delivered at US$ 4.2 billion with huge benefit shortfalls
(Bank Information Center-BIC, 2008); the Basilica of Our Lady of Peace of
35
Yamoussoukro-Ivory Coast (which at the time of writing this thesis was the largest
church in the world according to the Guinness Book of World Records) was originally
estimated to cost US$ 300 million. This church was delivered at US$ 360 million.
Ironically, today the church is hardly half full (Shiferaw & Klakegg, 2012); the
Bujagali Falls 250 MW dam project in Uganda was originally estimated to cost US$
530 million. It was delivered in July 2012 at a cost of US$ 900 million with huge
benefit shortfalls. (International Rivers, 2012).
Based on a study conducted by the Standish Group (2001), over 30 percent of projects
were considered failed by a 1994 survey of project managers. The same survey, having
been repeated every 2 years since, found that the failure rate had improved to less than
25 percent by 2000 but a majority of projects (76 percent) continued to be considered
either failed or challenged (Standish Group, 2001). A closer look at the statistics
indicated that there was a clear inverse correlation between project success and the
size of the project. The Standish Group survey showed that as project size increased
from small projects (less than 6 team members, cost less than $750,000) to large
projects (over 500 people and costs in excess of $10 million) the success rates of the
projects falls dramatically. Small projects succeeded at almost a 60 percent rate while
medium size projects success rate was about percent and the very largest projects
rarely succeeded (Standish Group, 2001).
In a research study aimed at analyzing project success, highlighting those success
criteria which the project managers have an impact on and identifying a leadership
style which can maximize the potential for them to achieve project success, Blaskovics
(2014) used a mixture of library search (archiving) and field research (using
qualitative interview of four project managers from one company) to prove that
managers directly have an impact on the project triangle and on the stakeholder
satisfaction, while they have an indirect impact on the client satisfaction. So project
managers could have an impact on all three layers of project success.
36
2.5 Critique of the Existing Literature
Available literature showed that project success had been researched extensively over
the last three decades. Most of the authors on this subject agreed that project success
is multidimensional often citing operational excellence (time, cost, quality) and
product success as key measures of project success. However, there was little attention
given to contextual measures of project success. For instance, very few researchers
(Shenhar, Dvir, & Levy, 1997; Shenhar, Dvir, Levy, & Maltz, 2001; Shenhar & Dvir,
2007a; Hoegl & Gemuenden, 2001) considered the outcomes of complexity leadership
in defining project success measures. As a result, project success measures were
presented in a one size-fits-all manner without considering the typology, type or size
of the project.
Project success should also be construed from the context in which the project is
implemented. This means that when deciding whether a project has been successful or
not, triangulation, cognitive mapping and retrospective sense making are required to
ensure that the project context is considered. It is in this light that some studies have
called for the use of chaos theory (and complex adaptive systems theory) in
contextualizing megaproject performance. In other words, success criteria for complex
megaprojects should take into account the main outcomes of complexity leadership
namely; innovation, learning, adaptability and new organizational forms.
It is widely acknowledged in practice that project complexity affects performance.
However, in most of the literature, this claim is made in passing. For instance, there
appeared to be no study that had individually linked the causes of complexity (i.e.,
human behavior, system behavior, ambiguity) to project success. Instead, only aspects
of these broader measures of complexity had been considered. Most of the complexity
literature concentrated on characterizing complexity on projects. The result of this
characterization was the identification of various categories and frameworks that can
be used to analyze and classify the complexity that is inherent in projects. For instance,
project complexity can now be classified as either structural or dynamic or being
caused by human behavior, system behavior or ambiguity. This categorization is an
37
important beginning point in determining how to manage complexity in projects. By
understanding its root causes, appropriate management strategies can be pursued to
ensure that complexity does not continue leading to project failure.
Leadership on projects and other temporary organizations has been extensively
researched. However, like project success, leadership research on projects has not kept
the pace in addressing emerging issues of project complexity. Leadership studies have
generally been conducted assuming fairly stable organizational settings in which the
concepts of “project” and “project management” are well defined. However,
temporary complex organizations such as megaprojects require approaches that differ
from those used in permanent organizations (Chen et al., 2004; Packendorff, 1995).
Unlike in simple and complicated contexts where leadership of projects is fact-based,
complex and chaotic contexts require pattern-based leadership (Snowden & Boone,
2007).
It is contended that traditional project managers oversimplify the processes involved
in managing people and this oversimplification leads to project failure (Whitty &
Schulz, 2007). A leader’s ability to cope with complexity and not to look for
reductionist strategies should therefore aid project success and the emergence of
adaptive systems. Uhl-Bien and Marion (2009) propose that adaptive leaders will be
adept at recognizing and engaging with the complex interactive dynamics as they
emerge; and that adaptive leadership should therefore produce a rich flow of
information to stimulate and to enhance the effectiveness of leadership in a
dynamically complex situation.
A deep understanding of context, the ability to embrace complexity and paradox, and
a willingness to flexibly change leadership style is required for leaders who want to
make things happen in a time of increasing uncertainty (Snowden & Boone, 2007), as
is the case in megaprojects. There is need to deemphasize the “ontology of being”
(Chia, 1995) on which the pre-modern and modern project management is based, in
favor of the “virtual and process ontology” on which the postmodern and hypermodern
project management is based. Such a view presupposes that leadership is emerging in
38
social interaction, and that traditional leader-follower distinctions should be
problematized (Packendorff, Crevani, & Lindgren, 2014).
A study similar to this was conducted by O’Donnell (2010). In seeking to establish the
relationships among project management leadership practices, project complexity, and
measurements of project success, the study identified leadership practices as the
independent variable, project complexity as the moderating variable and project
success as the dependent variable. Whereas this study had interesting findings, a
fundamental question is whether project complexity should have been the independent
variable. It is contended that in the context of process and virtual ontology, leadership
style becomes depending on the context and not vice versa. A leader of a complex
project exhibits exploitation or exploration behaviors depending on the level of
complexity. As such, project complexity should be the independent variable and
leadership style should be treated as a variable moderating the influence of complexity
on megaproject success.
In a study to establish the relationship among leadership style, complexity and project
success, O’Donnell (2010) neither reviewed the complexity theory nor the complexity
leadership theory. Without a review of these theories, the study was not contextualized
and anchored. To some extent, the study reviewed emergence and the growth of project
management but this review did not extend beyond the projects of modernity. Thus,
the study missed the opportunity to capture the real context in which contemporary
projects fall.
2.6 Summary of the Existing Literature
Complexity is a characteristic of a program or a project or its environment that is
difficult to manage due to human behavior, system behavior, and ambiguity. It is not
directly proportional to the size of a program or a project as small programs and
projects may contain substantial complexity. Programs and projects with complexity
may fluctuate between conditions of relative stability and predictability to instability
and uncertainty.
39
Megaprojects are some of the most complex type of projects. This complexity is the
main cause of the iron law of megaprojects. The most important skills for the
successful navigation of this inherent complexity in programs and projects is
leadership. A megaproject leader should always use a flexible leadership style, which
implies that the style changes with the context and the program or project team or
individuals. The characteristics of the postmodern projects imply that the pre-modern
and modern leadership approaches cannot be effectively applied to rid complex
megaprojects of the iron law. The literature strongly suggests that context is highly
relevant to leadership style.
Unlike other models of leadership such as transformational and situational leadership,
complexity leadership does not view change as only, or even primarily, top-down; it
does not see change as being led in the traditional sense of the word. Rather, a core
premise of complexity leadership is that change is emergent, unpredictable, and
essentially uncontrollable. The main outcomes of complexity leadership are
innovation, learning, adaptability and new organizational forms.
2.7 Research Gaps
Prior studies have confirmed that complexity inherent in the context of infrastructural
megaprojects is the main cause of their bizarre performance (Cooke-Davies, Crawford,
& Stephens, 2011). However, none of these studies has included Kenya. This is despite
the fact that Kenya continues to increasingly use complex infrastructural megaprojects
to deliver goods and services to its citizenry. Further, existing studies on complexity
have not established the causal relationship between its components and project
success. Instead, complexity has been studied as a composite variable assuming that
its causes are equally weighty. Without a coherent research agenda to understand both
its causes and navigation strategies, complexity continues to result in problems, waste,
economic and social failure (Remington & Zolin, 2011).
Several studies have singled out the project manager’s leadership skill as the most
important for successful navigation of complexity (PMI, 2013a). Unfortunately,
existing studies on project leadership cannot be generalized to complex megaprojects
40
since these studies have been based on the pre-modern and modern social worlds, both
of which assume fairly orderly and stable organizational settings (Chen et al., 2004;
Packendorff, 1995). On the contrary, megaprojects are implemented in an unstable and
unorderly postmodern social world of emergence and rapid change, where the sum of
the parts of a system are less than the whole (PMI, 2014); and project management is
neither a practice nor a tool but a rallying rhetoric in the context of power play,
domination and control (Gauthier & Ika, 2012).
Where studies on the relationship among project complexity, leadership and success
have been conducted, leadership has been treated as an independent variable that
causes project success while complexity has been treated as a moderating variable
(O’Donnell, 2010). The present study contends that such conceptualization is flawed
to the extent that project leadership is constantly in becoming depending on the context
and therefore, complexity determines the project manager’s leadership behavior.
41
CHAPTER THREE
RESEARCH METHODOLOGY
3.0 Introduction
This chapter discusses the methodology followed by the study. The first section
presents the research philosophy and design on which the study was anchored. The
target population of the study is presented in the next section followed by a description
of the sampling frame, sample and sampling technique. The remainder of the chapter
describes the instruments of the study, data collection procedure followed by data
processing, analysis and presentation. A table showing how the study variables were
operationalized is also included in this chapter together with a description of the pilot
study and diagnostic tests conducted on data.
3.1 Research Philosophy and Design
This study was operationalized through exploratory, descriptive and explanatory
research goals based on Neuman (2003) classification of research goals. To achieve
these goals, a post-positivist philosophy emphasizing virtual constructionist ontology
(Gauthier & Ika, 2012) was assumed. This philosophy utilizes both interpretivist
(Bryman & Bell, 2007) and pragmatist (Goldkuhl, 2012) epistemologies to generate
knowledge based on a combination of deductive and inductive approaches. Given that
complexity is the midpoint between order and disorder, the virtual constructionist
ontology was deemed appropriate as it combines the characteristics of both the
Heraclitean ontology of “becoming” and the Parmedean ontology of “being”.
The choice of this philosophical perspective was guided by the social world of
complex megaprojects. In this social world, a project is a discourse of legitimation and
an arena of social and power plays; serving the interests of powerful stakeholders. As
such, megaproject management is neither a practice nor a tool (as is the case with
projects implemented in the modern social world) but a rallying rhetoric in a context
of power play, domination and control (Gauthier & Ika, 2012).
42
This study was designed to be mixed-method research combining both quantitative
and qualitative strategies (Burch & Carolyn, 2016). The mixed-method research
provides an epistemological paradigm that occupies the conceptual space between
positivism and interpretivism (Tashakkori & Creswell, 2007), the main epistemologies
on which the virtual constructionist ontology thrives. Interpretivism was particularly
important in mapping individual as well as group behavior, characterizing project
culture and determining the leadership styles.
To generate data for this study, a cross-sectional survey design was used. This design
entails the collection of data (predominantly by questionnaire or structured interview)
on usually quite a lot more than one case and at a single point in time in order to collect
a body of quantitative or quantifiable data in connection with two or more variables,
which are then examined to detect patterns of association (Bryman & Bell, 2007). A
variant of this research design involving qualitative interviews and archiving was used
to build up a body of qualitative data.
3.2 Target Population
This study had as its primary population public sector infrastructural megaprojects
implemented by the government of Kenya since 2005. Given the continual
reorganizations within government and the several projects implemented by the
government, it was unlikely that project records earlier than 2005 could be traced with
ease. Following Flyvbjerg (2014), the minimum budget for megaprojects included in
this study was approximately Ksh. 1 billion. A total of 31 projects were identified as
having been completed from Vision 2030 Secretariat.
Managers, team members, sponsors and key stakeholders of these projects constituted
the population of respondents from whom data was collected. These respondents were
selected since they represent the three basic interest on any project namely; business
interest, supplier interest and user interest (Axelos, 2017). The rationale for selecting
infrastructure among other foundations of national transformation was based on its
huge actual and projected expenditure in comparison to other sectors. Specifically, in
the Government of Kenya (2013) Second Medium Term Plan, infrastructure was
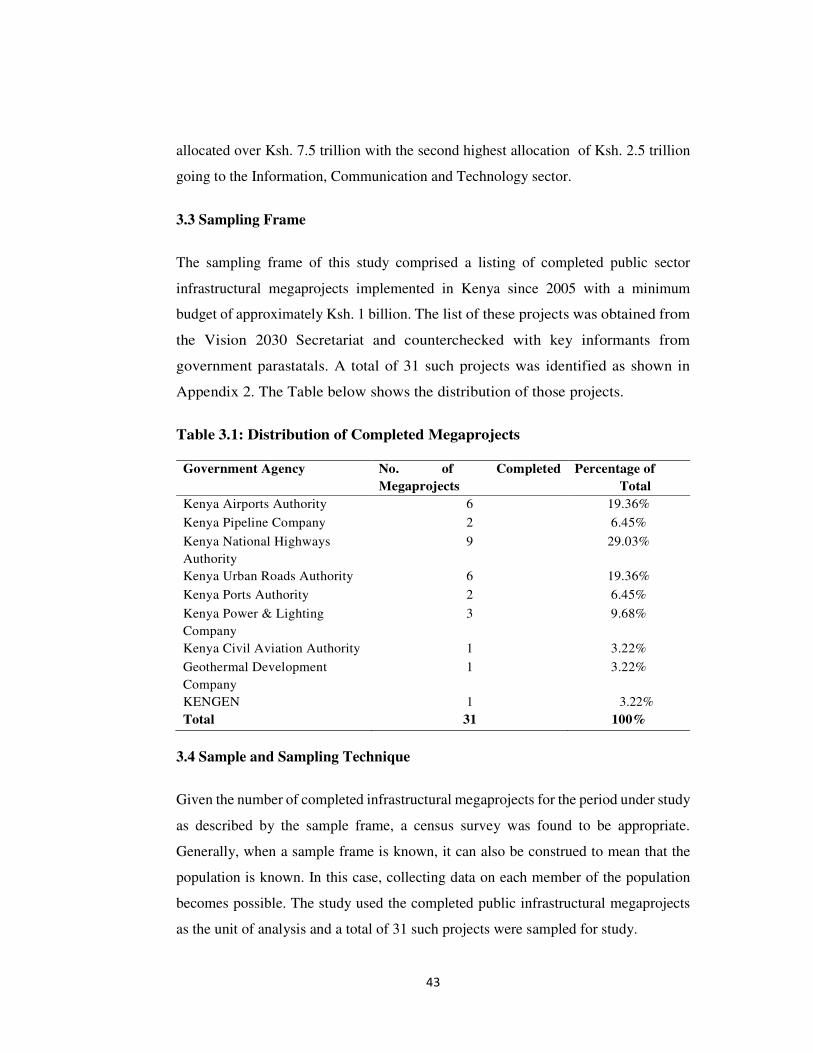
43
allocated over Ksh. 7.5 trillion with the second highest allocation of Ksh. 2.5 trillion
going to the Information, Communication and Technology sector.
3.3 Sampling Frame
The sampling frame of this study comprised a listing of completed public sector
infrastructural megaprojects implemented in Kenya since 2005 with a minimum
budget of approximately Ksh. 1 billion. The list of these projects was obtained from
the Vision 2030 Secretariat and counterchecked with key informants from
government parastatals. A total of 31 such projects was identified as shown in
Appendix 2. The Table below shows the distribution of those projects.
Table 3.1: Distribution of Completed Megaprojects
Government Agency No. of Completed
Megaprojects
Percentage of
Total
Kenya Airports Authority 6 19.36%
Kenya Pipeline Company 2 6.45%
Kenya National Highways
Authority
9 29.03%
Kenya Urban Roads Authority 6 19.36%
Kenya Ports Authority 2 6.45%
Kenya Power & Lighting
Company
3 9.68%
Kenya Civil Aviation Authority 1 3.22%
Geothermal Development
Company
KENGEN
1
1
3.22%
3.22%
Total 31 100%
3.4 Sample and Sampling Technique
Given the number of completed infrastructural megaprojects for the period under study
as described by the sample frame, a census survey was found to be appropriate.
Generally, when a sample frame is known, it can also be construed to mean that the
population is known. In this case, collecting data on each member of the population
becomes possible. The study used the completed public infrastructural megaprojects
as the unit of analysis and a total of 31 such projects were sampled for study.

44
The unit of observation comprised project managers, project sponsors and project team
members. These were purposively selected as respondents since they represent the
three key interests on a project namely; business interest, supplier interest and user
interest (Axelos, 2017). Following this approach, for each sampled project, a total of
four respondents were selected comprising the project manager, two team members
and one sponsor. In total, 124 respondents were selected to participate in this study
composed of 31 project managers, 62 project team members and 31 sponsors. The
project manager provided data on the overall complexity of the project while the
project sponsor provided data on the overall success of the project. The team members
provided responses to the leader-behavior questionnaire used to determine the
manager’s leadership style.
3.5 Instruments
The fieldwork for this study utilized three interlinked questionnaires namely, the
Complexity Assessment Questionnaire (CAQ), the Leadership Behavior
Questionnaire (LBQ); and the Project Success Questionnaire (PSQ). The CAQ was
constructed based on the Practice Standard for Navigating Complexity (PMI, 2014)
while the LBQ simulated the Leadership Dimensions Questionnaire (Dulewicz &
Higgs, 2005). The PSQ was developed based on Shenhar and Dvir (2001) and McLeod
et al. (2012). The questionnaire survey is hailed to be an efficient data collection
mechanism when the researcher knows exactly what is required and how to measure
the variables of interest (Neuman, 2003). All the 3 questionnaires utilized a mixture of
Likert scale, open ended questions, checklists and probing questions including those
soliciting for specific project metrics.
The Practice Standard for Navigating Complexity (PMI, 2014) was selected as an
appropriate benchmark for the development of the CAQ given the rigor and wide
stakeholder participation in its development. The Leadership Dimensions
Questionnaire ((Dulewicz & Higgs, 2005) was used as a reference point to develop the
LBQ given its validity and reliability. It is a proven questionnaire supported by
previous research (Geoghegan & Dulewicz, 2008) and provides an indication of the
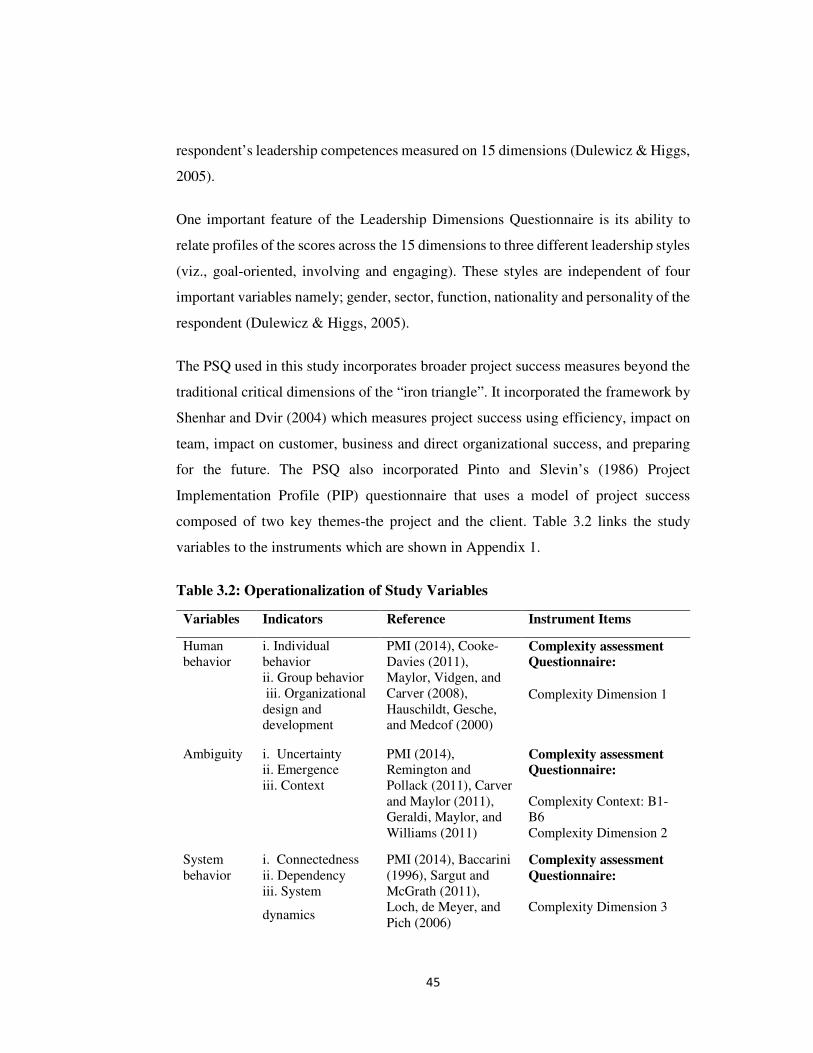
45
respondent’s leadership competences measured on 15 dimensions (Dulewicz & Higgs,
2005).
One important feature of the Leadership Dimensions Questionnaire is its ability to
relate profiles of the scores across the 15 dimensions to three different leadership styles
(viz., goal-oriented, involving and engaging). These styles are independent of four
important variables namely; gender, sector, function, nationality and personality of the
respondent (Dulewicz & Higgs, 2005).
The PSQ used in this study incorporates broader project success measures beyond the
traditional critical dimensions of the “iron triangle”. It incorporated the framework by
Shenhar and Dvir (2004) which measures project success using efficiency, impact on
team, impact on customer, business and direct organizational success, and preparing
for the future. The PSQ also incorporated Pinto and Slevin’s (1986) Project
Implementation Profile (PIP) questionnaire that uses a model of project success
composed of two key themes-the project and the client. Table 3.2 links the study
variables to the instruments which are shown in Appendix 1.
Table 3.2: Operationalization of Study Variables
Variables Indicators Reference Instrument Items
Human behavior
i. Individual behavior ii. Group behavior iii. Organizational design and development
PMI (2014), Cooke-Davies (2011), Maylor, Vidgen, and Carver (2008), Hauschildt, Gesche, and Medcof (2000)
Complexity assessment
Questionnaire:
Complexity Dimension 1
Ambiguity i. Uncertainty ii. Emergence iii. Context
PMI (2014), Remington and Pollack (2011), Carver and Maylor (2011), Geraldi, Maylor, and Williams (2011)
Complexity assessment
Questionnaire:
Complexity Context: B1-B6
Complexity Dimension 2
System behavior
i. Connectedness ii. Dependency iii. System
dynamics
PMI (2014), Baccarini (1996), Sargut and McGrath (2011), Loch, de Meyer, and Pich (2006)
Complexity assessment
Questionnaire:
Complexity Dimension 3
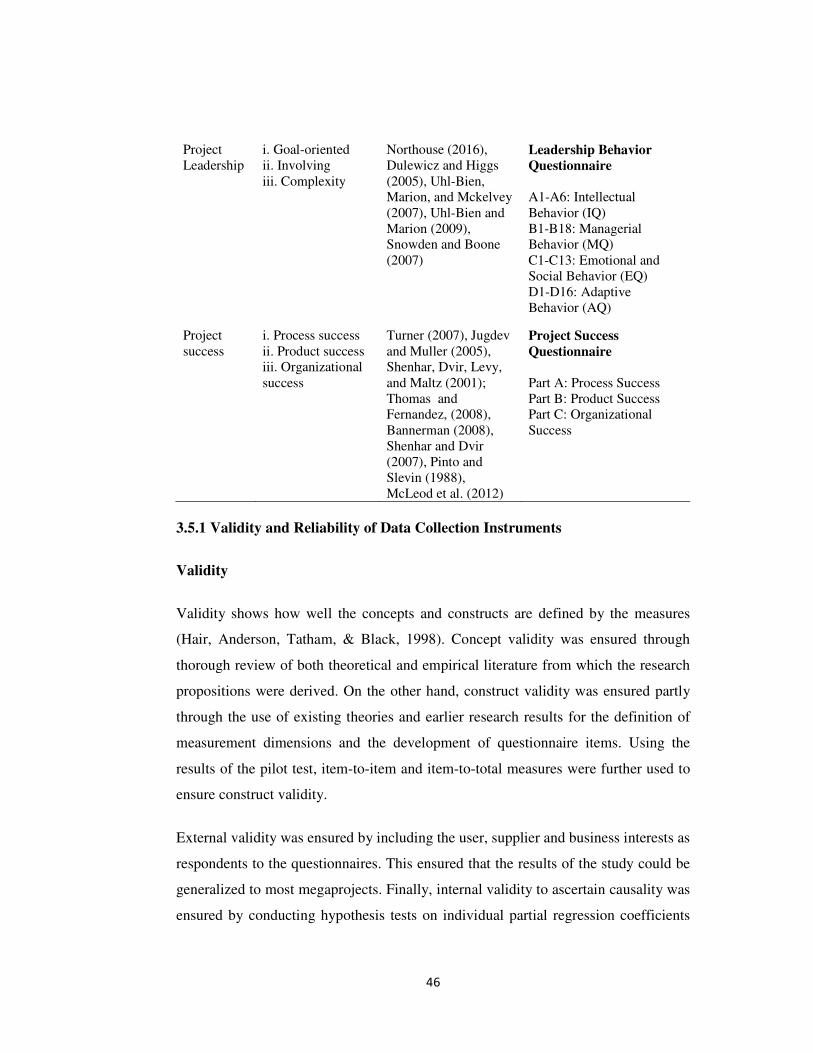
46
Project Leadership
i. Goal-oriented ii. Involving iii. Complexity
Northouse (2016), Dulewicz and Higgs (2005), Uhl-Bien, Marion, and Mckelvey (2007), Uhl-Bien and Marion (2009), Snowden and Boone (2007)
Leadership Behavior
Questionnaire
A1-A6: Intellectual
Behavior (IQ) B1-B18: Managerial
Behavior (MQ) C1-C13: Emotional and
Social Behavior (EQ) D1-D16: Adaptive
Behavior (AQ)
Project success
i. Process success ii. Product success iii. Organizational success
Turner (2007), Jugdev and Muller (2005), Shenhar, Dvir, Levy, and Maltz (2001); Thomas and Fernandez, (2008), Bannerman (2008), Shenhar and Dvir (2007), Pinto and Slevin (1988), McLeod et al. (2012)
Project Success
Questionnaire
Part A: Process Success Part B: Product Success Part C: Organizational
Success
3.5.1 Validity and Reliability of Data Collection Instruments
Validity
Validity shows how well the concepts and constructs are defined by the measures
(Hair, Anderson, Tatham, & Black, 1998). Concept validity was ensured through
thorough review of both theoretical and empirical literature from which the research
propositions were derived. On the other hand, construct validity was ensured partly
through the use of existing theories and earlier research results for the definition of
measurement dimensions and the development of questionnaire items. Using the
results of the pilot test, item-to-item and item-to-total measures were further used to
ensure construct validity.
External validity was ensured by including the user, supplier and business interests as
respondents to the questionnaires. This ensured that the results of the study could be
generalized to most megaprojects. Finally, internal validity to ascertain causality was
ensured by conducting hypothesis tests on individual partial regression coefficients
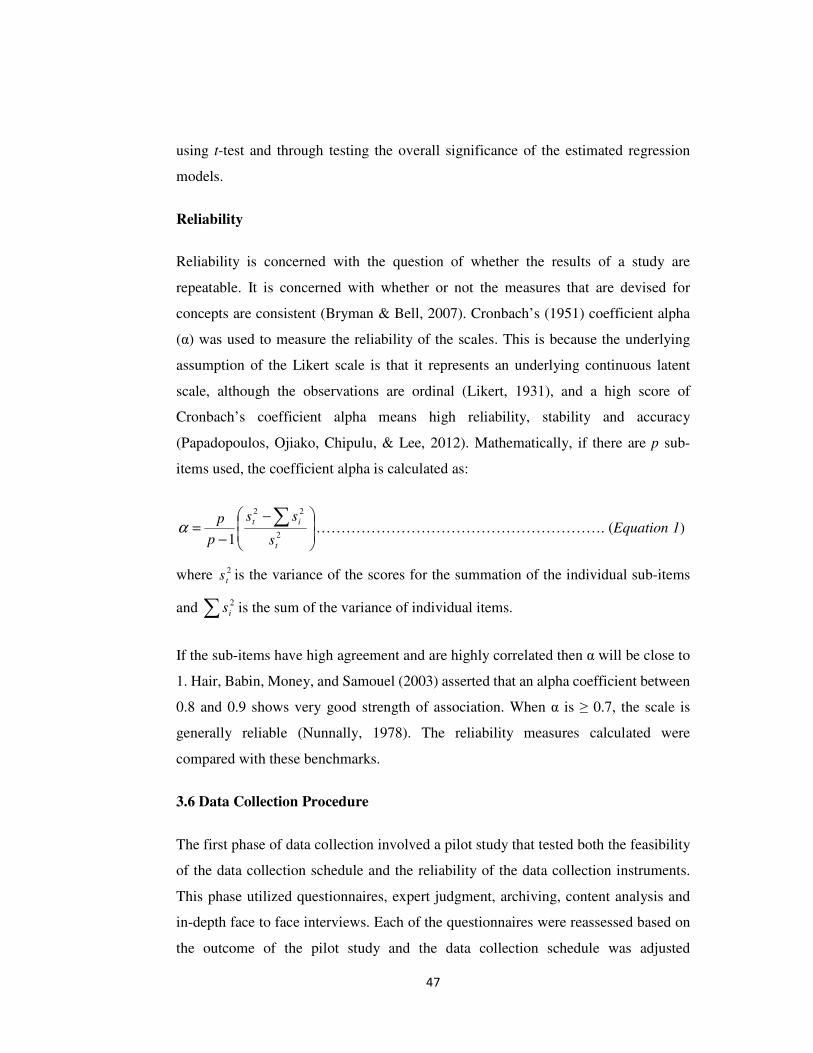
47
using t-test and through testing the overall significance of the estimated regression
models.
Reliability
Reliability is concerned with the question of whether the results of a study are
repeatable. It is concerned with whether or not the measures that are devised for
concepts are consistent (Bryman & Bell, 2007). Cronbach’s (1951) coefficient alpha
(α) was used to measure the reliability of the scales. This is because the underlying
assumption of the Likert scale is that it represents an underlying continuous latent
scale, although the observations are ordinal (Likert, 1931), and a high score of
Cronbach’s coefficient alpha means high reliability, stability and accuracy
(Papadopoulos, Ojiako, Chipulu, & Lee, 2012). Mathematically, if there are p sub-
items used, the coefficient alpha is calculated as:
−
−=
∑2
22
1t
it
s
ss
p
pα …………………………………………………. (Equation 1)
where 2
ts is the variance of the scores for the summation of the individual sub-items
and ∑ 2
is is the sum of the variance of individual items.
If the sub-items have high agreement and are highly correlated then α will be close to
1. Hair, Babin, Money, and Samouel (2003) asserted that an alpha coefficient between
0.8 and 0.9 shows very good strength of association. When α is ≥ 0.7, the scale is
generally reliable (Nunnally, 1978). The reliability measures calculated were
compared with these benchmarks.
3.6 Data Collection Procedure
The first phase of data collection involved a pilot study that tested both the feasibility
of the data collection schedule and the reliability of the data collection instruments.
This phase utilized questionnaires, expert judgment, archiving, content analysis and
in-depth face to face interviews. Each of the questionnaires were reassessed based on
the outcome of the pilot study and the data collection schedule was adjusted
48
accordingly. The outputs of this phase were used to inform planning for the second
phase which involved administering the CAQ, LBQ and the PSQ to the wider
respondents.
The second phase entailed primary data collection using the three questionnaires. The
first instrument to be administered was the CAQ. Given the technical nature of the
CAQ, the researcher was mostly present when it was being filled by the project
managers in order to make clarifications as required. The LBQ and PSQ were delivered
to the team members and sponsors respectively and were collected after being
completed. The researcher made follow-on clarifications on the data provided by the
respondents on phone.
3.7 Data Processing, Analysis and Presentation
3.7.1 Data Processing
Raw data were collected from respondents using hard copy questionnaires. Each
questionnaire was coded using the project title to avoid mixing up data for different
projects. To aid in data input, processing and storage, this study utilized the Statistical
Package for Social Sciences (SPSS) version 20, Microsoft Access 2010 and Microsoft
Excel 2010. The original database was created in MS Access (due to its versatility)
and then transferred to SPSS for ease of processing. MS Excel was used to complement
SPSS in navigating through data sets during processing for analysis. The SPSS
software was chosen for its analytical superiority, availability and ability to handle
large amounts of data.
3.7.2 Data Analysis
Qualitative Data Analysis
Qualitative data analysis was conducted using cognitive and scenario mapping, and
through triangulation. Both cognitive and scenario mapping allow for grouping
together of like items so as to identify key categories and causes of a phenomenon.
Triangulation on the other hand involves the use of three or more theories, sources or
49
types of information, or types of analysis to verify and substantiate an assessment
(Kusek & Rist, 2004). In this study, causes of cost and schedule overruns in projects,
determination of typical project culture based on individual behaviors, and
determination of typical project leadership behaviors and styles, were all done using
mapping and triangulation. The Competitive Values Model (Livari & Huisman, 2007)
was specifically used to map individual behaviors onto typical project/organizational
cultures.
Quantitative Data Analysis
This was done using both descriptive and inferential statistics. SPSS version 20 was
largely used in quantitative analysis. Descriptive statistics for quantitative data
analysis were derived using frequencies and percentages, measures of central tendency
(mainly the mean), measures of dispersion (mainly standard deviation coefficient of
variation, skewness and kurtosis), Earned Value measures (mainly Cost Performance
Index, CPI and Schedule Performance Index, SPI) and scoring (unweighted scores and
Standard Ten Scores). Inferential statistics used were derived using parametric tests
(i.e., regression and correlation analysis) and Analysis of Variance (ANOVA);
The overall model for this study assumed the form of a moderated regression model
and was specified as:
µββββββββ ++++++++=−
iiiiiiiiiii LSBLAMLHBLSBAMHBPS 87654321
(Equation 2)
where iµ is the stochastic term and β2, β3, β4 and β5 are the slopes of the regression
equation on account of human behavior, ambiguity, system behavior and leadership,
and β1 is the intercept. Β6, β7, and β8 are the slopes of the regression equation as a result
of the interaction with leadership.
The regression coefficients were extracted using Ordinary Least Squares (OLS)
method and tested for significance at the 95 percent confidence level using two-tailed
t-test based on the hypothesis that:
50
0:0 =ibH ;
0: ≠iA bH ; where ib are the values of individual betas in the estimated regression
equation.
The significance of the individual models was tested using multiple coefficient of
determination (R2), the F-test and the P-Value. The overall significance of the
moderation model was tested using 2R change which shows the increase in variation
explained by the introduction of the interaction term.
Diagnostic Tests
The suitability of data for parametric tests (i.e., correlation and regression analysis)
was conducted using diagnostic tests of normality, multicollinearity, autocorrelation
and heteroscedasticity. Since parametric tests assume normal distribution of data sets,
it was important to confirm that the distribution of collected data approximated a
normal distribution. The normality test was conducted by calculating the measures of
skewness and kurtosis and comparing them with the benchmark values. Skewness
involves the symmetry of distribution of the variable about its mean, whereas kurtosis
involves the peakedness of probability distribution of a variable (Hassan, Bashir, &
Abbas, 2017). When the coefficient of skewness is within the -1 to +1 range and
coefficient of kurtosis is within the range of -2.2 to +2.2, the data are assumed to be
approximately normally distributed (Sposito, Hand, & Skarpness, 1983) and therefore
pass the normality test.
Parametric tests also require that the regressors included in the regression model are
not collinear. If the regressors are linearly related, then the problem of multicollinearity
arises. To ensure that this was not the case for this study, Variance Inflating Factor
(VIF) was determined. VIF measures the speed with which variances and covariances
increase. It shows how the variance of an estimator is inflated by the presence of
multicollinearity (Gujarati & Porter, 2009). For large samples, when VIF is greater
than 10 then the problem of multicollinearity is said to be present. For smaller samples,
a VIF greater than 4 implies presence of multicollinearity (O’Brien, 2007).
51
The problem of autocorrelation, also referred to as serial correlation arises when the
error terms are correlated. The use of parametric tests requires that the error terms are
not correlated. To check for autocorrelation, the Durbin-Watson statistic was
calculated and its value compared with the benchmark which is usually a value of 2
(Gujarati & Porter, 2009). A value of less than 2 means than this problem is absent and
therefore the data are fit for use.
One of the important assumptions of the classical linear regression model is that the
variance of each disturbance term, conditional on the chosen values of the explanatory
variables, is some constant number. Thus, the error terms are expected to exhibit equal
spread (homoscedasticity). To ensure that this was the case for data in this study,
residual statistics were plotted on a scatter diagram.
3.7.3 Data Presentation
Analyzed data was presented using tables, figures, charts, equations and text. Tables
and figures were used to present descriptive data while equations were used to present
inferential statistics. Explanations and discussions of both descriptive and inferential
statistics was done using text.
52
CHAPTER FOUR
RESEARCH FINDINGS AND DISCUSSION
4.1 Introduction
This chapter presents the findings of the study together with a discussion of those
findings in light of the literature reviewed. The first part of the chapter provides a brief
description of the projects surveyed and the response rate. This is followed by the
results of the pilot study. The findings of the main study are presented next starting
with the dependent variable. Results for each of the independent variables are first
presented descriptively followed by the tests of hypothesis and a discussion of the
results. In the final section, the results of the moderated model are presented and
discussed followed by a revised model. This revised model represents the optimal
model of the study.
4.2 Projects Surveyed and Response Rate
The projects surveyed had a budget at appraisal ranging from approximately Ksh. 1
Billion to Ksh. 40 Billion with 8 of these projects (29.6%) having a budget at appraisal
of over Ksh. 10 Billion. The scheduled duration for these projects ranged from 4
months to 72 months with most projects having a scheduled duration of above 20
months. The project locations were spread across several counties in Kenya. All the
surveyed projects were turnkey, involving a variation of Engineer-Procure-Construct
(EPC) and Design-Build-Transfer (DBT) delivery arrangements. The megaprojects
studied fall into two main categories following the classification by Shenhar and Dvir
(2007a). Most of the projects were system projects which produced a single outcome
such as the KCAA Headquarter building, comprising a collection of assemblies,
components and subsystems. Yet others, such as the Mombasa Port Modernization
Project, were array projects (system of systems) that integrated a collection of systems
functioning together to achieve a common goal.
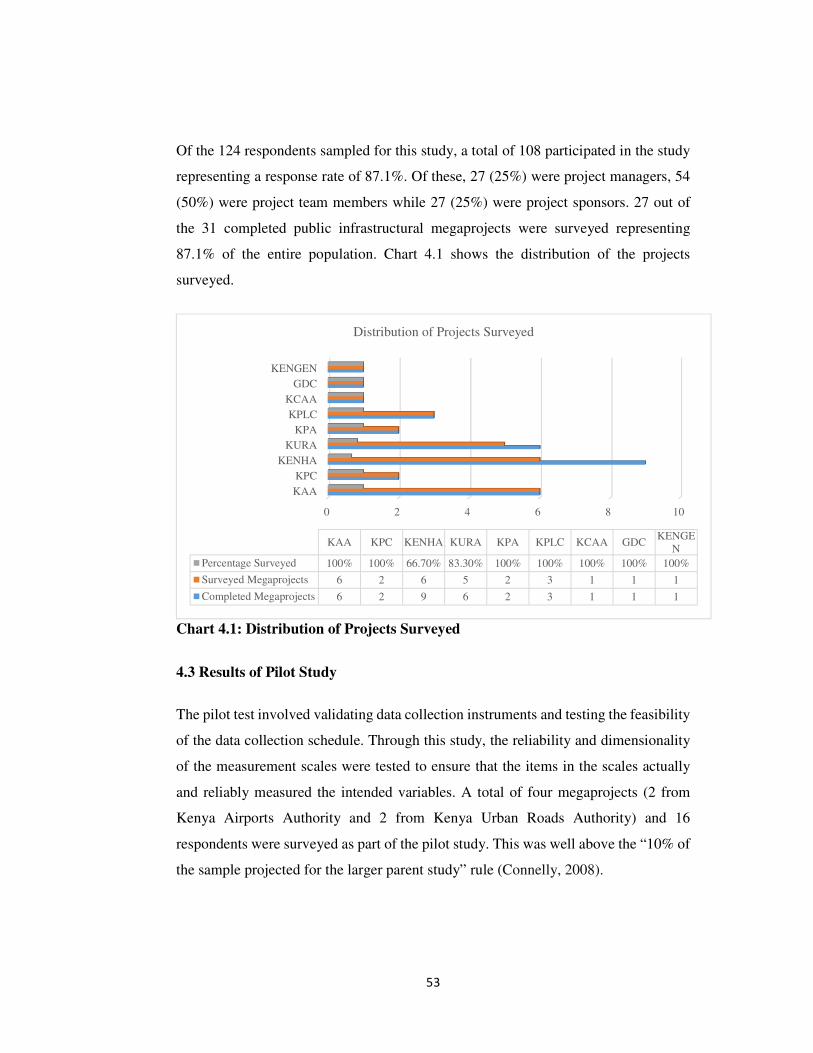
53
Of the 124 respondents sampled for this study, a total of 108 participated in the study
representing a response rate of 87.1%. Of these, 27 (25%) were project managers, 54
(50%) were project team members while 27 (25%) were project sponsors. 27 out of
the 31 completed public infrastructural megaprojects were surveyed representing
87.1% of the entire population. Chart 4.1 shows the distribution of the projects
surveyed.
Chart 4.1: Distribution of Projects Surveyed
4.3 Results of Pilot Study
The pilot test involved validating data collection instruments and testing the feasibility
of the data collection schedule. Through this study, the reliability and dimensionality
of the measurement scales were tested to ensure that the items in the scales actually
and reliably measured the intended variables. A total of four megaprojects (2 from
Kenya Airports Authority and 2 from Kenya Urban Roads Authority) and 16
respondents were surveyed as part of the pilot study. This was well above the “10% of
the sample projected for the larger parent study” rule (Connelly, 2008).
0 2 4 6 8 10
KAA
KPC
KENHA
KURA
KPA
KPLC
KCAA
GDC
KENGEN
KAA KPC KENHA KURA KPA KPLC KCAA GDCKENGE
N
Percentage Surveyed 100% 100% 66.70% 83.30% 100% 100% 100% 100% 100%
Surveyed Megaprojects 6 2 6 5 2 3 1 1 1
Completed Megaprojects 6 2 9 6 2 3 1 1 1
Distribution of Projects Surveyed
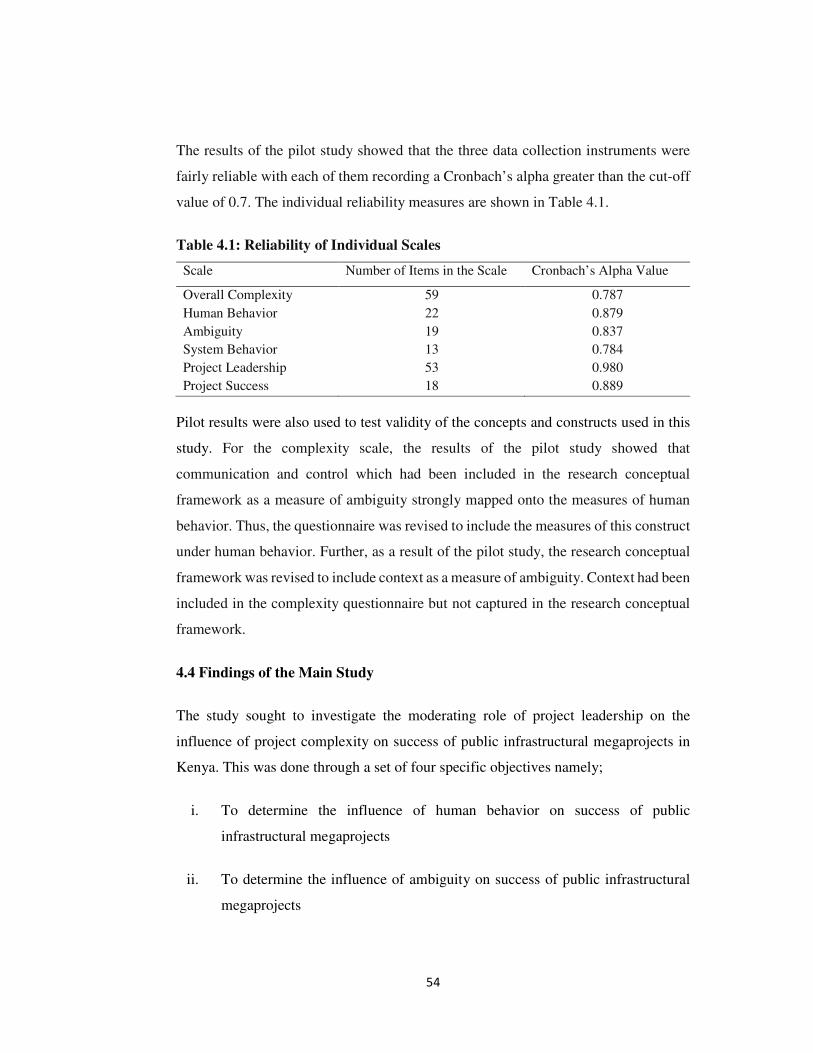
54
The results of the pilot study showed that the three data collection instruments were
fairly reliable with each of them recording a Cronbach’s alpha greater than the cut-off
value of 0.7. The individual reliability measures are shown in Table 4.1.
Table 4.1: Reliability of Individual Scales
Scale Number of Items in the Scale Cronbach’s Alpha Value
Overall Complexity 59 0.787
Human Behavior 22 0.879
Ambiguity 19 0.837
System Behavior 13 0.784
Project Leadership 53 0.980
Project Success 18 0.889
Pilot results were also used to test validity of the concepts and constructs used in this
study. For the complexity scale, the results of the pilot study showed that
communication and control which had been included in the research conceptual
framework as a measure of ambiguity strongly mapped onto the measures of human
behavior. Thus, the questionnaire was revised to include the measures of this construct
under human behavior. Further, as a result of the pilot study, the research conceptual
framework was revised to include context as a measure of ambiguity. Context had been
included in the complexity questionnaire but not captured in the research conceptual
framework.
4.4 Findings of the Main Study
The study sought to investigate the moderating role of project leadership on the
influence of project complexity on success of public infrastructural megaprojects in
Kenya. This was done through a set of four specific objectives namely;
i. To determine the influence of human behavior on success of public
infrastructural megaprojects
ii. To determine the influence of ambiguity on success of public infrastructural
megaprojects
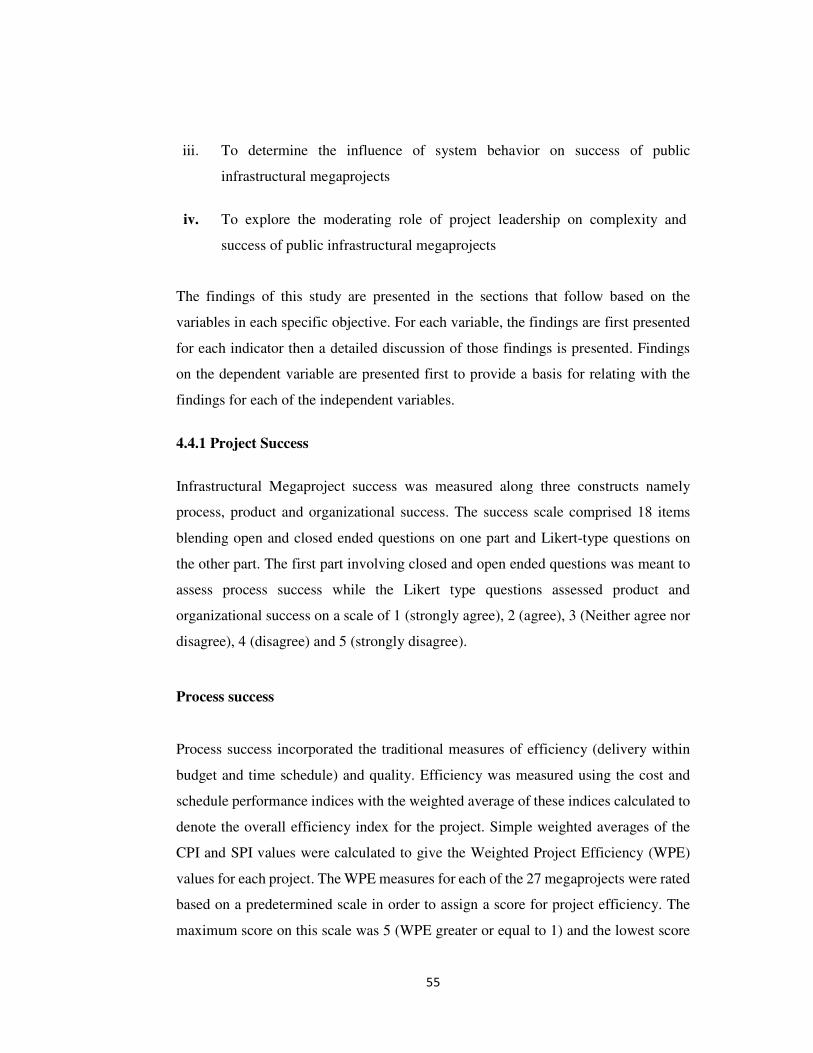
55
iii. To determine the influence of system behavior on success of public
infrastructural megaprojects
iv. To explore the moderating role of project leadership on complexity and
success of public infrastructural megaprojects
The findings of this study are presented in the sections that follow based on the
variables in each specific objective. For each variable, the findings are first presented
for each indicator then a detailed discussion of those findings is presented. Findings
on the dependent variable are presented first to provide a basis for relating with the
findings for each of the independent variables.
4.4.1 Project Success
Infrastructural Megaproject success was measured along three constructs namely
process, product and organizational success. The success scale comprised 18 items
blending open and closed ended questions on one part and Likert-type questions on
the other part. The first part involving closed and open ended questions was meant to
assess process success while the Likert type questions assessed product and
organizational success on a scale of 1 (strongly agree), 2 (agree), 3 (Neither agree nor
disagree), 4 (disagree) and 5 (strongly disagree).
Process success
Process success incorporated the traditional measures of efficiency (delivery within
budget and time schedule) and quality. Efficiency was measured using the cost and
schedule performance indices with the weighted average of these indices calculated to
denote the overall efficiency index for the project. Simple weighted averages of the
CPI and SPI values were calculated to give the Weighted Project Efficiency (WPE)
values for each project. The WPE measures for each of the 27 megaprojects were rated
based on a predetermined scale in order to assign a score for project efficiency. The
maximum score on this scale was 5 (WPE greater or equal to 1) and the lowest score
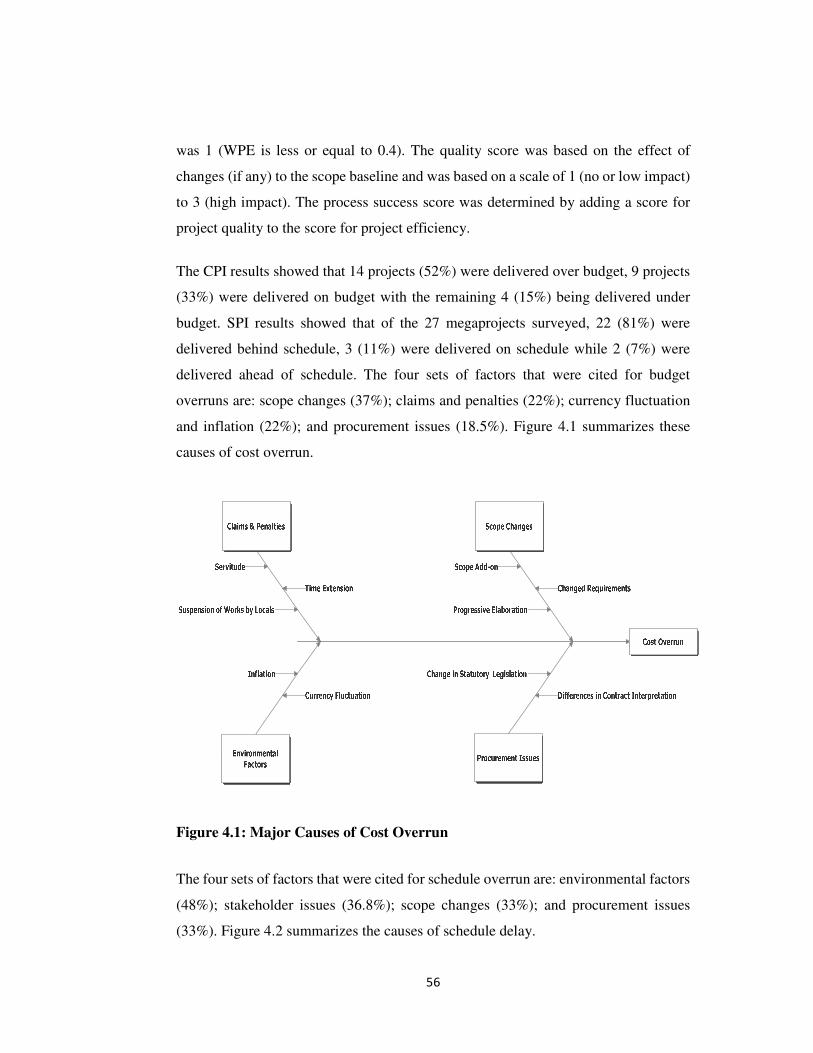
56
was 1 (WPE is less or equal to 0.4). The quality score was based on the effect of
changes (if any) to the scope baseline and was based on a scale of 1 (no or low impact)
to 3 (high impact). The process success score was determined by adding a score for
project quality to the score for project efficiency.
The CPI results showed that 14 projects (52%) were delivered over budget, 9 projects
(33%) were delivered on budget with the remaining 4 (15%) being delivered under
budget. SPI results showed that of the 27 megaprojects surveyed, 22 (81%) were
delivered behind schedule, 3 (11%) were delivered on schedule while 2 (7%) were
delivered ahead of schedule. The four sets of factors that were cited for budget
overruns are: scope changes (37%); claims and penalties (22%); currency fluctuation
and inflation (22%); and procurement issues (18.5%). Figure 4.1 summarizes these
causes of cost overrun.
Figure 4.1: Major Causes of Cost Overrun
The four sets of factors that were cited for schedule overrun are: environmental factors
(48%); stakeholder issues (36.8%); scope changes (33%); and procurement issues
(33%). Figure 4.2 summarizes the causes of schedule delay.
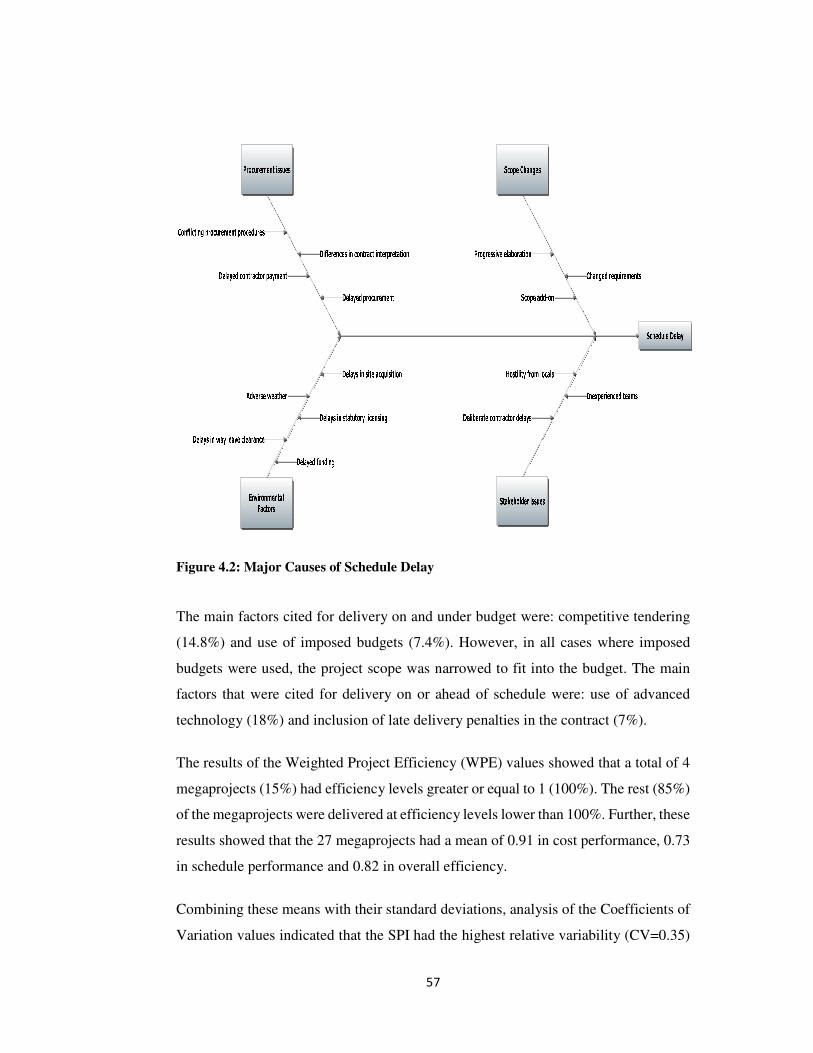
57
Figure 4.2: Major Causes of Schedule Delay
The main factors cited for delivery on and under budget were: competitive tendering
(14.8%) and use of imposed budgets (7.4%). However, in all cases where imposed
budgets were used, the project scope was narrowed to fit into the budget. The main
factors that were cited for delivery on or ahead of schedule were: use of advanced
technology (18%) and inclusion of late delivery penalties in the contract (7%).
The results of the Weighted Project Efficiency (WPE) values showed that a total of 4
megaprojects (15%) had efficiency levels greater or equal to 1 (100%). The rest (85%)
of the megaprojects were delivered at efficiency levels lower than 100%. Further, these
results showed that the 27 megaprojects had a mean of 0.91 in cost performance, 0.73
in schedule performance and 0.82 in overall efficiency.
Combining these means with their standard deviations, analysis of the Coefficients of
Variation values indicated that the SPI had the highest relative variability (CV=0.35)
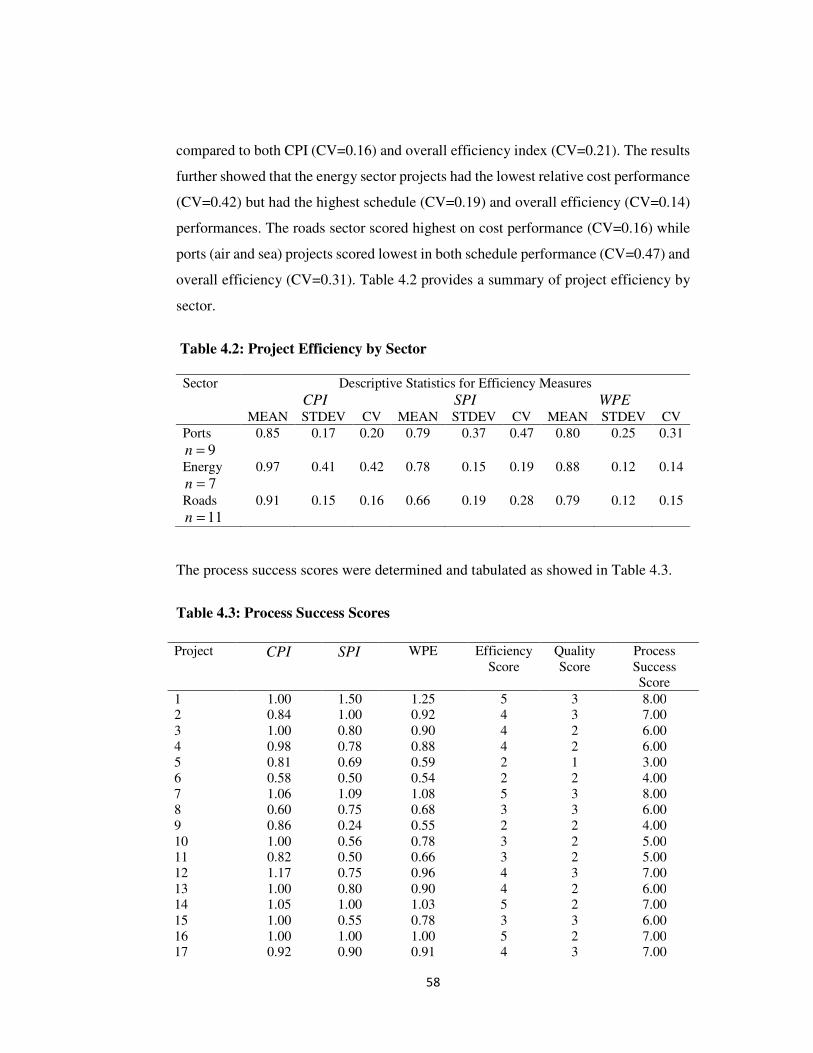
58
compared to both CPI (CV=0.16) and overall efficiency index (CV=0.21). The results
further showed that the energy sector projects had the lowest relative cost performance
(CV=0.42) but had the highest schedule (CV=0.19) and overall efficiency (CV=0.14)
performances. The roads sector scored highest on cost performance (CV=0.16) while
ports (air and sea) projects scored lowest in both schedule performance (CV=0.47) and
overall efficiency (CV=0.31). Table 4.2 provides a summary of project efficiency by
sector.
Table 4.2: Project Efficiency by Sector
Sector Descriptive Statistics for Efficiency Measures
CPI SPI WPE
MEAN STDEV CV MEAN STDEV CV MEAN STDEV CV
Ports
9=n
0.85 0.17 0.20 0.79 0.37 0.47 0.80 0.25 0.31
Energy
7=n
0.97 0.41 0.42 0.78 0.15 0.19 0.88 0.12 0.14
Roads
11=n
0.91 0.15 0.16 0.66 0.19 0.28 0.79 0.12 0.15
The process success scores were determined and tabulated as showed in Table 4.3.
Table 4.3: Process Success Scores
Project CPI SPI WPE Efficiency Score
Quality Score
Process Success Score
1 1.00 1.50 1.25 5 3 8.00 2 0.84 1.00 0.92 4 3 7.00 3 1.00 0.80 0.90 4 2 6.00 4 0.98 0.78 0.88 4 2 6.00 5 0.81 0.69 0.59 2 1 3.00 6 0.58 0.50 0.54 2 2 4.00 7 1.06 1.09 1.08 5 3 8.00 8 0.60 0.75 0.68 3 3 6.00 9 0.86 0.24 0.55 2 2 4.00 10 1.00 0.56 0.78 3 2 5.00 11 0.82 0.50 0.66 3 2 5.00 12 1.17 0.75 0.96 4 3 7.00 13 1.00 0.80 0.90 4 2 6.00 14 1.05 1.00 1.03 5 2 7.00 15 1.00 0.55 0.78 3 3 6.00 16 1.00 1.00 1.00 5 2 7.00 17 0.92 0.90 0.91 4 3 7.00
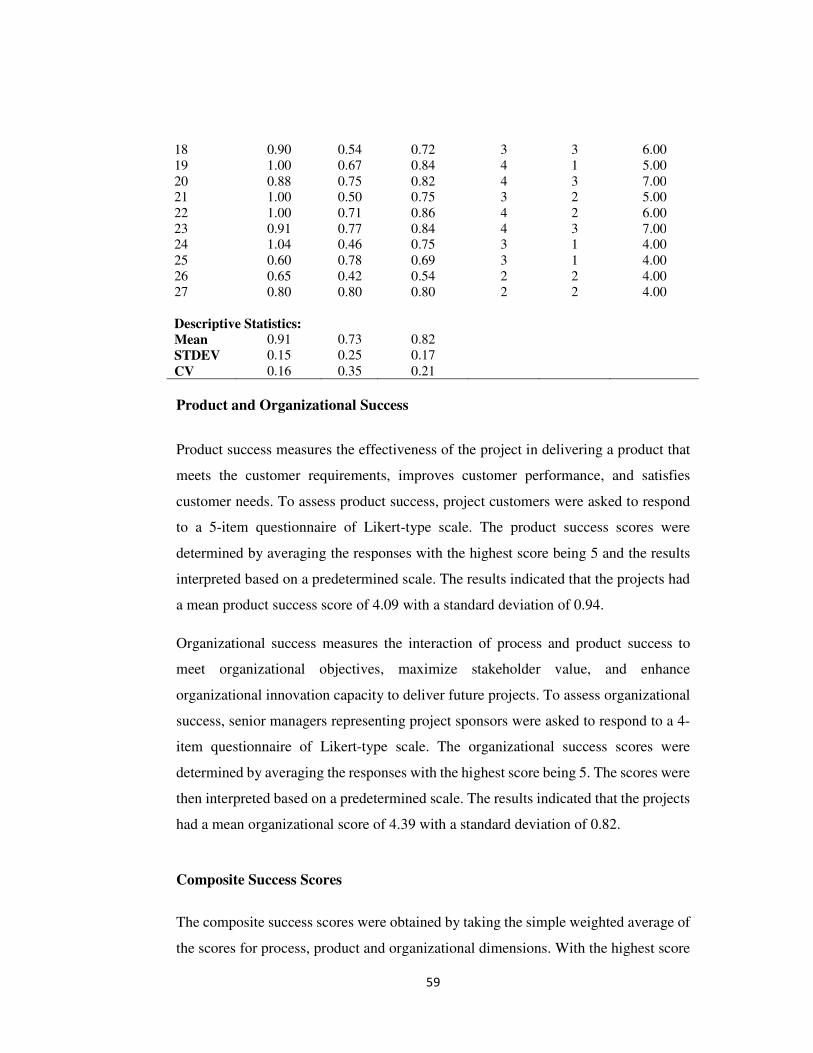
59
18 0.90 0.54 0.72 3 3 6.00 19 1.00 0.67 0.84 4 1 5.00 20 0.88 0.75 0.82 4 3 7.00 21 1.00 0.50 0.75 3 2 5.00 22 1.00 0.71 0.86 4 2 6.00 23 0.91 0.77 0.84 4 3 7.00 24 1.04 0.46 0.75 3 1 4.00 25 0.60 0.78 0.69 3 1 4.00 26 0.65 0.42 0.54 2 2 4.00 27 0.80 0.80 0.80 2 2 4.00
Descriptive Statistics:
Mean 0.91 0.73 0.82 STDEV 0.15 0.25 0.17 CV 0.16 0.35 0.21
Product and Organizational Success
Product success measures the effectiveness of the project in delivering a product that
meets the customer requirements, improves customer performance, and satisfies
customer needs. To assess product success, project customers were asked to respond
to a 5-item questionnaire of Likert-type scale. The product success scores were
determined by averaging the responses with the highest score being 5 and the results
interpreted based on a predetermined scale. The results indicated that the projects had
a mean product success score of 4.09 with a standard deviation of 0.94.
Organizational success measures the interaction of process and product success to
meet organizational objectives, maximize stakeholder value, and enhance
organizational innovation capacity to deliver future projects. To assess organizational
success, senior managers representing project sponsors were asked to respond to a 4-
item questionnaire of Likert-type scale. The organizational success scores were
determined by averaging the responses with the highest score being 5. The scores were
then interpreted based on a predetermined scale. The results indicated that the projects
had a mean organizational score of 4.39 with a standard deviation of 0.82.
Composite Success Scores
The composite success scores were obtained by taking the simple weighted average of
the scores for process, product and organizational dimensions. With the highest score
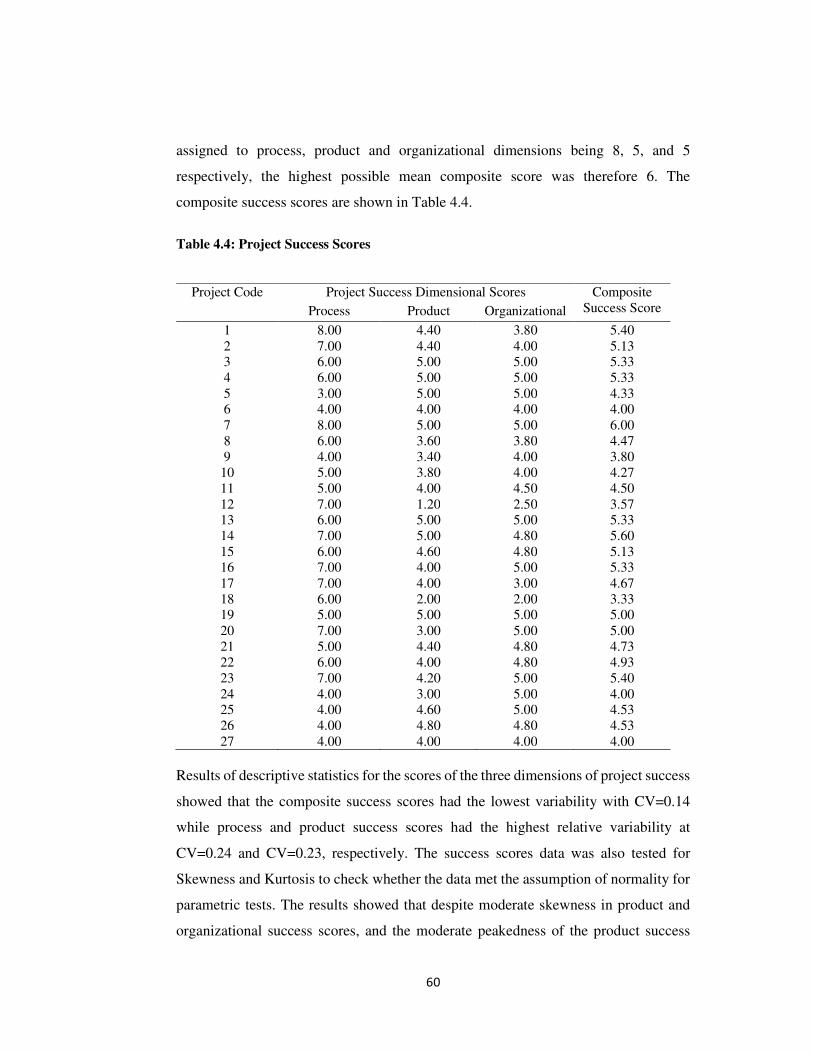
60
assigned to process, product and organizational dimensions being 8, 5, and 5
respectively, the highest possible mean composite score was therefore 6. The
composite success scores are shown in Table 4.4.
Table 4.4: Project Success Scores
Project Code Project Success Dimensional Scores Composite Success Score Process Product Organizational
1 8.00 4.40 3.80 5.40 2 7.00 4.40 4.00 5.13 3 6.00 5.00 5.00 5.33 4 6.00 5.00 5.00 5.33 5 3.00 5.00 5.00 4.33 6 4.00 4.00 4.00 4.00 7 8.00 5.00 5.00 6.00 8 6.00 3.60 3.80 4.47 9 4.00 3.40 4.00 3.80 10 5.00 3.80 4.00 4.27 11 5.00 4.00 4.50 4.50 12 7.00 1.20 2.50 3.57 13 6.00 5.00 5.00 5.33 14 7.00 5.00 4.80 5.60 15 6.00 4.60 4.80 5.13 16 7.00 4.00 5.00 5.33 17 7.00 4.00 3.00 4.67 18 6.00 2.00 2.00 3.33 19 5.00 5.00 5.00 5.00 20 7.00 3.00 5.00 5.00 21 5.00 4.40 4.80 4.73 22 6.00 4.00 4.80 4.93 23 7.00 4.20 5.00 5.40 24 4.00 3.00 5.00 4.00 25 4.00 4.60 5.00 4.53 26 4.00 4.80 4.80 4.53 27 4.00 4.00 4.00 4.00
Results of descriptive statistics for the scores of the three dimensions of project success
showed that the composite success scores had the lowest variability with CV=0.14
while process and product success scores had the highest relative variability at
CV=0.24 and CV=0.23, respectively. The success scores data was also tested for
Skewness and Kurtosis to check whether the data met the assumption of normality for
parametric tests. The results showed that despite moderate skewness in product and
organizational success scores, and the moderate peakedness of the product success
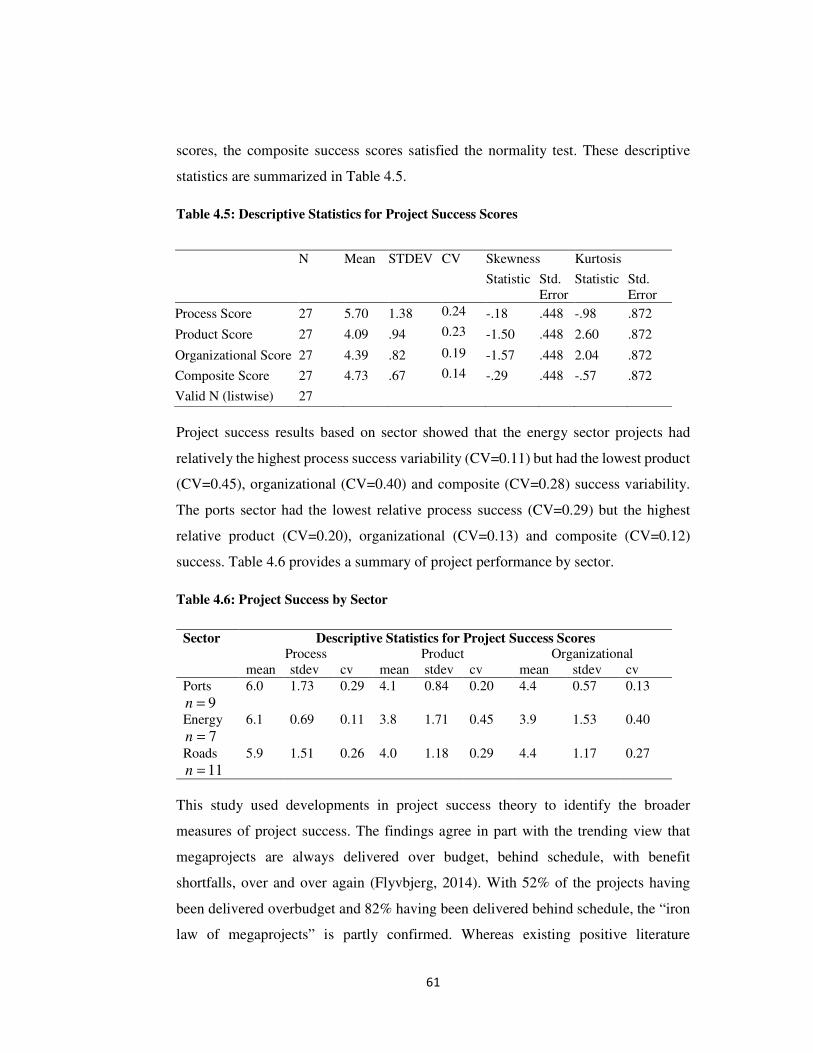
61
scores, the composite success scores satisfied the normality test. These descriptive
statistics are summarized in Table 4.5.
Table 4.5: Descriptive Statistics for Project Success Scores
N Mean STDEV CV Skewness Kurtosis
Statistic Std. Error
Statistic Std. Error
Process Score 27 5.70 1.38 0.24 -.18 .448 -.98 .872
Product Score 27 4.09 .94 0.23 -1.50 .448 2.60 .872
Organizational Score 27 4.39 .82 0.19 -1.57 .448 2.04 .872
Composite Score 27 4.73 .67 0.14 -.29 .448 -.57 .872
Valid N (listwise) 27
Project success results based on sector showed that the energy sector projects had
relatively the highest process success variability (CV=0.11) but had the lowest product
(CV=0.45), organizational (CV=0.40) and composite (CV=0.28) success variability.
The ports sector had the lowest relative process success (CV=0.29) but the highest
relative product (CV=0.20), organizational (CV=0.13) and composite (CV=0.12)
success. Table 4.6 provides a summary of project performance by sector.
Table 4.6: Project Success by Sector
This study used developments in project success theory to identify the broader
measures of project success. The findings agree in part with the trending view that
megaprojects are always delivered over budget, behind schedule, with benefit
shortfalls, over and over again (Flyvbjerg, 2014). With 52% of the projects having
been delivered overbudget and 82% having been delivered behind schedule, the “iron
law of megaprojects” is partly confirmed. Whereas existing positive literature
Sector Descriptive Statistics for Project Success Scores Process Product Organizational
mean stdev cv mean stdev cv mean stdev cv
Ports
9=n
6.0 1.73 0.29 4.1 0.84 0.20 4.4 0.57 0.13
Energy
7=n
6.1 0.69 0.11 3.8 1.71 0.45 3.9 1.53 0.40
Roads
11=n
5.9 1.51 0.26 4.0 1.18 0.29 4.4 1.17 0.27
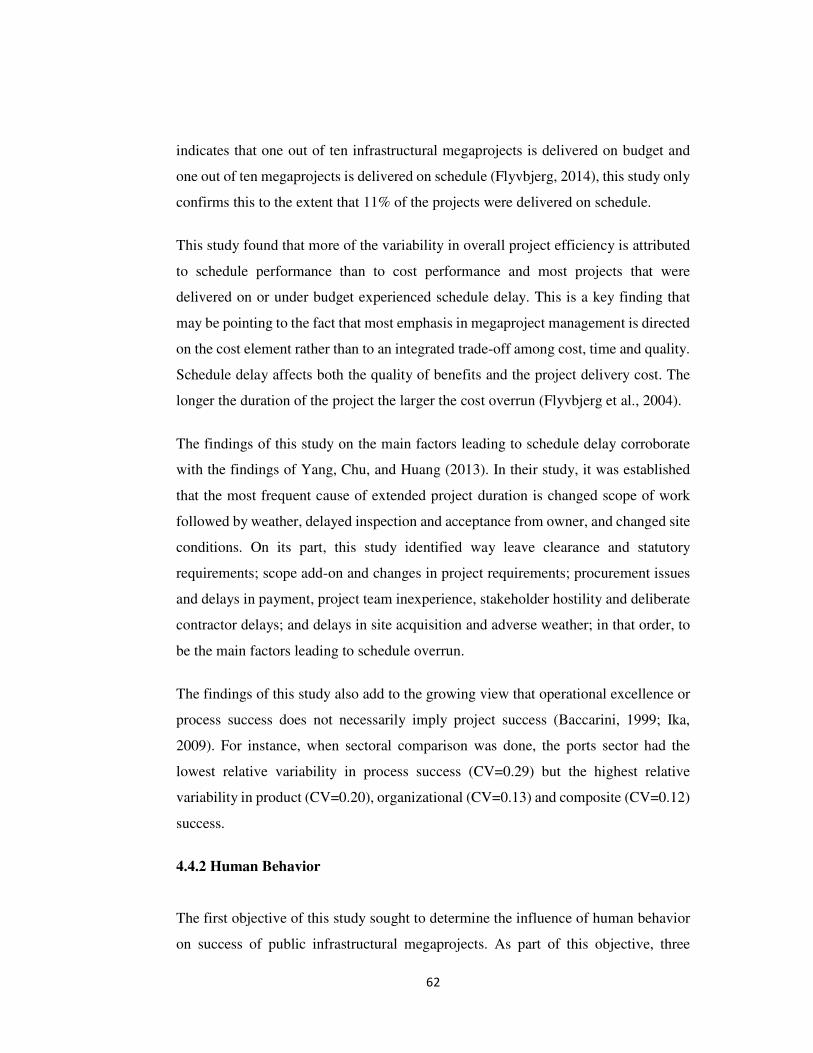
62
indicates that one out of ten infrastructural megaprojects is delivered on budget and
one out of ten megaprojects is delivered on schedule (Flyvbjerg, 2014), this study only
confirms this to the extent that 11% of the projects were delivered on schedule.
This study found that more of the variability in overall project efficiency is attributed
to schedule performance than to cost performance and most projects that were
delivered on or under budget experienced schedule delay. This is a key finding that
may be pointing to the fact that most emphasis in megaproject management is directed
on the cost element rather than to an integrated trade-off among cost, time and quality.
Schedule delay affects both the quality of benefits and the project delivery cost. The
longer the duration of the project the larger the cost overrun (Flyvbjerg et al., 2004).
The findings of this study on the main factors leading to schedule delay corroborate
with the findings of Yang, Chu, and Huang (2013). In their study, it was established
that the most frequent cause of extended project duration is changed scope of work
followed by weather, delayed inspection and acceptance from owner, and changed site
conditions. On its part, this study identified way leave clearance and statutory
requirements; scope add-on and changes in project requirements; procurement issues
and delays in payment, project team inexperience, stakeholder hostility and deliberate
contractor delays; and delays in site acquisition and adverse weather; in that order, to
be the main factors leading to schedule overrun.
The findings of this study also add to the growing view that operational excellence or
process success does not necessarily imply project success (Baccarini, 1999; Ika,
2009). For instance, when sectoral comparison was done, the ports sector had the
lowest relative variability in process success (CV=0.29) but the highest relative
variability in product (CV=0.20), organizational (CV=0.13) and composite (CV=0.12)
success.
4.4.2 Human Behavior
The first objective of this study sought to determine the influence of human behavior
on success of public infrastructural megaprojects. As part of this objective, three
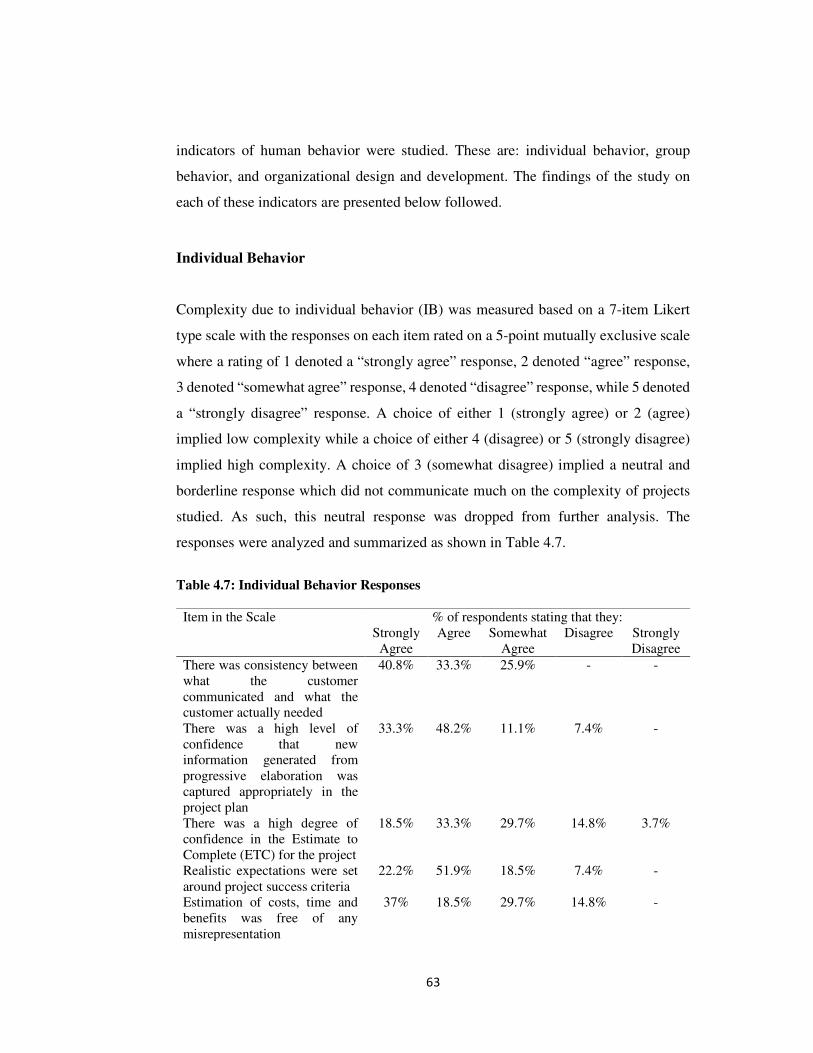
63
indicators of human behavior were studied. These are: individual behavior, group
behavior, and organizational design and development. The findings of the study on
each of these indicators are presented below followed.
Individual Behavior
Complexity due to individual behavior (IB) was measured based on a 7-item Likert
type scale with the responses on each item rated on a 5-point mutually exclusive scale
where a rating of 1 denoted a “strongly agree” response, 2 denoted “agree” response,
3 denoted “somewhat agree” response, 4 denoted “disagree” response, while 5 denoted
a “strongly disagree” response. A choice of either 1 (strongly agree) or 2 (agree)
implied low complexity while a choice of either 4 (disagree) or 5 (strongly disagree)
implied high complexity. A choice of 3 (somewhat disagree) implied a neutral and
borderline response which did not communicate much on the complexity of projects
studied. As such, this neutral response was dropped from further analysis. The
responses were analyzed and summarized as shown in Table 4.7.
Table 4.7: Individual Behavior Responses
Item in the Scale % of respondents stating that they: Strongly Agree
Agree Somewhat Agree
Disagree Strongly Disagree
There was consistency between what the customer communicated and what the customer actually needed
40.8% 33.3% 25.9% - -
There was a high level of confidence that new information generated from progressive elaboration was captured appropriately in the project plan
33.3% 48.2% 11.1% 7.4% -
There was a high degree of confidence in the Estimate to Complete (ETC) for the project
18.5% 33.3% 29.7% 14.8% 3.7%
Realistic expectations were set around project success criteria
22.2% 51.9% 18.5% 7.4% -
Estimation of costs, time and benefits was free of any misrepresentation
37% 18.5% 29.7% 14.8% -
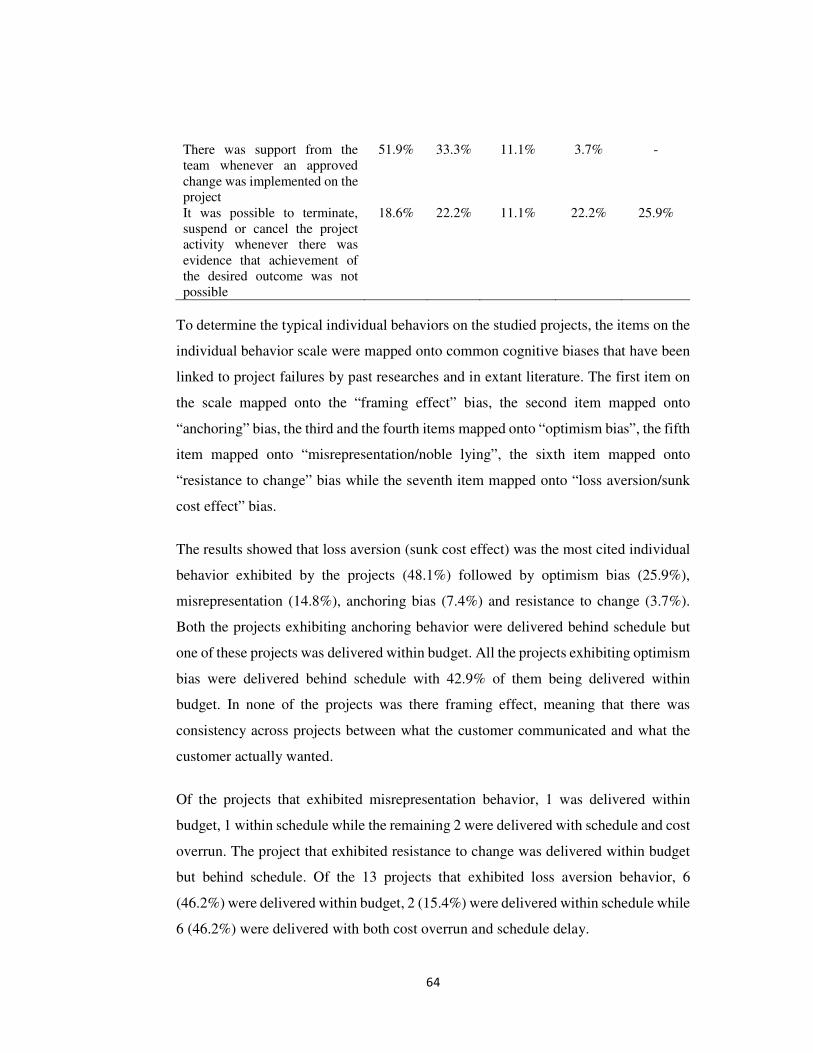
64
There was support from the team whenever an approved change was implemented on the project
51.9% 33.3% 11.1% 3.7% -
It was possible to terminate, suspend or cancel the project activity whenever there was evidence that achievement of the desired outcome was not possible
18.6% 22.2% 11.1% 22.2% 25.9%
To determine the typical individual behaviors on the studied projects, the items on the
individual behavior scale were mapped onto common cognitive biases that have been
linked to project failures by past researches and in extant literature. The first item on
the scale mapped onto the “framing effect” bias, the second item mapped onto
“anchoring” bias, the third and the fourth items mapped onto “optimism bias”, the fifth
item mapped onto “misrepresentation/noble lying”, the sixth item mapped onto
“resistance to change” bias while the seventh item mapped onto “loss aversion/sunk
cost effect” bias.
The results showed that loss aversion (sunk cost effect) was the most cited individual
behavior exhibited by the projects (48.1%) followed by optimism bias (25.9%),
misrepresentation (14.8%), anchoring bias (7.4%) and resistance to change (3.7%).
Both the projects exhibiting anchoring behavior were delivered behind schedule but
one of these projects was delivered within budget. All the projects exhibiting optimism
bias were delivered behind schedule with 42.9% of them being delivered within
budget. In none of the projects was there framing effect, meaning that there was
consistency across projects between what the customer communicated and what the
customer actually wanted.
Of the projects that exhibited misrepresentation behavior, 1 was delivered within
budget, 1 within schedule while the remaining 2 were delivered with schedule and cost
overrun. The project that exhibited resistance to change was delivered within budget
but behind schedule. Of the 13 projects that exhibited loss aversion behavior, 6
(46.2%) were delivered within budget, 2 (15.4%) were delivered within schedule while
6 (46.2%) were delivered with both cost overrun and schedule delay.
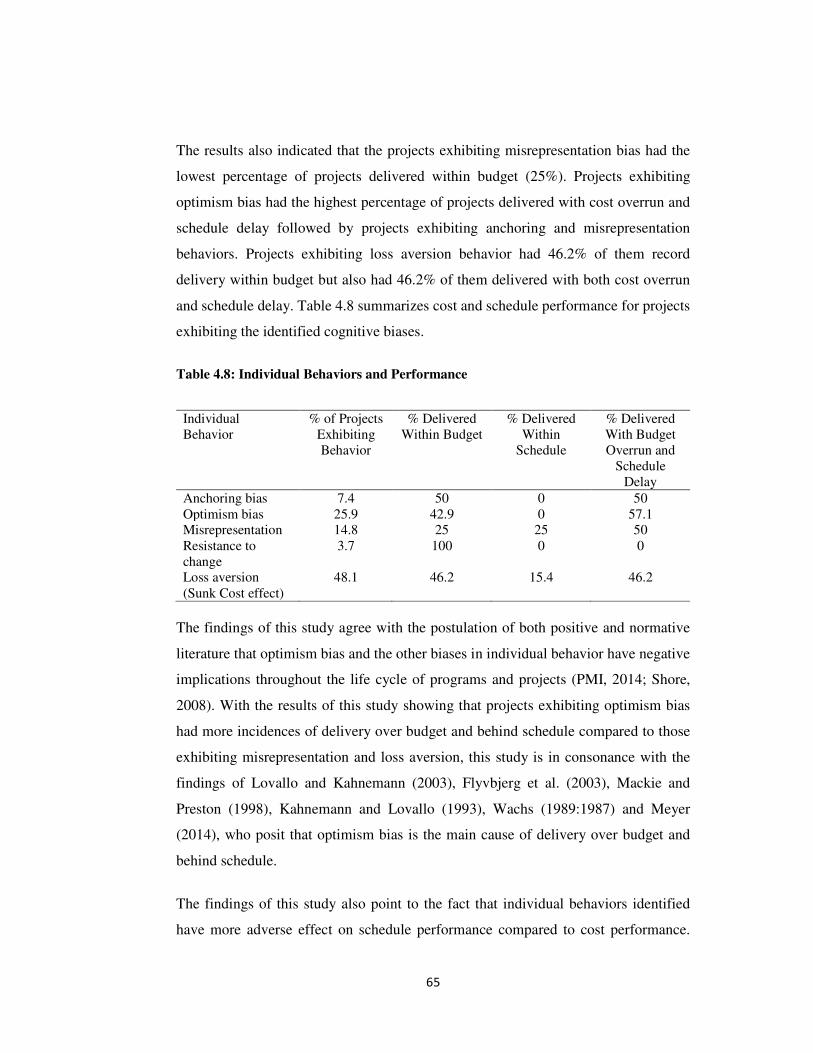
65
The results also indicated that the projects exhibiting misrepresentation bias had the
lowest percentage of projects delivered within budget (25%). Projects exhibiting
optimism bias had the highest percentage of projects delivered with cost overrun and
schedule delay followed by projects exhibiting anchoring and misrepresentation
behaviors. Projects exhibiting loss aversion behavior had 46.2% of them record
delivery within budget but also had 46.2% of them delivered with both cost overrun
and schedule delay. Table 4.8 summarizes cost and schedule performance for projects
exhibiting the identified cognitive biases.
Table 4.8: Individual Behaviors and Performance
Individual Behavior
% of Projects Exhibiting Behavior
% Delivered Within Budget
% Delivered Within
Schedule
% Delivered With Budget Overrun and
Schedule Delay
Anchoring bias 7.4 50 0 50 Optimism bias 25.9 42.9 0 57.1 Misrepresentation 14.8 25 25 50 Resistance to change
3.7 100 0 0
Loss aversion (Sunk Cost effect)
48.1 46.2 15.4 46.2
The findings of this study agree with the postulation of both positive and normative
literature that optimism bias and the other biases in individual behavior have negative
implications throughout the life cycle of programs and projects (PMI, 2014; Shore,
2008). With the results of this study showing that projects exhibiting optimism bias
had more incidences of delivery over budget and behind schedule compared to those
exhibiting misrepresentation and loss aversion, this study is in consonance with the
findings of Lovallo and Kahnemann (2003), Flyvbjerg et al. (2003), Mackie and
Preston (1998), Kahnemann and Lovallo (1993), Wachs (1989:1987) and Meyer
(2014), who posit that optimism bias is the main cause of delivery over budget and
behind schedule.
The findings of this study also point to the fact that individual behaviors identified
have more adverse effect on schedule performance compared to cost performance.
66
Indeed, the mean cost performance for the entire sample was higher and more stable
compared to the mean schedule performance. This finding may be pointing to the fact
that public infrastructural megaproject sponsors feel more pressure from the public
when projects are delivered over budget compared to when they are delivered behind
schedule and so they prioritize cost performance over schedule performance. Where
this is the case, the overall essence of project management is lost as delivery on
schedule is a core performance metric that must be monitored closely just as cost
performance. Previous studies have shown that implementation sluggishness has a
significant relationship with cost escalation in infrastructure projects (Flyvbjerg,
Holm, & Buhl, 2004).
The findings of this study put misrepresentation bias in the second place among
individual biases associated with cost overrun and schedule delay. Misrepresentation,
which is sometimes referred to as “noble lying” has its support in Hirschman’s theory
and a postulation that if people knew in advance the real challenges and costs involved
in delivering megaprojects, they would probably never have touched them and nothing
would get built (Flyvbjerg, 2014). Even though this theory is flawed in validity based
on the small sample size on which it was construed, this study shows that it indeed
explains under performance on infrastructural megaprojects. The surprising bit is that
this misrepresentation comes from both in-project and corporate or programme
management, as in the cases where project managers cited servitude to be the main
reason for both cost and schedule underperformance.
In terms of occurrence on projects, this study found that loss aversion had almost twice
the frequency of optimism bias and thrice the frequency of misrepresentation. These
results corroborate with those of Shore (2008) who found twice as many incidences of
sunk cost effect (loss aversion) in comparison with overconfidence (optimism).
Continued exhibition of loss aversion bias on projects does not support the generally
accepted project management principle of “continued business justification” (Axelos,
2017). According to this principle, a project can be canceled any time during its life
cycle whenever it is found that its business case is not viable, desirable or achievable.
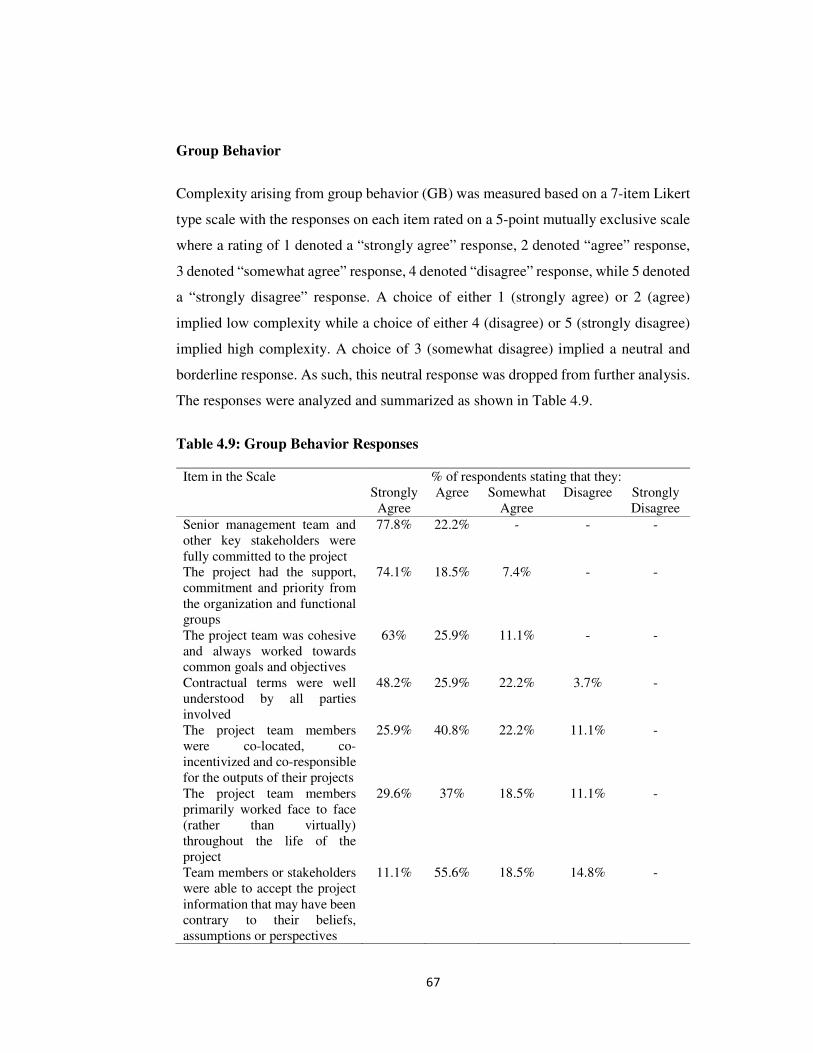
67
Group Behavior
Complexity arising from group behavior (GB) was measured based on a 7-item Likert
type scale with the responses on each item rated on a 5-point mutually exclusive scale
where a rating of 1 denoted a “strongly agree” response, 2 denoted “agree” response,
3 denoted “somewhat agree” response, 4 denoted “disagree” response, while 5 denoted
a “strongly disagree” response. A choice of either 1 (strongly agree) or 2 (agree)
implied low complexity while a choice of either 4 (disagree) or 5 (strongly disagree)
implied high complexity. A choice of 3 (somewhat disagree) implied a neutral and
borderline response. As such, this neutral response was dropped from further analysis.
The responses were analyzed and summarized as shown in Table 4.9.
Table 4.9: Group Behavior Responses Item in the Scale % of respondents stating that they:
Strongly Agree
Agree Somewhat Agree
Disagree Strongly Disagree
Senior management team and other key stakeholders were fully committed to the project
77.8% 22.2% - - -
The project had the support, commitment and priority from the organization and functional groups
74.1% 18.5% 7.4% - -
The project team was cohesive and always worked towards common goals and objectives
63% 25.9% 11.1% - -
Contractual terms were well understood by all parties involved
48.2% 25.9% 22.2% 3.7% -
The project team members were co-located, co-incentivized and co-responsible for the outputs of their projects
25.9% 40.8% 22.2% 11.1% -
The project team members primarily worked face to face (rather than virtually) throughout the life of the project
29.6% 37% 18.5% 11.1% -
Team members or stakeholders were able to accept the project information that may have been contrary to their beliefs, assumptions or perspectives
11.1% 55.6% 18.5% 14.8% -
68
Analysis of project delivery was conducted based on the responses in the GB scale.
The results showed that of the projects in which the respondents agreed that senior
management team and other key stakeholders were fully committed to the project,
48.2% were delivered within budget while 18.5% were delivered within schedule. Top
management support and support from other key stakeholders have long been
recognized in extant literature as a key factor that contributes to project success (PMI,
2014; Hauschildt, Gesche, & Medcof, 2000). This is even more important for
infrastructural megaprojects which are transformational in nature and whose budget
may be more than the entire implementing organization’s asset base in real terms. In
some cases, the project may be the only activity the organization is involved in over
several years. For the most part, senior management confuse this support for
micromanagement and may get involved in the day to day management of the project
denying the project manager and the team the flexibility they require to manage the
project as per the project charter. This micromanagement comes with a lot of interests,
including issues of servitude (as identified in this study) which could lead to poor
project delivery capability. It is not surprising therefore, that despite the centrality of
top management support in delivering successful projects, this study found that less
than 50% of the projects where senior management teams were fully committed to
their course were delivered within budget and a dismal 18.5% were delivered within
schedule.
Of the projects in which respondents agreed that the project had the support,
commitment and priority from the organization and functional groups, 52% were
delivered within budget, with 20% being delivered within schedule. This is plausible
particularly considering that nine out ten megaprojects have cost overruns (Flyvbjerg,
2014). Of the projects in which the respondents agreed that the project team was
cohesive and always worked towards common goals and objectives, 54.2% were
delivered within budget but only 20.8% were delivered within schedule. Again
compared with the results in Flyvbjerg (2014), this is plausible. Normative literature
recognizes that team working can improve efficiency (Green, 1997) but team work
does not guarantee in itself good results (Belbin, 1993). Rather, what is important is
how the individuals within the group work cohesively together (Mullins, 2005). The
69
various behaviors of the team members must mesh together in order to achieve
objectives (Crainer, 1998).
Of all projects in which respondents agreed that contractual terms were well
understood by all parties involved, 55% were delivered within budget while 25% were
delivered within schedule. All the projects in which the respondents disagreed with
this statement were delivered both behind schedule and with cost overrun. In
contemporary project management, the project manager has a role in ensuring that the
project procurement function works well in support of project delivery. Ensuring that
supplies of the right quality are delivered to the project at the right time is critical. Both
ISO 21500:2012 and the PMBOK® Guide consider procurement as a key knowledge
area for project management. It is also required of the project manager to ensure that
contractual terms are well understood by all parties to the procurement contracts as
any misunderstanding could lead to disputes and claims, which may affect project
delivery capability. In practice however, procurement is usually a separate function
from projects with its own structures.
For the projects in which the respondents agreed that project team members were co-
located, co-incentivized and co-responsible for the outputs of their projects, 38.9%
were delivered within budget while 16.7% were delivered within schedule. For the
projects that disagreed with this statement, 33.3% were delivered within budget with
none being delivered within schedule. This finding agrees with the postulations of
normative literature that co-location is a factor in ensuring rapid and faster
communication when managing projects in dynamic environments (Collyer, 2016) and
it enhances the ability of team members to perform as a team (PMI, 2013c). The results
showed that for the projects in which the respondents agreed that the project team
members primarily worked face to face (rather than virtually) throughout the life of
the project, 47.4% were delivered within budget with 10.5% being delivered on
schedule. All the projects in which respondents disagreed with this statement were
delivered with both cost overrun and schedule delay.
For the projects in which team members or stakeholders were able to accept the project
information that may have been contrary to their beliefs, assumptions or perspectives,
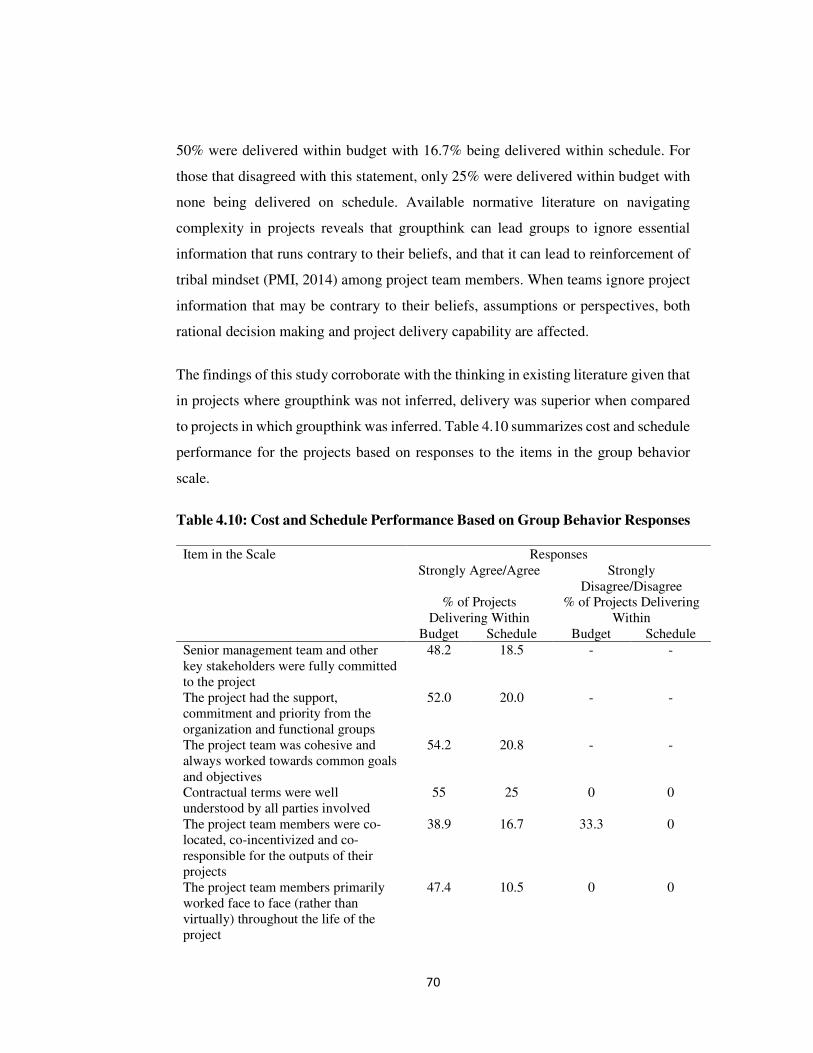
70
50% were delivered within budget with 16.7% being delivered within schedule. For
those that disagreed with this statement, only 25% were delivered within budget with
none being delivered on schedule. Available normative literature on navigating
complexity in projects reveals that groupthink can lead groups to ignore essential
information that runs contrary to their beliefs, and that it can lead to reinforcement of
tribal mindset (PMI, 2014) among project team members. When teams ignore project
information that may be contrary to their beliefs, assumptions or perspectives, both
rational decision making and project delivery capability are affected.
The findings of this study corroborate with the thinking in existing literature given that
in projects where groupthink was not inferred, delivery was superior when compared
to projects in which groupthink was inferred. Table 4.10 summarizes cost and schedule
performance for the projects based on responses to the items in the group behavior
scale.
Table 4.10: Cost and Schedule Performance Based on Group Behavior Responses
Item in the Scale Responses Strongly Agree/Agree Strongly
Disagree/Disagree % of Projects
Delivering Within % of Projects Delivering
Within Budget Schedule Budget Schedule
Senior management team and other key stakeholders were fully committed to the project
48.2 18.5 - -
The project had the support, commitment and priority from the organization and functional groups
52.0 20.0 - -
The project team was cohesive and always worked towards common goals and objectives
54.2 20.8 - -
Contractual terms were well understood by all parties involved
55 25 0 0
The project team members were co-located, co-incentivized and co-responsible for the outputs of their projects
38.9 16.7 33.3 0
The project team members primarily worked face to face (rather than virtually) throughout the life of the project
47.4 10.5 0 0
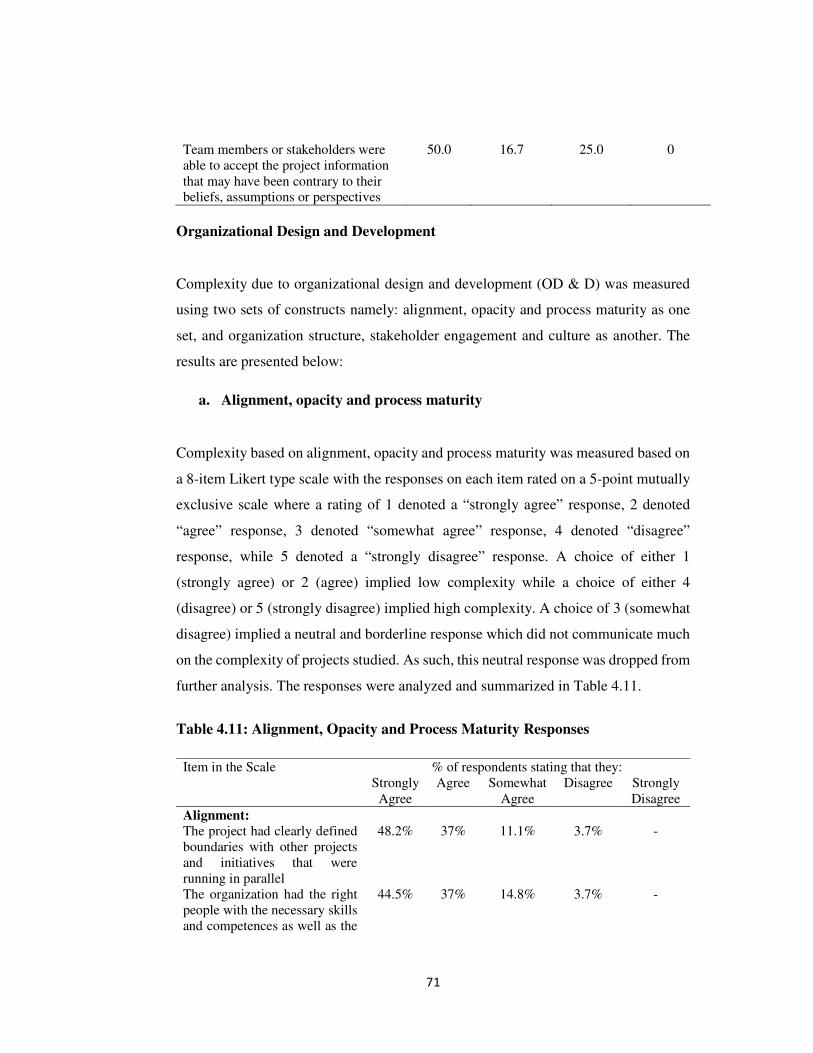
71
Team members or stakeholders were able to accept the project information that may have been contrary to their beliefs, assumptions or perspectives
50.0 16.7 25.0 0
Organizational Design and Development
Complexity due to organizational design and development (OD & D) was measured
using two sets of constructs namely: alignment, opacity and process maturity as one
set, and organization structure, stakeholder engagement and culture as another. The
results are presented below:
a. Alignment, opacity and process maturity
Complexity based on alignment, opacity and process maturity was measured based on
a 8-item Likert type scale with the responses on each item rated on a 5-point mutually
exclusive scale where a rating of 1 denoted a “strongly agree” response, 2 denoted
“agree” response, 3 denoted “somewhat agree” response, 4 denoted “disagree”
response, while 5 denoted a “strongly disagree” response. A choice of either 1
(strongly agree) or 2 (agree) implied low complexity while a choice of either 4
(disagree) or 5 (strongly disagree) implied high complexity. A choice of 3 (somewhat
disagree) implied a neutral and borderline response which did not communicate much
on the complexity of projects studied. As such, this neutral response was dropped from
further analysis. The responses were analyzed and summarized in Table 4.11.
Table 4.11: Alignment, Opacity and Process Maturity Responses
Item in the Scale % of respondents stating that they: Strongly Agree
Agree Somewhat Agree
Disagree Strongly Disagree
Alignment: The project had clearly defined boundaries with other projects and initiatives that were running in parallel
48.2% 37% 11.1% 3.7% -
The organization had the right people with the necessary skills and competences as well as the
44.5% 37% 14.8% 3.7% -
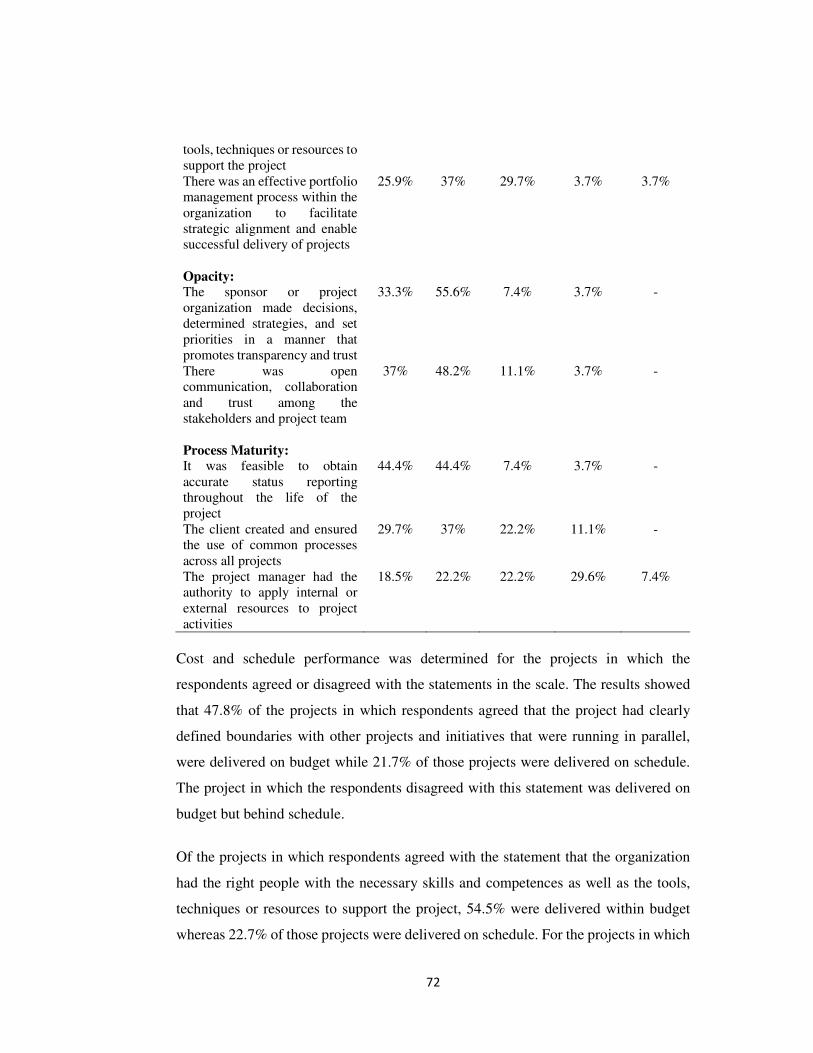
72
tools, techniques or resources to support the project There was an effective portfolio management process within the organization to facilitate strategic alignment and enable successful delivery of projects
25.9% 37% 29.7% 3.7% 3.7%
Opacity:
The sponsor or project organization made decisions, determined strategies, and set priorities in a manner that promotes transparency and trust
33.3% 55.6% 7.4% 3.7% -
There was open communication, collaboration and trust among the stakeholders and project team
37% 48.2% 11.1% 3.7% -
Process Maturity:
It was feasible to obtain accurate status reporting throughout the life of the project
44.4% 44.4% 7.4% 3.7% -
The client created and ensured the use of common processes across all projects
29.7% 37% 22.2% 11.1% -
The project manager had the authority to apply internal or external resources to project activities
18.5% 22.2% 22.2% 29.6% 7.4%
Cost and schedule performance was determined for the projects in which the
respondents agreed or disagreed with the statements in the scale. The results showed
that 47.8% of the projects in which respondents agreed that the project had clearly
defined boundaries with other projects and initiatives that were running in parallel,
were delivered on budget while 21.7% of those projects were delivered on schedule.
The project in which the respondents disagreed with this statement was delivered on
budget but behind schedule.
Of the projects in which respondents agreed with the statement that the organization
had the right people with the necessary skills and competences as well as the tools,
techniques or resources to support the project, 54.5% were delivered within budget
whereas 22.7% of those projects were delivered on schedule. For the projects in which
73
respondents disagreed with this statement, none was delivered on budget or on
schedule.
For the projects in which the respondents agreed that there was an effective portfolio
management process within the organization to facilitate strategic alignment and
enable successful delivery of projects, 41.2% were delivered within budget while
17.6% were delivered within schedule. However, for the projects in which the
respondents disagreed with this statement, 50% were delivered on budget but none
was delivered within schedule. This finding agrees with the postulation in normative
literature that misalignment may result in conflicting priorities and direction for the
program or project team (PMI, 2014). For this study, the findings established that
project misalignment adversely affected schedule delivery and to a considerable
extent, budget delivery. The findings also support are reinforce the Structural
Contingency Theory which posits that An organization whose characteristics align
with the contingencies in its situation will perform more effectively compared to an
organization whose characteristics do not fit with the contingencies in its situation
((Donaldson, 2001).
On average, 50% of the projects in which the respondents agreed that the sponsor or
project organization made decisions, determined strategies, and set priorities in a
manner that promotes transparency and trust, were delivered on budget with 20.8% of
these projects being delivered on schedule. For the projects where this was not the
case, none was delivered on budget or on schedule. A total of 47.8% of the projects in
which there was open communication, collaboration and trust among the stakeholders
and project team, were delivered within budget while only 13% of these projects were
delivered on schedule. None of the projects in which the respondents disagreed with
this statement was delivered on budget or on schedule. This finding agrees with the
postulation of normative literature that in an environment that promotes open
communication and where project decisions, priorities and strategies are made
transparently, organization design and development improves the organization’s
visioning, empowerment, learning and problem solving processes (Mullins, 2005),
which are critical aspects of adaptive behavior that project managers require to
74
successfully deliver complex megaprojects. It was noted that none of the projects in
which decisions, strategies and priorities were not made in a transparent manner, was
delivered within budget or schedule.
The results of this study agree with the postulation in extant literature that effective
communication has an impact on project execution and/or outcome (PMI, 2013c;
Doloi, 2013; Rostand, 2013; Olaniran, Love, Edwards, Olatunji, & Matthews,
2015). It is also widely recognized in literature that trust within the project team and
among team members has a positive effect on transfer of knowledge (Holste & Fields,
2010; Maurer, 2010), which is critical for the team to explore and exploit decision
choices in complex megaprojects. As noted from this study, in projects where there
was no open communication, collaboration and trust among the stakeholders and
project team, the probability of delivery within cost and schedule dropped from 47.8%
and 13% respectively, to 0%. Perhaps this finding provides a first level reply to
Olaniran et al. (2015) who postulated that there is need for further empirical research
to examine how communication influences megaproject performance.
Of the projects in which it was feasible to obtain accurate status reporting throughout
the life of the project, 52.2% were delivered on budget while 21.7% were delivered on
schedule. Where this was not the case, projects recorded 100% delivery within budget
with 0% delivery within schedule. In projects where the client created and ensured the
use of common processes across all projects, delivery within budget stood at 47.4%
with delivery within schedule capping at 21.1%. However, where this was not the case,
the probability of delivery within budget was 66.7% but none of those projects was
delivered within schedule. There is evidence that project management maturity (PMM)
is significantly related to business performance but not to project performance (Yazici,
2009). A critical aspect of PMM is process maturity which involves ensuring common
processes are followed across all projects-of course with a considerable amount of
tailoring. On whether PMM has a relationship with project performance, this study
posts mixed findings-on one hand it is concluded that lack of process maturity had
negative relationship with schedule delivery while the results are mixed on the
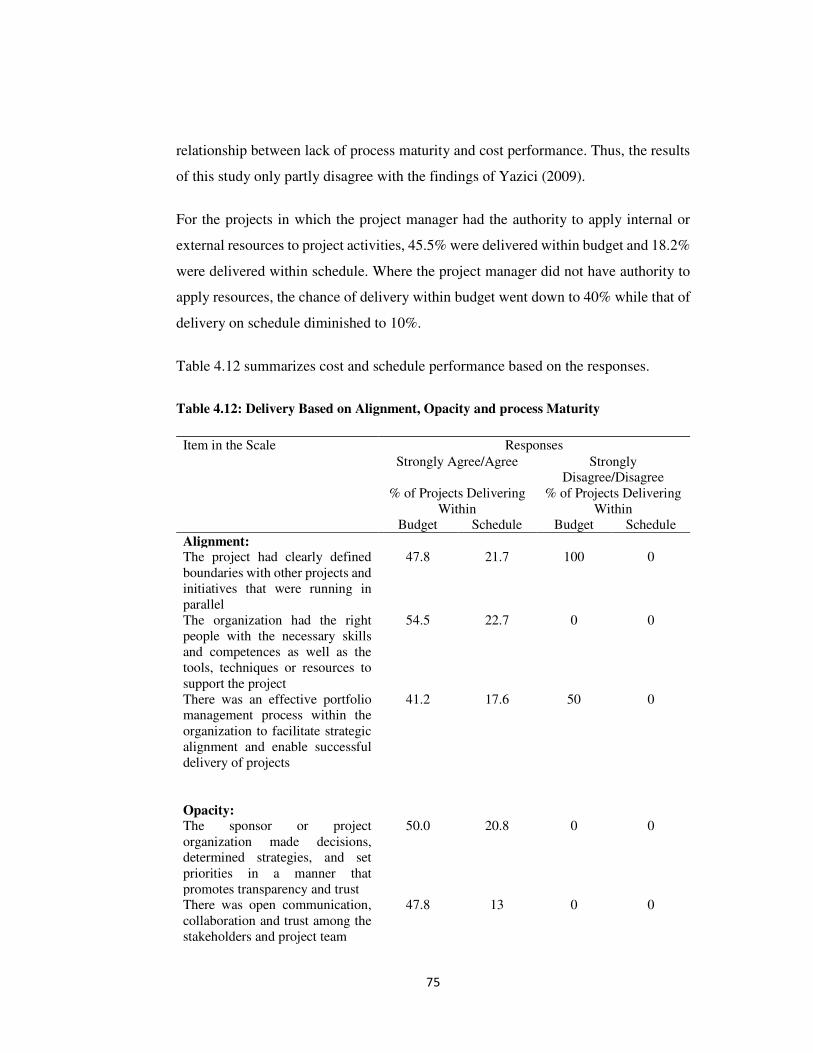
75
relationship between lack of process maturity and cost performance. Thus, the results
of this study only partly disagree with the findings of Yazici (2009).
For the projects in which the project manager had the authority to apply internal or
external resources to project activities, 45.5% were delivered within budget and 18.2%
were delivered within schedule. Where the project manager did not have authority to
apply resources, the chance of delivery within budget went down to 40% while that of
delivery on schedule diminished to 10%.
Table 4.12 summarizes cost and schedule performance based on the responses.
Table 4.12: Delivery Based on Alignment, Opacity and process Maturity
Item in the Scale Responses
Strongly Agree/Agree Strongly Disagree/Disagree
% of Projects Delivering Within
% of Projects Delivering Within
Budget Schedule Budget Schedule
Alignment: The project had clearly defined boundaries with other projects and initiatives that were running in parallel
47.8 21.7 100 0
The organization had the right people with the necessary skills and competences as well as the tools, techniques or resources to support the project
54.5 22.7 0 0
There was an effective portfolio management process within the organization to facilitate strategic alignment and enable successful delivery of projects
41.2 17.6 50 0
Opacity:
The sponsor or project organization made decisions, determined strategies, and set priorities in a manner that promotes transparency and trust
50.0 20.8 0 0
There was open communication, collaboration and trust among the stakeholders and project team
47.8 13 0 0
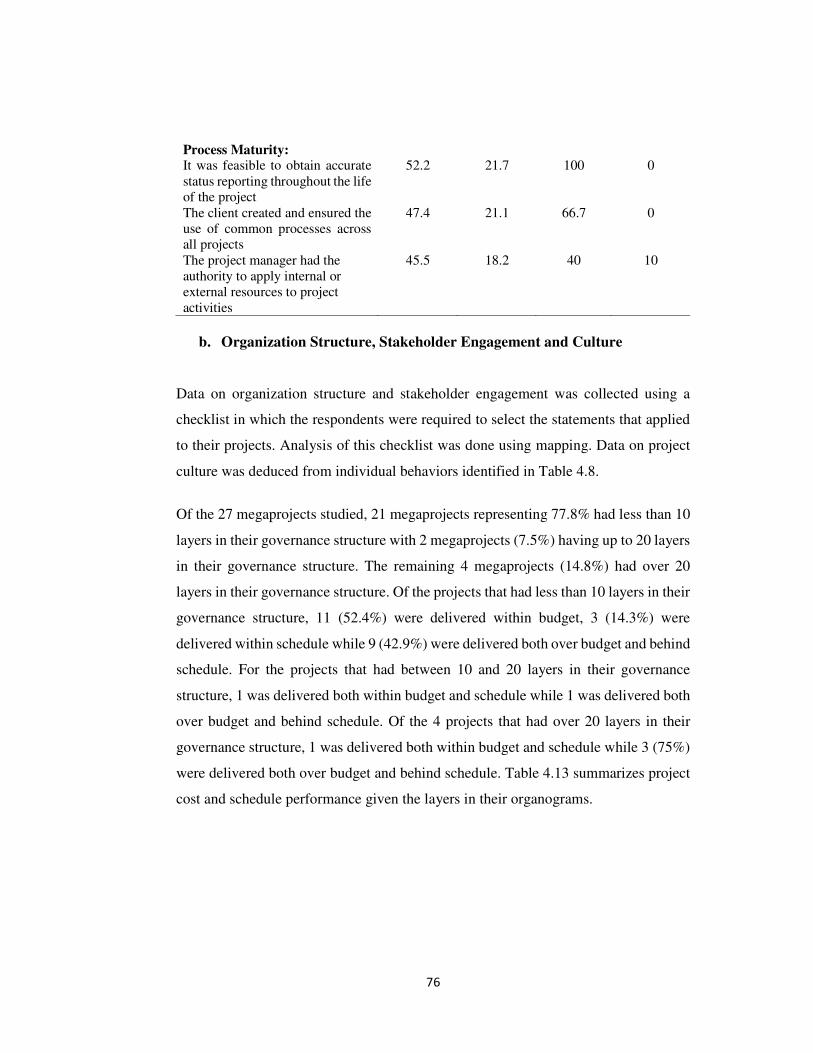
76
Process Maturity: It was feasible to obtain accurate status reporting throughout the life of the project
52.2 21.7 100 0
The client created and ensured the use of common processes across all projects
47.4 21.1 66.7 0
The project manager had the authority to apply internal or external resources to project activities
45.5 18.2 40 10
b. Organization Structure, Stakeholder Engagement and Culture
Data on organization structure and stakeholder engagement was collected using a
checklist in which the respondents were required to select the statements that applied
to their projects. Analysis of this checklist was done using mapping. Data on project
culture was deduced from individual behaviors identified in Table 4.8.
Of the 27 megaprojects studied, 21 megaprojects representing 77.8% had less than 10
layers in their governance structure with 2 megaprojects (7.5%) having up to 20 layers
in their governance structure. The remaining 4 megaprojects (14.8%) had over 20
layers in their governance structure. Of the projects that had less than 10 layers in their
governance structure, 11 (52.4%) were delivered within budget, 3 (14.3%) were
delivered within schedule while 9 (42.9%) were delivered both over budget and behind
schedule. For the projects that had between 10 and 20 layers in their governance
structure, 1 was delivered both within budget and schedule while 1 was delivered both
over budget and behind schedule. Of the 4 projects that had over 20 layers in their
governance structure, 1 was delivered both within budget and schedule while 3 (75%)
were delivered both over budget and behind schedule. Table 4.13 summarizes project
cost and schedule performance given the layers in their organograms.
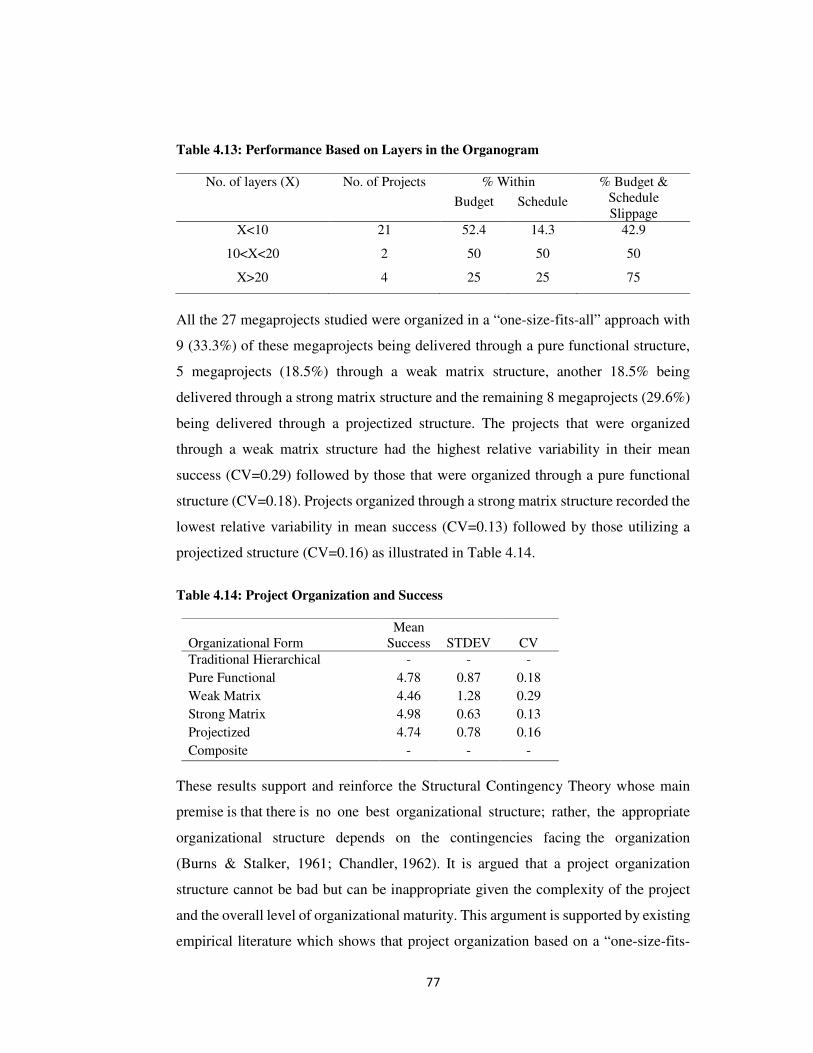
77
Table 4.13: Performance Based on Layers in the Organogram
No. of layers (X) No. of Projects % Within % Budget & Schedule Slippage
Budget Schedule
X<10 21 52.4 14.3 42.9
10<X<20 2 50 50 50
X>20 4 25 25 75
All the 27 megaprojects studied were organized in a “one-size-fits-all” approach with
9 (33.3%) of these megaprojects being delivered through a pure functional structure,
5 megaprojects (18.5%) through a weak matrix structure, another 18.5% being
delivered through a strong matrix structure and the remaining 8 megaprojects (29.6%)
being delivered through a projectized structure. The projects that were organized
through a weak matrix structure had the highest relative variability in their mean
success (CV=0.29) followed by those that were organized through a pure functional
structure (CV=0.18). Projects organized through a strong matrix structure recorded the
lowest relative variability in mean success (CV=0.13) followed by those utilizing a
projectized structure (CV=0.16) as illustrated in Table 4.14.
Table 4.14: Project Organization and Success
Organizational Form Mean
Success STDEV CV
Traditional Hierarchical - - -
Pure Functional 4.78 0.87 0.18
Weak Matrix 4.46 1.28 0.29
Strong Matrix 4.98 0.63 0.13
Projectized 4.74 0.78 0.16
Composite - - -
These results support and reinforce the Structural Contingency Theory whose main
premise is that there is no one best organizational structure; rather, the appropriate
organizational structure depends on the contingencies facing the organization
(Burns & Stalker, 1961; Chandler, 1962). It is argued that a project organization
structure cannot be bad but can be inappropriate given the complexity of the project
and the overall level of organizational maturity. This argument is supported by existing
empirical literature which shows that project organization based on a “one-size-fits-
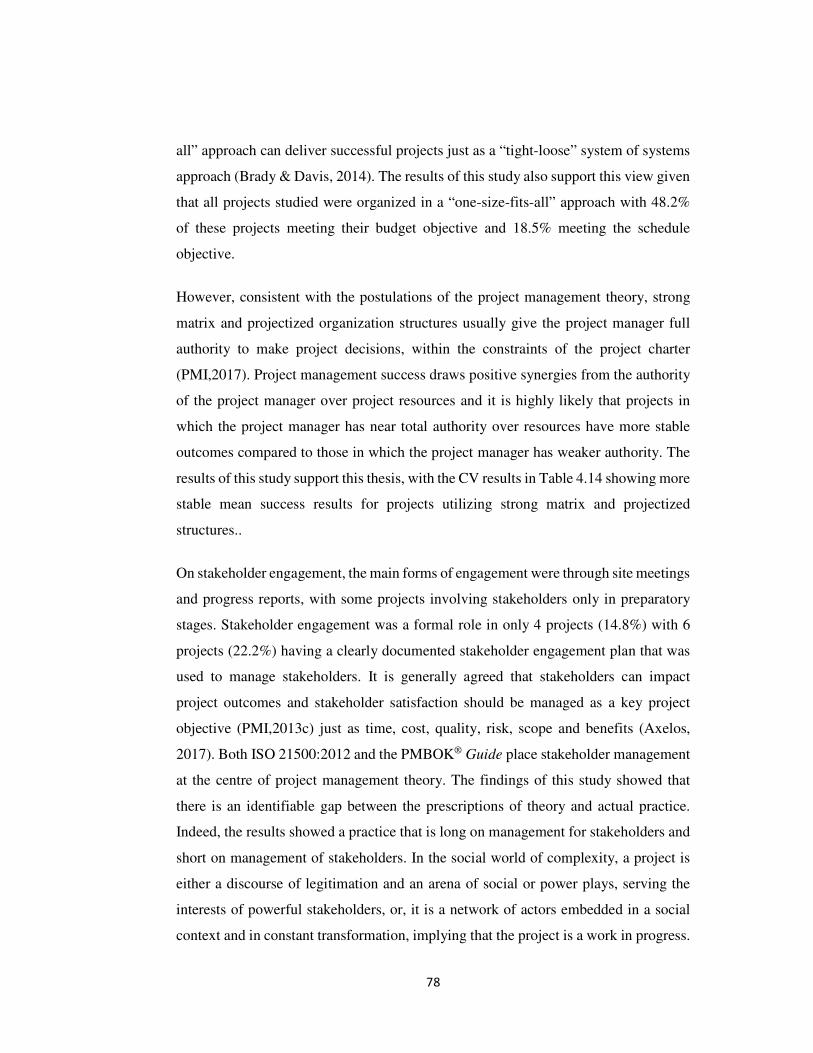
78
all” approach can deliver successful projects just as a “tight-loose” system of systems
approach (Brady & Davis, 2014). The results of this study also support this view given
that all projects studied were organized in a “one-size-fits-all” approach with 48.2%
of these projects meeting their budget objective and 18.5% meeting the schedule
objective.
However, consistent with the postulations of the project management theory, strong
matrix and projectized organization structures usually give the project manager full
authority to make project decisions, within the constraints of the project charter
(PMI,2017). Project management success draws positive synergies from the authority
of the project manager over project resources and it is highly likely that projects in
which the project manager has near total authority over resources have more stable
outcomes compared to those in which the project manager has weaker authority. The
results of this study support this thesis, with the CV results in Table 4.14 showing more
stable mean success results for projects utilizing strong matrix and projectized
structures..
On stakeholder engagement, the main forms of engagement were through site meetings
and progress reports, with some projects involving stakeholders only in preparatory
stages. Stakeholder engagement was a formal role in only 4 projects (14.8%) with 6
projects (22.2%) having a clearly documented stakeholder engagement plan that was
used to manage stakeholders. It is generally agreed that stakeholders can impact
project outcomes and stakeholder satisfaction should be managed as a key project
objective (PMI,2013c) just as time, cost, quality, risk, scope and benefits (Axelos,
2017). Both ISO 21500:2012 and the PMBOK® Guide place stakeholder management
at the centre of project management theory. The findings of this study showed that
there is an identifiable gap between the prescriptions of theory and actual practice.
Indeed, the results showed a practice that is long on management for stakeholders and
short on management of stakeholders. In the social world of complexity, a project is
either a discourse of legitimation and an arena of social or power plays, serving the
interests of powerful stakeholders, or, it is a network of actors embedded in a social
context and in constant transformation, implying that the project is a work in progress.
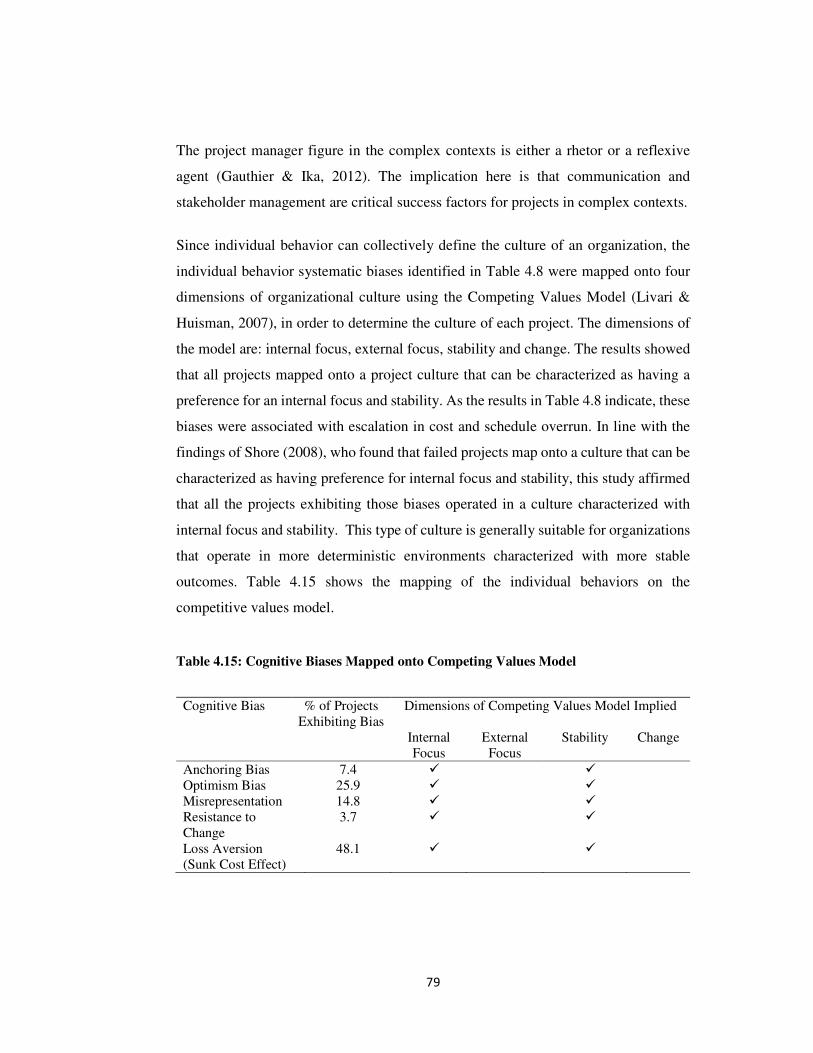
79
The project manager figure in the complex contexts is either a rhetor or a reflexive
agent (Gauthier & Ika, 2012). The implication here is that communication and
stakeholder management are critical success factors for projects in complex contexts.
Since individual behavior can collectively define the culture of an organization, the
individual behavior systematic biases identified in Table 4.8 were mapped onto four
dimensions of organizational culture using the Competing Values Model (Livari &
Huisman, 2007), in order to determine the culture of each project. The dimensions of
the model are: internal focus, external focus, stability and change. The results showed
that all projects mapped onto a project culture that can be characterized as having a
preference for an internal focus and stability. As the results in Table 4.8 indicate, these
biases were associated with escalation in cost and schedule overrun. In line with the
findings of Shore (2008), who found that failed projects map onto a culture that can be
characterized as having preference for internal focus and stability, this study affirmed
that all the projects exhibiting those biases operated in a culture characterized with
internal focus and stability. This type of culture is generally suitable for organizations
that operate in more deterministic environments characterized with more stable
outcomes. Table 4.15 shows the mapping of the individual behaviors on the
competitive values model.
Table 4.15: Cognitive Biases Mapped onto Competing Values Model
Cognitive Bias % of Projects Exhibiting Bias
Dimensions of Competing Values Model Implied
Internal Focus
External Focus
Stability Change
Anchoring Bias 7.4 � � Optimism Bias 25.9 � � Misrepresentation 14.8 � � Resistance to Change
3.7 � �
Loss Aversion (Sunk Cost Effect)
48.1 � �
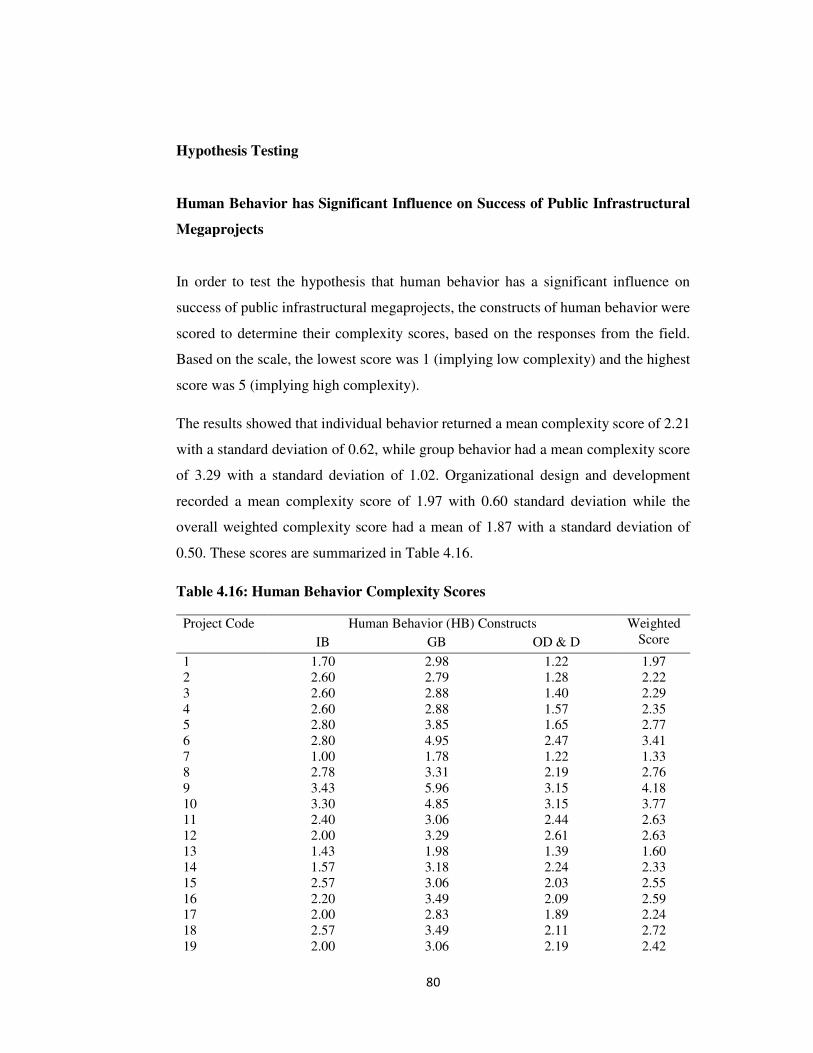
80
Hypothesis Testing
Human Behavior has Significant Influence on Success of Public Infrastructural
Megaprojects
In order to test the hypothesis that human behavior has a significant influence on
success of public infrastructural megaprojects, the constructs of human behavior were
scored to determine their complexity scores, based on the responses from the field.
Based on the scale, the lowest score was 1 (implying low complexity) and the highest
score was 5 (implying high complexity).
The results showed that individual behavior returned a mean complexity score of 2.21
with a standard deviation of 0.62, while group behavior had a mean complexity score
of 3.29 with a standard deviation of 1.02. Organizational design and development
recorded a mean complexity score of 1.97 with 0.60 standard deviation while the
overall weighted complexity score had a mean of 1.87 with a standard deviation of
0.50. These scores are summarized in Table 4.16.
Table 4.16: Human Behavior Complexity Scores
Project Code Human Behavior (HB) Constructs Weighted Score IB GB OD & D
1 1.70 2.98 1.22 1.97 2 2.60 2.79 1.28 2.22 3 2.60 2.88 1.40 2.29 4 2.60 2.88 1.57 2.35 5 2.80 3.85 1.65 2.77 6 2.80 4.95 2.47 3.41 7 1.00 1.78 1.22 1.33 8 2.78 3.31 2.19 2.76 9 3.43 5.96 3.15 4.18 10 3.30 4.85 3.15 3.77 11 2.40 3.06 2.44 2.63 12 2.00 3.29 2.61 2.63 13 1.43 1.98 1.39 1.60 14 1.57 3.18 2.24 2.33 15 2.57 3.06 2.03 2.55 16 2.20 3.49 2.09 2.59 17 2.00 2.83 1.89 2.24 18 2.57 3.49 2.11 2.72 19 2.00 3.06 2.19 2.42
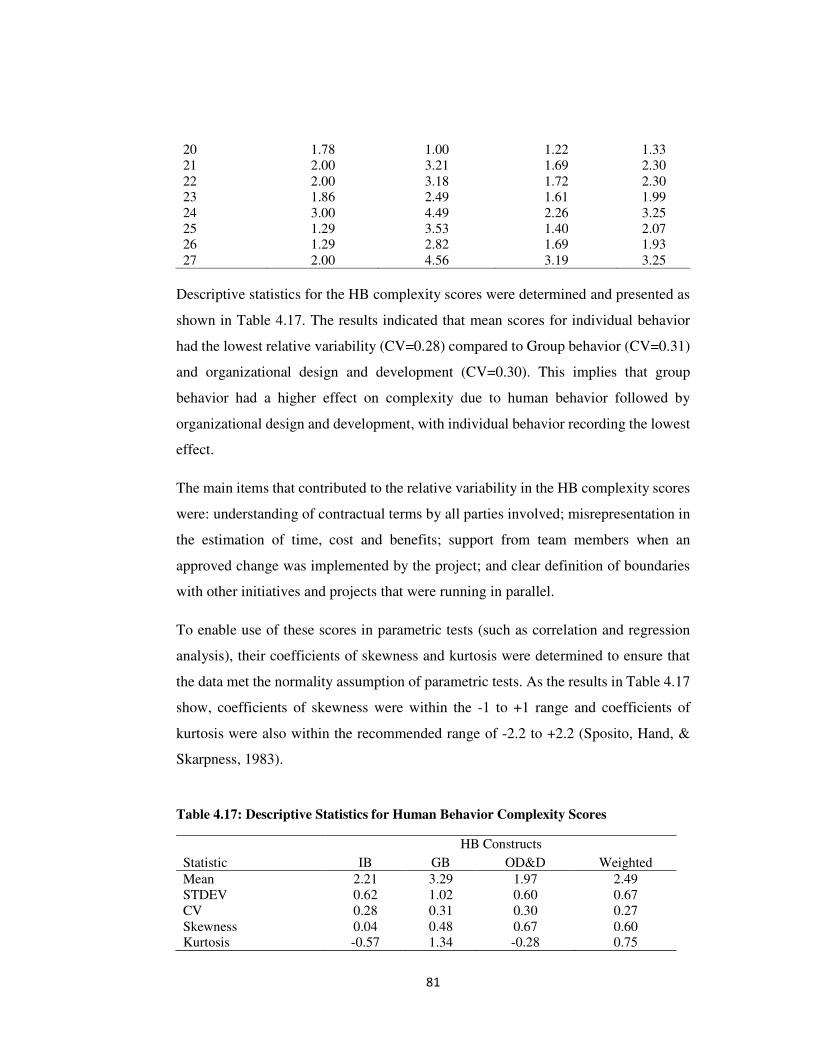
81
20 1.78 1.00 1.22 1.33 21 2.00 3.21 1.69 2.30 22 2.00 3.18 1.72 2.30 23 1.86 2.49 1.61 1.99 24 3.00 4.49 2.26 3.25 25 1.29 3.53 1.40 2.07 26 1.29 2.82 1.69 1.93 27 2.00 4.56 3.19 3.25
Descriptive statistics for the HB complexity scores were determined and presented as
shown in Table 4.17. The results indicated that mean scores for individual behavior
had the lowest relative variability (CV=0.28) compared to Group behavior (CV=0.31)
and organizational design and development (CV=0.30). This implies that group
behavior had a higher effect on complexity due to human behavior followed by
organizational design and development, with individual behavior recording the lowest
effect.
The main items that contributed to the relative variability in the HB complexity scores
were: understanding of contractual terms by all parties involved; misrepresentation in
the estimation of time, cost and benefits; support from team members when an
approved change was implemented by the project; and clear definition of boundaries
with other initiatives and projects that were running in parallel.
To enable use of these scores in parametric tests (such as correlation and regression
analysis), their coefficients of skewness and kurtosis were determined to ensure that
the data met the normality assumption of parametric tests. As the results in Table 4.17
show, coefficients of skewness were within the -1 to +1 range and coefficients of
kurtosis were also within the recommended range of -2.2 to +2.2 (Sposito, Hand, &
Skarpness, 1983).
Table 4.17: Descriptive Statistics for Human Behavior Complexity Scores
HB Constructs
Statistic IB GB OD&D Weighted
Mean 2.21 3.29 1.97 2.49 STDEV 0.62 1.02 0.60 0.67 CV 0.28 0.31 0.30 0.27 Skewness 0.04 0.48 0.67 0.60 Kurtosis -0.57 1.34 -0.28 0.75
82
Results of the other diagnostic tests showed that there was no serial correlation in the
data used to conduct regression analysis given a Durbin-Watson statistic less than 2.
Data was also checked for collinearity using the Tolerance and VIF statistics. The
results indicated a VIF value much lower than 4 which is used as the threshold to
indicate multicollinearity particularly in small samples (O’Brien, 2007). The problem
of heteroscedasticity was checked using residual statistics in a scatter plot. The results
indicated that almost all the residuals had a mean of 0.000 and were approximately
equally spread implying that the data was homoscedastic and was therefore good for
OLS regression analysis.
As a first step in testing the hypothesis, the scores of HB constructs were first
correlated with those of project success to determine if they had any association. The
results are summarized in Table 4.18. The results showed that at 99% confidence level
all the three dimensional measures of success had significant positive correlation with
the overall composite success score but this correlation was much stronger between
product dimension and overall composite score ( 710.0=r ). This was followed by the
organizational success dimension ( 630.0=r ). The correlation between the process
success dimension and the composite project success was the lowest )589.0( =r .
Further, the results showed that there was a strong significant positive correlation
between product success and organizational success ( 709.0=r ). At 99% confidence
level, the results showed that: there was significant moderate positive correlation
between individual and group behavior (r=0.674); the correlation between individual
behavior and organizational design and development was moderately positive and
significant (r=0.539); there was a significant strong positive correlation between group
behavior and organizational design and development (r=0.783); and group behavior
had the strongest significant positive correlation with the weighted HB complexity
(r=0.995) followed by organizational design and development (r=0.866) and
individual behavior (r=0.816).
On the relationship between human behavior and project success, the results indicated
that at 99% confidence level, group behavior and overall human behavior had
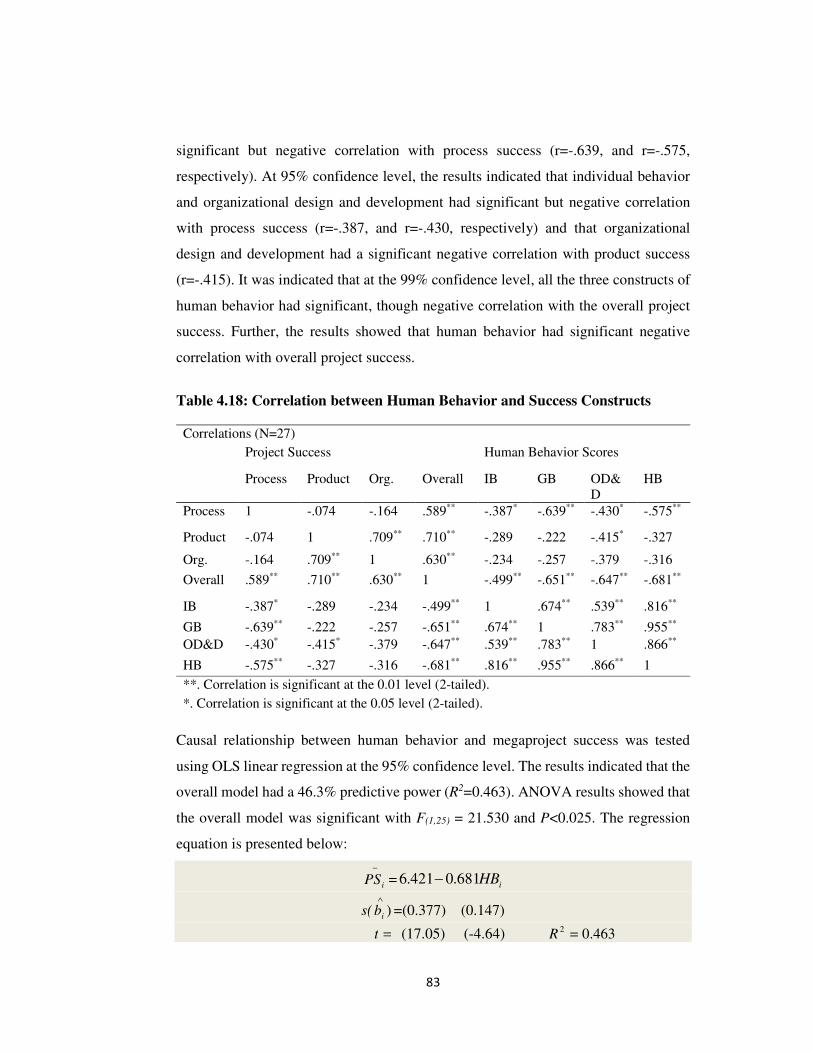
83
significant but negative correlation with process success (r=-.639, and r=-.575,
respectively). At 95% confidence level, the results indicated that individual behavior
and organizational design and development had significant but negative correlation
with process success (r=-.387, and r=-.430, respectively) and that organizational
design and development had a significant negative correlation with product success
(r=-.415). It was indicated that at the 99% confidence level, all the three constructs of
human behavior had significant, though negative correlation with the overall project
success. Further, the results showed that human behavior had significant negative
correlation with overall project success.
Table 4.18: Correlation between Human Behavior and Success Constructs
Correlations (N=27)
Project Success Human Behavior Scores
Process Product Org. Overall IB GB OD&D
HB
Process 1 -.074 -.164 .589** -.387* -.639** -.430* -.575**
Product -.074 1 .709** .710** -.289 -.222 -.415* -.327
Org. -.164 .709** 1 .630** -.234 -.257 -.379 -.316
Overall .589** .710** .630** 1 -.499** -.651** -.647** -.681**
IB -.387* -.289 -.234 -.499** 1 .674** .539** .816**
GB -.639** -.222 -.257 -.651** .674** 1 .783** .955**
OD&D -.430* -.415* -.379 -.647** .539** .783** 1 .866**
HB -.575** -.327 -.316 -.681** .816** .955** .866** 1
**. Correlation is significant at the 0.01 level (2-tailed).
*. Correlation is significant at the 0.05 level (2-tailed).
Causal relationship between human behavior and megaproject success was tested
using OLS linear regression at the 95% confidence level. The results indicated that the
overall model had a 46.3% predictive power (R2=0.463). ANOVA results showed that
the overall model was significant with F(1,25) = 21.530 and P<0.025. The regression
equation is presented below:
−
iPS = iHB681.0421.6 −
s( )∧
ib =(0.377) (0.147)
=t (17.05) (-4.64) 463.02 =R
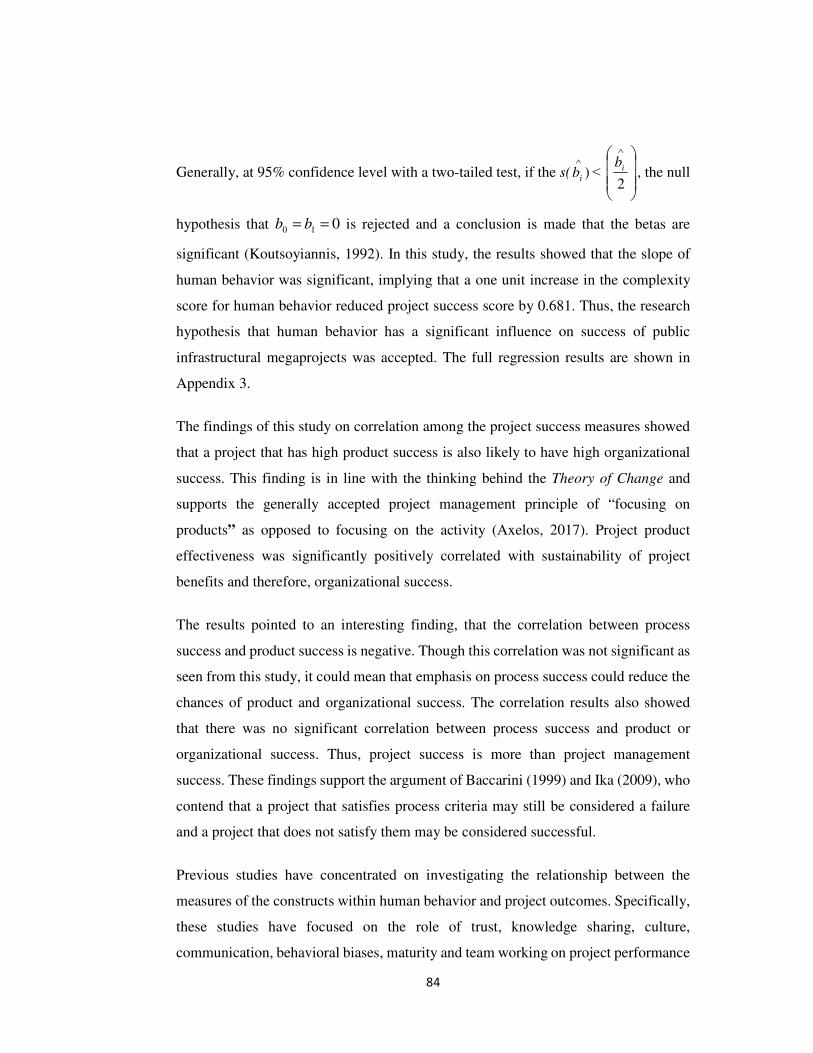
84
Generally, at 95% confidence level with a two-tailed test, if the s( )∧
ib ˂
∧
2
ib, the null
hypothesis that 010 == bb is rejected and a conclusion is made that the betas are
significant (Koutsoyiannis, 1992). In this study, the results showed that the slope of
human behavior was significant, implying that a one unit increase in the complexity
score for human behavior reduced project success score by 0.681. Thus, the research
hypothesis that human behavior has a significant influence on success of public
infrastructural megaprojects was accepted. The full regression results are shown in
Appendix 3.
The findings of this study on correlation among the project success measures showed
that a project that has high product success is also likely to have high organizational
success. This finding is in line with the thinking behind the Theory of Change and
supports the generally accepted project management principle of “focusing on
products” as opposed to focusing on the activity (Axelos, 2017). Project product
effectiveness was significantly positively correlated with sustainability of project
benefits and therefore, organizational success.
The results pointed to an interesting finding, that the correlation between process
success and product success is negative. Though this correlation was not significant as
seen from this study, it could mean that emphasis on process success could reduce the
chances of product and organizational success. The correlation results also showed
that there was no significant correlation between process success and product or
organizational success. Thus, project success is more than project management
success. These findings support the argument of Baccarini (1999) and Ika (2009), who
contend that a project that satisfies process criteria may still be considered a failure
and a project that does not satisfy them may be considered successful.
Previous studies have concentrated on investigating the relationship between the
measures of the constructs within human behavior and project outcomes. Specifically,
these studies have focused on the role of trust, knowledge sharing, culture,
communication, behavioral biases, maturity and team working on project performance
85
(Collyer, 2016; Maurer, 2010; Holste & Fields, 2010; Yazici, 2009; Shore, 2008;
Livari & Huisman, 2007). The present study looked at these measures collectively in
one variable called human behavior as an independent study variable. Thus, the
findings of this study contribute to and reinforce the developments in the behavior
school of thought in project management research (Turner et al., 2010).
4.4.3 Ambiguity
The second objective of this study was to investigate the influence of ambiguity on
success of public infrastructural megaprojects. Complexity arising from ambiguity
was measured on a scale comprising three constructs namely; project context,
emergence and uncertainty. The findings are presented per construct in the sections
that follow.
Project Context
Complexity due to project context was assessed using a checklist that contained several
statements regarding various project contractual arrangements and risk handling. The
respondents were required to choose all the statements in the checklist that applied to
their individual projects. The results showed that of the 27 projects surveyed, 20
projects (74.1%) utilized Fixed Price Contracts with 9(45%) of these utilizing a Firm
Fixed Price/Lump sum contract and 11 projects (55%) utilizing Fixed Price with
Economic Price Adjustment contract. One project (3.7%) utilized a Cost Plus
Fixed/Percentage Fee contract while 6 projects (22.2%) utilized some form of Cost
Contracts that involved re-measurement and ad-measurement based on initial
estimates and Bill of Quantities respectively.
Table 4.19 presents the mean performance statistics of the megaprojects studied based
on their contract types. The results showed that with the exception of the 1 project that
utilized a CPF/PF contract, the projects that utilized cost contracts involving re-/ad-
measurement had the highest mean success score at 5.11 points out of the possible
6.00. These projects also recorded the lowest relative variability (CV=0.1174) in the
individual mean success scores. Using the CV values as measures of riskiness in
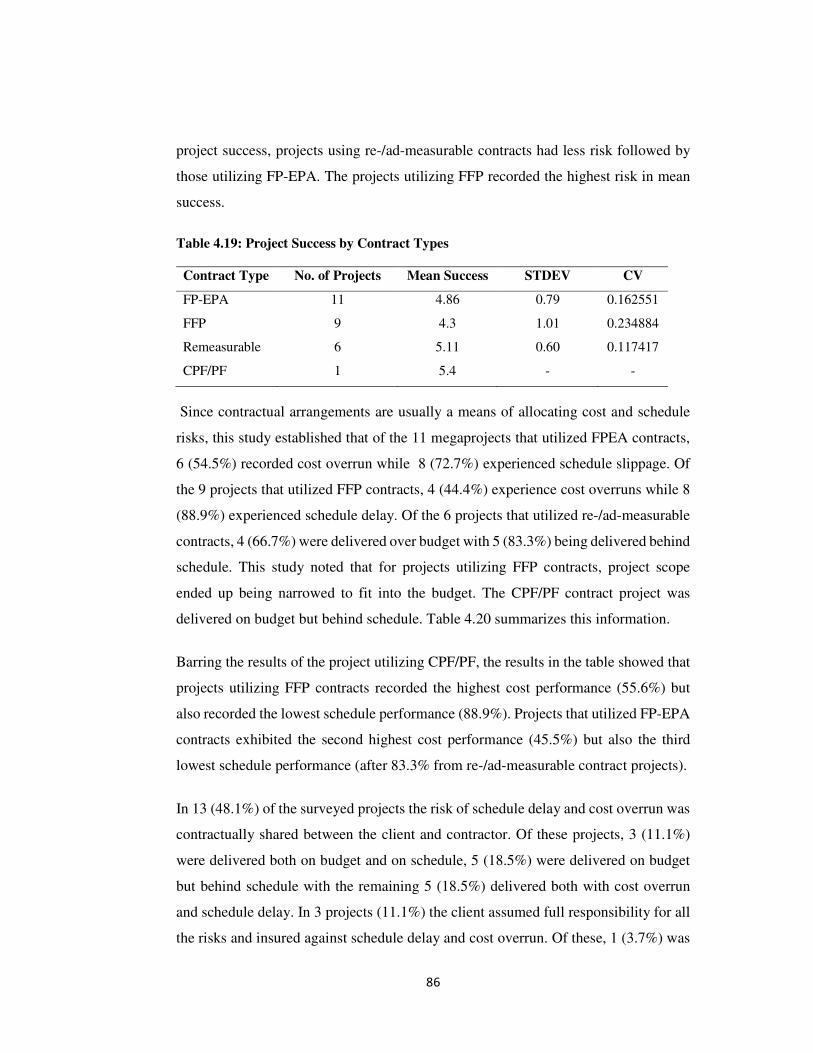
86
project success, projects using re-/ad-measurable contracts had less risk followed by
those utilizing FP-EPA. The projects utilizing FFP recorded the highest risk in mean
success.
Table 4.19: Project Success by Contract Types
Contract Type No. of Projects Mean Success STDEV CV
FP-EPA 11 4.86 0.79 0.162551
FFP 9 4.3 1.01 0.234884
Remeasurable 6 5.11 0.60 0.117417
CPF/PF 1 5.4 - -
Since contractual arrangements are usually a means of allocating cost and schedule
risks, this study established that of the 11 megaprojects that utilized FPEA contracts,
6 (54.5%) recorded cost overrun while 8 (72.7%) experienced schedule slippage. Of
the 9 projects that utilized FFP contracts, 4 (44.4%) experience cost overruns while 8
(88.9%) experienced schedule delay. Of the 6 projects that utilized re-/ad-measurable
contracts, 4 (66.7%) were delivered over budget with 5 (83.3%) being delivered behind
schedule. This study noted that for projects utilizing FFP contracts, project scope
ended up being narrowed to fit into the budget. The CPF/PF contract project was
delivered on budget but behind schedule. Table 4.20 summarizes this information.
Barring the results of the project utilizing CPF/PF, the results in the table showed that
projects utilizing FFP contracts recorded the highest cost performance (55.6%) but
also recorded the lowest schedule performance (88.9%). Projects that utilized FP-EPA
contracts exhibited the second highest cost performance (45.5%) but also the third
lowest schedule performance (after 83.3% from re-/ad-measurable contract projects).
In 13 (48.1%) of the surveyed projects the risk of schedule delay and cost overrun was
contractually shared between the client and contractor. Of these projects, 3 (11.1%)
were delivered both on budget and on schedule, 5 (18.5%) were delivered on budget
but behind schedule with the remaining 5 (18.5%) delivered both with cost overrun
and schedule delay. In 3 projects (11.1%) the client assumed full responsibility for all
the risks and insured against schedule delay and cost overrun. Of these, 1 (3.7%) was
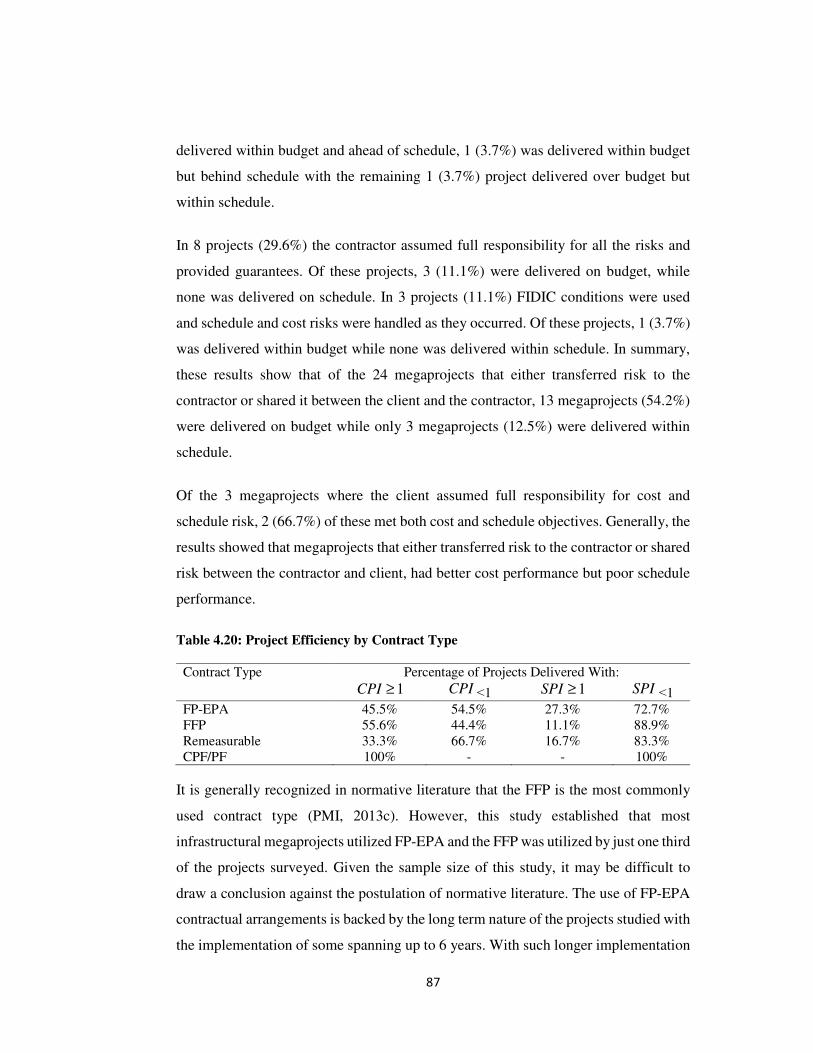
87
delivered within budget and ahead of schedule, 1 (3.7%) was delivered within budget
but behind schedule with the remaining 1 (3.7%) project delivered over budget but
within schedule.
In 8 projects (29.6%) the contractor assumed full responsibility for all the risks and
provided guarantees. Of these projects, 3 (11.1%) were delivered on budget, while
none was delivered on schedule. In 3 projects (11.1%) FIDIC conditions were used
and schedule and cost risks were handled as they occurred. Of these projects, 1 (3.7%)
was delivered within budget while none was delivered within schedule. In summary,
these results show that of the 24 megaprojects that either transferred risk to the
contractor or shared it between the client and the contractor, 13 megaprojects (54.2%)
were delivered on budget while only 3 megaprojects (12.5%) were delivered within
schedule.
Of the 3 megaprojects where the client assumed full responsibility for cost and
schedule risk, 2 (66.7%) of these met both cost and schedule objectives. Generally, the
results showed that megaprojects that either transferred risk to the contractor or shared
risk between the contractor and client, had better cost performance but poor schedule
performance.
Table 4.20: Project Efficiency by Contract Type
Contract Type Percentage of Projects Delivered With:
1≥CPI CPI ˂1 1≥SPI SPI ˂1
FP-EPA 45.5% 54.5% 27.3% 72.7% FFP 55.6% 44.4% 11.1% 88.9% Remeasurable 33.3% 66.7% 16.7% 83.3% CPF/PF 100% - - 100%
It is generally recognized in normative literature that the FFP is the most commonly
used contract type (PMI, 2013c). However, this study established that most
infrastructural megaprojects utilized FP-EPA and the FFP was utilized by just one third
of the projects surveyed. Given the sample size of this study, it may be difficult to
draw a conclusion against the postulation of normative literature. The use of FP-EPA
contractual arrangements is backed by the long term nature of the projects studied with
the implementation of some spanning up to 6 years. With such longer implementation
88
periods, it is likely that factors outside the control of the client or contractor such as
inflation and currency fluctuation may adversely affect cost performance.
The use of Fixed Price contracts is usually a tactic of transferring the risk of cost
overrun to the contractor. In the case of FFP contracts, the entire risk of cost overrun
is actually transferred from the client to the contractor. In such cases, the contractors
are usually careful not to eat into their profit margins. The results of this study agree
with this practice given that a larger proportion of projects that utilized FFP contracts
recorded the highest cost performance. This was followed by projects that utilized FP-
EPA, which is a variation of FP contracts. Despite having recorded superior cost
performance, projects that utilized FFP recorded the highest schedule slippage. This
could mean that utilizing FFP contracts could be a zero sum game-since project
management success must take into account both cost and schedule performance. It
was noted that projects whose contracts included late delivery penalties actually
delivered on schedule. This means that the use of FFP should be adjusted to include
late delivery penalties if the objectives of both cost and schedule are to be achieved
simultaneously.
The results indicated that none of the projects utilized contractual arrangements with
incentives for accelerated cost or schedule delivery. Such pain/gain contracts would
include Fixed Price Incentive Fee, Cost-Plus Incentive Fee or Cost-Plus Award Fee.
The use of these types of contracts incentivizes the contractor for superior delivery of
the pre-agreed performance metrics such as schedule and cost performance (PMI,
2013c). As such, using these types of contracts is strongly associated with superior
project performance (Brady & Davis, 2014) since the parties involved in the project
may prefer different actions because of their different risk preferences (Eisenhardt,
1989). Thus, the pain/gain contractual arrangements can be critical in solving the
agency problem that characterizes most employer-contractor relationships (Jensen &
Meckling, 1976) on projects.
It is argued that transferring risk to the contractor (as in the use of Fixed Price
contracts) offers no real protection for the client because the client is always
accountable for cost, time, quality and safety (Brady & Davis, 2014). The results of
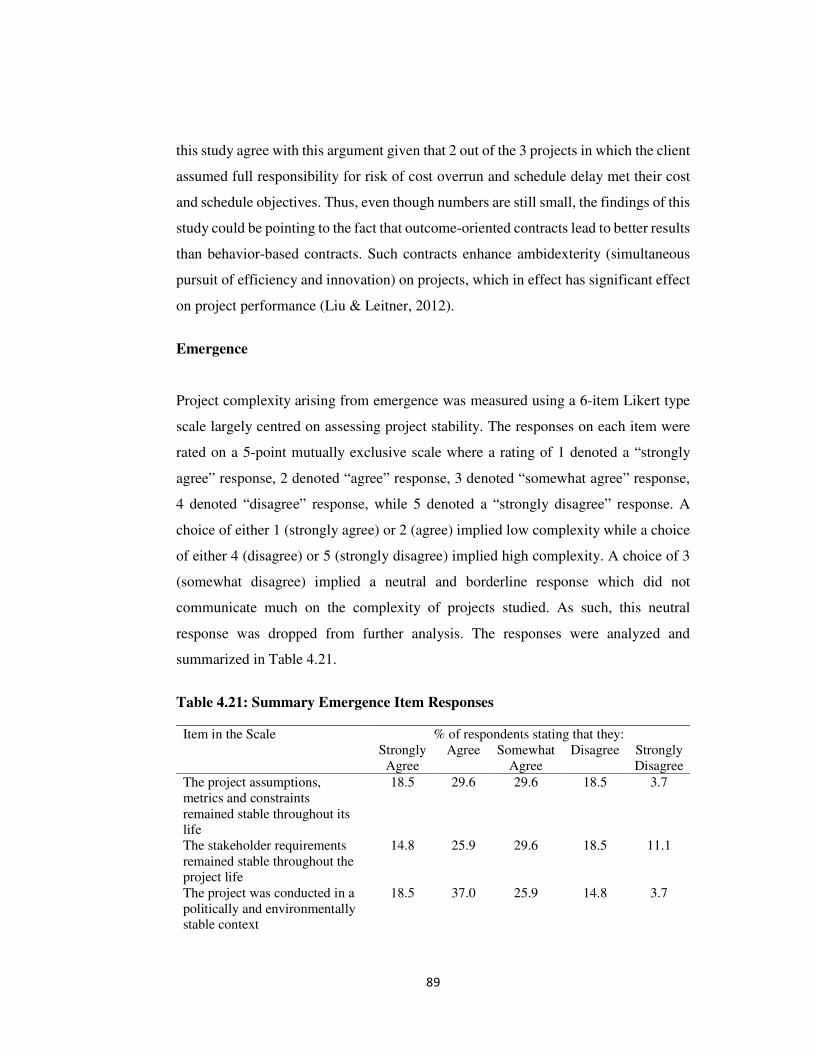
89
this study agree with this argument given that 2 out of the 3 projects in which the client
assumed full responsibility for risk of cost overrun and schedule delay met their cost
and schedule objectives. Thus, even though numbers are still small, the findings of this
study could be pointing to the fact that outcome-oriented contracts lead to better results
than behavior-based contracts. Such contracts enhance ambidexterity (simultaneous
pursuit of efficiency and innovation) on projects, which in effect has significant effect
on project performance (Liu & Leitner, 2012).
Emergence
Project complexity arising from emergence was measured using a 6-item Likert type
scale largely centred on assessing project stability. The responses on each item were
rated on a 5-point mutually exclusive scale where a rating of 1 denoted a “strongly
agree” response, 2 denoted “agree” response, 3 denoted “somewhat agree” response,
4 denoted “disagree” response, while 5 denoted a “strongly disagree” response. A
choice of either 1 (strongly agree) or 2 (agree) implied low complexity while a choice
of either 4 (disagree) or 5 (strongly disagree) implied high complexity. A choice of 3
(somewhat disagree) implied a neutral and borderline response which did not
communicate much on the complexity of projects studied. As such, this neutral
response was dropped from further analysis. The responses were analyzed and
summarized in Table 4.21.
Table 4.21: Summary Emergence Item Responses
Item in the Scale % of respondents stating that they: Strongly
Agree Agree Somewhat
Agree Disagree Strongly
Disagree
The project assumptions, metrics and constraints remained stable throughout its life
18.5 29.6 29.6 18.5 3.7
The stakeholder requirements remained stable throughout the project life
14.8 25.9 29.6 18.5 11.1
The project was conducted in a politically and environmentally stable context
18.5 37.0 25.9 14.8 3.7
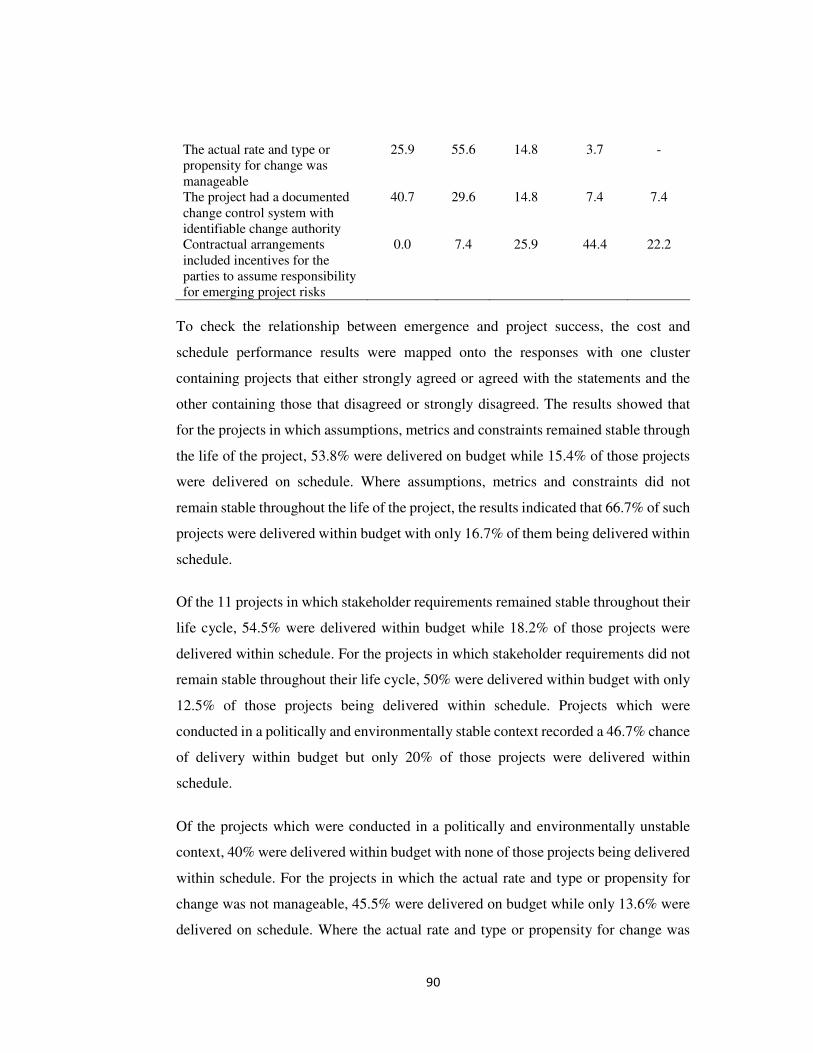
90
The actual rate and type or propensity for change was manageable
25.9 55.6 14.8 3.7 -
The project had a documented change control system with identifiable change authority
40.7 29.6 14.8 7.4 7.4
Contractual arrangements included incentives for the parties to assume responsibility for emerging project risks
0.0 7.4 25.9 44.4 22.2
To check the relationship between emergence and project success, the cost and
schedule performance results were mapped onto the responses with one cluster
containing projects that either strongly agreed or agreed with the statements and the
other containing those that disagreed or strongly disagreed. The results showed that
for the projects in which assumptions, metrics and constraints remained stable through
the life of the project, 53.8% were delivered on budget while 15.4% of those projects
were delivered on schedule. Where assumptions, metrics and constraints did not
remain stable throughout the life of the project, the results indicated that 66.7% of such
projects were delivered within budget with only 16.7% of them being delivered within
schedule.
Of the 11 projects in which stakeholder requirements remained stable throughout their
life cycle, 54.5% were delivered within budget while 18.2% of those projects were
delivered within schedule. For the projects in which stakeholder requirements did not
remain stable throughout their life cycle, 50% were delivered within budget with only
12.5% of those projects being delivered within schedule. Projects which were
conducted in a politically and environmentally stable context recorded a 46.7% chance
of delivery within budget but only 20% of those projects were delivered within
schedule.
Of the projects which were conducted in a politically and environmentally unstable
context, 40% were delivered within budget with none of those projects being delivered
within schedule. For the projects in which the actual rate and type or propensity for
change was not manageable, 45.5% were delivered on budget while only 13.6% were
delivered on schedule. Where the actual rate and type or propensity for change was
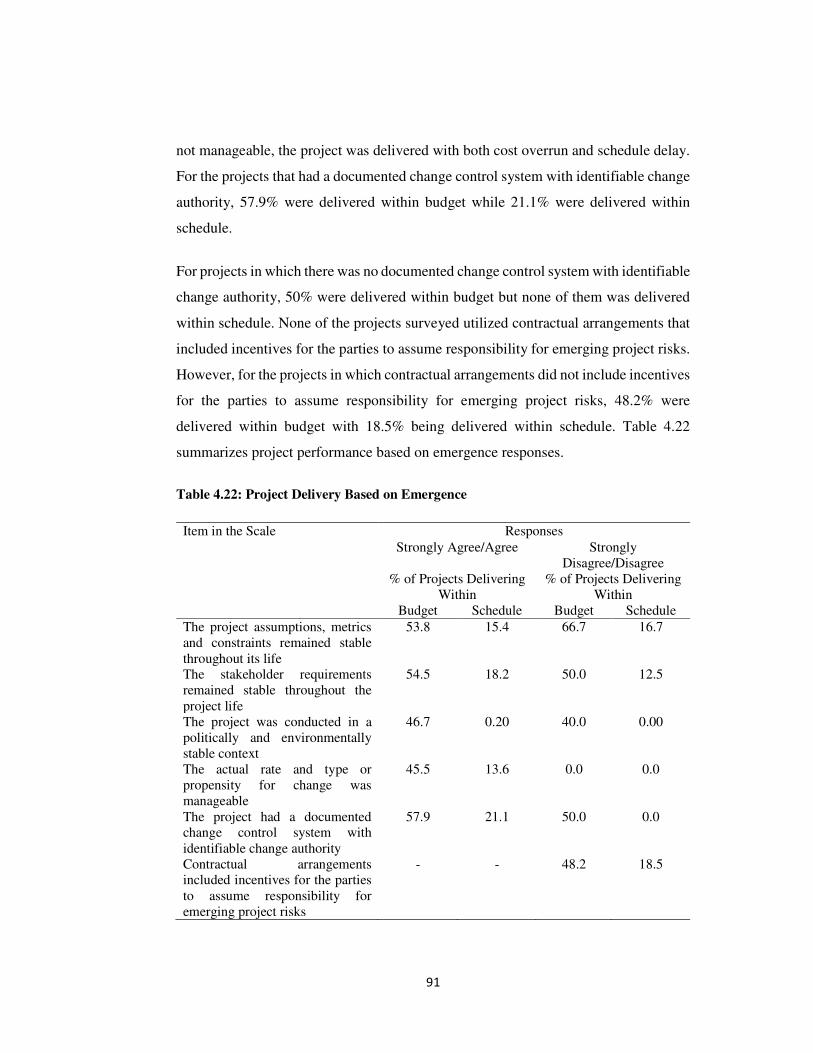
91
not manageable, the project was delivered with both cost overrun and schedule delay.
For the projects that had a documented change control system with identifiable change
authority, 57.9% were delivered within budget while 21.1% were delivered within
schedule.
For projects in which there was no documented change control system with identifiable
change authority, 50% were delivered within budget but none of them was delivered
within schedule. None of the projects surveyed utilized contractual arrangements that
included incentives for the parties to assume responsibility for emerging project risks.
However, for the projects in which contractual arrangements did not include incentives
for the parties to assume responsibility for emerging project risks, 48.2% were
delivered within budget with 18.5% being delivered within schedule. Table 4.22
summarizes project performance based on emergence responses.
Table 4.22: Project Delivery Based on Emergence
Item in the Scale Responses Strongly Agree/Agree Strongly
Disagree/Disagree % of Projects Delivering
Within % of Projects Delivering
Within Budget Schedule Budget Schedule
The project assumptions, metrics and constraints remained stable throughout its life
53.8 15.4 66.7 16.7
The stakeholder requirements remained stable throughout the project life
54.5 18.2 50.0 12.5
The project was conducted in a politically and environmentally stable context
46.7 0.20 40.0 0.00
The actual rate and type or propensity for change was manageable
45.5 13.6 0.0 0.0
The project had a documented change control system with identifiable change authority
57.9 21.1 50.0 0.0
Contractual arrangements included incentives for the parties to assume responsibility for emerging project risks
- - 48.2 18.5
92
The results of this study seem to agree with the postulation of normative literature that
emergence can have both positive and negative effect on project outcomes. (PMI,
2014). Emergence may enhance the ability of a project to innovate which in turn could
improve project delivery capability. As an illustration, projects in which assumptions,
metrics and constraints did not remain stable throughout their life recorded much better
cost and schedule performance compared to those in which assumptions, metrics and
constraints remained stable. The implication of this is that contractual arrangements in
projects should ensure collaborative efforts with appropriate incentives to encourage
the parties to solve problems that emerge as a result of progress elaboration and during
execution (Brady & Davis, 2014).
Stability of stakeholder requirements is a key aspect of complexity that affects the
delivery capability of a project since emergence in stakeholder requirements implies
emergence in scope. As the findings of this study attest, emergence in stakeholder
requirements throughout the project’s life cycle could lead to reduced cost and
schedule performance thereby dimming chances of project management success.
Likewise, stability in the political and physical environment of a project could affect
project delivery capability. In this study, instability in the political and physical
environment adversely affected chances of delivery within budget and schedule. This
is plausible particularly given that public infrastructural projects are implemented in
delivery of a “political manifesto” and so instability in the political system inevitably
affects project management success.
As noted by Swartz (2008), emergence can disrupt a project schedule, and the ability
of the schedule to absorb that disruption is critical for the delivery of project outcomes.
In situations where the actual rate and type or propensity for change is not manageable,
as is the case in complex infrastructural megaprojects, the apparent schedule disruption
may also disrupt cost performance. Indeed, the results of this study attest to this to the
extent that where the actual rate and type or propensity for change was not manageable,
cost and schedule delivery slipped to zero. In most cases where the project context was
not stable, schedule delivery was adversely affected.
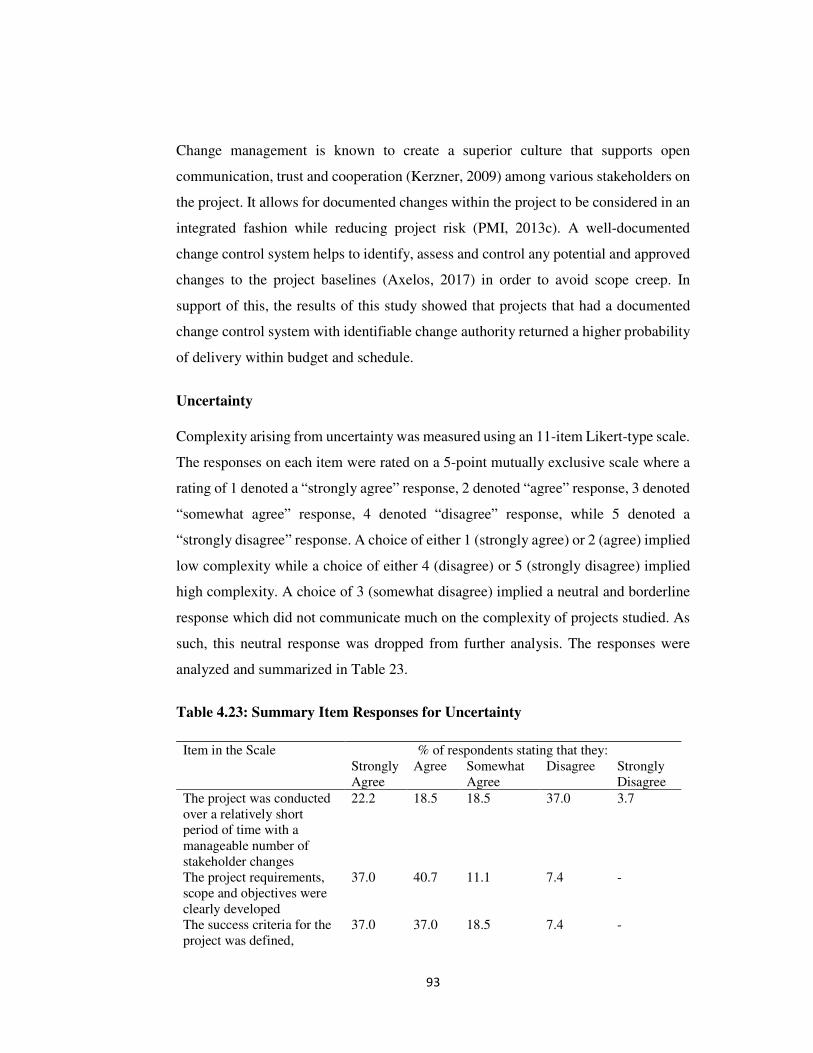
93
Change management is known to create a superior culture that supports open
communication, trust and cooperation (Kerzner, 2009) among various stakeholders on
the project. It allows for documented changes within the project to be considered in an
integrated fashion while reducing project risk (PMI, 2013c). A well-documented
change control system helps to identify, assess and control any potential and approved
changes to the project baselines (Axelos, 2017) in order to avoid scope creep. In
support of this, the results of this study showed that projects that had a documented
change control system with identifiable change authority returned a higher probability
of delivery within budget and schedule.
Uncertainty
Complexity arising from uncertainty was measured using an 11-item Likert-type scale.
The responses on each item were rated on a 5-point mutually exclusive scale where a
rating of 1 denoted a “strongly agree” response, 2 denoted “agree” response, 3 denoted
“somewhat agree” response, 4 denoted “disagree” response, while 5 denoted a
“strongly disagree” response. A choice of either 1 (strongly agree) or 2 (agree) implied
low complexity while a choice of either 4 (disagree) or 5 (strongly disagree) implied
high complexity. A choice of 3 (somewhat disagree) implied a neutral and borderline
response which did not communicate much on the complexity of projects studied. As
such, this neutral response was dropped from further analysis. The responses were
analyzed and summarized in Table 23.
Table 4.23: Summary Item Responses for Uncertainty
Item in the Scale % of respondents stating that they: Strongly Agree
Agree Somewhat Agree
Disagree Strongly Disagree
The project was conducted over a relatively short period of time with a manageable number of stakeholder changes
22.2 18.5 18.5 37.0 3.7
The project requirements, scope and objectives were clearly developed
37.0 40.7 11.1 7.4 -
The success criteria for the project was defined,
37.0 37.0 18.5 7.4 -
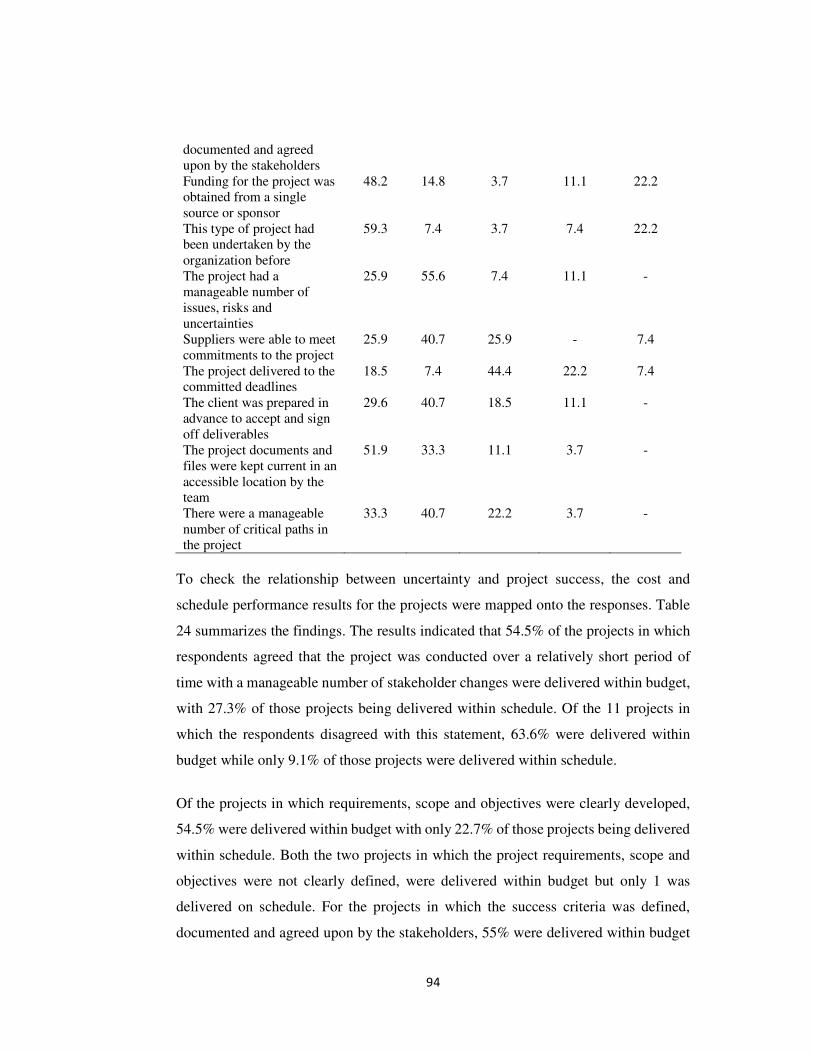
94
documented and agreed upon by the stakeholders Funding for the project was obtained from a single source or sponsor
48.2 14.8 3.7 11.1 22.2
This type of project had been undertaken by the organization before
59.3 7.4 3.7 7.4 22.2
The project had a manageable number of issues, risks and uncertainties
25.9 55.6 7.4 11.1 -
Suppliers were able to meet commitments to the project
25.9 40.7 25.9 - 7.4
The project delivered to the committed deadlines
18.5 7.4 44.4 22.2 7.4
The client was prepared in advance to accept and sign off deliverables
29.6 40.7 18.5 11.1 -
The project documents and files were kept current in an accessible location by the team
51.9 33.3 11.1 3.7 -
There were a manageable number of critical paths in the project
33.3 40.7 22.2 3.7 -
To check the relationship between uncertainty and project success, the cost and
schedule performance results for the projects were mapped onto the responses. Table
24 summarizes the findings. The results indicated that 54.5% of the projects in which
respondents agreed that the project was conducted over a relatively short period of
time with a manageable number of stakeholder changes were delivered within budget,
with 27.3% of those projects being delivered within schedule. Of the 11 projects in
which the respondents disagreed with this statement, 63.6% were delivered within
budget while only 9.1% of those projects were delivered within schedule.
Of the projects in which requirements, scope and objectives were clearly developed,
54.5% were delivered within budget with only 22.7% of those projects being delivered
within schedule. Both the two projects in which the project requirements, scope and
objectives were not clearly defined, were delivered within budget but only 1 was
delivered on schedule. For the projects in which the success criteria was defined,
documented and agreed upon by the stakeholders, 55% were delivered within budget
95
while 25% were delivered within schedule. Both the projects in which the success
criteria was not defined, documented and agreed upon by the stakeholders, were
delivered on budget with none being delivered on schedule.
An aggregate 46.7% of the projects whose funding was obtained from a single source
or sponsor were delivered within budget with 26.7% of those projects being delivered
within schedule. Where project funding came from multiple sources or sponsors,
55.6% were delivered within budget with none being delivered on schedule. For
projects which had not been undertaken by the organization before, the chance of
delivery within budget was 44.4% while that of delivery within schedule was 22.2%.
Where that type of project was being delivered by the organization for the first time,
the chance of delivery within budget went down to 37.5% while that of delivery on
schedule dropped to 12.5%.
In circumstances where the project had a manageable number of issues, risks and
uncertainties, delivery within budget was recorded in 45.5% of the projects while
delivery within schedule was recorded in only 13.6% of the projects. Where there were
unmanageable number of issues, risks and uncertainties, cost delivery went down to
33.3% while schedule delivery slipped to zero. In projects where suppliers were able
to meet commitments, 44.4% were delivered within budget and 16.7% were delivered
within schedule. For the 2 projects in which suppliers could not meet their
commitments, one was delivered on budget while both were delivered behind
schedule. Of the 7 projects that were delivered to the committed deadlines, only 1 was
delivered within budget, none was delivered within schedule. Where the projects did
not deliver to the committed deadlines, 25% were delivered within budget but none
was delivered within schedule.
In circumstances where the client was prepared in advance to accept and sign off
deliverables, the chance of delivery within schedule was 52.6% and that of delivery
within budget was 26.3%. These went down to 33.3% and 0% in circumstances where
the client was not prepared in advance to accept and sign off deliverables. The results
also indicated that of the 26 projects in which project documents and files were kept
current in an accessible location by the team, 43.5% of those projects were delivered
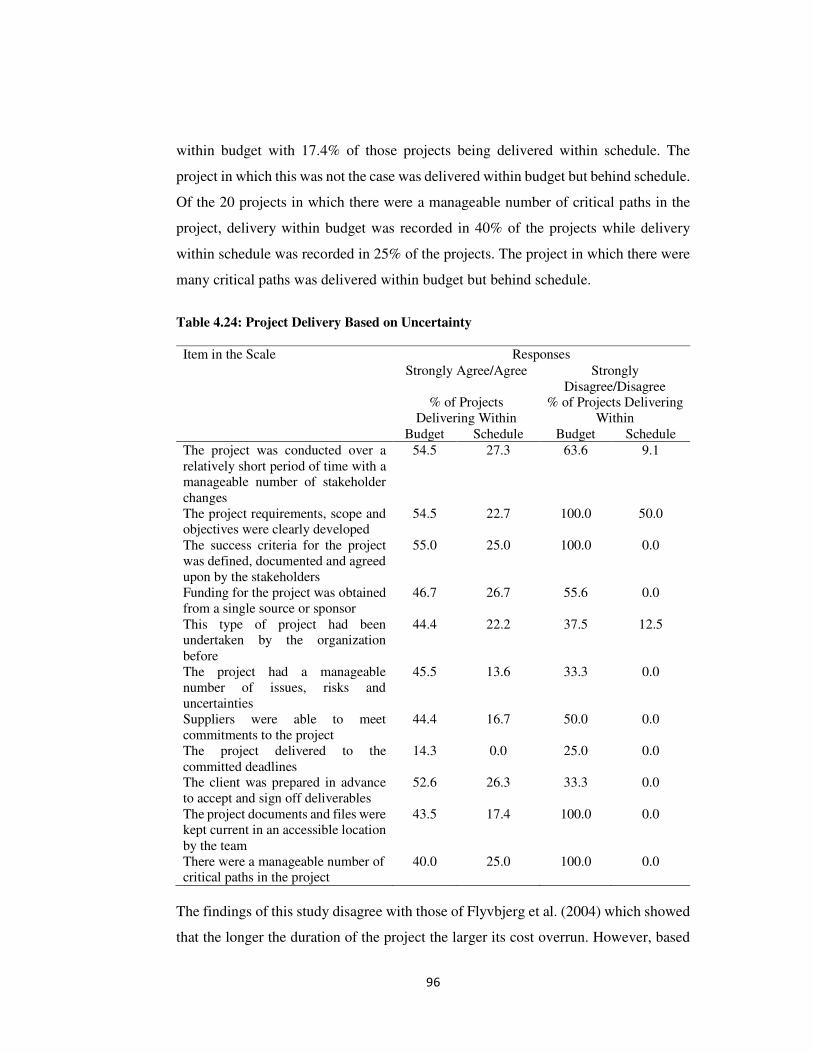
96
within budget with 17.4% of those projects being delivered within schedule. The
project in which this was not the case was delivered within budget but behind schedule.
Of the 20 projects in which there were a manageable number of critical paths in the
project, delivery within budget was recorded in 40% of the projects while delivery
within schedule was recorded in 25% of the projects. The project in which there were
many critical paths was delivered within budget but behind schedule.
Table 4.24: Project Delivery Based on Uncertainty
Item in the Scale Responses Strongly Agree/Agree Strongly
Disagree/Disagree % of Projects
Delivering Within % of Projects Delivering
Within Budget Schedule Budget Schedule
The project was conducted over a relatively short period of time with a manageable number of stakeholder changes
54.5 27.3 63.6 9.1
The project requirements, scope and objectives were clearly developed
54.5 22.7 100.0 50.0
The success criteria for the project was defined, documented and agreed upon by the stakeholders
55.0 25.0 100.0 0.0
Funding for the project was obtained from a single source or sponsor
46.7 26.7 55.6 0.0
This type of project had been undertaken by the organization before
44.4 22.2 37.5 12.5
The project had a manageable number of issues, risks and uncertainties
45.5 13.6 33.3 0.0
Suppliers were able to meet commitments to the project
44.4 16.7 50.0 0.0
The project delivered to the committed deadlines
14.3 0.0 25.0 0.0
The client was prepared in advance to accept and sign off deliverables
52.6 26.3 33.3 0.0
The project documents and files were kept current in an accessible location by the team
43.5 17.4 100.0 0.0
There were a manageable number of critical paths in the project
40.0 25.0 100.0 0.0
The findings of this study disagree with those of Flyvbjerg et al. (2004) which showed
that the longer the duration of the project the larger its cost overrun. However, based
97
on the findings of this study, longer schedule duration was associated with increased
delivery of projects under budget. This finding appears to be in line with the thinking
of economic theory that uncertainties are necessary conditions for the existence of
opportunities and that without uncertainty entrepreneurial profits would be impossible
(Knight, 1948). What is apparent from the findings of this study is that longer schedule
duration was associated with reduced delivery within schedule.
The results also showed that delivery over budget and behind schedule was equally
high where the project had a large number of issues, risks and uncertainties. The
implication of this is that change and risk management planning are critical to avoid
firefighting whenever the vagaries of uncertainty hit a project. The Practice Guide on
Navigating Complexity (PMI, 2014) recognizes that adequate risk and change
management procedures should be in place to enable proper actions during the times
of uncertainty, and risk sharing and collaboration are key strategies to handle
uncertainty. This study found that chances of delivery over budget and behind schedule
were also high in circumstances where that type of project had not been undertaken by
the organization before. This confirms that the principle of learning from experience
could lead to better project outcomes (Axelos, 2017).
Hypothesis Testing
Ambiguity has Significant Influence on Success of Public Infrastructural
Megaprojects
In order to test the hypothesis that ambiguity has a significant influence on success of
public infrastructural megaprojects, the constructs of ambiguity were scored to
determine their complexity scores. The results showed that the emergence construct
had a mean complexity score of 2.49 with a standard deviation of 0.66 while the
uncertainty construct recorded a mean complexity score of 2.17 with a standard
deviation of 0.52. The weighted ambiguity complexity score had a mean of 2.33 with
a standard deviation of 0.52.
The results indicated that the emergence scores had the highest relative variability
(CV=0.26) compared to that of uncertainty (CV=0.24) and the weighted score
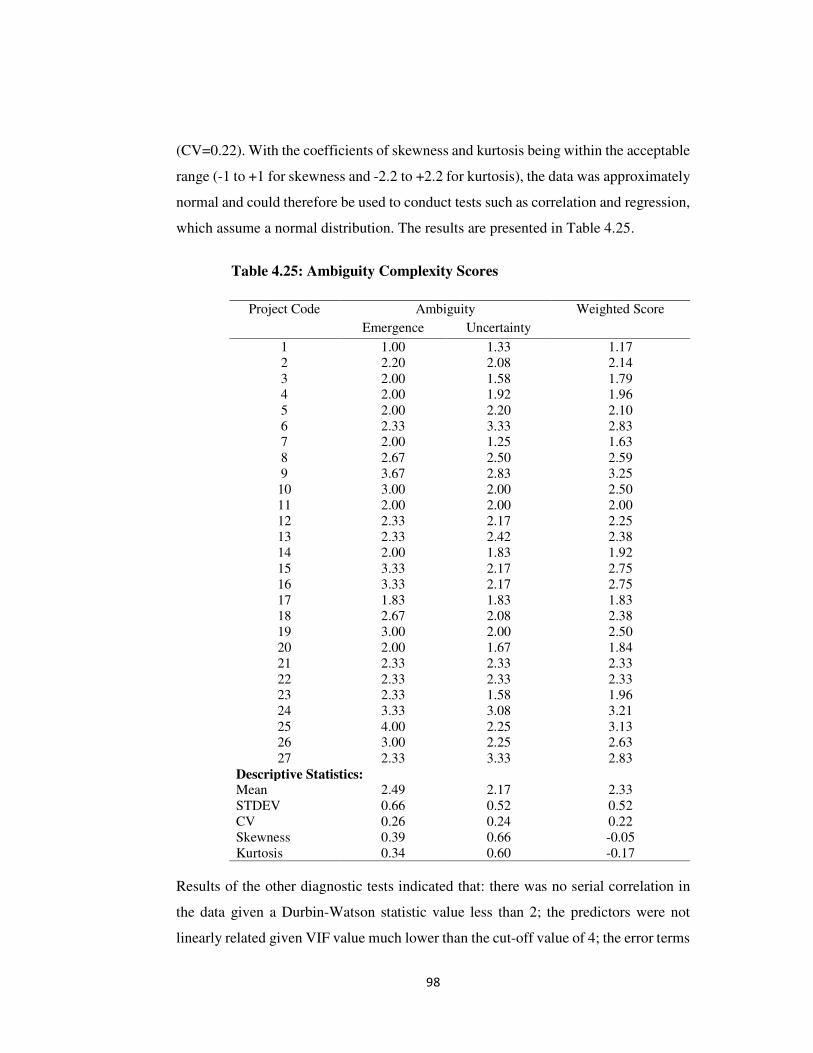
98
(CV=0.22). With the coefficients of skewness and kurtosis being within the acceptable
range (-1 to +1 for skewness and -2.2 to +2.2 for kurtosis), the data was approximately
normal and could therefore be used to conduct tests such as correlation and regression,
which assume a normal distribution. The results are presented in Table 4.25.
Table 4.25: Ambiguity Complexity Scores
Project Code Ambiguity Weighted Score
Emergence Uncertainty
1 1.00 1.33 1.17 2 2.20 2.08 2.14 3 2.00 1.58 1.79 4 2.00 1.92 1.96 5 2.00 2.20 2.10 6 2.33 3.33 2.83 7 2.00 1.25 1.63 8 2.67 2.50 2.59 9 3.67 2.83 3.25 10 3.00 2.00 2.50 11 2.00 2.00 2.00 12 2.33 2.17 2.25 13 2.33 2.42 2.38 14 2.00 1.83 1.92 15 3.33 2.17 2.75 16 3.33 2.17 2.75 17 1.83 1.83 1.83 18 2.67 2.08 2.38 19 3.00 2.00 2.50 20 2.00 1.67 1.84 21 2.33 2.33 2.33 22 2.33 2.33 2.33 23 2.33 1.58 1.96 24 3.33 3.08 3.21 25 4.00 2.25 3.13 26 3.00 2.25 2.63 27 2.33 3.33 2.83
Descriptive Statistics: Mean 2.49 2.17 2.33 STDEV 0.66 0.52 0.52 CV 0.26 0.24 0.22 Skewness 0.39 0.66 -0.05 Kurtosis 0.34 0.60 -0.17
Results of the other diagnostic tests indicated that: there was no serial correlation in
the data given a Durbin-Watson statistic value less than 2; the predictors were not
linearly related given VIF value much lower than the cut-off value of 4; the error terms
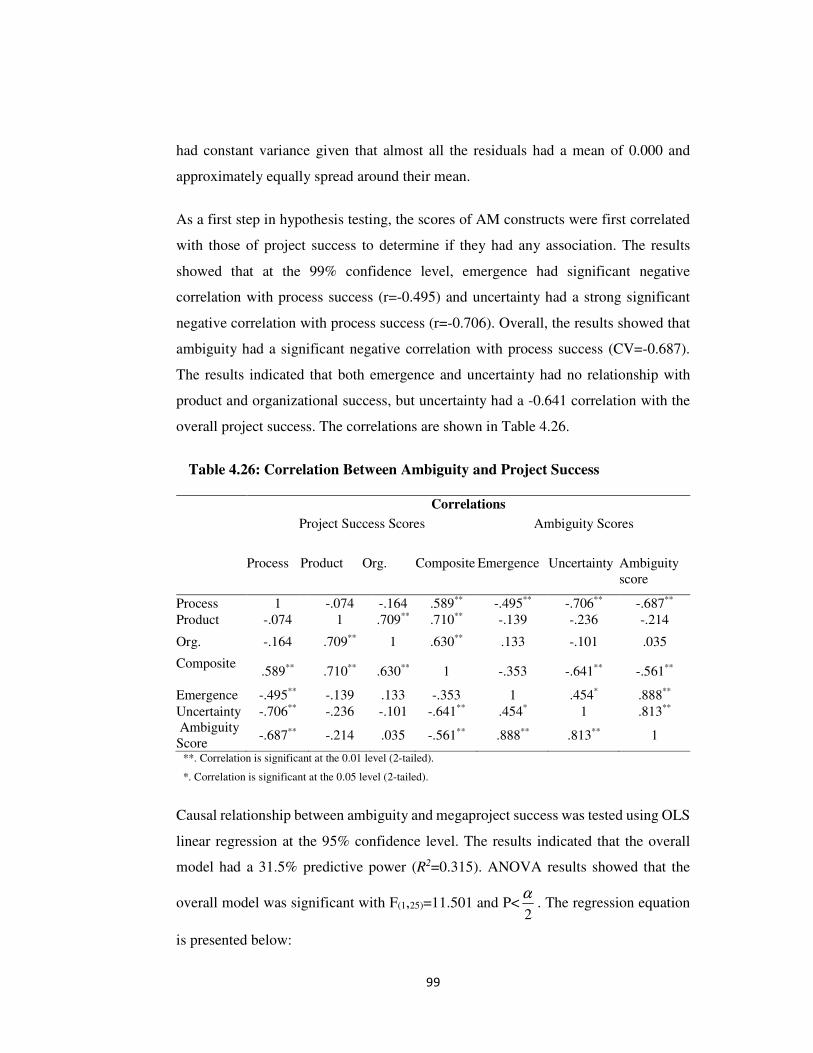
99
had constant variance given that almost all the residuals had a mean of 0.000 and
approximately equally spread around their mean.
As a first step in hypothesis testing, the scores of AM constructs were first correlated
with those of project success to determine if they had any association. The results
showed that at the 99% confidence level, emergence had significant negative
correlation with process success (r=-0.495) and uncertainty had a strong significant
negative correlation with process success (r=-0.706). Overall, the results showed that
ambiguity had a significant negative correlation with process success (CV=-0.687).
The results indicated that both emergence and uncertainty had no relationship with
product and organizational success, but uncertainty had a -0.641 correlation with the
overall project success. The correlations are shown in Table 4.26.
Table 4.26: Correlation Between Ambiguity and Project Success
Correlations
Project Success Scores Ambiguity Scores
Process Product Org. Composite Emergence Uncertainty Ambiguity score
Process 1 -.074 -.164 .589** -.495** -.706** -.687** Product -.074 1 .709** .710** -.139 -.236 -.214
Org. -.164 .709** 1 .630** .133 -.101 .035
Composite
.589** .710** .630** 1 -.353 -.641** -.561**
Emergence -.495** -.139 .133 -.353 1 .454* .888**
Uncertainty -.706** -.236 -.101 -.641** .454* 1 .813** Ambiguity Score
-.687** -.214 .035 -.561** .888** .813** 1
**. Correlation is significant at the 0.01 level (2-tailed).
*. Correlation is significant at the 0.05 level (2-tailed).
Causal relationship between ambiguity and megaproject success was tested using OLS
linear regression at the 95% confidence level. The results indicated that the overall
model had a 31.5% predictive power (R2=0.315). ANOVA results showed that the
overall model was significant with F(1,25)=11.501 and P<2
α. The regression equation
is presented below:
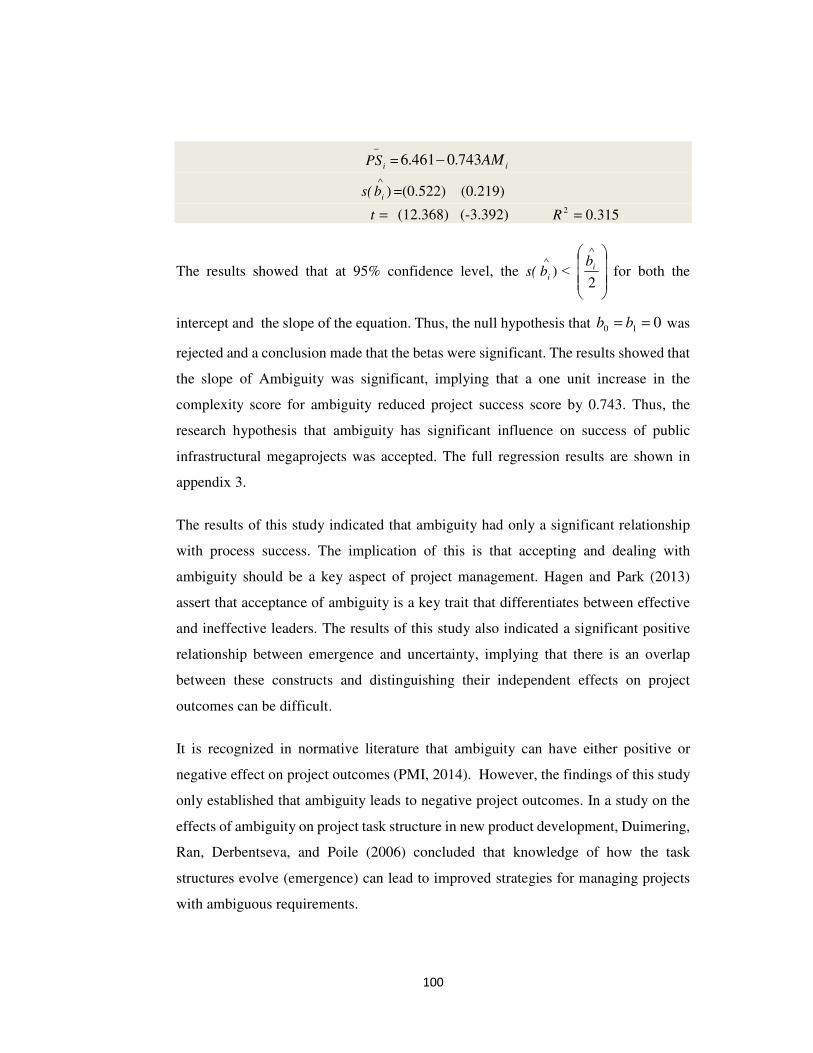
100
−
iPS = iAM743.0461.6 −
s( )∧
ib =(0.522) (0.219)
=t (12.368) (-3.392) 315.02 =R
The results showed that at 95% confidence level, the s( )∧
ib ˂
∧
2
ib for both the
intercept and the slope of the equation. Thus, the null hypothesis that 010 == bb was
rejected and a conclusion made that the betas were significant. The results showed that
the slope of Ambiguity was significant, implying that a one unit increase in the
complexity score for ambiguity reduced project success score by 0.743. Thus, the
research hypothesis that ambiguity has significant influence on success of public
infrastructural megaprojects was accepted. The full regression results are shown in
appendix 3.
The results of this study indicated that ambiguity had only a significant relationship
with process success. The implication of this is that accepting and dealing with
ambiguity should be a key aspect of project management. Hagen and Park (2013)
assert that acceptance of ambiguity is a key trait that differentiates between effective
and ineffective leaders. The results of this study also indicated a significant positive
relationship between emergence and uncertainty, implying that there is an overlap
between these constructs and distinguishing their independent effects on project
outcomes can be difficult.
It is recognized in normative literature that ambiguity can have either positive or
negative effect on project outcomes (PMI, 2014). However, the findings of this study
only established that ambiguity leads to negative project outcomes. In a study on the
effects of ambiguity on project task structure in new product development, Duimering,
Ran, Derbentseva, and Poile (2006) concluded that knowledge of how the task
structures evolve (emergence) can lead to improved strategies for managing projects
with ambiguous requirements.
101
4.4.4 System Behavior
The third objective of this study was to investigate the influence of system behavior
on success of public infrastructural megaprojects. Complexity arising from system
behavior was measured on a scale comprising three constructs namely; connectedness,
dependency and system dynamics. The findings are presented per construct in the
sections that follow.
Connectedness
Complexity arising from connectedness was measured using a Likert-type scale
containing 4 items. Each of these items were scored on a scale of 1 to 3 with a score
of 1 denoting low complexity and 3 denoting high complexity. Connectedness denotes
a relationship that exists between two or more components of a project (PMI, 2014).
This relationship was measured by checking the number of connections among
stakeholders, subcontracts, project components, third party relationships and layers in
the organogram. The number of connections was determined using the formula:
( )2
1−=
NNC ………………………………………………..Equation 3
where N is the number of components, stakeholders, layers or third party relations. The
results are shown in Table 4.27.
The results showed that in 66.6% of the projects surveyed, there were more than 45
stakeholder connections. These projects had more than 10 stakeholders. There were
over 45 subcontractor/component connections in 25.9% of the projects, also implying
that these projects had more than 10 subcontracts/components. The results also showed
that in 39.7% of the projects surveyed, there were more than 45 third party relation
connections while there were more than 45 connections related to the layers in the
organogram in 22.2% of the project surveyed.
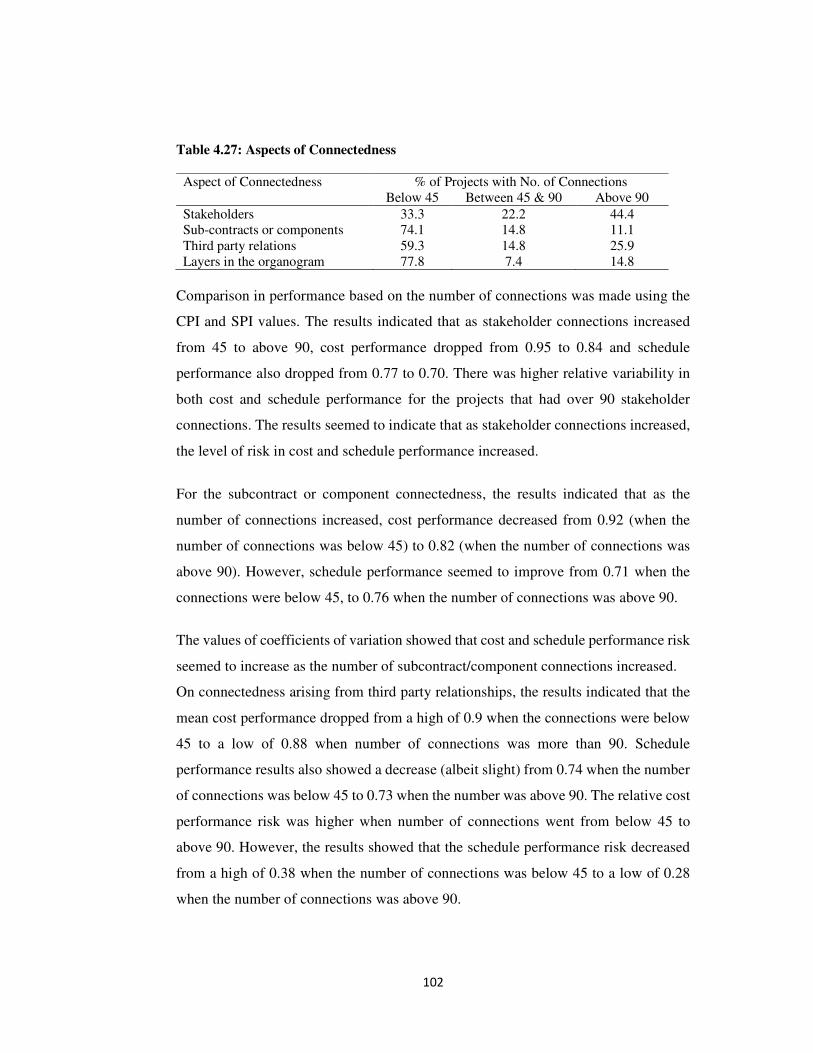
102
Table 4.27: Aspects of Connectedness
Aspect of Connectedness % of Projects with No. of Connections Below 45 Between 45 & 90 Above 90
Stakeholders 33.3 22.2 44.4 Sub-contracts or components 74.1 14.8 11.1 Third party relations 59.3 14.8 25.9 Layers in the organogram 77.8 7.4 14.8
Comparison in performance based on the number of connections was made using the
CPI and SPI values. The results indicated that as stakeholder connections increased
from 45 to above 90, cost performance dropped from 0.95 to 0.84 and schedule
performance also dropped from 0.77 to 0.70. There was higher relative variability in
both cost and schedule performance for the projects that had over 90 stakeholder
connections. The results seemed to indicate that as stakeholder connections increased,
the level of risk in cost and schedule performance increased.
For the subcontract or component connectedness, the results indicated that as the
number of connections increased, cost performance decreased from 0.92 (when the
number of connections was below 45) to 0.82 (when the number of connections was
above 90). However, schedule performance seemed to improve from 0.71 when the
connections were below 45, to 0.76 when the number of connections was above 90.
The values of coefficients of variation showed that cost and schedule performance risk
seemed to increase as the number of subcontract/component connections increased.
On connectedness arising from third party relationships, the results indicated that the
mean cost performance dropped from a high of 0.9 when the connections were below
45 to a low of 0.88 when number of connections was more than 90. Schedule
performance results also showed a decrease (albeit slight) from 0.74 when the number
of connections was below 45 to 0.73 when the number was above 90. The relative cost
performance risk was higher when number of connections went from below 45 to
above 90. However, the results showed that the schedule performance risk decreased
from a high of 0.38 when the number of connections was below 45 to a low of 0.28
when the number of connections was above 90.
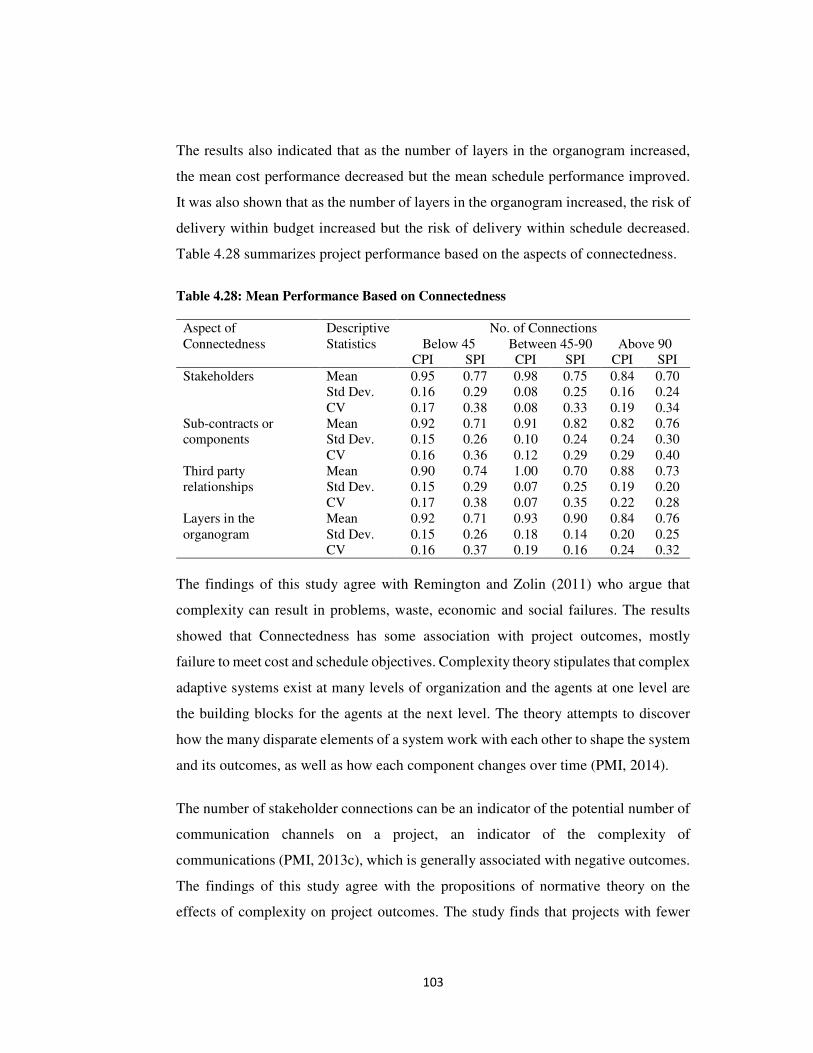
103
The results also indicated that as the number of layers in the organogram increased,
the mean cost performance decreased but the mean schedule performance improved.
It was also shown that as the number of layers in the organogram increased, the risk of
delivery within budget increased but the risk of delivery within schedule decreased.
Table 4.28 summarizes project performance based on the aspects of connectedness.
Table 4.28: Mean Performance Based on Connectedness
Aspect of Connectedness
Descriptive Statistics
No. of Connections Below 45 Between 45-90 Above 90
CPI SPI CPI SPI CPI SPI
Stakeholders Mean 0.95 0.77 0.98 0.75 0.84 0.70 Std Dev. 0.16 0.29 0.08 0.25 0.16 0.24 CV 0.17 0.38 0.08 0.33 0.19 0.34
Sub-contracts or components
Mean 0.92 0.71 0.91 0.82 0.82 0.76 Std Dev. 0.15 0.26 0.10 0.24 0.24 0.30 CV 0.16 0.36 0.12 0.29 0.29 0.40
Third party relationships
Mean 0.90 0.74 1.00 0.70 0.88 0.73 Std Dev. 0.15 0.29 0.07 0.25 0.19 0.20 CV 0.17 0.38 0.07 0.35 0.22 0.28
Layers in the organogram
Mean 0.92 0.71 0.93 0.90 0.84 0.76 Std Dev. 0.15 0.26 0.18 0.14 0.20 0.25 CV 0.16 0.37 0.19 0.16 0.24 0.32
The findings of this study agree with Remington and Zolin (2011) who argue that
complexity can result in problems, waste, economic and social failures. The results
showed that Connectedness has some association with project outcomes, mostly
failure to meet cost and schedule objectives. Complexity theory stipulates that complex
adaptive systems exist at many levels of organization and the agents at one level are
the building blocks for the agents at the next level. The theory attempts to discover
how the many disparate elements of a system work with each other to shape the system
and its outcomes, as well as how each component changes over time (PMI, 2014).
The number of stakeholder connections can be an indicator of the potential number of
communication channels on a project, an indicator of the complexity of
communications (PMI, 2013c), which is generally associated with negative outcomes.
The findings of this study agree with the propositions of normative theory on the
effects of complexity on project outcomes. The study finds that projects with fewer
104
channels of communication (given the stakeholder connections) have superior cost and
schedule performance than those with many channels of communication.
Even though there have been several conceptual contributions on the study of
structural complexity (Dvir & Shenhar, 2011; Shenhar & Dvir, 2007b) in projects, and
even though the concept of connectedness is well researched in the fields of sociology
and/or psychology, not much literature exists about the specific components of
structural complexity such as connectedness. While contributing to the contingency
school of project management thought (Turner et al., 2010), the findings of this study
could be a baseline for future research.
Dependency
Dependency occurs when work and task packages are interdependent in such a way
that one work package depends on another work package or one task package depends
on another task package. Dependency was measured using a Likert-type scale
containing 3 items. Each of these items were scored on a scale of 1 to 3 with a score
of 1 denoting low complexity and 3 denoting high complexity. The results indicated
that of the projects surveyed, 11.1% had one critical path, 37% had up to 5 critical
paths while 51.9% of the projects had more than 5 critical paths. In 14.8% of the
projects there was one dependency relationship among the project components while
in 29.6% of the projects, there were up to 5 dependency relationships. A total of 55.6%
of the projects surveyed reported having more than 5 dependency relationships among
the project components.
An aggregate 44.4% of the projects were reported to have had one interphase between
the project’s products and those of other projects within the organization while 37%
of the projects reported having had up to 5 interphases between the project’s products
and those of other projects within the organization. In 18.5% of the projects surveyed
there were more than 5 interphases between the project’s products and those of other
projects within the organization. Table 4.29 summarizes the responses based on
aspects of dependency.
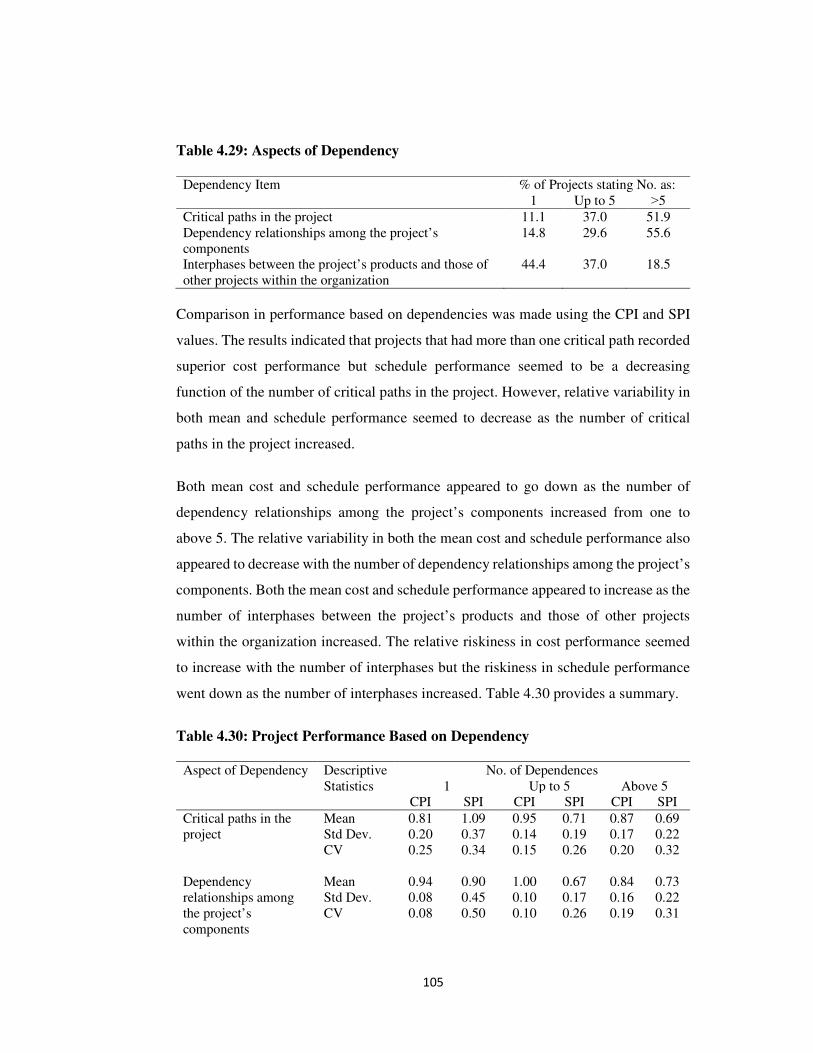
105
Table 4.29: Aspects of Dependency
Dependency Item % of Projects stating No. as: 1 Up to 5 ˃5
Critical paths in the project 11.1 37.0 51.9 Dependency relationships among the project’s components
14.8 29.6 55.6
Interphases between the project’s products and those of other projects within the organization
44.4 37.0 18.5
Comparison in performance based on dependencies was made using the CPI and SPI
values. The results indicated that projects that had more than one critical path recorded
superior cost performance but schedule performance seemed to be a decreasing
function of the number of critical paths in the project. However, relative variability in
both mean and schedule performance seemed to decrease as the number of critical
paths in the project increased.
Both mean cost and schedule performance appeared to go down as the number of
dependency relationships among the project’s components increased from one to
above 5. The relative variability in both the mean cost and schedule performance also
appeared to decrease with the number of dependency relationships among the project’s
components. Both the mean cost and schedule performance appeared to increase as the
number of interphases between the project’s products and those of other projects
within the organization increased. The relative riskiness in cost performance seemed
to increase with the number of interphases but the riskiness in schedule performance
went down as the number of interphases increased. Table 4.30 provides a summary.
Table 4.30: Project Performance Based on Dependency
Aspect of Dependency Descriptive Statistics
No. of Dependences 1 Up to 5 Above 5
CPI SPI CPI SPI CPI SPI
Critical paths in the project
Mean 0.81 1.09 0.95 0.71 0.87 0.69 Std Dev. 0.20 0.37 0.14 0.19 0.17 0.22 CV 0.25 0.34 0.15 0.26 0.20 0.32
Dependency relationships among the project’s components
Mean
0.94
0.90
1.00
0.67
0.84
0.73
Std Dev. 0.08 0.45 0.10 0.17 0.16 0.22 CV 0.08 0.50 0.10 0.26 0.19 0.31
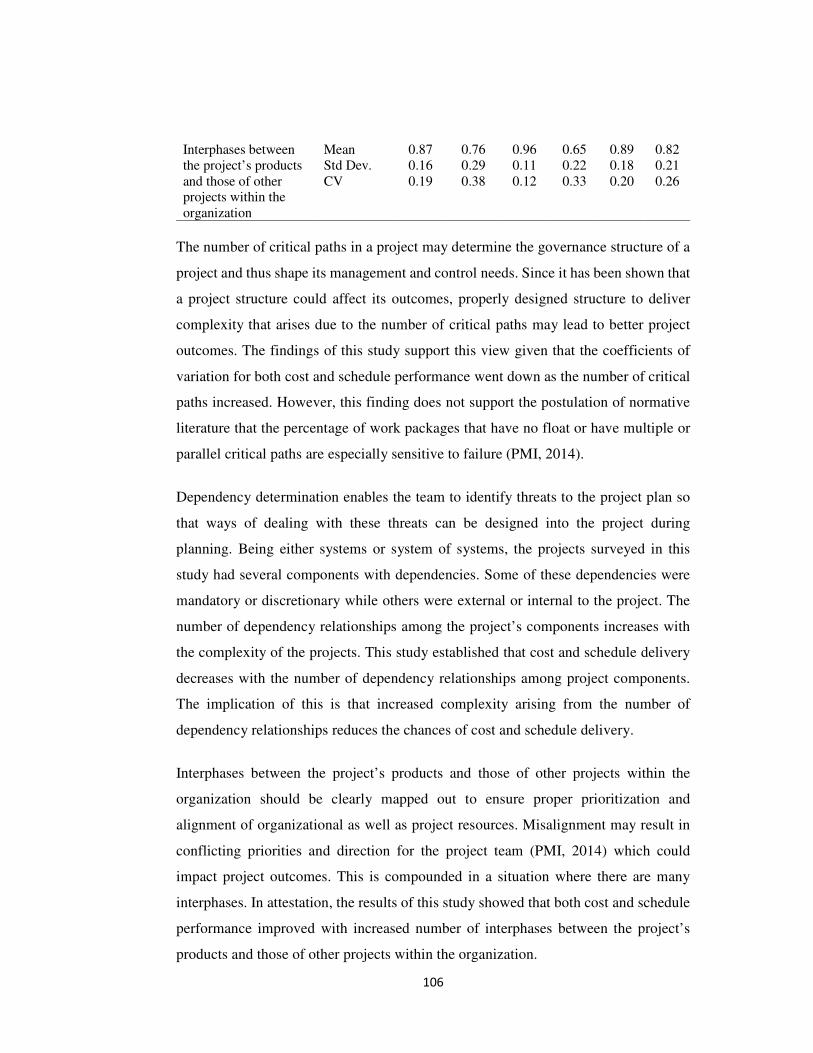
106
Interphases between the project’s products and those of other projects within the organization
Mean 0.87 0.76 0.96 0.65 0.89 0.82 Std Dev. 0.16 0.29 0.11 0.22 0.18 0.21 CV 0.19 0.38 0.12 0.33 0.20 0.26
The number of critical paths in a project may determine the governance structure of a
project and thus shape its management and control needs. Since it has been shown that
a project structure could affect its outcomes, properly designed structure to deliver
complexity that arises due to the number of critical paths may lead to better project
outcomes. The findings of this study support this view given that the coefficients of
variation for both cost and schedule performance went down as the number of critical
paths increased. However, this finding does not support the postulation of normative
literature that the percentage of work packages that have no float or have multiple or
parallel critical paths are especially sensitive to failure (PMI, 2014).
Dependency determination enables the team to identify threats to the project plan so
that ways of dealing with these threats can be designed into the project during
planning. Being either systems or system of systems, the projects surveyed in this
study had several components with dependencies. Some of these dependencies were
mandatory or discretionary while others were external or internal to the project. The
number of dependency relationships among the project’s components increases with
the complexity of the projects. This study established that cost and schedule delivery
decreases with the number of dependency relationships among project components.
The implication of this is that increased complexity arising from the number of
dependency relationships reduces the chances of cost and schedule delivery.
Interphases between the project’s products and those of other projects within the
organization should be clearly mapped out to ensure proper prioritization and
alignment of organizational as well as project resources. Misalignment may result in
conflicting priorities and direction for the project team (PMI, 2014) which could
impact project outcomes. This is compounded in a situation where there are many
interphases. In attestation, the results of this study showed that both cost and schedule
performance improved with increased number of interphases between the project’s
products and those of other projects within the organization.
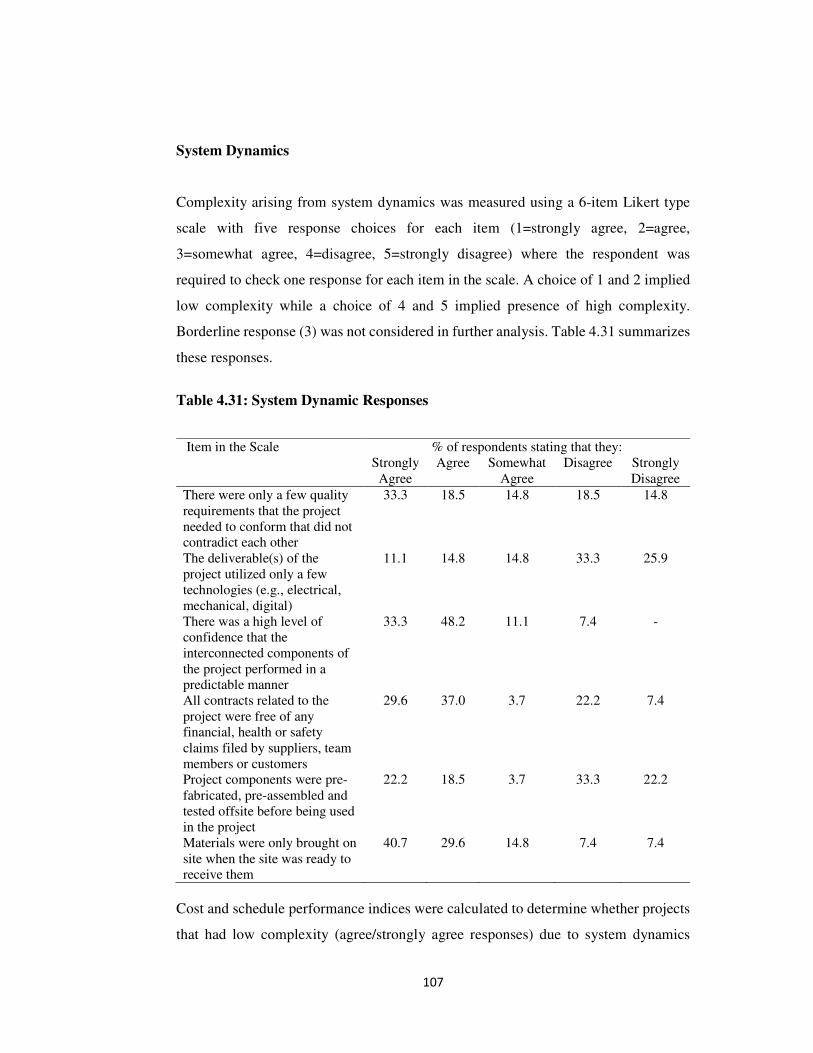
107
System Dynamics
Complexity arising from system dynamics was measured using a 6-item Likert type
scale with five response choices for each item (1=strongly agree, 2=agree,
3=somewhat agree, 4=disagree, 5=strongly disagree) where the respondent was
required to check one response for each item in the scale. A choice of 1 and 2 implied
low complexity while a choice of 4 and 5 implied presence of high complexity.
Borderline response (3) was not considered in further analysis. Table 4.31 summarizes
these responses.
Table 4.31: System Dynamic Responses
Item in the Scale % of respondents stating that they: Strongly Agree
Agree Somewhat Agree
Disagree Strongly Disagree
There were only a few quality requirements that the project needed to conform that did not contradict each other
33.3 18.5 14.8 18.5 14.8
The deliverable(s) of the project utilized only a few technologies (e.g., electrical, mechanical, digital)
11.1 14.8 14.8 33.3 25.9
There was a high level of confidence that the interconnected components of the project performed in a predictable manner
33.3 48.2 11.1 7.4 -
All contracts related to the project were free of any financial, health or safety claims filed by suppliers, team members or customers
29.6 37.0 3.7 22.2 7.4
Project components were pre-fabricated, pre-assembled and tested offsite before being used in the project
22.2 18.5 3.7 33.3 22.2
Materials were only brought on site when the site was ready to receive them
40.7 29.6 14.8 7.4 7.4
Cost and schedule performance indices were calculated to determine whether projects
that had low complexity (agree/strongly agree responses) due to system dynamics
108
performed differently when compared with the projects with high complexity
(disagree/strongly disagree responses) due to system dynamics. The results are
summarized in Table 32. These results indicated that projects in which there were only
a few quality requirements that the project needed to conform that did not contradict
each other, had lower mean cost (0.89) and schedule (0.75) performance compared to
those in which there were many quality requirements (CPI=0.91 and SPI=0.77). The
mean cost and schedule performance for the projects in which there were only a few
quality requirements that the project needed to conform that did not contradict each
other, were riskier when compared to the performance of those in which there were
many requirements.
For projects in which deliverable(s) utilized only a few technologies, the mean cost
performance was higher and relatively stable (Mean= 1.00, CV= 0.10) compared to
those in which the deliverables utilized many technologies (Mean= 0.84, CV= 0.19).
However, the schedule performance results indicated that the mean performance
increased with the number of technologies, though with increased risk (for mean SPI,
0.78>0.67; and for CV of SPI, 0.29<0.36).
For projects in which there was a high level of confidence that the interconnected
components performed in a predictable manner, mean cost performance was higher
(CPI=0.92) but riskier (CV=0.16) compared with those that indicated to the contrary
(CPI=0.86, CV=0.10). Schedule performance results for these projects indicated that
mean performance increased with complexity and that this increased performance was
relatively more stable (for Mean SPI, 0.85>0.76; for CV, 0.08<0.32).
Projects in which all contracts were free of any financial, health or safety claims filed
by suppliers, team members or customers, recorded the same mean cost performance
(but with higher risk) compared to projects with financial, health or safety claims.
However, schedule performance for these projects decreased with increased claims
and the overall stability of the mean schedule performance also went down.
Projects in which components were pre-fabricated, pre-assembled and tested offsite
before being used in the project recorded both higher cost and schedule performance
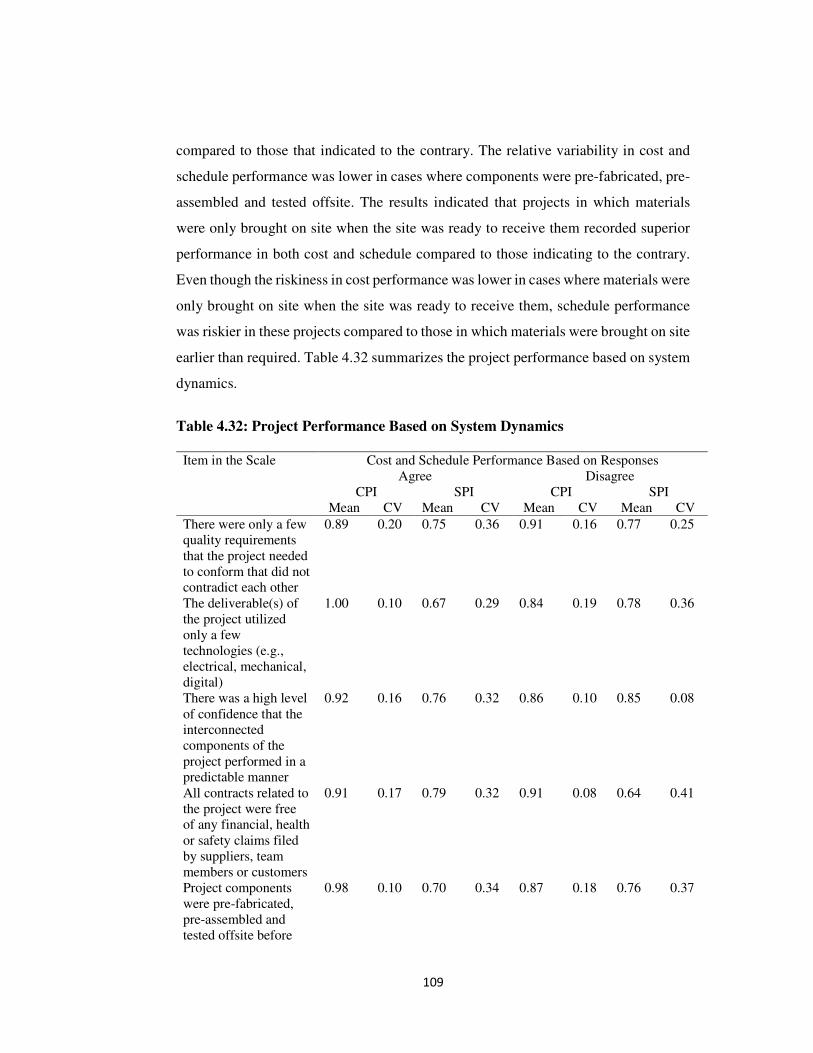
109
compared to those that indicated to the contrary. The relative variability in cost and
schedule performance was lower in cases where components were pre-fabricated, pre-
assembled and tested offsite. The results indicated that projects in which materials
were only brought on site when the site was ready to receive them recorded superior
performance in both cost and schedule compared to those indicating to the contrary.
Even though the riskiness in cost performance was lower in cases where materials were
only brought on site when the site was ready to receive them, schedule performance
was riskier in these projects compared to those in which materials were brought on site
earlier than required. Table 4.32 summarizes the project performance based on system
dynamics.
Table 4.32: Project Performance Based on System Dynamics
Item in the Scale Cost and Schedule Performance Based on Responses Agree Disagree
CPI SPI CPI SPI Mean CV Mean CV Mean CV Mean CV
There were only a few quality requirements that the project needed to conform that did not contradict each other
0.89 0.20 0.75 0.36 0.91 0.16 0.77 0.25
The deliverable(s) of the project utilized only a few technologies (e.g., electrical, mechanical, digital)
1.00 0.10 0.67 0.29 0.84 0.19 0.78 0.36
There was a high level of confidence that the interconnected components of the project performed in a predictable manner
0.92 0.16 0.76 0.32 0.86 0.10 0.85 0.08
All contracts related to the project were free of any financial, health or safety claims filed by suppliers, team members or customers
0.91 0.17 0.79 0.32 0.91 0.08 0.64 0.41
Project components were pre-fabricated, pre-assembled and tested offsite before
0.98 0.10 0.70 0.34 0.87 0.18 0.76 0.37
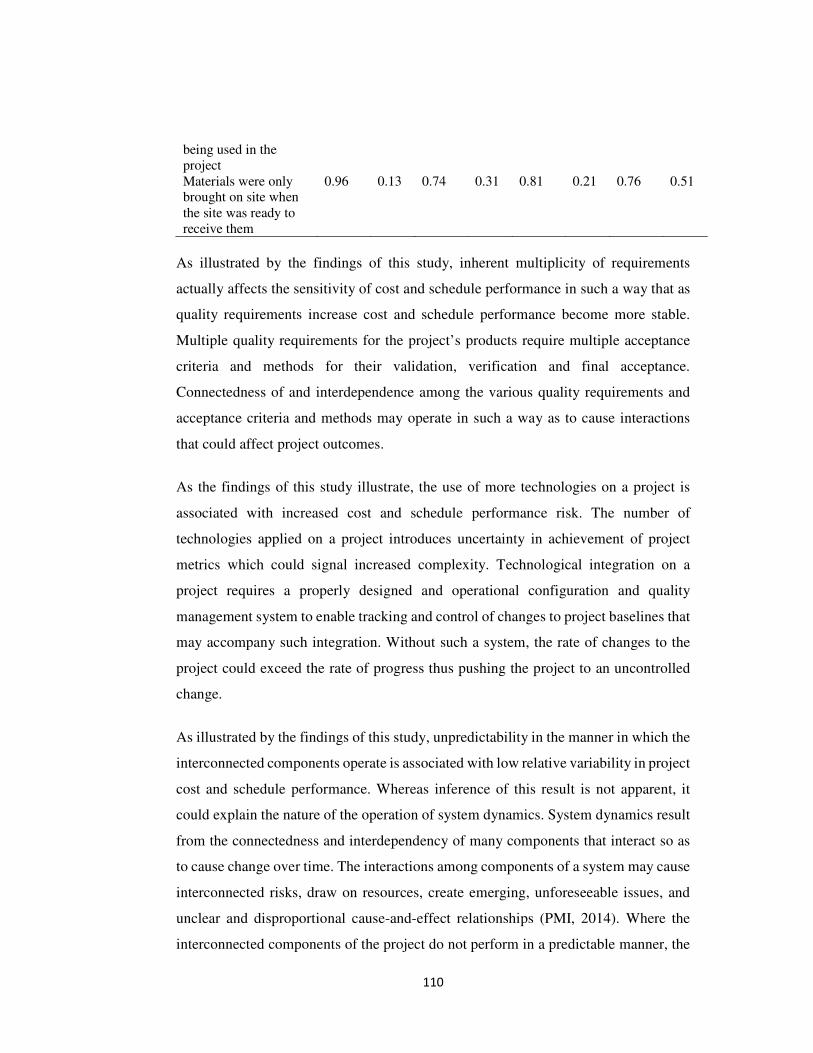
110
being used in the project Materials were only brought on site when the site was ready to receive them
0.96 0.13 0.74 0.31 0.81 0.21 0.76 0.51
As illustrated by the findings of this study, inherent multiplicity of requirements
actually affects the sensitivity of cost and schedule performance in such a way that as
quality requirements increase cost and schedule performance become more stable.
Multiple quality requirements for the project’s products require multiple acceptance
criteria and methods for their validation, verification and final acceptance.
Connectedness of and interdependence among the various quality requirements and
acceptance criteria and methods may operate in such a way as to cause interactions
that could affect project outcomes.
As the findings of this study illustrate, the use of more technologies on a project is
associated with increased cost and schedule performance risk. The number of
technologies applied on a project introduces uncertainty in achievement of project
metrics which could signal increased complexity. Technological integration on a
project requires a properly designed and operational configuration and quality
management system to enable tracking and control of changes to project baselines that
may accompany such integration. Without such a system, the rate of changes to the
project could exceed the rate of progress thus pushing the project to an uncontrolled
change.
As illustrated by the findings of this study, unpredictability in the manner in which the
interconnected components operate is associated with low relative variability in project
cost and schedule performance. Whereas inference of this result is not apparent, it
could explain the nature of the operation of system dynamics. System dynamics result
from the connectedness and interdependency of many components that interact so as
to cause change over time. The interactions among components of a system may cause
interconnected risks, draw on resources, create emerging, unforeseeable issues, and
unclear and disproportional cause-and-effect relationships (PMI, 2014). Where the
interconnected components of the project do not perform in a predictable manner, the
111
emerging uncertainty increases dynamic complexity which in turn could affect project
outcomes.
A key approach to dealing with risks due to progressive elaboration is to pre-fabricate,
pre-assemble and pretest components before using them on the project. This approach
does not only ensure that quality is designed into the project but also minimizes
chances of rework, rejects or off-specifications. As Brady and Davis (2014) have
shown, this approach does improve cost and schedule delivery. In support of this, this
study found that cost and schedule performance indices were more stable where project
components were pre-fabricated, pre-assembled and tested offsite before being used
in the project.
Construction sites are usually constrained for space. Some of the materials used are
high value items that may not be stocked for long without considerable risk of
pilferage. Yet, other items such as cement are perishable and require to be stocked just
in time. The implication here is that the project procurement function must ensure a
seamless flow of materials and other stock items. Just-In-Time stocking of materials
ensures economic use of site space and avoids tying too much money into stock that
may not be currently required. As the results of this study showed, this practice was
associated with superior and more stable cost and schedule performance.
Hypothesis Testing
System Behavior has Significant Influence on Success of Public Infrastructural
Megaprojects
In order to test the hypothesis that system behavior has a significant influence on
success of public infrastructural megaprojects, the constructs of system behavior were
scored to determine their complexity scores. System dynamics score was determined
by multiplying the connectedness score with the dependency score, since system
dynamics involves the interaction of connectedness and dependency. The scores for
each of the constructs together with weighted score (calculated by taking a simple
average of the mean scores for each of these constructs) are shown in Table 4.33.
112
The results showed that the construct of connectedness had a mean complexity score
of 4.09 with a standard deviation of 0.80 while the dependency construct recorded a
mean complexity score of 2.06 with a standard deviation of 0.60. System dynamics
construct had a mean complexity score of 8.47 with a standard deviation of 3.17
whereas the weighted system behavior complexity score had a mean of 4.88 with a
standard deviation of 1.40.
In terms of relative variability in the complexity scores, the construct of system
dynamics ranked highest with CV=0.37 followed by dependency at CV=0.29 and
connectedness at CV= 0.20. The weighted system behavior complexity scores had a
relative variability of 0.29. To check the suitability of the data for parametric tests such
as correlation and regression analysis, the coefficients of skewness and kurtosis were
determined for the scores of each construct. The coefficients were within the
acceptable range (-1 to +1 threshold for skewness and the -2.2 to +2.2 thresholds for
kurtosis) as shown in Table 4.33.
Results of the other diagnostic tests indicated that: there was no serial correlation in
the data given a Durbin-Watson statistic value less than 2; the predictors were not
linearly related given VIF value equal to 1, a value much lower than the cut-off value
of 4; the error terms had constant variance given that almost all the residuals had a
mean of 0.000 and approximately equally spread around their mean
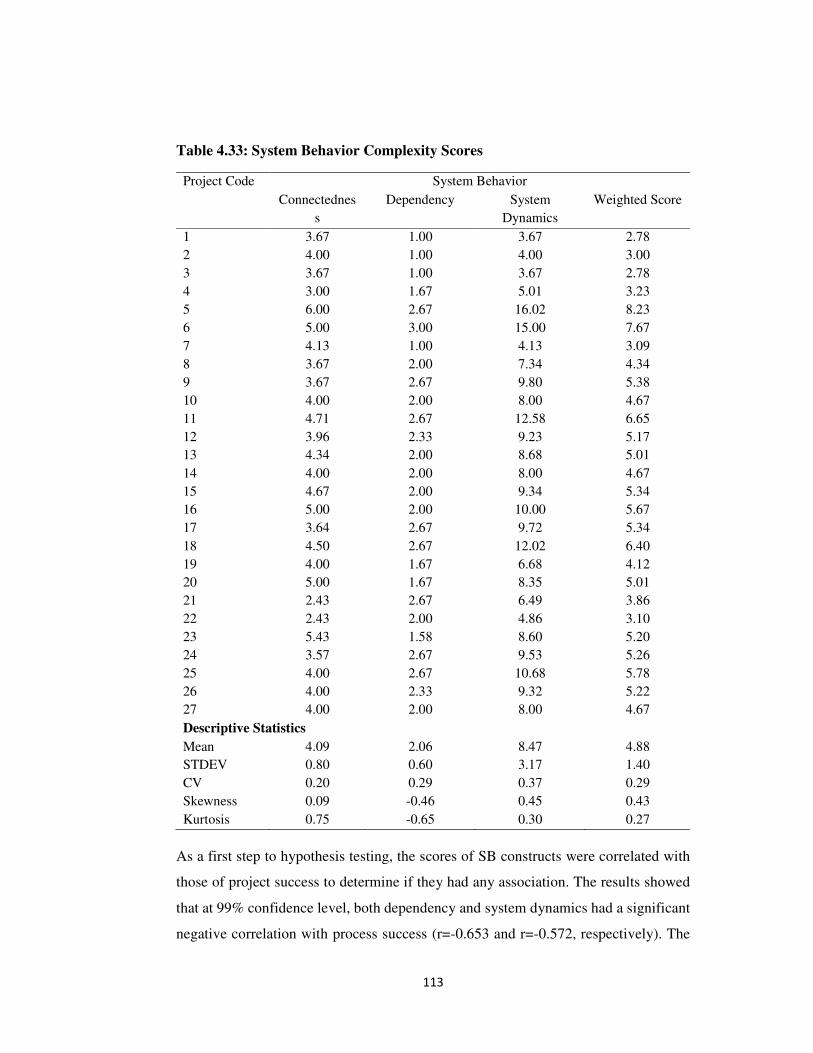
113
Table 4.33: System Behavior Complexity Scores
As a first step to hypothesis testing, the scores of SB constructs were correlated with
those of project success to determine if they had any association. The results showed
that at 99% confidence level, both dependency and system dynamics had a significant
negative correlation with process success (r=-0.653 and r=-0.572, respectively). The
Project Code System Behavior
Connectednes
s
Dependency System
Dynamics
Weighted Score
1 3.67 1.00 3.67 2.78
2 4.00 1.00 4.00 3.00
3 3.67 1.00 3.67 2.78
4 3.00 1.67 5.01 3.23
5 6.00 2.67 16.02 8.23
6 5.00 3.00 15.00 7.67
7 4.13 1.00 4.13 3.09
8 3.67 2.00 7.34 4.34
9 3.67 2.67 9.80 5.38
10 4.00 2.00 8.00 4.67
11 4.71 2.67 12.58 6.65
12 3.96 2.33 9.23 5.17
13 4.34 2.00 8.68 5.01
14 4.00 2.00 8.00 4.67
15 4.67 2.00 9.34 5.34
16 5.00 2.00 10.00 5.67
17 3.64 2.67 9.72 5.34
18 4.50 2.67 12.02 6.40
19 4.00 1.67 6.68 4.12
20 5.00 1.67 8.35 5.01
21 2.43 2.67 6.49 3.86
22 2.43 2.00 4.86 3.10
23 5.43 1.58 8.60 5.20
24 3.57 2.67 9.53 5.26
25 4.00 2.67 10.68 5.78
26 4.00 2.33 9.32 5.22
27 4.00 2.00 8.00 4.67
Descriptive Statistics
Mean 4.09 2.06 8.47 4.88
STDEV 0.80 0.60 3.17 1.40
CV 0.20 0.29 0.37 0.29
Skewness 0.09 -0.46 0.45 0.43
Kurtosis 0.75 -0.65 0.30 0.27
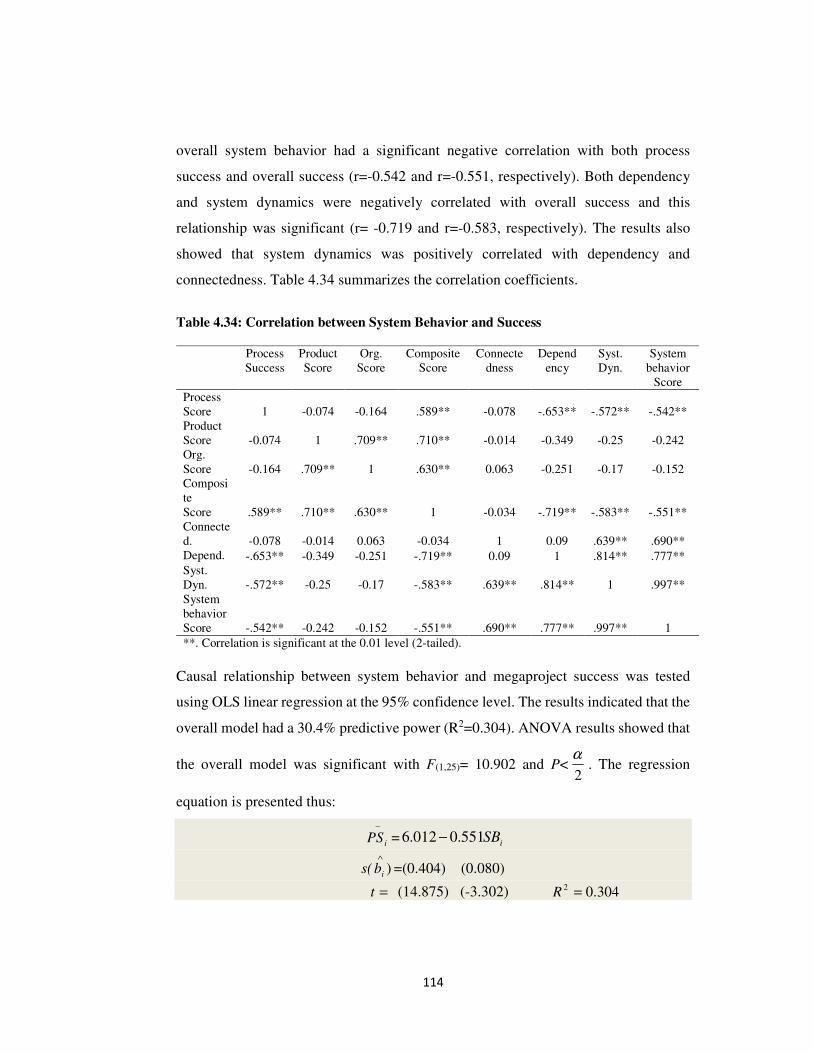
114
overall system behavior had a significant negative correlation with both process
success and overall success (r=-0.542 and r=-0.551, respectively). Both dependency
and system dynamics were negatively correlated with overall success and this
relationship was significant (r= -0.719 and r=-0.583, respectively). The results also
showed that system dynamics was positively correlated with dependency and
connectedness. Table 4.34 summarizes the correlation coefficients.
Table 4.34: Correlation between System Behavior and Success
Process Success
Product Score
Org. Score
Composite Score
Connectedness
Dependency
Syst. Dyn.
System behavior
Score
Process Score 1 -0.074 -0.164 .589** -0.078 -.653** -.572** -.542** Product Score -0.074 1 .709** .710** -0.014 -0.349 -0.25 -0.242 Org. Score -0.164 .709** 1 .630** 0.063 -0.251 -0.17 -0.152 Composite Score .589** .710** .630** 1 -0.034 -.719** -.583** -.551** Connected. -0.078 -0.014 0.063 -0.034 1 0.09 .639** .690** Depend. -.653** -0.349 -0.251 -.719** 0.09 1 .814** .777** Syst. Dyn. -.572** -0.25 -0.17 -.583** .639** .814** 1 .997** System behavior Score -.542** -0.242 -0.152 -.551** .690** .777** .997** 1
**. Correlation is significant at the 0.01 level (2-tailed).
Causal relationship between system behavior and megaproject success was tested
using OLS linear regression at the 95% confidence level. The results indicated that the
overall model had a 30.4% predictive power (R2=0.304). ANOVA results showed that
the overall model was significant with F(1,25)= 10.902 and P< . The regression
equation is presented thus:
−
iPS = iSB551.0012.6 −
s( )∧
ib =(0.404) (0.080)
=t (14.875) (-3.302) 304.02 =R
2
α
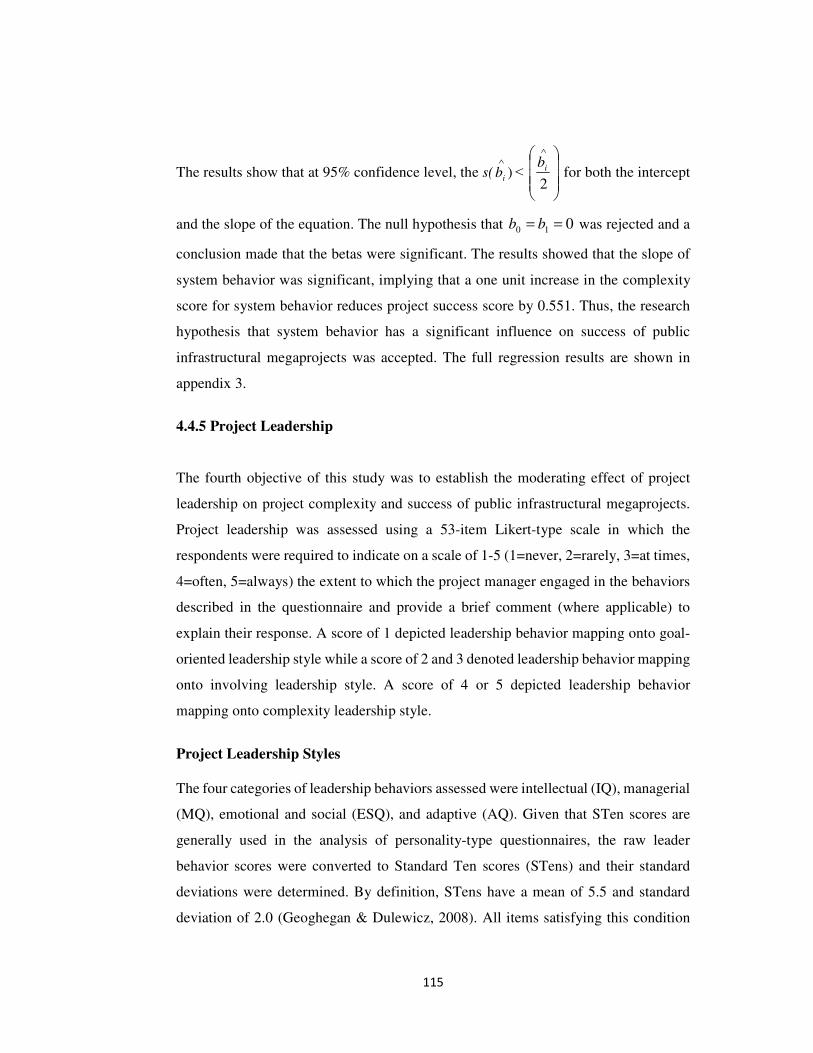
115
The results show that at 95% confidence level, the s( )∧
ib ˂
∧
2
ib for both the intercept
and the slope of the equation. The null hypothesis that 010 == bb was rejected and a
conclusion made that the betas were significant. The results showed that the slope of
system behavior was significant, implying that a one unit increase in the complexity
score for system behavior reduces project success score by 0.551. Thus, the research
hypothesis that system behavior has a significant influence on success of public
infrastructural megaprojects was accepted. The full regression results are shown in
appendix 3.
4.4.5 Project Leadership
The fourth objective of this study was to establish the moderating effect of project
leadership on project complexity and success of public infrastructural megaprojects.
Project leadership was assessed using a 53-item Likert-type scale in which the
respondents were required to indicate on a scale of 1-5 (1=never, 2=rarely, 3=at times,
4=often, 5=always) the extent to which the project manager engaged in the behaviors
described in the questionnaire and provide a brief comment (where applicable) to
explain their response. A score of 1 depicted leadership behavior mapping onto goal-
oriented leadership style while a score of 2 and 3 denoted leadership behavior mapping
onto involving leadership style. A score of 4 or 5 depicted leadership behavior
mapping onto complexity leadership style.
Project Leadership Styles
The four categories of leadership behaviors assessed were intellectual (IQ), managerial
(MQ), emotional and social (ESQ), and adaptive (AQ). Given that STen scores are
generally used in the analysis of personality-type questionnaires, the raw leader
behavior scores were converted to Standard Ten scores (STens) and their standard
deviations were determined. By definition, STens have a mean of 5.5 and standard
deviation of 2.0 (Geoghegan & Dulewicz, 2008). All items satisfying this condition
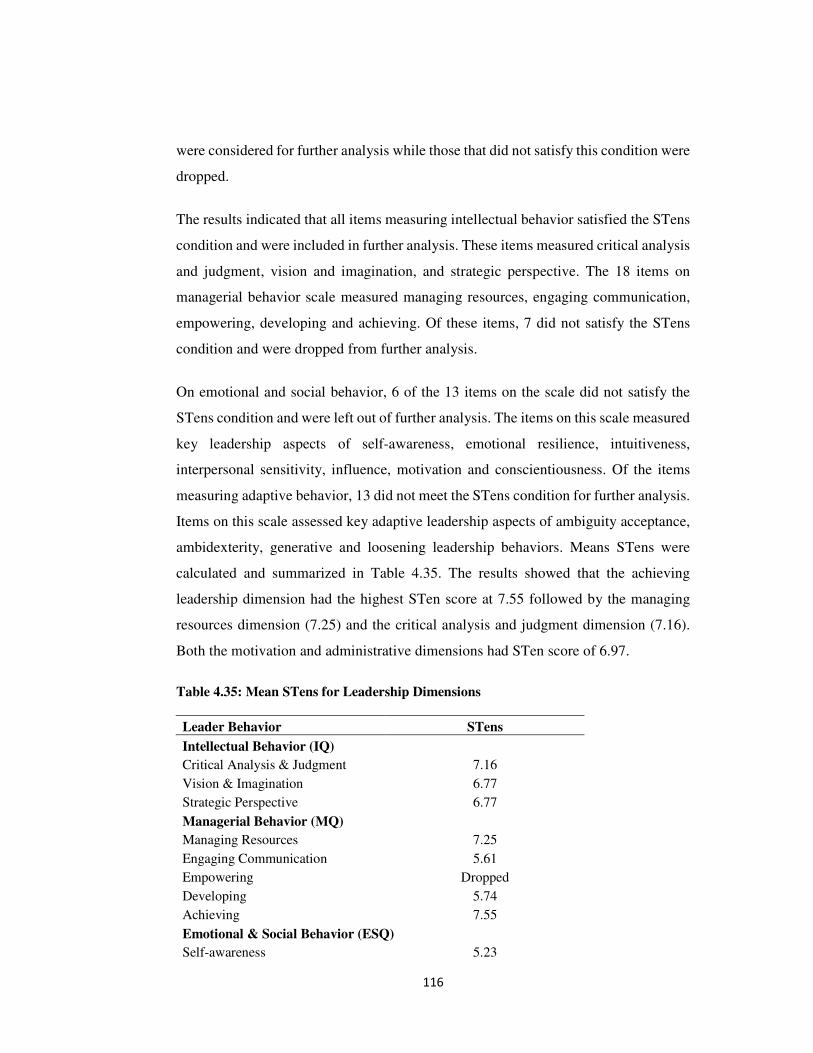
116
were considered for further analysis while those that did not satisfy this condition were
dropped.
The results indicated that all items measuring intellectual behavior satisfied the STens
condition and were included in further analysis. These items measured critical analysis
and judgment, vision and imagination, and strategic perspective. The 18 items on
managerial behavior scale measured managing resources, engaging communication,
empowering, developing and achieving. Of these items, 7 did not satisfy the STens
condition and were dropped from further analysis.
On emotional and social behavior, 6 of the 13 items on the scale did not satisfy the
STens condition and were left out of further analysis. The items on this scale measured
key leadership aspects of self-awareness, emotional resilience, intuitiveness,
interpersonal sensitivity, influence, motivation and conscientiousness. Of the items
measuring adaptive behavior, 13 did not meet the STens condition for further analysis.
Items on this scale assessed key adaptive leadership aspects of ambiguity acceptance,
ambidexterity, generative and loosening leadership behaviors. Means STens were
calculated and summarized in Table 4.35. The results showed that the achieving
leadership dimension had the highest STen score at 7.55 followed by the managing
resources dimension (7.25) and the critical analysis and judgment dimension (7.16).
Both the motivation and administrative dimensions had STen score of 6.97.
Table 4.35: Mean STens for Leadership Dimensions
Leader Behavior STens
Intellectual Behavior (IQ)
Critical Analysis & Judgment 7.16
Vision & Imagination 6.77
Strategic Perspective 6.77
Managerial Behavior (MQ)
Managing Resources 7.25
Engaging Communication 5.61
Empowering Dropped
Developing 5.74
Achieving 7.55
Emotional & Social Behavior (ESQ)
Self-awareness 5.23
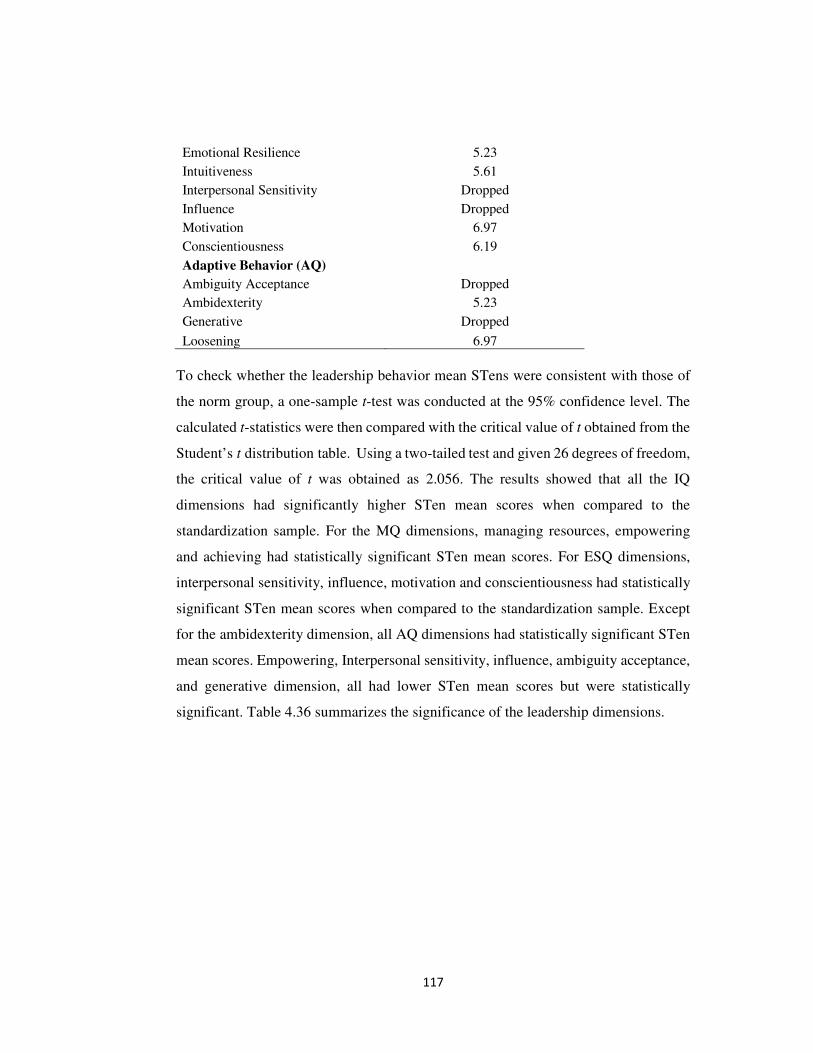
117
Emotional Resilience 5.23
Intuitiveness 5.61
Interpersonal Sensitivity Dropped
Influence Dropped
Motivation 6.97
Conscientiousness 6.19
Adaptive Behavior (AQ)
Ambiguity Acceptance Dropped
Ambidexterity 5.23
Generative Dropped
Loosening 6.97
To check whether the leadership behavior mean STens were consistent with those of
the norm group, a one-sample t-test was conducted at the 95% confidence level. The
calculated t-statistics were then compared with the critical value of t obtained from the
Student’s t distribution table. Using a two-tailed test and given 26 degrees of freedom,
the critical value of t was obtained as 2.056. The results showed that all the IQ
dimensions had significantly higher STen mean scores when compared to the
standardization sample. For the MQ dimensions, managing resources, empowering
and achieving had statistically significant STen mean scores. For ESQ dimensions,
interpersonal sensitivity, influence, motivation and conscientiousness had statistically
significant STen mean scores when compared to the standardization sample. Except
for the ambidexterity dimension, all AQ dimensions had statistically significant STen
mean scores. Empowering, Interpersonal sensitivity, influence, ambiguity acceptance,
and generative dimension, all had lower STen mean scores but were statistically
significant. Table 4.36 summarizes the significance of the leadership dimensions.
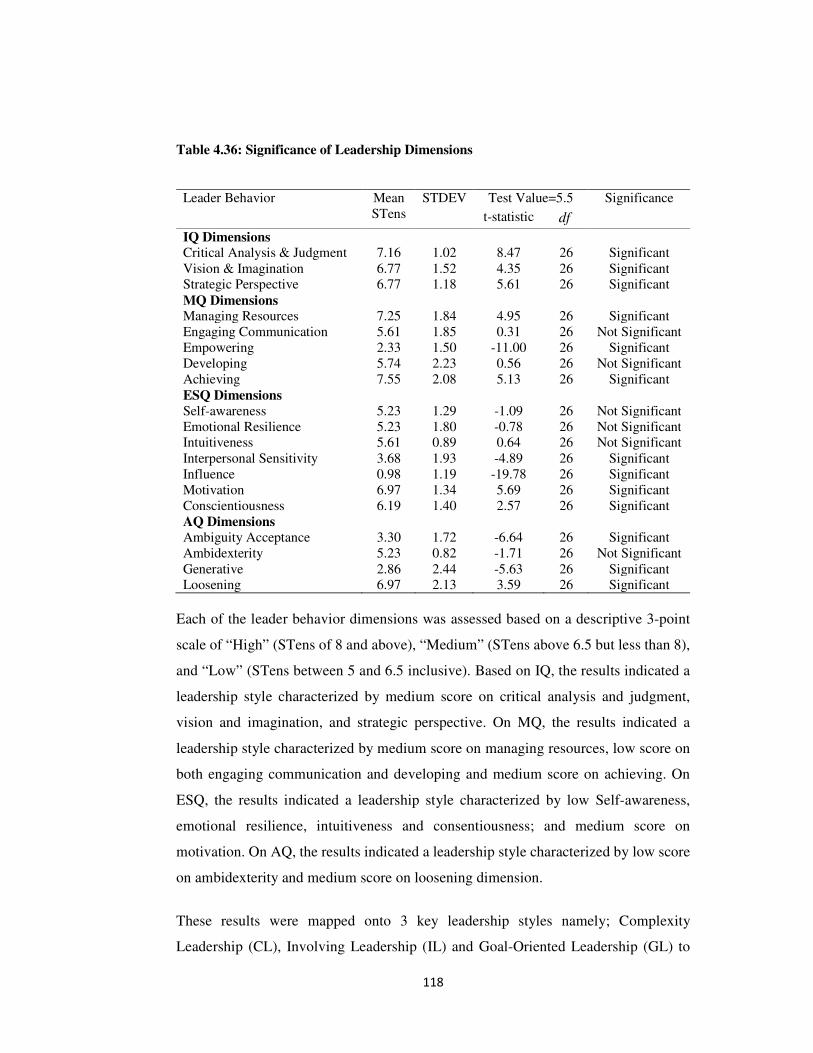
118
Table 4.36: Significance of Leadership Dimensions
Each of the leader behavior dimensions was assessed based on a descriptive 3-point
scale of “High” (STens of 8 and above), “Medium” (STens above 6.5 but less than 8),
and “Low” (STens between 5 and 6.5 inclusive). Based on IQ, the results indicated a
leadership style characterized by medium score on critical analysis and judgment,
vision and imagination, and strategic perspective. On MQ, the results indicated a
leadership style characterized by medium score on managing resources, low score on
both engaging communication and developing and medium score on achieving. On
ESQ, the results indicated a leadership style characterized by low Self-awareness,
emotional resilience, intuitiveness and consentiousness; and medium score on
motivation. On AQ, the results indicated a leadership style characterized by low score
on ambidexterity and medium score on loosening dimension.
These results were mapped onto 3 key leadership styles namely; Complexity
Leadership (CL), Involving Leadership (IL) and Goal-Oriented Leadership (GL) to
Leader Behavior Mean STens
STDEV Test Value=5.5 Significance
t-statistic df
IQ Dimensions
Critical Analysis & Judgment 7.16 1.02 8.47 26 Significant Vision & Imagination 6.77 1.52 4.35 26 Significant Strategic Perspective 6.77 1.18 5.61 26 Significant MQ Dimensions Managing Resources 7.25 1.84 4.95 26 Significant Engaging Communication 5.61 1.85 0.31 26 Not Significant Empowering 2.33 1.50 -11.00 26 Significant Developing 5.74 2.23 0.56 26 Not Significant Achieving 7.55 2.08 5.13 26 Significant ESQ Dimensions Self-awareness 5.23 1.29 -1.09 26 Not Significant Emotional Resilience 5.23 1.80 -0.78 26 Not Significant Intuitiveness 5.61 0.89 0.64 26 Not Significant Interpersonal Sensitivity 3.68 1.93 -4.89 26 Significant Influence 0.98 1.19 -19.78 26 Significant Motivation 6.97 1.34 5.69 26 Significant Conscientiousness 6.19 1.40 2.57 26 Significant AQ Dimensions Ambiguity Acceptance 3.30 1.72 -6.64 26 Significant Ambidexterity 5.23 0.82 -1.71 26 Not Significant Generative 2.86 2.44 -5.63 26 Significant Loosening 6.97 2.13 3.59 26 Significant
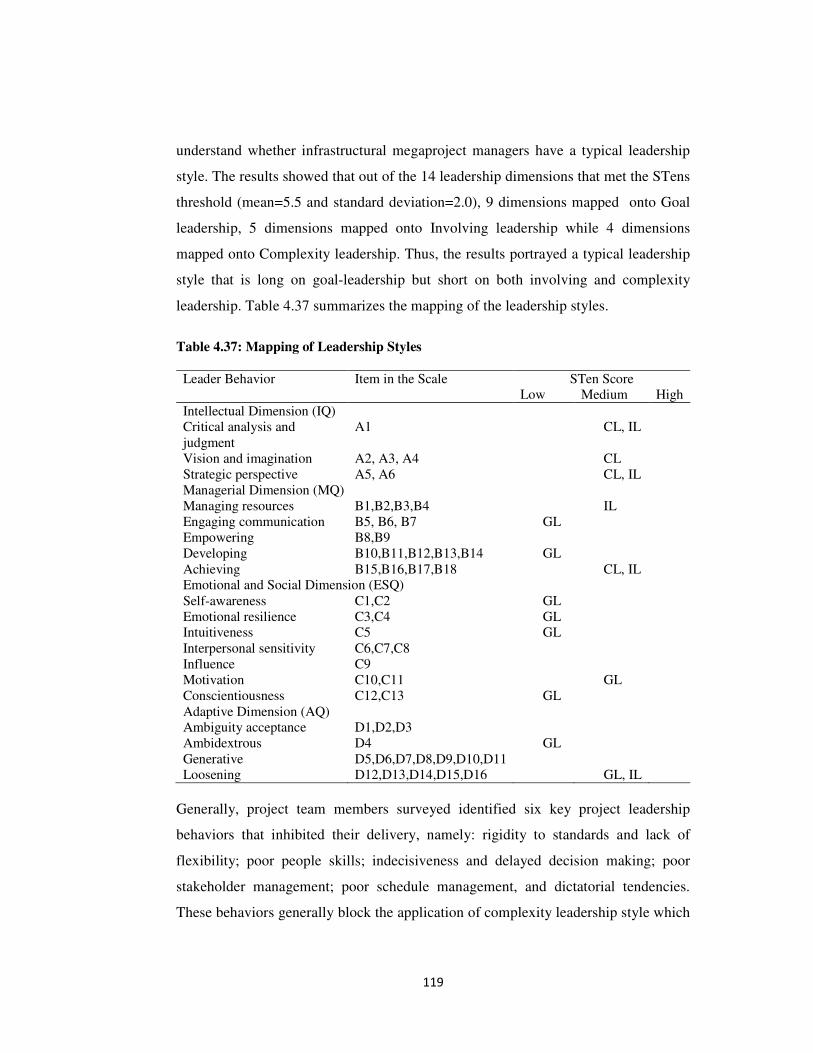
119
understand whether infrastructural megaproject managers have a typical leadership
style. The results showed that out of the 14 leadership dimensions that met the STens
threshold (mean=5.5 and standard deviation=2.0), 9 dimensions mapped onto Goal
leadership, 5 dimensions mapped onto Involving leadership while 4 dimensions
mapped onto Complexity leadership. Thus, the results portrayed a typical leadership
style that is long on goal-leadership but short on both involving and complexity
leadership. Table 4.37 summarizes the mapping of the leadership styles.
Table 4.37: Mapping of Leadership Styles
Leader Behavior Item in the Scale STen Score Low Medium High
Intellectual Dimension (IQ) Critical analysis and judgment
A1 CL, IL
Vision and imagination A2, A3, A4 CL Strategic perspective A5, A6 CL, IL Managerial Dimension (MQ) Managing resources B1,B2,B3,B4 IL Engaging communication B5, B6, B7 GL Empowering B8,B9 Developing B10,B11,B12,B13,B14 GL Achieving B15,B16,B17,B18 CL, IL Emotional and Social Dimension (ESQ) Self-awareness C1,C2 GL Emotional resilience C3,C4 GL Intuitiveness C5 GL Interpersonal sensitivity C6,C7,C8 Influence C9 Motivation C10,C11 GL Conscientiousness C12,C13 GL Adaptive Dimension (AQ) Ambiguity acceptance D1,D2,D3 Ambidextrous D4 GL Generative D5,D6,D7,D8,D9,D10,D11 Loosening D12,D13,D14,D15,D16 GL, IL
Generally, project team members surveyed identified six key project leadership
behaviors that inhibited their delivery, namely: rigidity to standards and lack of
flexibility; poor people skills; indecisiveness and delayed decision making; poor
stakeholder management; poor schedule management, and dictatorial tendencies.
These behaviors generally block the application of complexity leadership style which
120
requires that a leader oscillates from administrative leadership to generative and
adaptive leadership as context evolves.
The findings of this study revealed that managers of public infrastructural
megaprojects exhibited a leadership style that was short on adaptive behavior
indicating reduced ability to navigate through inherent complexity. This finding is
consistent with that in Uhl-Bien (2012) where a majority of organizations operating in
a complex environment were found to be responding to complexity using traditional
approaches to leadership. However, this finding runs counter to that by Baskovics
(2014) and Pisarski et al. (2011), who argue that classical leadership style needs to be
enhanced in order to achieve project success in complex contexts.
This study tailored the framework in Dulewicz and Higgs (2005) to analyze leadership
style. This framework used three dimensions with 15 measures to map leadership
styles. In the current study, an additional dimension with 4 measures was introduced
to capture the essence of leadership in a complexity context (Snowden & Boone, 2007;
Uhl-Bien, Marion, & McKelvey, 2007; Surie & Hazy, 2006). When the raw leadership
scores were transformed to Standard Tens (STens), a total of 5 measures were dropped
leaving 14 measures which were used in further analysis.
An important parallel between the findings of this study and those of Geoghegan and
Dulewicz (2008) relates to the items that were dropped from the scale following
transformation of raw scores to STens. Geoghegan and Dulewicz found that vision and
imagination had STens lower than the norm group and was thus dropped from the
scale. The findings of the current study did not agree with this. Indeed, envisioning is
a critical determinant of the application of a tight-loose administrative leadership style
in a complex project environment.
The present study dropped empowering, interpersonal sensitivity and influence from
the scale. Whereas all these three leadership behaviors are important, their omission
might have been as a result of introduction of adaptive dimension measures of
ambidexterity and loosening. Ambidextrous teams pursue innovation and efficiency
simultaneously, which generally require that the teams are empowered. The exploit-
121
explore (loosening) decision is generally enhanced by interpersonal sensitivity of the
leader and their ability to influence the team.
Of the four measures of adaptive behavior, ambiguity acceptance and generative
behavior were dropped from the scale leaving ambidexterity and loosening. This study
takes the view that both ambiguity acceptance and generative behavior are subsets of
ambidexterity and loosening. Based on STens, the top ranking leadership behaviors
commonly exhibited by project managers were: achieving, managing resources,
critical analysis and judgment, loosening and motivation, respectively. This order does
not seem to support the leadership decision-making framework developed by Snowden
and Boone (2007). This framework shows that complex or chaotic contexts require a
leader who can act or probe first before sensing and responding. In complex and
chaotic contexts, a project manager figure is either a rhetor or a reflexive agent
(Gauthier & Ika, 2012) implying that adaptive behavior anchored in complexity
science should dominate the leadership style.
The findings of this study portrayed a style that is long on goal-leadership but short on
both involving and complexity leadership. This practice is not supported by the
postulations of both positive and normative leadership literature which recognize that
in order to respond positively to complexity in megaprojects, there is need for
transformational and appropriate leadership (Cooke-Davies, 2011; Hayes & Bennett,
2011; PMI, 2013a; Snowden & Boone, 2007; Uhl-Bien & Marion, 2009; Gauthier &
Ika, 2012; Chen, Donahue, & Klimoski, 2004; Packendorff, 1995; Weiss, Donigian &
Hughes, 2010). Generally, high complexity contexts require a more facilitative style
of leadership (Higgs & Rowland, 2003) because leader-centric or directive style of
leadership works best in relatively simple and straightforward contexts (Dulewicz &
Higgs, 2005).
Most of the inhibitive leader behaviors cited by the project team members relate to the
inability of project managers to act according to the contexts of the social world of
their projects. The project manager figure in the complex contexts is either a rhetor or
a reflexive agent (Gauthier & Ika, 2012) who exercises pattern-based leadership as
opposed to fact-based leadership (Snowden & Boone, 2007). Complex projects require
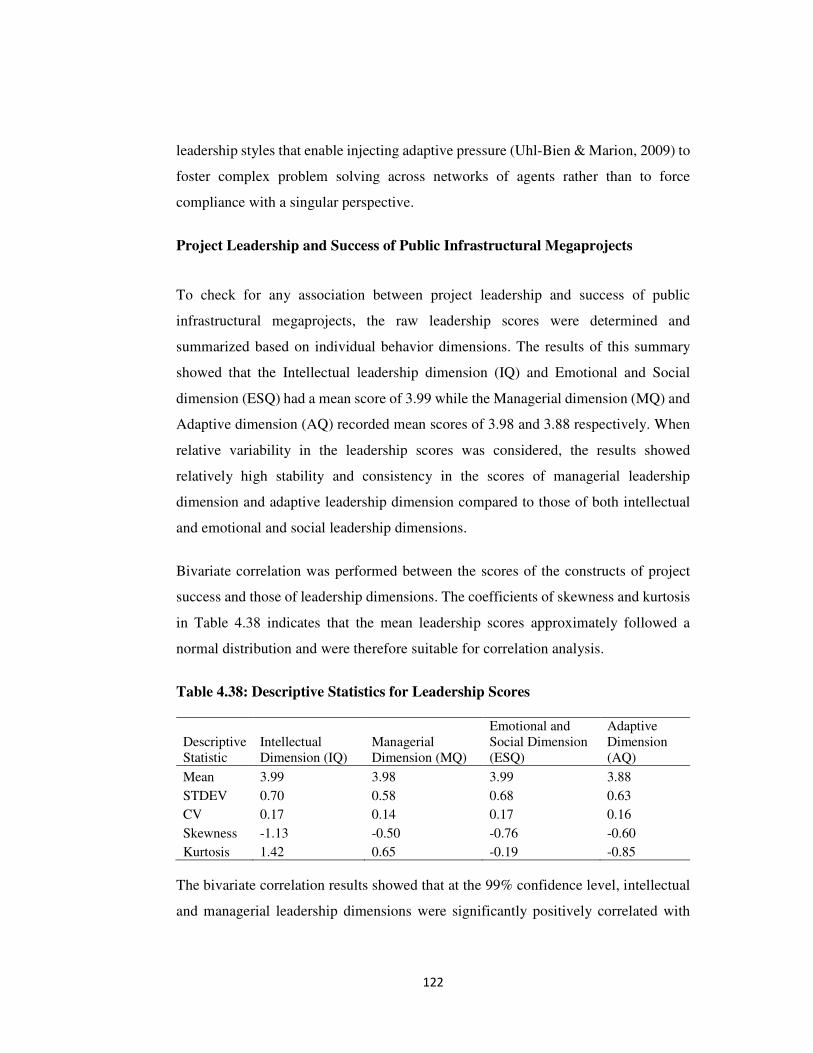
122
leadership styles that enable injecting adaptive pressure (Uhl-Bien & Marion, 2009) to
foster complex problem solving across networks of agents rather than to force
compliance with a singular perspective.
Project Leadership and Success of Public Infrastructural Megaprojects
To check for any association between project leadership and success of public
infrastructural megaprojects, the raw leadership scores were determined and
summarized based on individual behavior dimensions. The results of this summary
showed that the Intellectual leadership dimension (IQ) and Emotional and Social
dimension (ESQ) had a mean score of 3.99 while the Managerial dimension (MQ) and
Adaptive dimension (AQ) recorded mean scores of 3.98 and 3.88 respectively. When
relative variability in the leadership scores was considered, the results showed
relatively high stability and consistency in the scores of managerial leadership
dimension and adaptive leadership dimension compared to those of both intellectual
and emotional and social leadership dimensions.
Bivariate correlation was performed between the scores of the constructs of project
success and those of leadership dimensions. The coefficients of skewness and kurtosis
in Table 4.38 indicates that the mean leadership scores approximately followed a
normal distribution and were therefore suitable for correlation analysis.
Table 4.38: Descriptive Statistics for Leadership Scores
Descriptive Statistic
Intellectual Dimension (IQ)
Managerial Dimension (MQ)
Emotional and Social Dimension (ESQ)
Adaptive Dimension (AQ)
Mean 3.99 3.98 3.99 3.88
STDEV 0.70 0.58 0.68 0.63
CV 0.17 0.14 0.17 0.16
Skewness -1.13 -0.50 -0.76 -0.60
Kurtosis 1.42 0.65 -0.19 -0.85
The bivariate correlation results showed that at the 99% confidence level, intellectual
and managerial leadership dimensions were significantly positively correlated with
123
process success. At the 95% confidence level, both emotional and social dimension
and adaptive dimension had significant and positive correlation with process success.
Within the intellectual leadership dimension, the results showed that vision and
imagination positively correlated with process success and this correlation was
significant at the 95% confidence level. The strategic perspective aspect of intellectual
leadership dimension had a strong and significant positive correlation with product
success at the 99% confidence level. The results also showed moderately positive and
significant correlation between strategic perspective and organizational success, at the
99% confidence level.
Within the managerial leadership dimension, the results indicated that at the 99% level
of confidence, managing resources and achieving behaviors had strong positive and
significant correlations with process success, while engaging communication and
developing behaviors had moderate but significant correlation with process success.
On emotional and social dimension, the results indicate that motivation and
conscientiousness behaviors strongly and positively correlated with process success at
the 99% confidence level. The results also showed moderate but significantly positive
correlation between interpersonal sensitivity and process success. At the 95% level of
confidence, emotional resilience was found to significantly positively correlate with
process success.
In the adaptive leadership dimension, the results showed that loosening behavior had
a strong positive correlation with product success and a moderate positive correlation
with organizational success. Both these correlations were significant at the 99%
confidence level. Overall, the results showed that project leadership had positive and
medium correlation with product and organizational success and had a near strong
positive correlation with overall project success. Table 4.39 presents these correlation
coefficients.
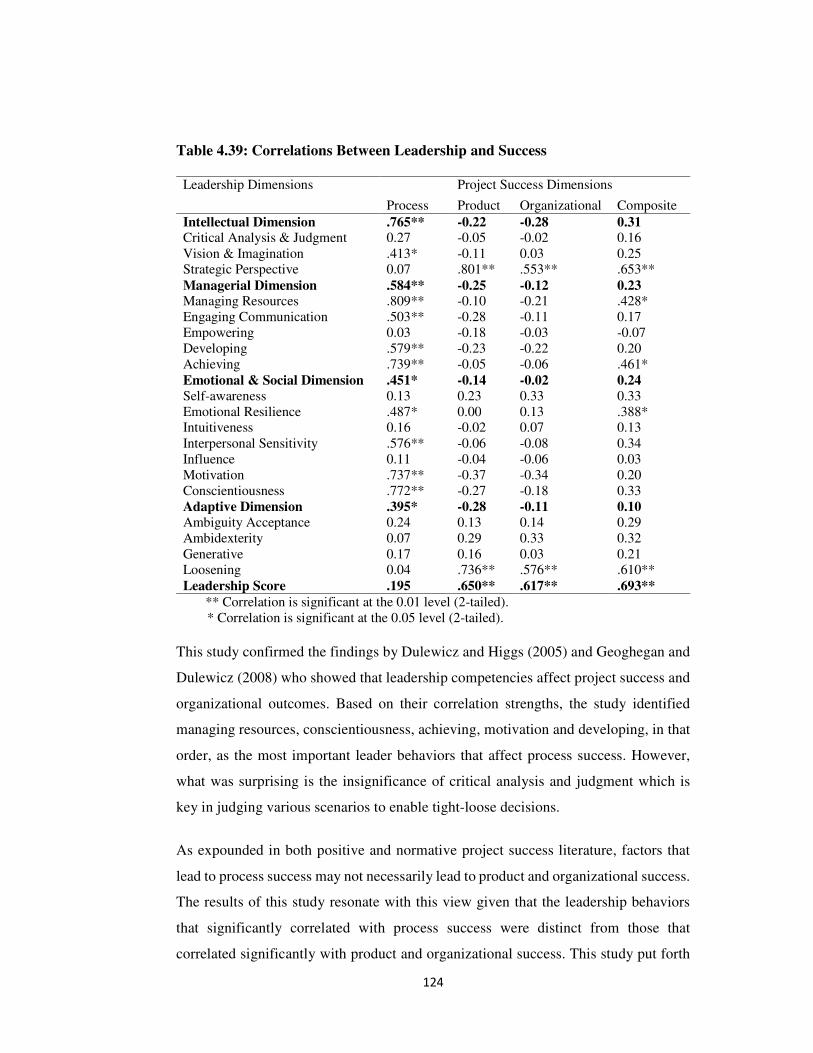
124
Table 4.39: Correlations Between Leadership and Success
Leadership Dimensions Project Success Dimensions
Process Product Organizational Composite
Intellectual Dimension .765** -0.22 -0.28 0.31 Critical Analysis & Judgment 0.27 -0.05 -0.02 0.16 Vision & Imagination .413* -0.11 0.03 0.25 Strategic Perspective 0.07 .801** .553** .653** Managerial Dimension .584** -0.25 -0.12 0.23 Managing Resources .809** -0.10 -0.21 .428* Engaging Communication .503** -0.28 -0.11 0.17 Empowering 0.03 -0.18 -0.03 -0.07 Developing .579** -0.23 -0.22 0.20 Achieving .739** -0.05 -0.06 .461* Emotional & Social Dimension .451* -0.14 -0.02 0.24
Self-awareness 0.13 0.23 0.33 0.33 Emotional Resilience .487* 0.00 0.13 .388* Intuitiveness 0.16 -0.02 0.07 0.13 Interpersonal Sensitivity .576** -0.06 -0.08 0.34 Influence 0.11 -0.04 -0.06 0.03 Motivation .737** -0.37 -0.34 0.20 Conscientiousness .772** -0.27 -0.18 0.33 Adaptive Dimension .395* -0.28 -0.11 0.10
Ambiguity Acceptance 0.24 0.13 0.14 0.29 Ambidexterity 0.07 0.29 0.33 0.32 Generative 0.17 0.16 0.03 0.21 Loosening 0.04 .736** .576** .610** Leadership Score .195 .650** .617** .693**
** Correlation is significant at the 0.01 level (2-tailed). * Correlation is significant at the 0.05 level (2-tailed).
This study confirmed the findings by Dulewicz and Higgs (2005) and Geoghegan and
Dulewicz (2008) who showed that leadership competencies affect project success and
organizational outcomes. Based on their correlation strengths, the study identified
managing resources, conscientiousness, achieving, motivation and developing, in that
order, as the most important leader behaviors that affect process success. However,
what was surprising is the insignificance of critical analysis and judgment which is
key in judging various scenarios to enable tight-loose decisions.
As expounded in both positive and normative project success literature, factors that
lead to process success may not necessarily lead to product and organizational success.
The results of this study resonate with this view given that the leadership behaviors
that significantly correlated with process success were distinct from those that
correlated significantly with product and organizational success. This study put forth
125
the thesis that a leadership which is characterized by high strategic perspective and
loosening was most likely to achieve both product and organizational success. Further,
the findings of this study agree in part with the findings of O’Donnell (2010) that
project leadership has positive and medium to strong correlation with project success.
Earlier studies have shown that there is a significant positive relationship between
ambiguity acceptance and customer and organizational outcomes for team members
(Hagen & Park, 2013). On the contrary, this study did not find any significant
relationship between these variables. However, it is noted that loosening behavior
heavily draws from a leader’s ability to recognize that a complex project context can
present ambiguous situations which require to be either explored or exploited. It can
therefore be said that ambiguity necessitates loosening behavior and its acceptance
facilitates decision making.
Whereas the individual behaviors within the adaptive leadership dimension did not
portray a significant relationship with process success, they did have when combined.
And with the loosening behavior having had a significant positive relationship with
product and organizational success, adaptive leadership was the only leadership
dimension that had significant relationship with all the dimensions of project success.
Therefore, in line with the recommendation of Snowden and Boone (2007), there is
need to broaden the traditional approach to leadership and decision making and form
a new perspective based on complexity science. Such an approach to leadership is
consistent with the central assertion of the meso argument that leadership is multi-
level, processual, contextual, and interactive (Uhl-Bien & Marion, 2009).
Hypothesis Testing
Project Leadership has Significant Moderating Effect on Complexity and Success
of Public Infrastructural Megaprojects
In order to test the hypothesis that project leadership has significant moderating effect
on complexity and success of public infrastructural megaprojects, the overall
complexity index for each project was determined by calculating a simple average of
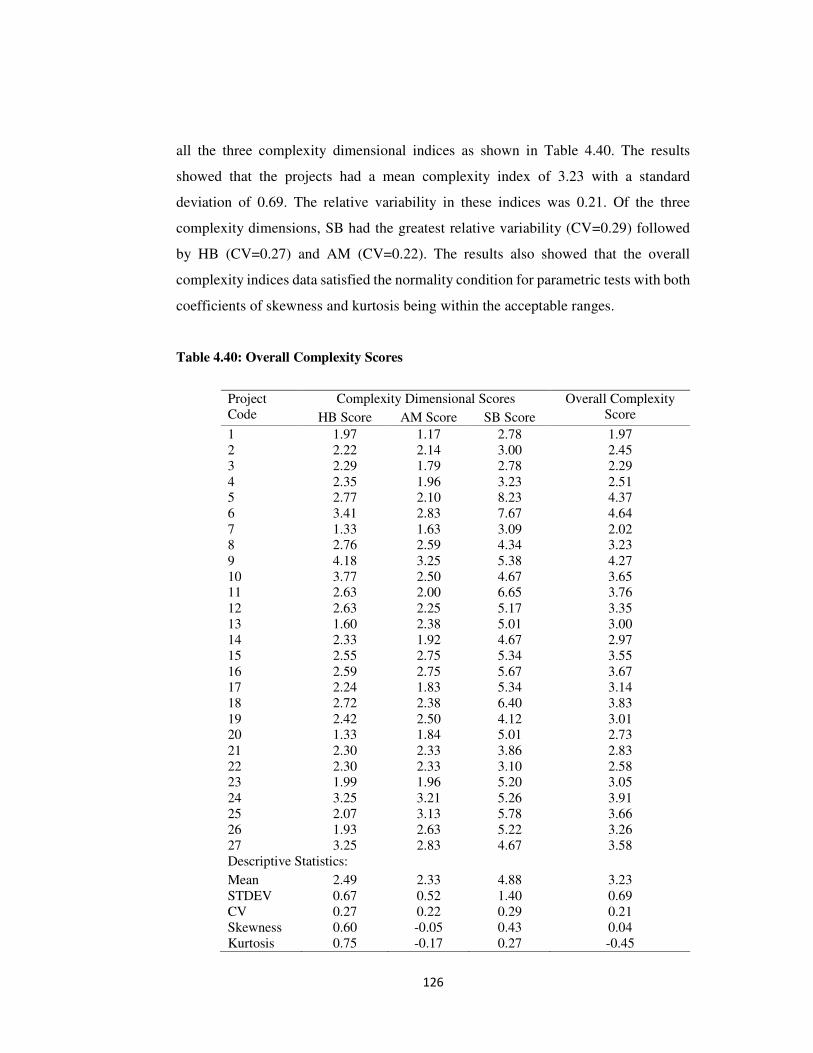
126
all the three complexity dimensional indices as shown in Table 4.40. The results
showed that the projects had a mean complexity index of 3.23 with a standard
deviation of 0.69. The relative variability in these indices was 0.21. Of the three
complexity dimensions, SB had the greatest relative variability (CV=0.29) followed
by HB (CV=0.27) and AM (CV=0.22). The results also showed that the overall
complexity indices data satisfied the normality condition for parametric tests with both
coefficients of skewness and kurtosis being within the acceptable ranges.
Table 4.40: Overall Complexity Scores
Project Code
Complexity Dimensional Scores Overall Complexity Score HB Score AM Score SB Score
1 1.97 1.17 2.78 1.97 2 2.22 2.14 3.00 2.45 3 2.29 1.79 2.78 2.29 4 2.35 1.96 3.23 2.51 5 2.77 2.10 8.23 4.37 6 3.41 2.83 7.67 4.64 7 1.33 1.63 3.09 2.02 8 2.76 2.59 4.34 3.23 9 4.18 3.25 5.38 4.27 10 3.77 2.50 4.67 3.65 11 2.63 2.00 6.65 3.76 12 2.63 2.25 5.17 3.35 13 1.60 2.38 5.01 3.00 14 2.33 1.92 4.67 2.97 15 2.55 2.75 5.34 3.55 16 2.59 2.75 5.67 3.67 17 2.24 1.83 5.34 3.14 18 2.72 2.38 6.40 3.83 19 2.42 2.50 4.12 3.01 20 1.33 1.84 5.01 2.73 21 2.30 2.33 3.86 2.83 22 2.30 2.33 3.10 2.58 23 1.99 1.96 5.20 3.05 24 3.25 3.21 5.26 3.91 25 2.07 3.13 5.78 3.66 26 1.93 2.63 5.22 3.26 27 3.25 2.83 4.67 3.58 Descriptive Statistics:
Mean 2.49 2.33 4.88 3.23 STDEV 0.67 0.52 1.40 0.69 CV 0.27 0.22 0.29 0.21 Skewness 0.60 -0.05 0.43 0.04 Kurtosis 0.75 -0.17 0.27 -0.45
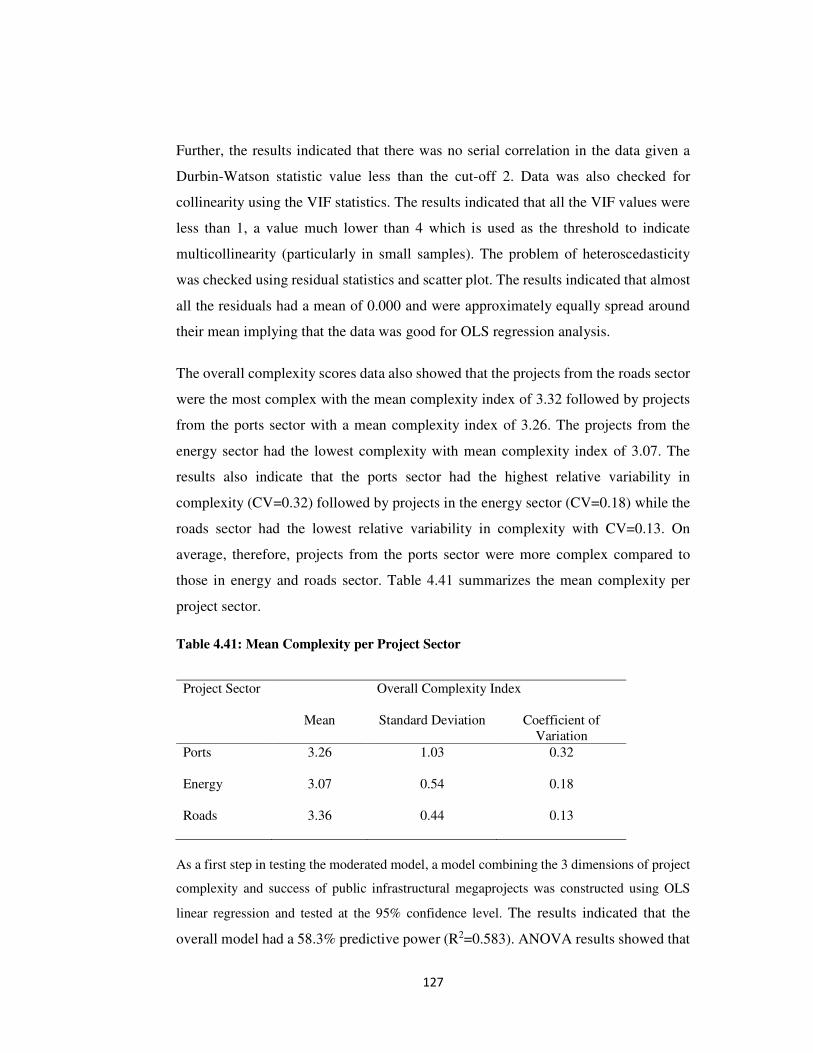
127
Further, the results indicated that there was no serial correlation in the data given a
Durbin-Watson statistic value less than the cut-off 2. Data was also checked for
collinearity using the VIF statistics. The results indicated that all the VIF values were
less than 1, a value much lower than 4 which is used as the threshold to indicate
multicollinearity (particularly in small samples). The problem of heteroscedasticity
was checked using residual statistics and scatter plot. The results indicated that almost
all the residuals had a mean of 0.000 and were approximately equally spread around
their mean implying that the data was good for OLS regression analysis.
The overall complexity scores data also showed that the projects from the roads sector
were the most complex with the mean complexity index of 3.32 followed by projects
from the ports sector with a mean complexity index of 3.26. The projects from the
energy sector had the lowest complexity with mean complexity index of 3.07. The
results also indicate that the ports sector had the highest relative variability in
complexity (CV=0.32) followed by projects in the energy sector (CV=0.18) while the
roads sector had the lowest relative variability in complexity with CV=0.13. On
average, therefore, projects from the ports sector were more complex compared to
those in energy and roads sector. Table 4.41 summarizes the mean complexity per
project sector.
Table 4.41: Mean Complexity per Project Sector
Project Sector Overall Complexity Index
Mean Standard Deviation
Coefficient of Variation
Ports 3.26 1.03
0.32
Energy 3.07 0.54
0.18
Roads 3.36 0.44
0.13
As a first step in testing the moderated model, a model combining the 3 dimensions of project
complexity and success of public infrastructural megaprojects was constructed using OLS
linear regression and tested at the 95% confidence level. The results indicated that the
overall model had a 58.3% predictive power (R2=0.583). ANOVA results showed that
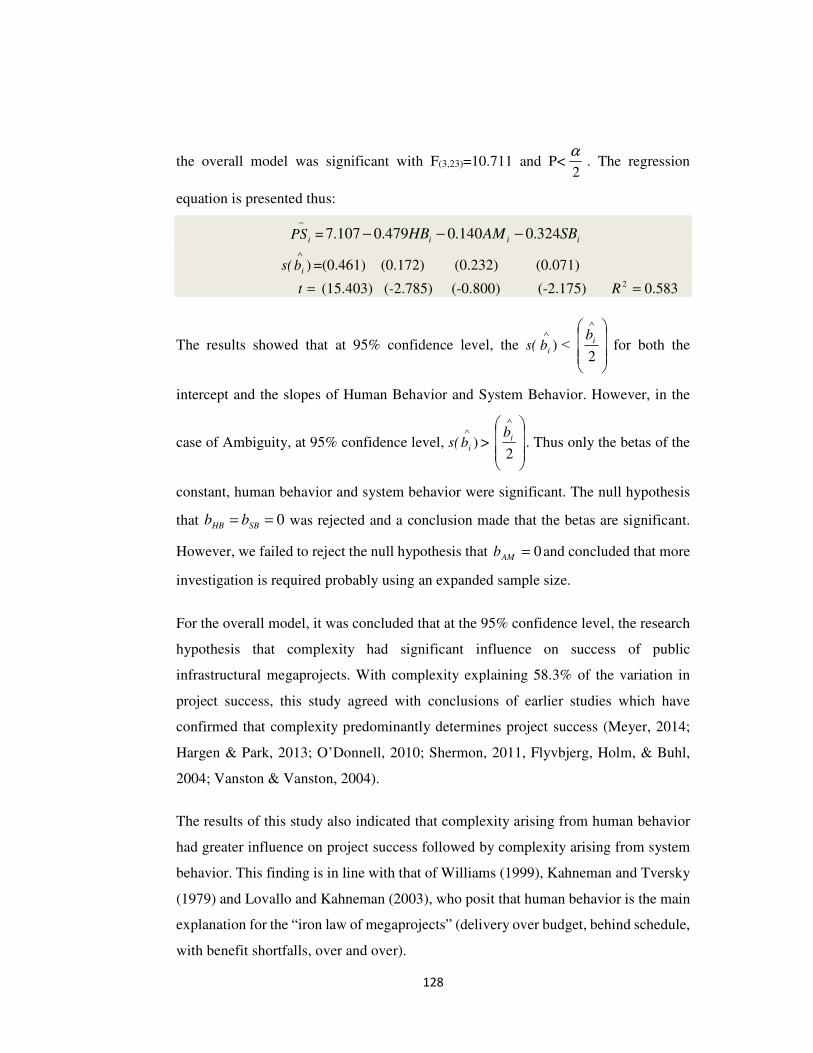
128
the overall model was significant with F(3,23)=10.711 and P< . The regression
equation is presented thus:
−
iPS = iii SBAMHB 324.0140.0479.0107.7 −−−
s( )∧
ib =(0.461) (0.172) (0.232) (0.071)
=t (15.403) (-2.785) (-0.800) (-2.175) 583.02 =R
The results showed that at 95% confidence level, the s( )∧
ib ˂
∧
2
ib for both the
intercept and the slopes of Human Behavior and System Behavior. However, in the
case of Ambiguity, at 95% confidence level, s( )∧
ib >
∧
2
ib. Thus only the betas of the
constant, human behavior and system behavior were significant. The null hypothesis
that 0== SBHB bb was rejected and a conclusion made that the betas are significant.
However, we failed to reject the null hypothesis that 0=AMb and concluded that more
investigation is required probably using an expanded sample size.
For the overall model, it was concluded that at the 95% confidence level, the research
hypothesis that complexity had significant influence on success of public
infrastructural megaprojects. With complexity explaining 58.3% of the variation in
project success, this study agreed with conclusions of earlier studies which have
confirmed that complexity predominantly determines project success (Meyer, 2014;
Hargen & Park, 2013; O’Donnell, 2010; Shermon, 2011, Flyvbjerg, Holm, & Buhl,
2004; Vanston & Vanston, 2004).
The results of this study also indicated that complexity arising from human behavior
had greater influence on project success followed by complexity arising from system
behavior. This finding is in line with that of Williams (1999), Kahneman and Tversky
(1979) and Lovallo and Kahneman (2003), who posit that human behavior is the main
explanation for the “iron law of megaprojects” (delivery over budget, behind schedule,
with benefit shortfalls, over and over).
2
α
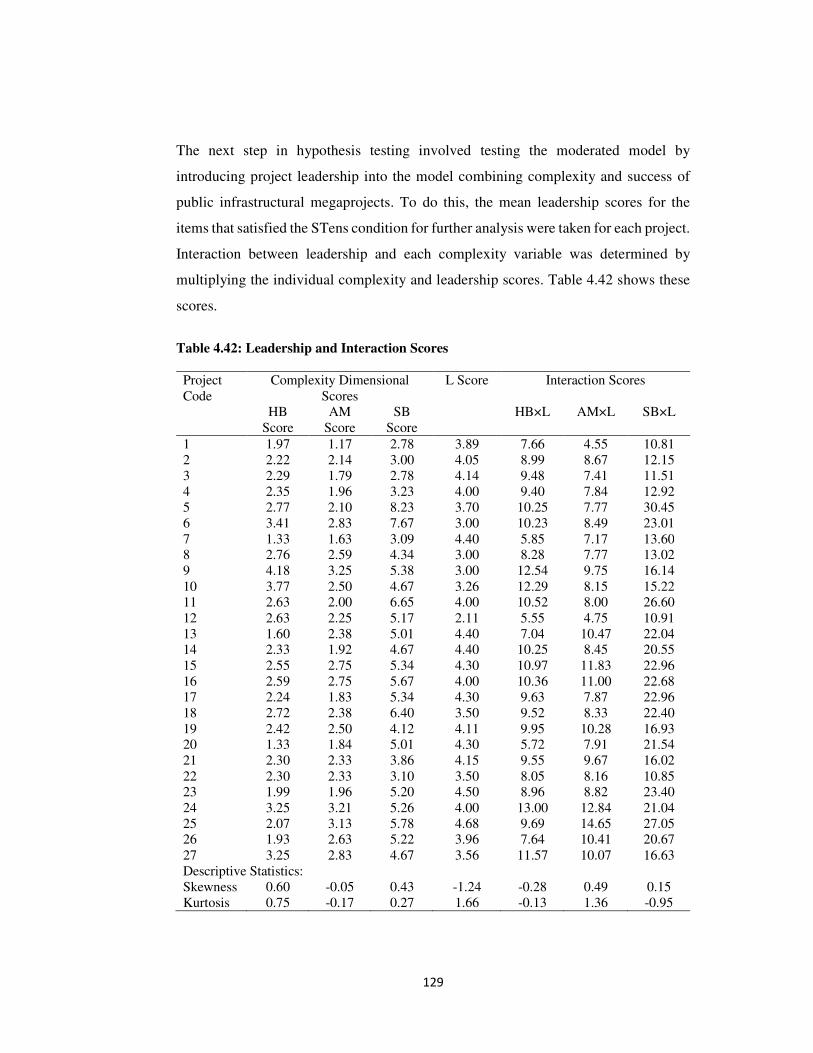
129
The next step in hypothesis testing involved testing the moderated model by
introducing project leadership into the model combining complexity and success of
public infrastructural megaprojects. To do this, the mean leadership scores for the
items that satisfied the STens condition for further analysis were taken for each project.
Interaction between leadership and each complexity variable was determined by
multiplying the individual complexity and leadership scores. Table 4.42 shows these
scores.
Table 4.42: Leadership and Interaction Scores
Project Code
Complexity Dimensional Scores
L Score Interaction Scores
HB Score
AM Score
SB Score
HB×L AM×L SB×L
1 1.97 1.17 2.78 3.89 7.66 4.55 10.81 2 2.22 2.14 3.00 4.05 8.99 8.67 12.15 3 2.29 1.79 2.78 4.14 9.48 7.41 11.51 4 2.35 1.96 3.23 4.00 9.40 7.84 12.92 5 2.77 2.10 8.23 3.70 10.25 7.77 30.45 6 3.41 2.83 7.67 3.00 10.23 8.49 23.01 7 1.33 1.63 3.09 4.40 5.85 7.17 13.60 8 2.76 2.59 4.34 3.00 8.28 7.77 13.02 9 4.18 3.25 5.38 3.00 12.54 9.75 16.14 10 3.77 2.50 4.67 3.26 12.29 8.15 15.22 11 2.63 2.00 6.65 4.00 10.52 8.00 26.60 12 2.63 2.25 5.17 2.11 5.55 4.75 10.91 13 1.60 2.38 5.01 4.40 7.04 10.47 22.04 14 2.33 1.92 4.67 4.40 10.25 8.45 20.55 15 2.55 2.75 5.34 4.30 10.97 11.83 22.96 16 2.59 2.75 5.67 4.00 10.36 11.00 22.68 17 2.24 1.83 5.34 4.30 9.63 7.87 22.96 18 2.72 2.38 6.40 3.50 9.52 8.33 22.40 19 2.42 2.50 4.12 4.11 9.95 10.28 16.93 20 1.33 1.84 5.01 4.30 5.72 7.91 21.54 21 2.30 2.33 3.86 4.15 9.55 9.67 16.02 22 2.30 2.33 3.10 3.50 8.05 8.16 10.85 23 1.99 1.96 5.20 4.50 8.96 8.82 23.40 24 3.25 3.21 5.26 4.00 13.00 12.84 21.04 25 2.07 3.13 5.78 4.68 9.69 14.65 27.05 26 1.93 2.63 5.22 3.96 7.64 10.41 20.67 27 3.25 2.83 4.67 3.56 11.57 10.07 16.63 Descriptive Statistics: Skewness 0.60 -0.05 0.43 -1.24 -0.28 0.49 0.15 Kurtosis 0.75 -0.17 0.27 1.66 -0.13 1.36 -0.95
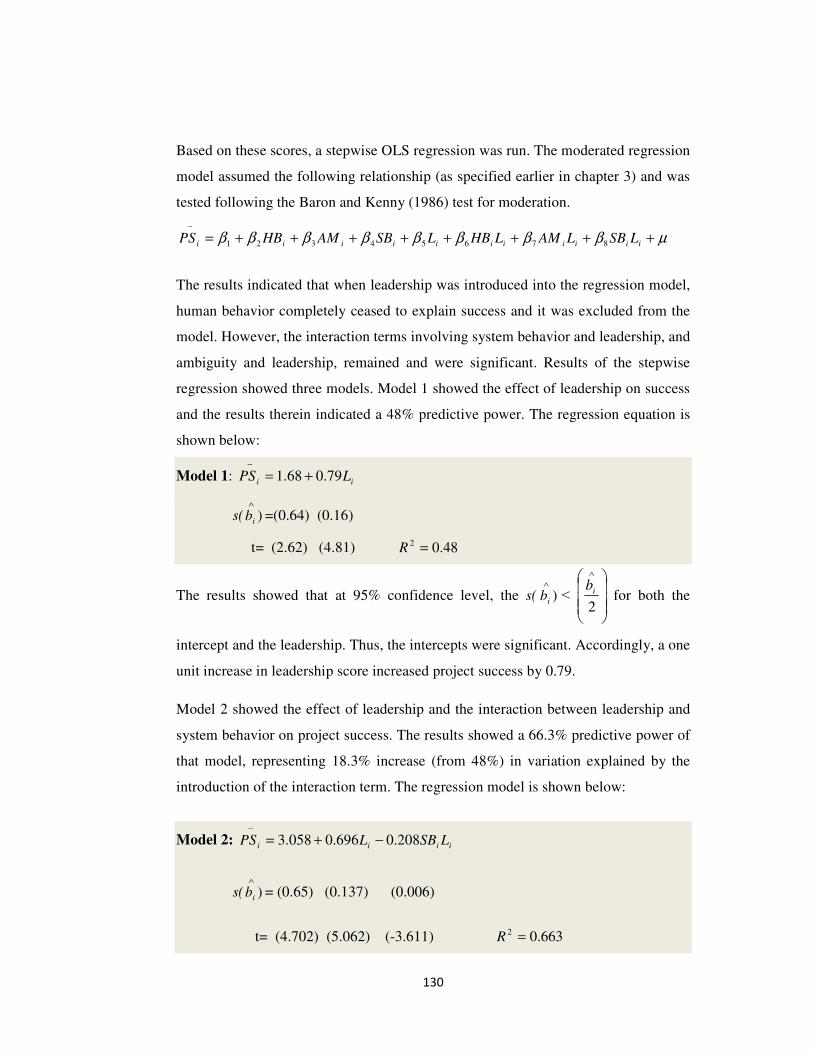
130
Based on these scores, a stepwise OLS regression was run. The moderated regression
model assumed the following relationship (as specified earlier in chapter 3) and was
tested following the Baron and Kenny (1986) test for moderation.
µββββββββ ++++++++=−
iiiiiiiiiii LSBLAMLHBLSBAMHBPS 87654321
The results indicated that when leadership was introduced into the regression model,
human behavior completely ceased to explain success and it was excluded from the
model. However, the interaction terms involving system behavior and leadership, and
ambiguity and leadership, remained and were significant. Results of the stepwise
regression showed three models. Model 1 showed the effect of leadership on success
and the results therein indicated a 48% predictive power. The regression equation is
shown below:
Model 1: ii LPS 79.068.1 +=−
s( )∧
ib =(0.64) (0.16)
t= (2.62) (4.81) 48.02 =R
The results showed that at 95% confidence level, the s( )∧
ib ˂
∧
2
ib for both the
intercept and the leadership. Thus, the intercepts were significant. Accordingly, a one
unit increase in leadership score increased project success by 0.79.
Model 2 showed the effect of leadership and the interaction between leadership and
system behavior on project success. The results showed a 66.3% predictive power of
that model, representing 18.3% increase (from 48%) in variation explained by the
introduction of the interaction term. The regression model is shown below:
Model 2: iiii LSBLPS 208.0696.0058.3 −+=−
s( )∧
ib = (0.65) (0.137) (0.006)
t= (4.702) (5.062) (-3.611) 663.02 =R
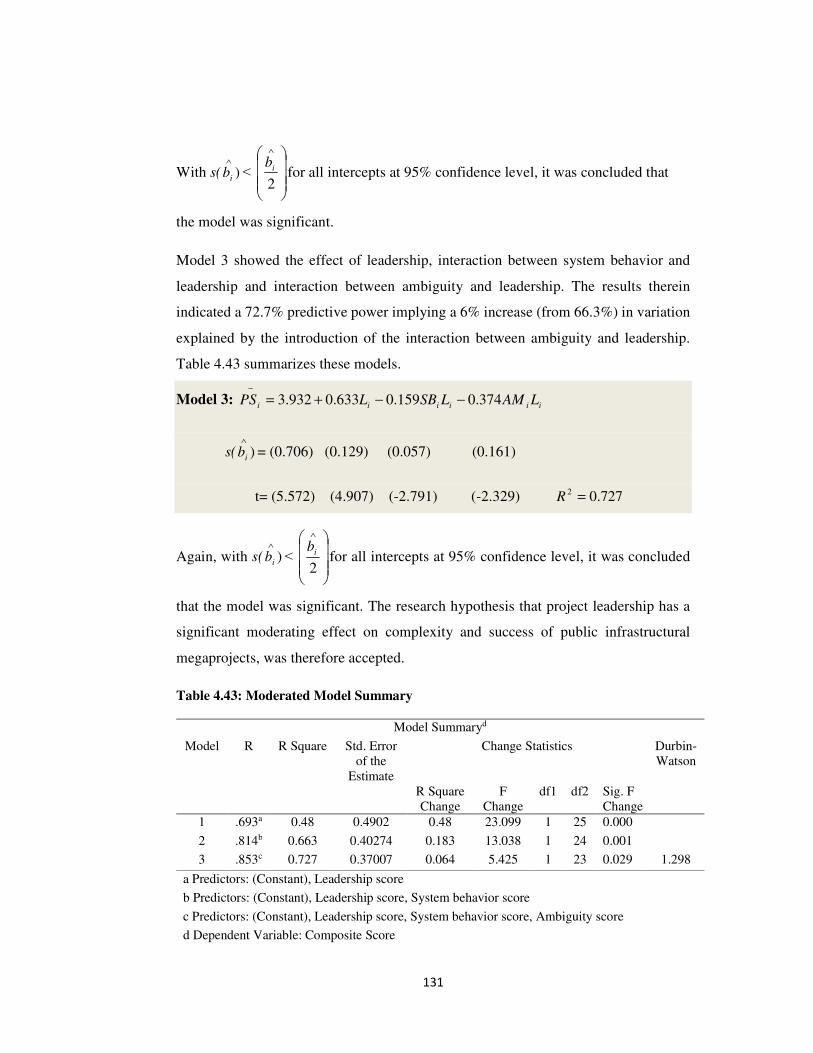
131
With s( )∧
ib ˂
∧
2
ibfor all intercepts at 95% confidence level, it was concluded that
the model was significant.
Model 3 showed the effect of leadership, interaction between system behavior and
leadership and interaction between ambiguity and leadership. The results therein
indicated a 72.7% predictive power implying a 6% increase (from 66.3%) in variation
explained by the introduction of the interaction between ambiguity and leadership.
Table 4.43 summarizes these models.
Model 3: iiiiii LAMLSBLPS 374.0159.0633.0932.3 −−+=
−
s( )∧
ib = (0.706) (0.129) (0.057) (0.161)
t= (5.572) (4.907) (-2.791) (-2.329) 727.02 =R
Again, with s( )∧
ib ˂
∧
2
ibfor all intercepts at 95% confidence level, it was concluded
that the model was significant. The research hypothesis that project leadership has a
significant moderating effect on complexity and success of public infrastructural
megaprojects, was therefore accepted.
Table 4.43: Moderated Model Summary
Model Summaryd
Model R R Square Std. Error of the
Estimate
Change Statistics Durbin-Watson
R Square Change
F Change
df1 df2 Sig. F Change
1 .693a 0.48 0.4902 0.48 23.099 1 25 0.000
2 .814b 0.663 0.40274 0.183 13.038 1 24 0.001
3 .853c 0.727 0.37007 0.064 5.425 1 23 0.029 1.298
a Predictors: (Constant), Leadership score
b Predictors: (Constant), Leadership score, System behavior score
c Predictors: (Constant), Leadership score, System behavior score, Ambiguity score
d Dependent Variable: Composite Score
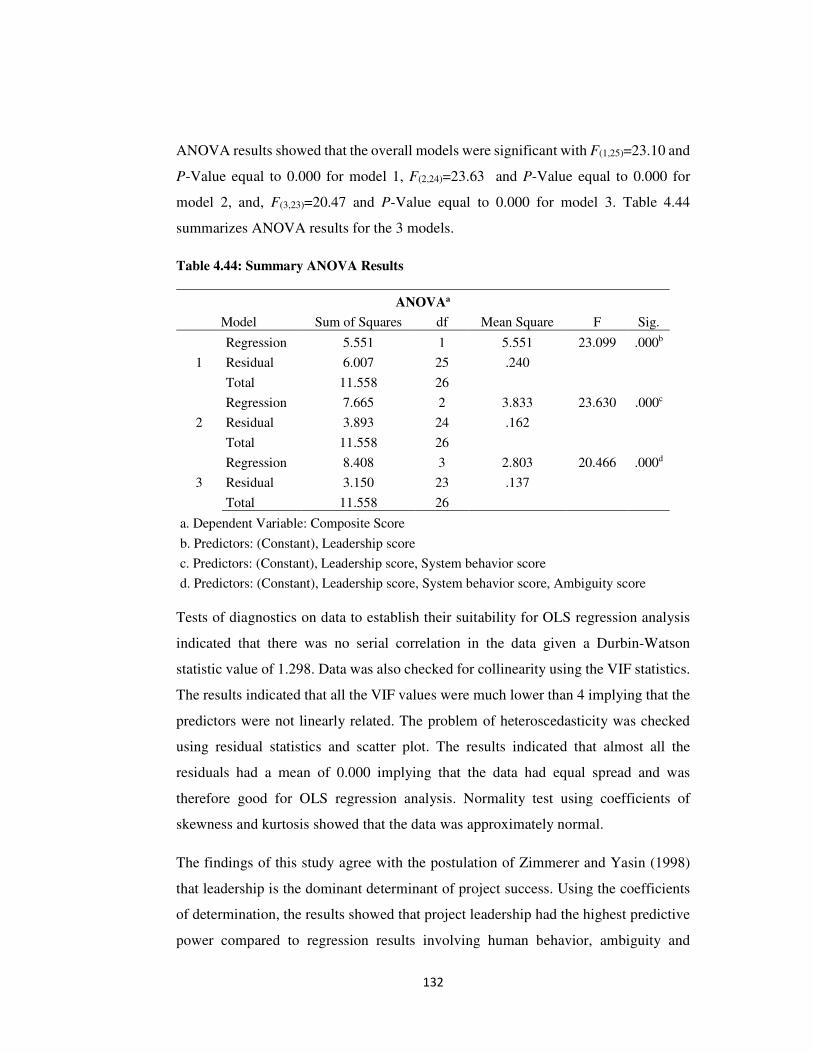
132
ANOVA results showed that the overall models were significant with F(1,25)=23.10 and
P-Value equal to 0.000 for model 1, F(2,24)=23.63 and P-Value equal to 0.000 for
model 2, and, F(3,23)=20.47 and P-Value equal to 0.000 for model 3. Table 4.44
summarizes ANOVA results for the 3 models.
Table 4.44: Summary ANOVA Results
ANOVAa
Model Sum of Squares df Mean Square F Sig.
1
Regression 5.551 1 5.551 23.099 .000b
Residual 6.007 25 .240
Total 11.558 26
2
Regression 7.665 2 3.833 23.630 .000c
Residual 3.893 24 .162
Total 11.558 26
3
Regression 8.408 3 2.803 20.466 .000d
Residual 3.150 23 .137
Total 11.558 26
a. Dependent Variable: Composite Score
b. Predictors: (Constant), Leadership score
c. Predictors: (Constant), Leadership score, System behavior score
d. Predictors: (Constant), Leadership score, System behavior score, Ambiguity score
Tests of diagnostics on data to establish their suitability for OLS regression analysis
indicated that there was no serial correlation in the data given a Durbin-Watson
statistic value of 1.298. Data was also checked for collinearity using the VIF statistics.
The results indicated that all the VIF values were much lower than 4 implying that the
predictors were not linearly related. The problem of heteroscedasticity was checked
using residual statistics and scatter plot. The results indicated that almost all the
residuals had a mean of 0.000 implying that the data had equal spread and was
therefore good for OLS regression analysis. Normality test using coefficients of
skewness and kurtosis showed that the data was approximately normal.
The findings of this study agree with the postulation of Zimmerer and Yasin (1998)
that leadership is the dominant determinant of project success. Using the coefficients
of determination, the results showed that project leadership had the highest predictive
power compared to regression results involving human behavior, ambiguity and
133
system behavior, individually on project success. Complexity alone explained 58.3%
of variation in project success. However, when project leadership was introduced, the
predictive power of the model jumped to 72.7%.
Further, the results of this study support the view that leadership skills are the most
important for successful navigation of complexity (PMI, 2013a) in megaprojects.
Apparently, when leadership was introduced into the regression model combining the
dimensions of complexity, it totally eclipsed human behavior as a predictor of success
and had significant interaction effect with both ambiguity and system behavior. As
such, the study agrees with the view suggesting that problems related to successful
project outcomes and inevitably the solution to achieving project objectives that meet
stakeholders’ expectations, originates with people in leadership roles and the
procedures adopted by project managers (Standish Group, 2006, 2009).
The findings of this study reinforce the proposal of the 2009 ICCPM round table series
on complex project management that future managers of complex projects need to be
developed and selected based on a range of leadership skills that enables them to
operate in uncertain and ambiguous environments (Hayes & Bennett, 2011).
4.5 Implications of the Findings and Optimal Model
4.5.1 Implications for Theory and Practice
This study confirmed that individually, human behavior, ambiguity and system
behavior significantly influences success of public infrastructural megaprojects. Even
though ambiguity was not significant when these three dimensions were combined into
one model, the central implication of the findings was that complexity indeed
influences success. This puts the application of the Complex Adaptive Systems theory
at the centre of resolving the “iron law” of megaprojects. The study identified biases
in individual as well as group behavior that represent a systematic pattern of deviation
from norm or rationality in judgment. The findings confirmed that these biases actually
affect project outcomes, mostly negatively. Collectively, the study established that
these biases affect the culture of the project organization. As showed in this study, the
individual behavioral biases led to a culture that did not support delivery of
134
megaprojects. Consequently, the findings underscore the significance and application
of the Cognitive Bias theory in delivery of successful public infrastructural
megaprojects. Results of this study also confirmed that there was no one best
organizational structure to deliver projects. Rather, the appropriate organizational
structure depends on the contingencies facing the organization . Based on the
findings of this study, projects whose characteristics aligned with the contingencies
within and outside their implementing organization performed more effectively
compared to those that were misaligned. In effect, the findings of this study reinforce
the application of the Structural Contingency theory in delivery of public
infrastructural megaprojects.
Finally, the findings of this study confirmed that project leadership indeed influences
successful delivery of public infrastructural megaprojects. This was in such a way that
success was enhanced as project leadership tended towards complexity leadership
style. This means that in order to deliver these projects successfully, project managers
must be quick to take note of emerging patterns or contexts so as to tailor their
leadership approach effectively. In essence, the findings pointed to the fact that
megaproject leadership becomes depending on the context. When project leadership
was introduced in a model combining the dimensions of complexity, human behavior
completely ceased to be a predictor of project success but the interaction effect of
leadership with ambiguity and system behavior remained significant. These findings
put Complexity Leadership theory at the centre of delivering successful public
infrastructural megaprojects.
4.5.2 Implications for Research
This study found that process success did not necessarily mean project success. It
confirmed that a project delivered within budget, within schedule and to the right
technical specifications is not necessarily a successful project. However, the study
established that a project that attains product success is likely to exhibit organizational
success. Thus, the findings of this study reinforce and contribute to the raging debate
on research in the success school as to whether project management success implies
project success.
135
The finding that individuals and groups exhibit cognitive biases which actually affect
the project and organization culture, and thus the project outcomes, is a key
contribution to research in the behavioral school of project management. With the
finding that project leadership should become depending on the context, the study adds
to the contingency school of project management research. The findings that: project
leadership, top management support, organization structure, and project manager’s
authority, influence project success are key contributions to the governance school of
project management research.
4.5.3 Optimal/Revised Model of the Study
The optimal model of this study was derived based on the research findings. The model
rearranges the constructs of each variable based on the magnitude of their coefficients
of determination with the variable. The model also orders the variables based on the
extent to which each explains the variability in the dependent variable. Based on the
findings of this study, group behavior had the highest correlation with human behavior
followed by organizational design and development, and individual behavior, in that
order. Emergence correlated with ambiguity more than uncertainty while system
dynamics correlated with system behavior more, followed by dependency and
connectedness, in that order. Based on the complexity dimensions, human behavior
explained more of the variation in project success followed by ambiguity and system
behavior, in that order. Of the project success dimensions, product success explained
more of the variation in overall success followed by organizational success and process
success, respectively.
The results for project leadership showed that success was enhanced as the leadership
style tended from goal-oriented towards involving and towards complexity leadership.
When project leadership was introduced into the combined model, human behavior
completely ceased to predict success but the interaction effect of project leadership
with both ambiguity and system behavior remained significant. This would imply that
project leadership influences (moderates) the strength of the causal relationship
between ambiguity and system behavior with success of public infrastructural
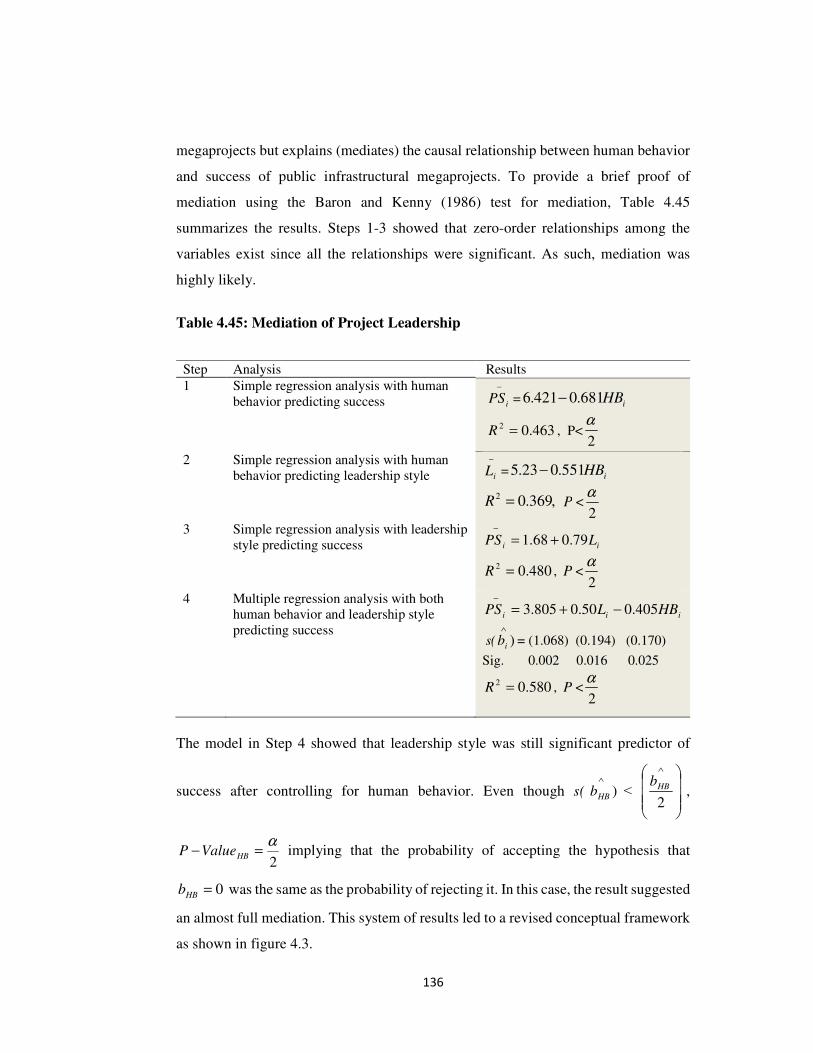
136
megaprojects but explains (mediates) the causal relationship between human behavior
and success of public infrastructural megaprojects. To provide a brief proof of
mediation using the Baron and Kenny (1986) test for mediation, Table 4.45
summarizes the results. Steps 1-3 showed that zero-order relationships among the
variables exist since all the relationships were significant. As such, mediation was
highly likely.
Table 4.45: Mediation of Project Leadership
Step Analysis Results
1 Simple regression analysis with human behavior predicting success
−
iPS = iHB681.0421.6 −
463.02 =R , P<
2 Simple regression analysis with human behavior predicting leadership style
−
iL = iHB551.023.5 −
,369.02 =R P <2
α
3 Simple regression analysis with leadership style predicting success ii LPS 79.068.1 +=
−
480.02 =R , P <2
α
4 Multiple regression analysis with both human behavior and leadership style predicting success
iii HBLPS 405.050.0805.3 −+=−
s( )∧
ib = (1.068) (0.194) (0.170)
Sig. 0.002 0.016 0.025
580.02 =R , P <2
α
The model in Step 4 showed that leadership style was still significant predictor of
success after controlling for human behavior. Even though s( )∧
HBb ˂
∧
2
HBb,
2
α=− HBValueP implying that the probability of accepting the hypothesis that
0=HBb was the same as the probability of rejecting it. In this case, the result suggested
an almost full mediation. This system of results led to a revised conceptual framework
as shown in figure 4.3.
2
α
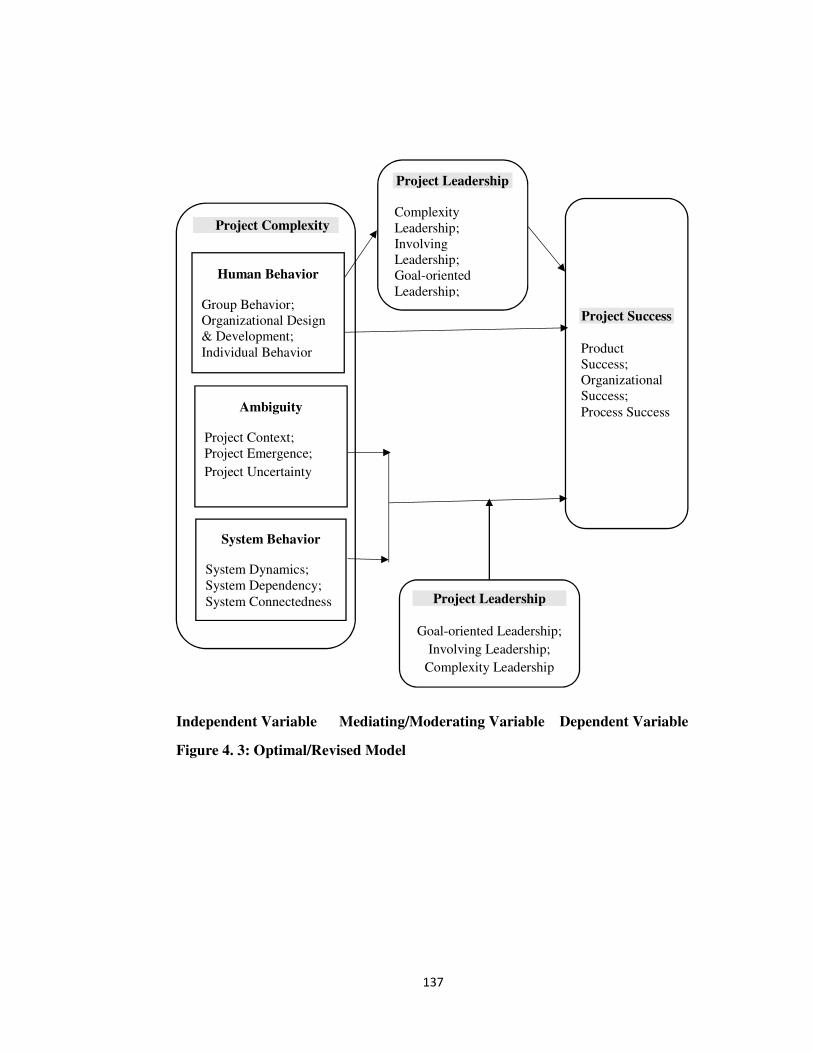
137
Independent Variable Mediating/Moderating Variable Dependent Variable
Figure 4. 3: Optimal/Revised Model
Project Complexity
Human Behavior
Group Behavior; Organizational Design & Development; Individual Behavior
Ambiguity
Project Context; Project Emergence;
Project Uncertainty
System Behavior
System Dynamics; System Dependency; System Connectedness
Project Leadership Complexity Leadership; Involving Leadership; Goal-oriented Leadership;
Project Success
Product Success; Organizational Success; Process Success
Project Leadership
Goal-oriented Leadership;
Involving Leadership;
Complexity Leadership
138
CHAPTER FIVE
SUMMARY, CONCLUSIONS AND RECOMMENDATIONS
5.1 Introduction
This chapter provides a summary of the rationale and methodology of this study
together with the findings from the study. Based on the summary of the findings,
conclusions are drawn as a basis of making both policy and research recommendations.
The summary of the findings is presented based on each study variable, with the
conclusions being presented based on each study objective. The recommendations are
presented for both policy and practice, and for research.
5.2 Summary of Findings
The main objective of this study was to investigate the moderating role of project
leadership on the influence of complexity on success of public infrastructural projects
in Kenya. To operationalize this, a set of 4 specific objectives were used with the main
variables of study being human behavior, ambiguity, system behavior and project
leadership. The need for this study arose from the thesis that complexity is the main
cause of waste and failure that results in infrastructural megaprojects being delivered
over budget, behind schedule, with benefit shortfalls, over and over again; and that
leadership skills are the most important for successful navigation of this complexity.
The study was designed as multiple-method research, based on virtual constructionist
ontology recognizing that complexity is the mid-point between order and disorder. A
cross-sectional census survey of 124 respondents (comprising 31 project managers, 62
project team members and 31 project sponsors) based on 31 completed public
infrastructural megaprojects was conducted using three interlinked questionnaires.
139
Collected data was processed and analyzed using Microsoft Access 2010, IBM’s SPSS
version 20 and Microsoft Excel 2010. Quantitative data analysis was conducted using
both descriptive and inferential statistics while qualitative data analysis was done
through scenario mapping and triangulation. The main descriptive statistics used were
the mean, standard deviation, coefficient of variation, skewness, kurtosis, percentages
and STens. The inferential statistics used were F-test, t-test, Pearson correlation
coefficients, coefficients of determination and tests of significance. Data presentation
was largely through tables, charts, text, figures and equations. The findings of the study
are summarized per each variable as follows:
5.2.1 Megaproject Success
Infrastructural Megaproject success was measured along three constructs namely
process, product and organizational success. Process success incorporated the
traditional measures of efficiency (delivery within budget and time schedule) and
quality. Product success measured the effectiveness of the project in delivering a
product that meets the customer requirements, improves customer performance, and
satisfies customer needs. Organizational success measured the interaction of process
and product success to meet organizational objectives, maximize stakeholder value,
and enhance organizational innovation capacity to deliver future projects.
The findings agreed in part with the trending view that megaprojects are always
delivered over budget, behind schedule. With 52% of the projects having been
delivered overbudget and 82% having been delivered behind schedule, the “iron law
of megaprojects” was partly confirmed. Whereas existing positive literature indicates
that one out of ten infrastructural megaprojects is delivered on budget and one out of
ten megaprojects is delivered on schedule, the study only confirmed this to the extent
that 11% of the projects were delivered on schedule.
Further, the results showed that the megaprojects surveyed had a mean of 0.91 in cost
performance, 0.73 in schedule performance and 0.82 in overall efficiency. This study
found that more of the variability in overall project efficiency was attributed to
schedule performance than to cost performance and most projects that were delivered
140
on or under budget experienced schedule delay. This is a key finding that may be
pointing to the fact that most emphasis in megaproject management is directed on the
cost element rather than to an integrated trade-off among cost, time and quality.
Project success results based on sector showed that the energy sector projects had
relatively the highest process success variability (CV=0.11) but had the lowest product
(CV=0.45), organizational (CV=0.40) and composite (CV=0.28) success variability.
The ports sector had the lowest relative process success (CV=0.29) but the highest
relative product (CV=0.20), organizational (CV=0.13) and composite (CV=0.12)
success. These findings add to the growing view that operational excellence or process
success does not necessarily imply project success.
5.2.2 Human Behavior
Human behavior was measured using three constructs namely; individual behavior,
group behavior, and organizational design and development. The study found that of
the complexity dimensions, human behavior had the highest predictive ability on
success of public infrastructural megaprojects with R2=46.5%. The findings of this
study agreed with the postulation of both positive and normative literature that
optimism bias and the other biases in individual behavior have negative implications
throughout the life cycle of programs and projects. Projects exhibiting optimism bias
had more incidences of delivery over budget and behind schedule compared to those
exhibiting misrepresentation and loss aversion. The findings also pointed to the fact
that individual behaviors identified had more adverse effect on schedule performance
compared to cost performance.
The findings of this study put misrepresentation bias in the second place among
individual biases associated with cost overrun and schedule delay. The surprising bit
was that this misrepresentation came from both in-project and corporate or programme
management, as in the cases where project managers cited servitude to be the main
reason for both cost and schedule underperformance. In terms of occurrence on
projects, this study found that loss aversion had almost twice the frequency of
optimism bias and thrice the frequency of misrepresentation.
141
In projects where groupthink was not inferred, delivery was superior when compared
to projects in which groupthink was inferred. For this study, the findings established
that project misalignment adversely affected schedule delivery and to a considerable
extent, budget delivery. This finding supports and reinforces the Structural
Contingency Theory which posits that an organization whose characteristics align with
the contingencies in its situation will perform more effectively compared to an
organization whose characteristics do not fit with the contingencies in its situation.
The results of this study agree with the postulation in extant literature that effective
communication has an impact on project execution and/or outcome. As noted from this
study, in projects where there was no open communication, collaboration and trust
among the stakeholders and project team, the probability of delivery within cost and
schedule dropped from 47.8% and 13% respectively, to 0%.
On whether project management maturity has a relationship with project performance,
this study posted mixed findings-on one hand it was concluded that lack of process
maturity had negative relationship with schedule delivery, on the other hand the results
are mixed on the relationship between lack of process maturity and cost performance.
For the projects in which the project manager had the authority to apply internal or
external resources to project activities, 45.5% were delivered within budget and 18.2%
were delivered within schedule.
Consistent with the postulations of the project management theory, strong matrix and
projectized organization structures usually give the project manager full authority to
make project decisions, within the constraints of the project charter. Where the project
manager did not have authority to apply resources, the chance of delivery within
budget went down to 40% while that of delivery on schedule diminished to 10%. The
results of this study showed that projects utilizing strong matrix and projectized
structures had more stable mean success results.
On stakeholder engagement, the main forms of engagement were through site meetings
and progress reports, with some projects involving stakeholders only in preparatory
stages. Stakeholder engagement was a formal role in only 4 projects (14.8%) with 6
142
projects (22.2%) having a clearly documented stakeholder engagement plan that was
used to manage stakeholders. The findings of this study showed that there is an
identifiable gap between the prescriptions of theory and actual practice. Indeed, the
results showed a practice that is long on management for stakeholders and short on
management of stakeholders.
All projects mapped onto a project culture that can be characterized as having a
preference for an internal focus and stability. In line with the findings in positive
literature, failed projects map onto a culture that can be characterized as having
preference for internal focus and stability. This type of culture is generally suitable
for organizations that operate in more deterministic environments characterized with
more stable outcomes.
5.2.3 Ambiguity
Complexity arising from ambiguity was measured on a scale comprising three
constructs namely; project context, emergence and uncertainty. The findings of this
study established that ambiguity had significant negative influence on success of
public infrastructural megaprojects. However, ambiguity did not have a significant
influence on success of infrastructural megaprojects when the three dimensions of
complexity are combined.
The results indicated that ambiguity had significant correlation with process success,
implying that accepting and dealing with ambiguity should be a key aspect of project
management. The study established that most infrastructural megaprojects utilized FP-
EPA with one third of the projects surveyed utilizing FFP contracts. A larger
proportion of projects that utilized FFP contracts recorded higher cost performance.
This was followed by projects that utilized FP-EPA, which is a variation of FP
contracts. Despite having recorded superior cost performance, projects that utilized
FFP recorded the highest schedule slippage. However, projects whose contracts
included late delivery penalties delivered on schedule.
143
The results of this study pointed to the thesis that projects utilizing outcome-oriented
contracts lead to better results than those utilizing behavior-based contracts. Projects
in which the client assumed full responsibility for risk of cost overrun and schedule
delay met their cost and schedule objectives. The results showed that emergence in
stakeholder requirements throughout the project’s life cycle could lead to reduced cost
and schedule performance thereby dimming chances of project management success.
Instability in the political and physical environment adversely affected chances of
delivery within budget and schedule.
Where the actual rate and type or propensity for change was not manageable, cost and
schedule delivery slipped to zero. Further, in most cases where the project context was
not stable, schedule delivery was adversely affected. Projects that had a documented
change control system with identifiable change authority returned a higher probability
of delivery within budget and schedule. It was also established that longer schedule
duration was associated with increased delivery of projects under budget but with
reduced delivery within schedule. Delivery over budget and behind schedule was
equally high where the project had a large number of issues, risks and uncertainties.
This study found that chances of delivery over budget and behind schedule were also
high in circumstances where that type of project had not been undertaken by the
organization before.
5.2.4 System Behavior
Complexity arising from system behavior was measured on a scale comprising three
constructs namely; connectedness, dependency and system dynamics. The study
established that system behavior had a significant influence on success of public
infrastructural megaprojects. The results showed that system connectedness had some
association with project outcomes, mostly failure to meet cost and schedule objectives.
Projects with fewer channels of communication (given the stakeholder connections)
had superior cost and schedule performance than those with many channels of
communication.
144
Projects that had more than one critical path recorded superior cost performance but
schedule performance seemed to be a decreasing function of the number of critical
paths in the project. However, relative variability in both mean and schedule
performance seemed to decrease as the number of critical paths in the project
increased. Both mean cost and schedule performance appeared to go down as the
number of dependency relationships among the project’s components increased from
one to above 5.
The relative variability in both the mean cost and schedule performance also appeared
to decrease with the number of dependency relationships among the project’s
components. Both the mean cost and schedule performance appeared to increase as the
number of interphases between the project’s products and those of other projects
within the organization increased. The relative riskiness in cost performance seemed
to increase with the number of interphases but the riskiness in schedule performance
went down as the number of interphases increased.
Coefficients of variation for both cost and schedule performance went down as the
number of critical paths increased. This study established that cost and schedule
delivery decreased with the number of dependency relationships among project
components. The implication of this is that increased complexity arising from the
number of dependency relationships reduced the chances of cost and schedule
delivery.
The study also established that the use of more technologies on a project was
associated with increased cost and schedule performance risk. Unpredictability in the
manner in which the interconnected components operate is associated with low relative
variability in project cost and schedule performance. Cost and schedule performance
indices were more stable where project components were pre-fabricated, pre-
assembled and tested offsite before being used in the project. Projects which embraced
Just-In-Time stocking of materials were associated with superior and more stable cost
and schedule performance.
145
5.2.5 Project Leadership
Project leadership was assessed using behaviors along four dimensions namely:
intellectual (IQ), managerial (MQ), emotional and social (ESQ), and adaptive (AQ).
Based on IQ, the results indicated a leadership style characterized by medium score on
critical analysis and judgment, vision and imagination, and strategic perspective. On
MQ, the results indicated a leadership style characterized by medium score on
managing resources, low score on both engaging communication and developing and
medium score on achieving. On ESQ, the results indicated a leadership style
characterized by low Self-awareness, emotional resilience, intuitiveness and
consentiousness; and medium score on motivation. On AQ, the results indicated a
leadership style characterized by low score on ambidexterity and medium score on
loosening dimension.
When the leadership behaviors were mapped onto three leadership styles namely:
Complexity Leadership (CL), Involving Leadership (IL) and Goal-Oriented
Leadership (GL), the results portrayed a typical leadership style that was long on goal-
leadership but short on both involving and complexity leadership. Generally, project
team members surveyed identified six key project leadership behaviors that inhibited
their delivery, namely: rigidity to standards and lack of flexibility; poor people skills;
indecisiveness and delayed decision making; poor stakeholder management; poor
schedule management, and dictatorial tendencies.
This study confirmed that leadership competencies affect project success and
organizational outcomes. Based on their correlation strengths, the study identified
managing resources, conscientiousness, achieving, motivation and developing, in that
order, as the most important leader behaviors that affected process success. Leadership
behaviors that significantly correlated with process success were distinct from those
that correlated significantly with product and organizational success. Based on the
findings of this study, leadership which is characterized by high strategic perspective
and loosening was most likely to achieve both product and organizational success.
146
Whereas the individual behaviors within the adaptive leadership dimension did not
portray a significant relationship with process success, they did have when combined.
And with the loosening behavior having had a significant positive relationship with
product and organizational success, adaptive leadership was the only leadership
dimension that had significant relationship with all the dimensions of project success.
In the absence of project leadership, human behavior was found to have the highest
predictive power on success of public infrastructural megaprojects. However, when
project leadership was introduced into the model linking complexity with project
success, project leadership became the dominant determinant of project success and
completely eclipsed human behavior from the final regression results. However, the
interaction effect of project leadership with ambiguity, and with system behavior
remained significant. This implies that leadership is not only a key determinant of
project success but also mediates the effect of human behavior on success of public
infrastructural megaprojects. Complexity alone explained 58.3% of the variability in
project success but when the project leadership was introduced into the model, its
explanatory power shot to 72.7%. The success rate was enhanced as the project
leadership style tended to that of complexity leadership.
5.3 Conclusions
This study sought to investigate the influence of project complexity on success of
public infrastructural megaprojects in Kenya. Having reviewed the literature on project
complexity, leader behavior and megaproject success, a conceptual framework was
developed consisting of three main causes of complexity as independent variables,
leader behavior as the moderating variable and megaproject success as the dependent
variable. A census survey of 31 completed public infrastructural megaprojects was
conducted with 124 respondents comprising 31 project managers, 62 project team
members and 31 project sponsors. Three separate but interlinked questionnaires were
used to collect data on the projects’ complexity, leader behavior and success. The
conclusion were drawn based on the findings and summarized as per the study
objectives.
147
Objective 1: To Determine the Influence of Human Behavior on Success of Public
Infrastructural Megaprojects
From the findings, it was concluded that human behavior had significant negative
influence on success of public infrastructural megaprojects. Individual behavior, group
behavior and organizational design and development, all had significant but negative
correlation with process success. However, only organizational design and
development had significant correlation with product success.
Optimism bias was the main individual behavior that led to cost and schedule
underperformance in infrastructural megaprojects but loss aversion was the most
occurring cognitive bias. Projects in which the project manager had near total authority
over resources had more stable outcomes compared to those in which the project
manager had weaker authority.
Stakeholder satisfaction was not managed as a key project objective and in some cases
it was considered as a front-end activity that was only important during project
planning. Despite the rapid change, uncertainty, dependency and emergence that
characterize public infrastructural megaprojects, implementation of these projects
assumed a culture that was characterized by stability and internal focus.
Objective 2: To Determine the Influence of Ambiguity on Success of Public
Infrastructural Megaprojects
The study established that ambiguity had significant negative influence on process
success but had no significant relationship with product or organizational success.
There was significant relationship between emergence and uncertainty and
differentiating the effect of each on project outcomes could be difficult given this
interrelationship. Infrastructural megaprojects majorly utilized FFP and FP-EPA
contracts. Even though these contract types led to increased chances of delivery within
budget, they carried with them an inherent risk of delivery behind schedule. Inclusion
of late delivery penalties in these contracts could help remedy the risk of schedule
slippage.
148
Projects in which the client assumed responsibility for cost and schedule risk had
higher chances of meeting both cost and schedule objectives than those transferring or
sharing this risk. Transferring or sharing project risk increased chances of achieving
cost objective but greatly reduced the chances of meeting schedule objective.
Objective 3: To Determine the Influence of System Behavior on Success of Public
Infrastructural Megaprojects
On the whole, system behavior had significant negative influence on success of public
infrastructural megaprojects. However, the individual constructs of system behavior
had mixed influence on project success. System connectedness was associated with
project outcomes in such a way that the more the number of connections, the lower
was the cost and schedule performance. The number of dependencies in a project were
associated with project outcomes in such a way that increased dependencies improved
cost and schedule performance except for case of the number of dependencies in the
critical path.
Objective 4: To Explore the Moderating Effect of Project Leadership on
Complexity and Success of Public Infrastructural Megaprojects
When the three dimensions of complexity were combined into a single model, human
behavior and system behavior had significant negative influence on success of public
infrastructural megaprojects. However, ambiguity was not significant in this combined
model. When project leadership was introduced into this combined model, human
behavior completely ceased to explain success but the interaction effect of project
leadership with ambiguity and system behavior remained significant.
Thus, it was concluded that project leadership had significant mediating effect on
human behavior and success of public infrastructural megaprojects; but had significant
moderating effect on ambiguity and system behavior, and success of public
infrastructural megaprojects. Project leadership was the dominant determinant of
project success in such a way that it explained the relationship between human
behavior and success but it influenced the relationship between ambiguity and system
149
behavior on success of public infrastructural megaprojects. Project leadership was
positively and significantly correlated with project management success. Strategic
perspective and loosening were the specific leadership behaviors that had positive and
significant relationship with product and organizational success. Thus, focusing on the
project management process may not necessarily assure product and organizational
success. In practice, project leadership was more goal-oriented than adaptive.
5.4 Recommendations
These recommendations were drawn from the conclusions presented in section 5.3.
The recommendations are presented at two levels with the first level being
recommendations for policy and practice and the second level being recommendations
for future research and academia.
5.4.1 Recommendations for Policy and Practice
Since project leadership was shown to dominate over the influence of human behavior
on success of public infrastructural megaprojects, the traditional approach to project
leadership and decision-making that is generally characterized by discharge of
intellectual, managerial and emotional and social behaviors, needs to be broadened in
order to form a new perspective based on complexity science. Such new perspective
to leadership should allow for generative behaviors such as loosening, ambiguity
acceptance and ambidexterity so as to enable project teams to respond effectively to
the adaptive pressure, dependency, uncertainty, rapid change and emergence that
generally characterize the context of public infrastructural megaprojects.
To achieve this shift in leadership perspective, it is recommended that implementing
organizations utilize structures that: allow project managers sufficient authority over
project resources; allow for stakeholder satisfaction to be managed as a key project
objective; allow for transparency in the manner in which organizations make project
decisions; ensure right people with the necessary skills and competences as well as the
tools, techniques or resources support the project; encourage innovation, creativity,
150
learning and attainment of process maturity; and ensure continued business case
justification to assure that the project is and remains viable, desirable and achievable.
Whereas focus on process and activity is important for project management success,
project implementation should focus on products in order to achieve both product and
organizational success. Projects are a means of operationalizing and delivering
organizational strategic objectives and so a functional project portfolio management
process should exist to ensure that only projects whose products contribute to
organizational success are selected for implementation. During implementation, a
clear focus on products should be maintained to ensure fidelity to the baselines.
Effective implementation of this recommendation requires that implementing and
sponsoring organizations: put in place an effective change management and control
system with clearly defined change authority; manage projects in stages with a clear
benefits realization approach; proactively manage stakeholder satisfaction as a key
project objective; adopt a planning approach that allows for progressive elaboration in
project scope; develop, document and deploy clear product descriptions, quality
requirements and their related acceptance criteria and methods.
Design of infrastructural megaprojects should recognize that transferring risk to the
contractor (as in the use of Fixed Price contracts) offers no real protection for the client
because the client is always accountable for cost, time, quality and safety. Given that
projects in which the client assumed responsibility for cost and schedule risk had
higher chances of meeting both cost and schedule objectives than those transferring or
sharing this risk, and since the parties involved in the project may prefer different
actions because of their different risk preferences, it is recommended that public
infrastructural megaprojects consider utilizing outcome-based contracts as opposed to
behavior-based contracts.
5.4.2 Recommendations for Further Research
As pointed out in normative literature, project management talent is 3-dimensional.
These dimensions are technical project management, strategic and business
151
management, and leadership. Since leadership skills have been shown to be the most
important for successful navigation of complexity, this study recommends that future
research focuses on determining the relative importance of the other two dimensions-
technical project management and strategic and business management-in determining
the success of public infrastructural megaprojects.
Given the overwhelming number of projects that utilized fixed price contracts, a more
elaborate study is required to convince project planners, sponsors and implementers of
public infrastructural megaprojects in Kenya that outcome-based contracts deliver
superior project performance than behavior-based contracts.
152
REFERENCES
Ahiaga-Dagbui, D.D., Love, P.E.D., Smith, S.D., & Ackermann, F. (2017). Toward a Systemic View to Cost Overrun Causation in Infrastructure Projects: A Review and Implications for Research. Project Management Journal, 48(2), 88-98.
Aiken, L. S., & West, S. G. (1991). Multiple regression: Testing and interpreting
interactions. Newbury Park: Sage.
Altshuler, A., & Luberoff, D. (2003). Megaprojects: The Changing Politics of Urban
Public Investment. Washington, DC: Brookings Institution. Ariely, D. (2008). Predictably Irrational: The Hidden Forces That Shape our
Decisions. New York, USA: Harper Collins Publishers.
Atkinson, R. (1999). Project management: Cost, time and quality, two best guesses and a phenomenon, it is time to accept other success criteria. International
Journal of Project Management, 17(6), 337-342.
Axelos Limited. (2017). Managing Successful Projects with PRINCE2® (6th ed.). United Kingdom: TSO, ISBN: 9780113315338.
Baccarini, D. (1999). The logical framework method of defining project success. Project Management Journal, 30(4), 25-32.
Baccarini, D. (1996). The concept of project complexity: a review. International
Journal of Project Management, 14(4), 201-214. Bain & Company. (2013). Management Tools & Trends. Boston, Massachusetts: Author. Bank Information Center (BIC). (2008). World Bank announces withdrawal from
Chad- Cameroon Pipeline after early repayment. Retrieved from http://www.bicusa.org/en/Article.3892.aspx (JS2). Bannermann, P.L. (2008). Defining project success: A multilevel framework. In Proceedings of the PMI Research Conference (pp. 1-14). Newton Square, PA: Project Management Institute.
Baron, R., & Kenny, D. (1986). The moderator-mediator variable distinction in social psychological research: Conceptual, strategic, and statistical considerations. Journal of Personality and Social Psychology, 51(6), 1173- 1182. Bass, B.M. (1995). Bass and Stogdill’s handbook of leadership-theory, research and
management applications. New York: Free Press.
153
Bass, B.M., Avolio, B.J., Jung, D.I., & Berson, Y. (2003). Predicting unit performance by assessing transformational and transactional leadership. Journal of Applied Psychology, 88(2), 207-218. Baumeister, R. F. & Bushman, B. J. (2010). Social psychology and human nature
(International Edition). Belmont, USA: Wadsworth.
Beck, U. (1992). Risk society: Towards a new modernity. New York, NY: Sage. Beck, U., Giddens, A., & Lash, S. (1994). Reflexive modernization: Politics,
tradition and aesthetics in the modern society. Cambridge, England: Polity Press. Blaskovics, B. (2014, November). Impact of leadership styles on project success– The case of a multinational company. Dynamic Relationships
Management Journal, 3 (2), 21‐36. Bless, H., Fielder, K., & Strack, F. (2004). Social Cognition: How Individuals
Construct Social Reality. New York, USA: Psychology Press. Brady, T., & Davies, A. (2014). Managing Structural and Dynamic Complexity: A Tale of Two Projects. Project Management Journal, 45(4), 21-38. Bruzelius, N., Flyvbjerg, B., Rothengatter, W. (2002). Big decision, big risks. Improving accountability in mega projects. Transport Policy, 9(2), 143–154. Bryman, A., & Bell, E. (2007). Business Research Methods (2nded.). New York, USA: Oxford University Press Inc., p. 55. Burch, P., & Carolyn, H. J. (2016). Mixed Methods for Policy Research and
Program Evaluation. Thousand Oaks, CA: Sage.
Burns, T., & Stalker, G. (1961). The Management of Innovation. London: Tavistock.
Caldart, A. A., & Joan, E. R., (2004). Corporate Strategy Revisited: A View from Complexity Theory. European Management Review, 1(1), 10-15. Cantarelli, C.C., Flyvbjerg, B., van Wee, B., & Molin, E.J.E. (2010). Lock-in and its influence on project performance of large-scale transportation infrastructure projects: Investigating the way in which lock-in can emerge and affect cost overruns. Environment and Planning: Planning and Design, 37, 792-807.
Cao, Q., & Hoffman, J.J. (2011). A case study approach for developing a project performance evaluation system. International Journal of Project
Management, 29(2), 155-164.
154
Carver, S., & Maylor, H. (2011). Fear of flying. In T. Cooke-Davies, L. Crawford, &
C. Stevens, (Eds.), Aspects of complexity: Managing projects in a complex
world, (p. 57-72). Newton Square: Project Management Institute.
Chandler, A. D., Jr. (1962). Strategy and structure: Chapters in the history of the
industrial enterprise. Cambridge, MA: MIT Press.
Charles, S. (2009). For a humanism amid hypermodernity: From a society of knowledge to a critical knowledge of society. Axiomathes, 19(4), 329-400.
Chen, G., Donahue, L.M., & Klimoski, R. (2004). Training Undergraduates to Work in Organizational Teams. Academy of Management Learning & Education,
3(1), 27-40.
Chia, R. (1995). From modern to postmodern organizational analysis. Organizational
studies, 16(4), 579-604. Collyer, S. (2016). Culture, Communication, and Leadership for Projects in Dynamic Environments. Project Management Journal, 47(6), 111–125.
Connelly, L. M. (2008). Pilot studies. Medsurg Nursing, 17(6), 411-412. Cooke-Davies, T. (2002). The real success factors on projects. International Journal
of Project Management, 20(3), 185-190. Cooke-Davis, T. (2011). Complexity in Project Management and the Management of Complex Projects. In T. Cooke-Davis, L. Crawford, & C. Stevens (Eds.), Aspects of Complexity: Managing projects in a complex world (pp. 1-13). Pennsylvania, USA: Project Management Institute. Cooke-Davies, T., Crawford, L., & Stevens, C. (Eds.). (2011). Aspects of
Complexity: Managing projects in a complex world. Pennsylvania, USA: Project Management Institute. Crainer, S. (1998). Key Management Ideas: Thinkers That Changed the Management
World (3rd ed.). Financial Times, Prentice Hall.
Cronbach, L.J. (1951). Coefficient alpha and the internal structure of tests. Psychometrika, 16(3), 297-334. Dansereau, F., Yammarino, F.J., & Kohles, J. (1999). Multiple levels of analysis from a longitudinal perspective: Some implications for theory building. Academy of Management Review, 24(2), 346-357. Dery, R. (2009). La modernite. Montreal, QC, Canada: JFD. de Wit, A. (1988). Measurement of Project success. Project Management Journal,
6(3), 164-170.
155
Doloi, H. (2013). Cost Overruns and Failure in Project Management: Understanding
the Roles of Key Stakeholders in Construction Projects. Journal of
Construction Engineering and Management, 139, 267-279.
Donaldson, L. (2001). The contingency theory of organizations. Thousand Oaks, CA:
Sage.
Drummond, H. (1998). Is escalation always irrational? Organizational Studies, 919- 929. Duimering, P.R., Ran, B., Derbentseva, N., & Poile, C. (2006). The Effects of Ambiguity on Project Task Structure in New Product Development, Knowledge and Process Management, 13(4), 239-251.
Dulewicz, V., & Higgs, M. (2005). Assessing leadership styles and organizational context. Journal of Managerial Psychology, 20(2), 106-123. Eisenhardt, K.M. (1989). Agency theory: An assessment and review. Academy of
Management Review, 14(1), 57-74. Flyvbjerg, B. (2014). What You Should Know About Mega Projects and Why: An Overview. Project Management Journal, 45(2), 6-17. Flyvbjerg, B. (2011). Overbudget, over time and over again: Managing major projects. In P. W.G Morris, J. K. Pinto, & J. Soderlund (Eds.), The Oxford
handbook of project management (pp. 321-344). Oxford, England: Oxford University Press. Flyvbjerg, B. (2005). Design by Deception: The politics of mega project approval. Harvard Design Magazine, 22 (Spring/Summer), 50-59. Flyvbjerg, B., Bruzelius, N., & Rothengatter, W. (2003). Mega projects and Risk: An
anatomy of ambition. Cambridge, England: Cambridge University Press. Flyvbjerg, B., Garbuio, B., & Lovallo, D. (2009). Delusion and deception in large infrastructure projects: Two models for explaining and preventing executive disaster. California Management Review, 51(2), 170-193. Flyvbjerg, B., Holm, M.K.S. & Buhl, S.L. (2005). "How (In) accurate Are Demand
Forecasts in Public Works Projects? The Case of Transportation." Journal of
the American Planning Association, 71(2), 131-146.
Flyvbjerg, B., Holm, M.K.S., & Buhl, S.L. (2004). What causes cost overrun in transport infrastructure projects? Transport Reviews, 24 (1), 3-18. Flyvbjerg, B., Holm, M.K.S., & Buhl, S.L. (2002). Underestimating costs in public works projects: Error or lie? Journal of American Planning Association,
68(3), 279-295.
156
Gauthier, J-B., & Ika, L.A. (2012). Foundations of Project Management Research: An Explicit and Six-facet Ontological Framework. Project Management
Journal, 43(5), 5-23. Geoghegan, L., & Dulewicz, A. (2008). Do project manager’s leadership competencies contribute to project success? Project Management Journal,
39(4), 58-67. George, S., & Thomas, J. (2010). Deconstructing the quest for value: Language games of organizational investment. Proceedings at the 5th Making Projects
Critical Workshop. Bristola, UK. Geraldi, J.G. (2008). The balance between order and chaos in multi-project firms: a conceptual model. International Journal of Project Management, 26(4), 348- 356. Geraldi, J., Maylor, H., & Williams, T. (2011). Now, let's make it really complex (complicated): A systematic review of the complexities of projects. International Journal of Operations & Production Management, 31(9), 966 – 990. Ghosh, P., Williams, D., Askew, P., & Mulgund, V. (2012). Organizations and leaders make or break projects. Energy Perspectives, (Summer), 20-27.
Giddens, A. (1990). The consequences of modernity. Stanford, CA: Stanford University Press. Goldkuhl, G. (2012). Pragmatism vs interpretivism in qualitative information systems research. European Journal of Information Systems, 21(2), 135-146. Government of Kenya. (2013). Second Medium Term Plan, 2013-2013. Kenya Vision 2030: Author. Green, J.R. (November, 1997). Team Building in Practice. Chartered Secretary, 34- 5.
Gujarati, D. N., & Porter, D.C. (2009). Basic Econometrics (5th ed.). USA, NY: McGraw Hill International. Hagen, M., & Park, S. (2013). Ambiguity Acceptance as a Function of Project Management: A new Critical Success Factor. Project Management Journal,
44(2), 52-66.
Hair, J.F., Babin, B., Money, A., & Samouel, P. (2003). The essentials of business
research methods. London: Wiley.
157
Hair, J.F., Anderson, R.E., Tatham, R.L., & Black, W. C. (1998). Multivariate data
analysis. Englewood Cliffs, NJ: Prentice Hall. Hallgren, M., & Maaninen-Olsson, E. (2005). Deviations, ambiguity and uncertainty in project intensive organization. Project Management Journal, 36(3), 17-26.
Haselton, M.G., Nettle, D., & Andrews, P.W. (2015). The Evolution of Cognitive Bias. In D. M. Buss (Ed.), The handbook of Evolutionary Psychology (p. 724-746). USA: John Wiley & Sons Inc. Hassan, M.M., Bashir, S., & Abbas S.M. (2017). The Impact of Project Managers’ Personality on Project Success in NGOs: The Mediating Role of Transformational Leadership. Project Management Journal, 48(2), 74-87 Hauschildt, J., Gesche, K., & Medcof, J. (2000). Realistic criteria for project managers. Selection and Development, 31(3), 23-32. Hayes, S., & Bennet, D. (2011). Managing projects with high complexity. In T. Cooke- Davies, L. Crawford, & C. Stevens, (Eds.), Aspects of Complexity:
Managing Projects in a Complex World (pp. 17-25). Pennsylvania, USA: Project Management Institute. Heifetz, R.A. (1994). Leadership without easy answers. Cambridge, MA: Belknap Press. Higgs, M., & Rowland, D. (2003). Is change changing? An Examination of Approaches to Changes and its leadership, Henley Working paper series, HWP 2003/13. Hirschman, A.O. (1995). Development projects observed (2nd ed.). Washington, D.C: Brookings Institution. Hodgson, D., & Cicmil, S. (2006). Are projects real? The PMBOK and the legitimation of project management knowledge. In D. Hodgson & S. Cicmil (Eds.), Making projects critical (pp. 29-50). New York, NY: Palgrave. Hoegl, M., & Gemuenden, H.G. (2001). Team work quality and the success of innovative projects: A theoretical concept and empirical evidence. Organization Science, 12(4), 435-449.
Holste, J.S., & Fields, D. (2010). Trust and Tacit Knowledge Sharing and Use. Journal of Knowledge Management, 14(1), 128-140. Ika, L.A. (2009). Project success as a topic in project management journals. Project
Management Journal, 40(4), 6-19.
International Rivers. (2012). Bujagali Dam, Uganda. Retrieved from http://www.internationalrivers.org/campaigns/bujagali-dam-uganda.
158
Jensen, M., & Meckling, W. (1976). Theory of the firm: Managerial behavior, agency costs, and ownership structure. Journal of Financial Economics, 3, 305-360.
Joffre, P., Auregan, P., Chedotel, F., & Tellier, A. (2006). Le management
strategique par projet. Paris, France: Editions Economica.
Johannessen, S., & Stacey, R.D. (2005). Technology as a social object: A complex responsive processes perspective. In R.D. Stacey (Ed.), Experiencing
emergence in organizations: Local interaction and emergence of global
patterns. London, UK: Routledge. Jugdev, K., & Muller, R. (2005). A retrospective look at our evolving understanding of project success. Project Management Journal, 36(4), 19-31.
Jugdev, K., Thomas, J., & Delisle, C.L. (2001). Rethinking Project Management: Old truths and new insights. Project Management Journal, 7(1), 36-43.
Kahneman, D., & Tversky, A. (1979). Intuitive prediction: biases and corrective procedures. In S. Makridakis, & S. C. Wheelwright (Eds.), Studies in the
Management Sciences: Forecasting, 12. North-Holland, Amsterdam, pp.313–27. Kaliba, C., Muya, M., and Mumba, K. (2008). "Cost escalation and schedule delays in road construction projects in Zambia." International Journal of Project
Management: doi:10.1016/j.ijproman.2008.07.003 Katz, R. L. (1955). Skills of an effective administrator. Harvard Business Review,
33(1), 33-42. Kellert, S. H. (1993). In the Wake of Chaos: Unpredictable Order in Dynamical
Systems. University of Chicago Press. Kenya National Bureau of Statistics. (2016). Economic Survey. Kenya, Nairobi: Author. Kerzner, H. (2008), Project Management-A Systems Approach to Planning,
Scheduling, and Controlling, (10th ed.). John Wiley & Sons Inc. Knight, E. H. (1948). Risk, Uncertainty and Profits (7th ed.). London, England:
London School of Economics and Political Science.
Koutsoyiannis, A. (1992). Theory of Econometrics (2nd ed.). Hong Kong: Macmillan
Education.
Kouzes, J. M., & Posner, B. Z. (2007). The Leadership Challenge. (4th. ed.) San Francisco, CA. Wiley.
159
Kozak-Holland, M. (2011). The history of project management. Oshawa, ON, Canada: Multi-Media Publications.
Kusek, J.Z., & Rist, R.C. (2004). Ten Steps to a Results-Based Monitoring and
Evaluation System. Washington DC, USA: The World Bank
Lewin, R. (1963). Complexity: Life at the edge of chaos. London: Phoenix.
Likert, R. (1931). A technique for the measurement of attitudes. Archive of
psychology, 22(140), 1-55.
Liu, L., & Leitner, D. (2012). Simultaneous Pursuit of Innovation and Efficiency in Complex Engineering Projects-A Study of the Antecedents and Impacts of Ambidexterity in Project Teams. Project Management Journal, 43(6), 97- 110.
Livari, J., & Huisman, M. (2007). The Relationship Between Organizational Culture and the Deployment of Systems Development Methodologies. MIS
Quarterly, 31(1), 35-58.
Loch, C.H., De Meyer, A., & Pich, M.T. (2006). Managing the unknown: A new
approach to managing high uncertainty and risk in projects. Hoboken, NJ: John Wiley and Sons.
Lord, R.G. (2008). Beyond transactional and transformational leadership: Can leaders still lead when they do not know what to do? In M. Uhl-Bien and R. Marion (Eds.), Complexity leadership, Part 1: Conceptual foundations
(pp.155-184). Charlotte, NC: Informative Age Publishing.
Lovallo, D., & Kahneman, D. (2003). Delusions of success, how optimism undermines executives’ decisions.Harvard Business Review, 81 (7), 57– 63.
Love, P.E.D., Sing, C.-P., Wang, X., Irani, Z., & Thwala, D.W. (2012). Overruns in Transportation Infrastructure Projects. Structure and Infrastructure
Engineering, 10(1), 141-159.
Lucas, T. (2009). Quantifying complexity. Website. www.calresco.org/lucas/quantify.htm. March 2015.
Luthans, F. (2002). Organizational Behavior (9th ed.). New Delhi, India: McGraw-Hill.
Mackie, P., & J. Preston (1998). "Twenty-one sources of error and bias in transport project appraisal." Transport Policy, 5(10), 1-7.
160
Marion, R., & Uhl-Bien, M. (2007). Paradigmatic influence and leadership: The perspectives of complexity theory and bureaucracy theory. In J.K. Hazy, J. Goldstein, and B. Lichtenstein (Eds.), Complex systems leadership theory (143- 159). USA, New York: ISCE Publishing.
Marion, R., & Uhl-Bien, M. (2003). Complexity theory and al-Qaeda: Examining complex leadership. Emergence: A journal of complexity issues in
organizations and management, 5, 56-78. Marion, R., & Uhl-Bien, M. (2001). Leadership in complex organizations. The
Leadership Quarterly, 12, 389-418. Marion, R. (1999). The Edge of Organization: Chaos and Complexity Theories of
Formal Social Organization. Newbury Park, CA: Sage, ISBN 0761912657
Markus, M.L., & Mao, J.Y. (2004). Participants in development and implementation- Updating an old tired concept for today’s IS contexts. Journal of the
Association for Information Systems, 5(11-12), 514-544.
Maurer, I. (2010). How to Build Trust in Inter-organizational Projects: The Impact of Project Staffing and Project Rewards on the Formation of Trust, Knowledge Acquisition and Product Innovation. International Journal of Project
Management, 28(7), 629-637.
Maylor, H., Vidgen, R., & Carver, S. (2008). Managerial Complexity in Project based Operations: A grounded model and its implications for practice. Project Management Journal, 39(1), 15-26.
Mckelvey, B. (2008). Emergent strategy via complexity leadership: Using complexity science and adaptive tension to build distributed intelligence. In
M. Uhl-Bien and R. Marion (Eds.), Complexity leadership, Part 1:
Conceptual foundations (pp.225-268). Charlotte, NC: Informative Age Publishing.
McLeod, L., Doolin, B., & MacDonell, G. S. (2012). A Perspective-Based Understanding of Project Success. Project Management Journal, 43(5), 68- 86.
Meyer, W. G. (2014). The Effect of Optimism Bias on the Decision to Terminate Failing Projects. Project Management Journal, 45(4), 7-20.
Miles, M.B., & Huberman, AM. (1994). Qualitative Data Analysis (2nd ed.). Thousand Oaks, CA: Sage Publications.
Morieux, Y. (2011). Smart Rules: Six ways to get people to solve problems without you. Harvard Business Review, 89(9), 78-86.
161
Morris, S. (1990). Cost and Time Overruns in Public Sector Projects. Economic and
Political Weekly, 15, 154-168.
Muller, R., & Turner, R. (2010). Leadership competency profiles of successful project managers. International Journal of Project Management, 28(5), 437- 448.
Mullins, J.L. (2007). Management and Organization Behavior (8th ed.). England: Prentice Hall.
Mumford, M.D., Zaccaro, S.J., Harding, F.D., Jacobs, T.O., & Fleishman, E.A. (2000). Leadership skills for a changing world: Solving complex social problems. Leadership Quarterly, 11(1), 11-35. Neuman, W.L. (2003). Social research methods: Qualitative and quantitative
approaches, (5th ed.). Upper Saddle River, NJ: Pearson Education.
Northouse, P. G. (2016). Leadership Theory & Practice (7th ed.). London, Great Britain: Sage.
Nunnally, J.C. (1978). Psychometric Theory (2nded.) New York, NY: McGraw-Hill.
O’Brien, R.M. (2007). A Caution Regarding Rules of Thumb for Variance Inflation Factors. Quality and Quantity, 41(5), 673-690.
Odeck, J. (2004). Cost Overruns in Road Construction: What are their sizes and determinants? Transport Policy, 11(1), 43-53.
O’Donnell, J.G. (2010). A study of the relationships among project managers’
leadership practices, project complexity, and project success. East Eisenhower Parkway, USA: UMI Dissertation Publishing. Olaniran, O.J., Love, P.E.D., Edwards, D., Olatunji, O.A., & Mathews, J. (2015). Cost Overruns in Hydrocarbon Megaprojects: A Critical Review and Implications for Research. Project Management Journal, 46(6), 126-138.
Olsen, E. E., Glenda, H. E., Richard, B., & Peter, V. (2001). Facilitating
Organization Change: Lessons from Complexity Science. San Francisco: Pfeiffer.
Omonyo, B.A. (2015). Lectures in Project Monitoring and Evaluation for
Professional Practitioners. Deutschland, Germany: LAP Lambert Academic Publishing. ISBN: 978-3-659-62815-3.
Packendorff, J., Crevani, L., & Lindgren, M. (2014). Project leadership in Becoming: A Process Study of an Organizational Change Project. Project Management
Journal, 45(3), 5-20.
162
Packendorff, J. (1995). Inquiring into Temporary Organization: New Directions for Project Management Research. Scandinavian Management Journal, 11(4), 319-333. Papadopoulos, T., Ojiako, U., Chipulu, M., & Lee, K. (2012). The Criticality of Risk Factors in Customer Relationship Management Projects. Project
Management Journal, 43(1), 65-75. Pinto, J. K., & Slevin, D.P. (1988a). Project Success: Definition and Measurement Techniques. Project Management Journal, 19, 67-71. Pinto, J. K., & Slevin, D.P. (1988b). Critical Success Factors in Effective Project Implementation. In D. I. Cleland & W.R. King (Eds.), Project Management
Handbook, (2nd ed., pp. 479-512). New York: Van Nostrand Reinhold. Pinto, J. K., & Slevin, D.P. (1986). The Project Implementation Profile: New Tools for Project Managers. Project Management Journal, 17(4), 57-70.
Pisarski, A., Chang, A., Ashkanasy, N., Zolin, R., Mazur, A., Jordan, P., & Hatcher, C.A. (2011). The contribution of leadership attributes to large scale, complex project success. In 2011 Academy of Management Annual Meeting
Proceedings, Academy of Management, San Antonio, Texas. Price Waterhouse Coopers (PwC). (2012). Insights and Trends: Current Portfolio, Program, and Project Management Practices. The third global survey on the
current state of project management. Author. Project Management Institute. (2014). Navigating Complexity: A Practice Guide. Pennsylvania, USA: Author.
Project Management Institute. (2013a). Pulse of the Profession™ In-Depth Report. Pennsylvania, USA: Author.
Project Management Institute. (2013b). Project Management Talent Gap Report. Pennsylvania, USA: Author.
Project Management Institute. (2013c). A Guide to the Project Management Body of
Knowledge (5th ed.). Pennsylvania, USA: Author. Project Management Institute. (2011). Practice Standard for Project Estimating. Pennsylvania, USA: Author. Remington, K., & Pollack, J. (2011). Tools for complex projects. In T. Cooke- Davies, L. Crawford, & C. Stevens, (Eds.), Aspects of Complexity: Managing
Projects in a Complex World, (pp. 29-38). Pennsylvania, USA: Project Management Institute.
163
Remington, K., & Zolin, R. (2011). Controlling Chaos? The Value of the Challenges of applying complexity theory to project management. In T. Cooke-Davies, L. Crawford, & C. Stevens, (Eds.), Aspects of Complexity: Managing
Projects in a Complex World, (pp. 115-128). Pennsylvania, USA: Project Management Institute. Sargut, G., & McGrath, R.G. (2011). Learning to live with complexity: How to make sense of the unpredictable and the undefinable in today’s hyperconnected business world. Harvard Business Review, 89(9), 68-75.
Shenhar, A. J., & Dvir, D. (2007a).Reinventing project management: the diamond
approach to successful growth and innovation. Boston, MA: Harvard Business School Press. Shenhar, A.J., & Dvir, D. (2007b). Project management research-The challenge and opportunity. Project Management Journal, 38(2), 93-99.
Shenhar, A.J., Dvir, D., Levy, O., & Maltz, A.C. (2001). Project success: A multidimensional strategic concept. Long Range Planning, 34(6), 699-725.
Shermon, D. (2011). The Impact of Complexity on Project Cost and Schedule
Estimates. In T. Cooke-Davies, L. Crawford, & C. Stevens, (Eds.), Aspects of
complexity: Managing projects in a complex world, (pp. 57-72). Newton
Square: Project Management Institute.
Shore, B. (2008). Systematic Biases and Culture in Project Failure. Project
Management Journal, 39(4), 5-13.
Snowden, D. J., & Boone, M. E. (2007). A Leader’s Framework for Decision Making. Harvard Business Review, 85(11), 68-76.
Sposito, V., Hand, M., & Skarpness, B. (1983). On the Efficiency of Using the Sample Kurtosis in Selecting Optimal Ipestimators. Communications in
Statistics, Simulation and Computation, 12(3), 265-272.
Standish Group. (2006). The chaos report. Retrieved from http://www.sdtimes.com/content/article.aspx?ArticleID=30247 Standish Group. (2009). The chaos report. Retrieved from http://www.standishgroup.com/newsroom/chaos_2009.php Stiglitz, J. (1989). Principal and agent. In J. Eatwell, M. Milgate, & P. Newman (Eds.), The New Palgrave: Allocation, information and markets. New York: W.W. Norton.
Sunindijo, R., Hadikusumo, B., & Ogunlana, S. (2007). Emotional Intelligence and
Leadership Styles in Construction Project Management. Journal of
Management in Engineering, 4(166), 42-59.
164
Surie, G., & Hazy, J.K. (2006). Generative Leadership: Nurturing innovation in complex systems. Emergence: Complexity and organization, 8(4), 13-26.
Swartz, S.M. (2008). Managerial Perceptions of Project Stability. Project
Management Journal, 39(4), 17-32.
Tashakorri, A., & Creswell, W.J. (2007). “The New Era of Mixed Methods.” Journal
of Mixed Methods Research, 1 (1), 3-7. Thomas, G. (2007). Education and Theory: Strangers in Paradigms. Open University Press. Thomas, G., & Fernandez, W. (2008). Success in IT projects: A matter of definition? International Journal of Project Management, 26(7), 733-742.
Thompson, K. N. (2010). Servant-leadership: An effective model for project management. A Dissertation Presented in Partial Fulfillment of the
Requirements for the Degree Doctor of Philosophy, Capella University. Thompson, J.D. (1967). Organizations in action: social science bases of
administrative theory. New York, McGraw Hill. Toor, S.U.R., & Ogunlana, S.O. (2010). Beyond the “iron triangle”: Stakeholder perception of key performance indicators (KPIs) for large-scale public sector development projects. International Journal of Project Management, 28(3), 228-236.
Turner, J.R. (2007). Project Success and Strategy. In J.R. Turner, & S.J. Simister (Eds.), Gower Handbook of Project Management, (3rd ed.). Aldershot, UK: Gower. Turner, J.R. & Muller, R. (2005).The project manager’s leadership style as a success factor on projects: a literature review. Project Management
Journal, 36(2), 49-61.
Turner, J.R., Zolin, R., & Remington, K. (2009). Modeling success on complex projects: Multiple perspectives over multiple time frames. In Proceedings of
IRNOP. October 11-13, 2009, Berlin, Germany.
Turner, J.R., Huemann, M., Anbari, F.T., & Bredillet, C.N. (2010). Perspectives on
Projects. London, U.K.
Tversky, A., & Kahneman, D. (1974). Judgment Under Uncertainty: Heuristics and Biases. Science New Series, 185(4157), 1124-1131.
Tyssen, A.K., Wald, A., & Spieth, P. (2013). Leadership in Temporary Organizations: A Review of leadership Theories and Research Agenda. Project Management Journal, 44(6), 52-64.
165
Uhl-Bien, M., & Marion, R. (2009). Complexity leadership in bureaucratic forms of organizing: A meso model. The Leadership Quarterly, 20, 631-650.
Uhl-Bien, M., Marion, R., & Mckelvey, B. (2007). Complexity leadership theory: shifting leadership from the industrial age to the knowledge era. The
Leadership Quarterly, 18(4), 298-318. Vanston, J.H., &.Vanston, L. K. (2004). Testing the Tea Leaves: Evaluating the Validity of Forecasts. Research-Technology Management, 47(5), 33-39.
Wachs, M. (1989). When Planners Lie with Numbers. Journal of the American
Planning Association, 55(4), 476-479.
Wachs, M. (1987). Technique vs. advocacy in forecasting: A study of rail rapid transit. Urban Resources, 4(1), pp 23-30 Wagner, J.A., & Hollenbeck, J.R. (2010). Organizational Behavior: Securing
Competitive Advantage. New York: Routledge. Warren, G. B. (1989). Managing the Dream: Leadership in the 21st Century. Journal
of Organizational Change Management, 2(1), 7.
Weiss, J., Donigian, A., & Hughes, J. (2010). Extreme Negotiations: What U.S. Soldiers in Afghanistan Have Learned About the Art of Managing High-Risk, High-Stakes Situation. Harvard Business Review, 88(11), 68-75.
Whitty, S.J., & Schulz, M.F. (2007). The impact of a puritan ideology on aspects of project management. International Journal of Project Management, 25, 10- 20.
Williams, T.M. (1999). The need for new paradigms of complex projects. International Journal of Project Management, 17(5), 269-273.
Yang, J-B., Chu, M-Y., & Huang, K-M. (2013). An Empirical Study of Schedule
Delay Causes Based on Taiwan’s Litigation Cases. Project Management
Journal, 44(3), 21-31.
Yazici, H.J. (2009). The Role of PMM and Organizational Culture in Perceived
Performance. Project Management Journal, 40(3), 14-33.
Yaw, W., Oluwoye, J., & Crawford, L. (2002). Causes of delay and cost overruns in construction of ground water projects in developing countries: Ghana as a case study. International Journal of Project Management, 21(2003), 321- 326.

166
Zhang, J., & Faerman, S. R. (2007). Distributed leadership in the development of a knowledge sharing system. European Journal of Information Systems, 16 (4), 479-494.
Zimmerer, T.W., & Yassin, M.M. (1998). A leadership profile of American project managers. Project Management Journal, 29(1), 31-38.
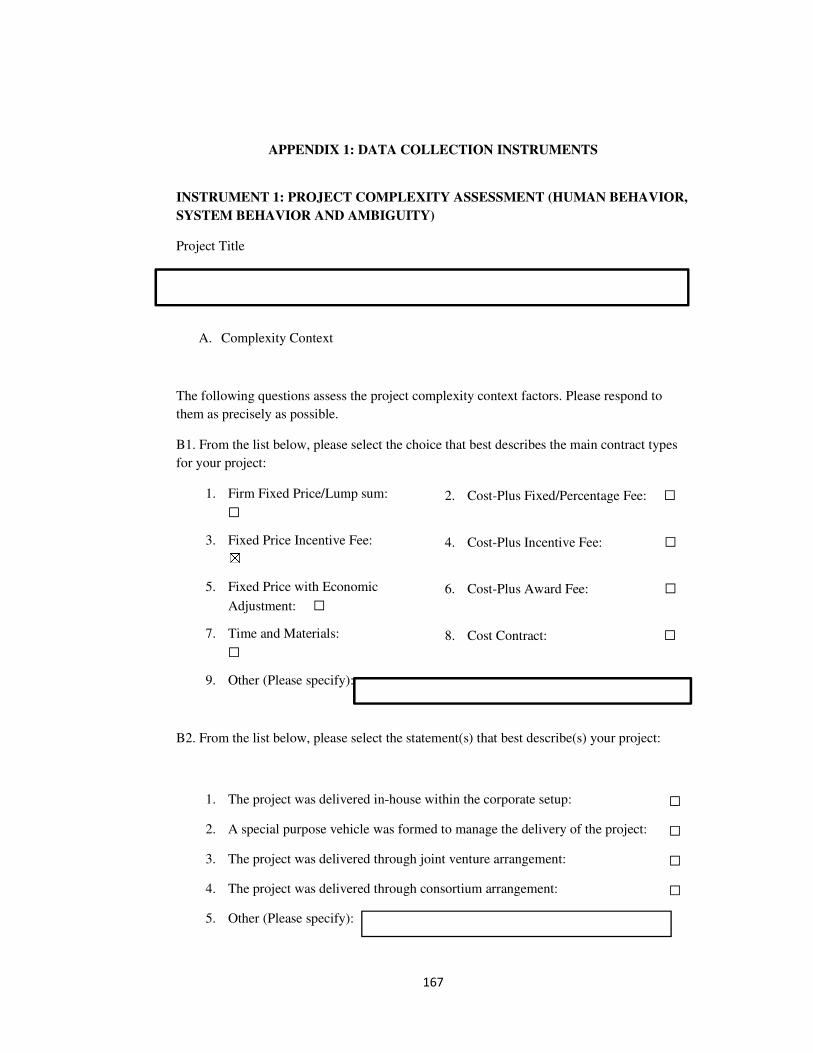
167
APPENDIX 1: DATA COLLECTION INSTRUMENTS
INSTRUMENT 1: PROJECT COMPLEXITY ASSESSMENT (HUMAN BEHAVIOR,
SYSTEM BEHAVIOR AND AMBIGUITY)
Project Title
A. Complexity Context
The following questions assess the project complexity context factors. Please respond to
them as precisely as possible.
B1. From the list below, please select the choice that best describes the main contract types
for your project:
1. Firm Fixed Price/Lump sum:
☐
2. Cost-Plus Fixed/Percentage Fee: ☐
3. Fixed Price Incentive Fee: ☒ 4. Cost-Plus Incentive Fee: ☐
5. Fixed Price with Economic
Adjustment: ☐
6. Cost-Plus Award Fee: ☐
7. Time and Materials:
☐
8. Cost Contract: ☐
9. Other (Please specify):
B2. From the list below, please select the statement(s) that best describe(s) your project:
1. The project was delivered in-house within the corporate setup: ☐
2. A special purpose vehicle was formed to manage the delivery of the project: ☐
3. The project was delivered through joint venture arrangement: ☐
4. The project was delivered through consortium arrangement: ☐
5. Other (Please specify):
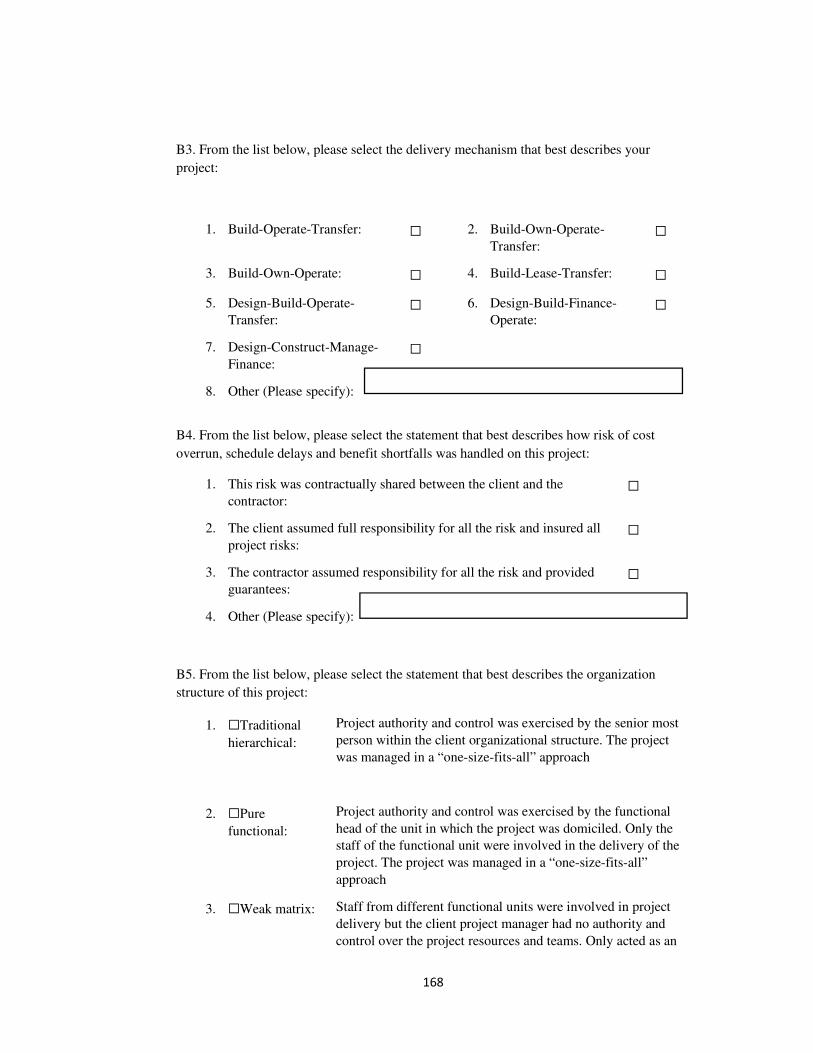
168
B3. From the list below, please select the delivery mechanism that best describes your
project:
1. Build-Operate-Transfer: ☐ 2. Build-Own-Operate-
Transfer: ☐
3. Build-Own-Operate: ☐ 4. Build-Lease-Transfer: ☐
5. Design-Build-Operate-
Transfer: ☐ 6. Design-Build-Finance-
Operate: ☐
7. Design-Construct-Manage-
Finance: ☐
8. Other (Please specify):
B4. From the list below, please select the statement that best describes how risk of cost
overrun, schedule delays and benefit shortfalls was handled on this project:
1. This risk was contractually shared between the client and the
contractor: ☐
2. The client assumed full responsibility for all the risk and insured all
project risks: ☐
3. The contractor assumed responsibility for all the risk and provided
guarantees: ☐
4. Other (Please specify):
B5. From the list below, please select the statement that best describes the organization
structure of this project:
1. ☐Traditional
hierarchical:
Project authority and control was exercised by the senior most
person within the client organizational structure. The project
was managed in a “one-size-fits-all” approach
2. ☐Pure
functional:
Project authority and control was exercised by the functional
head of the unit in which the project was domiciled. Only the
staff of the functional unit were involved in the delivery of the
project. The project was managed in a “one-size-fits-all”
approach
3. ☐Weak matrix: Staff from different functional units were involved in project
delivery but the client project manager had no authority and
control over the project resources and teams. Only acted as an
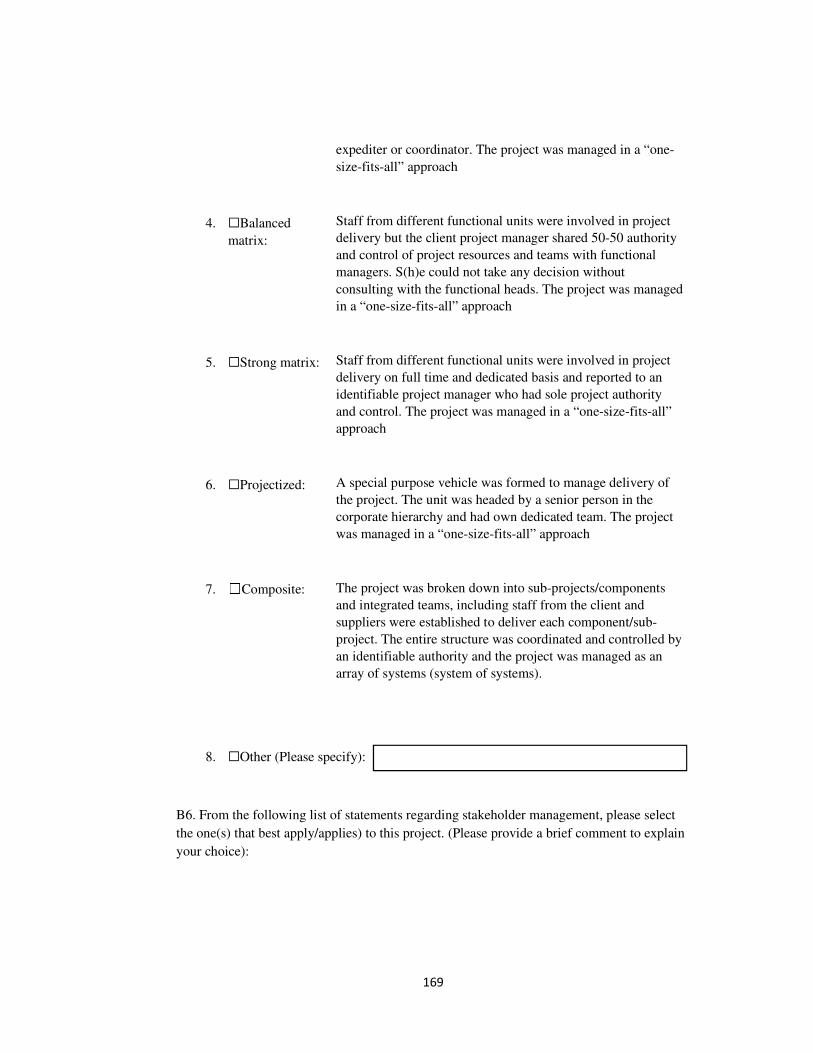
169
expediter or coordinator. The project was managed in a “one-
size-fits-all” approach
4. ☐Balanced
matrix:
Staff from different functional units were involved in project
delivery but the client project manager shared 50-50 authority
and control of project resources and teams with functional
managers. S(h)e could not take any decision without
consulting with the functional heads. The project was managed
in a “one-size-fits-all” approach
5. ☐Strong matrix: Staff from different functional units were involved in project
delivery on full time and dedicated basis and reported to an
identifiable project manager who had sole project authority
and control. The project was managed in a “one-size-fits-all”
approach
6. ☐Projectized: A special purpose vehicle was formed to manage delivery of
the project. The unit was headed by a senior person in the
corporate hierarchy and had own dedicated team. The project
was managed in a “one-size-fits-all” approach
7. ☐Composite: The project was broken down into sub-projects/components
and integrated teams, including staff from the client and
suppliers were established to deliver each component/sub-
project. The entire structure was coordinated and controlled by
an identifiable authority and the project was managed as an
array of systems (system of systems).
8. ☐Other (Please specify):
B6. From the following list of statements regarding stakeholder management, please select
the one(s) that best apply/applies) to this project. (Please provide a brief comment to explain
your choice):
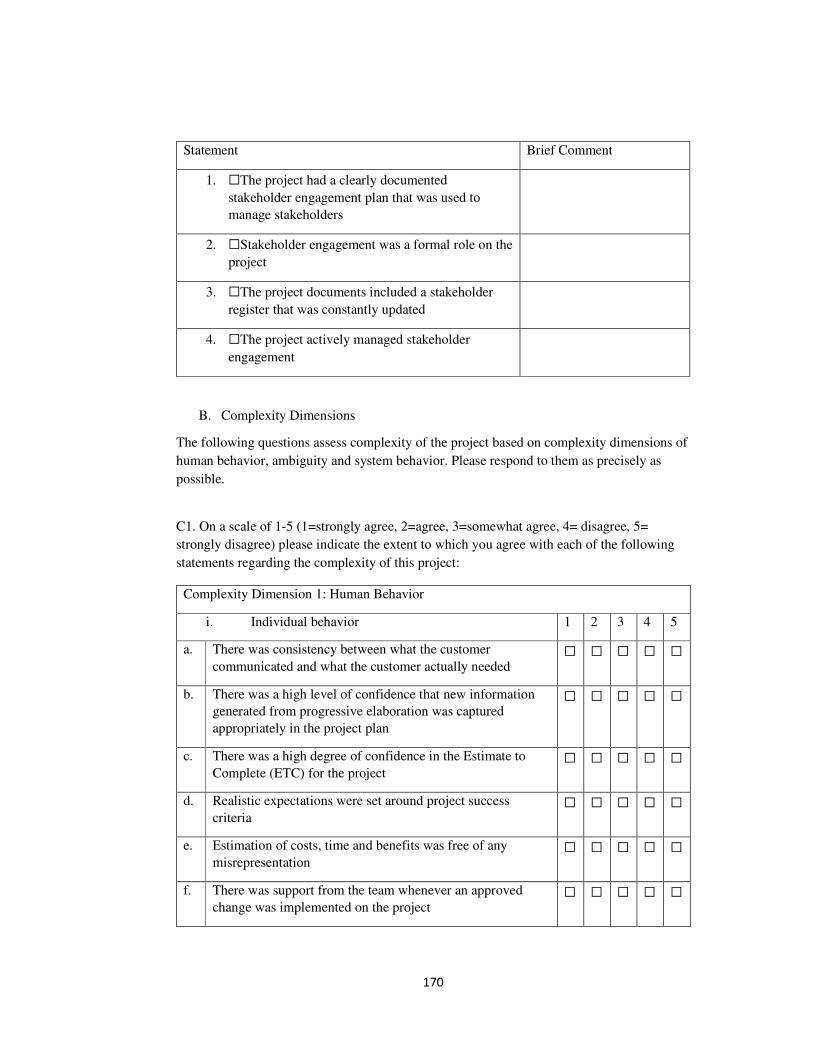
170
Statement Brief Comment
1. ☐The project had a clearly documented
stakeholder engagement plan that was used to
manage stakeholders
2. ☐Stakeholder engagement was a formal role on the
project
3. ☐The project documents included a stakeholder
register that was constantly updated
4. ☐The project actively managed stakeholder
engagement
B. Complexity Dimensions
The following questions assess complexity of the project based on complexity dimensions of
human behavior, ambiguity and system behavior. Please respond to them as precisely as
possible.
C1. On a scale of 1-5 (1=strongly agree, 2=agree, 3=somewhat agree, 4= disagree, 5=
strongly disagree) please indicate the extent to which you agree with each of the following
statements regarding the complexity of this project:
Complexity Dimension 1: Human Behavior
i. Individual behavior 1 2 3 4 5
a. There was consistency between what the customer
communicated and what the customer actually needed ☐ ☐ ☐ ☐ ☐
b. There was a high level of confidence that new information
generated from progressive elaboration was captured
appropriately in the project plan
☐ ☐ ☐ ☐ ☐
c. There was a high degree of confidence in the Estimate to
Complete (ETC) for the project ☐ ☐ ☐ ☐ ☐
d. Realistic expectations were set around project success
criteria ☐ ☐ ☐ ☐ ☐
e. Estimation of costs, time and benefits was free of any
misrepresentation ☐ ☐ ☐ ☐ ☐
f. There was support from the team whenever an approved
change was implemented on the project ☐ ☐ ☐ ☐ ☐
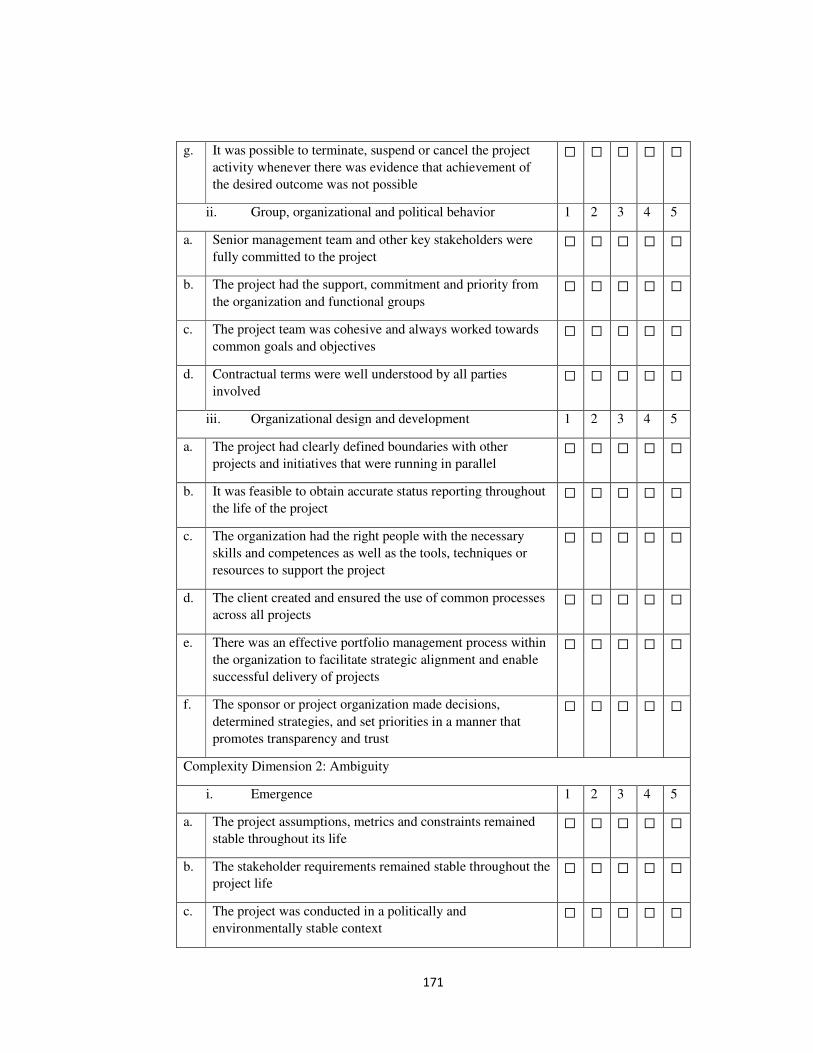
171
g. It was possible to terminate, suspend or cancel the project
activity whenever there was evidence that achievement of
the desired outcome was not possible
☐ ☐ ☐ ☐ ☐
ii. Group, organizational and political behavior 1 2 3 4 5
a. Senior management team and other key stakeholders were
fully committed to the project ☐ ☐ ☐ ☐ ☐
b. The project had the support, commitment and priority from
the organization and functional groups ☐ ☐ ☐ ☐ ☐
c. The project team was cohesive and always worked towards
common goals and objectives ☐ ☐ ☐ ☐ ☐
d. Contractual terms were well understood by all parties
involved ☐ ☐ ☐ ☐ ☐
iii. Organizational design and development 1 2 3 4 5
a. The project had clearly defined boundaries with other
projects and initiatives that were running in parallel ☐ ☐ ☐ ☐ ☐
b. It was feasible to obtain accurate status reporting throughout
the life of the project ☐ ☐ ☐ ☐ ☐
c. The organization had the right people with the necessary
skills and competences as well as the tools, techniques or
resources to support the project
☐ ☐ ☐ ☐ ☐
d. The client created and ensured the use of common processes
across all projects ☐ ☐ ☐ ☐ ☐
e. There was an effective portfolio management process within
the organization to facilitate strategic alignment and enable
successful delivery of projects
☐ ☐ ☐ ☐ ☐
f. The sponsor or project organization made decisions,
determined strategies, and set priorities in a manner that
promotes transparency and trust
☐ ☐ ☐ ☐ ☐
Complexity Dimension 2: Ambiguity
i. Emergence 1 2 3 4 5
a. The project assumptions, metrics and constraints remained
stable throughout its life ☐ ☐ ☐ ☐ ☐
b. The stakeholder requirements remained stable throughout the
project life ☐ ☐ ☐ ☐ ☐
c. The project was conducted in a politically and
environmentally stable context ☐ ☐ ☐ ☐ ☐
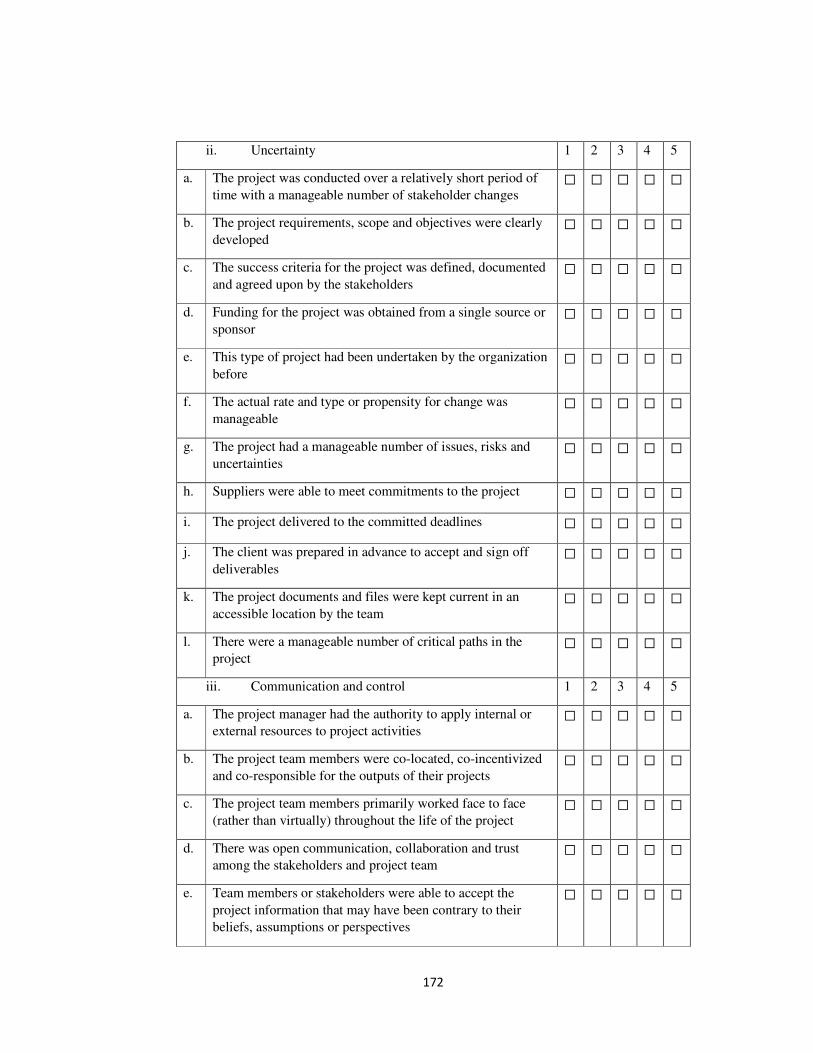
172
ii. Uncertainty 1 2 3 4 5
a. The project was conducted over a relatively short period of
time with a manageable number of stakeholder changes ☐ ☐ ☐ ☐ ☐
b. The project requirements, scope and objectives were clearly
developed ☐ ☐ ☐ ☐ ☐
c. The success criteria for the project was defined, documented
and agreed upon by the stakeholders ☐ ☐ ☐ ☐ ☐
d. Funding for the project was obtained from a single source or
sponsor ☐ ☐ ☐ ☐ ☐
e. This type of project had been undertaken by the organization
before ☐ ☐ ☐ ☐ ☐
f. The actual rate and type or propensity for change was
manageable ☐ ☐ ☐ ☐ ☐
g. The project had a manageable number of issues, risks and
uncertainties ☐ ☐ ☐ ☐ ☐
h. Suppliers were able to meet commitments to the project ☐ ☐ ☐ ☐ ☐
i. The project delivered to the committed deadlines ☐ ☐ ☐ ☐ ☐
j. The client was prepared in advance to accept and sign off
deliverables ☐ ☐ ☐ ☐ ☐
k. The project documents and files were kept current in an
accessible location by the team ☐ ☐ ☐ ☐ ☐
l. There were a manageable number of critical paths in the
project ☐ ☐ ☐ ☐ ☐
iii. Communication and control 1 2 3 4 5
a. The project manager had the authority to apply internal or
external resources to project activities ☐ ☐ ☐ ☐ ☐
b. The project team members were co-located, co-incentivized
and co-responsible for the outputs of their projects ☐ ☐ ☐ ☐ ☐
c. The project team members primarily worked face to face
(rather than virtually) throughout the life of the project ☐ ☐ ☐ ☐ ☐
d. There was open communication, collaboration and trust
among the stakeholders and project team ☐ ☐ ☐ ☐ ☐
e. Team members or stakeholders were able to accept the
project information that may have been contrary to their
beliefs, assumptions or perspectives
☐ ☐ ☐ ☐ ☐
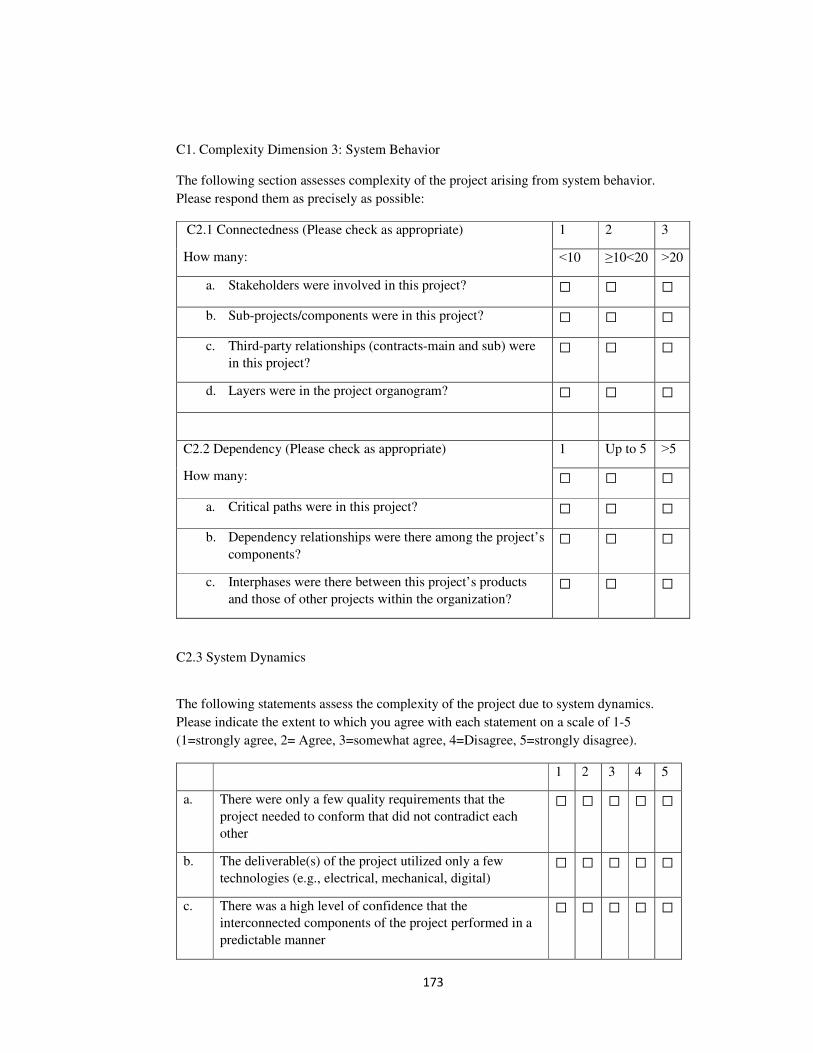
173
C1. Complexity Dimension 3: System Behavior
The following section assesses complexity of the project arising from system behavior.
Please respond them as precisely as possible:
C2.1 Connectedness (Please check as appropriate)
How many:
1 2 3
˂10 ≥10˂20 ˃20
a. Stakeholders were involved in this project? ☐ ☐ ☐
b. Sub-projects/components were in this project? ☐ ☐ ☐
c. Third-party relationships (contracts-main and sub) were
in this project? ☐ ☐ ☐
d. Layers were in the project organogram? ☐ ☐ ☐
C2.2 Dependency (Please check as appropriate)
How many:
1 Up to 5 ˃5
☐ ☐ ☐
a. Critical paths were in this project? ☐ ☐ ☐
b. Dependency relationships were there among the project’s
components? ☐ ☐ ☐
c. Interphases were there between this project’s products
and those of other projects within the organization? ☐ ☐ ☐
C2.3 System Dynamics
The following statements assess the complexity of the project due to system dynamics.
Please indicate the extent to which you agree with each statement on a scale of 1-5
(1=strongly agree, 2= Agree, 3=somewhat agree, 4=Disagree, 5=strongly disagree).
1 2 3 4 5
a. There were only a few quality requirements that the
project needed to conform that did not contradict each
other
☐ ☐ ☐ ☐ ☐
b. The deliverable(s) of the project utilized only a few
technologies (e.g., electrical, mechanical, digital) ☐ ☐ ☐ ☐ ☐
c. There was a high level of confidence that the
interconnected components of the project performed in a
predictable manner
☐ ☐ ☐ ☐ ☐
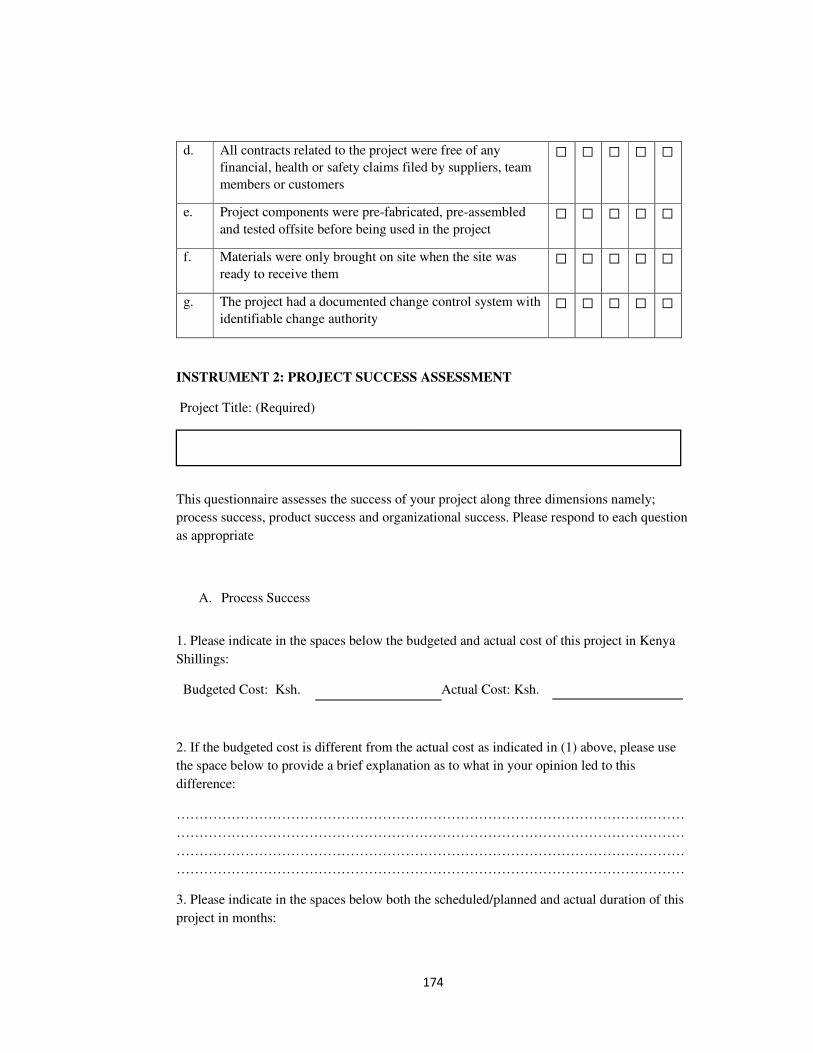
174
d. All contracts related to the project were free of any
financial, health or safety claims filed by suppliers, team
members or customers
☐ ☐ ☐ ☐ ☐
e. Project components were pre-fabricated, pre-assembled
and tested offsite before being used in the project ☐ ☐ ☐ ☐ ☐
f. Materials were only brought on site when the site was
ready to receive them ☐ ☐ ☐ ☐ ☐
g. The project had a documented change control system with
identifiable change authority ☐ ☐ ☐ ☐ ☐
INSTRUMENT 2: PROJECT SUCCESS ASSESSMENT
Project Title: (Required)
This questionnaire assesses the success of your project along three dimensions namely;
process success, product success and organizational success. Please respond to each question
as appropriate
A. Process Success
1. Please indicate in the spaces below the budgeted and actual cost of this project in Kenya
Shillings:
Budgeted Cost: Ksh. Actual Cost: Ksh.
2. If the budgeted cost is different from the actual cost as indicated in (1) above, please use
the space below to provide a brief explanation as to what in your opinion led to this
difference:
…………………………………………………………………………………………………
…………………………………………………………………………………………………
…………………………………………………………………………………………………
…………………………………………………………………………………………………
3. Please indicate in the spaces below both the scheduled/planned and actual duration of this
project in months:
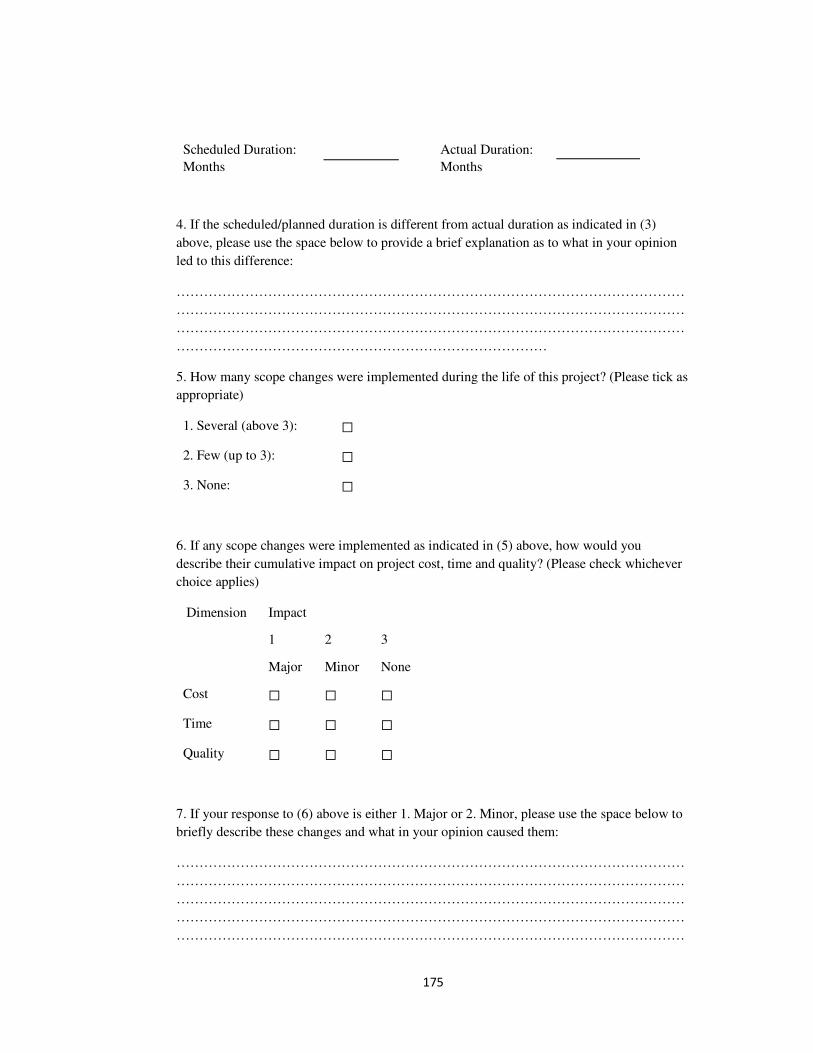
175
Scheduled Duration:
Months
Actual Duration:
Months
4. If the scheduled/planned duration is different from actual duration as indicated in (3)
above, please use the space below to provide a brief explanation as to what in your opinion
led to this difference:
…………………………………………………………………………………………………
…………………………………………………………………………………………………
…………………………………………………………………………………………………
………………………………………………………………………
5. How many scope changes were implemented during the life of this project? (Please tick as
appropriate)
1. Several (above 3): ☐
2. Few (up to 3): ☐
3. None: ☐
6. If any scope changes were implemented as indicated in (5) above, how would you
describe their cumulative impact on project cost, time and quality? (Please check whichever
choice applies)
Dimension Impact
1 2 3
Major Minor None
Cost ☐ ☐ ☐
Time ☐ ☐ ☐
Quality ☐ ☐ ☐
7. If your response to (6) above is either 1. Major or 2. Minor, please use the space below to
briefly describe these changes and what in your opinion caused them:
…………………………………………………………………………………………………
…………………………………………………………………………………………………
…………………………………………………………………………………………………
…………………………………………………………………………………………………
…………………………………………………………………………………………………
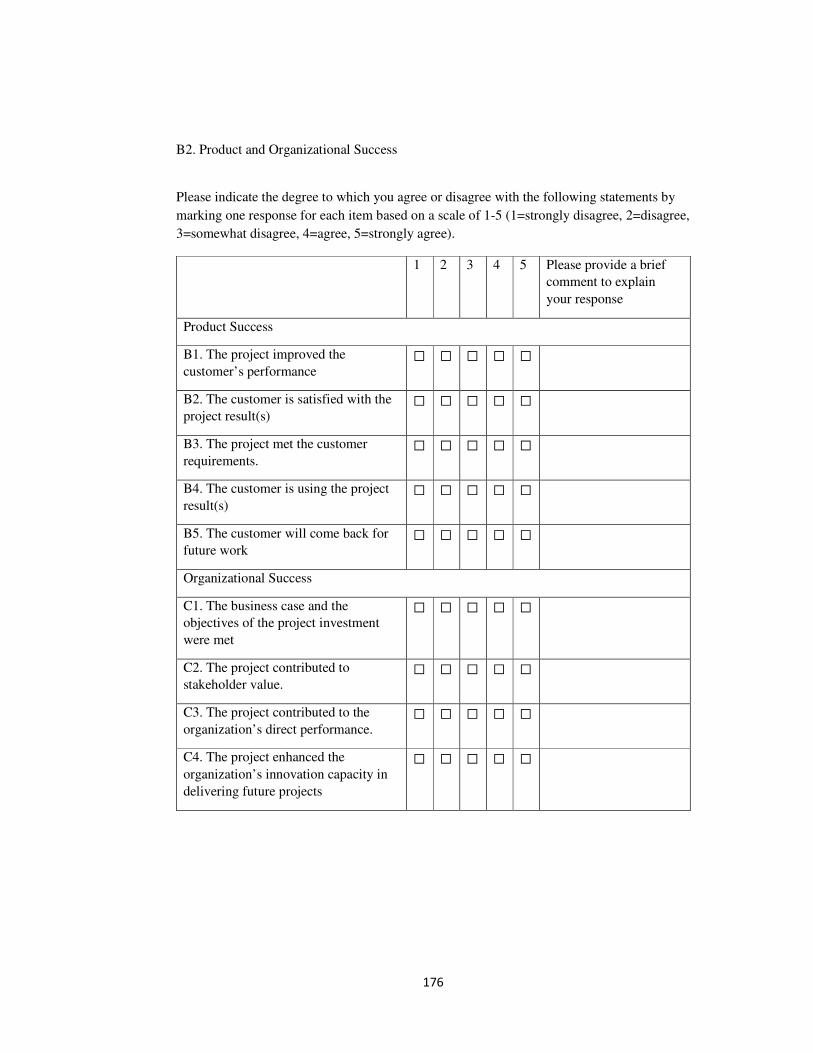
176
B2. Product and Organizational Success
Please indicate the degree to which you agree or disagree with the following statements by
marking one response for each item based on a scale of 1-5 (1=strongly disagree, 2=disagree,
3=somewhat disagree, 4=agree, 5=strongly agree).
1 2 3 4 5 Please provide a brief
comment to explain
your response
Product Success
B1. The project improved the
customer’s performance ☐ ☐ ☐ ☐ ☐
B2. The customer is satisfied with the
project result(s) ☐ ☐ ☐ ☐ ☐
B3. The project met the customer
requirements. ☐ ☐ ☐ ☐ ☐
B4. The customer is using the project
result(s) ☐ ☐ ☐ ☐ ☐
B5. The customer will come back for
future work ☐ ☐ ☐ ☐ ☐
Organizational Success
C1. The business case and the
objectives of the project investment
were met
☐ ☐ ☐ ☐ ☐
C2. The project contributed to
stakeholder value. ☐ ☐ ☐ ☐ ☐
C3. The project contributed to the
organization’s direct performance. ☐ ☐ ☐ ☐ ☐
C4. The project enhanced the
organization’s innovation capacity in
delivering future projects
☐ ☐ ☐ ☐ ☐
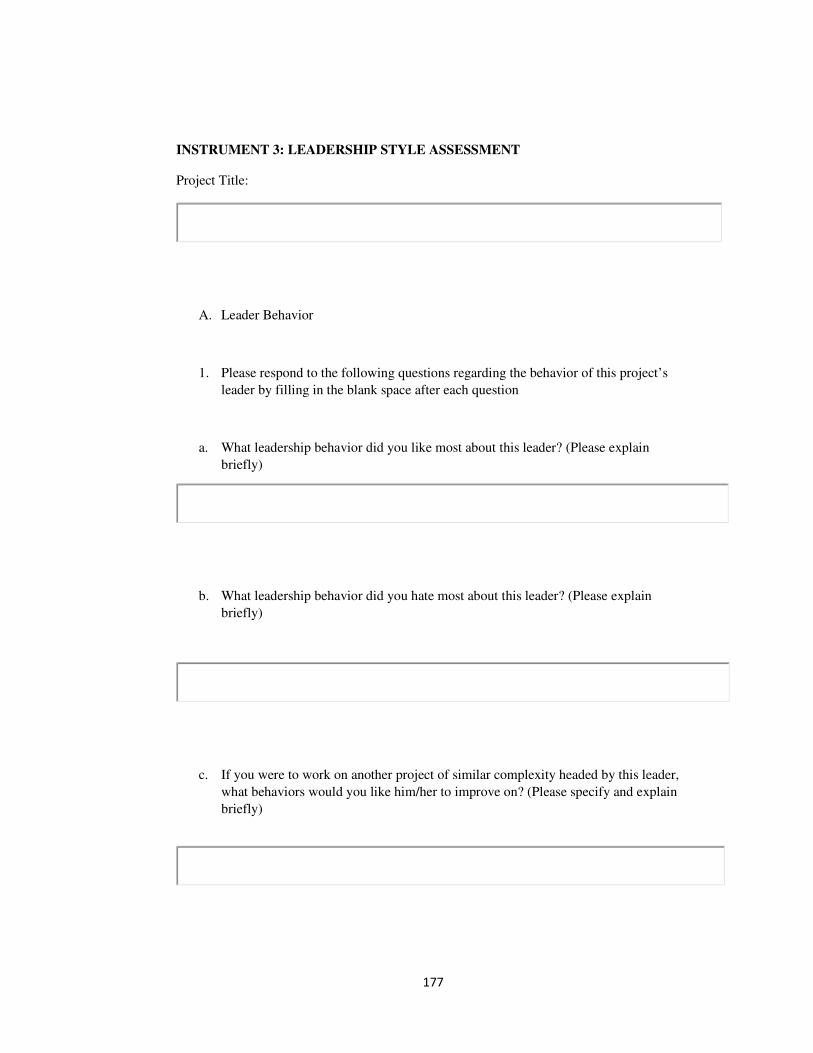
177
INSTRUMENT 3: LEADERSHIP STYLE ASSESSMENT
Project Title:
A. Leader Behavior
1. Please respond to the following questions regarding the behavior of this project’s
leader by filling in the blank space after each question
a. What leadership behavior did you like most about this leader? (Please explain
briefly)
b. What leadership behavior did you hate most about this leader? (Please explain
briefly)
c. If you were to work on another project of similar complexity headed by this leader,
what behaviors would you like him/her to improve on? (Please specify and explain
briefly)
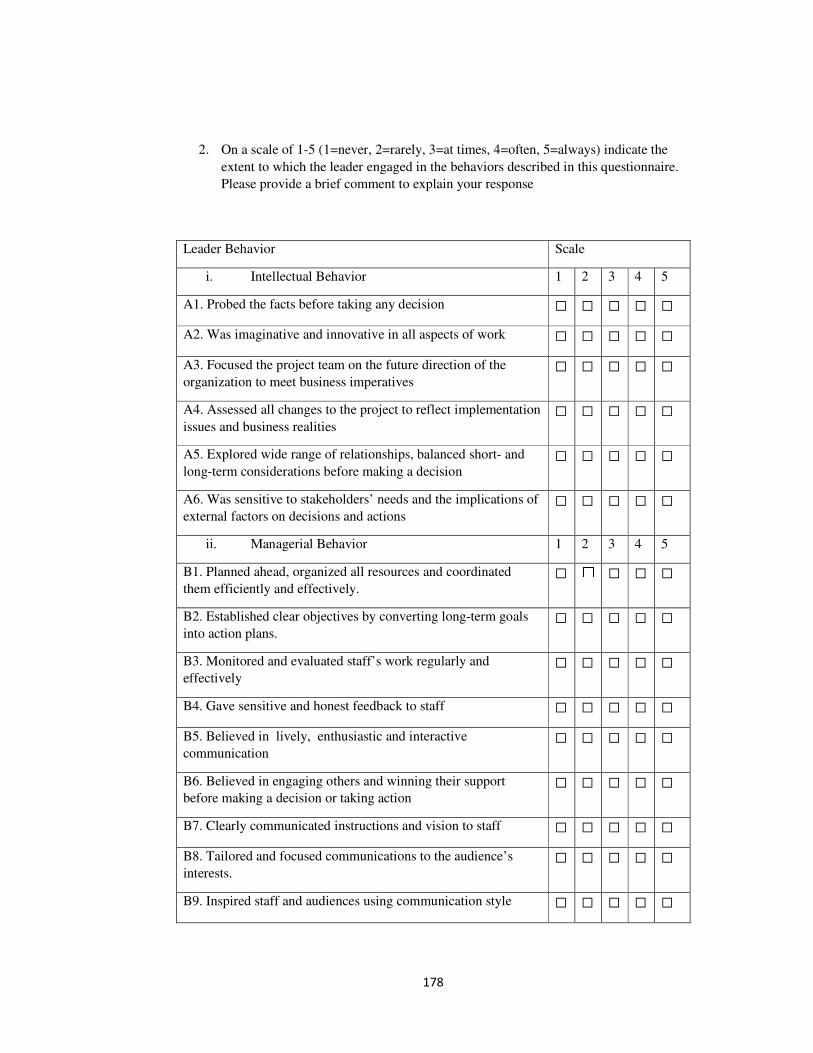
178
2. On a scale of 1-5 (1=never, 2=rarely, 3=at times, 4=often, 5=always) indicate the
extent to which the leader engaged in the behaviors described in this questionnaire.
Please provide a brief comment to explain your response
Leader Behavior Scale
i. Intellectual Behavior 1 2 3 4 5
A1. Probed the facts before taking any decision ☐ ☐ ☐ ☐ ☐
A2. Was imaginative and innovative in all aspects of work ☐ ☐ ☐ ☐ ☐
A3. Focused the project team on the future direction of the
organization to meet business imperatives ☐ ☐ ☐ ☐ ☐
A4. Assessed all changes to the project to reflect implementation
issues and business realities ☐ ☐ ☐ ☐ ☐
A5. Explored wide range of relationships, balanced short- and
long-term considerations before making a decision ☐ ☐ ☐ ☐ ☐
A6. Was sensitive to stakeholders’ needs and the implications of
external factors on decisions and actions ☐ ☐ ☐ ☐ ☐
ii. Managerial Behavior 1 2 3 4 5
B1. Planned ahead, organized all resources and coordinated
them efficiently and effectively. ☐ ☐ ☐ ☐ ☐
B2. Established clear objectives by converting long-term goals
into action plans. ☐ ☐ ☐ ☐ ☐
B3. Monitored and evaluated staff’s work regularly and
effectively ☐ ☐ ☐ ☐ ☐
B4. Gave sensitive and honest feedback to staff ☐ ☐ ☐ ☐ ☐
B5. Believed in lively, enthusiastic and interactive
communication ☐ ☐ ☐ ☐ ☐
B6. Believed in engaging others and winning their support
before making a decision or taking action ☐ ☐ ☐ ☐ ☐
B7. Clearly communicated instructions and vision to staff ☐ ☐ ☐ ☐ ☐
B8. Tailored and focused communications to the audience’s
interests. ☐ ☐ ☐ ☐ ☐
B9. Inspired staff and audiences using communication style ☐ ☐ ☐ ☐ ☐
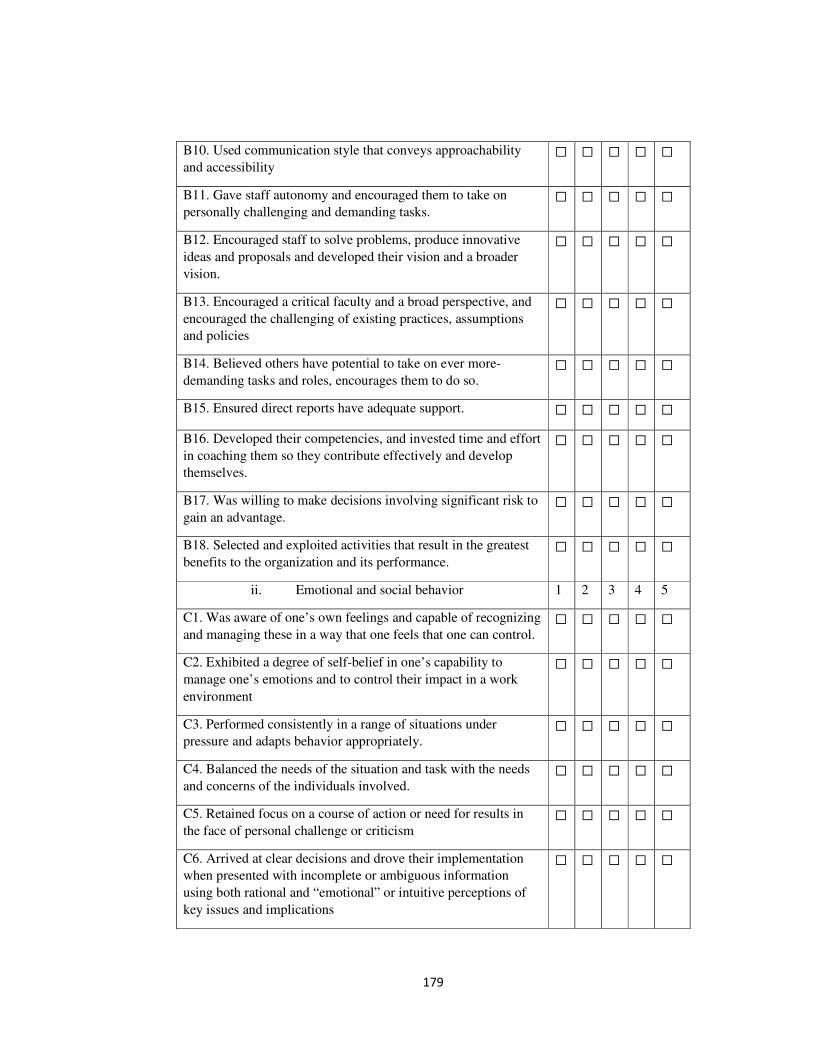
179
B10. Used communication style that conveys approachability
and accessibility ☐ ☐ ☐ ☐ ☐
B11. Gave staff autonomy and encouraged them to take on
personally challenging and demanding tasks. ☐ ☐ ☐ ☐ ☐
B12. Encouraged staff to solve problems, produce innovative
ideas and proposals and developed their vision and a broader
vision.
☐ ☐ ☐ ☐ ☐
B13. Encouraged a critical faculty and a broad perspective, and
encouraged the challenging of existing practices, assumptions
and policies
☐ ☐ ☐ ☐ ☐
B14. Believed others have potential to take on ever more-
demanding tasks and roles, encourages them to do so. ☐ ☐ ☐ ☐ ☐
B15. Ensured direct reports have adequate support. ☐ ☐ ☐ ☐ ☐
B16. Developed their competencies, and invested time and effort
in coaching them so they contribute effectively and develop
themselves.
☐ ☐ ☐ ☐ ☐
B17. Was willing to make decisions involving significant risk to
gain an advantage. ☐ ☐ ☐ ☐ ☐
B18. Selected and exploited activities that result in the greatest
benefits to the organization and its performance. ☐ ☐ ☐ ☐ ☐
ii. Emotional and social behavior 1 2 3 4 5
C1. Was aware of one’s own feelings and capable of recognizing
and managing these in a way that one feels that one can control. ☐ ☐ ☐ ☐ ☐
C2. Exhibited a degree of self-belief in one’s capability to
manage one’s emotions and to control their impact in a work
environment
☐ ☐ ☐ ☐ ☐
C3. Performed consistently in a range of situations under
pressure and adapts behavior appropriately. ☐ ☐ ☐ ☐ ☐
C4. Balanced the needs of the situation and task with the needs
and concerns of the individuals involved. ☐ ☐ ☐ ☐ ☐
C5. Retained focus on a course of action or need for results in
the face of personal challenge or criticism ☐ ☐ ☐ ☐ ☐
C6. Arrived at clear decisions and drove their implementation
when presented with incomplete or ambiguous information
using both rational and “emotional” or intuitive perceptions of
key issues and implications
☐ ☐ ☐ ☐ ☐
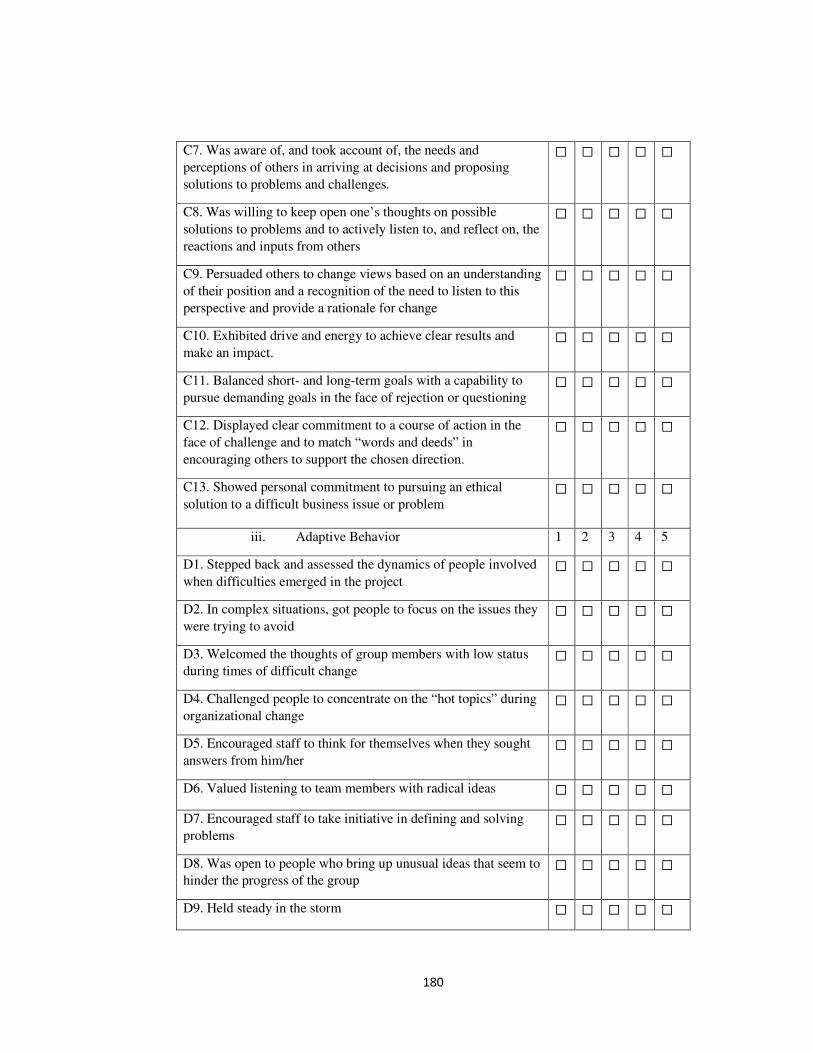
180
C7. Was aware of, and took account of, the needs and
perceptions of others in arriving at decisions and proposing
solutions to problems and challenges.
☐ ☐ ☐ ☐ ☐
C8. Was willing to keep open one’s thoughts on possible
solutions to problems and to actively listen to, and reflect on, the
reactions and inputs from others
☐ ☐ ☐ ☐ ☐
C9. Persuaded others to change views based on an understanding
of their position and a recognition of the need to listen to this
perspective and provide a rationale for change
☐ ☐ ☐ ☐ ☐
C10. Exhibited drive and energy to achieve clear results and
make an impact. ☐ ☐ ☐ ☐ ☐
C11. Balanced short- and long-term goals with a capability to
pursue demanding goals in the face of rejection or questioning ☐ ☐ ☐ ☐ ☐
C12. Displayed clear commitment to a course of action in the
face of challenge and to match “words and deeds” in
encouraging others to support the chosen direction.
☐ ☐ ☐ ☐ ☐
C13. Showed personal commitment to pursuing an ethical
solution to a difficult business issue or problem ☐ ☐ ☐ ☐ ☐
iii. Adaptive Behavior 1 2 3 4 5
D1. Stepped back and assessed the dynamics of people involved
when difficulties emerged in the project ☐ ☐ ☐ ☐ ☐
D2. In complex situations, got people to focus on the issues they
were trying to avoid ☐ ☐ ☐ ☐ ☐
D3. Welcomed the thoughts of group members with low status
during times of difficult change ☐ ☐ ☐ ☐ ☐
D4. Challenged people to concentrate on the “hot topics” during
organizational change ☐ ☐ ☐ ☐ ☐
D5. Encouraged staff to think for themselves when they sought
answers from him/her ☐ ☐ ☐ ☐ ☐
D6. Valued listening to team members with radical ideas ☐ ☐ ☐ ☐ ☐
D7. Encouraged staff to take initiative in defining and solving
problems ☐ ☐ ☐ ☐ ☐
D8. Was open to people who bring up unusual ideas that seem to
hinder the progress of the group ☐ ☐ ☐ ☐ ☐
D9. Held steady in the storm ☐ ☐ ☐ ☐ ☐
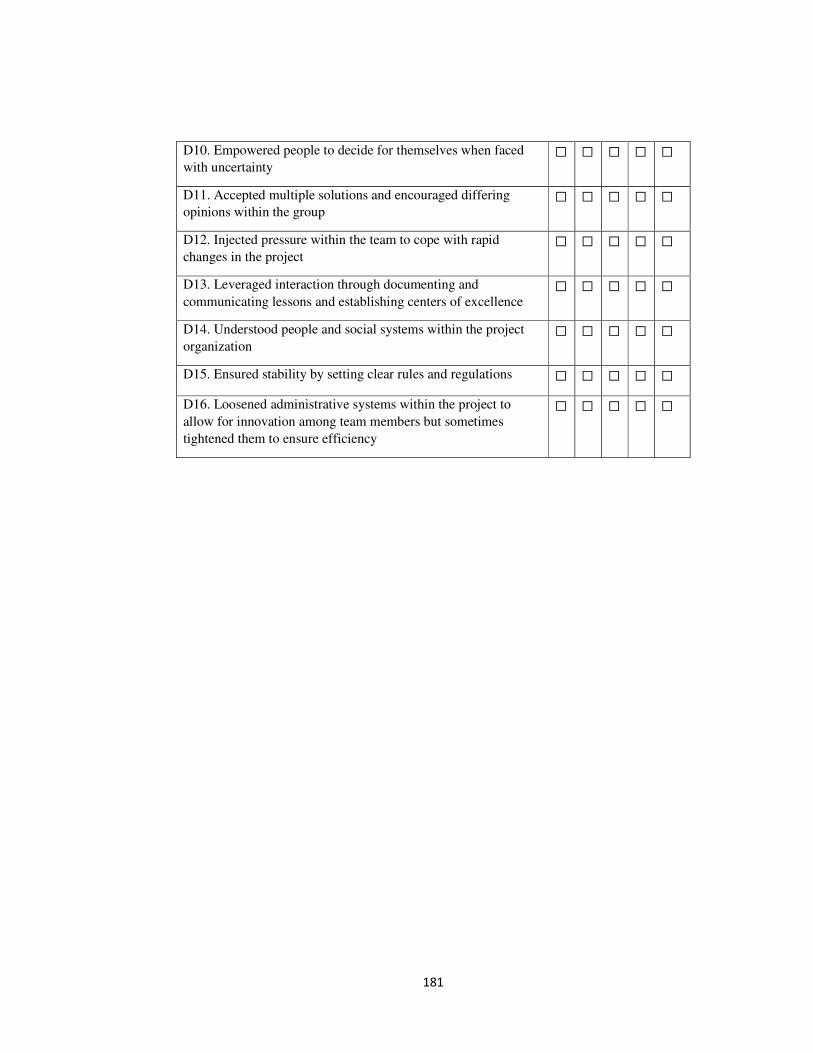
181
D10. Empowered people to decide for themselves when faced
with uncertainty ☐ ☐ ☐ ☐ ☐
D11. Accepted multiple solutions and encouraged differing
opinions within the group ☐ ☐ ☐ ☐ ☐
D12. Injected pressure within the team to cope with rapid
changes in the project ☐ ☐ ☐ ☐ ☐
D13. Leveraged interaction through documenting and
communicating lessons and establishing centers of excellence ☐ ☐ ☐ ☐ ☐
D14. Understood people and social systems within the project
organization ☐ ☐ ☐ ☐ ☐
D15. Ensured stability by setting clear rules and regulations ☐ ☐ ☐ ☐ ☐
D16. Loosened administrative systems within the project to
allow for innovation among team members but sometimes
tightened them to ensure efficiency
☐ ☐ ☐ ☐ ☐
182
APPENDIX 2: LIST OF COMPLETED INFRASTRUCTURAL MEGAPROJECTS
SURVEYED
1 Dredging Channel at Port of Mombasa
2 Mombasa Port Development Project
3 Sinendet-Kisumu Pipeline
4 Nairobi-Eldoret Pipeline
5 Terminal 1A Arrivals at JKIA
6 Terminal 1A Departures at JKIA
7 Rehabilitation of Existing Runway at JKIA
8 Primary Security Screening at JKIA
9 Emergency Terminal 1E at JKIA
10 Terminal 2 at JKIA
11 Kenya Electricity Expansion Project
12 Energy Sector Recovery Project
13 Mombasa Street Lighting Project
14 Kindaruma Upgrade Project
15 Rehabilitation and Upgrade of Upper Hill Roads
16 Rehabilitation and Upgrade of Eastleigh 1st Avenue Roads
17 Construction of Eastern and Northern Bypass
18 Rehabilitation and upgrade of Langata Road
19 Construction of Kapsoya Eldoret Road
20 Construction of KCAA Headquarters
21 Mau Summit-Kericho-Nyamasaria Road
22 Kisumu Airport-Kisian Road
23 Nairobi Southern Bypass Road
24 Upgrade to Bitumen Standard of Homa Bay-Mbita Road
25 Rehabilitation of Timboroa-Eldoret (A104) Road
26 Rehabilitation of Webuye-Malaba (A104) Road
27 Menengai Geothermal Development Project
28 Construction of Marsabit-Turbi Road
29 Construction of Nairobi-Thika Superhighway
30 Construction of Londian-Fortenan Road
31 Construction of Machakos Turn-off at JKIA
Source: Kenya Vision 2030 Secretariat
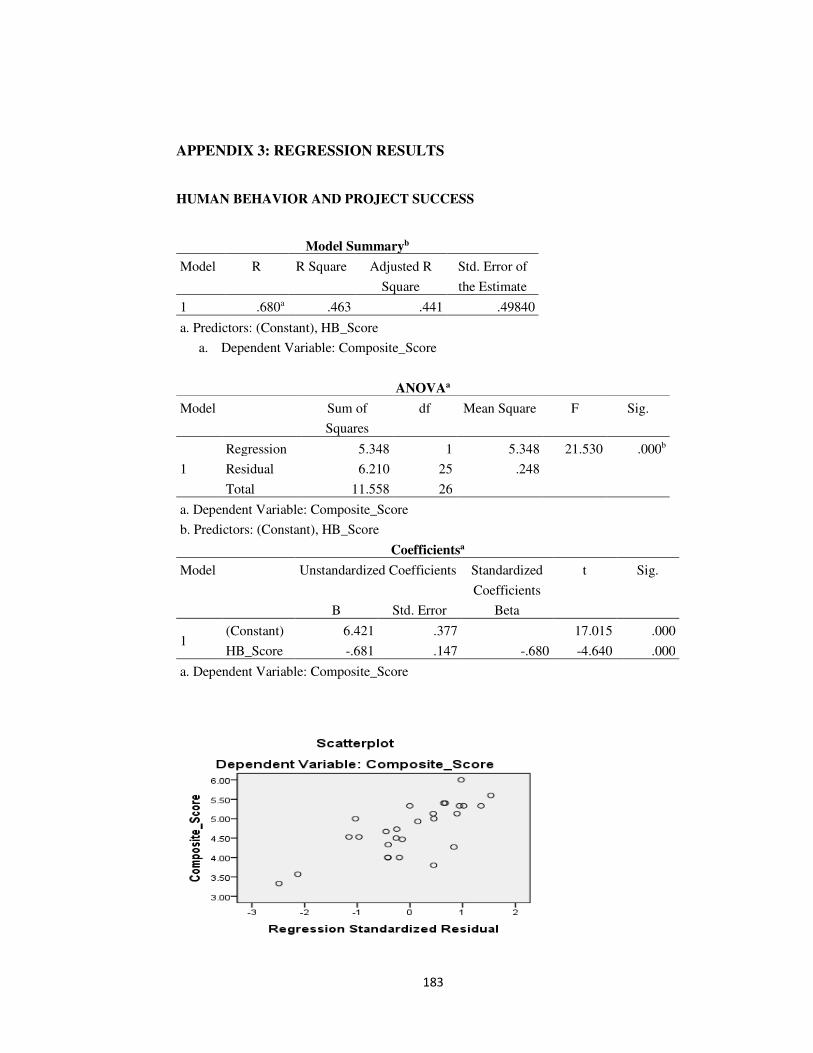
183
APPENDIX 3: REGRESSION RESULTS
HUMAN BEHAVIOR AND PROJECT SUCCESS
Model Summaryb
Model R R Square Adjusted R
Square
Std. Error of
the Estimate
1 .680a .463 .441 .49840
a. Predictors: (Constant), HB_Score
a. Dependent Variable: Composite_Score
ANOVAa
Model Sum of
Squares
df Mean Square F Sig.
1
Regression 5.348 1 5.348 21.530 .000b
Residual 6.210 25 .248
Total 11.558 26
a. Dependent Variable: Composite_Score
b. Predictors: (Constant), HB_Score
Coefficientsa
Model Unstandardized Coefficients Standardized
Coefficients
t Sig.
B Std. Error Beta
1 (Constant) 6.421 .377 17.015 .000
HB_Score -.681 .147 -.680 -4.640 .000
a. Dependent Variable: Composite_Score
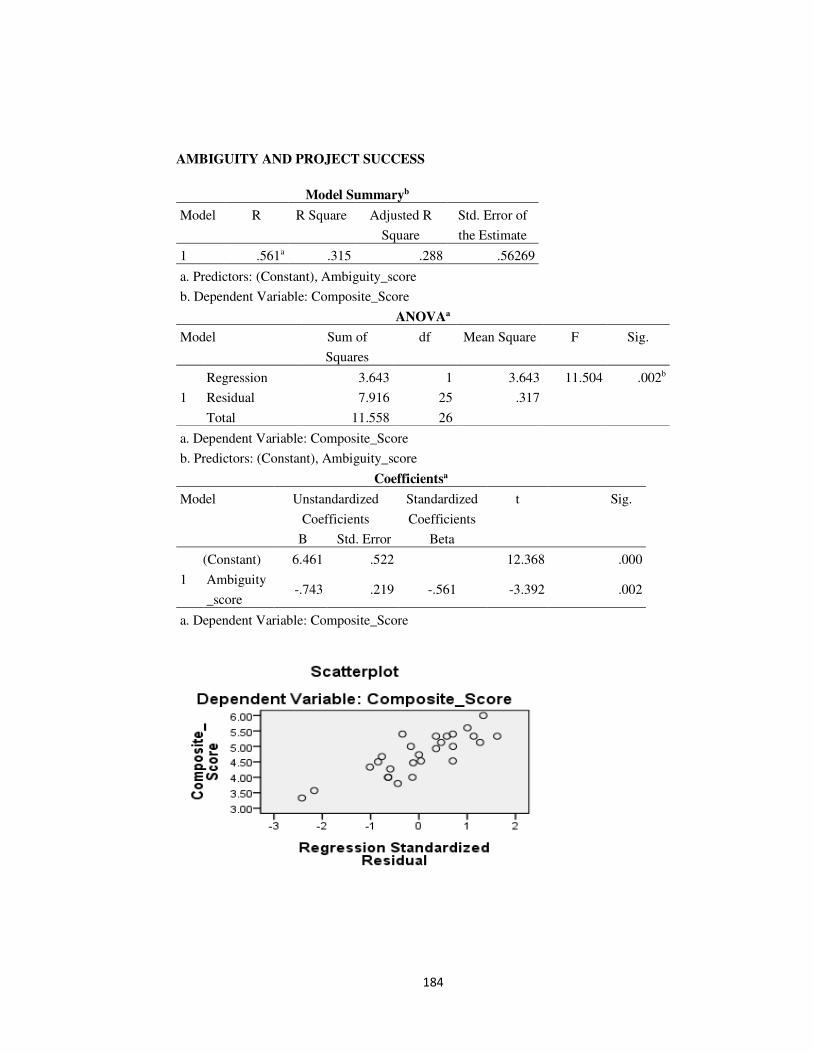
184
AMBIGUITY AND PROJECT SUCCESS
Model Summaryb
Model R R Square Adjusted R
Square
Std. Error of
the Estimate
1 .561a .315 .288 .56269
a. Predictors: (Constant), Ambiguity_score
b. Dependent Variable: Composite_Score
ANOVAa
Model Sum of
Squares
df Mean Square F Sig.
1
Regression 3.643 1 3.643 11.504 .002b
Residual 7.916 25 .317
Total 11.558 26
a. Dependent Variable: Composite_Score
b. Predictors: (Constant), Ambiguity_score
Coefficientsa
Model Unstandardized
Coefficients
Standardized
Coefficients
t Sig.
B Std. Error Beta
1
(Constant) 6.461 .522 12.368 .000
Ambiguity
_score -.743 .219 -.561 -3.392 .002
a. Dependent Variable: Composite_Score
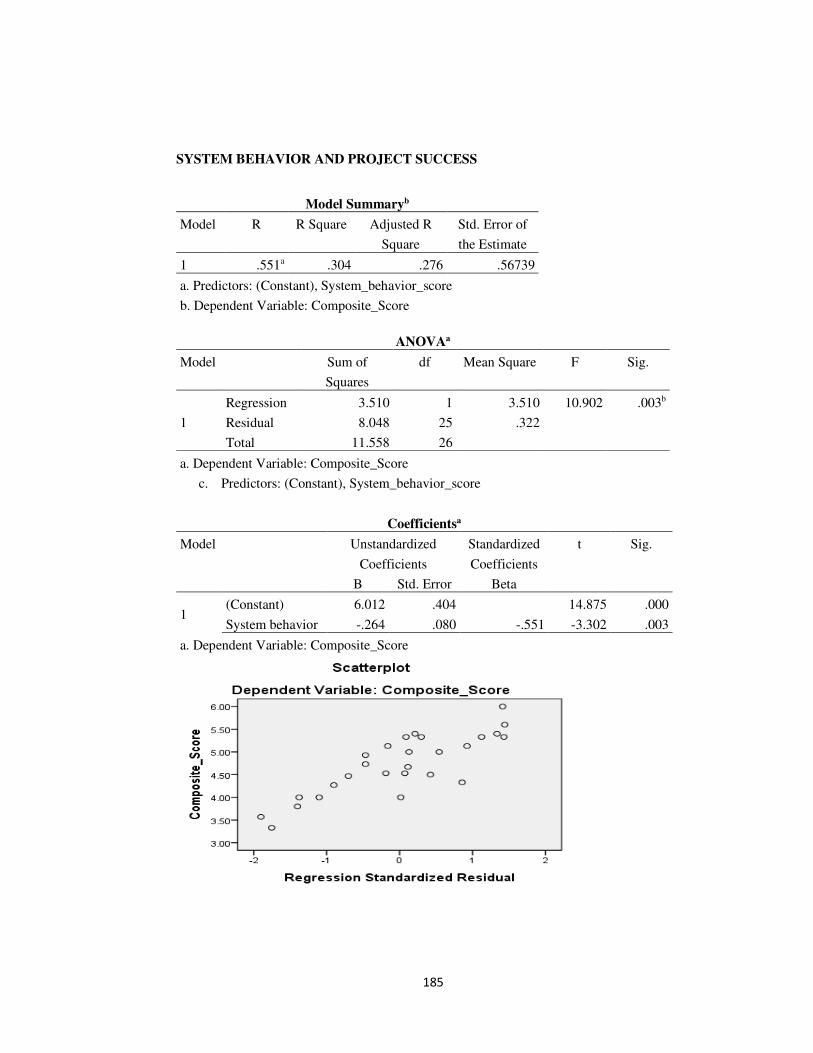
185
SYSTEM BEHAVIOR AND PROJECT SUCCESS
Model Summaryb
Model R R Square Adjusted R
Square
Std. Error of
the Estimate
1 .551a .304 .276 .56739
a. Predictors: (Constant), System_behavior_score
b. Dependent Variable: Composite_Score
ANOVAa
Model Sum of
Squares
df Mean Square F Sig.
1
Regression 3.510 1 3.510 10.902 .003b
Residual 8.048 25 .322
Total 11.558 26
a. Dependent Variable: Composite_Score
c. Predictors: (Constant), System_behavior_score
Coefficientsa
Model Unstandardized
Coefficients
Standardized
Coefficients
t Sig.
B Std. Error Beta
1 (Constant) 6.012 .404 14.875 .000
System behavior -.264 .080 -.551 -3.302 .003
a. Dependent Variable: Composite_Score
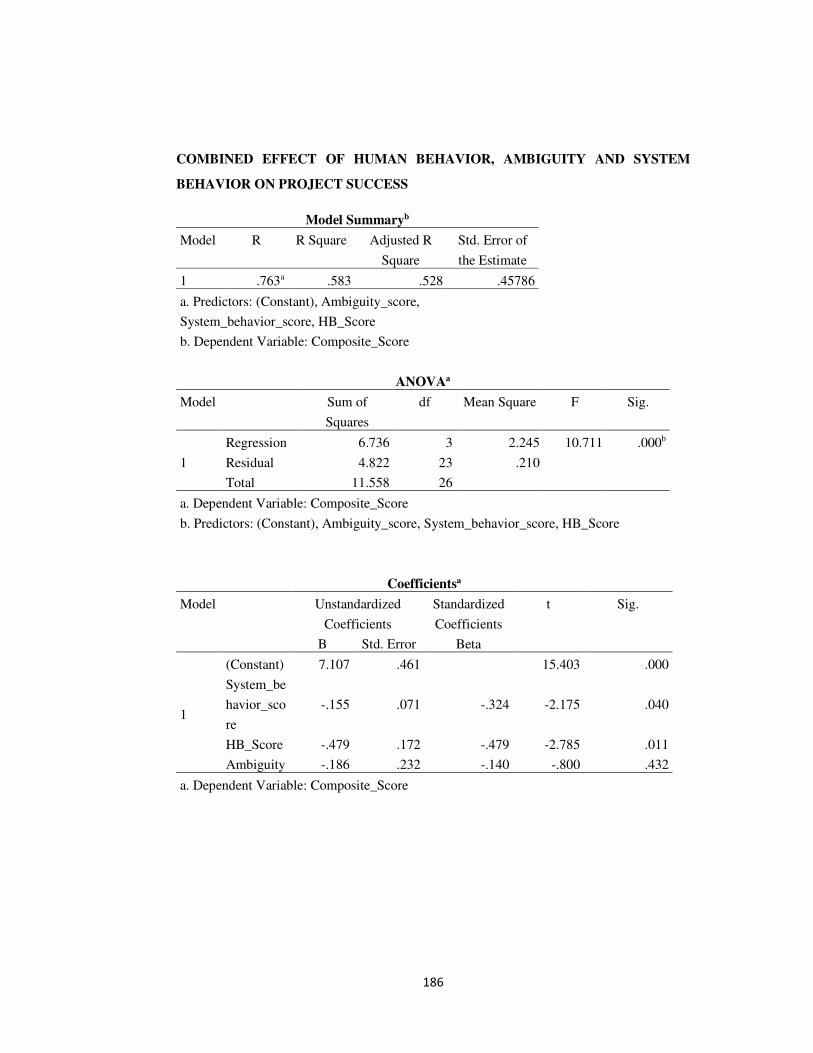
186
COMBINED EFFECT OF HUMAN BEHAVIOR, AMBIGUITY AND SYSTEM
BEHAVIOR ON PROJECT SUCCESS
Model Summaryb
Model R R Square Adjusted R
Square
Std. Error of
the Estimate
1 .763a .583 .528 .45786
a. Predictors: (Constant), Ambiguity_score,
System_behavior_score, HB_Score
b. Dependent Variable: Composite_Score
ANOVAa
Model Sum of
Squares
df Mean Square F Sig.
1
Regression 6.736 3 2.245 10.711 .000b
Residual 4.822 23 .210
Total 11.558 26
a. Dependent Variable: Composite_Score
b. Predictors: (Constant), Ambiguity_score, System_behavior_score, HB_Score
Coefficientsa
Model Unstandardized
Coefficients
Standardized
Coefficients
t Sig.
B Std. Error Beta
1
(Constant) 7.107 .461 15.403 .000
System_be
havior_sco
re
-.155 .071 -.324 -2.175 .040
HB_Score -.479 .172 -.479 -2.785 .011
Ambiguity -.186 .232 -.140 -.800 .432
a. Dependent Variable: Composite_Score
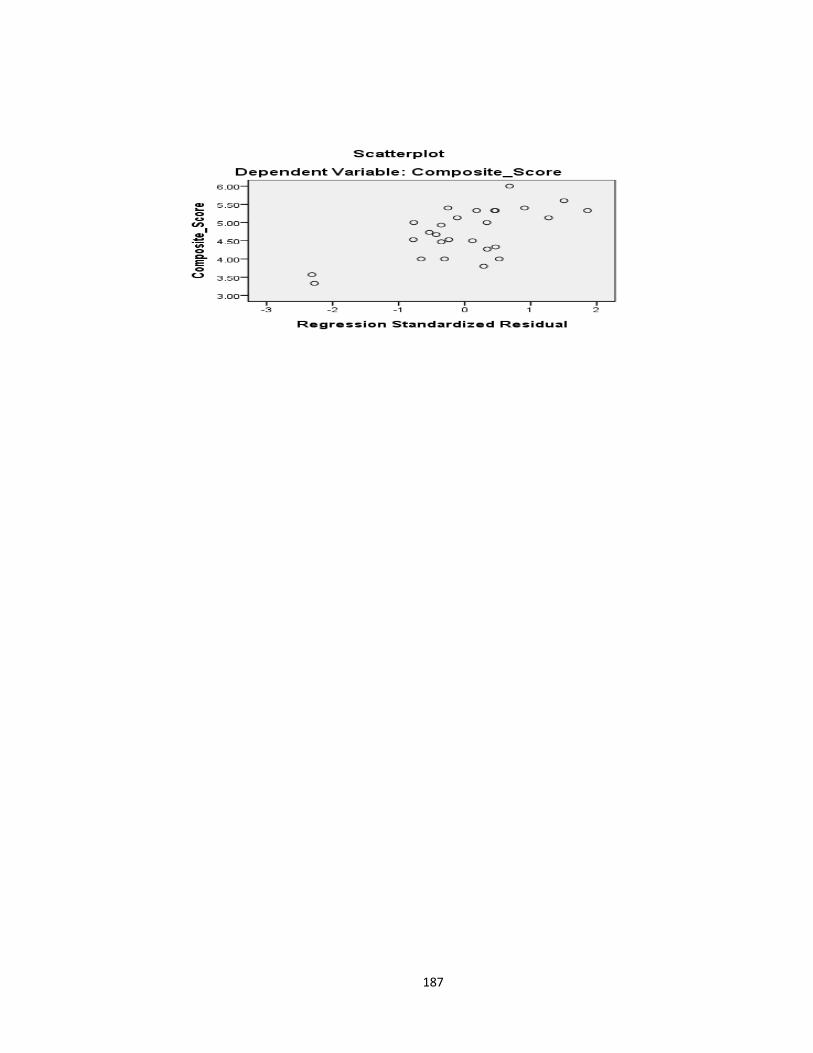
187