Embed Size (px)
Citation preview
This article was downloaded by: [86.155.145.10]On: 18 May 2014, At: 13:23Publisher: RoutledgeInforma Ltd Registered in England and Wales Registered Number: 1072954 Registeredoffice: Mortimer House, 37-41 Mortimer Street, London W1T 3JH, UK
Research Papers in EducationPublication details, including instructions for authors andsubscription information:http://www.tandfonline.com/loi/rred20
Moderate learning difficulties:searching for clarity and understandingBrahm Norwicha, Annamari Ylonena & Ruth Gwernan-Jonesb
a Graduate School of Education, University of Exeter, Exeter, UK.b The Penninsula College of Medicine and Dentistry, University ofExeter, Exeter, UK.Published online: 04 Oct 2012.
To cite this article: Brahm Norwich, Annamari Ylonen & Ruth Gwernan-Jones (2014) Moderatelearning difficulties: searching for clarity and understanding, Research Papers in Education, 29:1,1-19, DOI: 10.1080/02671522.2012.729153
To link to this article: http://dx.doi.org/10.1080/02671522.2012.729153
PLEASE SCROLL DOWN FOR ARTICLE
Taylor & Francis makes every effort to ensure the accuracy of all the information (the“Content”) contained in the publications on our platform. Taylor & Francis, our agents,and our licensors make no representations or warranties whatsoever as to the accuracy,completeness, or suitability for any purpose of the Content. Versions of publishedTaylor & Francis and Routledge Open articles and Taylor & Francis and Routledge OpenSelect articles posted to institutional or subject repositories or any other third-partywebsite are without warranty from Taylor & Francis of any kind, either expressedor implied, including, but not limited to, warranties of merchantability, fitness for aparticular purpose, or non-infringement. Any opinions and views expressed in this articleare the opinions and views of the authors, and are not the views of or endorsed byTaylor & Francis. The accuracy of the Content should not be relied upon and should beindependently verified with primary sources of information. Taylor & Francis shall not beliable for any losses, actions, claims, proceedings, demands, costs, expenses, damages,and other liabilities whatsoever or howsoever caused arising directly or indirectly inconnection with, in relation to or arising out of the use of the Content. This article may be used for research, teaching, and private study purposes. Terms &Conditions of access and use can be found at http://www.tandfonline.com/page/terms-and-conditions

It is essential that you check the license status of any given Open and OpenSelect article to confirm conditions of access and use.
Dow
nloa
ded
by [
86.1
55.1
45.1
0] a
t 13:
23 1
8 M
ay 2
014
Moderate learning difficulties: searching for clarity andunderstanding
Brahm Norwicha*, Annamari Ylonena and Ruth Gwernan-Jonesb
aGraduate School of Education, University of Exeter, Exeter, UK; bThe Penninsula Collegeof Medicine and Dentistry, University of Exeter, Exeter, UK
(Received 1 May 2012; final version received 8 September 2012)
The concept of moderate learning difficulties (MLD) is not clearly understood inits definition and in its general use. Nevertheless, as a distinct area of special edu-cational needs (SEN) this category has constituted about a quarter of all of thosepupils identified as having SEN in England. This paper reports the analysis offindings from an ongoing research project in an attempt to improve understandingof the MLD category. Pupils (aged 12–14 years) identified as having MLD werecompared with others in the same classes identified as having either specific learn-ing difficulties or low attainments in terms of literacy, reasoning and dispositionalmeasures. The paper shows that the label of MLD is often used in an over-general-ised way in schools and that although there are some differences in reasoning andliteracy abilities between those identified as having MLD and those who have not,no such differences were found in learner self-concept and in pupils’ attitudes toeducation and learning questioning the current definition of MLD which includesassociated low self-esteem. Reasons for lack of clarity in the definition/categoryof MLD are discussed, as are implications for future use of the term.
Keywords: moderate learning difficulties (MLD); SEN; identification;classification
Introduction
Background and rationale
Moderate learning difficulties (MLD) is a term used to describe a group of pupilswhich is currently the largest proportion of those identified as having a special edu-cational needs (SEN) in England (DfE 2010). However, this has been a contentiouscategory, which is currently understood in the English school census definition torefer to significant general difficulties in literacy and numeracy learning and inunderstanding concepts. It is also an important category to represent general learn-ing difficulties and so acts as the reference point for specific learning difficulties(SpLD), which are understood as being distinct from MLD learning difficulties.Compared to other areas of SEN, this is a neglected area for educational researchand initiatives and there has been considerably less research related to MLD thanother areas such as SpLD (dyslexia), autism and speech and language impairment(Desforges 2006).
*Corresponding author. Email: [email protected]
Research Papers in Education, 2014Vol. 29, No. 1, 1–19, http://dx.doi.org/10.1080/02671522.2012.729153
� 2012 The Author(s). Published by Routledge.This is an Open Access article. Non-commercial re-use, distribution, and reproduction in any medium, provided the originalwork is properly attributed, cited, and is not altered, transformed, or built upon in any way, is permitted. The moral rights ofthe named author(s) have been asserted.
Dow
nloa
ded
by [
86.1
55.1
45.1
0] a
t 13:
23 1
8 M
ay 2
014
The research reported in this paper was designed as part of a 2-year Researchand Development project – ‘Raising levels of achievement through lesson develop-ment for pupils with MLD’ – which aimed to improve the learning experiences andopportunities of pupils identified with MLD at Key Stage 3 (aged 11–13 years) inEnglish secondary schools. One of main aims of the MLD Lesson Study projectwas to evaluate the usefulness of the MLD category. This section sets the scene tothe general aim of the paper which is to examine the problematic nature of the cate-gory of MLD as used in the English school system.
Questions of terminology and categorisation of MLD have evolved over the past100 years according to changing social and political contexts. The debate about howto identify MLD focuses on whether to classify children according to how muchtheir school attainments differ from others, or whether and how to take account ofintellectual functioning as measured by cognitive ability tests (often called IQ test).Some of the current criticisms of the MLD category stem from its precursor, thecategory ‘educationally sub-normal (moderate)’ or ESN (M) from a critical socialperspective (Tomlinson 1982, 1985). This perspective focused on the stigma anddevaluation of learners so categorised, which when combined with disability studiescritique of the medical model (Oliver 2004) has led to the social model of learningdifficulties and disabilities and a contemporary critique of all SEN categoriesincluding MLD (Booth and Ainscow 2011).
One of the key questions in the debate is whether pupils identified with MLDare simply those at the lowest end of the range of pupils with low attainment orwhether they also have an intellectual disability (Norwich and Kelly 2005). A rele-vant point to this question was raised by Porter et al. (2011) in their survey ofdisability in schools which found that in one special school for pupils identifiedwith MLD only 50% of parents reported that their child had a disability as definedin the national disability legislation.
The Warnock Report (1978) signalled the advent of the current system of termi-nology, with acknowledgement of the issues of stigma and the intention to shiftfocus to the learning needs of individuals and away from medical classifications.The term ESN (M), (Tomlinson 1982), was replaced by ‘MLD’ and educationallysub-normal severe, ESN (S), by ‘severe learning difficulties’ (SLD). Like the con-tinuum of ‘mental deficiency’ initiated in the late 1900s, learning difficulties ran ona continuum of profound and multiple learning difficulties (PMLD), to SLD,through to MLD and to SpLD, with no set definitions of boundaries between theseterms (Copeland 2002). The Warnock Report also suggested a category of ‘mildlearning difficulties’ which was not taken up by practitioners. The current concep-tion of the ‘low attainer’ could represent some of these learners. Indeed, Norwichand Kelly (2005) have suggested that the MLD category has been widened to incor-porate some of these ‘low attaining’ learners.
Following the publication of Binet’s test in the early 1900s, the IQ criterionbecame a common aspect of identification for pupils who needed special provisionin many countries. Binet had argued for the need to standardise intellectual assess-ment on the grounds that it would provide an objective, and therefore fairer, meansof assessment of children to ascertain if they should be educated in special classesor schools (Clarke and Clarke 1974). From around the time of the Warnock Reportin the late 1970s official reluctance to refer to IQ/intelligence measures had grownas the theoretical validity and use and misuse of intelligence testing had come intoquestion (Norwich and Kelly 2005). Current legislation and educational guidance,
2 B. Norwich et al.
Dow
nloa
ded
by [
86.1
55.1
45.1
0] a
t 13:
23 1
8 M
ay 2
014
for example the SEN Code of Practice (2001), do not refer to the use of intelligencemeasures in identification procedures. However, educational psychologists whooften carry out assessment of pupils for the purpose of identification of MLD com-monly use them, so intelligence measures can still play a prominent role (Norwichand Kelly 2005).
With the fairly recent decision to collect statistical data about pupils with SEN,the government issued formal definitions for eleven categories of SEN to enablereliable reporting in the school census (DfES 2003). MLD was defined as:
Pupils with MLD will have attainments significantly below expected levels in most areasof the curriculum, despite appropriate interventions. Their needs will not be able to bemet by normal differentiation and the flexibilities of the National Curriculum. Theyshould only be recorded as MLD if additional educational provision is being made tohelp them to access the curriculum. Pupils with MLD have much greater difficulty thantheir peers in acquiring basic literacy and numeracy skills and in understanding concepts.They may also have associated speech and language delay, low self-esteem, low levelsof concentration and under-developed social skills. (DfES 2003: 3)
Using this definition, according to Government statistical analysis (DfE 2010),pupils identified with MLD comprise nearly one quarter of all those registered withSEN at School Action Plus (SA+) or with Statements (see Appendix 1 for an out-line of the SEN system in England). This makes it the most common type of needat these two levels (see Table 1). These data are collected through school surveyswhich are completed by teachers using the above definition of MLD in every schoolin England at a particular time in the school year. There is no specific nationalguidance about how the above definition of MLD is to be interpreted and what evi-dence indicates the various elements making up the definition.
In 2010, Ofsted reviewed legislation and provision for children and young peo-ple with SEN and disabilities. They concluded that children with SEN were inmany cases not supported equitably or appropriately (Ofsted 2010). SEN were iden-tified in widely varying ways between and within local areas, so that children withsimilar needs were identified differently, according to where they lived and whatschools they attended. Thresholds for securing additional provision also variedwidely, so that children with similar needs received varying levels of provision. Itwas also found that around half of schools used low attainment and lack of progressto indicate SEN, when many of these pupils were actually experiencing ‘poor teach-ing’ provision and low expectations. For this reason, it was concluded that the term‘SEN’ was being used too widely and that existing terminology on SEN was prob-lematic (Ofsted 2010).
The Green Paper released by the Department for Education (2011, 10), to out-line Government SEN policy, adopted the findings of the Ofsted report by propos-
Table 1. Percentage of pupils identified as having MLD of all pupils with different levelsof SEN in maintained primary schools, state-funded secondary schools and special schools.
Type of need
SA+ Statement Total
No. % No. % No. %
MLD 130,460 26.8 38,120 18.2 168,580 24.2
Source: DfE (2010).
Research Papers in Education 3
Dow
nloa
ded
by [
86.1
55.1
45.1
0] a
t 13:
23 1
8 M
ay 2
014
ing ‘to tackle the practice of over-identification by replacing the current SEN identi-fication levels of School Action (SA) and SA+ with a new single school-basedSEN category for children whose needs exceed what is normally available inschools’. However, the National Union for Teachers contested the claim that SENwas over-identified as ‘unfair and inaccurate’. Combining SA and SA+ would, theyclaimed, not decrease the number of pupils having additional needs, but reduce thesupport and specialist input for these children (NUT 2011, 19).
Review of relevant literature
Though the recent SEN classification (DfES 2003) does not specify the relationshipbetween the MLD definition and intellectual functioning, the historical system hasassumed that different degrees of ‘learning difficulties’ are associated with variousIQ score ranges. MLD has been seen to correspond to a range of 51–70, which cor-responds to the mild intellectual disabilities (mild ID) range in the US-based medi-cal classification DSM IV-TR (APA 2000; Frederickson and Cline 2009). In theDSM medical classification identification also requires that there is low adaptivefunctioning (in areas concerned with personal and social functioning in home, socialand neighbourhood contexts). This relates to the lower incidence of mild intellectualdisabilities relative to all identified as having disabilities in education in the USAthan England (MacMillan, Siperstein, and Gresham 1996). This is partly to do withthe tighter US definition used in identification as involving both intellectual func-tioning below 70 on standard scale (IQ scale) and low adaptive functioning outsideschool.
Although the cognitive tests are designed to have a mean of 100 and standarddeviation of 15, with about 2% scoring below 70, this criterion for MLD has beendiscredited by studies over a long period of time. When the current term was educa-tional (ESN-M), 25% of pupils in special schools for this group were found to havescores above 70 in the Isle of Wight study (Rutter, Tizard, and Whitmore 1970).This may reflect that special schools designated for ESN (M) were used for otherpurposes. In Wales, Chazan (1964) found even a higher percentage: 38% in the spe-cial schools had scores above 70. Further analysis showed that less than half ofthose with scores below 70 were in special schools. What distinguished those inspecial schools with below 70 scores from those in ordinary schools was low read-ing scores. This shows that low attainment was a key factor in going to specialschool for MLD (Yule 1975).
International research has also shown that the prevalence of intellectual function-ing in the mild ID range is above the expected 2%. Roeleveld, Zeilheis, and Gab-reels (1997) reported widely varying ranges from 0.5 to 8% for those identified ashaving mild ID. According to Simonoff et al. (2006), the reasons for this variationare not well understood as age, the cognitive measures used and socio-economiclevels are all seen as relevant factors. Simonoff and colleagues (2006) in a study inCroydon, London, undertook an epidemiological study through borough-widescreening followed up by in-depth assessment of children in Years 8 and 9 (12–14 years old). Depending on the specific measures used and assumptions made,between 5.8 and 10.6% of the pupils had Weschler intelligence scores below 70,and were so taken as having mild ID. Interestingly, only 15% of these pupils hadstatements of SEN and attended special schools, which is usually taken as indicat-ing a significant SEN. Furthermore, only about 10% of pupils who had scores
4 B. Norwich et al.
Dow
nloa
ded
by [
86.1
55.1
45.1
0] a
t 13:
23 1
8 M
ay 2
014
below 70 in ordinary schools had statements. What this study also found was that itwas not low educational attainment as much as behaviour difficulties, includingsocial communication difficulties, which predicted identification as having MLD inthe school system. The researchers concluded that identifying mild intellectual dis-ability through the school SEN system would include those with behaviour difficul-ties. The main conclusion was, however, that many young people with intellectualdisabilities are not identified in the school system; but whether there may be anybenefits in doing so was at the same time also questioned (Ibid.).
These findings imply that the majority of those pupils with scores of less than70 did not have statements. However, the study did not collect data about pupilswith SEN at SA+, and so could not identify those with scores of less than 70 andidentified with SEN at SA+. This methodological gap is important as the nationalschool level statistics show that only 26% of all those recorded as having MLDnationally have a statement, whereas 74% are recognised at SA+ (DCSF 2007). Itcould be that most of the 5–10% identified as having mild ID in DSM terms in theCroydon study are identified as having SEN without a statement. However, one ofthe strengths of the Croydon study is that it used multiple measures of intellectualfunctioning and gave a range of incidence for mild ID. The high incidence found inthis study is in line with other studies using the same epidemiological identificationmethods, as noted by the authors, but may also be due to the norms of the testsbeing more than eight years old. The authors considered whether their estimation ofthe Croydon population was accurate (Simonoff et al. 2006). Another interestingaspect of these epidemiological studies comes from comparing the older Isle ofWight epidemiological study with the more recent Croydon one. In the Isle ofWight study about 37% of those with scores of less than 70 were in special schoolswhich compares with 11–13% in any special school in the Croydon study. Thischange probably represents the greater increase in provision for pupils with SEN inordinary schools.
Research context and questions
The development part of the project aimed to enhance the educational achievementsof pupils identified with MLD using Lesson Study to develop pedagogic strategies,programmes and materials for wider use in secondary schools. Lesson Study is anapproach to continuing professional development developed in Japan (Takahashiand Yashida 2004) and used widely internationally, including the UK (Dudley2004). It involves teacher collaboration in the planning, teaching and reviewing ofspecific lessons. The series of research lessons are jointly planned, observed andanalysed with the aim of improving the teaching and learning process. LessonStudy involves identifying 1–2 pupils who become the focus for planning and eval-uation, called ‘case pupils’, depending on the topic and aims of the Study. The casepupils in this project were those that participating schools identified as havingMLD.
The specific aim of this paper is to examine how the MLD category is used inidentifying pupils in the Lesson Study project schools and the pattern of scores ofthe pupils so identified in terms of their reasoning, literacy, self-concept, resilienceand attitudes to school and class learning. In addition, the paper aims to examinehow pupils who have been identified as having MLD compare with others in theirclasses who were identified as having SpLD and those with low/average attainment.
Research Papers in Education 5
Dow
nloa
ded
by [
86.1
55.1
45.1
0] a
t 13:
23 1
8 M
ay 2
014
With these aims, the paper will throw some light on the question of the usefulnessof the MLD category. The research questions were:
(1) How is the MLD category used in identifying pupils in the project schools?(2) What is the recorded level of SEN of those identified with MLD in the pro-
ject schools?(3) What is the pattern of scores of pupils with identified MLD in reasoning, lit-
eracy, academic self-concept, resilience and attitudes to school and classlearning?
(4) How do those with identified MLD compare with others in their classesidentified as having SpLD, with low and average attainment?
Methods
Design, participants and setting
The survey was conducted in 18 secondary schools located in two urban and tworural local authorities in the south-west of England at the start of the two term Les-son Study programme. However, only 14 of the schools completed the programmefully and some data therefore only relate to the following schools: 11 secondaryschools and three schools which had special school status. In each school therewere two teachers involved in the Lesson Study programme. Of the total of 34teachers 82% (n= 28) were female and 18% (n= 6) were male; 41% (n= 14) werebetween 20 and 30 years old, 24% (n= 8) were between 31 and 40 years old, 26%(n= 9) were between 41 and 50 years old and 9% (n= 3) were aged over 51. About60% (n= 20) of the teachers had less than 10 years of teaching experience while therest had been teaching for over 10 years. Teachers worked with classes which had1–3 pupils who were identified as having MLD. These pupils were the focus of thedevelopment of teaching in these Lesson Study classes. In addition, in each LessonStudy class, Lesson Study teachers were asked to choose a small number of contrastpupils who were seen as having a SpLD and low/average attaining pupils (asidentified by the school). In each school between two and three Lesson Studieswere conducted over two school terms.
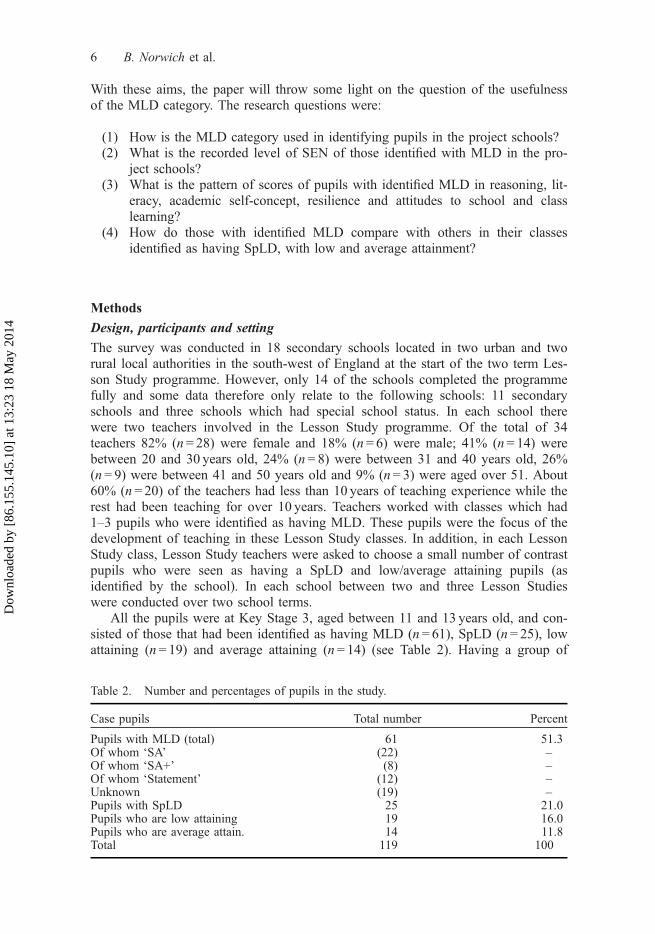
All the pupils were at Key Stage 3, aged between 11 and 13 years old, and con-sisted of those that had been identified as having MLD (n= 61), SpLD (n= 25), lowattaining (n= 19) and average attaining (n= 14) (see Table 2). Having a group of
Table 2. Number and percentages of pupils in the study.
Case pupils Total number Percent
Pupils with MLD (total) 61 51.3Of whom ‘SA’ (22) –Of whom ‘SA+’ (8) –Of whom ‘Statement’ (12) –Unknown (19) –Pupils with SpLD 25 21.0Pupils who are low attaining 19 16.0Pupils who are average attain. 14 11.8Total 119 100
6 B. Norwich et al.
Dow
nloa
ded
by [
86.1
55.1
45.1
0] a
t 13:
23 1
8 M
ay 2
014
contrast pupils enabled comparisons to be made between the four different groupsof pupils in their functioning that is relevant to the aims of the study.
Participating teachers were provided with the census definition of MLD andasked to consult with the SEN coordinators in their schools about how they identi-fied the case pupils for the Lesson Studies as having MLD. The proposed workingdefinition of MLD for each school was whether these pupils had been recorded inthe school’s annual return for the national school census. For the contrast pupils,teachers were asked to nominate those identified as having a SpLD through thesame means and those with low or average attainment, but not SEN, in terms oftheir typical attainment levels. It is clear from this selection method that the studywas focusing on how schools and teachers were using these categories in practiceby comparison with an epidemiological survey.
Though MLD should be identified only at SA+ and Statement levels for censuspurposes, some schools identified pupils as having MLD at SA level (see Table 2).This is likely to have occurred because schools can find it hard to distinguishbetween SA and SA+ as this depends on the involvement of an outside profes-sional, which is not always possible to secure.
Measures and analysis
A short questionnaire was designed to find out how the schools identified pupils ashaving MLD. Five options were provided: (i) low attainment only, (ii) low attain-ment and low intellectual levels, (iii) as not having a SpLD nor SLD, (iv) do notknow; identified by SEN staff/department and (v) as specified on a Statement. Par-ticipating teachers could tick those options which applied in their school. Out of the14 schools that completed the Lesson Study over two terms, responses to the ques-tionnaire were received from teachers at 12 schools. The instructions were for theteachers to consult the school’s SEN coordinator in completing this questionnaire sothat the responses reflected school identification practice.
All pupils were assessed individually at the pupils’ own school by two qualifiededucational researchers, who had been trained and had prior experience in usingthese kinds assessments, before the start of the Lesson Studies using a range ofmeasures to cover:
(i) Reasoning: through the British Abilities Scales (BAS II) Matrices (figuralanalogies) and Similarities (verbal concepts) scales (Elliott, Smith, andMcCulloch 2004).
(ii) Literacy: British Abilities Scales Word reading and Spelling scales (BAS II).(iii) Dispositions:
(a) Learner self concept: using Myself-as-a Learner Scale (MALS) whichassesses beliefs and evaluations about the self as a learner (Burden 2000).
(b) Resilience: using the Mastery and Agency scales of Resiliency scales(Prince-Embury 2007). The Mastery and relatedness parts of the scalesfocus on optimism, adaptability, sense of trust and comfort with others.
(c) Attitudes to Class Learning and School: These aspects were measuredwith two scales developed from using statements derived from research-based studies about pupil attitudes on five-point rating scales. Attitudes toclass learning scales consisted of five-statements asking pupils’ opinions
Research Papers in Education 7
Dow
nloa
ded
by [
86.1
55.1
45.1
0] a
t 13:
23 1
8 M
ay 2
014
on the following kinds of statements: ‘I avoid doing class work because itis too hard’1 (Cronbach’s alpha from the current study = 0.77). Attitudesto school scales had seven statements, for example, asking pupils to statewhether they agree or disagree with statements like: ‘my school gives meuseful skills and knowledge’ and ‘I get enough help at school with learn-ing’ (Cronbach’s alpha from the current study = 0.84).
This set of measures was used to assess current intellectual functioning, currentword level literacy attainments and current learning-related dispositions. The intel-lectual functioning and literacy measures were selected because of their relevanceto various conventional indicators of MLD, while the dispositional measures are rel-evant to other associated aspects of MLD, such as self-esteem – the references tothe BAS and disposition measures above show that they are designed and validatedto a high standard. While using the psychometric measures of intellectual function-ing, we are aware that these cannot be interpreted as valid measures of intelligence.The participating pupils could underperform on the scales, though the use of indi-vidual assessment and the building of personal rapport by the assessors makes thisless likely than group-based cognitive ability tests. We are aware of the issues ininterpreting scores in terms of national norms of cognitive functioning and the vari-ability in cognitive scores over time and do not assume that once-off scores indicatefixed level of intellectual functioning or potential.
Parents of the participating pupils and the pupils themselves gave informed con-sent to take part in the study. They were assured that their identities would not bedisclosed to anyone else and that data used would be analysed and reported as partof grouped data. Data have been stored electronically and are password protected.Where norms were used to interpret BAS scores, this involved either using T-scalescores (scales with means of 50 and standard deviations of 10, or standard scalescores with means of 100 and standard deviations of 15). After scoring theresponses using the appropriate procedures, data were analysed using analysis ofvariance with Tukey post hoc tests from the SPSS package. In the analysis of thedifference between literacy and reasoning scores, simple difference scores were usedrather than a regression method. This was done in line with the BAS technicalmanual (Elliott, Smith, and McCulloch 2004).
Findings
The key findings are presented in relation to the above research questions.
School identification of MLD and level of SEN
Table 3 below summarises the findings from this questionnaire.‘Low attainment only’ was chosen by teachers in three schools, while ‘low
attainment and low cognitive ability’ by teachers at another three schools. Only oneschool selected ‘not SpLD and not SLD’ (school 14 chose this with ‘low attainmentonly’). Teachers at four schools indicated that MLD had been identified by school’sSEN department. In two of the special schools the pupils had statements (schools 4and 12) while in one special school (school 7) ‘low attainment and low cognitiveability’ were said to be the deciding factor (however, from other sources we knowthat these students also have statements of SEN). Some schools/teachers gave fur-
8 B. Norwich et al.
Dow
nloa
ded
by [
86.1
55.1
45.1
0] a
t 13:
23 1
8 M
ay 2
014
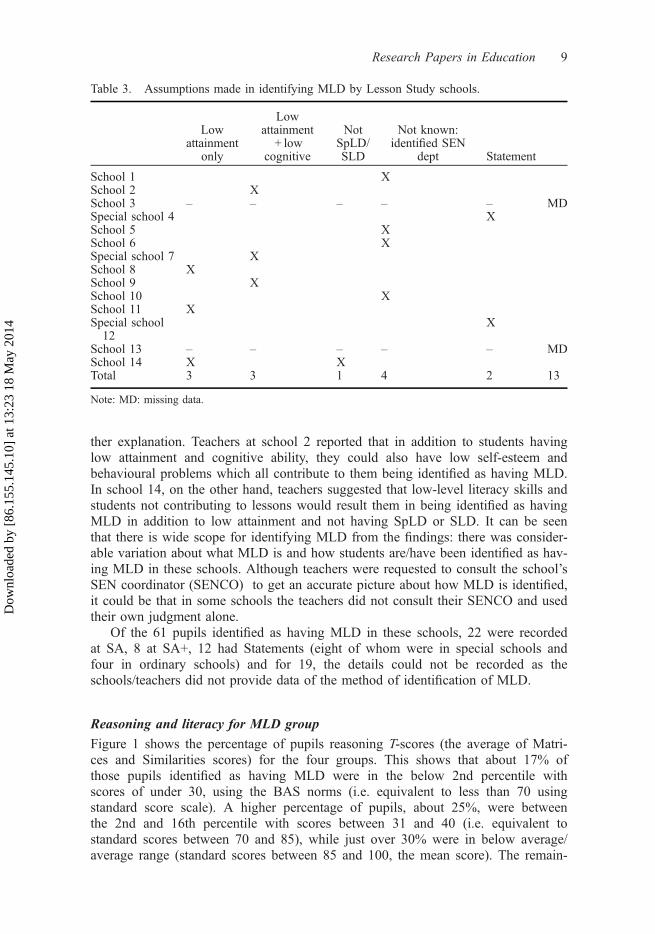
ther explanation. Teachers at school 2 reported that in addition to students havinglow attainment and cognitive ability, they could also have low self-esteem andbehavioural problems which all contribute to them being identified as having MLD.In school 14, on the other hand, teachers suggested that low-level literacy skills andstudents not contributing to lessons would result them in being identified as havingMLD in addition to low attainment and not having SpLD or SLD. It can be seenthat there is wide scope for identifying MLD from the findings: there was consider-able variation about what MLD is and how students are/have been identified as hav-ing MLD in these schools. Although teachers were requested to consult the school’sSEN coordinator (SENCO) to get an accurate picture about how MLD is identified,it could be that in some schools the teachers did not consult their SENCO and usedtheir own judgment alone.
Of the 61 pupils identified as having MLD in these schools, 22 were recordedat SA, 8 at SA+, 12 had Statements (eight of whom were in special schools andfour in ordinary schools) and for 19, the details could not be recorded as theschools/teachers did not provide data of the method of identification of MLD.
Reasoning and literacy for MLD group
Figure 1 shows the percentage of pupils reasoning T-scores (the average of Matri-ces and Similarities scores) for the four groups. This shows that about 17% ofthose pupils identified as having MLD were in the below 2nd percentile withscores of under 30, using the BAS norms (i.e. equivalent to less than 70 usingstandard score scale). A higher percentage of pupils, about 25%, were betweenthe 2nd and 16th percentile with scores between 31 and 40 (i.e. equivalent tostandard scores between 70 and 85), while just over 30% were in below average/average range (standard scores between 85 and 100, the mean score). The remain-
Table 3. Assumptions made in identifying MLD by Lesson Study schools.
Lowattainment
only
Lowattainment
+ lowcognitive
NotSpLD/SLD
Not known:identified SEN
dept Statement
School 1 XSchool 2 XSchool 3 – – – – – MDSpecial school 4 XSchool 5 XSchool 6 XSpecial school 7 XSchool 8 XSchool 9 XSchool 10 XSchool 11 XSpecial school12
X
School 13 – – – – – MDSchool 14 X XTotal 3 3 1 4 2 13
Note: MD: missing data.
Research Papers in Education 9
Dow
nloa
ded
by [
86.1
55.1
45.1
0] a
t 13:
23 1
8 M
ay 2
014
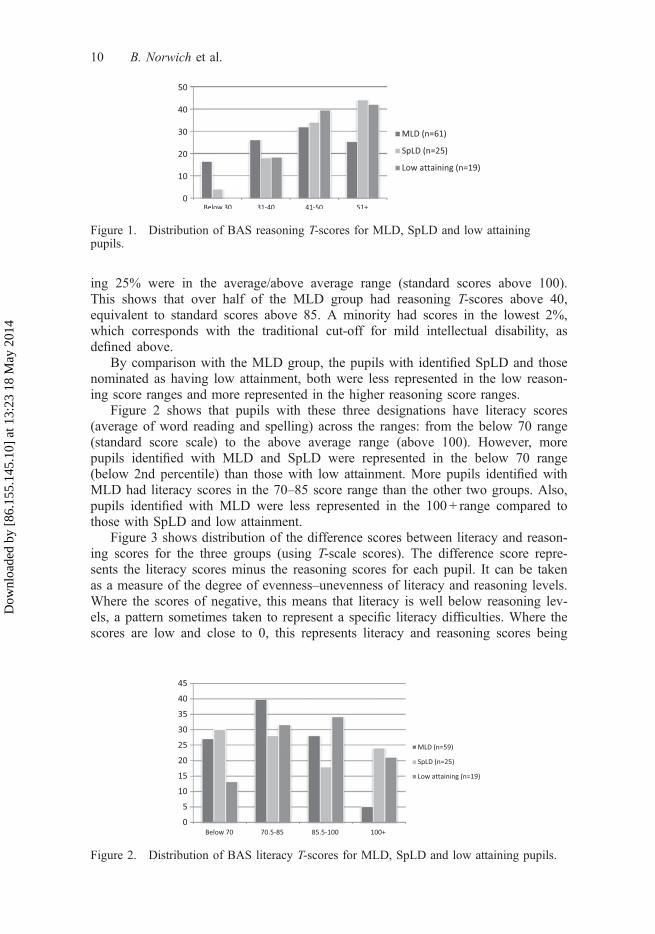
ing 25% were in the average/above average range (standard scores above 100).This shows that over half of the MLD group had reasoning T-scores above 40,equivalent to standard scores above 85. A minority had scores in the lowest 2%,which corresponds with the traditional cut-off for mild intellectual disability, asdefined above.
By comparison with the MLD group, the pupils with identified SpLD and thosenominated as having low attainment, both were less represented in the low reason-ing score ranges and more represented in the higher reasoning score ranges.
Figure 2 shows that pupils with these three designations have literacy scores(average of word reading and spelling) across the ranges: from the below 70 range(standard score scale) to the above average range (above 100). However, morepupils identified with MLD and SpLD were represented in the below 70 range(below 2nd percentile) than those with low attainment. More pupils identified withMLD had literacy scores in the 70–85 score range than the other two groups. Also,pupils identified with MLD were less represented in the 100 + range compared tothose with SpLD and low attainment.
Figure 3 shows distribution of the difference scores between literacy and reason-ing scores for the three groups (using T-scale scores). The difference score repre-sents the literacy scores minus the reasoning scores for each pupil. It can be takenas a measure of the degree of evenness–unevenness of literacy and reasoning levels.Where the scores of negative, this means that literacy is well below reasoning lev-els, a pattern sometimes taken to represent a specific literacy difficulties. Where thescores are low and close to 0, this represents literacy and reasoning scores being
Figure 1. Distribution of BAS reasoning T-scores for MLD, SpLD and low attainingpupils.
Figure 2. Distribution of BAS literacy T-scores for MLD, SpLD and low attaining pupils.
10 B. Norwich et al.
Dow
nloa
ded
by [
86.1
55.1
45.1
0] a
t 13:
23 1
8 M
ay 2
014
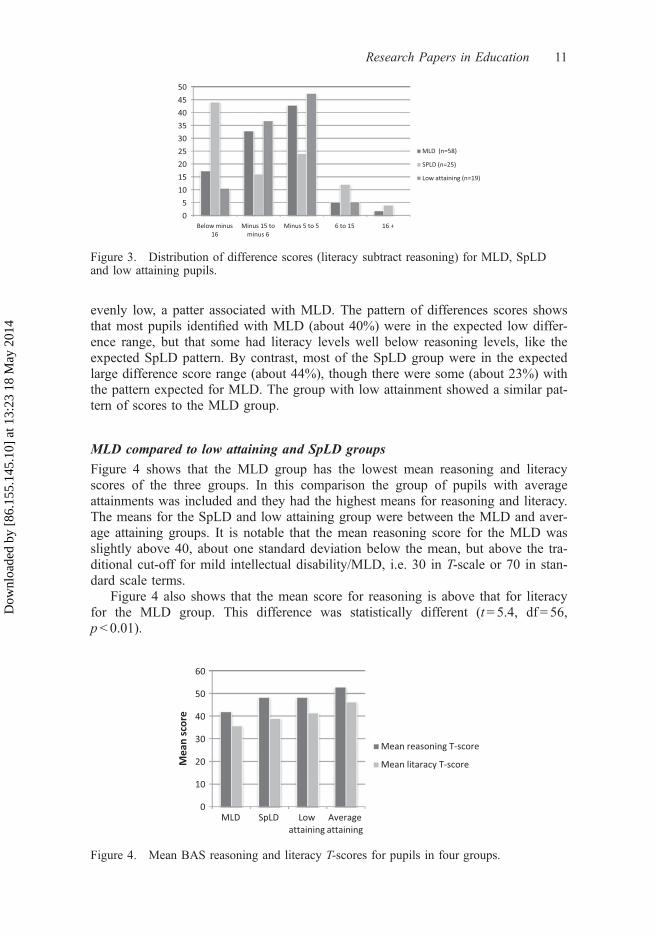
evenly low, a patter associated with MLD. The pattern of differences scores showsthat most pupils identified with MLD (about 40%) were in the expected low differ-ence range, but that some had literacy levels well below reasoning levels, like theexpected SpLD pattern. By contrast, most of the SpLD group were in the expectedlarge difference score range (about 44%), though there were some (about 23%) withthe pattern expected for MLD. The group with low attainment showed a similar pat-tern of scores to the MLD group.
MLD compared to low attaining and SpLD groups
Figure 4 shows that the MLD group has the lowest mean reasoning and literacyscores of the three groups. In this comparison the group of pupils with averageattainments was included and they had the highest means for reasoning and literacy.The means for the SpLD and low attaining group were between the MLD and aver-age attaining groups. It is notable that the mean reasoning score for the MLD wasslightly above 40, about one standard deviation below the mean, but above the tra-ditional cut-off for mild intellectual disability/MLD, i.e. 30 in T-scale or 70 in stan-dard scale terms.
Figure 4 also shows that the mean score for reasoning is above that for literacyfor the MLD group. This difference was statistically different (t= 5.4, df = 56,p< 0.01).
Figure 3. Distribution of difference scores (literacy subtract reasoning) for MLD, SpLDand low attaining pupils.
Figure 4. Mean BAS reasoning and literacy T-scores for pupils in four groups.
Research Papers in Education 11
Dow
nloa
ded
by [
86.1
55.1
45.1
0] a
t 13:
23 1
8 M
ay 2
014
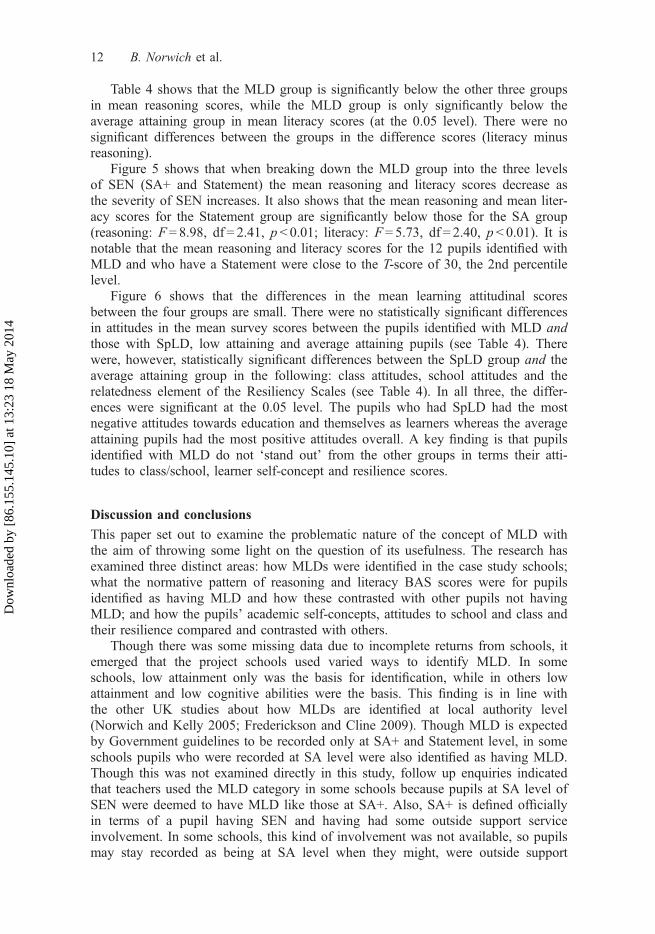
Table 4 shows that the MLD group is significantly below the other three groupsin mean reasoning scores, while the MLD group is only significantly below theaverage attaining group in mean literacy scores (at the 0.05 level). There were nosignificant differences between the groups in the difference scores (literacy minusreasoning).
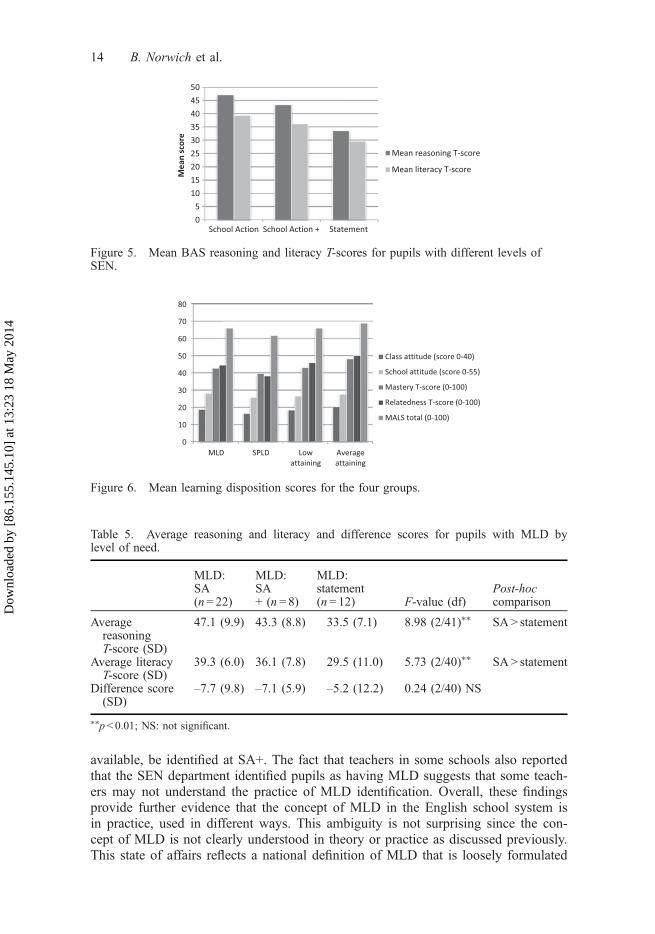
Figure 5 shows that when breaking down the MLD group into the three levelsof SEN (SA+ and Statement) the mean reasoning and literacy scores decrease asthe severity of SEN increases. It also shows that the mean reasoning and mean liter-acy scores for the Statement group are significantly below those for the SA group(reasoning: F= 8.98, df = 2.41, p< 0.01; literacy: F= 5.73, df = 2.40, p< 0.01). It isnotable that the mean reasoning and literacy scores for the 12 pupils identified withMLD and who have a Statement were close to the T-score of 30, the 2nd percentilelevel.
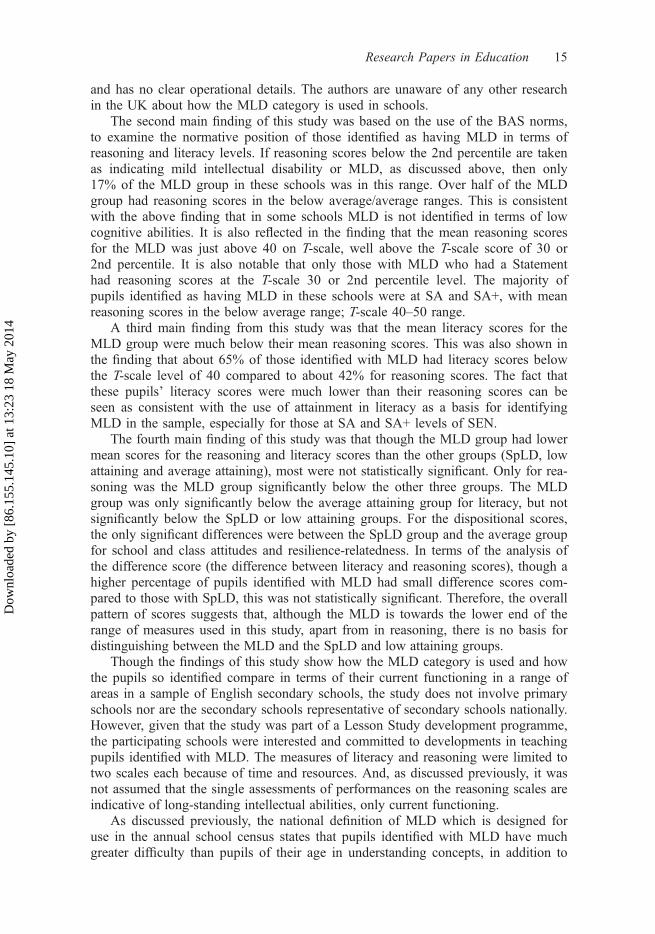
Figure 6 shows that the differences in the mean learning attitudinal scoresbetween the four groups are small. There were no statistically significant differencesin attitudes in the mean survey scores between the pupils identified with MLD andthose with SpLD, low attaining and average attaining pupils (see Table 4). Therewere, however, statistically significant differences between the SpLD group and theaverage attaining group in the following: class attitudes, school attitudes and therelatedness element of the Resiliency Scales (see Table 4). In all three, the differ-ences were significant at the 0.05 level. The pupils who had SpLD had the mostnegative attitudes towards education and themselves as learners whereas the averageattaining pupils had the most positive attitudes overall. A key finding is that pupilsidentified with MLD do not ‘stand out’ from the other groups in terms their atti-tudes to class/school, learner self-concept and resilience scores.
Discussion and conclusions
This paper set out to examine the problematic nature of the concept of MLD withthe aim of throwing some light on the question of its usefulness. The research hasexamined three distinct areas: how MLDs were identified in the case study schools;what the normative pattern of reasoning and literacy BAS scores were for pupilsidentified as having MLD and how these contrasted with other pupils not havingMLD; and how the pupils’ academic self-concepts, attitudes to school and class andtheir resilience compared and contrasted with others.
Though there was some missing data due to incomplete returns from schools, itemerged that the project schools used varied ways to identify MLD. In someschools, low attainment only was the basis for identification, while in others lowattainment and low cognitive abilities were the basis. This finding is in line withthe other UK studies about how MLDs are identified at local authority level(Norwich and Kelly 2005; Frederickson and Cline 2009). Though MLD is expectedby Government guidelines to be recorded only at SA+ and Statement level, in someschools pupils who were recorded at SA level were also identified as having MLD.Though this was not examined directly in this study, follow up enquiries indicatedthat teachers used the MLD category in some schools because pupils at SA level ofSEN were deemed to have MLD like those at SA+. Also, SA+ is defined officiallyin terms of a pupil having SEN and having had some outside support serviceinvolvement. In some schools, this kind of involvement was not available, so pupilsmay stay recorded as being at SA level when they might, were outside support
12 B. Norwich et al.
Dow
nloa
ded
by [
86.1
55.1
45.1
0] a
t 13:
23 1
8 M
ay 2
014
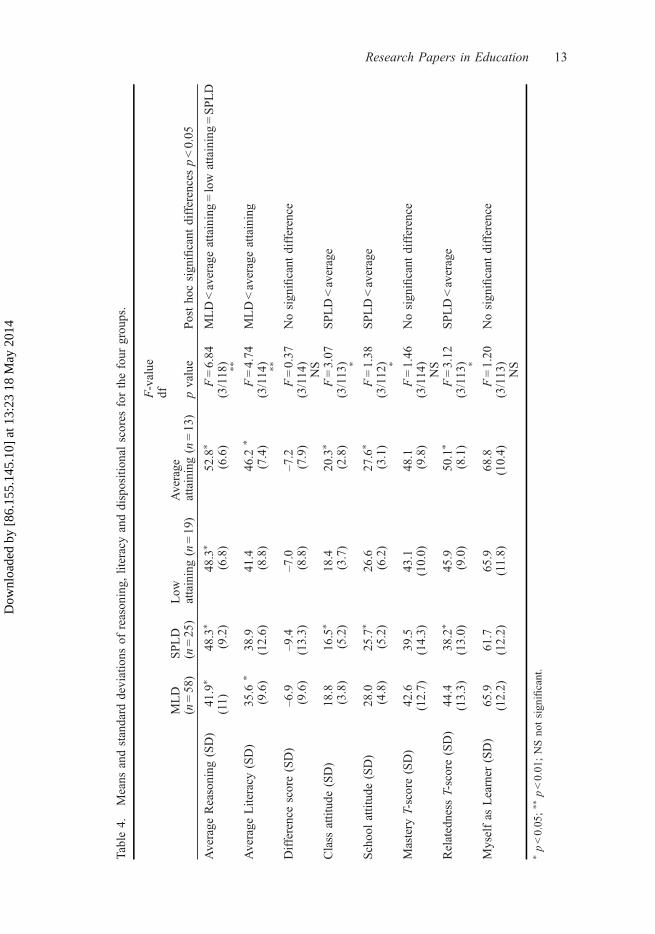
Table4.
Means
andstandard
deviations
ofreasoning,
literacyanddispositional
scores
forthefour
groups.
F-value
df
Posthocsignificant
differencesp<0.05
MLD
(n=58)
SPLD
(n=25)
Low
attaining(n=19)
Average
attaining(n=13)
pvalue
Average
Reasoning
(SD)
41.9⁄
48.3⁄
48.3⁄
52.8⁄
F=6.84
MLD<averageattaining=low
attaining=SPLD
(11)
(9.2)
(6.8)
(6.6)
(3/118) ⁄⁄
Average
Literacy
(SD)
35.6
⁄38.9
41.4
46.2
⁄F=4.74
MLD<averageattaining
(9.6)
(12.6)
(8.8)
(7.4)
(3/114) ⁄⁄
Differencescore(SD)
–6.9
–9.4
–7.0
–7.2
F=0.37
Nosignificant
difference
(9.6)
(13.3)
(8.8)
(7.9)
(3/114)
NS
Class
attitude(SD)
18.8
16.5⁄
18.4
20.3⁄
F=3.07
SPLD<average
(3.8)
(5.2)
(3.7)
(2.8)
(3/113) ⁄
Schoolattitude(SD)
28.0
25.7⁄
26.6
27.6⁄
F=1.38
SPLD<average
(4.8)
(5.2)
(6.2)
(3.1)
(3/112) ⁄
Mastery
T-score(SD)
42.6
39.5
43.1
48.1
F=1.46
Nosignificant
difference
(12.7)
(14.3)
(10.0)
(9.8)
(3/114)
NS
Relatedness
T-score(SD)
44.4
38.2⁄
45.9
50.1⁄
F=3.12
SPLD<average
(13.3)
(13.0)
(9.0)
(8.1)
(3/113) ⁄
Myselfas
Learner
(SD)
65.9
61.7
65.9
68.8
F=1.20
Nosignificant
difference
(12.2)
(12.2)
(11.8)
(10.4)
(3/113)
NS
⁄p<0.05
;⁄⁄
p<0.01
;NSno
tsign
ificant.
Research Papers in Education 13
Dow
nloa
ded
by [
86.1
55.1
45.1
0] a
t 13:
23 1
8 M
ay 2
014
available, be identified at SA+. The fact that teachers in some schools also reportedthat the SEN department identified pupils as having MLD suggests that some teach-ers may not understand the practice of MLD identification. Overall, these findingsprovide further evidence that the concept of MLD in the English school system isin practice, used in different ways. This ambiguity is not surprising since the con-cept of MLD is not clearly understood in theory or practice as discussed previously.This state of affairs reflects a national definition of MLD that is loosely formulated
Figure 5. Mean BAS reasoning and literacy T-scores for pupils with different levels ofSEN.
Figure 6. Mean learning disposition scores for the four groups.
Table 5. Average reasoning and literacy and difference scores for pupils with MLD bylevel of need.
MLD:SA(n= 22)
MLD:SA+ (n = 8)
MLD:statement(n= 12) F-value (df)
Post-hoccomparison
AveragereasoningT-score (SD)
47.1 (9.9) 43.3 (8.8) 33.5 (7.1) 8.98 (2/41)⁄⁄ SA> statement
Average literacyT-score (SD)
39.3 (6.0) 36.1 (7.8) 29.5 (11.0) 5.73 (2/40)⁄⁄ SA> statement
Difference score(SD)
–7.7 (9.8) –7.1 (5.9) –5.2 (12.2) 0.24 (2/40) NS
⁄⁄p< 0.01; NS: not significant.
14 B. Norwich et al.
Dow
nloa
ded
by [
86.1
55.1
45.1
0] a
t 13:
23 1
8 M
ay 2
014
and has no clear operational details. The authors are unaware of any other researchin the UK about how the MLD category is used in schools.
The second main finding of this study was based on the use of the BAS norms,to examine the normative position of those identified as having MLD in terms ofreasoning and literacy levels. If reasoning scores below the 2nd percentile are takenas indicating mild intellectual disability or MLD, as discussed above, then only17% of the MLD group in these schools was in this range. Over half of the MLDgroup had reasoning scores in the below average/average ranges. This is consistentwith the above finding that in some schools MLD is not identified in terms of lowcognitive abilities. It is also reflected in the finding that the mean reasoning scoresfor the MLD was just above 40 on T-scale, well above the T-scale score of 30 or2nd percentile. It is also notable that only those with MLD who had a Statementhad reasoning scores at the T-scale 30 or 2nd percentile level. The majority ofpupils identified as having MLD in these schools were at SA and SA+, with meanreasoning scores in the below average range; T-scale 40–50 range.
A third main finding from this study was that the mean literacy scores for theMLD group were much below their mean reasoning scores. This was also shown inthe finding that about 65% of those identified with MLD had literacy scores belowthe T-scale level of 40 compared to about 42% for reasoning scores. The fact thatthese pupils’ literacy scores were much lower than their reasoning scores can beseen as consistent with the use of attainment in literacy as a basis for identifyingMLD in the sample, especially for those at SA and SA+ levels of SEN.
The fourth main finding of this study was that though the MLD group had lowermean scores for the reasoning and literacy scores than the other groups (SpLD, lowattaining and average attaining), most were not statistically significant. Only for rea-soning was the MLD group significantly below the other three groups. The MLDgroup was only significantly below the average attaining group for literacy, but notsignificantly below the SpLD or low attaining groups. For the dispositional scores,the only significant differences were between the SpLD group and the average groupfor school and class attitudes and resilience-relatedness. In terms of the analysis ofthe difference score (the difference between literacy and reasoning scores), though ahigher percentage of pupils identified with MLD had small difference scores com-pared to those with SpLD, this was not statistically significant. Therefore, the overallpattern of scores suggests that, although the MLD is towards the lower end of therange of measures used in this study, apart from in reasoning, there is no basis fordistinguishing between the MLD and the SpLD and low attaining groups.
Though the findings of this study show how the MLD category is used and howthe pupils so identified compare in terms of their current functioning in a range ofareas in a sample of English secondary schools, the study does not involve primaryschools nor are the secondary schools representative of secondary schools nationally.However, given that the study was part of a Lesson Study development programme,the participating schools were interested and committed to developments in teachingpupils identified with MLD. The measures of literacy and reasoning were limited totwo scales each because of time and resources. And, as discussed previously, it wasnot assumed that the single assessments of performances on the reasoning scales areindicative of long-standing intellectual abilities, only current functioning.
As discussed previously, the national definition of MLD which is designed foruse in the annual school census states that pupils identified with MLD have muchgreater difficulty than pupils of their age in understanding concepts, in addition to
Research Papers in Education 15
Dow
nloa
ded
by [
86.1
55.1
45.1
0] a
t 13:
23 1
8 M
ay 2
014
very low attainments across the curriculum. However, this is a definition fornational reporting purposes only and not for teaching and learning or resource allo-cation purposes, for which there have been no national definitions formulated. Thisstudy shows uncertainty and important differences in how the MLD category isused in the project schools, which is reflected in the wide range of functioning forpupils identified as having MLD. The loose operational approach to identifyingMLD and the variability in functioning of those so identified could be seen to beconsistent with recent conclusions that there is an over-identification of SEN in theEngland (Ofsted 2010). However, whether SEN is over-identified generally andMLD over-identified specifically depends on the purposes of using such a category.If MLD is taken as equivalent to mild intellectual disabilities as used in health ser-vice classifications such as DSM, then the study shows that only those identified ashaving MLD and with Statements came close to meeting these criteria. And, asSimonoff et al. (2006) comment, it is unknown whether identifying pupils with mildintellectual disability is helpful to these pupils and their parents. In this study, onlymean reasoning scores were significantly below those of pupils identified as lowattaining (and without SEN), but even here the mean score was well above the mildintellectual disability cut-off.
When only low attainment is used as the definition of MLD, this represents amore educational definition and avoids the problematic issues, discussed above,about the biases in methods of assessing intellectual functioning and identifyingpupils in categoric terms. However, the findings in this study show that in terms ofliteracy and other learning-related dispositions, those identified as having MLDwere only different by degree along a continuum of functioning. The contested anduncertain position of the MLD category as used in schools, as shown in relation topupils seen as ‘low attaining’, was also evident in relation to pupils identified ashaving SpLD. Though pupils identified with MLD had much lower reasoningscores than those with SpLD, there were no statistically significant differences in lit-eracy levels, difference scores (literacy minus reasoning scores) nor any of thelearning-related dispositions scores. Hence, there was no secure basis for distin-guishing between MLD and SpLD in terms of the measures in these schools. Thisreflects on school procedures for distinguishing between MLD and SpLD in theseschools, which has a bearing on the debate about the basis for defining a SpLD/dys-lexia (Gibbs and Elliott 2010).
MLD is an area and category of special educational needs that has been muchneglected in educational research and development in England, despite its uneasybut continuing use and the high proportion of pupils identified under this category.The relatively high incidence in England compares with a much lower incidence ofmild mental retardation, the US counterpart to MLD (MacMillan, Siperstein, andGresham 1996). Mild mental retardation, which is now called mild intellectual dis-abilities, made up 8.6% of all pupils identified as having disabilities in education inthe USA in 2007 (US IDEA statistics: this covers mild, moderate and severe intellec-tual disabilities with mild being the largest sub-group). This is partly to do with thetighter US definition in terms of both intellectual functioning below 70 on standardscale (IQ scale) and low adaptive functioning outside school. The lower US inci-dence is also associated with higher percentages of children being identified as hav-ing specific learning disabilities, the counterpart to SpLD in England. MacMillan,Siperstein, and Gresham (1996) question the basis for a reliable distinct category ofmild mental retardation (mild intellectual disability) in terms that are relevant to the
16 B. Norwich et al.
Dow
nloa
ded
by [
86.1
55.1
45.1
0] a
t 13:
23 1
8 M
ay 2
014
use of MLD in England. They recommend that intellectual disabilities should bereserved for more severe forms of difficulties and that a more descriptive termshould be used for those currently identified with mild intellectual disabilities. InEngland, there is the equivalent issue of whether pupils identified as having MLDare to be considered as at the lowest end of the continuum of lower attaining pupilsor whether they have a mild-moderate intellectual disability. This is the fundamentalissue raised by the research discussed in this paper. What are the boundaries of SENand how do we define SEN – what counts as a disability in education?
The rationale for using a learner category, like MLD, is usually justified in termsof whether the categories:
(i) are reliable and valid in terms of distinguishing the group from other groups,(ii) are informative in understanding those identified and(iii) have positive consequence in terms of:
(a) resources allocation and(b) specific teaching approaches.
The research reported here relates to the first rationale and suggests that there is noevidence base for using the MLD category in some secondary schools. Whether thislimited conclusion can be generalised to other English schools depends on furtherresearch. However, other research from this project calls into question whether thereare specific MLD teaching approaches (Ylonen and Norwich 2012). The directionof this combined research is to call into question the current MLD category systemand consider alternative more refined classifications. It has been argued elsewhere(Norwich 2007) that one alternative can be provided by the development of asophisticated multi-dimensional category system based on the International Classifi-cation of Functioning (ICF: WHO 2002). This framework integrates the medicaland social models of disability and distinguishes between impairment and the otherpersonal and social factors that impact on activity and participation in differentsocial contexts. As Hollenweger (2011) has shown this requires further national andinternational commitment to research and development work about classificationsystems within an educational framework.
Note1. For data analysis these statements were reversed.
Notes on contributorsBrahm Norwich is a professor of Educational Psychology and Special Educational Needs atthe Graduate School of Education, University of Exeter. He has worked as a teacher, aprofessional educational psychologist and has researched and published widely in these fields.
Annamari Ylonen, PhD, is a research fellow at the Graduate School of Education,University of Exeter. Her research interests include issues of inclusion, exclusion and socialjustice in education.
Ruth Gwernan-Jones, PhD, is an associate research fellow at the Peninsula College ofMedicine and Dentistry at The University of Exeter. Her research interests include inclusionand special educational needs, particularly in relation to learning difficulties.
Research Papers in Education 17
Dow
nloa
ded
by [
86.1
55.1
45.1
0] a
t 13:
23 1
8 M
ay 2
014
ReferencesAPA. 2000. DSM IV-TR: Diagnostic and statistical manual of mental disorders-Text
revision. 4th ed. Washington, DC: American Psychiatric Association.Booth, T., and M. Ainscow. 2011. Index for inclusion: Developing learning and participa-
tion in schools. 3rd ed. Bristol: CSIE.Burden, R. 2000. Myself as a leaner scale. Windsor: NFER-Nelson.Chazan, M. 1964. The incidence and nature of maladjustment among children in schools for
the educationally subnormal. British Journal of Educational Psychology 35: 292–304.Clarke, A.D.B., and A.M. Clarke. 1974. The changing concept of intelligence: A selective his-
torical review. In Mental deficiency: The changing outlook, ed. A.M. Clarke and A.D.B.Clarke, 143–63. London: Methuen.
Copeland, I. 2002. The backward pupil over a cycle of a century. Leicestershire: UpfrontPublishing.
DCSF. 2007. SEN and statistics in England 2007: Statistical first release. London: DCSF.DES. 1978. Special educational needs, report of the committee of enquiry into the education
of handicapped children and young people (The Warnock Report). London: HMSO.Desforges, C. 2006. Review of literature about pupils with moderate learning difficulties.
London: Esmee Fairbairn Foundation.DfE. 2010. Special Educational Needs: Statistical first release. http://www.education.gov.uk/
rsgateway/DB/SFR/s001007/sfr14-2011v2.pdf (accessed September 11, 2011).DfE. 2011. Support and aspiration: A new approach to special educational needs and dis-
ability. London: HMSO.DfES. 2001. Special educational needs code of practice. London: DfES.DfES. 2003. Data collection by type of special educational needs. London: DfES.Dudley P., 2004. Lessons for learning: Research Lesson Study, innovation, transfer and
meta-pedagogy; a design experiment? Paper presented at 5th annual Conference of theTLRP, November 22–24, in Cardiff.
Elliott, C.D., P. Smith, and K. McCulloch. 2004. British ability scales . 2nd ed. Windsor:NFER-Nelson.
Frederickson, N., and T. Cline. 2009. Special educational needs, inclusion and diversity.Maidenhead: McGraw Hill.
Gibbs, S.J., and J.G. Elliott. 2010. Dyslexia: A categorical falsehood without validity or util-ity. In Advances in learning and behavioral disabilities: Vol. 2 Literacy and Learning,ed. T.E. Scruggs and M.A. Mastopieri, 287–302. Bingley: Emerald.
Hollenweger, J. 2011. Development of an ICF-based eligibility procedure for education inSwitzerland. BMC Public Health 11, Suppl no. 5: 1–8.
MacMillan, D., G.N. Siperstein, and F.M. Gresham. 1996. A challenge to the viability ofmild mental retardation as a diagnostic category. Exceptional Children 62, no. 4:356–71.
Norwich, B., and N. Kelly. 2005. Moderate learning difficulties and the future of inclusion.London: RoutlegeFalmer.
Norwich, B. 2007. Categories of special educational needs. In The sage handbook of specialeducation, ed. L. Florian, 55–66. London: Sage.
NUT. 2011. Response from NUT to Green Paper, June 2011. www.teachers.org.uk/files/resp-from-nut-to-green-paper-june11-je.doc (accessed September, 11).
Ofsted. 2010. The special educational needs and disability review: A statement is notenough. London: HMSO.
Oliver, M. 2004. The social model in action: If I had a hammer. In Implementing the socialmodel of disability: Theory and research, ed. C. Barnes and G. Mercer, 18–31. Leeds:The Disability Press.
Porter, J., H. Daniels, A. Feiler, and J. Georgeson. 2011. Collecting disability data from par-ents. Research Papers in Education 26, no. 4: 427–42.
Prince-Embury, S. 2007. Resiliency scales for children and adolescents: A profile of personalstrengths. San Antonio, TX: Pearson.
Roeleveld, N., G.A. Zeilheis, and F. Gabreels. 1997. The prevalence of mental retardation:A critical review of recent literature. Developmental Medicine and Child Neurology 39:125–32.
18 B. Norwich et al.
Dow
nloa
ded
by [
86.1
55.1
45.1
0] a
t 13:
23 1
8 M
ay 2
014
Rutter, M., J. Tizard, and K. Whitmore. 1970. Education, health and behaviour. London:Longman.
Simonoff, E., A. Pickles, O. Chadwick, P. Gringras, N. Wood, S. Higgins, J. Maney,N. Karia, H. Iqbal, and A. Moore. 2006. The Croydon assessment of learning study:Prevalence and educational identification of mild mental retardation. Journal of ChildPsychology and Psychiatry 47, no. 8: 828–39.
Takahashi, A., and M. Yashida. 2004. Ideas for establishing lesson-study communities.Teaching Children Mathematics May: 436–43.
Tomlinson, S. 1982. A sociology of special education. London: Routledge, Kegan and Paul.Tomlinson, S. 1985. The expansion of special education. Oxford Review of Education 11,
no. 2: 157–65.WHO. 2002. International classification of functioning, disability and health: Towards a
common language for functioning, disability and health. Geneva: WHO.Ylonen, A., and B. Norwich. 2012. Using lesson study to develop teaching approaches for
secondary school pupils with moderate learning difficulties: Teachers’ concepts, attitudesand pedagogic strategies. European Journal of Special Needs Education 27, no. 3:301–17.
Yule, W. 1975. Psychological and medical concepts. In Orientations in special education,ed. K. Wedell, 17–41. London: Wiley.
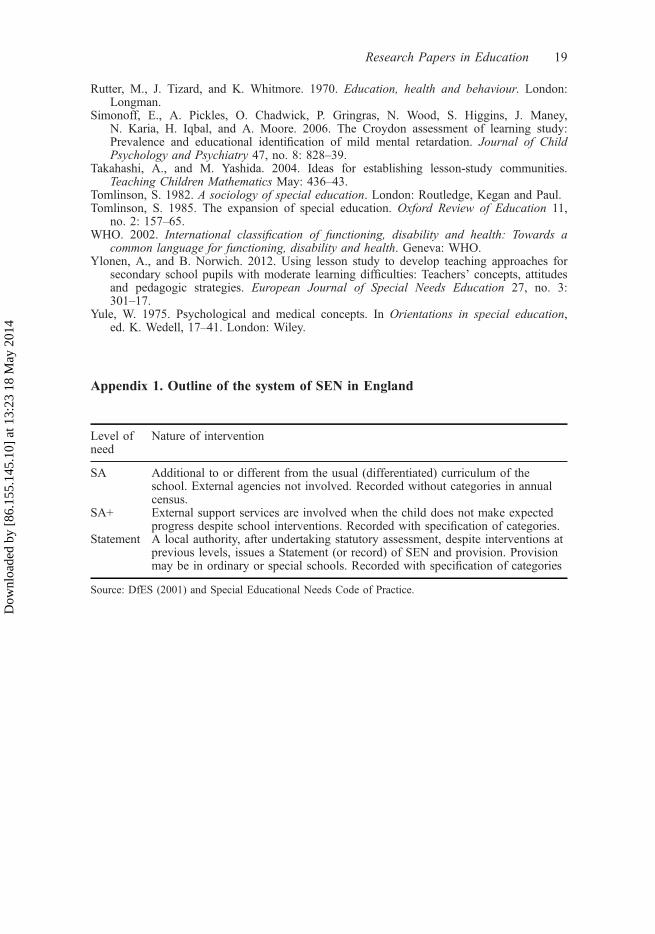
Appendix 1. Outline of the system of SEN in England
Level ofneed
Nature of intervention
SA Additional to or different from the usual (differentiated) curriculum of theschool. External agencies not involved. Recorded without categories in annualcensus.
SA+ External support services are involved when the child does not make expectedprogress despite school interventions. Recorded with specification of categories.
Statement A local authority, after undertaking statutory assessment, despite interventions atprevious levels, issues a Statement (or record) of SEN and provision. Provisionmay be in ordinary or special schools. Recorded with specification of categories
Source: DfES (2001) and Special Educational Needs Code of Practice.
Research Papers in Education 19
Dow
nloa
ded
by [
86.1
55.1
45.1
0] a
t 13:
23 1
8 M
ay 2
014