Embed Size (px)
Citation preview

Models of Excellence
Georgia’s Health Priorities August 07, 2015
Brenda Fitzgerald, M.D.
Commissioner and State Health Officer
Georgia Department of Public Health


Inform
The Hedgehog Concept
Protect Prevent

Mission of Public Health
• PREVENT
disease, injury,
disability
• PROMOTE
health and well
being
• PREPARE for
and respond to
disasters

Georgia Department of Public Health
Key Initiatives
2
0
1
2
I
n
i
t
i
a
t
i
v
e
s
O
b
e
s
i
t
y
Asthma
I
m
m
u
n
i
z
a
t
i
o
n
Prescription Drug Overdose
T
o
b
a
c
c
o
Access to Healthcare
I
n
f
a
n
t
M
o
r
t
a
l
i
t
y
Telehealth
• Reduce preventable
infant mortality rate
from 6.3% to 5.3%
• Get all children on a
path to 3rd grade
reading competency
• Increase the
percentage of Georgia
students in the
healthy fitness zone
• Eliminate pediatric
asthma deaths by
2019
• Reduce the number of
adults hospitalized for
diabetes/hypertension
• Identify, establish and
maintain programs
and services to
increase access to
healthcare by 2019
• Develop infrastructure
to promote health
and wellbeing by
collecting, analyzing
and reporting health
data, tracking disease,
and applying science
and epidemiological
principles to support
decisions
• By 2019, improve
infrastructure to
prepare for and
respond to
emergencies
• Recruit, develop and
retain work force with
skills focused on the
following
competencies: core,
organizational,
leadership, and job
specific/professional
Prevent Disease, Injury
and Disability Promote Health and
Wellbeing
Prepare for and
Respond to
Emergencies

Georgia Infant Mortality Rate America’s Health Rankings
Georgia
IMR
U.S.
Rank
2012 7.7 44
2013 6.93 34
2014 6.6 31
Source: America’s Health Rankings 2014
48% DECREASE SINCE 1990

Georgia Infant Mortality Clusters 2002-2006

Georgia Infant Mortality Clusters 2002-2006
Atlanta
Area
Augusta
Area
Columbus
Area
Macon
Area
Savannah
Area
Valdosta
Area
11.8
15.1
15.8
14.7
13.3
17.5
Georgia IMR 2002-2006 = 8.4 deaths per 1,000 live births

Leading Causes of Infant Death
by Cluster
A B C D E F
Congenital malformations, chromosomal
abnormalities 2 3 2 2 3 3
Newborn affected by maternal complications
of pregnancy 2
Respiratory distress of newborn 1
Short for gestational age, LBW, not otherwise
classified 1 2 1 1 1 1
Sudden infant death syndrome 3 3 3 2

Leading Causes of Infant Mortality
in Georgia 2002-2006
Cause of Death Number
% of
Total
Deaths
Rank
Disorders related to short
gestation and low birth
weight
1117 19.5 1
Congenital malformations,
deformations and
chromosomal abnormalities 964 16.8 2
Sudden unexpected infant
death 621 10.8 3

Projected Preventable
Infant Mortality Rate
4.0
5.0
6.0
7.0
8.0
9.0
10.0
Observed IMR Projected IMR
2019 PIMR
5.4
2013 PIMR
6.3
Source: GA Office of Health Indicators for Planning

Objective 1:
Strengthen the
Regional Perinatal
System
Objective 2:
Develop targeted
educational
campaigns
Objective 3:
Develop external
collaborations to
support initiatives
RPC standards of care
17-Hydroxy P Registry
Fetal/Infant mortality
review committee
Maternal mortality
review committee
Community-based home
visitation programs
Tobacco Cessation
Safe Sleep
Breastfeeding and
Baby-Friendly
Hospitals &
Businesses
Early Elective
Deliveries
1115 Waiver Utilization
to Improve Birth
Spacing & Conception
Planning
Perinatal Quality
Collaborative
Infant Mortality Reduction Strategic
Plan (2012–2016)
LARC Placement

Smoking Before and During Pregnancy
Live Birth Delivery
Source: Georgia PRAMS 2008-2012

Georgia Tobacco Quitline
• 24 hours a day, 7 days a week
• English: 1.877.270.STOP (1.877.270.7867)
• Spanish: 1.877.2NO.FUME (1.877.266.3863)
• Hearing Impaired, TTY Services: 1.877.777.6534

GA Early Elective Deliveries
Reduced 39-week elective deliveries
• Public and private collaboration
Georgia Hospital Association
March of Dimes
GA OB/GYN Society
GA Chapter of American Academy of
Pediatrics
• 2009: 65%

4.73% 4.71% 4.59% 4.24%
5.94%
6.51% 6.19%
5.66%
37 weeks 38 weeks 39 weeks 40 weeks
All Deliveries Non-medically Indicated Elective Deliveries
Percent of 37-40 Weeks
Admitted to NICU

2.66% 2.78% 2.83%
2.60%
3.33%
3.86% 3.67% 3.68%
37 weeks 38 weeks 39 weeks 40 weeks
All Deliveries Non-medically Indicated Elective Deliveries
Percent of 37-40 Weeks
Assisted Ventilation

1.01% 1%
1.10%
0.94%
1.25% 1.19%
1.33%
1.14%
37 weeks 38 weeks 39 weeks 40 weeks
All Deliveries Non-medically Indicated Elective Deliveries
Percent of 37-40 Weeks
On Antibiotics

Math Standardized
Score
ELA Standardized
Score
Reading Standardized
Score
37 Weeks Gestation 335.4 326.9 337.5
39 Weeks Gestation 337.5 328.5 339.3
320.0
322.0
324.0
326.0
328.0
330.0
332.0
334.0
336.0
338.0
340.0
342.0
Sta
nd
ard
ized
Scale
Sco
re f
or
CR
CT
The Relationship Between Standardized
Test Scores and Gestational Age (Adjusted for mother’s age and education level)

35 weeks 39 - 40 weeks
A baby’s brain at 35 weeks
weighs only two-thirds
of what it will weigh at 39 to 40 weeks.

2015 % of
Hospitals
Reporting
January 0.76% 87%
February 0.63% 80%
March 0.44% 84%
April 0.62% 74%
May 0.79% 59%
Georgia Early Elective Deliveries
Source: Georgia Hospital Association
Georgia has
been under
the national
2% standard
for the past 21
months

Repeat Preterm Births
• Women who have a premature delivery are
approximately three times more likely to
have a subsequent preterm birth than
women whose prior birth was term
• The relative risks are lower (2.3) for Black,
non-Hispanic women than White, non-
Hispanic women (3.4)
• Hispanic women appear to be under-
represented in the linking of birth events

Source: Office of Health Indicators for Planning (OHIP)
Georgia Department of Public Health
Repeat
Preterm Births
2009-2013
This map presents data from
a preliminary analysis of
repeat preterm births using
GA resident singleton births
in 2009 linked to repeat
births in 2009 – 2013.

Immediate Postpartum
LARC Placement
• Prevents rapid repeat pregnancy-
associated risks Maternal mortality
Preterm labor
Low birthrate
Neonatal death
• Medicaid reimbursement (April
2014)
Increasing Postpartum
LARC Placement
• Collaboration with Georgia ObGyn
Society, Emory, Peach State
Provider training (186 providers
trained to date)
Online modules for training
resources
Peach State grant to purchase pelvic
models for residency training
programs
Patient information

Georgia Infant Sleep-Related Deaths
103 infants died
in Georgia
due to
sleep-related causes
2015
January 12
February 14
March 20
April 18
May 14
June 19
July 6
Source: CDC SDY Report January 1 – July 17, 2015
In just the first seven months of 2015

Georgia’s Safe to Sleep Campaign
Educational Flipchart for
Patient Education and/or
training for staff on
effective Safe Sleep
education.
Step by step guide
for starting a
hospital-based safe
to sleep program.
Patient Education
handouts, board
books and other
resources.

Alone – Babies should
always have their own
safe, firm sleep space. No
sharing of the sleep space
with others, adults or
children.
Back – Babies should be
placed on their backs every
sleep, every time, even
naps.
Crib – Babies should sleep
in cribs without blankets,
quilts, crib bumpers or
toys. Babies should not be
placed on couches or adult
beds for sleep.
Safe Sleep for Babies

Provided by Georgia Bureau of Investigation

Georgia Childhood Obesity
Georgia ranks 17th in the nation
for childhood obesity
(Georgia ranked second in 2009)

Percent Meeting Physical
Activity Recommendations

Georgia FitnessGram Results
2013-2014 • 1,082,721 (71%) students tested
• 40% of Georgia students (grades 1-12) not
in Healthy Fitness Zone (HFZ) for body
composition (BMI)
• 19% of Georgia students (grades 4-12) in
the HFZ for every basic fitness test
component
• 22% of Georgia students (grades 4-12) not
in HFZ for any basic fitness test
component

Physical Activity and
Academic Performance • Physical Activity Across the Curriculum
(University of Kansas 2009) 26 elementary schools, 3 years
90 minutes a week during classroom lessons
10 minutes, intermittently during the day,
during language arts and mathematics
Significant improvements in academic
achievement in reading, math, and spelling
scores

Physical Activity and
Academic Performance
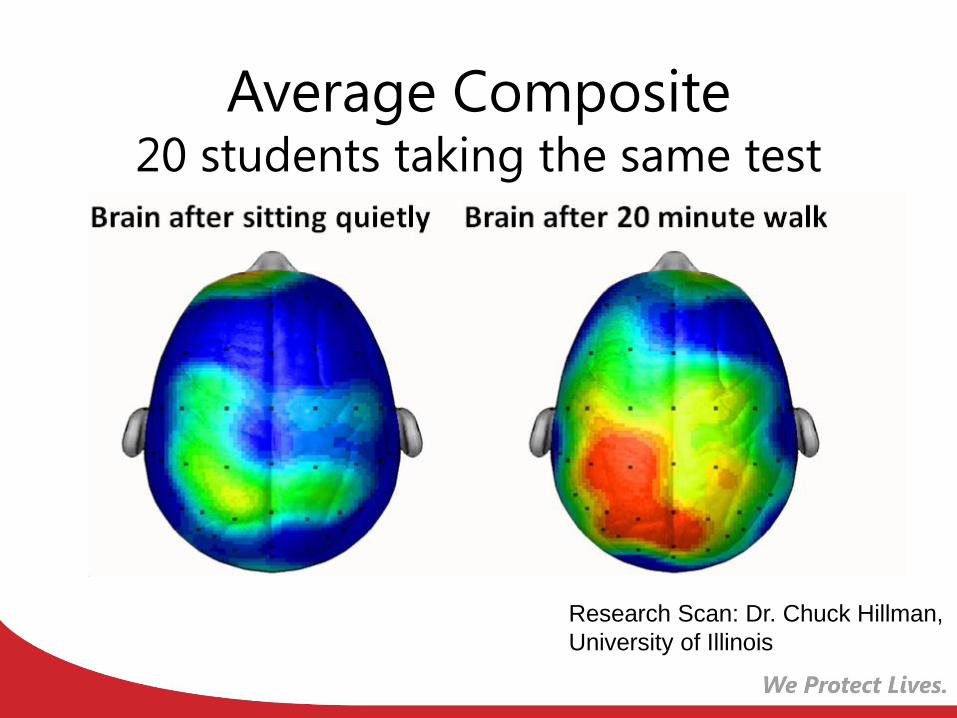
Average Composite 20 students taking the same test
Research Scan: Dr. Chuck Hillman,
University of Illinois
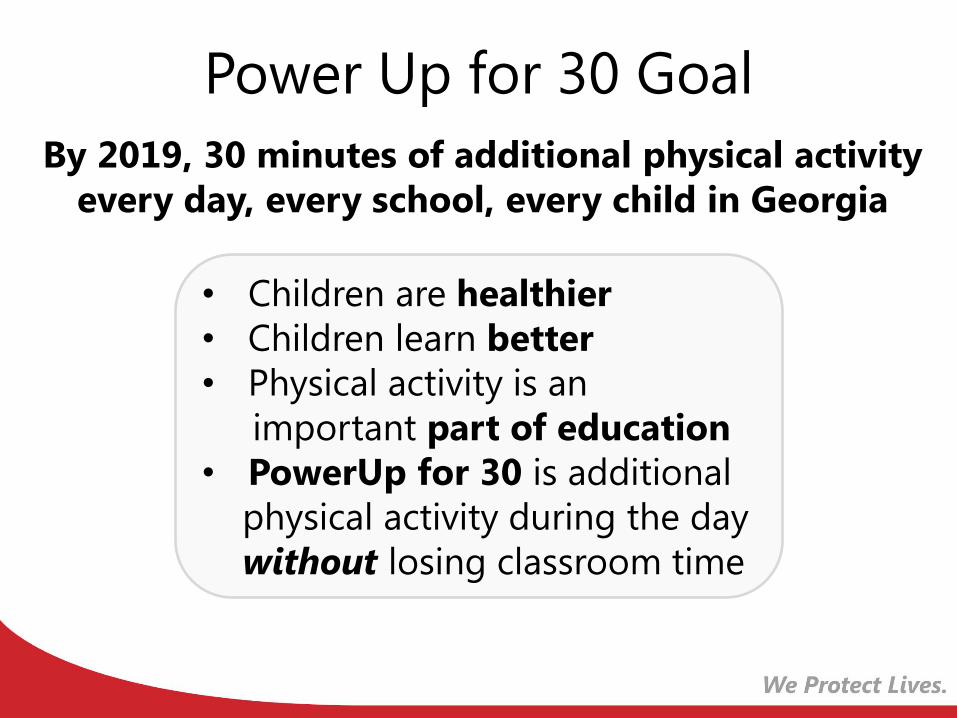
Power Up for 30 Goal
By 2019, 30 minutes of additional physical activity
every day, every school, every child in Georgia
• Children are healthier
• Children learn better
• Physical activity is an
important part of education
• PowerUp for 30 is additional
physical activity during the day
without losing classroom time

Power Up for 30
Pledge Status
602 Schools
Pledged
465 Schools
Trained
July, 2015
Georgia Childhood Obesity
Systems Model
• Originally created in 2007-2008 with
legislators, their staff and subject matter
experts
• Features healthcare, school, transportation,
education interventions or “levers” that are
funded through legislative decisions
• Informed by peer-reviewed journal articles
specifically, the caloric impact of an
intervention
• Georgia childhood obesity prevalence
across all age groups at baseline is 18%

Georgia SHAPE Impact Power Up for 30 in 50% of schools Power Up for 30 in 100% of schools
Reaching 50% of Georgia elementary
schools with Power Up for 30 and
sustaining it over time; within 5 years,
childhood obesity prevalence may
decline to 17%
Reaching 100% of Georgia elementary
schools with Power Up for 30 and
sustaining it over time; by 2034,
childhood obesity prevalence may
decline to 11.1%
Source: Georgia State University
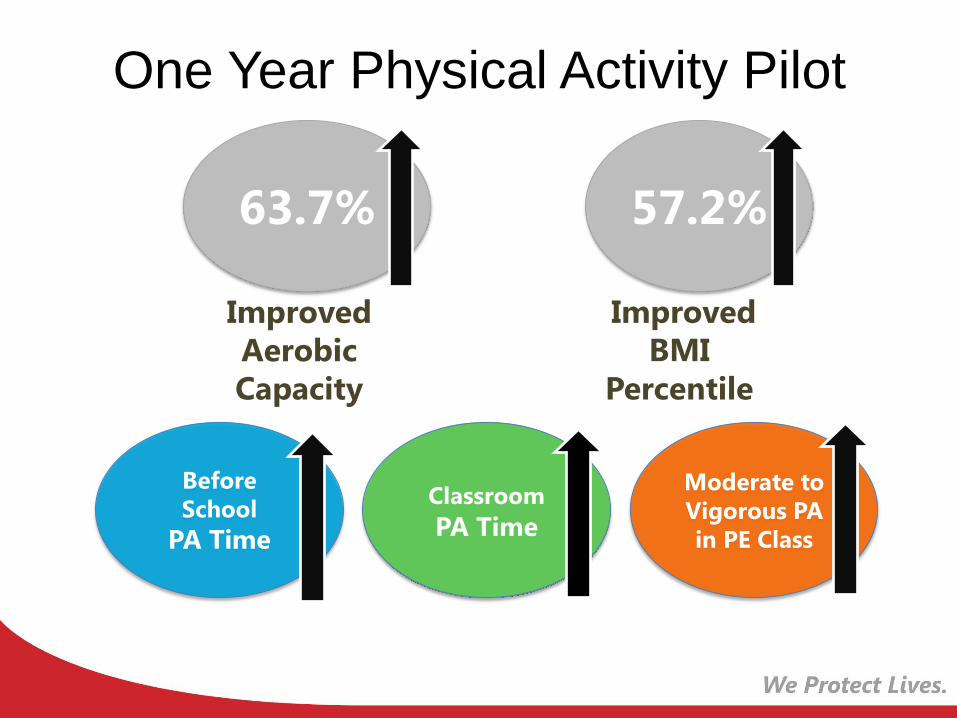
One Year Physical Activity Pilot
63.7%
Improved
Aerobic
Capacity
57.2%
Improved
BMI
Percentile
Before
School
PA Time
Classroom
PA Time
Moderate to
Vigorous PA
in PE Class

Physical Activity and
Academic Performance
Cobb County
School District
students in HFZ
for Aerobic
Capacity
Scored HIGHER
in math and
reading
Academic Scores by Aerobic Fitness HFZ

Physical Activity and
Academic Performance
Cobb County
School District
students in HFZ
for Aerobic
Capacity
Reported
FEWER
discipline
referrals
Percentage of Discipline Referrals by
Aerobic Fitness HFZ

Physical Activity and
Academic Performance
95.8%
95.9%
96.0%
96.1%
96.2%
96.3%
96.4%
96.5%H
un
dre
ds
ADA
Cobb County
School District
students in HFZ
for Aerobic
Capacity
Recorded
BETTER
average daily
attendance

Georgia SHAPE Collective Impact
Academic Research:
Programs & Policies
Investment Resources and TA:
• Action for Healthy Kids
• Alliance for a Healthier
Generation
• Children’s Healthcare
• Georgia Organics
• HealthMPowers
• Academic Institutions
Power Up for 30
SHAPE Mini-Grants
Professional Development
Georgia School PA
& Nutrition
Toolkits
Recognition
• SHAPE Honor Roll
• Quality Rated SHAPE
• Alliance Awards
State Agency Collaboration
DOE, DPH, AGR, DCH,
DFACS,
DOAS, DBHDD Private Companies & Foundations:
BCBS, Centene, The Coca-Cola
Company
GEORGIA
SCHOOLS

Source: Hart & Risley, 1995
THE GROWING BRAIN IS SHAPED BY
THE EXPERIENCES AROUND IT
Abuse
Hunger
Unsafe
housing
Maternal
depression
Poverty
Neglect
Adult resilience
Strong, supportive
relationships
Healthy communities &
families
Lots of loving words and
interactions
Laughter, serve & return
Proper nutrition & clinical care

30 Million Word Gap
High Income Working Class Poverty
43 MILLION
24 MILLION
11 MILLION
Source: Hart & Risley

Window of Opportunity

Language Nutrition
Increases neurological development
Leads to the ability to read
Leads to high school graduation
Influences economic
success

A Population-Based Approach:
From Universal Design to Targeted Interventions
All of Georgia’s Children
No Known
Factors
Medical
Factors
Trauma
Factors
Developmental
Factors
System
Community
Individual
State Agencies, Employers, Insurance, Professional Organizations
Non-profits, Faith-based Organizations, Hospitals & Practices,
Schools, Local Businesses, Local Governments, Early Childcare
Centers
Providers, Teachers, Families, Caregivers
Economic
Factors
No
Known
Factors

GA WIC- Talk With Me Baby
• Random sample of children (18-24 months)
assessed for language, speech, and
communication patterns
• 900 Georgia WIC staff trained on language
nutrition
• 199 WIC centers integrated language nutrition
messages into their centers
• Nutritionists discuss modeling behaviors with
clients, encouraging parents to talk with their
• DVDs play in waiting rooms
• Educational materials provided to clients


Georgia Pathway to
Language and Literacy
Coalition Partners
• Atlanta Area School for the
Deaf
• Atlanta Speech School
• Georgia Department of
Education
• Georgia Department of Public
Health
• Georgia Hands & Voices
• Georgia Pathway to Language
and Literacy
• Georgia School for the Deaf
• Get Georgia Reading
• The Auditory-Verbal Center
• Recognition that
interactions and
transactions from ages
0-5 are key
• Shift in focus from
professionals only to
include parents and
agencies
• Coalition focus,
increased work with
community
partnerships

Georgia’s Pathway to
Language Development
• 35 hours per week of meaningful language
with children
Native language in the home
Access to language regardless of modality
(ASL, LSL, or both)
• Diagnosis and intervention by 6 months
Significantly better language scores,
regardless of communication modality

Age At Identification Metro-Atlanta
Frequency Percent Cumulative
Percent
Newborn 43 30.9 30.9
1-6 months 22 15.8 46.7
7-12 months 15 10.8 57.5
13-18 months 17 12.2 69.7
19-24 months 18 12.9 82.6
25-30 months 10 7.2 89.8
31 months + 14 10.1 100
TOTAL 139 100 100
47% of D/HH children were identified
within 6 months
Source: Dr. Susan Easterbrooks, GSU

Age At Intervention Metro-Atlanta
Frequency Percent Cumulative
Percent
Newborn 1 .7 .7
1-6 months 30 21.6 22.3
7-12 months 25 18.0 40.3
13-18 months 13 9.4 49.6
19-24 months 32 23.0 72.7
25-30 months 8 5.8 78.4
31 months + 30 21.6 100
TOTAL 139 100 100
Only 22% of D/HH children were in
intervention at 6 months
Source: Dr. Susan Easterbrooks, GSU

Riley’s Path to Reading on Grade
Level by 3rd Grade By 2020, each child and every child who is deaf or hard of hearing (DHH)
will be on a path to grade level reading, regardless of language or
communication modality.

Georgia Newborns
• 130,000
babies born
annually
• 4 percent
require follow
up after initial
newborn
hearing
screening

100 Babies Program Overview
Collaborative Initiative • Georgia DPH, Georgia Department of Education,
Georgia Pathway
Program Goal • D/HH children in Georgia have Birth to Literacy Plan
• D/HH children read at grade level by third grade
Identification and Intervention • 100 Babies program children are assigned a
Georgia Testing Identification number
• Linked to Statewide Longitudinal Data System
• Track, match and collect hearing screening and
intervention data for evaluation
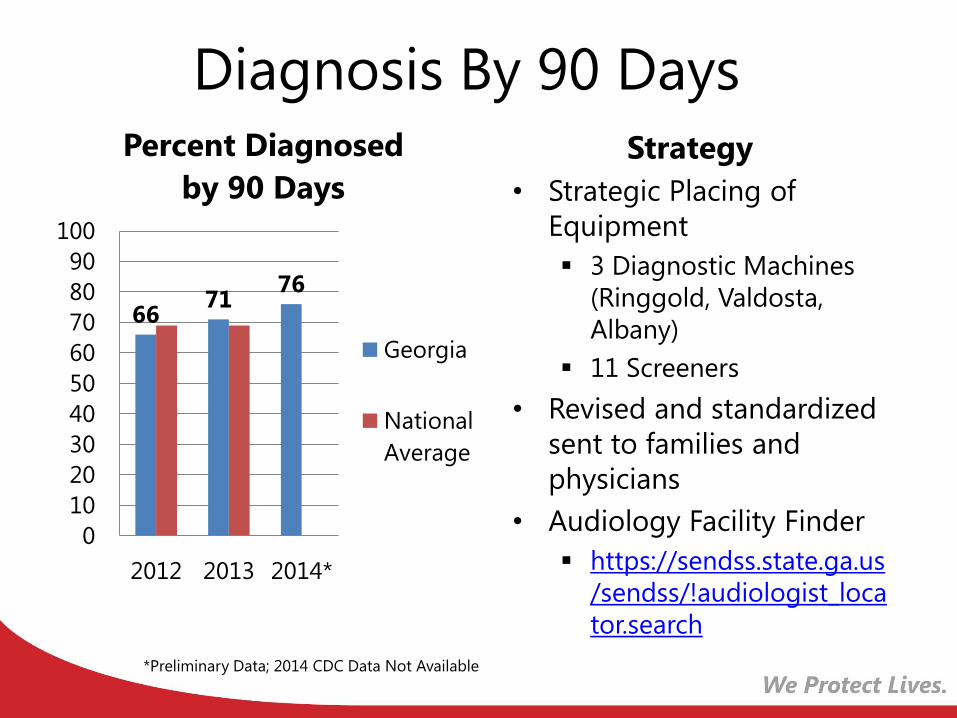
Diagnosis By 90 Days
66 71
76
0
10
20
30
40
50
60
70
80
90
100
2012 2013 2014*
Percent Diagnosed
by 90 Days
Georgia
National
Average
Strategy
• Strategic Placing of
Equipment
3 Diagnostic Machines
(Ringgold, Valdosta,
Albany)
11 Screeners
• Revised and standardized
sent to families and
physicians
• Audiology Facility Finder
https://sendss.state.ga.us
/sendss/!audiologist_loca
tor.search
*Preliminary Data; 2014 CDC Data Not Available

Loss to Follow-Up
Percent Loss to Follow-Up
44
32
0
10
20
30
40
50
60
70
80
90
100
2012 2013
Georgia
National
Average
• Communication to
Audiologists
• Follow-up Protocol built
into SendSS
Minimum 13 steps before
closing
• Fully Staffed
• Created notifications in
SendSS
Strategy

Enrolled in Intervention by 6 Months
60 66
0
10
20
30
40
50
60
70
80
90
100
2012 2013
Percent Enrolled in
Intervention by
6 Months
Georgia
National
Average
Strategy
• Intervention logs
from Georgia PINES
received and entered
monthly
• Three private
intervention providers
documenting
intervention
enrollment in SendSS

Georgia 2012
Ranking
2013
Ranking
Babies
diagnosed by
three months
26 19
Loss to follow-
up 34 26
Babies enrolled
in intervention
by six months
30 27
Source: CDC State Ranking for Deaf and Hard of Hearing
Performance Measures
Georgia’s Progress

Brain Trust 4 Babies Participants
• Department of Community
Health
• Department of Early Care and
Learning
• Department of Public Health
• Division of Family and Children’s
Services
• Head Start of Georgia
• Emory University School of
Medicine, Department of Pediatrics
• Emory University School of
Nursing
• Georgia State University
• Morehouse School of Medicine
Public Agencies
• Arthur M. Blank Family
Foundation
• Atlanta Speech School
• Children’s Healthcare of
Atlanta
• Concerned Black Clergy
• Georgia Chapter, American
Academy of Pediatrics
• Georgia Family Connection
Partnership
• Georgia Hospital Association
• La Amistad
• Marcus Autism Center
• Urban League
• Voices for Georgia’s Children
Academics
Private Organizations

Community Engagement &
Awareness Education & Training
Research Funding Policy
Increased access through
partnerships Data & Evaluation
Brain Trust 4 Babies
Early Brain Development as Statewide Priority
Family Engagement
Primacy of Language
Prenatal
Care Newborn
Care
Co-
Morbidities Trauma
Prevention
Language-
rich
Interactions
Safe,
Supportive
Communities
Mental
Health

Georgia Post-Arrival Ebola Monitoring October 24, 2014-August 6, 2015
Georgia DPH Epidemiology Section 08-06-15
• Individuals monitored: 2,095
• Clinical inquiries: 312
• Individuals from Sierra Leone and
Guinea currently being monitored: 93
• Individuals from Liberia currently self-
monitoring: 85
• Children monitored: 124
• Individuals medically evaluated for fever
or symptoms: 34
• Medical/healthcare professionals
monitored for fever or symptoms: 32
• Travelers tested for Ebola: 6

Measles in Georgia Case diagnosed Feb. 7, 2015
• 9 month old from Kyrgyzstan (no connection to
Disneyland outbreak)
• Unvaccinated
• Symptomatic on overseas flight
• Hospitalized, treated, released
• Previous measles case in Georgia was 2012
Contact Investigation • Individuals exposed: 332
• Susceptible individuals identified: 32
• Individuals receiving IG or MMR: 23
• No IG or MMR (monitored and self-isolated at
home): 9
• No secondary measles cases

Cyclospora Investigation Cyclosporiasis in Georgia
• 28 cases statewide
• 4 cases with history of international travel
• 13 cases in Fulton County
• 202 contacts (not all cyclospora infections)
• Disseminated electronic survey through known
confirmed cases, through nextdoor.com, and
social media to identify additional cases
• Multiple restaurants being investigated
• Traceback investigation is on-going
• No epidemiological link at this time to cilantro
from Puebla, Mexico
• Current FDA ban on cilantro from Puebla,
Mexico


Georgia Medical Marijuana Registry
Doctors
registered: 124
Patients
registered: 123
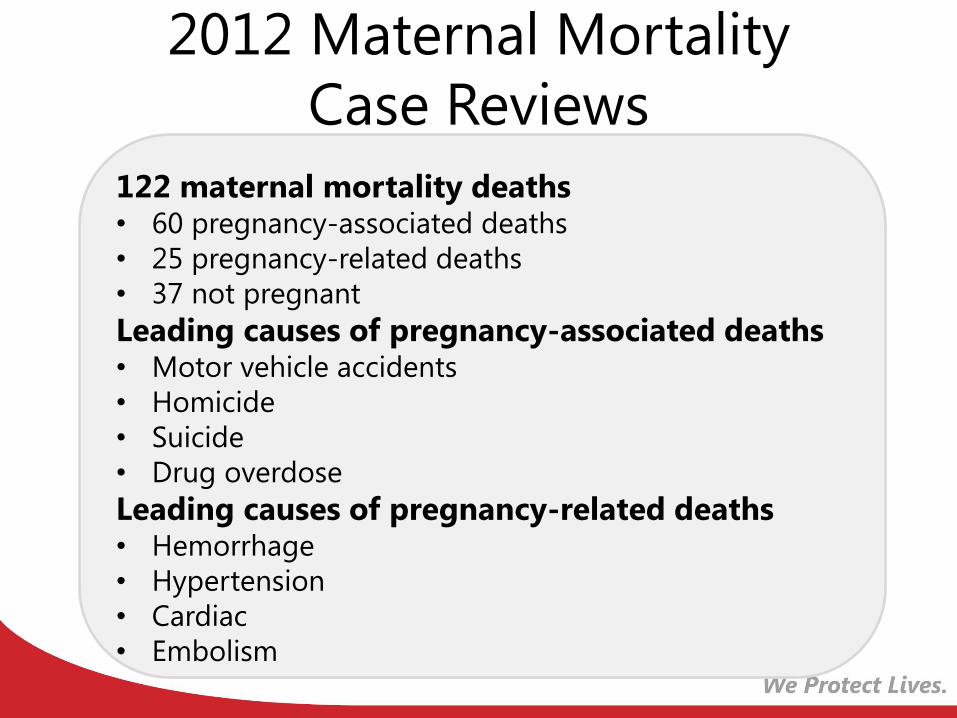
2012 Maternal Mortality
Case Reviews
122 maternal mortality deaths • 60 pregnancy-associated deaths
• 25 pregnancy-related deaths
• 37 not pregnant
Leading causes of pregnancy-associated deaths • Motor vehicle accidents
• Homicide
• Suicide
• Drug overdose
Leading causes of pregnancy-related deaths • Hemorrhage
• Hypertension
• Cardiac
• Embolism

Leading Causes of
Pregnancy-Related Death
0
1
2
3
4
5
6
7
8
9
10
Hemorrhage Hypertension Cardiac events Embolisms
Nu
mb
er
of
death
s

Thank You
Brenda Fitzgerald, M.D.
Commissioner and State Health Officer
Georgia Department of Public Health