Embed Size (px)
Citation preview
Models in Cost.-Effectiveness Analysis:An Example r 0 .
OCT 19 N
A.JSIA A
* .
ECONOMICS AND COSTING DIVISIONRAC PAPER RACP-2Revised June 1965
Models in Cost-Effectiveness Analysis:
An Example
byOliver Bryk
RESERCHANALYSIS CORPORATIONMcLEAN, VIRGINIA
Models in Cost-Effectiveness Analysis:
An Example
?REFACE
This paper was presented at the 21st
Annual National Forum of The American
Helicopter Society on 13 May 1965. It
describes some approaches to modeling
for systems analysis or cost-effectiveness
studies.
iii

BLANK PAGE
INTRODUCTION
Elements of Cost-Effectiveness Analys~i
Cost-effectiveness studies are an aid to resource allocation
decisions. The principal elements of a cost-effectiveness analysis are:
Objective(s) (functions to be accomplished)
Alternatives (feasible ways of achieving the desiredmilitary capability or accomplishing the function)
Costs of resource requirements for each alternative
Models (sets of mathematical or logical relationshipsamong the objectives, alternatives, environmentand resources)
Criterion for choosing the preferred alternative
The criterion specifies the relation between the measure of effective-
ness and the measure of cost that will result in preference. The effective-
ness measure should express the extent to which the objective is being
accomplished. The measure of cost must be consistent with the overall
framework of the resource allocation problem, e.g., net future total
peacetime cost of ownership for N years.
An extensive discussion of the criterion of preference is beyond
the scope of this paper; Chapter 9 of Hitch and McKean, The Economics of
Defense in the Nuclear Age, covers the criterion problem admirably.
However, some problems in selection of criteria, and in selection of a
preferred alternative within the constraints of a given criterion, are
examined in the final section of the paper, "Cost-Effectiveness Model."
Regardless of the specific criterion to be applied, the effectiveness
and cost of each of the alternatives must be estimated and related. These
estimates are made by means of several types of logically interrelated
models. The emphasis of this paper is on the conceptual design and function
of the principal types of models used in cost-effectiveness analysis.
Role of Models
All models used in cost-effectiveness analysis are formalized relations
among abstractions from the real world. They perform a dual purpose of
(a) reducing the problem to manageable proportions, and (b) identifying
those variables and parameters that are significant to the decision
process.
The problem in any cost-effectiveness analysis is how to get from
"here to-there"; from the estimate of effectiveness to the estimate of
cost of each alternative; and from the effectiveness and costs of each
alternative to selection of the preferred alternative for accomplishing
the objective. This progression cannot be accomplished directly, but
is made possible by four principal types of interrelated models:
Effectiveness models
System and organization models
Cost models
Cost-effectiveness models
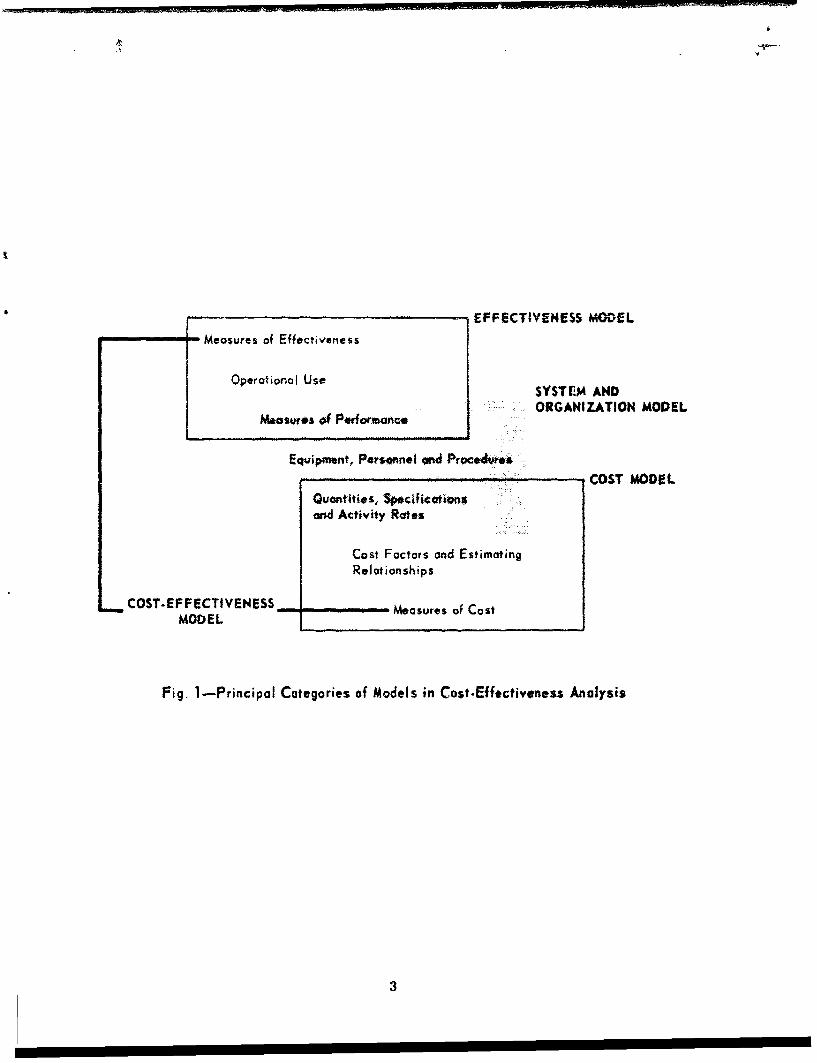
The interrelation of these models is illustrated in Figure 1.
An effectiveness modcl relates the measures of effectiveness on
the functions to be accomplished (the objective) to measures of performance
L
EFFECTIVENESS MODEL
Measures of Effectiveness
Operational Use SYSTEM AND
ORGANIZATION MODELM**sur.. of P~ef&rmanCe-
Equipment, Personnei md Procaend"COST MODEL
Quantities, Siectfitatons
and Activity Rates
Cost Factors and EstimatingRelationships
COST-EFFECTIVENESS .. . Measures of CostMODEL
Fig. I-Principal Categories of Models in Cost-Effectiveness Analysis
3
in the context of an operational concept.
A system and organization model relates the measure of performance
to the physical specifications, quantities, and activity rates of a system
and/or organization (equipment, personnel, and procedures) consistent with
the operational concept.
A cost model relates the quantities, specifications, and activity
rates of the system, and of the organization that operates and/or supports
it, to measures of cost through cost factors and estimating relationships.
A criterion or cost-effectiveness model relates cost and effectiveness
of each alternative to aid in the selection of the preferred alternative.
The concepts of design and the function of the models as used in the
analytical process are illustrated in the following sections (for a com-
prehensive discussion of modeling, see "Guide for Reviewers of Studies
Containing Cost-Effectiveness Analysis.") 2/
DESIGN AND APPLICATION OF MODELS
Within this section, a set of models is described that were designed
for the estimation of effectiveness and cost of alternative aircraft
systems for the same objective. The models were developed as part of
RAC's research in cost-effectiveness methodology.
The Objective
A hypothetical problem is used to illustrate the application of the
models. In the exatple, a military requirement to accomplish a set of
tactical missions had been identified, for which one of several different
aircraft was to le selected as the principal item of materiel. The
4
A8
criterion is the lowest peacetime cost for a wartime capability to
accomplish the mission requirement on a sustained basis.
An analysis of the objective (operational requirement) revealed the
following information:
There were several different mission profiles. All missions required
return to the base of operations after completion. A requirement for a
specific quantity of missions per day existed in a number of military
units located in different operating environments. All of the missions
had to be flown on extremely short notice. Demands for sorties were
random in time, and there were no priority differences among missions so
requested. The different profiles occurred with different relative
frequency among military units.
For each of the aircraft, performance, reliability, maintainability,
and cost estimates were available, and it had been determined by other
means that each aircraft could accomplish the mission tasks.
Support-personnel costs and factors, peacetime activity rates, and
other materiel planning factors were available.
Conceptual Design of the Models
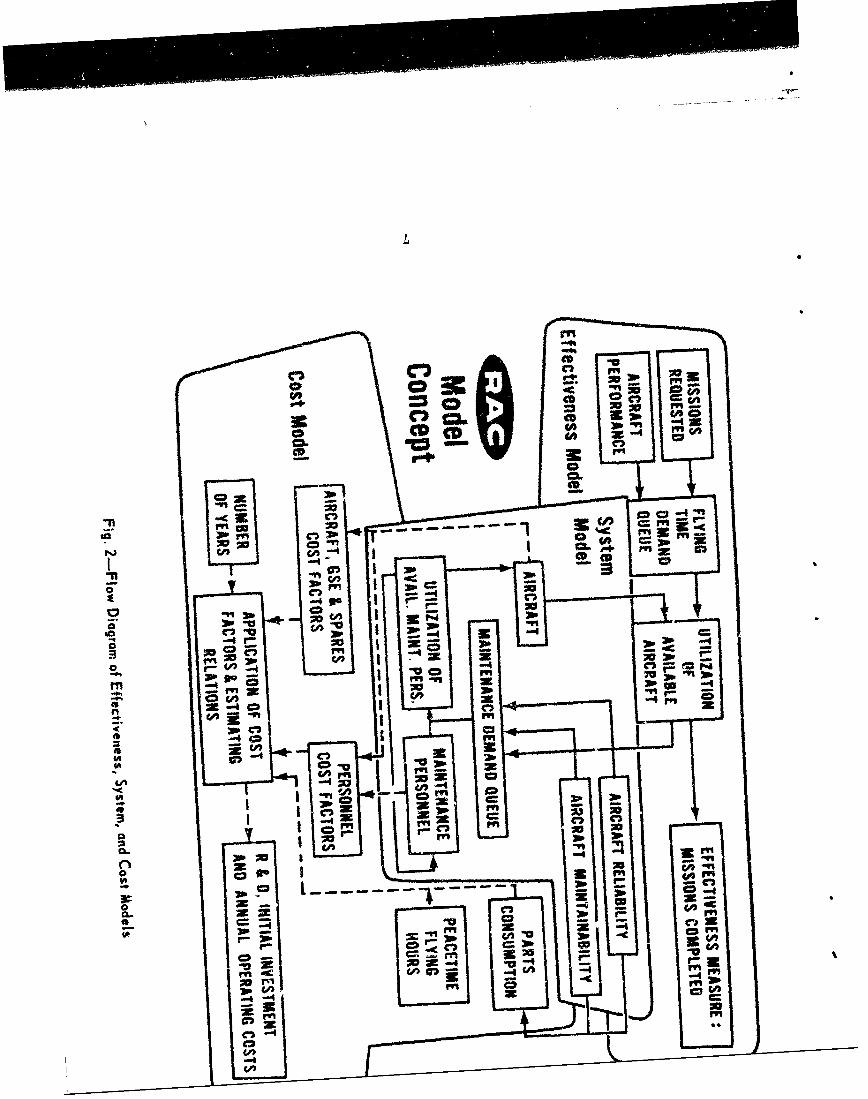
The design of the models was based on the following overall concept:
For the measurement of effectiveness, to be expressed as the namber
of missions per day completed, the wartime operational requirements were
to be translated into demands for flying time as a function of aircraft
performance (effectiveness model). The demands for flying time were to
be translated into numbers of aircraft and personnel as a function of the
5
aircraft support requirements and policies (systems model). The resource
requirements for aircraft and their support to provide a wartime capability
were to be translated into peacetime costs (cost model). The effectiveness
and systems models, generating physical-resource-requirement data, were to
simulate the operations to adequately represent at least some of the more
important interdependencies. A flow diagram illustrates the conceptual
design of the three models in Figure 2.
The models were to be so designed that all repetitive operations
would be performed by a digital computer and all one-time operations by
hand. This was an arbitrary allocation i~tated by time and manpower
constraints. Sequential operations had to oe minimized to limit potential
bottlenecks in the process of analysis. Computer schedule constraints
limited automatic iteration.
Description of Models
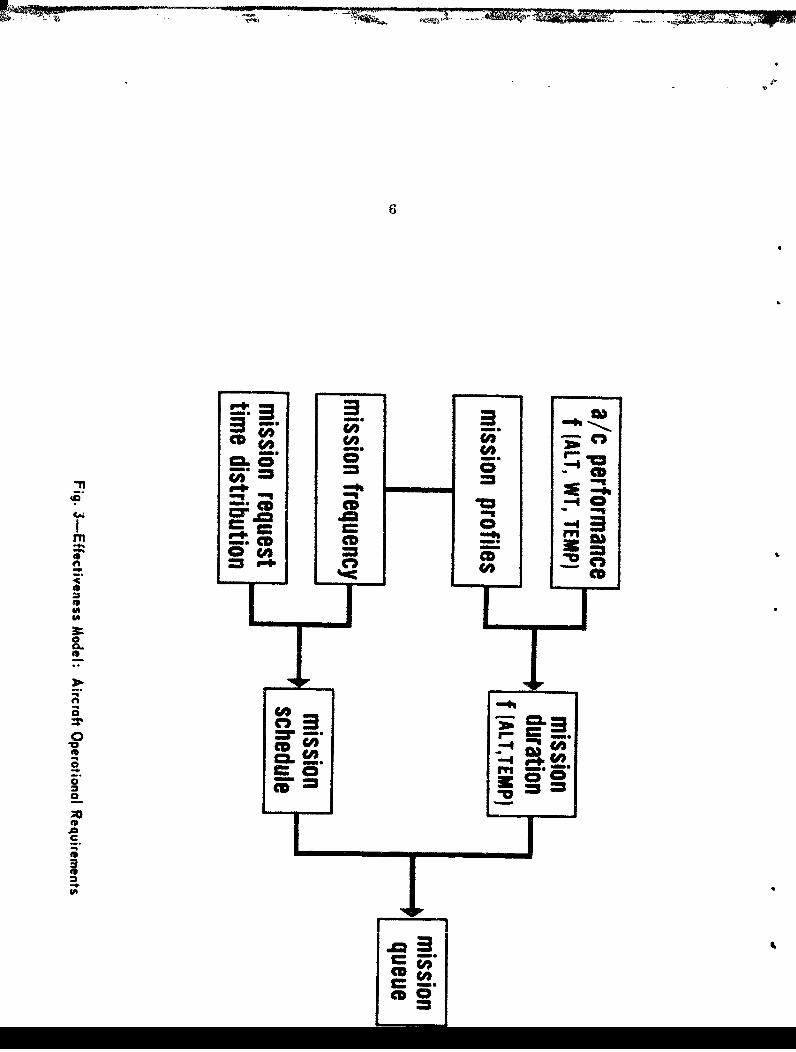
Effectiveness Model. The function of this model was to reiate
effectiveness to performance under simulated operational uses. Its ou~t-
put--ordered demands for flying time--was derived from two principal con-
siderations: the time required to fly each mission profile, and the tirne
distribution of requests for missions.
The relative frequency of missioni types at each military unit was
calculated manually and its operating environment noted. The time (and
fuel) to fly eoch mission was calculated manually from aircraft perfor-
mance data or each planned flight pnrofile, for eo.., aircraft, at each
en~vironm t•i condition (altitude arid temperature). The flight times
CO)0
C,~
CA t
.. aCC3I
aa
n 30a03
CD-CC-CA
0- ~ ~ ~ c 3p-----------
0n 4e
4 -=04C
f"30;1 2
(and fuel) for each mission/environmental condition/aircraft combination
were then matched with the military unit/relative mission frequency/environ-
menta'. condition combinations to form cumulative frequency distributions
for each aircraft/military unit combination.
To simulate the operations, random numbers were selected to draw
requests for missions, i.e., flight times, which were ordered in a queue
(see Figure 3).
A "dispatcher" in the computer program assigned aircraft from the
system model's pool to flight requests under a choice of several policies,
e.g., various options on the length of the operations day. At the end
of each simulated day, unfulfilled mission requests were canceled.
A "bookkeeping" computer subroutine recorded totals and calculated
averages of numbers of missions requested, missions completed, delays,
flight time, and fuel consumption for each model run (simulated months
of operations).
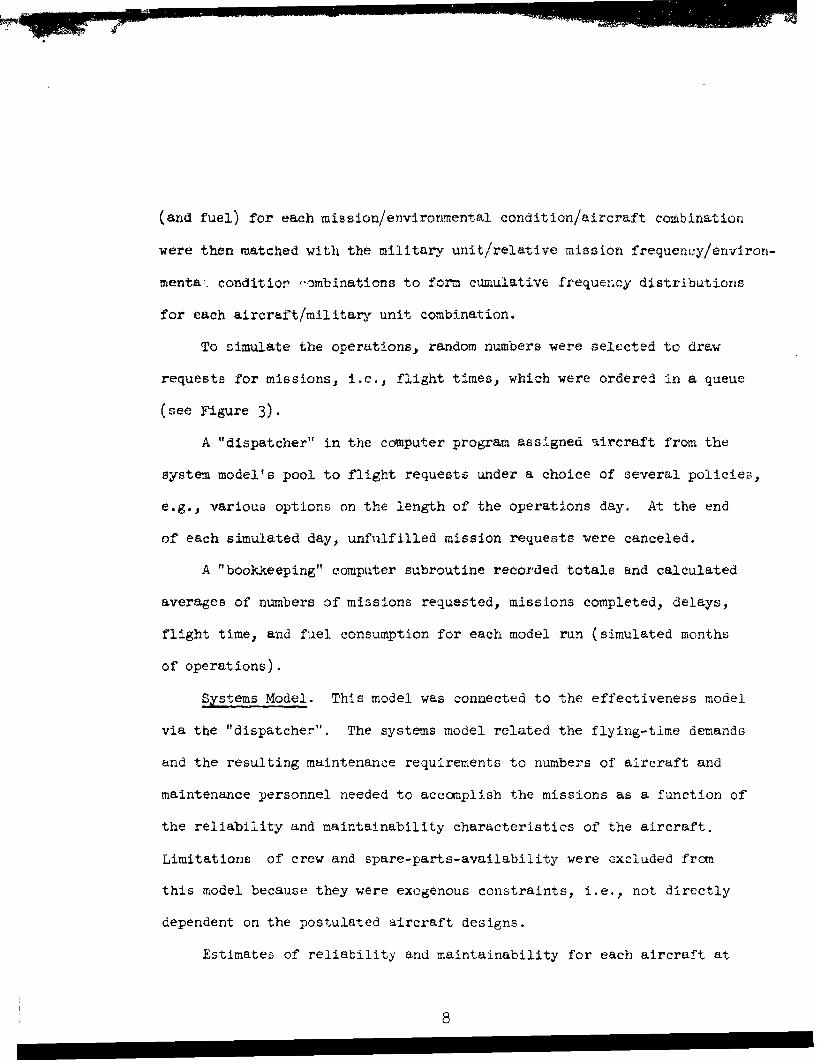
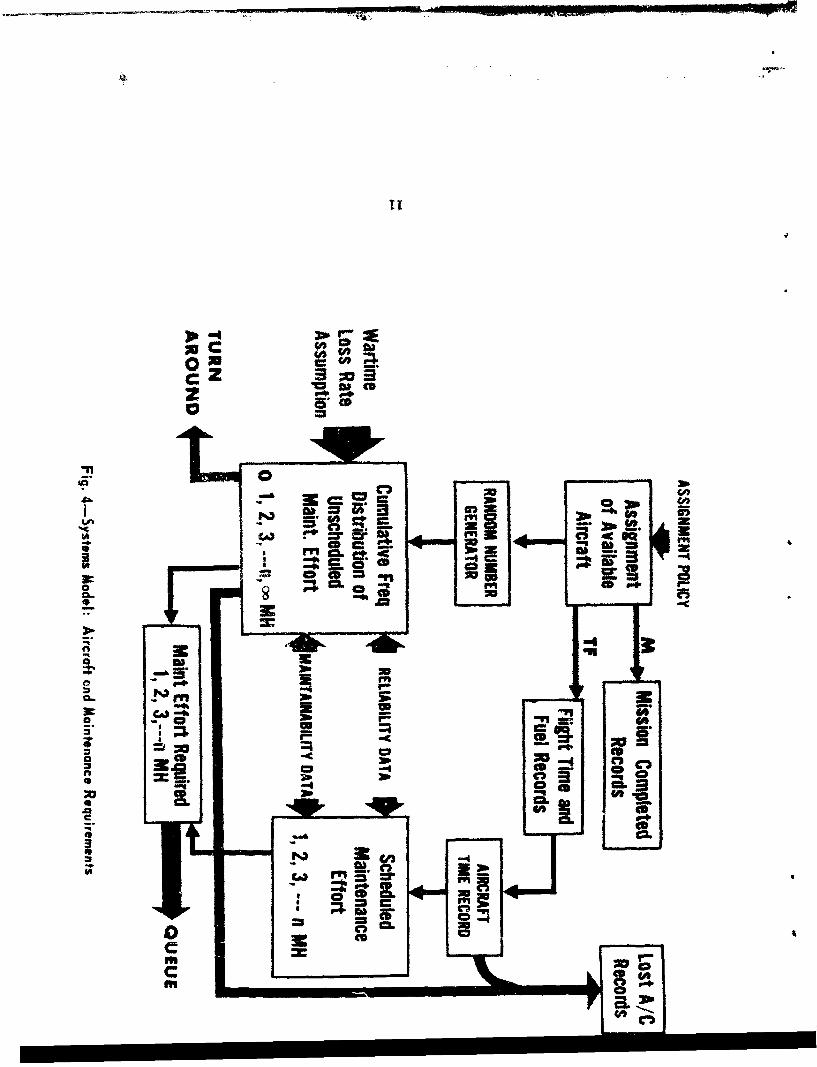
Systems Model. This model was connected to the effectiveness model
via the "dispatcher". The systems model related the flying-time demands
and the resulting maintenance requirements to numbers of aircraft and
maintenance personnel needed to accomplish the missions as a function of
the reliability and maintainability characteristics of the aircraft.
Limitations of crew and spare-parts-availability were excluded from
this model because they were exogenous constraints, i.e., not directly
dependent on the postulated aircraft designs.
Estimates of reliability and maintainability for each aircraft at
8
777
6
folio
oNS
0 CD
Ini.OWN
8.r.
CC
C)
3
SI
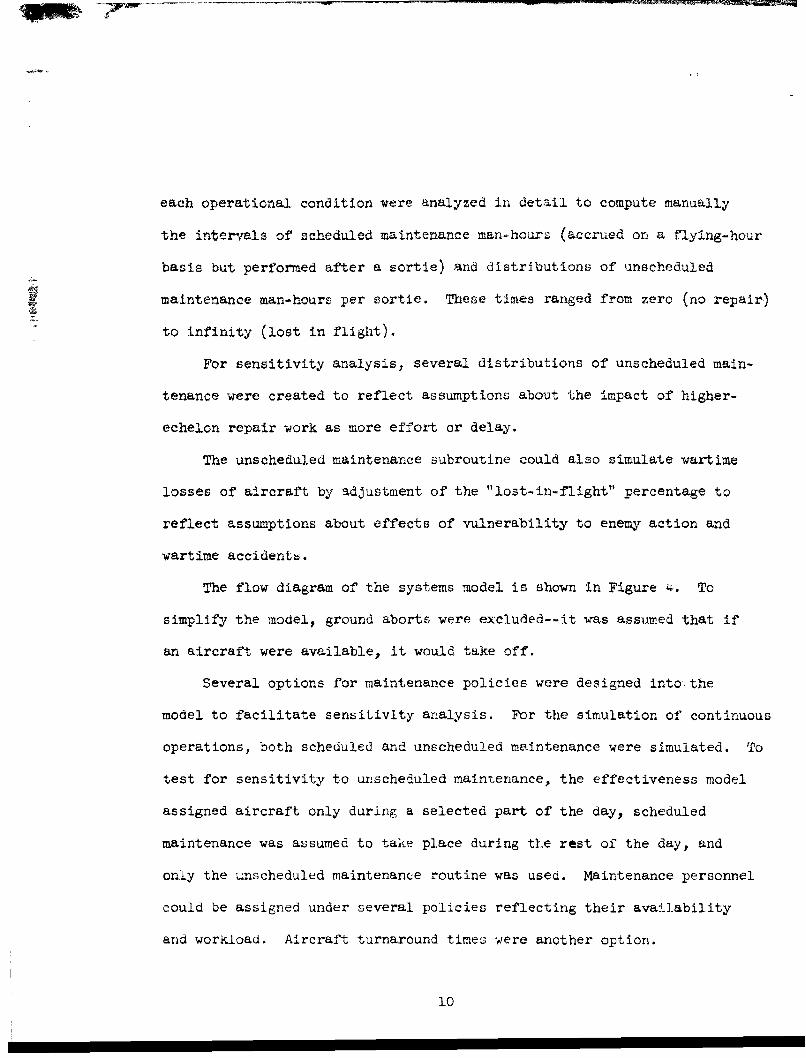
each operational condition were analyzed in detail to compute manually
the intervals of scheduled maintenance man-hours (accrued on a flying-hour
basis but performed after a sortie) and distributions of unscheduled
maintenance man-hours per sortie. These times ranged from zero (no repair)
"to infinity (lost in flight).
For sensitivity analysis, several distributions of unscheduled main-
tenance were created to reflect assumptions about the impact of higher-
echelon repair work as more effort or delay.
The unscheduled maintenance subroutine could also simulate wartime
losses of aircraft by adjustment of the "lost-in-flight" percentage to
reflect assumptions about effects of vulnerability to enemy action and
wartime accidents.
The flow diagram of the systems model is shown in Figure 4. To
simplify the model, ground aborts were excluded--it was assumed that if
an aircraft were available, it would take off.
Several options for maintenance policies were designed into the
model to facilitate sensitivity analysis. For the simulation of continuous
operations, both scheduled and unscheduled maintenance were simulated. To
test for sensitivity to unscheduled maintenance, the effectiveness model
assigned aircraft only during a selected part of the day, scheduled
maintenance was assumed to take place during the rest of the day, and
only the unscheduled maintenance routine was used. Maintenance personnel
could be assigned under several policies reflecting their availability
and workload. Aircraft turnaround times were another option.
10
0"C Z
o 5o
rrto c ICL )
ni
"in
0 m1C OR;&
F-
After each aircraft's assignment, the records of its simulated
cumulative engine time were interrogated to determine if scheduled
maintenance were due after the sortie. A random number was used to
select the amount of unscheduled maintenance, due after the sortie,
from the cu-ulative distribution. Unscheduled and scheduled maintenance
were additive.
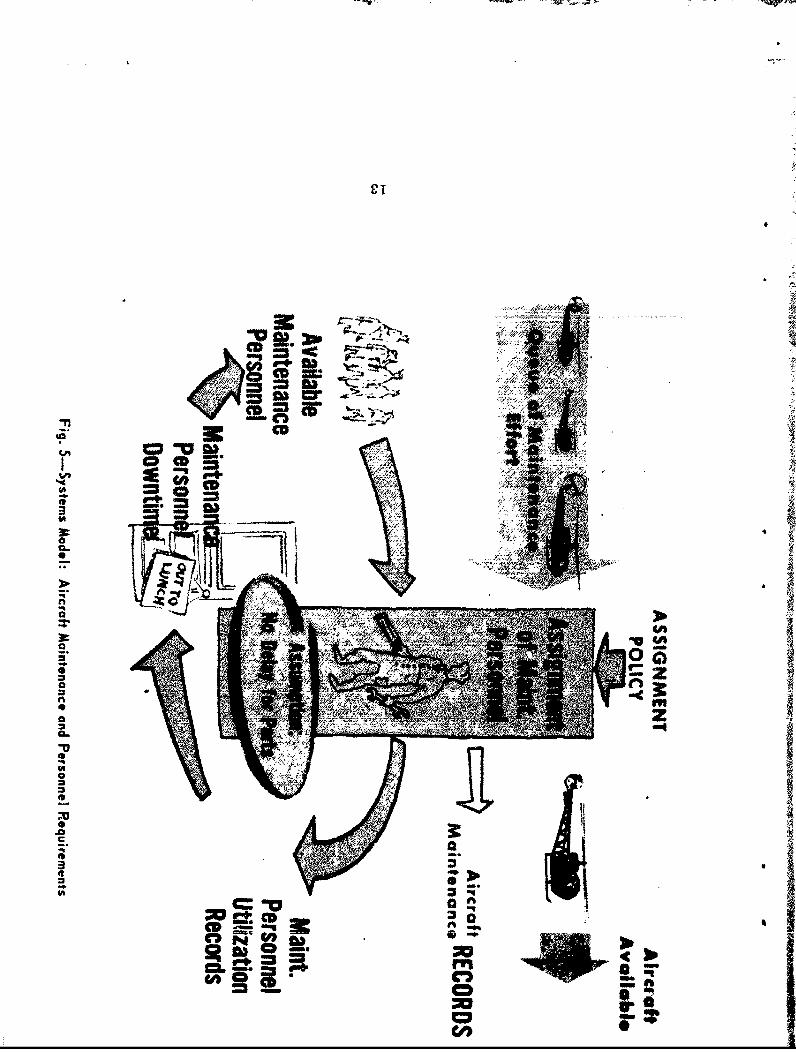
If no maintenance were called for, the aircraft was returned to
availability status via an optional turnaround time. If maintenance
were due, the aircraft entered a queue and awaited assignment of
maintenance personnel according to the policy selected, e.g., to assign
one available mechanic to any job less than two man-hours, two available
mechanics to jobs for two to six man-hours, etc. The computer model
calculated the downtime according to the maintenance man-hours required
and the maintenance men assigned. Following maintenance, aircraft were
returned to availability status. If maintenance were infinite, no
mechanics were assigned and the aircraft was entered in the tally as
lost (see Figure 5).
The computer programs of the effectiveness and systems models are
described in a PAC paper now in preparation: "A Simulation Model for
Vehicle Operation with a Set of Stochastic Conditions." 1/
Cost Model. The systems model furnished estimates on the resources
(aircraft, personnel, fuel, hcoirs, etc.) required to provide the simu-
lated wartime capability expressed in the measure of effectiveness.
The peac m cost! of this- capabiliy ,,ere co.put. w..t. h e aid of
i2
CDl
CDC
IA
-0i
CL.
fNil
I 44
-c m
cost models that derived total system costs from the simulated resource
requirements by factors and estimating relations.
To conserve time, costing proceeded in paralliel with the simulations
in the effectiveness and systems models. Research and development costs
were estimated separately by hand. Cost sub-models were used to generate
separate schedules of costs for aircraft systemsand for maintenance per-
sonnel so that costs of any combination of these two principal resources
could be determined without delay.
Aircraft system acquisition and operational cost factors differea
for each aircraft type. They included the complete aircraft itself,
ground-support equipment, parts, and fuel consumption. Planning factors
for maintena.nce and replacement of ground-support equipment, initial
stocks of spares, peacetime attrition (expressed as aircraft replaced
per 100,000 flying hours), maintenance float, and training aircraft
were common to all designs.
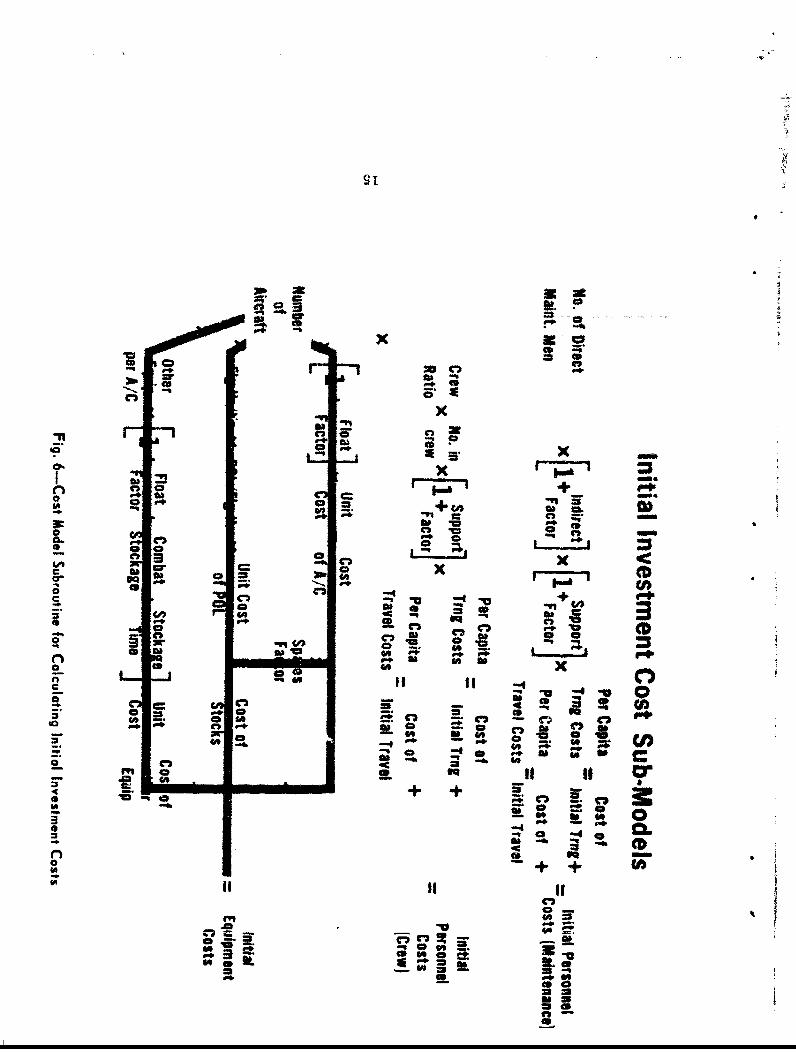
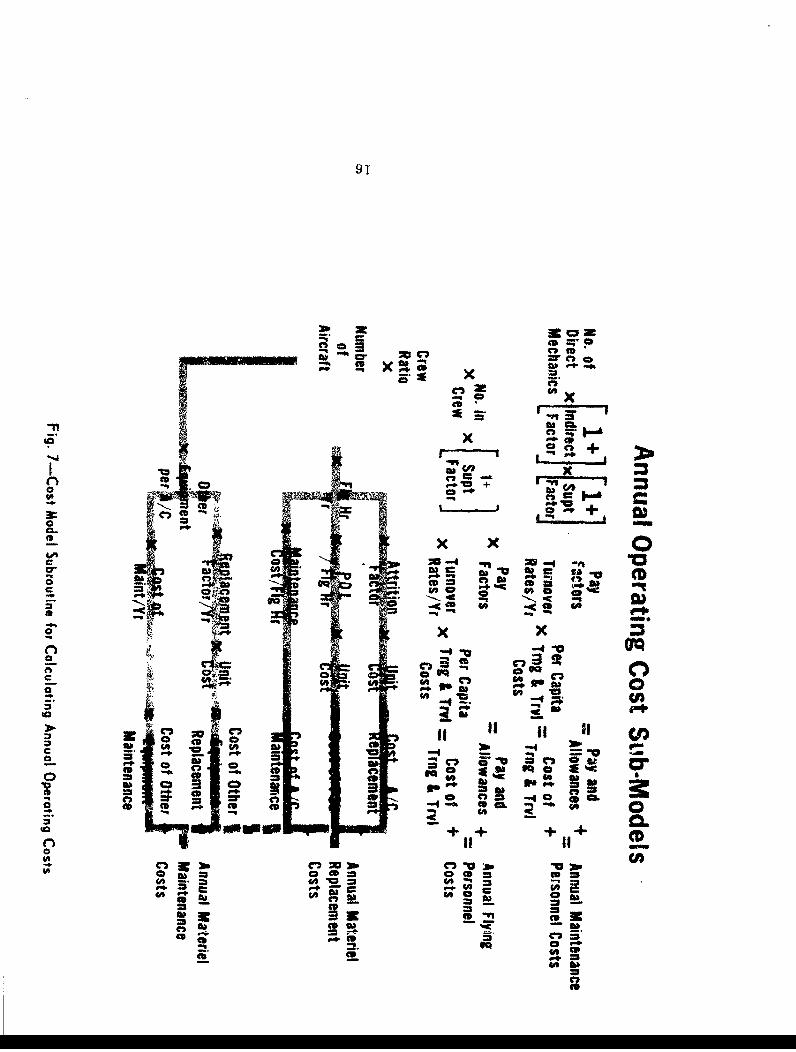
The cost factors were entered into th2 compute- sub-models, which
calculated the initial investment and annual operating costs for the
given numbers of aircraft, ycdrs of operation, annual flying hours, and
attrition factors, and then added to these the costs of research and
development. The sub-models for initial investment and annual operating
costs are illustrated in Figures 6 and T, respectively.
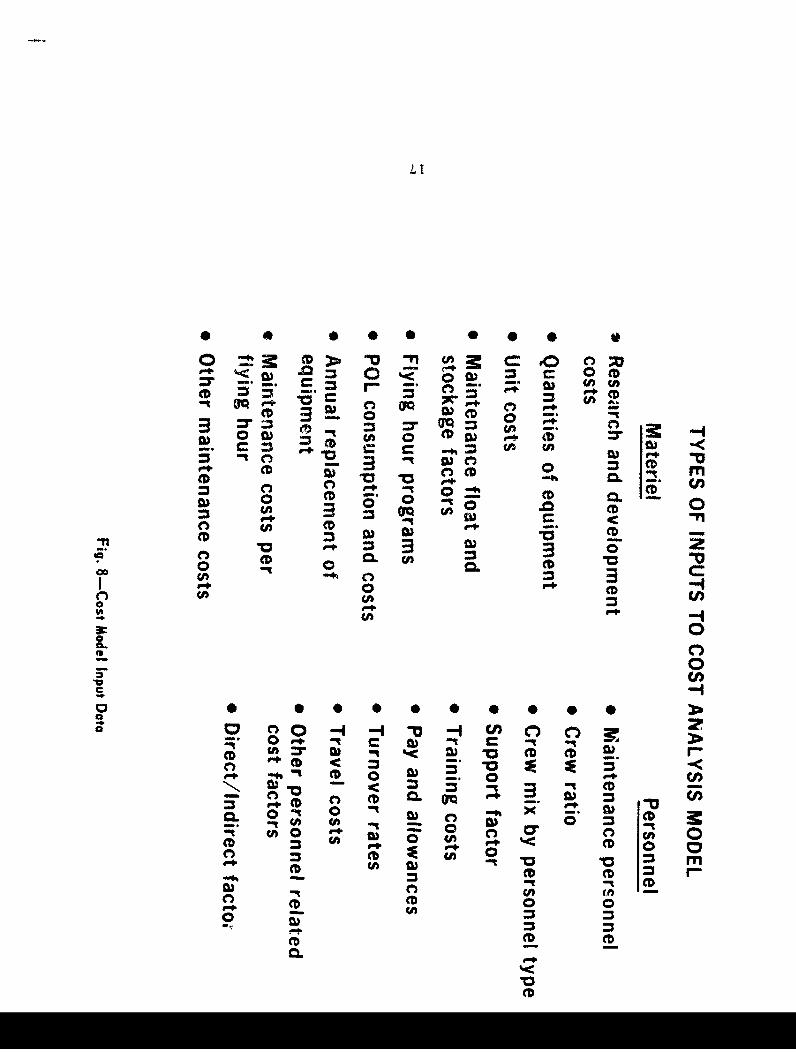
Preparation of the input data was a manual process cften requiring
considerable analysis and use of estimating relations (the types of
cost model input data are listed in Figure 8).
14
V
a 0
* 0
404Ca
x+o C,
Q. 4
o 0
2- 12
-. ca M* ~~
In -C, -
so a .. ,z4 C 4 C" ... ~40 9- p. 1a- 44A __
+0 +10 Z4 i 0(
44 '4 +
- 44 _44+0 +3 -* 2
*m -4. r*'4
to 0
LtI
_ ~~ a fU)
=r = r c m
0 w z~~
0 C0 C. 0-
0 m CA
0 '
_) C
C4- 0 P+0
009L0 0
0 0
CC CD 2) 00 0D m
0 10 O 0 .I
P+ -k P
-. 0 6** f
ckC 0 CD9
0 ' 1
C D flip P + C D~0 0 U
0 m (A; 000 (Al w
m
m 0
@. '
CL0
91
ONO cr C1 t
xO
-nf
LZ +
n ONE&
0I xx
ar cat M = 6,"9'
)C-aac
CC
ic a C)
CIO a;a =a 'C3 3 3
S CS
CA to -%9' ~q FA (A o ~o
ft Cl
*tV
02CD
For the estimation of the spare!s-cost per flying hours, the scheduled
and unschedaled maintenance data preparrc for T.he system model were used.
A detailed description of the cost model computer program will be
published in a future RAC paper, now in preparation: "An Individual System/
Organization Cost Model."
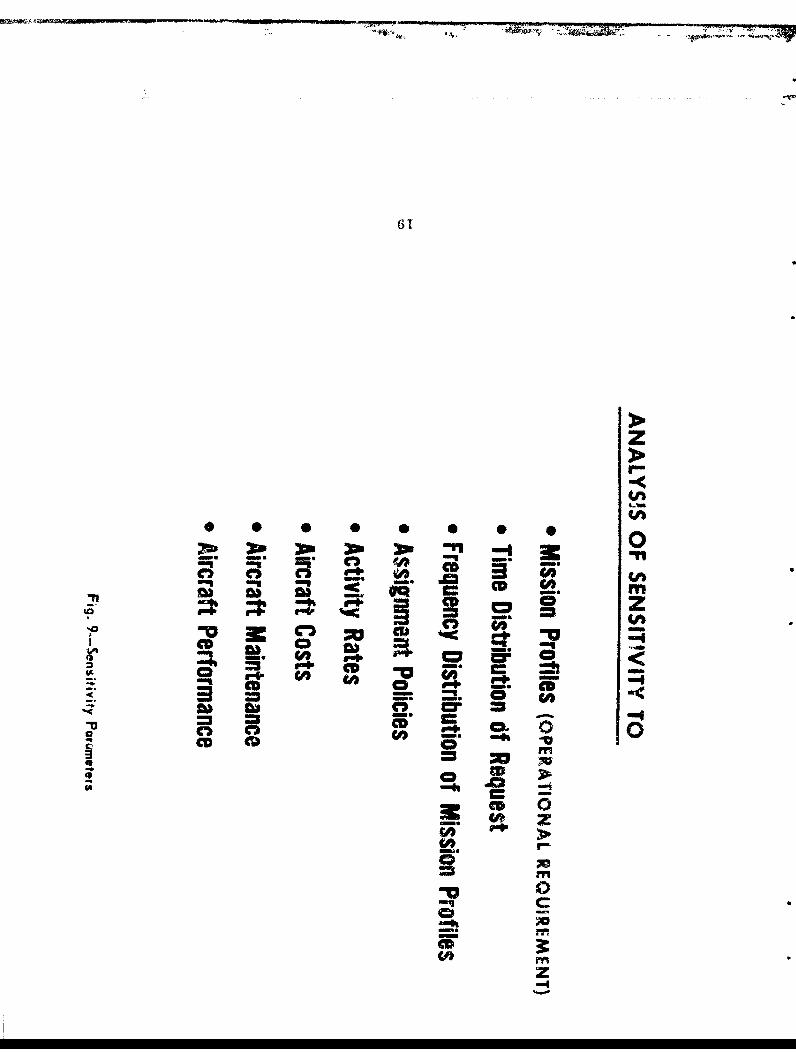
Sensitivity Analysis. in each of the models discussed above, calcu-
lations were repeated with small changes in input values, and with different
simulation rules (options or policies) to determine the sensitivity of the
results to such changes (see Figure 9). in this manner, assumptions were
identified which must be explicitly included in the information presented
for the selection of the preferred alternative.
Cost-Effectiveness Model. To select the preferred alternative, a
criterion is applied relating cost and effectiveness in some specified
manner. As mentioned earlier, the preferred alternative was to be
selected on the basis of' the lowest peacetime cost for a specified level
of effectiveness, i.e., wartime capability.
The cost-effectiveness model is not a computer program; rather, it
is a type of decision model. Without go-irg into a lengthy discussion
of the theoretical aspects of resource allocation decisions, a series of
simplified illustratiors will be used to describe the cost-effectiveness
model - thu raison d'e'tre of the computer models discussed above.
Simulations by the effectiveness and system models showed that the
same level of eff'ectivoness, i.e., missions completed per day, could be
obtained for Pzch of the alternat i-es with sýeveral different combinations
I I I I I I I I I I , i i , ,
61
z
* 0 0 0 0
U ~e CD ~-
-n~X m D Z
C-)-
C'3 '64C
•re .4 < a
. K C'= =CD .. -•
""o -g
"C2 CDsl
.4 - =. 0
mm
40=CD Q 0 -. -~CD
(ACA
m
Co
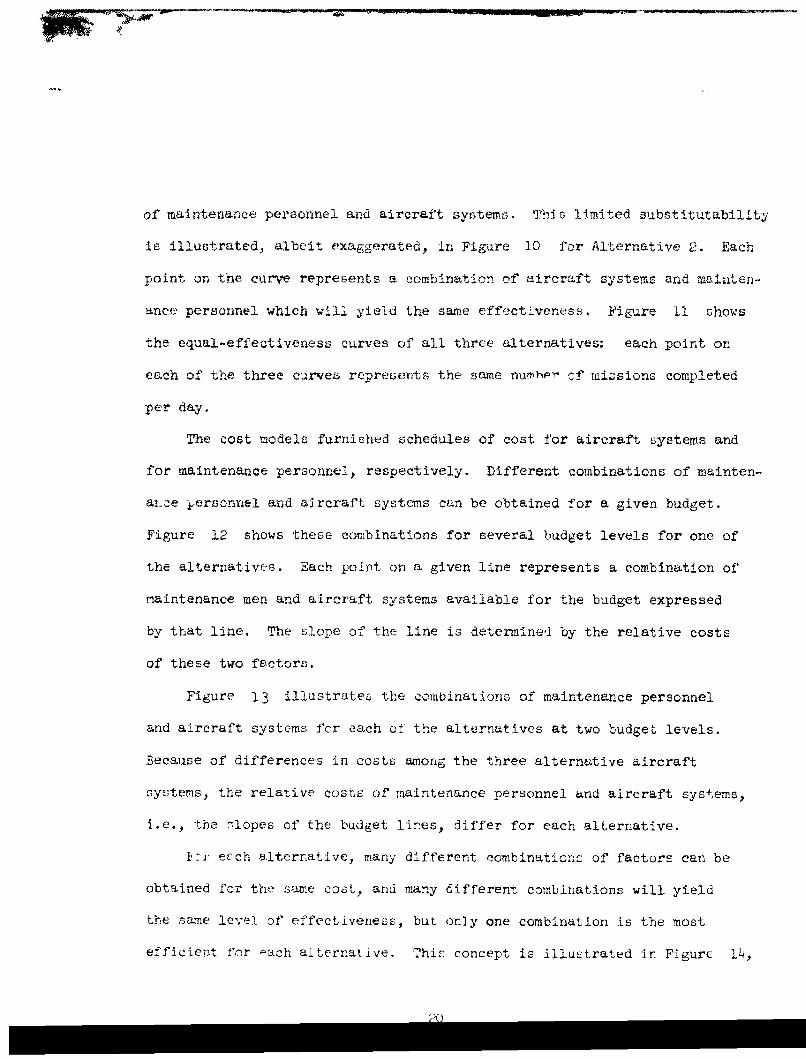
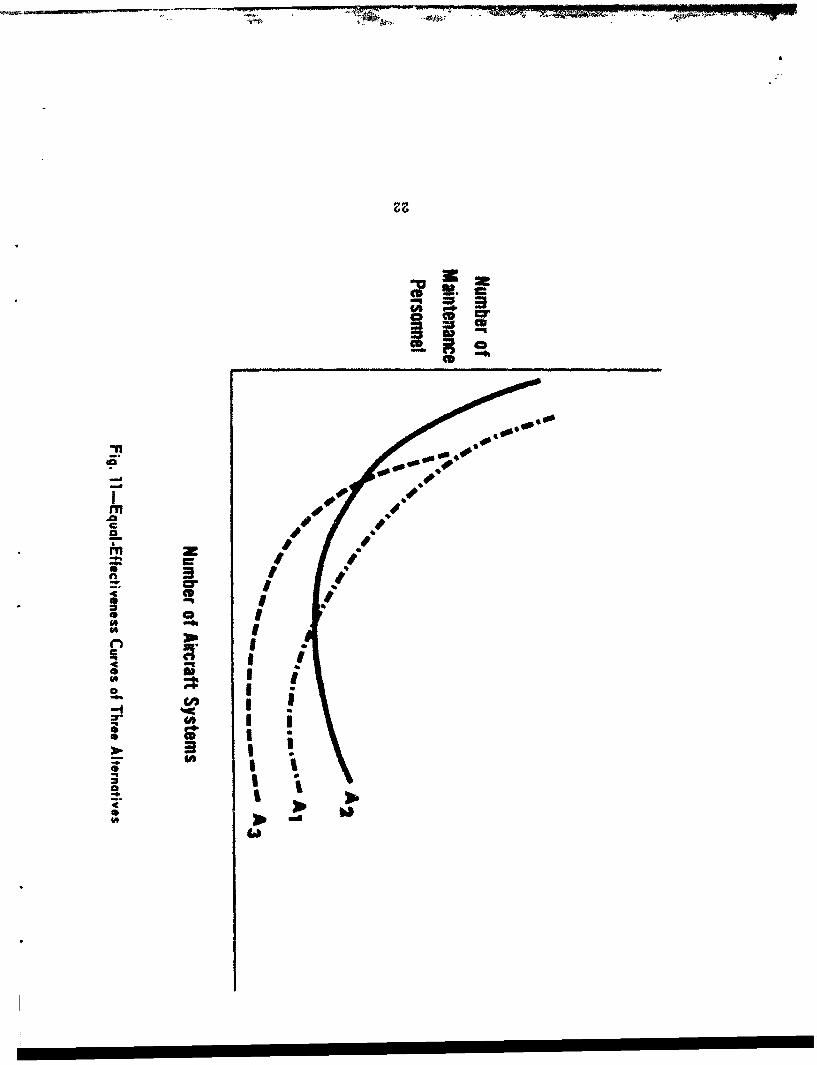
of maintenance personnel and aircraft syoteqs. This limited substitutability
is illustrated, albeit exaggerated, in Figure 10 for Alternative 2. Each
point on the curve represents a combination of aircraft systems and mainten-
ance personnel which will yield the same effectiveness. Figure Ll 5hows
the equal-effectiveness curves of all three alternatives: each point on
each of the three curves represents the same numhpr -f nmissions completed
per day.
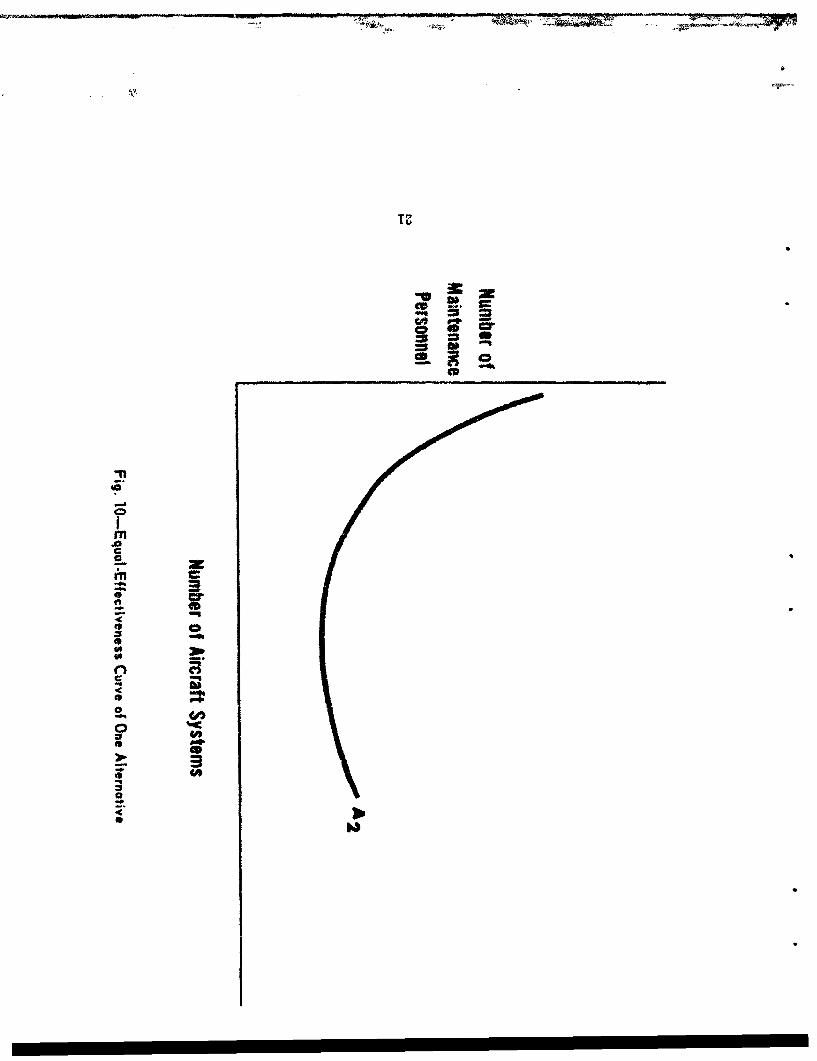
The cost models furnished schedules of cost for aircraft systems and
for maintenance personnel, respectively. Different combinations of mainten-
ai-.e personrnel and aircraft systems can be obtained for a given budget.
Figure 12 shows these combinations for several budget levels for one of
the alternatives. Each point on a given line represents a combination of
maintenance men and aircraft systems available for the budget expressed
by that line. The slope of the line is determined by the relative costs
of these two factors.
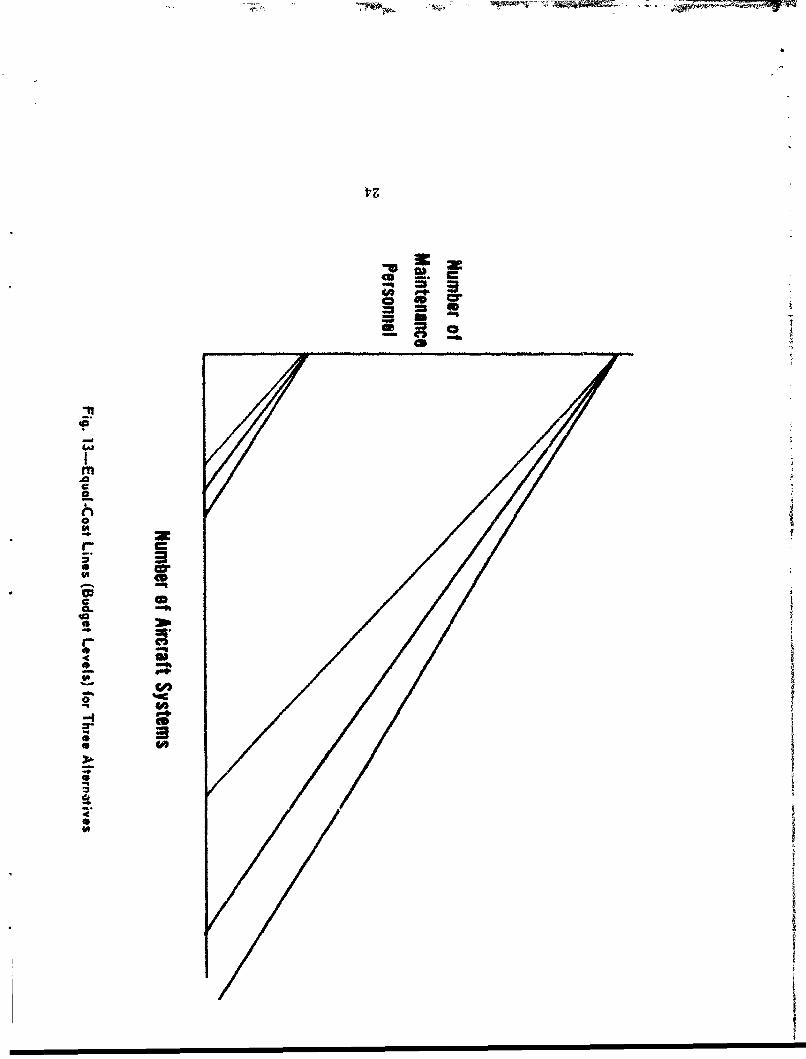
Figure 13 illustrates the combinations of maintenance personnel
and aircraft systems for each of the alternatives at two budget levels.
Because of differences in costs among the three alternative aircraft
systems, the relative costs of maintenance personnel and aircraft systems,
i.e., the ýlopes of the budget lines, differ for each alternative.
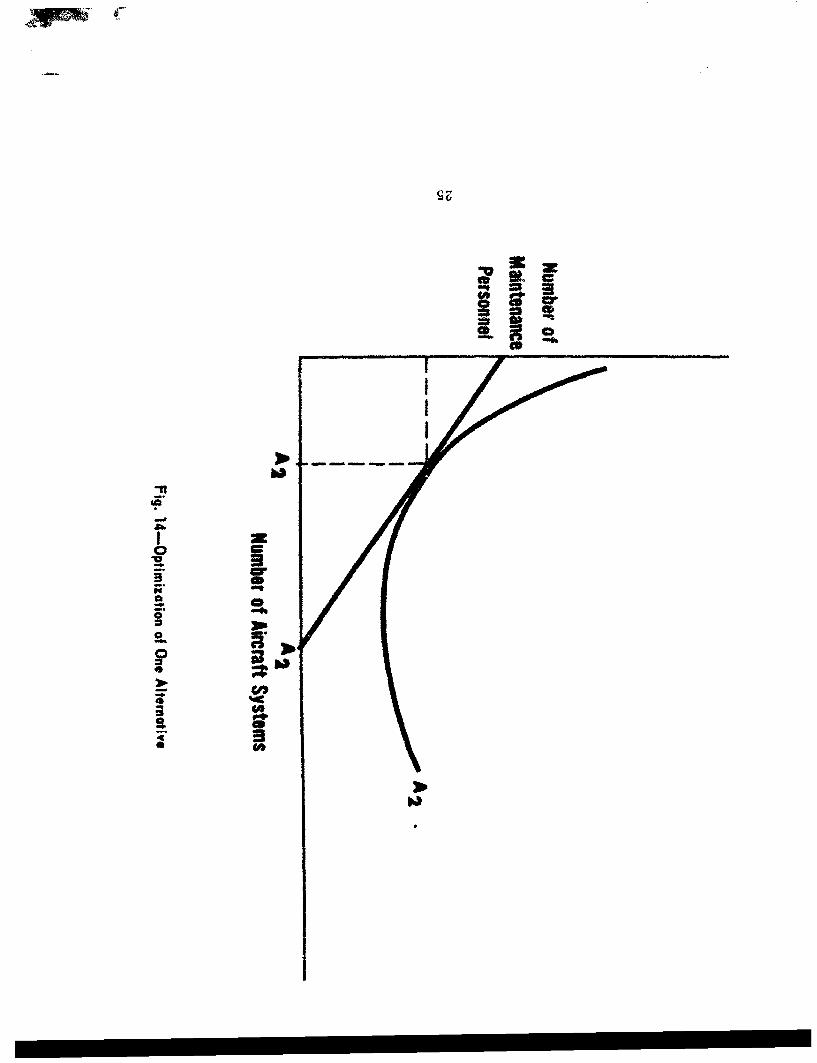
1 Jr ecch alternative, many different combination= of factors can be
obtained for the same cost, and many different combinations will yield
the same leve3 of effectiveness, but only one combination is the most
efficient for each alternative. This concept is illustrated in Figurc 14,
TZ
"11
in °o
Q0
++r
< •
IC)c
31-
-aa
rrir
CC
.0
r a
C%
,lo I~ "-I 2 I wm-fl f
CD s
* a Ic
o to
*0 0
ii°
od
CC
00m
'I.@
, Sm. II II I
- ~ 1 7P~ tt
4D4
cm.
CC~
ac-
41
CC
CC
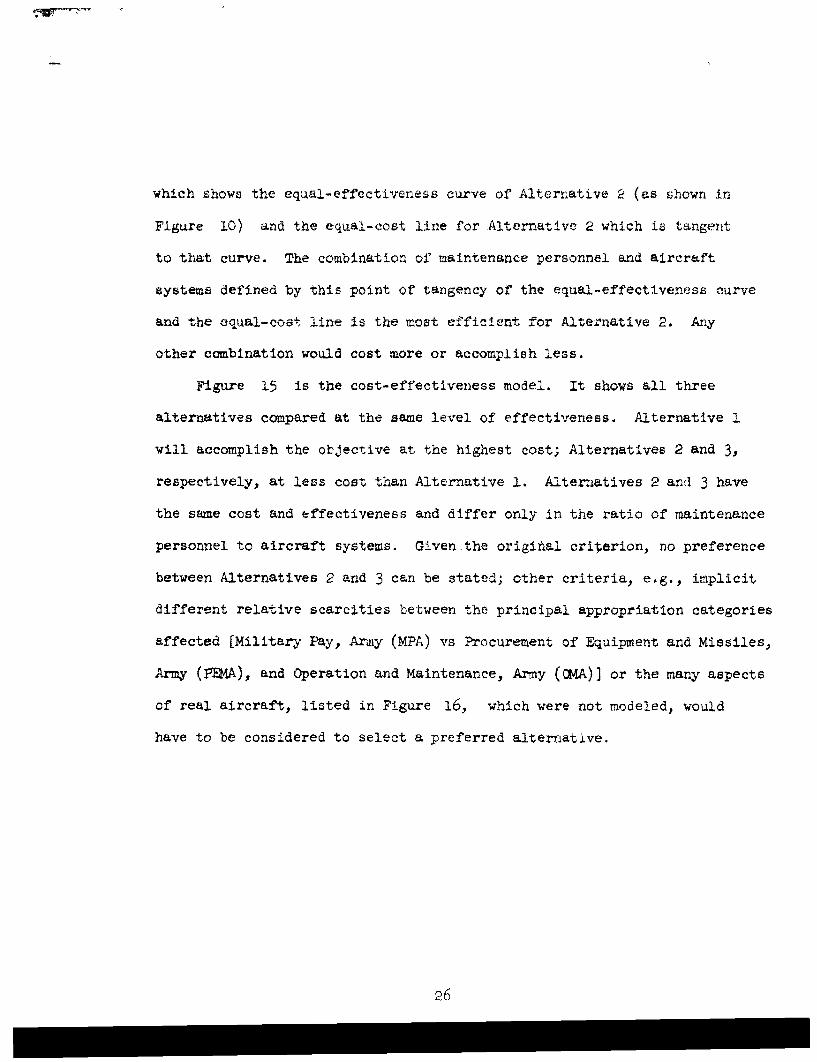
which shows the equal-effectiveness curve of Alternative 2 (as shown in
Figure 10) and the equal-cost line for Alternative 2 which is tangent
to that curve. The combination of maintenance personnel and aircraft
systems defined by this point of tangency of the equal-effectiveness curve
and the equal-cost, line is the most efficient for Alternative 2. Any
other combination would cost more or accomplish less.
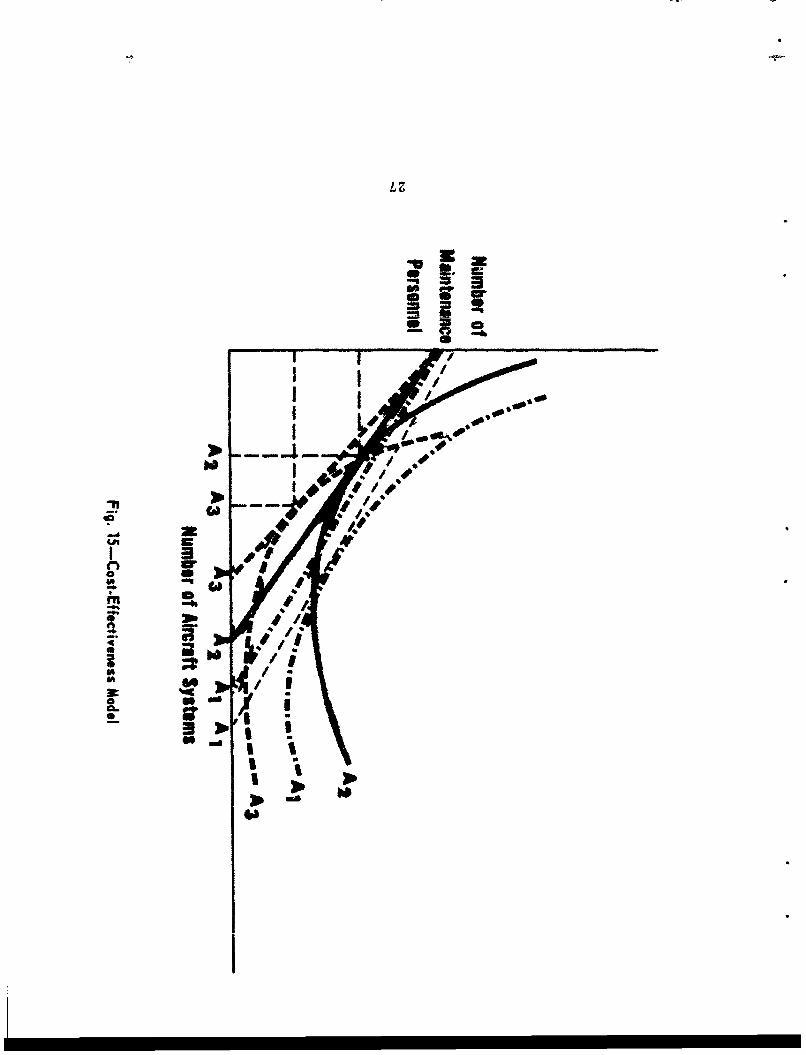
Figure 15 is the cost-effectiveness model. It shows all three
alternatives compared at the same level of effectiveness. Alternative 1
will accomplish the objective at the highest cost; Alternatives 2 and 3,
respectively, at less cost than Alternative 1. Alternatives 2 and 3 have
the same cost and effectiveness and differ only in the ratio of maintenance
personnel to aircraft systems. Given the origiftal criterion, no preference
between Alternatives 2 and 3 can be stated; other criteria, e.g., implicit
different relative scarcities between the principal appropriation categories
affected [Military Pay, Army (MPA) vs Procurement of Equipment and Missiles,
Army (PEMA), and Operation and Maintenance, Army (ORA)] or the many aspects
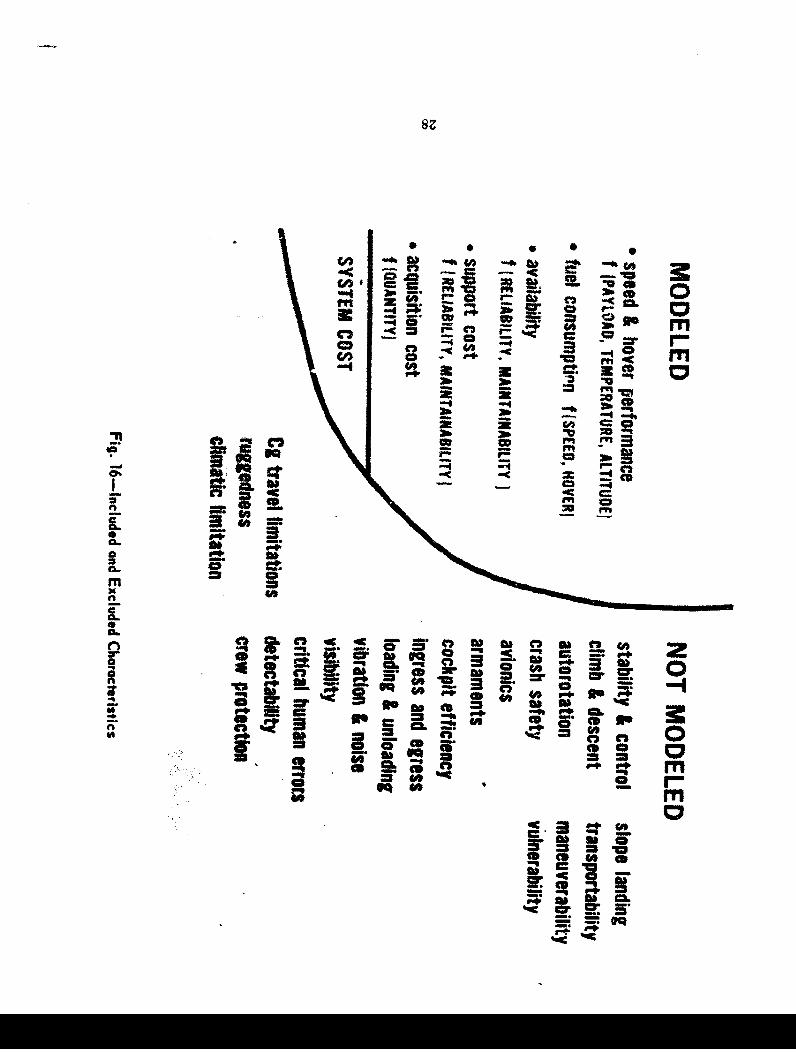
of real aircraft, listed in Figure 16, which were not modeled, would
have to be considered to select a preferred altertiative.
26
Ia
LZ
I I .I,..
lo
n a
- lyI
I I I I
-4 4c
r" Z- *a -
-, * MQ) 4cto 3- C
2) -vNb 3wat at C
c~ CD
0 - co
CC
a-ax 4
di2 0 0-
W M = 0 g.0 =ft to ci cfiq a ol
CD0
ro.m
REFERENCES
1. C. J. Hitch and R. N. McKean, "The Criterion Problem," The Economicsof Defense in the Nuclear AV, Harvard University Press, Cambridge,Mass.,17 PP. 158-631.
2. 1. Tleymont, 0. Bryk, H. Linstone, and J. Surmeier, "GIde for Reviewersof Studies Containing Cost-Effectiveness Analysis," Research AnalysisCorporation, Study IR-240, April 1965, pp. 11-15 and 50-58.
3. C. Allen, J. Bossenga, and J. Johnson, "A Simulation Model for VehicleOperation with a Set of Stochastic Conditions," Research AnalysisCorporation, in preparation.
4. J. J. Surmeier, "An Individual System/Organization Cost Model,"Research Analysis Corporation, in preparation.
29