Embed Size (px)
Citation preview
U.S. Department of the InteriorU.S. Geological Survey
Scientific Investigations Report 2006-5192
In cooperation with Ohio Water Development Authority, Ohio Lake Erie Office, Northeast Ohio Regional Sewer District, and Cuyahoga County Board of Health
Models for Predicting Recreational Water Quality at Lake Erie Beaches

COVER PHOTOGRAPH: Edgewater Park, Main Beach, looking east to downtown Cleveland, Ohio. (Photo by Ken Frame, U.S. Geological Survey.)
Models for Predicting Recreational Water Quality at Lake Erie Beaches
By Donna S. Francy, Robert A. Darner, and Erin E. Bertke
In cooperation with Ohio Water Development Authority, Ohio Lake Erie Office, Northeast Ohio Regional Sewer District, and Cuyahoga County Board of Health
Scientific Investigations Report 2006-5192
U.S. Department of the InteriorU.S. Geological Survey
U.S. Department of the InteriorDIRK KEMPTHORNE, Secretary
U.S. Geological SurveyP. Patrick Leahy, Acting Director
U.S. Geological Survey, Reston, Virginia: 2006
For product and ordering information: World Wide Web: http://www.usgs.gov/pubprod Telephone: 1-888-ASK-USGS
For more information on the USGS—the Federal source for science about the Earth, its natural and living resources, natural hazards, and the environment: World Wide Web: http://www.usgs.gov Telephone: 1-888-ASK-USGS
Suggested citation: Francy, D.S., Darner, R.A. and Bertke, E.E., 2006, Models for predicting recreational water quality at Lake Erie beaches: U.S. Geological Survey Scientific Investigations Report 2006-5192, 13 p.
Any use of trade, product, or firm names is for descriptive purposes only and does not imply endorsement by the U.S. Government.
Although this report is in the public domain, permission must be secured from the individual copyright owners to reproduce any copyrighted material contained within this report.
iii
ContentsAbstract ...........................................................................................................................................................1Introduction.....................................................................................................................................................1Methods...........................................................................................................................................................2
Data Collection ......................................................................................................................................2Quality Assurance and Quality Control .............................................................................................3Data Analysis and Development and Testing of Predictive Models ............................................3
Relations Between Escherichia coli Concentrations and Environmental or Water-Quality Variables ..................................................................................................................4
Development and Validation of Beach-Specific Predictive Models .....................................................7Determination of Model Output Values .............................................................................................7Model Validation ...................................................................................................................................7
Future Work ..................................................................................................................................................10Summary and Conclusions .........................................................................................................................11Acknowledgments .......................................................................................................................................12References Cited..........................................................................................................................................12
Figures1. Map showing locations of the five Lake Erie beaches used for studies of
predictive modeling ......................................................................................................................22. Graphs showing Escherichia coli concentrations in water by wave height and
24-hour wind direction, Villa Angela, 2004–2005 .....................................................................63. Graph showing establishment of the threshold probability for Huntington
2000–2004 model ...........................................................................................................................9
Tables 1. Summary statistics of Escherichia coli (E. coli) concentrations at five Lake Erie
beaches, 2000–2005 ......................................................................................................................52. Pearson’s r correlations between log10 Escherichia coli (E. coli) concentrations
and explanatory variables at five Lake Erie beaches, 2000–2005 .........................................63. Variables and regression statistics for beach models ........................................................................84. Numbers of correct responses and the sensitivities and specificities of model
responses with indicated thresholds and predicted Escherichia coli (E. coli) concentrations compared to previous day’s E. coli concentrations (current method for assessing recreational water quality) ...................................................9
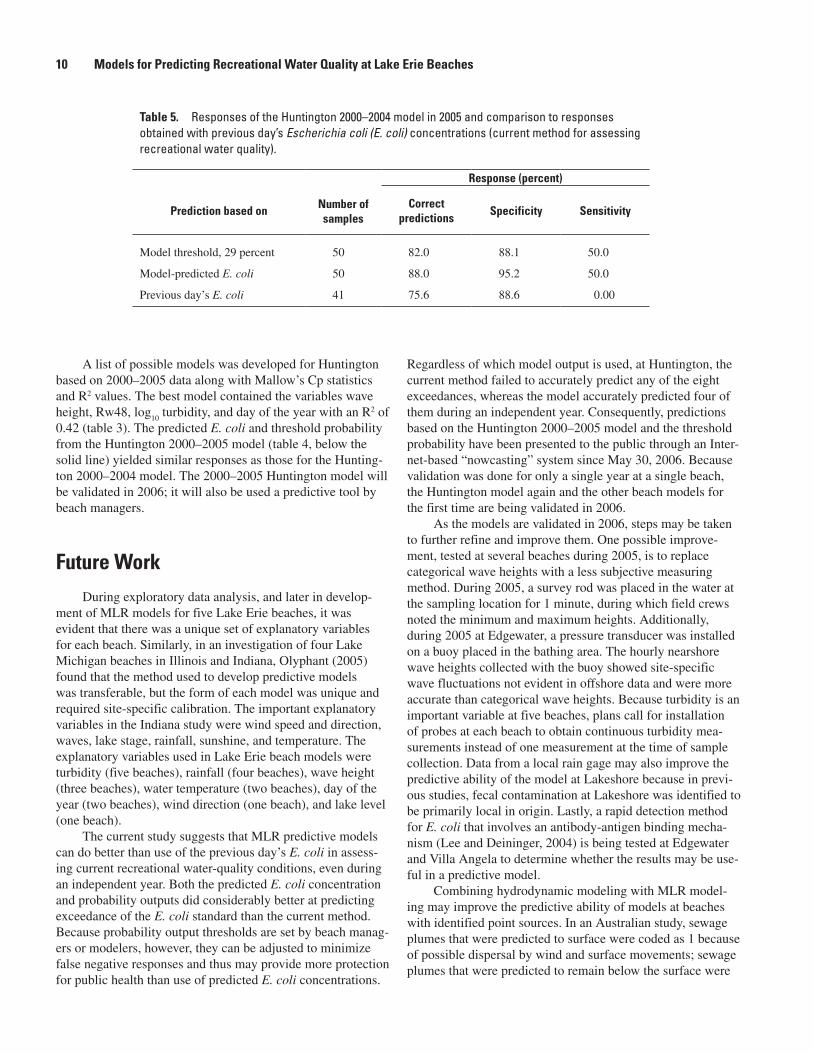
5. Responses of the Huntington model 2000–2004 in 2005 and comparison to responses obtained with previous day’s Escherichia coli (E. coli) concentrations (current method for assessing recreational water quality) ................................................................10
iv
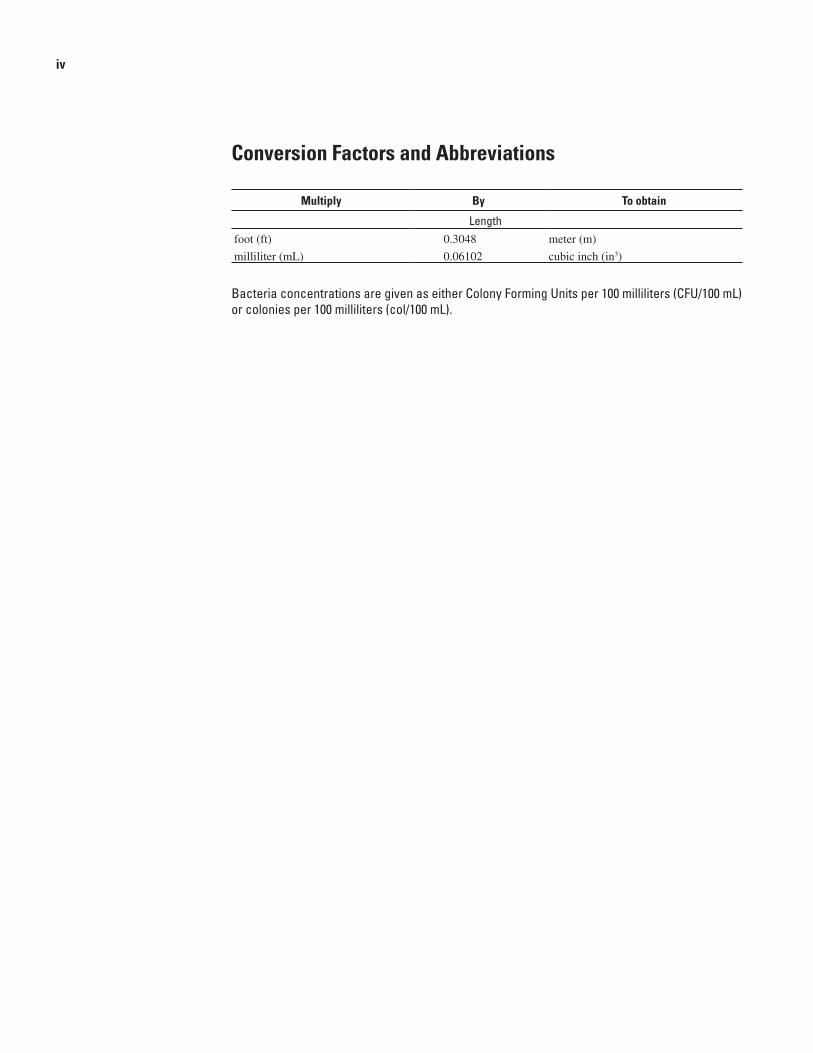
Conversion Factors and Abbreviations
Multiply By To obtain
Lengthfoot (ft) 0.3048 meter (m)
milliliter (mL) 0.06102 cubic inch (in3)
Bacteria concentrations are given as either Colony Forming Units per 100 milliliters (CFU/100 mL) or colonies per 100 milliliters (col/100 mL).
AbstractData collected from four Lake Erie beaches during the
recreational seasons of 2004–05 and from one Lake Erie beach during 2000–2005 were used to develop predictive models for recreational water quality by means of multiple linear regres-sion. The best model for each beach was based on a unique combination of environmental and water-quality explanatory variables including turbidity, rainfall, wave height, water temperature, day of the year, wind direction, and lake level. Two types of outputs were produced from the models—the predicted Escherichia coli concentration and the probability that the bathing-water standard will be exceeded. The model for one of beaches, Huntington Reservation (Huntington), was validated in 2005. For 2005, the Huntington model yielded more correct responses and better predicted exceedance of the standard than did current methods for assessing recreational water quality, which are based on the previous day’s E. coli concentration. Predictions based on the Huntington model have been available to the public through an Internet-based “nowcasting” system since May 30, 2006. The other beach models are being validated for the first time in 2006. The methods used in this study to develop and test predictive models can be applied at other similar coastal beaches.
IntroductionSwim advisories or closings issued by beach managers
in the United States are based on standards for concentrations of fecal-indicator bacteria, such as Escherichia coli (E. coli) or enterococci. Concentrations may change between the time of sampling and the reporting of results (18–24 hours). For example, in Ohio, the current practice is to use results from the previous day’s E. coli to assess whether to post a recreational water-quality advisory (Ohio Department of Health, 2005). This time lag can lead to beach advisories and closures that cause unwarranted loss of valuable recreation access or to per-mit swimming when conditions present an unacceptable level of risk. Recognizing this problem and other inadequacies in beach monitoring, the U.S. Environmental Protection Agency
(USEPA) initiated the Beaches Environmental Assessment, Closure, and Health (BEACH) Program to reduce the health risks for users of U.S. recreational waters (U.S. Environmental Protection Agency, 1999a).
One goal of the USEPA BEACH Program is development of mathematical models for real-time forecasting. Real-time forecasting may help resolve the delayed notification problems inherent with the present approach to recreational monitoring. In cases where fecal contamination to a beach is point-source dominated, hydrodynamic mixing and transport models can be applied (U.S. Environmental Protection Agency, 1999b). At many Ohio beaches and elsewhere, however, nonpoint or unidentified sources dominate, and multiple linear regression (MLR) models may be more appropriate. MLR models typi-cally make use of easily measured environmental and water-quality variables to estimate bacterial indicator concentrations or the probability of exceeding target concentrations.
Models based on environmental and water-quality vari-ables have been shown to be useful predictors of recreational water quality. They include advisory systems based on rainfall amounts (Ackerman and Weisberg, 2003; Hose and others, 2005) or more complicated models that employ real-time sen-sors to measure several explanatory variables (Olyphant and others, 2003; Whitman, 2005; Olyphant and Pfister, 2005). Beach-specific models were previously developed for Ohio Lake Erie beaches using MLR techniques and 1 or 2 years of data (Francy and Darner, 2002; Francy and others, 2003). The explanatory variables included wave height, number of birds on the beach, lake-current direction, rainfall, turbidity, and wind direction and speed.
The U.S. Geological Survey (USGS), in cooperation with Ohio Water Development Authority, Ohio Lake Erie Office, Northeast Ohio Regional Sewer District, and Cuyahoga County Board of Health, developed and tested MLR predictive models during a 2-year study. Data were collected to identify and compare the explanatory variables that best described E. coli concentrations at five Ohio Lake Erie beaches. This study was also done to compare the performance of predic-tive models to the current method for assessing recreational water quality and determine whether model results were good enough to be used for future public notifications. At Hunting-ton Reservation, because of 6 years of data collection, investi-
Models for Predicting Recreational Water Quality at Lake Erie Beaches
By Donna S. Francy, Robert A. Darner, and Erin E. Bertke
gations were further along than at other beaches, so this model was assessed during an independent (validation) year. The best model for each beach was based on a unique combination of explanatory variables including wave height, antecedent rain-fall, turbidity, lake level, water temperature, wind direction, and day of the year. Although the models performed better than the current method to assess recreational water quality, work is ongoing to improve their accuracies.
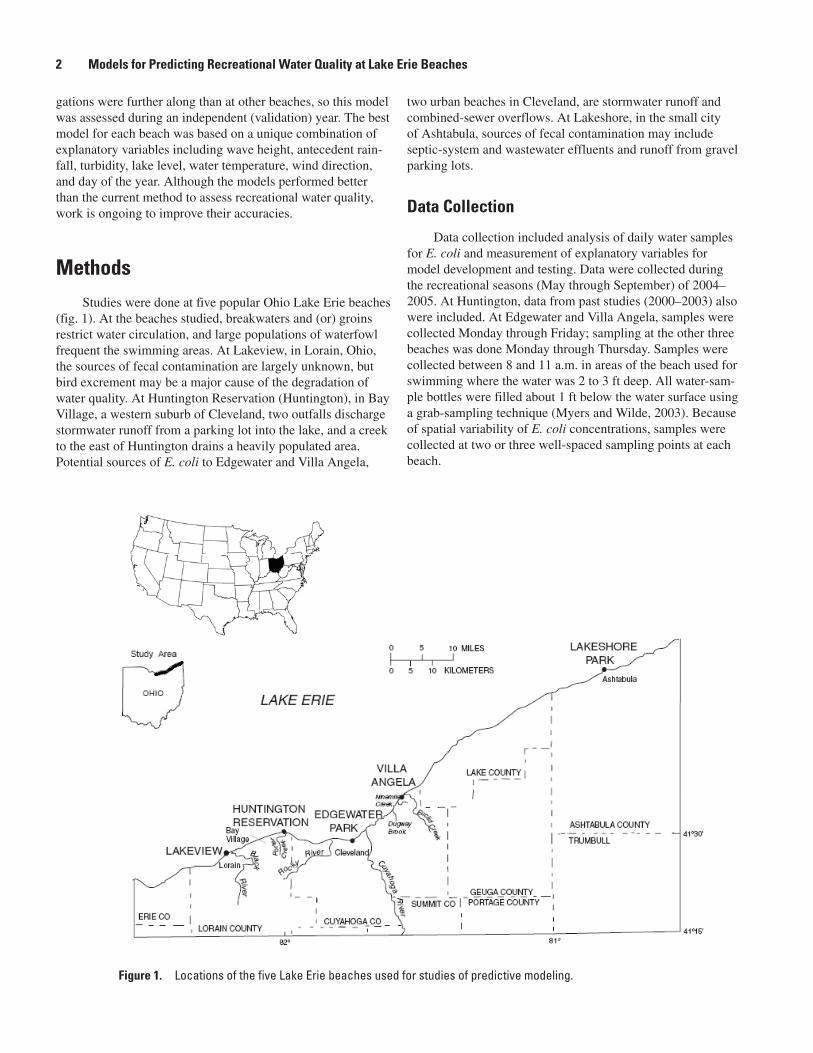
MethodsStudies were done at five popular Ohio Lake Erie beaches
(fig. 1). At the beaches studied, breakwaters and (or) groins restrict water circulation, and large populations of waterfowl frequent the swimming areas. At Lakeview, in Lorain, Ohio, the sources of fecal contamination are largely unknown, but bird excrement may be a major cause of the degradation of water quality. At Huntington Reservation (Huntington), in Bay Village, a western suburb of Cleveland, two outfalls discharge stormwater runoff from a parking lot into the lake, and a creek to the east of Huntington drains a heavily populated area. Potential sources of E. coli to Edgewater and Villa Angela,
two urban beaches in Cleveland, are stormwater runoff and combined-sewer overflows. At Lakeshore, in the small city of Ashtabula, sources of fecal contamination may include septic-system and wastewater effluents and runoff from gravel parking lots.
Data Collection
Data collection included analysis of daily water samples for E. coli and measurement of explanatory variables for model development and testing. Data were collected during the recreational seasons (May through September) of 2004–2005. At Huntington, data from past studies (2000–2003) also were included. At Edgewater and Villa Angela, samples were collected Monday through Friday; sampling at the other three beaches was done Monday through Thursday. Samples were collected between 8 and 11 a.m. in areas of the beach used for swimming where the water was 2 to 3 ft deep. All water-sam-ple bottles were filled about 1 ft below the water surface using a grab-sampling technique (Myers and Wilde, 2003). Because of spatial variability of E. coli concentrations, samples were collected at two or three well-spaced sampling points at each beach.
Figure 1. Locations of the five Lake Erie beaches used for studies of predictive modeling.
� Models for Predicting Recreational Water Quality at Lake Erie Beaches
Water samples were kept on ice until analyzed for concentrations of E. coli and turbidity locally by each agency within 6 hours of collection. Samples from Huntington were analyzed by use of the mTEC method (U.S. Environmental Protection Agency, 2000); samples from the other beaches were analyzed by use of the modified mTEC membrane-filtra-tion method (U.S. Environmental Protection Agency, 2002). Turbidity was determined in water samples with laboratory turbidimeters.
Data on explanatory variables were collected by field crews or compiled from a variety of sources. Upon arrival, field crews counted the number of birds on the beach, and they estimated wave-height categories at the time of sample collec-tion. Wave heights were placed into categories based on mini-mum and maximum heights in each wave train: (1) 0 to 2 ft, (2) 1 to 3 ft, (3) 2 to 4 ft, and (4) 3 to 6 ft or greater. If there were only a few observations in category 4, categories 3 and 4 were combined. Lake-level data were obtained from National Oceanic and Atmospheric Administration (NOAA) station in Fairport Harbor, Ohio, for Lakeshore (NOAA ID 9063053) and the station in Cleveland for the other four beaches (NOAA ID 9063053) (National Oceanic and Atmospheric Administra-tion, 2005a).
Rainfall and wind-direction data were compiled from the National Weather Service local climatology data stations at Hopkins International Airport for Huntington, Villa Angela, and Edgewater; from Lorain County Regional Airport for Lakeview; and from Ashtabula County Airport for Lake-shore (National Oceanic and Atmospheric Administration, 2005b). “R
d-1” was the amount of rain, in inches, that fell in
the 24-hour period (9 a.m. to 9 a.m.) preceding the morning sampling. Similarly, “R
d-2” and “R
d-3” were amounts of rain
that fell in 24-hour periods 2 days and 3 days preceding the morning sampling, respectively. Additional rainfall variables were computed as follows:
Rainfall weighted 72 hours (Rw72) = (3* R
d-1 + 2* R
d-2 + R
d-3)
Rainfall weighted 48 hours (Rw48) = (2* Rd-1
+ Rd-2
)
“Wind direction 24” was calculated by summing hourly wind vectors for the 24-hour period preceding sampling and determining the direction of the resultant vector. Wind direc-tions were then placed into categories by examining patterns in plots of E. coli concentrations as a function of wind direction 24; processes affecting E. coli were also considered to ensure that the wind direction 24 categories could reasonably be explained by physical processes.
Quality Assurance and Quality Control
Because models are only as good as the data used to develop them, strict quality-assurance and quality-control (QA/QC) practices were implemented. Written protocols were distributed to all personnel. The USGS did several onsite QA/QC checks of procedures performed by field and labora-
tory personnel throughout the recreational season, and any needed corrective actions were immediately taken. Approxi-mately 10 percent of E. coli samples were QC samples including split replicates, interagency replicates, field blanks, and positive control reference cultures, described elsewhere (Francy and others, 2005). For turbidity, duplicate aliquots were measured from the same bottle, and measurements that did not agree within 10 percent were repeated. Turbidity reference standards were sent to all laboratories. Results from QC samples were carefully monitored; retests were done and corrective measures were taken when needed.
Data Analysis and Development and Testing of Predictive Models
A daily E. coli concentration was calculated by averaging results from multiple sampling points at each beach. Averages were used instead of medians so as not to downweight the influence of extreme measurements. Bacterial concentrations were log
10 transformed before data analysis. Because, in previ-
ous studies (Francy and others, 2003), relations were shown to differ from year to year at the same beach, at least 2 years of data from each beach were examined and used for model development.
Statistical tests were done and plots were constructed to determine the strength of associations between E. coli and explanatory variables measured during the study. These included calculations of correlation coefficients and construc-tion of scatterplots for continuous variables. Box plots were used to understand the distribution of E. coli concentrations as a function of categorical variables, such as wave height and wind direction. Analysis of variance (ANOVA) was used to determine the relations between categorical variables and E. coli concentrations. The Tukey-Kramer multiple compari-son test was used to determine which groups differed from each other (Helsel and Hirsch, 2002, p. 198).
Explanatory variables that showed significant relations to E. coli concentrations were used to produce a list of possible MLR models using the Mallows Cp test (Mallows, 1973). The MLR models were ordered so that the coefficient of deter-mination (R2) was maximized and the Mallows’ Cp statistic was minimized. The R2 of each model is the fraction of the variation in E. coli concentrations that can be explained by a combination of explanatory variables. The Cp statistic is a measure of the error in a model with a subset of explanatory variables, relative to the error in a model that incorporates all potential explanatory variables. Models with explanatory vari-ables strongly related to each other (collinear), such as those with multiple rainfall variables, were omitted from the list. Models were then selected for further examination on the basis of the Mallows’ Cp ranking. Model statistics were examined and diagnostic tests were done to identify the model(s) for each beach that provided the best linear, unbiased estimator of E. coli concentrations (Helsel and Hirsch, 2002, p. 228). These included determination of parameter estimates, Cook’s
Methods �
D values, partial residual plots, and residuals plots. Performing well on model diagnostic tests and having a set of explanatory variables that seemed reasonable and were relatively easy to collect were the criteria for choosing the “best” model for each beach.
Two types of output were produced by the models. The first and obvious output was the predicted E. coli concentra-tion. Because prediction intervals were shown to be fairly wide in earlier studies (Francy and Darner, 1998; Francy and others, 2003), a second output variable was developed in the hope of providing a more accurate prediction—the probability of exceeding the Ohio single-sample bathing water standard for E. coli of 235 colony-forming units per 100 milliliters (CFU/100 mL). The probability that the predicted value with n-p degrees of freedom was greater than 235 CFU/100 mL was computed as prob (t>x), where x = (log
10 (235) – ) / sep,
t is student’s t, is the regression estimate of the log10
E. coli, sep is the standard error of prediction of y, n is the number of observations used in the regression, and p is the number of regression coefficients estimated in the regression equation.
For each selected model, a threshold probability associ-ated with too great a risk to allow swimming was determined retrospectively. Threshold probabilities were determined by taking the dataset used to develop the model and finding the probability that provided a reasonable balance between achiev-ing a high number of correct responses and a low number of false negative responses.
Model specificities and sensitivities for the threshold probability technique and predicted E. coli concentrations were reported and compared to specificities and sensitivities associated with the current method used to assess recreational water quality. The sensitivity is the proportion of actual exceedances (concentrations > 235 CFU/100 mL) that were predicted correctly. The specificity is the proportion of nonex-ceedances that were predicted correctly.
For model validation, data were collected during an independent year (a year whose data were not used for model development) to compare the model’s performance with the current method for assessing recreational water-quality. The model developed with data collected in 2000–2004 at Huntington was validated with data collected in 2005. After validation tests, new parameter estimates were determined based on data collected at Huntington from 2000–2005. At the other beaches, model validation will be done in 2006 for data collected during 2004–05.
Relations Between Escherichia coli Concentrations and Environmental or Water-Quality Variables
Annual summary statistics for E. coli concentrations at the five Lake Erie beaches are listed in table 1. Annual median concentrations of E. coli were highest at Lakeview and Lake-
shore, ranging from 130 to 380 CFU/100 mL. The percentage of days that the bathing-water standard was exceeded ranged from 8.1 percent at Edgewater in 2004 to 61.2 percent at Lakeview in 2005.
For Huntington, correlations between E. coli concentra-tions and potential explanatory variables were determined for data collected during 2000–2004 (table 2, left side of the solid line). R
d-1, turbidity, and log
10 turbidity were positively and
significantly related to E. coli for 2000–2004 combined and for each of the 5 years examined separately (data not shown). Number of birds, day of the year, R
d-3, water temperature, and
lake level were weakly or not significantly related to concen-trations of E. coli. Because both R
d-1 and R
d-2 (daily rainfall
variables) were significantly related to E. coli, Rw48 was included as an additional variable. Rw48 was more highly cor-related with E. coli than the single-day rainfall variables.
For Edgewater, Villa Angela, Lakeshore, and Lakeview, correlations between E. coli concentrations and potential explanatory variables were determined for data collected dur-ing 2004–2005 (table 2). R
d-1, Rw48, and log
10 turbidity were
positively and significantly related to E. coli at all beaches. The strongest relations between number of birds or day of the year and E. coli were found at Lakeview. At Edgewater, Villa Angela, and Lakeshore, but not at Lakeview, weighted rainfall variables (Rw48 or Rw72) were more highly correlated with E. coli than single-day rainfall variables. Water temperature was a significant variable for all beaches except Edgewater. Lake level was negatively and significantly related to E. coli at all beaches except Lakeshore.
The relations between categorical explanatory variables and E. coli were examined graphically and statistically. At all beaches, median E. coli concentrations increased with increasing wave height, and statistically significant differences were found among most of the wave-height categories. For example, at Villa Angela, statistically significant differences in E. coli concentrations were found between wave-height category 0 to 2 ft and other categories (fig. 2). Wind direction was found to be significantly related to E. coli concentrations at Lakeview and Villa Angela, but not at Huntington, Lake-shore, or Edgewater. At Villa Angela, southwesterly winds (173–254°) were associated with significantly higher E. coli concentrations than other wind directions (fig. 2). Because no physical factors seemed to explain this phenomenon, wind direction 24 was not used in model development at Villa Angela. At Lakeview, southerly winds (91–270°) were associ-ated with the highest E. coli concentrations (data not shown). Southerly winds tend to calm the beach waters and may lead to more birds in the area.
� Models for Predicting Recreational Water Quality at Lake Erie Beaches
Table 1. Summary statistics of Escherichia coli (E. coli) concentrations at five Lake Erie beaches, 2000–2005.
[CFU/100 mL is colony-forming units per 100 milliliters]
BeachNumber of samples
Daily E. coli concentrationsa, in CFU/100 mL
Number (percent) of days bathing-water standardb was exceededMedian Minimum Maximum
Edgewater
2004 99 51 5 890 8 (8.1)
2005 93 58 2 1,900 16 (17.2)
Villa Angela
2004 99 49 1 6,900 19 (19.2)
2005 89 110 2 4,200 32 (36.0)
Huntington
2000 51 110 8 6,600 12 (23.5)
2001 50 44 3 1,200 10 (20.0)
2002 52 43 4 1,800 11 (21.2)
2003 54 58 2 730 6 (11.1)
2004 54 31 3 1,500 7 (13.0)
2005 58 34 1 2,400 8 (13.8)
Lakeview
2004 46 280 54 4,200 27 (58.7)
2005 49 380 11 3,500 30 (61.2)
Lakeshore
2004 44 130 18 14,000 16 (36.4)
2005 45 240 9 5,200 23 (51.1)
a The daily concentrations of E. coli were determined by calculating the average of two or three point samples.
b Days the concentration of E. coli exceeded the single-sample maximum bathing-water standard of 235 CFU/100 mL.
Relations Between Escherichia coli Concentrations and Environmental or Water-Quality Variables �
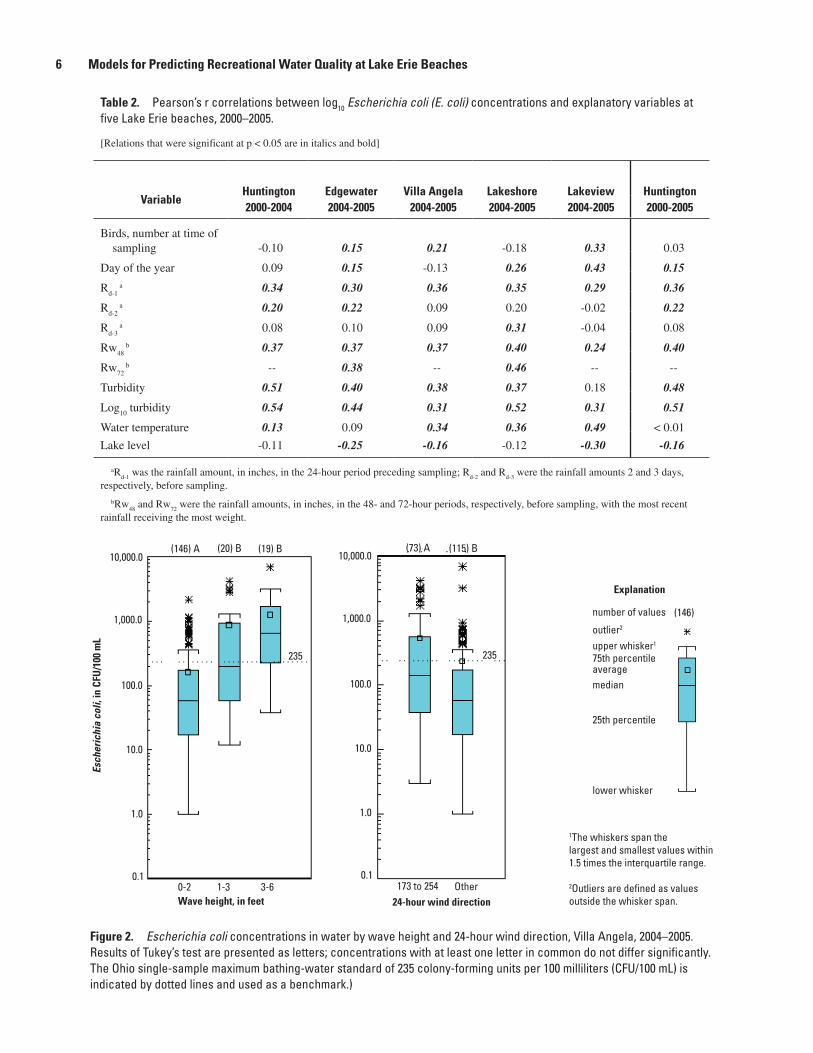
Table �. Pearson’s r correlations between log10 Escherichia coli (E. coli) concentrations and explanatory variables at five Lake Erie beaches, 2000–2005.
[Relations that were significant at p < 0.05 are in italics and bold]
VariableHuntington Edgewater Villa Angela Lakeshore Lakeview Huntington�000-�00� �00�-�00� �00�-�00� �00�-�00� �00�-�00� �000-�00�
Birds, number at time of sampling -0.10 0.15 0.21 -0.18 0.33 0.03
Day of the year 0.09 0.15 -0.13 0.26 0.43 0.15
Rd-1
a 0.34 0.30 0.36 0.35 0.29 0.36
Rd-2
a 0.20 0.22 0.09 0.20 -0.02 0.22
Rd-3
a 0.08 0.10 0.09 0.31 -0.04 0.08
Rw48
b 0.37 0.37 0.37 0.40 0.24 0.40
Rw72
b -- 0.38 -- 0.46 -- --
Turbidity 0.51 0.40 0.38 0.37 0.18 0.48
Log10
turbidity 0.54 0.44 0.31 0.52 0.31 0.51
Water temperature 0.13 0.09 0.34 0.36 0.49 < 0.01
Lake level -0.11 -0.25 -0.16 -0.12 -0.30 -0.16
aRd-1
was the rainfall amount, in inches, in the 24-hour period preceding sampling; Rd-2
and Rd-3
were the rainfall amounts 2 and 3 days, respectively, before sampling.
bRw48
and Rw72
were the rainfall amounts, in inches, in the 48- and 72-hour periods, respectively, before sampling, with the most recent rainfall receiving the most weight.
(146) A (20) B (19) B (73) A (115) B10,000.0
1,000.0
100.0
10.0
1.0
0.1
10,000.0
1,000.0
100.0
10.0
1.0
0.10-2 1-3 3-6 173 to 254 OtherWave height, in feet 24-hour wind direction
Esch
eric
hia
coli,
in C
FU/1
00 m
L
235 235
25th percentile
lower whisker
number of values (146)
outlier2
upper whisker1
75th percentileaveragemedian
Explanation
1The whiskers span thelargest and smallest values within1.5 times the interquartile range.
2Outliers are defined as valuesoutside the whisker span.
Figure �. Escherichia coli concentrations in water by wave height and 24-hour wind direction, Villa Angela, 2004–2005. Results of Tukey’s test are presented as letters; concentrations with at least one letter in common do not differ significantly. The Ohio single-sample maximum bathing-water standard of 235 colony-forming units per 100 milliliters (CFU/100 mL) is indicated by dotted lines and used as a benchmark.)
� Models for Predicting Recreational Water Quality at Lake Erie Beaches
Development and Validation of Beach-Specific Predictive Models
A list of possible models was produced for each beach, along with their Mallow’s Cp statistic and R2 values. From the list, one best model for each beach was selected; R2 values ranged from 0.35 for Lakeshore to 0.44 for Lakeview (table 3, above the solid line). All of the best beach models incorpo-rated log
10 turbidity as an explanatory variable, and four out
of five models incorporated a rainfall variable. Lake level was used only at Edgewater, and wind direction and day of the year only at Lakeview. Wave height and water temperature were used in three and two beach models, respectively.
Determination of Model Output Values
The MLR models were used to predict output values for the data used to develop the models. For the output as pre-dicted E. coli, no further calculations were needed because the threshold is, by default, set at 235 CFU/100 mL. The output as the probability requires determination of a threshold probabil-ity—the lowest (most conservative) probability that produces the most correct responses and (or) fewest false negative responses (Francy and others, 2003). This concept can be best explained by examining the plot for the Huntington 2000–2004 best model with a 29 percent threshold (fig. 3) and then explaining the process used to determine the 29 percent threshold. The plot is divided into four quadrants by a vertical line through 2.37 (log
10 of 235 CFU/100 mL) on the x-axis
and a horizontal line through the threshold probability of 29. By raising or lowering the horizontal probability line, one can determine the best threshold probability. This determination is somewhat subjective. For example, a threshold of 50 would have produced the highest number of correct responses (215) but would also have produced a high number of false nega-tives (28). Thresholds between 35 and 45 do little to reduce the number of false negatives. Selecting a threshold of 29, however, still maintains a high number of correct responses (210) but reduces the false negatives to a more acceptable level (18) and represents a compromise between false negative and false positive responses. In addition, setting the threshold to a lower value such as 29 enables the beach manager to err on the safe side. Thresholds, determined for the other beaches in this manner, ranged from 29 to 38 percent (table 4, above the solid line).
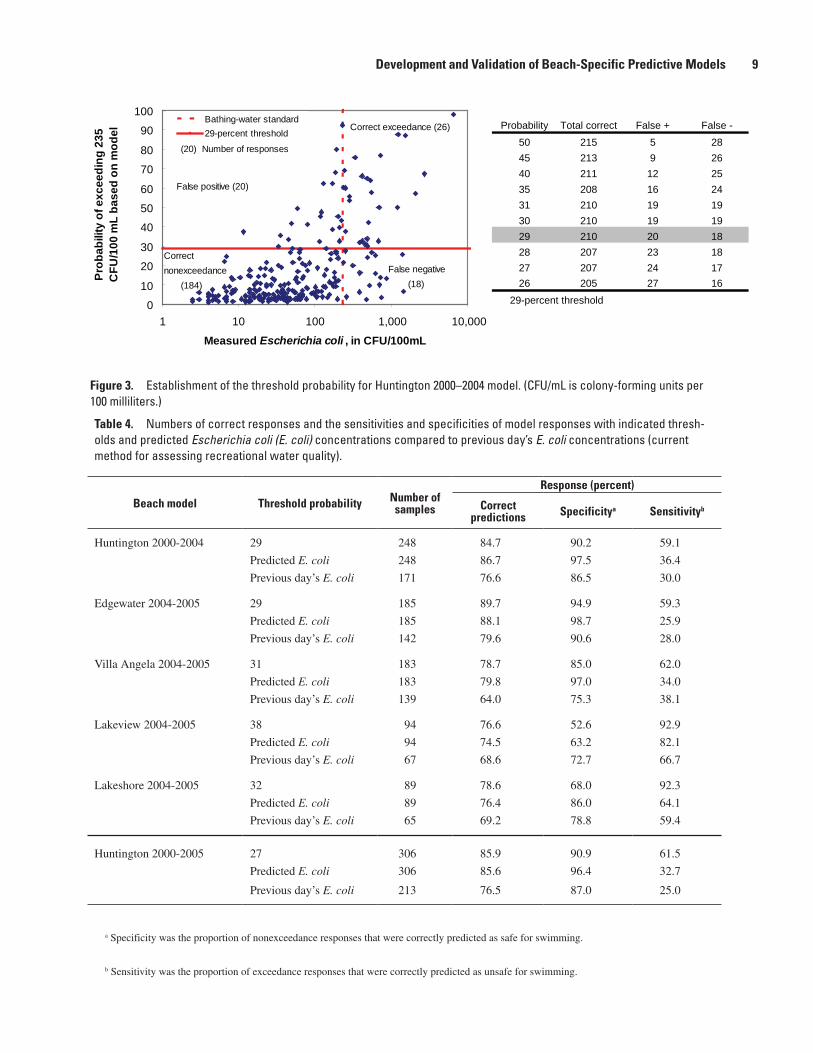
The responses from models that predict E. coli concentra-tions and threshold probabilities were compared to use of the previous day’s E. coli (table 4). For all beaches, the percent-ages of correct predictions were higher using the model than using the previous day’s E. coli. For Huntington 2000–2004
and Edgewater, model specificities using threshold probabili-ties were relatively high (90.2 and 94.9 percent), but model sensitivities (59.1 and 59.3 percent) were the lowest among the threshold probability responses for all beaches. The specifici-ties may be high at Huntington and Edgewater because the E. coli concentration did not exceed the standard for most of the days sampled (table 1). In contrast, at Lakeview and Lake-shore, model specificities using the threshold probability were less than those found using the current method and were rela-tively low (52.6 and 68 percent), but model sensitivities using the threshold probability were high (92.9 and 92.3 percent). The sensitivities may be high at Lakeview and Lakeshore because the standard was frequently exceeded in the datasets used to develop the models (table 1). In comparing the two model output values, use of predicted E. coli concentrations resulted in higher specificities, and use of threshold prob-abilities resulted in higher sensitivities. In fact, at all beaches, sensitivities were substantially higher using the threshold probability than using the predicted E. coli or the previous day’s E. coli.
Model Validation
Models perform fairly well when predicting responses to data used for their development. A better test of a model is to predict responses for an independent period. The 2000–2004 Huntington model was tested in 2005, and model responses were compared to use of the previous day’s E. coli (table 5). The percentages of correct predictions and specificities using either model output were in the same range as those found using the previous day’s E. coli. However, use of the previous day’s E. coli provided fewer predictions (41) than the model (50) because no samples were collected on Sundays. The dif-ference between the model responses and the current method responses is most pronounced when examining the sensitivi-ties. Using both output values from the model, four out of eight exceedances (50 percent sensitivity) during 2005 were correctly predicted. Using the previous day’s E. coli, none of the exceedances was predicted, resulting in a sensitivity of zero.
The data collected at Huntington during 2005 were added to the 2000–2004 dataset, and a new model was developed. Correlation coefficients that describe the relations between explanatory variables and E. coli for Huntington 2000–2005 are listed in table 2 (right side of solid line). As in 2000–2004, the relations between E. coli and R
d-1, R
d-2, Rw48, turbidity,
and log10
turbidity were significant for the 2000–2005 data-set. With the additional year, day of the year and lake level were significantly related to E. coli for 2000–2005 and were therefore added as possible explanatory variables during the 2000–2005 model-development process.
Development and Validation of Beach-Specific Predictive Models �
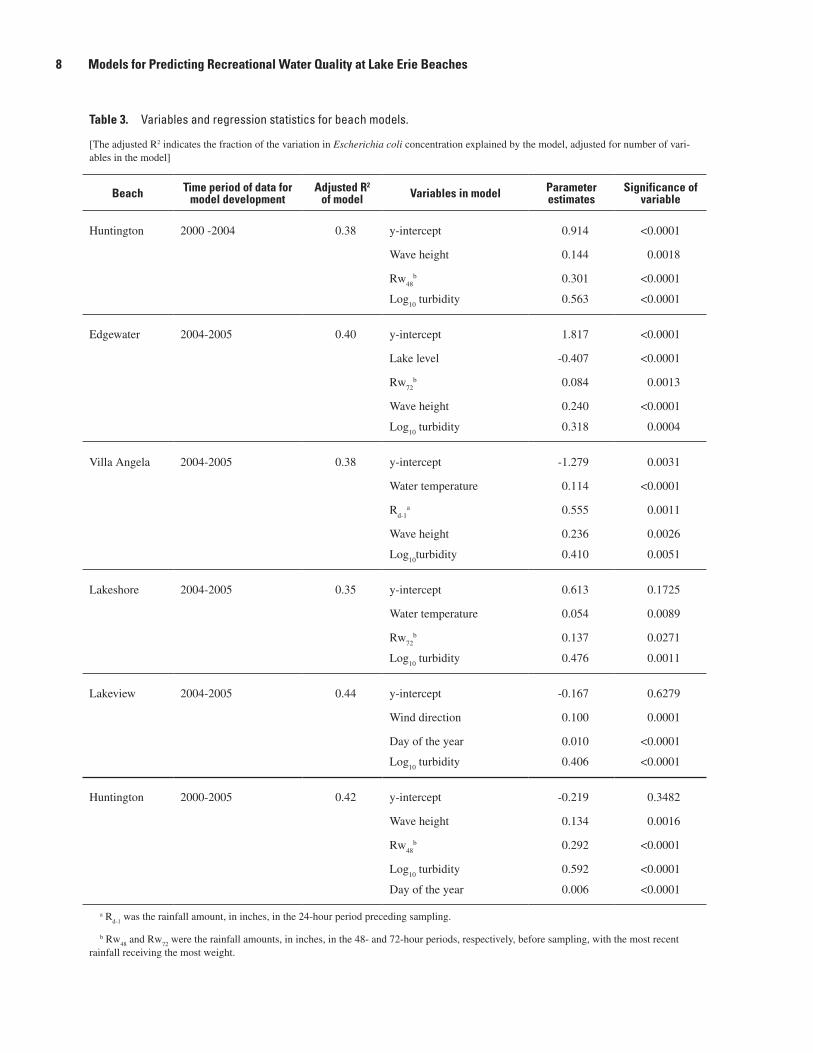
Table �. Variables and regression statistics for beach models.
[The adjusted R2 indicates the fraction of the variation in Escherichia coli concentration explained by the model, adjusted for number of vari-ables in the model]
Beach Time period of data for model development
Adjusted R� of model Variables in model Parameter
estimatesSignificance of
variable
Huntington 2000 -2004 0.38 y-intercept 0.914 <0.0001
Wave height 0.144 0.0018
Rw48
b 0.301 <0.0001
Log10
turbidity 0.563 <0.0001
Edgewater 2004-2005 0.40 y-intercept 1.817 <0.0001
Lake level -0.407 <0.0001
Rw72
b 0.084 0.0013
Wave height 0.240 <0.0001
Log10
turbidity 0.318 0.0004
Villa Angela 2004-2005 0.38 y-intercept -1.279 0.0031
Water temperature 0.114 <0.0001
Rd-1
a 0.555 0.0011
Wave height 0.236 0.0026
Log10
turbidity 0.410 0.0051
Lakeshore 2004-2005 0.35 y-intercept 0.613 0.1725
Water temperature 0.054 0.0089
Rw72
b 0.137 0.0271
Log10
turbidity 0.476 0.0011
Lakeview 2004-2005 0.44 y-intercept -0.167 0.6279
Wind direction 0.100 0.0001
Day of the year 0.010 <0.0001
Log10
turbidity 0.406 <0.0001
Huntington 2000-2005 0.42 y-intercept -0.219 0.3482
Wave height 0.134 0.0016
Rw48
b 0.292 <0.0001
Log10
turbidity 0.592 <0.0001
Day of the year 0.006 <0.0001
a Rd-1
was the rainfall amount, in inches, in the 24-hour period preceding sampling.
b Rw48
and Rw72
were the rainfall amounts, in inches, in the 48- and 72-hour periods, respectively, before sampling, with the most recent rainfall receiving the most weight.
� Models for Predicting Recreational Water Quality at Lake Erie Beaches
Probability Total correct False + False -50 215 5 2845 213 9 2640 211 12 2535 208 16 2431 210 19 1930 210 19 1929 210 20 1828 207 23 1827 207 24 1726 205 27 16
29-percent threshold0
10
20
30
40
50
60
70
80
90
100
1 10 100 1,000 10,000
Measured Escherichia coli , in CFU/100mL
Prob
abili
tyof
exce
edin
g23
5C
FU/1
00m
Lba
sed
onm
odel
Bathing-water standard29-percent threshold
Correctnonexceedance
(184)
False positive (20)
Correct exceedance (26)
False negative(18)
(20) Number of responses
Figure �. Establishment of the threshold probability for Huntington 2000–2004 model. (CFU/mL is colony-forming units per 100 milliliters.)
Table �. Numbers of correct responses and the sensitivities and specificities of model responses with indicated thresh-olds and predicted Escherichia coli (E. coli) concentrations compared to previous day’s E. coli concentrations (current method for assessing recreational water quality).
Beach model Threshold probability Number of samples
Response (percent)
Correct predictions Specificitya Sensitivityb
Huntington 2000-2004 29 248 84.7 90.2 59.1
Predicted E. coli 248 86.7 97.5 36.4
Previous day’s E. coli 171 76.6 86.5 30.0
Edgewater 2004-2005 29 185 89.7 94.9 59.3
Predicted E. coli 185 88.1 98.7 25.9
Previous day’s E. coli 142 79.6 90.6 28.0
Villa Angela 2004-2005 31 183 78.7 85.0 62.0
Predicted E. coli 183 79.8 97.0 34.0
Previous day’s E. coli 139 64.0 75.3 38.1
Lakeview 2004-2005 38 94 76.6 52.6 92.9
Predicted E. coli 94 74.5 63.2 82.1
Previous day’s E. coli 67 68.6 72.7 66.7
Lakeshore 2004-2005 32 89 78.6 68.0 92.3
Predicted E. coli 89 76.4 86.0 64.1
Previous day’s E. coli 65 69.2 78.8 59.4
Huntington 2000-2005 27 306 85.9 90.9 61.5
Predicted E. coli 306 85.6 96.4 32.7
Previous day’s E. coli 213 76.5 87.0 25.0
a Specificity was the proportion of nonexceedance responses that were correctly predicted as safe for swimming.
b Sensitivity was the proportion of exceedance responses that were correctly predicted as unsafe for swimming.
Development and Validation of Beach-Specific Predictive Models �
A list of possible models was developed for Huntington based on 2000–2005 data along with Mallow’s Cp statistics and R2 values. The best model contained the variables wave height, Rw48, log
10 turbidity, and day of the year with an R2 of
0.42 (table 3). The predicted E. coli and threshold probability from the Huntington 2000–2005 model (table 4, below the solid line) yielded similar responses as those for the Hunting-ton 2000–2004 model. The 2000–2005 Huntington model will be validated in 2006; it will also be used a predictive tool by beach managers.
Future WorkDuring exploratory data analysis, and later in develop-
ment of MLR models for five Lake Erie beaches, it was evident that there was a unique set of explanatory variables for each beach. Similarly, in an investigation of four Lake Michigan beaches in Illinois and Indiana, Olyphant (2005) found that the method used to develop predictive models was transferable, but the form of each model was unique and required site-specific calibration. The important explanatory variables in the Indiana study were wind speed and direction, waves, lake stage, rainfall, sunshine, and temperature. The explanatory variables used in Lake Erie beach models were turbidity (five beaches), rainfall (four beaches), wave height (three beaches), water temperature (two beaches), day of the year (two beaches), wind direction (one beach), and lake level (one beach).
The current study suggests that MLR predictive models can do better than use of the previous day’s E. coli in assess-ing current recreational water-quality conditions, even during an independent year. Both the predicted E. coli concentration and probability outputs did considerably better at predicting exceedance of the E. coli standard than the current method. Because probability output thresholds are set by beach manag-ers or modelers, however, they can be adjusted to minimize false negative responses and thus may provide more protection for public health than use of predicted E. coli concentrations.
Regardless of which model output is used, at Huntington, the current method failed to accurately predict any of the eight exceedances, whereas the model accurately predicted four of them during an independent year. Consequently, predictions based on the Huntington 2000–2005 model and the threshold probability have been presented to the public through an Inter-net-based “nowcasting” system since May 30, 2006. Because validation was done for only a single year at a single beach, the Huntington model again and the other beach models for the first time are being validated in 2006.
As the models are validated in 2006, steps may be taken to further refine and improve them. One possible improve-ment, tested at several beaches during 2005, is to replace categorical wave heights with a less subjective measuring method. During 2005, a survey rod was placed in the water at the sampling location for 1 minute, during which field crews noted the minimum and maximum heights. Additionally, during 2005 at Edgewater, a pressure transducer was installed on a buoy placed in the bathing area. The hourly nearshore wave heights collected with the buoy showed site-specific wave fluctuations not evident in offshore data and were more accurate than categorical wave heights. Because turbidity is an important variable at five beaches, plans call for installation of probes at each beach to obtain continuous turbidity mea-surements instead of one measurement at the time of sample collection. Data from a local rain gage may also improve the predictive ability of the model at Lakeshore because in previ-ous studies, fecal contamination at Lakeshore was identified to be primarily local in origin. Lastly, a rapid detection method for E. coli that involves an antibody-antigen binding mecha-nism (Lee and Deininger, 2004) is being tested at Edgewater and Villa Angela to determine whether the results may be use-ful in a predictive model.
Combining hydrodynamic modeling with MLR model-ing may improve the predictive ability of models at beaches with identified point sources. In an Australian study, sewage plumes that were predicted to surface were coded as 1 because of possible dispersal by wind and surface movements; sewage plumes that were predicted to remain below the surface were
Table �. Responses of the Huntington 2000–2004 model in 2005 and comparison to responses obtained with previous day’s Escherichia coli (E. coli) concentrations (current method for assessing recreational water quality).
Prediction based on Number of samples
Response (percent)
Correct predictions
Specificity Sensitivity
Model threshold, 29 percent 50 82.0 88.1 50.0
Model-predicted E. coli 50 88.0 95.2 50.0
Previous day’s E. coli 41 75.6 88.6 0.00
10 Models for Predicting Recreational Water Quality at Lake Erie Beaches
coded as 0 (Krogh and Robinson, 1996). This “plume entrap-ment” variable generated by near-field oceanographic models was found to be a significant variable in regression models.
The procedures detailed in this report can be used by oth-ers to develop predictive models at coastal beaches; all that is needed is an existing monitoring program and a basic knowl-edge of statistics and computer software. Equipment costs for data collection are minimal because most of the data required for predictive models are available from other agencies or are easily measured at the beach. As a model proves to be a use-ful tool at a particular beach, beach managers may decide to invest in more expensive equipment to measure environmental conditions in real time. If validation tests are successful, beach managers may also decide to develop an Internet-based system that provides model predictions to the beach-going public 7 days a week. Currently, weekend estimates are not com-monly available because most laboratories are not staffed on weekends.
Predictive models are meant to augment existing beach monitoring programs, not to replace them, and must be con-tinuously tested and refined. For example, if changes are made to improve water quality at the beach (for example, bird-deter-rent devices are installed, leaking sewerlines are repaired), new models can be developed using data collected after the improvements have been initiated. Additional data and refined variables can be added to models to improve predictions and to better protect public health.
Summary and ConclusionsA goal of the U.S. Environmental Protection Agency
(USEPA) Beaches Environmental Assessment, Closure, and Health (BEACH) Program is development of mathematical models for real-time forecasting to help resolve the delayed notification problems inherent with the present approach to recreational monitoring. At many beaches where nonpoint or unidentified sources dominate, multiple linear regression (MLR) models based on easily measured environmental and water-quality variables may be the most appropriate type of model for estimating bacterial indicator concentrations or the probability of exceeding target concentrations.
The U.S. Geological Survey (USGS), in cooperation with Ohio Water Development Authority, Ohio Lake Erie Office, Northeast Ohio Regional Sewer District, and Cuyahoga County Board of Health, developed and tested MLR predic-tive models for E. coli concentrations at five Ohio Lake Erie beaches—Lakeview (Lorain, Ohio), Huntington Reservation (Bay Village, Ohio), Edgewater and Villa Angela (Cleve-land, Ohio), and Lakeshore (Ashtabula, Ohio). At one beach, Huntington Reservation (Huntington), investigations were further along than at other beaches, so the Huntington model was assessed during an independent or validation year (a year whose data were not used for model development).
Data collection included analysis of daily water samples for E. coli and measurement of explanatory variables for model development and testing. Data were collected during the recreational seasons (May through September) of 2004–05. At Huntington, data from past studies (2000–2003) also were included. Among the environmental variables were single-day and weighted rainfall variables. Single-day variables included rainfall that fell in a previous 24-hour period; weighted rainfall included rainfall that fell in the 48- or 72-hour antecedent period, with the most recent rainfall receiving the most weight (Rw48 and Rw72, respectively). Wind direction was calcu-lated by summing hourly wind vectors for the 24-hour period preceding sampling and determining the direction of the resul-tant vector. Wave height was visually estimated and placed into one of four categories.
A daily E. coli concentration was calculated by averaging results from multiple sampling points at each beach. Bacterial concentrations were log
10 transformed before data analysis. At
least 2 years of data from each beach were examined and used for model development. Explanatory variables that showed significant relations to E. coli concentrations were used to produce a list of possible MLR models using the Mallows Cp test. The MLR models were ordered so that the coefficient of determination (R2) was maximized and the Mallows’ Cp statistic was minimized. Model statistics were examined and diagnostic tests were done to identify the model(s) for each beach that provided the best linear, unbiased estimator of E. coli concentrations.
The two types of output produced by the models were predicted E. coli concentration and the probability of exceed-ing the Ohio single-sample bathing water standard for E. coli of 235 colony-forming units per 100 milliliters (CFU/100 mL). For each selected model, a threshold prob-ability associated with too great a risk to allow swimming was determined retrospectively. Threshold probabilities were determined by taking the dataset used to develop the model and finding the probability that provided a reasonable balance between achieving a high number of correct responses and a low number of false negative responses.
From a list of possible models, one best model for each was selected; R2 values ranged from 0.35 for Lakeshore to 0.44 for Lakeview. All of the best beach models incorporated log
10 turbidity as an explanatory variable, and four out of five
models incorporated a rainfall variable. Weighted rainfall variables (Rw48 and Rw72) were used in three beach models instead of single-day rainfall variables. Lake level was used only at Edgewater, and wind direction and day of the year only at Lakeview. Wave height and water temperature were used in three and two beach models, respectively.
The responses from models that predict E. coli concen-trations and threshold probabilities were compared to use of the previous day’s E. coli (current method). Model threshold probabilities ranged from 29 to 38 percent. For all beaches, the percentages of correct predictions were higher using the model than using the previous day’s E. coli.
Summary and Conclusions 11
The model developed with data collected in 2000–2004 at Huntington was validated with data collected during an independent period (2005). Using either model output, the percentages of correctly predicting nonexceedance of the bathing-water standard (specificity) were in the same range as the percentage found using the previous day’s E. coli. The difference between the model responses and the current method responses was most pronounced when examining the percentages of correctly predicting exceedance of the bathing-water standard (sensitivity). Using both output values from the model, four out of eight exceedances (50 percent sensitivity) during 2005 were correctly predicted. Using the previous day’s E. coli, none of the exceedances was predicted.
Principal conclusions and implications for future work are the following:
It was evident that there was a unique set of explana-tory variables for each beach. The explanatory vari-ables used in Lake Erie beach models were turbidity (five beaches), rainfall (four beaches), wave height (three beaches), water temperature (two beaches), day of the year (two beaches), wind direction (one beach), and lake level (one beach).
This study suggests that MLR predictive models can do better than use of the previous day’s E. coli in assessing current recreational water-quality conditions, even during an independent year. Because validation was done for only a single year at a single beach, the Huntington model and other beach models are being validated in 2006.
As the models are validated in 2006, steps may be taken to further refine and improve them. Possible improvements include obtaining more accurate measurements of wave heights, measuring continuous turbidity, obtaining data from local rain gages, and incorporating rapid analytical methods for E. coli into the models. Combining hydrodynamic modeling with MLR modeling also may improve the predictive ability of models at beaches with identified point sources.
The procedures detailed in this report can be used by others to develop predictive models at coastal beaches. Through an Internet-based system, models can be use-ful tools that provide predictions to the beach-going public 7 days a week.
If changes are made to improve water quality at a beach, new models can be developed using data col-lected after the improvements have been initiated. Additional data and refined variables can be added to models to improve predictions and to better protect public health.
•
•
•
•
•
AcknowledgmentsThe authors thank Lester Stumpe, Mark Citriglia, and
Eva Hatvani of the Northeast Ohio Regional Sewer Dis-trict; Jill Lis of the Cuyahoga County Board of Health; Jack Kurowski of the Lorain City Health Dept.; Brenda Stephens of the Ashtabula Township Park Commission; and students Timothy Roberts and Paula Carver.
References Cited
Ackerman, D., and Weisberg, S.B., 2003, Relationship between rainfall and beach bacterial concentrations on Santa Monica bay beaches: Journal of Water and Health, v. 1, no. 2, p. 85–89.
Francy, D.S., Bushon, R.N., Brady, A.M.G., Kephart, C.M., and Stoeckel, D.M., 2005, Quality-assurance/quality-con-trol manual for the Ohio Water Microbiology Laboratory, accessed March 2006 at http://oh.water.usgs.gov/micro/qcmanual/manual.html
Francy, D.S., and Darner, R.A., 1998, Factors affecting Escherichia coli concentrations at Lake Erie public bathing beaches: U.S. Geological Survey Water-Resources Investi-gations Report 98–4241, 41 p.
Francy, D.S., and Darner, R.A., 2002, Forecasting bacteria levels at bathing beaches in Ohio: U.S. Geological Survey Fact Sheet FS–132–02, 4 p.
Francy, D.S., Gifford, A.M., and Darner, R.A., 2003, Esch-erichia coli at Ohio bathing beaches— Distribution, sources, wastewater indicators, and predictive modeling: U.S. Geological Survey Water-Resources Investigations Report 02–4285, 120 p.
Helsel, D.R., and Hirsch, R.M., 2002, Statistical methods in water resources: U.S. Geological Survey Techniques of Water-Resources Investigations, book 3, chap. A3, accessed March 2006 at http://pubs.er.usgs.gov/pubs/twri/twri04A3
Hose, G.C., Gordon, G., McCullough, F.E., Pulver, N., and Murray, B.R., 2005, Spatial and rainfall related patterns of bacterial contamination in Sydney Harbour estuary: Journal of Water and Health, v. 3, no. 4, p. 349–358.
Krogh, M., and Robinson, L., 1996, Environmental variables and their association with faecal coliform and faecal strepto-cocci densities at thirteen Sydney beaches: Marine Pollution Bulletin, v. 33, no. 7–12, p. 239–248.
Lee, J., and Deininger, R.A., 2004, Detection of E. coli in beach water within 1 hour using immunomagnetic separa-tion and ATP bioluminescence: Luminescence, v. 19, no. 1, p. 31–36.
1� Models for Predicting Recreational Water Quality at Lake Erie Beaches
Mallows, C.L., 1973, Some comments on CP: Technometrics, v. 42, no. 1, p. 87–94.
Myers, D.N., Wilde, F.D., eds., 2003, Biological indicators (3d ed.)— U.S. Geological Survey Techniques of Water-Resources Investigations, book 9, chap A7, accessed March 2006 at http://pubs.water.usgs.gov/twri9A7/
National Oceanic and Atmospheric Administration, 2005a, International Great Lakes Datum, Center for Operational Oceanographic Products and Services, accessed October 2005 at http://www.co-ops.nos.noaa.gov
National Oceanic and Atmospheric Administration, 2005b, National Virtual Data System—National Climatic Data Center. Asheville, N.C., accessed October 2004 and 2005 at http://nndc.noaa.gov
Ohio Department of Health, 2005, Bathing beach monitoring program, accessed September 2005 at http://www.odh.state.oh.us/odhPrograms/eh/bbeach/beachmon.aspx
Olyphant, G.A., 2005, Statistical basis for predicting the need for bacterially induced beach closures—Emergence of a paradigm: Water Research, v. 39, no. 20, p. 4953–4960.
Olyphant, G.A., and Pfister, M., 2005, SwimCast—Its physi-cal and statistical basis: Proceedings of the Joint Confer-ence–Lake Michigan, State of the Lake and the Great Lakes Beach Association, Green Bay, Wisconsin, USA, Nov. 2–3, 2005, accessed March 2006 at http://www.aqua.wisc.edu/solm/
Olyphant, G.A., Thomas, J., Whitman, R.L., and Harper, D., 2003, Characterization and statistical modeling of bacterial (Escherichia coli) outflows from watersheds that discharge into southern Lake Michigan: Environmental Monitoring and Assessment, v. 81, no. 1–3, p. 289–300.
U.S. Environmental Protection Agency, 1999a, EPA action plan for beaches and recreational waters—Reducing expo-sures to waterborne pathogens: Washington, D.C., EPA/600/R–98/079, 19 p.
U.S. Environmental Protection Agency, 1999b, Review of potential modeling tools and approaches to support the BEACH program: Washington, D.D., EPA/823/R–99/002 [variable pagination].
U.S. Environmental Protection Agency, 2000, Improved enu-meration methods for the recreational water quality indica-tors—Enterococci and Escherichia coli: Washington, D.C., EPA–821–R–97–004 [variable pagination].
U.S. Environmental Protection Agency, 2002, Method 1603—Escherichia coli (E. coli) in water by membrane filtration using modified membrane-thermotolerant Escherichia coli agar (modified mTEC): Washington, D.C., EPA–821–R–02–023.
Whitman, R., 2005, Project S.A.F.E, accessed March 2006 at http://www.glsc.usgs.gov
References Cited 1�


Francy and others— M
odels for Predicting Recreational Water Q
uality at Lake Erie Beaches—
Scientific Investigations Report 2006-5192
Printed on recycled paper