Embed Size (px)
Citation preview
Mobility • Safety • Economy • Environment
Models and Methods for Collision AnalysisA guide for policymakers and practitioners
Professor Neville A StantonHuman Factors Engineering, University of SouthamptonMarch 2019

ISBN: 978-1-9160527-1-0
The Royal Automobile Club Foundation for Motoring Ltd is a transport policy and research
organisation which explores the economic, mobility, safety and environmental issues
relating to roads and their users. The Foundation publishes independent and authoritative
research with which it promotes informed debate and advocates policy in the interest of the
responsible motorist.
RAC Foundation
89–91 Pall Mall
London
SW1Y 5HS
Tel no: 020 7747 3445
www.racfoundation.org
Registered Charity No. 1002705
March 2019 © Copyright Royal Automobile Club Foundation for Motoring Ltd
Mobility • Safety • Economy • Environment
Models and Methods for Collision AnalysisA guide for policymakers and practitioners
Professor Neville A StantonHuman Factors Engineering, University of SouthamptonMarch 2019

i Models and Methods for Collision Analysis – A guide for policymakers and practitioners iiwww.racfoundation.org
About the Author
Disclaimer
Acknowledgements
Professor Neville Stanton, PhD, DSc, is a Chartered Psychologist, Chartered Ergonomist
and Chartered Engineer. He holds the Chair in Human Factors Engineering in the Faculty
of Engineering and the Environment at the University of Southampton in the UK. He has
degrees in occupational psychology, applied psychology and human factors engineering and
has worked at the Universities of Aston, Brunel, Cornell and MIT (Massachusetts Institute of
Technology). His research interests include modelling, predicting, analysing and evaluating
human performance in systems, as well as designing the interfaces and interaction between
humans and technology.
Professor Stanton has worked on design of automobiles, aircraft, ships and control rooms
over the past 30 years, on a variety of automation projects. He has published 40 books and
over 300 journal papers on ergonomics and human factors. In 1998 he was presented with
the Institution of Electrical Engineers Divisional Premium Award for research into system safety.
The Chartered Institute of Ergonomics and Human Factors in the UK awarded him The Otto
Edholm Medal in 2001, The President’s Medal in 2008 and 2018, and The Sir Frederic Bartlett
Medal in 2012 for his contributions to basic and applied ergonomics research. The Royal
Aeronautical Society awarded him and his colleagues the Hodgson Prize in 2006 for research
on design-induced, flight-deck error, published in The Aeronautical Journal. The University of
Southampton has awarded him a Doctor of Science in 2014 for his sustained contribution to
the development and validation of human factors methods.
He can be contacted at: [email protected]
This report has been prepared for the RAC Foundation by Professor Neville Stanton (University
of Southampton). Reasonable efforts have been made to publish reliable data and information
but the author, the University of Southampton and the RAC Foundation cannot assume
responsibility for the validity of all materials or the consequences of their use. The report
content reflects the views of the author and not necessarily those of the RAC Foundation.
Professor Neville Stanton would like to thank Professor Paul Salmon, Professor Guy Walker,
Dr Maggie Stanton, Elizabeth Box and Dr Anneka Lawson for their assistance and support
on this project.
i Models and Methods for Collision Analysis – A guide for policymakers and practitioners iiwww.racfoundation.org
ContentsAbout the report .................................................................................................................. vi
Introduction ......................................................................................................................... 1
1.1 Purpose ......................................................................................................................... 1
1.2 Background and context: UK road safety compared with other modes.......................... 1
Timeline of Models and Methods Development .................................................................... 3
Methods Selected for Review .............................................................................................. 7
Case Studies Based on the Uber Vehicle Collision with a Pedestrian ................................... 9
Comparison of Methods .................................................................................................... 16
Recommendations ............................................................................................................ 20
Appendix A: Description of the Methods ............................................................................. 21
Appendix B: Case Studies Applying the Methods to the Uber Collision .............................. 31
Appendix C: Expertise of Human Factors Analysts ............................................................ 46
References ........................................................................................................................ 47
1
2
3
4
5
6
iii Models and Methods for Collision Analysis – A guide for policymakers and practitioners ivwww.racfoundation.org
List of tablesTable 3.1: List of methods and corresponding models ......................................................... 7
Table 4.1: Timeline of events leading to Uber vehicle collision with pedestrian ...................... 9
Table 4.2: List of potential recommendations ..................................................................... 15
Table 5.2: Evaluation of methods against the seven tenets of collisions .............................. 17
Table 5.3: Evaluation of methods against the methodological criteria ................................. 18
Table 5.4: Evaluation of methods against the practical criteria ............................................ 19
Table A.1: Classification of key hazards in STAMP–CAST ................................................... 29
Table B.1: HFACS analysis of the Uber collision with a pedestrian ...................................... 42
iii Models and Methods for Collision Analysis – A guide for policymakers and practitioners ivwww.racfoundation.org
List of FiguresFigure 2.1: Timeline of selected methods (above line) and models (below line) ..................... 4
Figure 4.1: Actor Map of the Uber collision with a pedestrian ............................................. 11
Figure 4.2: AcciMap of the Uber collision with a pedestrian................................................ 13
Figure A.1: The AcciMap model ......................................................................................... 22
Figure A.2: The Bow-Tie model ......................................................................................... 23
Figure A.3: The EAST model .............................................................................................. 24
Figure A.4: The fault tree model ......................................................................................... 25
Figure A.5: The couplings model ........................................................................................ 26
Figure A.6: The HFACS model ........................................................................................... 27
Figure A.7: The STAMP model ........................................................................................... 29
Figure A.8: The STEP model .............................................................................................. 30
Figure B.1: Bow-Tie analysis of the Uber collision with a pedestrian ................................... 32
Figure B.2b: EAST–BN analysis of the Uber collision with a – the social network ............... 34
Figure B.2a: EAST–BN analysis of the Uber collision with a – the task network .................. 35
Figure B.2c: EAST–BN analysis of the Uber collision with a – the information network ....... 36
Figure B.3: Fault Tree Analysis of the Uber collision with a pedestrian ................................ 38
Figure B.4: FRAM analysis of the Uber collision with a pedestrian ...................................... 40
Figure B.5: STAMP–CAST analysis of the Uber collision with a pedestrian ......................... 43
Figure B.6: STEP analysis of the Uber collision with a pedestrian ....................................... 45
v Models and Methods for Collision Analysis – A guide for policymakers and practitioners viwww.racfoundation.org
List of abbreviationsAEB Autonomous Emergency Braking (Volvo)
EAST–BL Event Analysis of Systemic Teamwork – Broken Links
EAST–BN Event Analysis of Systemic Teamwork – Broken Nodes
FRAM Functional Resonance Analysis Method
FTA Fault Tree Analysis
HE Hazardous event
HFACS Human Factors Analysis and Classification Scheme
IE intermediate event
RCIP Road Collision Investigation Project
STAMP–CAST Systems–Theoretic Accident Model and Processes –
Causal Analysis using Systems Theory
STEP Sequential Timed Event Plotting
STS sociotechnical system(s)
In June 2018 the UK Government announced that £480,000 of funding was being provided
to the RAC Foundation to lead a trial of innovative approaches to road collision investigation.
The purpose of the Road Collision Investigation Project is to establish whether there is a
business case for investing more resource into the investigation of road crashes to facilitate
feedback and learning, in a manner akin to that already in place for the rail, air and maritime
sectors within the UK. As part of this three-year project several police force areas in England
are recruiting additional staff to collect and collate collision data which will be analysed to
identify and understand common themes and patterns that result in death and serious injury
on the public highway.
In order to test and trial a different approach to road collision investigation it is important,
from the outset, to develop an understanding of the human factors and accident analysis
models and methods used in other safety critical contexts. On that basis, following a
competitive tendering process, we commissioned Professor Neville Stanton, from the
University of Southampton, to advise on an appropriate framework to inform the direction
and approach taken by the Road Collision Investigation Project.
The report describes how accident causation models have changed over time and
details the rationale for taking a systems approach to collision investigation. A summary,
explanation and comparison of key systemic human factors accident investigation models
and human factors accident analysis methods is provided, illustrated by a case study from
the US where an Uber vehicle was involved in a collision with a pedestrian in March 2018.
Professor Stanton concludes with recommendations for the Road Collision Investigation
Project taking account of this evidence base.
This report is being published today, as the first of a series of project technical notes and
reports to support the development and delivery of the Road Collision Investigation Project.
We hope that this report, and subsequent work, will be of interest to those responsible for
identifying safety learning from incidents and look forward to continuing the dialogue with a
broad range of stakeholders across the safety critical system landscape as we continue to
develop this project.
For more information about the project please visit our website. You can also subscribe to
our mailing list to receive project updates. The project team can also be contacted via email.
Elizabeth Box
Head of Research, RAC Foundation
Road Collision Investigation Project Manager, RAC Foundation
v Models and Methods for Collision Analysis – A guide for policymakers and practitioners viwww.racfoundation.org
About the report
1 Models and Methods for Collision Analysis – A guide for policymakers and practitioners 2www.racfoundation.org
1. Introduction
Purpose
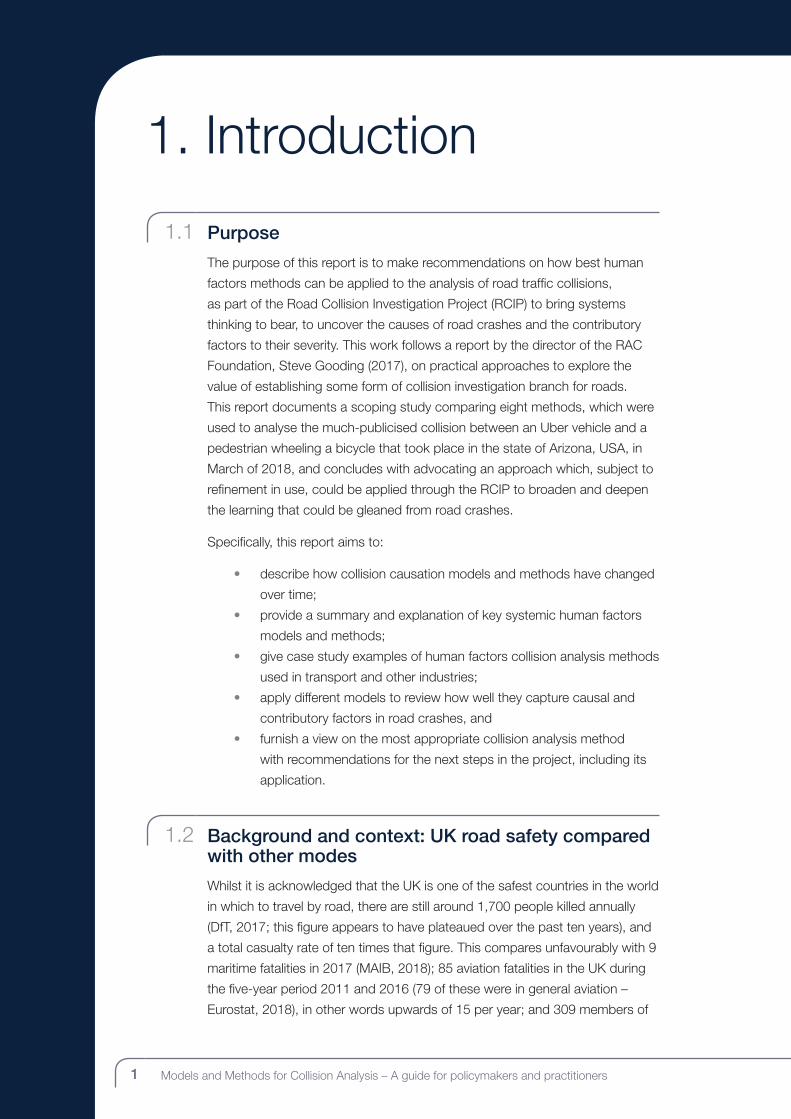
The purpose of this report is to make recommendations on how best human
factors methods can be applied to the analysis of road traffic collisions,
as part of the Road Collision Investigation Project (RCIP) to bring systems
thinking to bear, to uncover the causes of road crashes and the contributory
factors to their severity. This work follows a report by the director of the RAC
Foundation, Steve Gooding (2017), on practical approaches to explore the
value of establishing some form of collision investigation branch for roads.
This report documents a scoping study comparing eight methods, which were
used to analyse the much-publicised collision between an Uber vehicle and a
pedestrian wheeling a bicycle that took place in the state of Arizona, USA, in
March of 2018, and concludes with advocating an approach which, subject to
refinement in use, could be applied through the RCIP to broaden and deepen
the learning that could be gleaned from road crashes.
Specifically, this report aims to:
• describe how collision causation models and methods have changed
over time;
• provide a summary and explanation of key systemic human factors
models and methods;
• give case study examples of human factors collision analysis methods
used in transport and other industries;
• apply different models to review how well they capture causal and
contributory factors in road crashes, and
• furnish a view on the most appropriate collision analysis method
with recommendations for the next steps in the project, including its
application.
Background and context: UK road safety compared with other modes
Whilst it is acknowledged that the UK is one of the safest countries in the world
in which to travel by road, there are still around 1,700 people killed annually
(DfT, 2017; this figure appears to have plateaued over the past ten years), and
a total casualty rate of ten times that figure. This compares unfavourably with 9
maritime fatalities in 2017 (MAIB, 2018); 85 aviation fatalities in the UK during
the five-year period 2011 and 2016 (79 of these were in general aviation –
Eurostat, 2018), in other words upwards of 15 per year; and 309 members of
1.1
1.2

1 Models and Methods for Collision Analysis – A guide for policymakers and practitioners 2www.racfoundation.org
the general public fatalities in rail (of which 273 were suicide or suspected suicide, leaving 36
from other causes) in 2017 (ORR, 2017). Additionally there was 1 rail workforce fatality and
15 passenger fatalities. Air, maritime and rail modes all have accident investigation branches
that investigate incidents with the aim of making their transport system safer, and these have
had some success – as attested by the very low fatality figures. The comparatively higher
figures in road transport have led to the question of whether a collision investigation branch
for roads could help to identify interventions that would reduce fatalities and serious injuries
(Gooding, 2017). Approaches to collision analysis have changed over the past century, as
shown in the following chapter.
3 Models and Methods for Collision Analysis – A guide for policymakers and practitioners 4www.racfoundation.org3 Models and Methods for Collision Analysis – A guide for policymakers and practitioners 4www.racfoundation.org
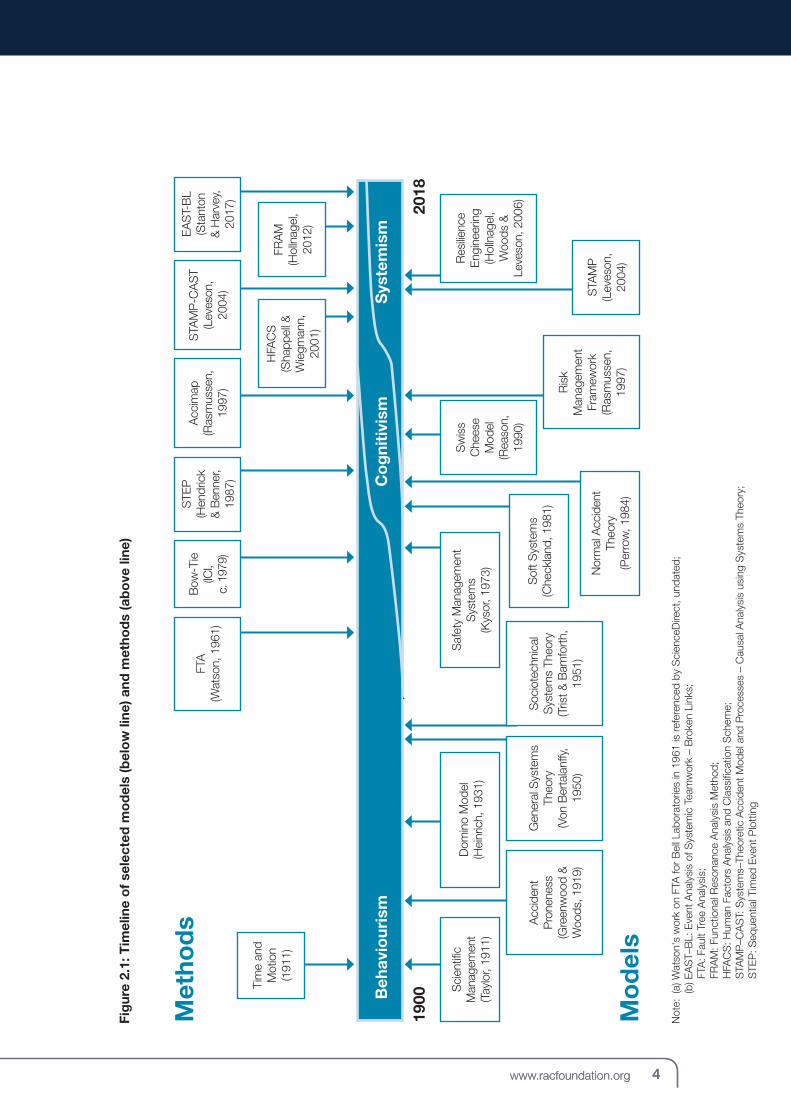
2. Timeline of Models and Methods DevelopmentAs Figure 2.1 shows, the dominant theories have changed over the timeline
between 1900 and 2018. In the early 1900s the focus of attention in incident
investigation was the work environment, with legislation being introduced to
enhance worker safety. Measures such as systematically recording incidents,
providing workers with protection from equipment, breaking work into its
component parts (Scientific Management: Taylor, 1911) and investigating
incident-proneness (Greenwood & Woods, 1919) led to measures that began
to improve the work environment. The cause-and-effect model (classically,
the Domino Model as proposed by Heinrich (1931)) epitomises the prevalent
view of that time, wherein the aim of incident investigation was to prevent all
incidents, with defences and barriers being put in place to prevent incidents
from occurring. This focus continued until the 1950s, when modern risk
management began. The new approach recognised that zero risk is not
achievable, but rather that system safety techniques benefited organisations
by reducing the frequency of incidents, with the result that interest was
stimulated in understanding how and why incidents occurred. Until the 1960s
the focus was largely on individual behaviour, with behaviourism as the
dominant research paradigm. Dominant models at this point were Scientific
Management, Accident-Proneness and the Domino Model. These models
have focused on attributing blame to individuals and searching for a root
cause of incidents. The associated methods based on these models (i.e. Fault
Tree Analysis, Bow-Tie and STEP (Sequential Timed Event Plotting)) are linear
and decompositional in nature (presenting events in a sequential manner and
breaking them down into their component parts). As such they tend to search
for faulty components and place an emphasis on human error.
3 Models and Methods for Collision Analysis – A guide for policymakers and practitioners 4www.racfoundation.org3 Models and Methods for Collision Analysis – A guide for policymakers and practitioners 4www.racfoundation.org
Fig
ure
2.1:
Tim
elin
e o
f se
lect
ed m
od
els
(bel
ow
line
) and
met
hod
s (a
bo
ve li
ne)
Not
e: (
a) W
atso
n's
wor
k on
FTA
for
Bel
l Lab
orat
orie
s in
196
1 is
refe
renc
ed b
y S
cien
ceD
irect
, und
ated
;
(b) E
AS
T–B
L: E
vent
Ana
lysi
s of
Sys
tem
ic T
eam
wor
k –
Bro
ken
Link
s;
FTA
: Fau
lt Tr
ee A
naly
sis;
FR
AM
: Fun
ctio
nal R
eson
ance
Ana
lysi
s M
etho
d;
HFA
CS
: Hum
an F
acto
rs A
naly
sis
and
Cla
ssifi
catio
n S
chem
e;
S
TAM
P–C
AS
T: S
yste
ms–
Theo
retic
Acc
iden
t Mod
el a
nd P
roce
sses
– C
ausa
l Ana
lysi
s us
ing
Sys
tem
s Th
eory
;
STE
P: S
eque
ntia
l Tim
ed E
vent
Plo
ttin
g
Tim
e an
d M
otio
n (1
911)
FTA
(W
atso
n, 1
961)
Bow
-Tie
(IC
I,
c. 1
979)
Acc
imap
(R
asm
usse
n,
1997
)
STA
MP
-CA
ST
(Lev
eson
, 20
04)
STE
P
(Hen
dric
k &
Ben
ner,
1987
)
EAS
T-B
L (S
tant
on
& H
arve
y,
2017
)
FRA
M
(Hol
lnag
el,
2012
)
HFA
CS
(S
happ
ell &
W
iegm
ann,
20
01)
Sci
entifi
c M
anag
emen
t (T
aylo
r, 19
11)
Nor
mal
Acc
iden
t Th
eory
(P
erro
w, 1
984)
Sof
t Sys
tem
s (C
heck
land
, 198
1)
Saf
ety
Man
agem
ent
Sys
tem
s
(Kys
or, 1
973)
Dom
ino
Mod
el
(Hei
nric
h, 1
931)
STA
MP
(L
eves
on,
2004
)Res
ilienc
e En
gine
erin
g (H
olln
agel
, W
oods
&
Leve
son,
200
6)S
ocio
tech
nica
l S
yste
ms
Theo
ry
(Tris
t & B
amfo
rth,
19
51)
Gen
eral
Sys
tem
s Th
eory
(V
on B
erta
lanf
fy,
1950
)
Acc
iden
t P
rone
ness
(G
reen
woo
d &
W
oods
, 191
9)R
isk
Man
agem
ent
Fram
ewor
k (R
asm
usse
n,
1997
)
Sw
iss
Che
ese
Mod
el
(Rea
son,
19
90)
Beh
avio
uris
m
Met
hod
s
Mo
del
s
Co
gni
tivi
smS
yste
mis
m
2018
1900
5 Models and Methods for Collision Analysis – A guide for policymakers and practitioners 6www.racfoundation.org
During the 1960s, systems became increasingly diverse, requiring safety systems to become
correspondingly more complex, necessitating structures in place to implement, maintain and
improve them. In addition, General Systems Theory (Von Bertalanffy, 1950) proposed the idea
that all things are composed of systems. In recognition of this, Kysor (1973) introduced the
concept of a Safety Management System. A Safety Management System is a system that is
used to manage or control safety, or a management system aimed at promoting safety. Whilst
there was still a search for a root cause of any given incident, the emphasis on organisational
and management features meant that incidents began to be conceptualised as having their
genuine root cause in these factors. Alongside this development there were changes that
broadened the focus still further to government and international levels, with the Health and
Safety Executive being set up in the UK in 1975, increased legislation in Europe, and the World
Safety Organization with its international standards being established also in 1975. At the
same time a number of major disasters occurred, leading to investigations and the publication
of official reports, which in turn increased awareness of the multiple influences that operate
when an incident happens. This led to further safety legislation and a shift from individual
initiatives to a systemic approach, with large companies integrating safety management into
their management framework. There has been an increasing recognition from that period
onwards that safety management is a process rather than an outcome.
The rise of cognitivism in the 1970s led to the linking of behaviour to underlying cognitive
functions and interaction with the world. This saw an increase in emphasis on psychological
factors, with a focus on decision-making, particularly in relation to ‘errors’. Reason (1990)
made a distinction between ‘errors’ (unintended acts) and ‘mistakes’ (deliberate acts,
though not malicious in intent). He classifies ‘slips’ as failures of attention, and ‘lapses’ as
failures of memory. Both slips and lapses are examples of where the action was unintended,
whereas mistakes are associated with intended action, but nevertheless having a poor
outcome. A mistake occurs when an actor intentionally performs an action that turns out to
be wrong. Therefore mistakes originate at the planning level, rather than the task-execution
level, and can thus also be termed planning failures. This thinking has influenced the
development of methods that have decisions and actions embedded within them, such as
HFACS (the Human Factors Analysis and Classification Scheme) and AcciMap. The STEP
method focuses on decisions and actions across time (sequentially), whilst methods such as
AcciMap, HFACS and STAMP (Systems–Theoretic Accident Model and Processes) consider
decisions and actions across levels of the system.
Although Sociotechnical Systems Theory was originally developed in the 1950s, it took
decades to reach mainstream risk management, and has attracted increasing interest in
more recent years. It was during the 1980s that the term ‘sociotechnical system’ was first
mentioned in relation to safety management and organisational design (Robinson, 1982).
This broadened the scope of investigation to the work system (consisting of the social and
technical subsystems in a given environment) as the unit of analysis. Sociotechnical Systems
Theory rose in popularity from the mid-1980s with Soft Systems Methodology, Normal
Accident Theory and then the Swiss Cheese Model. The Swiss Cheese Model underpins
the HFACS method, viewing collisions as happening when factors align in such a way as to
produce negative consequences.
5 Models and Methods for Collision Analysis – A guide for policymakers and practitioners 6www.racfoundation.org
Rasmussen (1997) proposed the Risk Management Framework – this highlighted the role of
actors at all levels of the system as responsible for safety. This changed the focus of incident
investigation from deconstructing what had happened in terms of events, acts and errors,
to designing improved systems. The approach shows that there can be many reasons why
a collision occurs, and that all of them need to be mitigated if the collision is not to reoccur
in the future. The Risk Management Framework provided the theoretical basis for the
AcciMaps and STAMP methods.
Resilience engineering was developed in the mid-2000s and has led to the development of
FRAM (the Functional Resonance Analysis Method). Finally, the EAST–BL (Event Analysis of
Systemic Teamwork – Broken Links) method is based on a general model of Sociotechnical
Systems Theory and assesses resilience in the networks. Both approaches recognise that
system behaviour cannot be predicted purely by predicting the behaviour of the component
parts. Each subsystem will have its own goals and functions. The models need to account
for interactions between these subsystems, which may be non-linear. Alongside this
there has been a shift from ‘human error’ to ‘human performance variability’. Thus the
understanding has moved from the dichotomous conceptualisation of correct and incorrect
behaviour to recognising that there is a range of human performance for which systems
need to accommodate and offer resilience. Methods such as FRAM and EAST–BL take a
holistic approach that is not domain-specific.
It has been argued that systemic approaches are needed to address the complexity of road
safety (Salmon and Lenné, 2015). By adopting the Rasmussen (1997) Risk Management
Framework, it is possible to view road traffic collisions resulting from:
1. multiple contributory factors rather than a single poor decision/action;
2. multiple system actors, rather than just road users alone;
3. interactions between multiple contributory factors and their emergent properties
(i.e. properties beyond the individual person or system component that emerge
through their interaction);
4. vertical integration across actors and events at all levels of the system;
5. poor quality of (or absence of) communication and feedback across levels of the
system, not just deficiencies at one level alone;
6. migration of system performance over time (at multiple levels of the road transport
system), from safe to unsafe, under the influence of various pressures, such as
economic and physical resources and constraints; and
7. a combination of triggering events (at multiple levels of the road transport system),
each of which is unlikely in isolation to cause significant problems, but all of which
occurring together can be catastrophic.
Resilience engineering offers a way of thinking about the dynamics of a system. More
resilient systems have a greater ability to return to a stable state after some disturbance. In
road transport terms, this means the ability of the road system to either prevent collisions or
to return quickly to normal running after a collision has occurred.
The selected methods are reviewed in the following chapter.
7 Models and Methods for Collision Analysis – A guide for policymakers and practitioners 8www.racfoundation.org
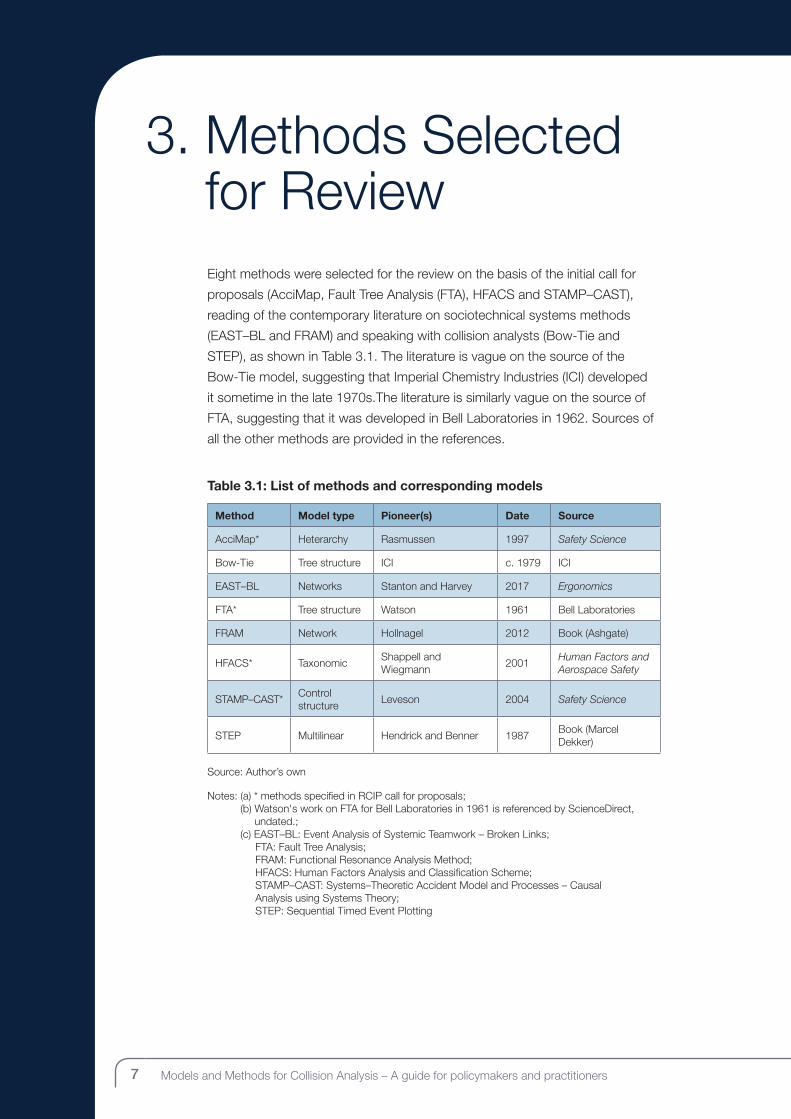
3. Methods Selected for ReviewEight methods were selected for the review on the basis of the initial call for
proposals (AcciMap, Fault Tree Analysis (FTA), HFACS and STAMP–CAST),
reading of the contemporary literature on sociotechnical systems methods
(EAST–BL and FRAM) and speaking with collision analysts (Bow-Tie and
STEP), as shown in Table 3.1. The literature is vague on the source of the
Bow-Tie model, suggesting that Imperial Chemistry Industries (ICI) developed
it sometime in the late 1970s.The literature is similarly vague on the source of
FTA, suggesting that it was developed in Bell Laboratories in 1962. Sources of
all the other methods are provided in the references.
Table 3.1: List of methods and corresponding models
Method Model type Pioneer(s) Date Source
AcciMap* Heterarchy Rasmussen 1997 Safety Science
Bow-Tie Tree structure ICI c. 1979 ICI
EAST–BL Networks Stanton and Harvey 2017 Ergonomics
FTA* Tree structure Watson 1961 Bell Laboratories
FRAM Network Hollnagel 2012 Book (Ashgate)
HFACS* TaxonomicShappell and Wiegmann
2001Human Factors and Aerospace Safety
STAMP–CAST*Control structure
Leveson 2004 Safety Science
STEP Multilinear Hendrick and Benner 1987Book (Marcel Dekker)
Source: Author’s own
Notes: (a) * methods specified in RCIP call for proposals; (b) Watson's work on FTA for Bell Laboratories in 1961 is referenced by ScienceDirect,
undated.; (c) EAST–BL: Event Analysis of Systemic Teamwork – Broken Links; FTA: Fault Tree Analysis; FRAM: Functional Resonance Analysis Method; HFACS: Human Factors Analysis and Classification Scheme; STAMP–CAST: Systems–Theoretic Accident Model and Processes – Causal
Analysis using Systems Theory; STEP: Sequential Timed Event Plotting

7 Models and Methods for Collision Analysis – A guide for policymakers and practitioners 8www.racfoundation.org
As Table 3.1 shows, each of the methods is associated with an underlying model type, the
pioneer(s) of the method, the date it was developed/published, and its source.
A short description of each of the methods is contained within Appendix A. The application
of the AcciMap method to a case study is presented in the next section, and applications of
the other methods may be found in Appendix B.
9 Models and Methods for Collision Analysis – A guide for policymakers and practitioners 10www.racfoundation.org
4. Case Studies Based on the Uber Vehicle Collision with a PedestrianTo make a direct comparison of the methods, a case study was selected to
which all of the methods could be applied. This case study was based on the
Uber vehicle collision with a pedestrian wheeling a bicycle, which occurred
at approximately 21.58 on 18 March 2018 in Arizona, USA. Although the full
report by NHTSA (the US National Highway Traffic Safety Administration) was
not available at the time of this study, there was sufficient information available
to undertake analysis with the methods selected for review (a short preliminary
report was available: NTSB, 2018). This analysis is based upon information that
was available at the time of writing the report. As the investigation progresses,
these details may change and/or further details may come to light. However
this is unlikely to change the nature of the comparison of methods, which was
the purpose of this exercise. The timeline of the immediate events leading up to
the collision, as far as they are known, are presented in Table 4.1.
The background to this collision is that Uber decided to test its automated
vehicles in Arizona after being denied testing in California (owing to the
requirement for testing permits, a ruling which Uber disputed). The Arizona
State governor made it known that he would allow testing without special
vehicle permits. Prior to the vehicle testing, Uber recruited and trained drivers
to work eight-hour shifts in its vehicles. The role of the drivers was to observe
the vehicle and to note events of interest on a central tablet. They were also
supposed to regain control of the vehicle in the event of an emergency. In
order for the testing to proceed, Uber disabled the Autonomous Emergency
Braking (AEB) and the Volvo City Safety system. These systems were removed
in order to avoid an erratic ride in the vehicle, such as vehicle braking in the
event that objects in the vehicles path were falsely detected. Following the
collision of the Uber vehicle with the pedestrian, the testing programme was
suspended. There is an ongoing investigation into the collision (NTSB, 2018).
Analysis of the collision was undertaken in this paper using all eight methods
in order to highlight the differences between the approaches. The AcciMap
analysis is presented in this chapter, with the other seven analyses presented in
Appendix B. The AcciMap analysis has been chosen here as it offers the most
9 Models and Methods for Collision Analysis – A guide for policymakers and practitioners 10www.racfoundation.org
comprehensive description of the collision and was found to be superior in the comparison
of methods.
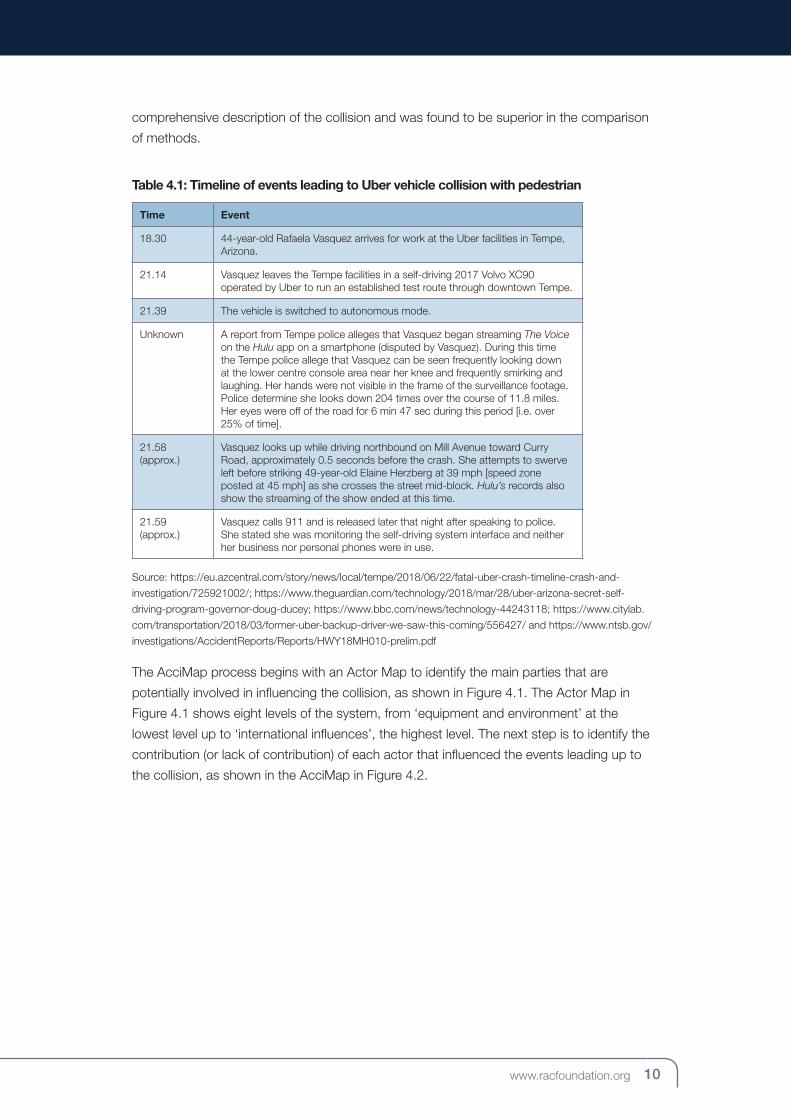
Table 4.1: Timeline of events leading to Uber vehicle collision with pedestrian
Time Event
18.30 44-year-old Rafaela Vasquez arrives for work at the Uber facilities in Tempe, Arizona.
21.14 Vasquez leaves the Tempe facilities in a self-driving 2017 Volvo XC90 operated by Uber to run an established test route through downtown Tempe.
21.39 The vehicle is switched to autonomous mode.
Unknown A report from Tempe police alleges that Vasquez began streaming The Voice on the Hulu app on a smartphone (disputed by Vasquez). During this time the Tempe police allege that Vasquez can be seen frequently looking down at the lower centre console area near her knee and frequently smirking and laughing. Her hands were not visible in the frame of the surveillance footage. Police determine she looks down 204 times over the course of 11.8 miles. Her eyes were off of the road for 6 min 47 sec during this period [i.e. over 25% of time].
21.58 (approx.)
Vasquez looks up while driving northbound on Mill Avenue toward Curry Road, approximately 0.5 seconds before the crash. She attempts to swerve left before striking 49-year-old Elaine Herzberg at 39 mph [speed zone posted at 45 mph] as she crosses the street mid-block. Hulu’s records also show the streaming of the show ended at this time.
21.59 (approx.)
Vasquez calls 911 and is released later that night after speaking to police. She stated she was monitoring the self-driving system interface and neither her business nor personal phones were in use.
Source: https://eu.azcentral.com/story/news/local/tempe/2018/06/22/fatal-uber-crash-timeline-crash-and-
investigation/725921002/; https://www.theguardian.com/technology/2018/mar/28/uber-arizona-secret-self-
driving-program-governor-doug-ducey; https://www.bbc.com/news/technology-44243118; https://www.citylab.
com/transportation/2018/03/former-uber-backup-driver-we-saw-this-coming/556427/ and https://www.ntsb.gov/
investigations/AccidentReports/Reports/HWY18MH010-prelim.pdf
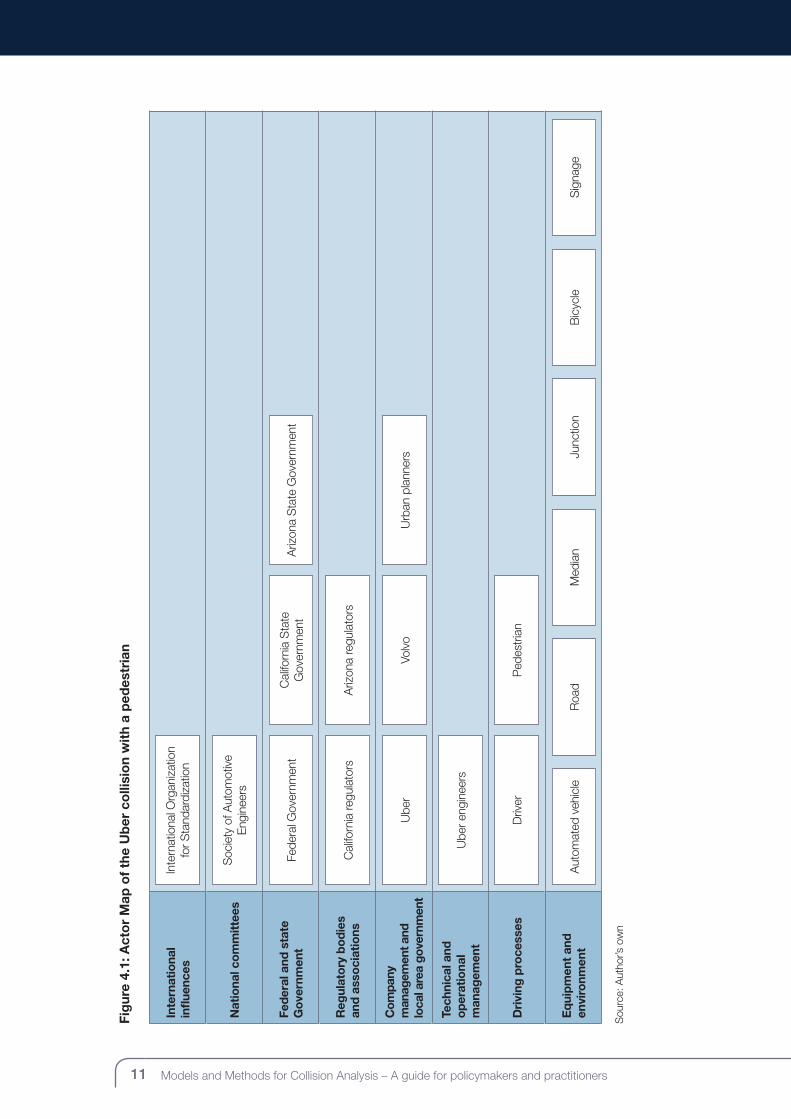
The AcciMap process begins with an Actor Map to identify the main parties that are
potentially involved in influencing the collision, as shown in Figure 4.1. The Actor Map in
Figure 4.1 shows eight levels of the system, from ‘equipment and environment’ at the
lowest level up to ‘international influences’, the highest level. The next step is to identify the
contribution (or lack of contribution) of each actor that influenced the events leading up to
the collision, as shown in the AcciMap in Figure 4.2.
11 Models and Methods for Collision Analysis – A guide for policymakers and practitioners 12www.racfoundation.org
Fig
ure
4.1:
Act
or
Map
of
the
Ub
er c
olli
sio
n w
ith
a p
edes
tria
n
Sou
rce:
Aut
hor’s
ow
n
Inte
rnat
iona
l in
flue
nces
Nat
iona
l co
mm
ittee
s
Fed
eral
and
sta
te
Go
vern
men
t
Reg
ulat
ory
bo
die
s an
d a
sso
ciat
ions
Com
pany
m
anag
emen
t and
lo
cal a
rea
gove
rnm
ent
Tech
nica
l and
o
per
atio
nal
man
agem
ent
Dri
ving
pro
cess
es
Eq
uip
men
t an
d
envi
ronm
ent
Inte
rnat
iona
l Org
aniz
atio
n fo
r Sta
ndar
diza
tion
Soc
iety
of A
utom
otiv
e En
gine
ers
Fede
ral G
over
nmen
t
Ube
r
Ube
r eng
inee
rs
Cal
iforn
ia re
gula
tors
Driv
er
Aut
omat
ed v
ehic
leJu
nctio
nR
oad
Bic
ycle
Med
ian
Sig
nage
Cal
iforn
ia S
tate
G
over
nmen
t
Volv
o
Ariz
ona
regu
lato
rs
Ped
estr
ian
Ariz
ona
Sta
te G
over
nmen
t
Urb
an p
lann
ers
11 Models and Methods for Collision Analysis – A guide for policymakers and practitioners 12www.racfoundation.org
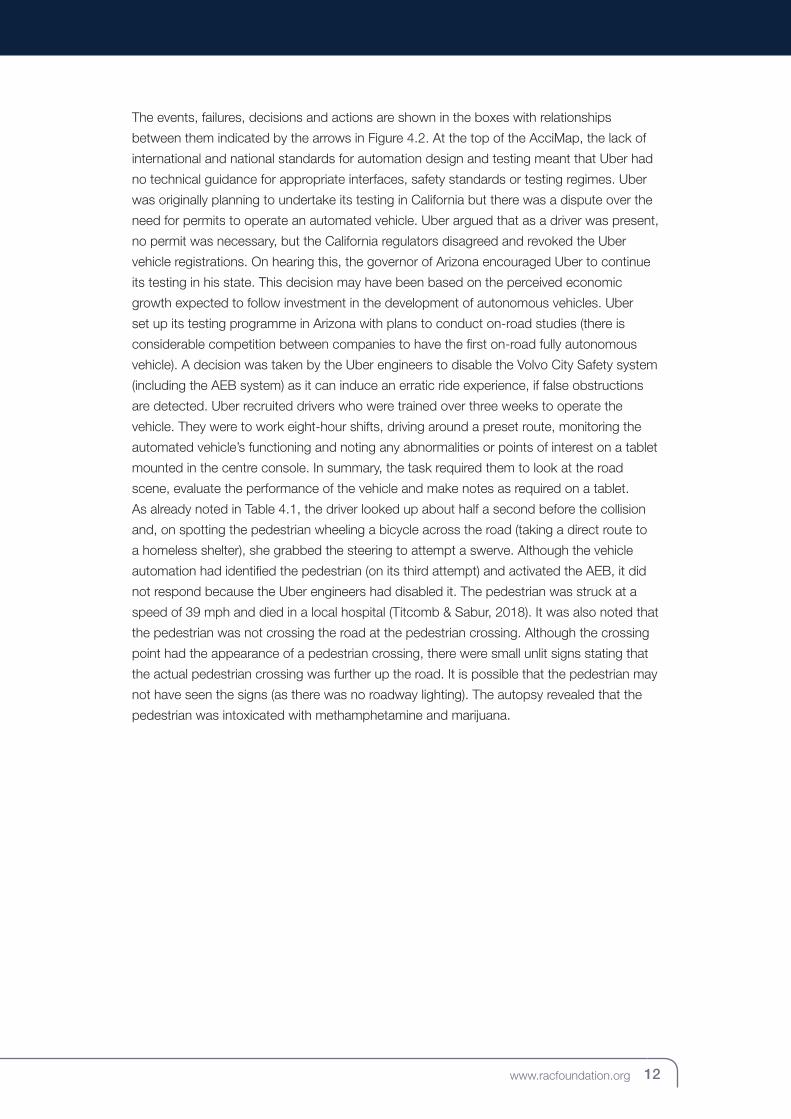
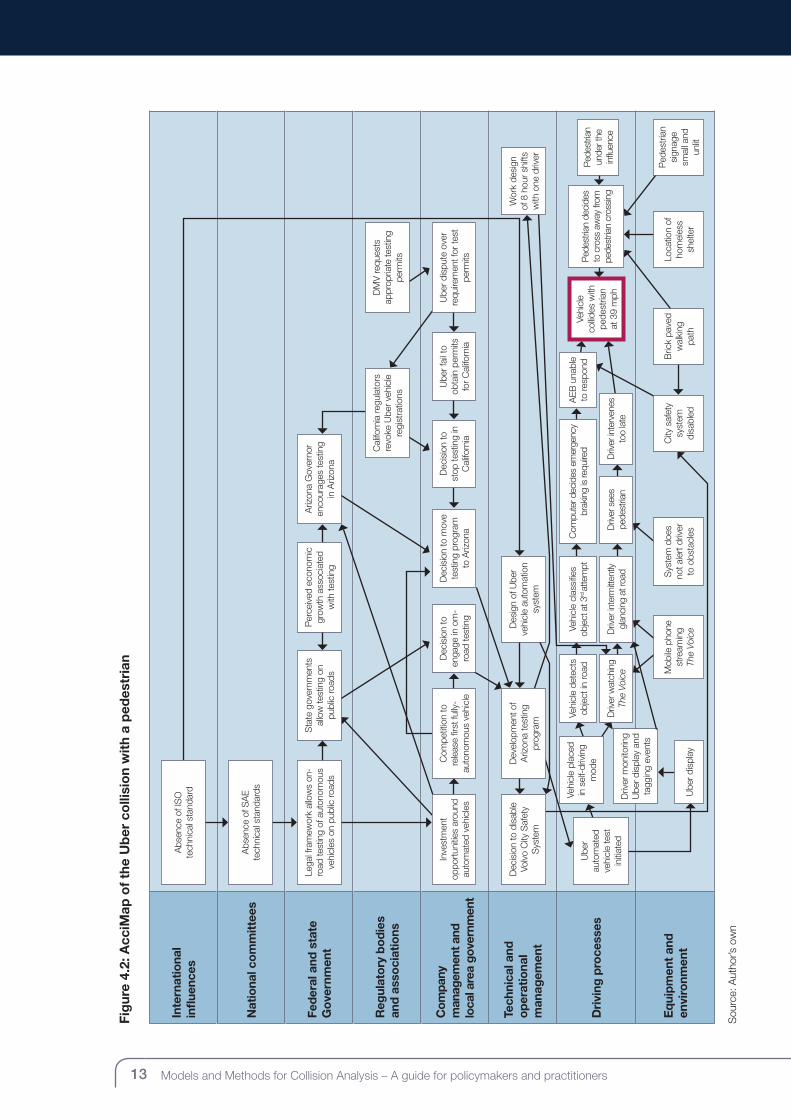
The events, failures, decisions and actions are shown in the boxes with relationships
between them indicated by the arrows in Figure 4.2. At the top of the AcciMap, the lack of
international and national standards for automation design and testing meant that Uber had
no technical guidance for appropriate interfaces, safety standards or testing regimes. Uber
was originally planning to undertake its testing in California but there was a dispute over the
need for permits to operate an automated vehicle. Uber argued that as a driver was present,
no permit was necessary, but the California regulators disagreed and revoked the Uber
vehicle registrations. On hearing this, the governor of Arizona encouraged Uber to continue
its testing in his state. This decision may have been based on the perceived economic
growth expected to follow investment in the development of autonomous vehicles. Uber
set up its testing programme in Arizona with plans to conduct on-road studies (there is
considerable competition between companies to have the first on-road fully autonomous
vehicle). A decision was taken by the Uber engineers to disable the Volvo City Safety system
(including the AEB system) as it can induce an erratic ride experience, if false obstructions
are detected. Uber recruited drivers who were trained over three weeks to operate the
vehicle. They were to work eight-hour shifts, driving around a preset route, monitoring the
automated vehicle’s functioning and noting any abnormalities or points of interest on a tablet
mounted in the centre console. In summary, the task required them to look at the road
scene, evaluate the performance of the vehicle and make notes as required on a tablet.
As already noted in Table 4.1, the driver looked up about half a second before the collision
and, on spotting the pedestrian wheeling a bicycle across the road (taking a direct route to
a homeless shelter), she grabbed the steering to attempt a swerve. Although the vehicle
automation had identified the pedestrian (on its third attempt) and activated the AEB, it did
not respond because the Uber engineers had disabled it. The pedestrian was struck at a
speed of 39 mph and died in a local hospital (Titcomb & Sabur, 2018). It was also noted that
the pedestrian was not crossing the road at the pedestrian crossing. Although the crossing
point had the appearance of a pedestrian crossing, there were small unlit signs stating that
the actual pedestrian crossing was further up the road. It is possible that the pedestrian may
not have seen the signs (as there was no roadway lighting). The autopsy revealed that the
pedestrian was intoxicated with methamphetamine and marijuana.
13 Models and Methods for Collision Analysis – A guide for policymakers and practitioners 14www.racfoundation.org
Fig
ure
4.2:
Acc
iMap
of
the
Ub
er c
olli
sio
n w
ith
a p
edes
tria
n
Sou
rce:
Aut
hor’s
ow
n
Inte
rnat
iona
l in
flue
nces
Nat
iona
l co
mm
ittee
s
Fed
eral
and
sta
te
Go
vern
men
t
Reg
ulat
ory
bo
die
s an
d a
sso
ciat
ions
Com
pany
m
anag
emen
t and
lo
cal a
rea
gove
rnm
ent
Tech
nica
l and
o
per
atio
nal
man
agem
ent
Dri
ving
pro
cess
es
Eq
uip
men
t an
d
envi
ronm
ent
Vehi
cle
collid
es w
ith
pede
stria
n at
39
mph
Driv
er m
onito
ring
Ube
r dis
play
and
ta
ggin
g ev
ents
Abs
ence
of I
SO
te
chni
cal s
tand
ard
Abs
ence
of S
AE
te
chni
cal s
tand
ards
Lega
l fra
mew
ork
allo
ws
on-
road
test
ing
of a
uton
omou
s ve
hicl
es o
n pu
blic
road
s
Sta
te g
over
nmen
ts
allo
w te
stin
g on
pu
blic
road
s
Per
ceiv
ed e
cono
mic
gr
owth
ass
ocia
ted
with
test
ing
Ariz
ona
Gov
erno
r en
cour
ages
test
ing
in A
rizon
a
Cal
iforn
ia re
gula
tors
re
voke
Ube
r veh
icle
re
gist
ratio
ns
Ube
r dis
pute
ove
r re
quire
men
t for
test
pe
rmits
Inve
stm
ent
oppo
rtun
ities
aro
und
auto
mat
ed v
ehic
les
Ube
r fai
l to
obta
in p
erm
its
for C
alifo
rnia
Dec
isio
n to
st
op te
stin
g in
C
alifo
rnia
Dec
isio
n to
mov
e te
stin
g pr
ogra
m
to A
rizon
a
Dec
isio
n to
en
gage
in o
m-
road
test
ing
Com
petit
ion
to
rele
ase
first
fully
-au
tono
mou
s ve
hicl
e
DM
V re
ques
ts
appr
opria
te te
stin
g pe
rmits
Dev
elop
men
t of
Ariz
ona
test
ing
prog
ram
Des
ign
of U
ber
vehi
cle
auto
mat
ion
syst
em
Ube
r au
tom
ated
ve
hicl
e te
st
initi
ated
Ube
r dis
play
Mob
ile p
hone
st
ream
ing
The
Voic
e
Sys
tem
doe
s no
t ale
rt d
river
to
obs
tacl
es
Vehi
cle
dete
cts
obje
ct in
road
Vehi
cle
clas
sifie
s ob
ject
at 3
rd a
ttem
ptC
ompu
ter d
ecid
es e
mer
genc
y br
akin
g is
requ
ired
Driv
er w
atch
ing
The
Voic
eD
river
inte
rmitt
ently
gl
anci
ng a
t roa
dD
river
see
s pe
dest
rian
AEB
una
ble
to re
spon
dP
edes
trian
dec
ides
to
cro
ss a
way
from
pe
dest
rian
cros
sing
Ped
estri
an
unde
r the
in
fluen
ce
City
saf
ety
syst
em
disa
bled
Driv
er in
terv
enes
to
o la
te
Vehi
cle
plac
ed
in s
elf-
driv
ing
mod
e
Dec
isio
n to
dis
able
Vo
lvo
City
Saf
ety
Sys
tem
Ped
estr
ian
sign
age
smal
l and
un
lit
Bric
k pa
ved
wal
king
pa
th
Loca
tion
of
hom
eles
s sh
elte
r
Wor
k de
sign
of
8 h
our s
hifts
w
ith o
ne d
river

13 Models and Methods for Collision Analysis – A guide for policymakers and practitioners 14www.racfoundation.org
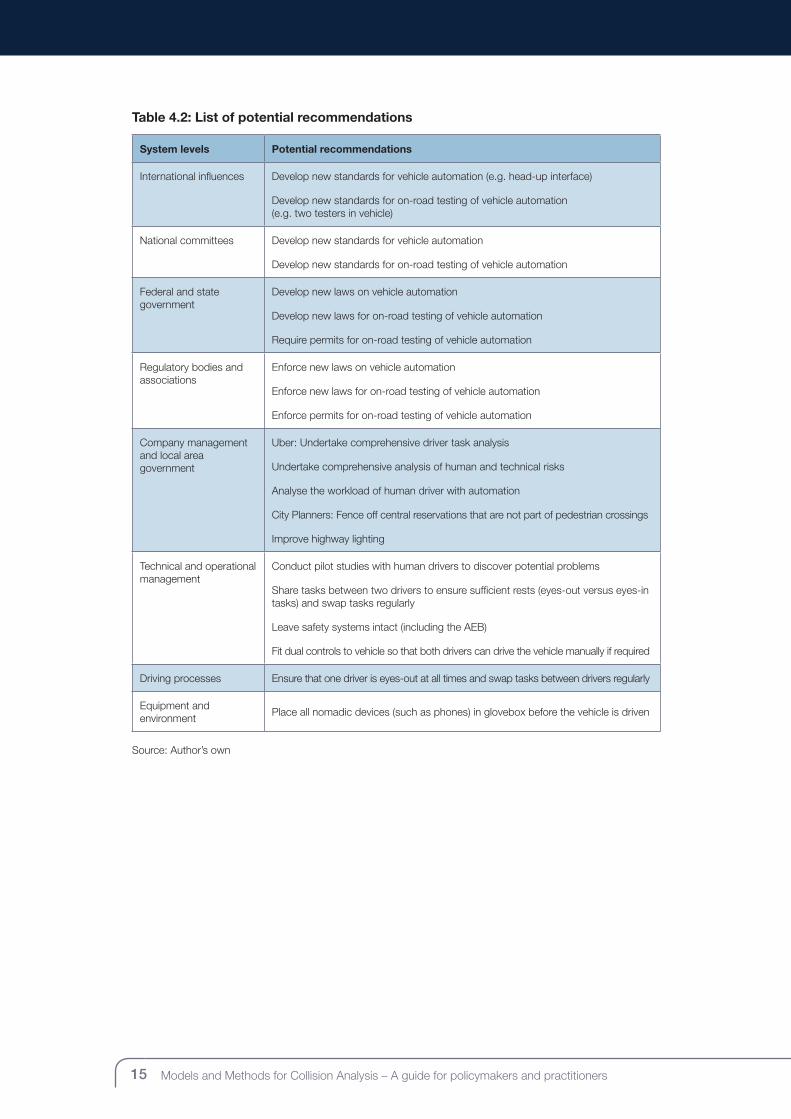
The AcciMap in Figure 4.2 shows the analysis of the collision together with the many
underlying influences that led up to the fatal event. From the collision analysis, it is possible
to develop recommendations with the aim of preventing this type of event from reoccurring.
Examples of the type of recommendations that could be developed are illustrated in
Table 4.2. At the top two levels (international influences and national committees), new
standards for vehicle automation and on-road testing are required. Governments and
regulatory bodies (the next two levels down) need to develop and enforce new laws for
vehicle automation and their on-road testing. At the next level down, the company needs
to undertake a comprehensive analysis of human and technical risks, accompanied by task
and workload analysis. At the same level, local planners should improve lighting and fence
off central reservations where there is a natural crossing point. Technical and operational
management need to better understand the demands made on drivers of automated
vehicles and share tasks accordingly. The vehicles should be fitted with dual control and
two drivers present. The inbuilt vehicle safety systems should be left intact. Finally, at the
bottom level, drivers should place all nomadic devices in the glovebox before the vehicle is
put in motion. The point here is that collisions do not result from any single point of failure;
rather they are systemic and multicausal in nature. To reduce collisions, issues need to be
addressed at all of the system levels.
The seven other case studies applying the methods to the Uber collision are contained with
Appendix B.
15 Models and Methods for Collision Analysis – A guide for policymakers and practitioners 16www.racfoundation.org
Table 4.2: List of potential recommendations
System levels Potential recommendations
International influences Develop new standards for vehicle automation (e.g. head-up interface)
Develop new standards for on-road testing of vehicle automation (e.g. two testers in vehicle)
National committees Develop new standards for vehicle automation
Develop new standards for on-road testing of vehicle automation
Federal and state government
Develop new laws on vehicle automation
Develop new laws for on-road testing of vehicle automation
Require permits for on-road testing of vehicle automation
Regulatory bodies and associations
Enforce new laws on vehicle automation
Enforce new laws for on-road testing of vehicle automation
Enforce permits for on-road testing of vehicle automation
Company management and local area government
Uber: Undertake comprehensive driver task analysis
Undertake comprehensive analysis of human and technical risks
Analyse the workload of human driver with automation
City Planners: Fence off central reservations that are not part of pedestrian crossings
Improve highway lighting
Technical and operational management
Conduct pilot studies with human drivers to discover potential problems
Share tasks between two drivers to ensure sufficient rests (eyes-out versus eyes-in tasks) and swap tasks regularly
Leave safety systems intact (including the AEB)
Fit dual controls to vehicle so that both drivers can drive the vehicle manually if required
Driving processes Ensure that one driver is eyes-out at all times and swap tasks between drivers regularly
Equipment and environment
Place all nomadic devices (such as phones) in glovebox before the vehicle is driven
Source: Author’s own
15 Models and Methods for Collision Analysis – A guide for policymakers and practitioners 16www.racfoundation.org
5. Comparison of MethodsA comparison of the methods was undertaken by three human factors experts
(see Appendix C) across a range of theoretical, methodological and practical
criteria as shown in Table 5.1 to Table 5.4.
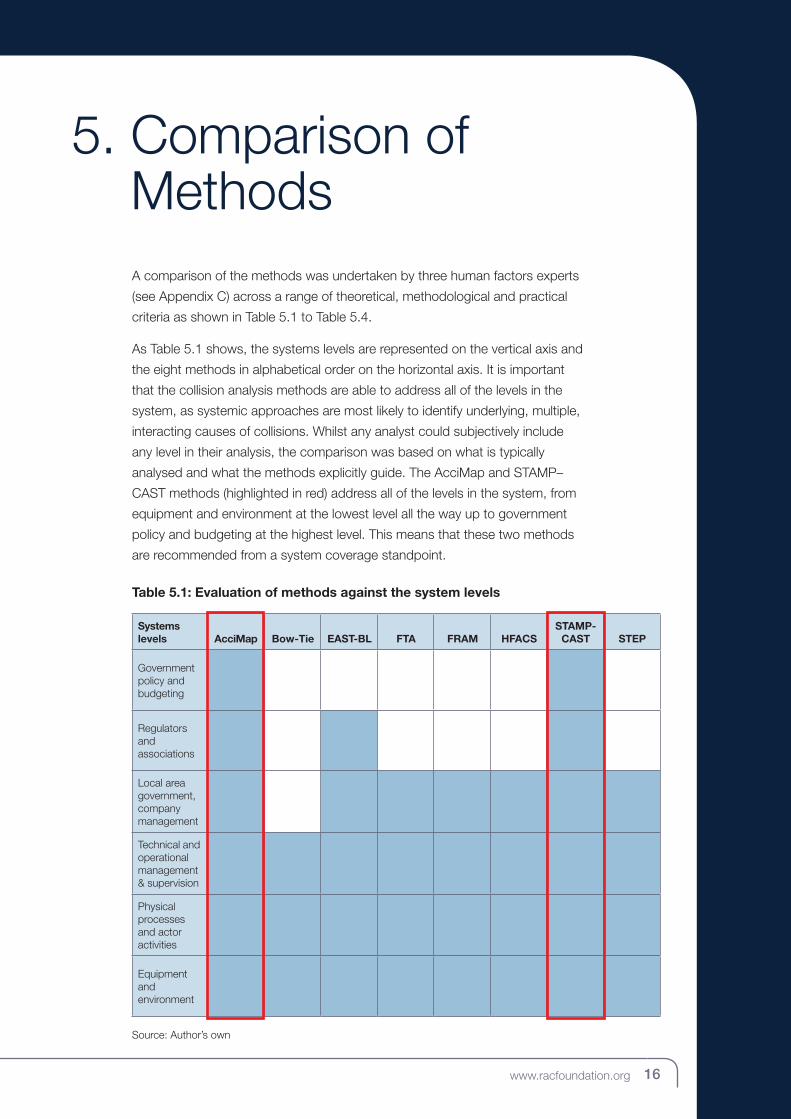
As Table 5.1 shows, the systems levels are represented on the vertical axis and
the eight methods in alphabetical order on the horizontal axis. It is important
that the collision analysis methods are able to address all of the levels in the
system, as systemic approaches are most likely to identify underlying, multiple,
interacting causes of collisions. Whilst any analyst could subjectively include
any level in their analysis, the comparison was based on what is typically
analysed and what the methods explicitly guide. The AcciMap and STAMP–
CAST methods (highlighted in red) address all of the levels in the system, from
equipment and environment at the lowest level all the way up to government
policy and budgeting at the highest level. This means that these two methods
are recommended from a system coverage standpoint.
Table 5.1: Evaluation of methods against the system levels
Systems levels AcciMap Bow-Tie EAST-BL FTA FRAM HFACS
STAMP-CAST STEP
Government policy and budgeting
Regulators and associations
Local area government, company management
Technical and operational management & supervision
Physical processes and actor activities
Equipment and environment
Source: Author’s own
17 Models and Methods for Collision Analysis – A guide for policymakers and practitioners 18www.racfoundation.org
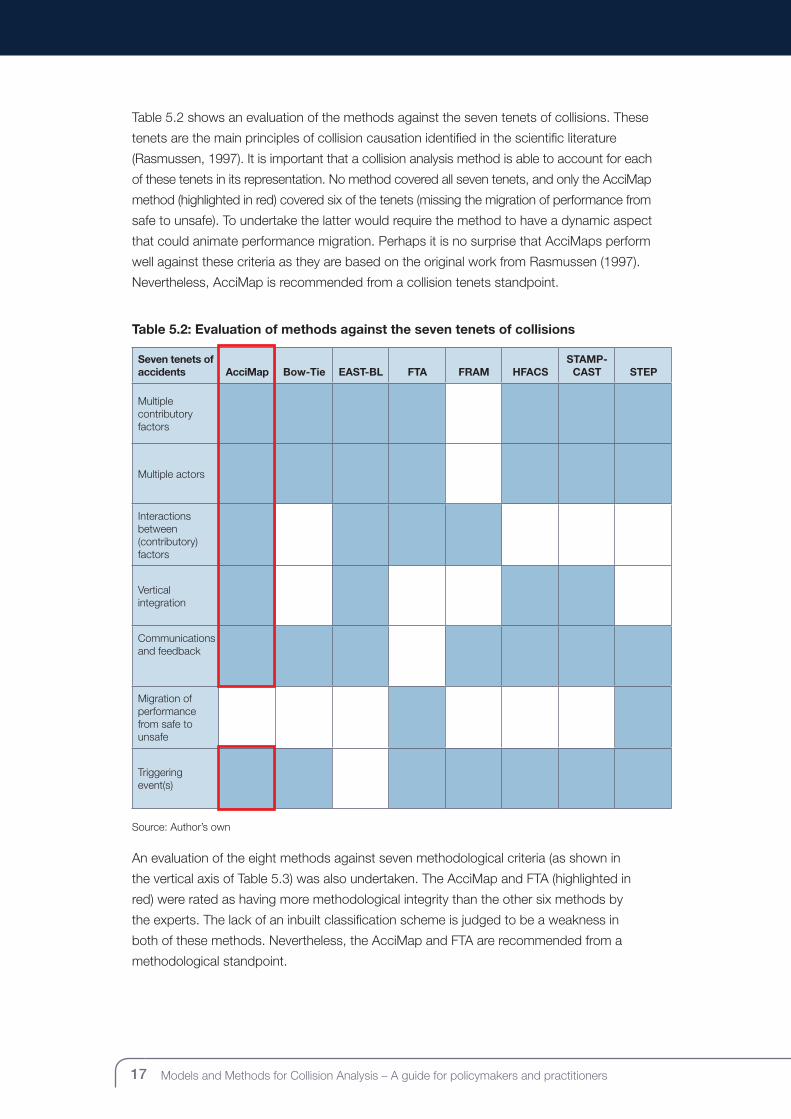
Table 5.2 shows an evaluation of the methods against the seven tenets of collisions. These
tenets are the main principles of collision causation identified in the scientific literature
(Rasmussen, 1997). It is important that a collision analysis method is able to account for each
of these tenets in its representation. No method covered all seven tenets, and only the AcciMap
method (highlighted in red) covered six of the tenets (missing the migration of performance from
safe to unsafe). To undertake the latter would require the method to have a dynamic aspect
that could animate performance migration. Perhaps it is no surprise that AcciMaps perform
well against these criteria as they are based on the original work from Rasmussen (1997).
Nevertheless, AcciMap is recommended from a collision tenets standpoint.
Table 5.2: Evaluation of methods against the seven tenets of collisions
Seven tenets of accidents AcciMap Bow-Tie EAST-BL FTA FRAM HFACS
STAMP-CAST STEP
Multiple contributory factors
Multiple actors
Interactions between (contributory) factors
Vertical integration
Communications and feedback
Migration of performance from safe to unsafe
Triggering event(s)
Source: Author’s own
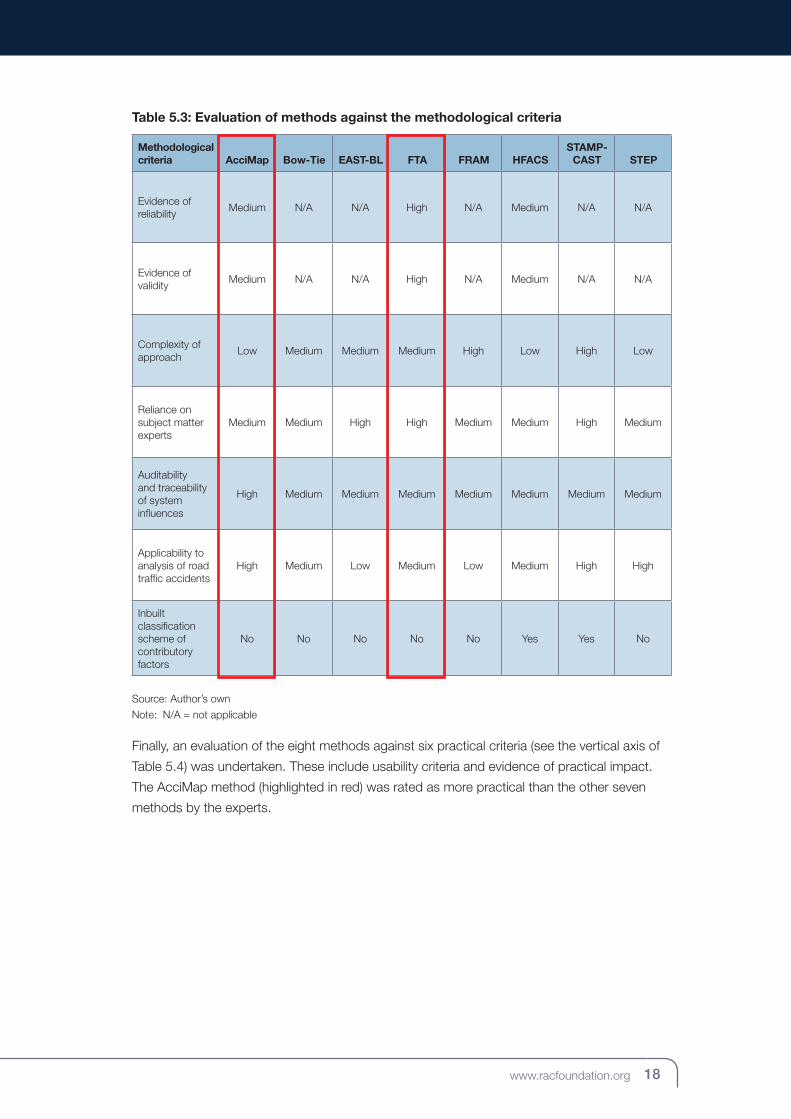
An evaluation of the eight methods against seven methodological criteria (as shown in
the vertical axis of Table 5.3) was also undertaken. The AcciMap and FTA (highlighted in
red) were rated as having more methodological integrity than the other six methods by
the experts. The lack of an inbuilt classification scheme is judged to be a weakness in
both of these methods. Nevertheless, the AcciMap and FTA are recommended from a
methodological standpoint.
17 Models and Methods for Collision Analysis – A guide for policymakers and practitioners 18www.racfoundation.org
Table 5.3: Evaluation of methods against the methodological criteria
Methodological criteria AcciMap Bow-Tie EAST-BL FTA FRAM HFACS
STAMP-CAST STEP
Evidence of reliability
Medium N/A N/A High N/A Medium N/A N/A
Evidence of validity
Medium N/A N/A High N/A Medium N/A N/A
Complexity of approach
Low Medium Medium Medium High Low High Low
Reliance on subject matter experts
Medium Medium High High Medium Medium High Medium
Auditability and traceability of system influences
High Medium Medium Medium Medium Medium Medium Medium
Applicability to analysis of road traffic accidents
High Medium Low Medium Low Medium High High
Inbuilt classification scheme of contributory factors
No No No No No Yes Yes No
Source: Author’s own
Note: N/A = not applicable
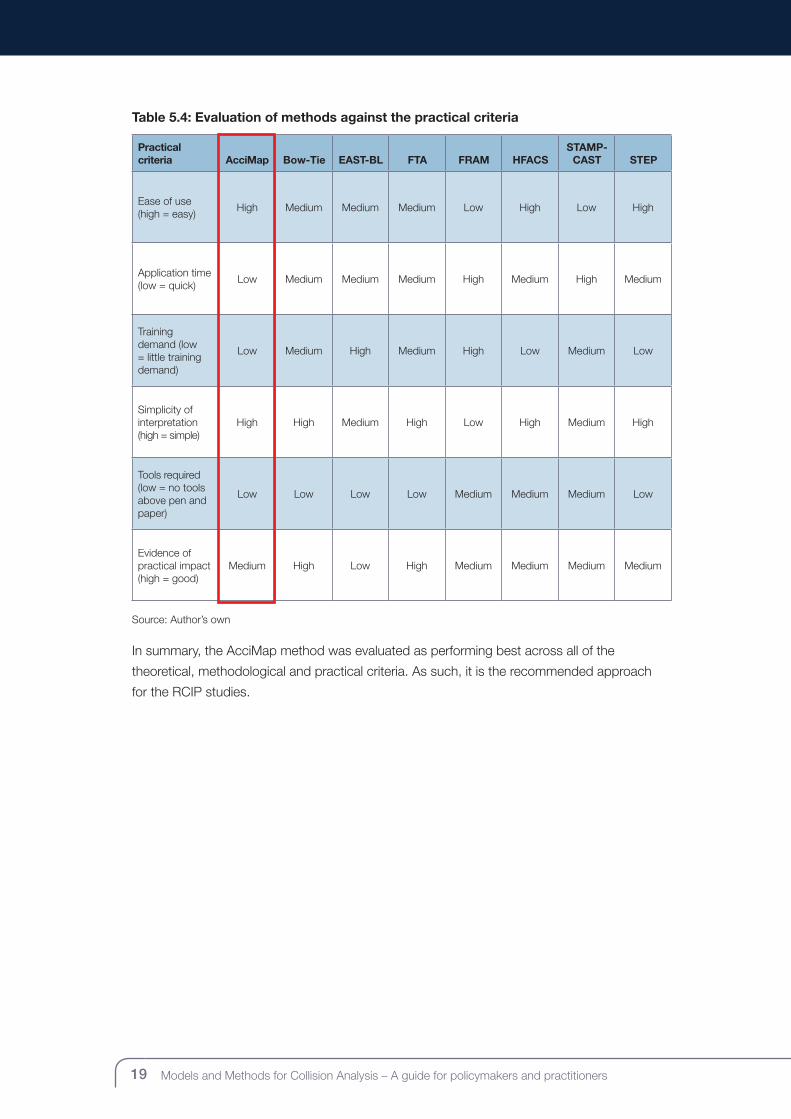
Finally, an evaluation of the eight methods against six practical criteria (see the vertical axis of
Table 5.4) was undertaken. These include usability criteria and evidence of practical impact.
The AcciMap method (highlighted in red) was rated as more practical than the other seven
methods by the experts.
19 Models and Methods for Collision Analysis – A guide for policymakers and practitioners 20www.racfoundation.org
Table 5.4: Evaluation of methods against the practical criteria
Practical criteria AcciMap Bow-Tie EAST-BL FTA FRAM HFACS
STAMP-CAST STEP
Ease of use (high = easy)
High Medium Medium Medium Low High Low High
Application time (low = quick)
Low Medium Medium Medium High Medium High Medium
Training demand (low = little training demand)
Low Medium High Medium High Low Medium Low
Simplicity of interpretation (high = simple)
High High Medium High Low High Medium High
Tools required (low = no tools above pen and paper)
Low Low Low Low Medium Medium Medium Low
Evidence of practical impact (high = good)
Medium High Low High Medium Medium Medium Medium
Source: Author’s own
In summary, the AcciMap method was evaluated as performing best across all of the
theoretical, methodological and practical criteria. As such, it is the recommended approach
for the RCIP studies.
19 Models and Methods for Collision Analysis – A guide for policymakers and practitioners 20www.racfoundation.org
6. RecommendationsThis report has sought to present a view on collision analysis methods and their
applicability to road collisions. Expert judgment has been used to compare
the eight methods selected for review, and these have been applied to a case
study, with this application presented so that their analysis and representation
can be better understood. From this analysis, the Actor Map and AcciMap
methods are recommended and next steps for the Road Collision Investigation
Project (RCIP) have been developed.
• Develop classification scheme for Actor Maps and AcciMaps
To help with the consistency of reporting and aggregation of data, classification
schemes need to be developed for the Actor Maps and AcciMaps. A recent
study has already presented an Actor Map scheme for the UK (McIlroy et al.,
2018), which would provide a good starting point.
• Matrix for linking of events in AcciMaps
To improve the usability of the AcciMap method, a matrix for associating events
at the same and different levels in the system hierarchy should be developed.
This should make it easier for analysts to construct AcciMaps.
• Development of training materials for Actor Maps and AcciMaps
A training package needs to be developed for training analysts in the
construction of Actor Maps and AcciMaps.
• Pilot study of training in Actor Maps and AcciMaps
A pilot study should be conducted with the training package so that the
materials can be evaluated and refined before delivery. This will also offer the
opportunity to conduct early studies of reliability and validity of the Actor Map
and AcciMap methods.
• Revision of training materials
The training materials will need to be revised in light of the pilot study before
final delivery.
• Rollout of training for RCIP study
The training needs to be delivered to those analysts participating in the RCIP.
Studies of the reliability and validity of the Actor Map and AcciMap methods
also need to be conducted alongside the training. Studies of adherence to the
Actor Map and AcciMap methods should be conducted at intervals across the
lifetime of the RCIP.
21 Models and Methods for Collision Analysis – A guide for policymakers and practitioners 22www.racfoundation.org
Appendix A: Description of the MethodsA description of each of the eight methods being considered in the evaluation is presented
in alphabetical order with a brief description and the accompanying model.
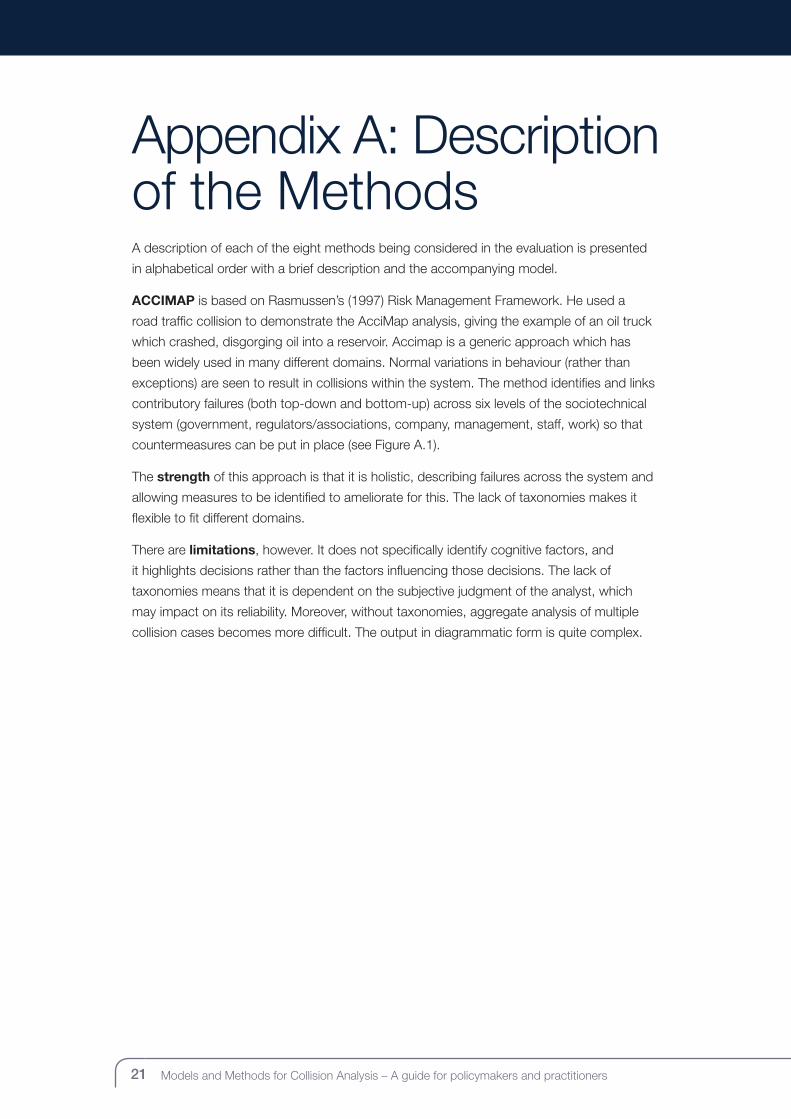
ACCIMAP is based on Rasmussen’s (1997) Risk Management Framework. He used a
road traffic collision to demonstrate the AcciMap analysis, giving the example of an oil truck
which crashed, disgorging oil into a reservoir. Accimap is a generic approach which has
been widely used in many different domains. Normal variations in behaviour (rather than
exceptions) are seen to result in collisions within the system. The method identifies and links
contributory failures (both top-down and bottom-up) across six levels of the sociotechnical
system (government, regulators/associations, company, management, staff, work) so that
countermeasures can be put in place (see Figure A.1).
The strength of this approach is that it is holistic, describing failures across the system and
allowing measures to be identified to ameliorate for this. The lack of taxonomies makes it
flexible to fit different domains.
There are limitations, however. It does not specifically identify cognitive factors, and
it highlights decisions rather than the factors influencing those decisions. The lack of
taxonomies means that it is dependent on the subjective judgment of the analyst, which
may impact on its reliability. Moreover, without taxonomies, aggregate analysis of multiple
collision cases becomes more difficult. The output in diagrammatic form is quite complex.
21 Models and Methods for Collision Analysis – A guide for policymakers and practitioners 22www.racfoundation.org
Figure A.1: The AcciMap model
Government policy and budgeting
Regulatory bodies and associations
Company management
Technical and operational
management
Physical process and
actor activities
Equipment and
surroundings
= Failures, decision, actions etc
Laws
Regulations
Plans
Action
Company policy
Government
Regulators, associations
Company
Management
Staff
Work
Hazardous process
Source: Svedung & Rasmussen (2002)
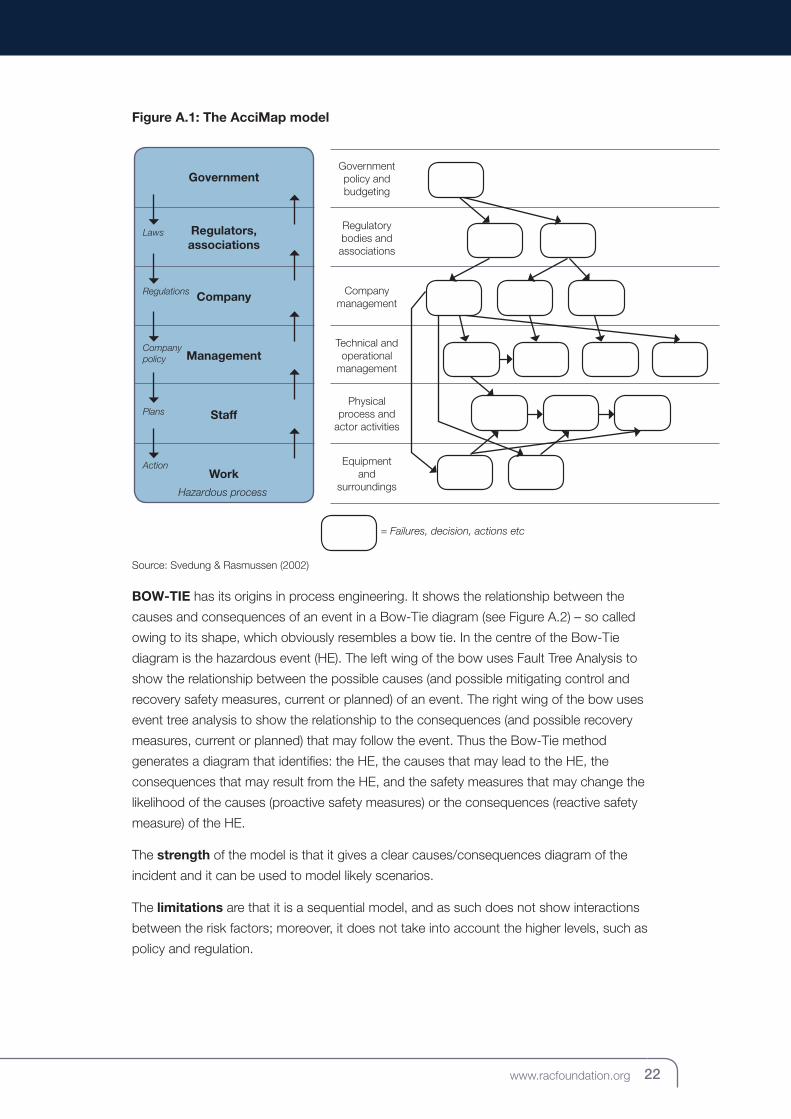
BOW-TIE has its origins in process engineering. It shows the relationship between the
causes and consequences of an event in a Bow-Tie diagram (see Figure A.2) – so called
owing to its shape, which obviously resembles a bow tie. In the centre of the Bow-Tie
diagram is the hazardous event (HE). The left wing of the bow uses Fault Tree Analysis to
show the relationship between the possible causes (and possible mitigating control and
recovery safety measures, current or planned) of an event. The right wing of the bow uses
event tree analysis to show the relationship to the consequences (and possible recovery
measures, current or planned) that may follow the event. Thus the Bow-Tie method
generates a diagram that identifies: the HE, the causes that may lead to the HE, the
consequences that may result from the HE, and the safety measures that may change the
likelihood of the causes (proactive safety measures) or the consequences (reactive safety
measure) of the HE.
The strength of the model is that it gives a clear causes/consequences diagram of the
incident and it can be used to model likely scenarios.
The limitations are that it is a sequential model, and as such does not show interactions
between the risk factors; moreover, it does not take into account the higher levels, such as
policy and regulation.
23 Models and Methods for Collision Analysis – A guide for policymakers and practitioners 24www.racfoundation.org
Figure A.2: The Bow-Tie model
Potential outcome
Potential causes
Control measures
Prevention Recovery
Recovery measures
Loss of controlConsequence
Consequence
ConsequenceThreat
Threat
Threat
Hazardous event
Source: https://slideplayer.com/slide/12655534 (slide 8)
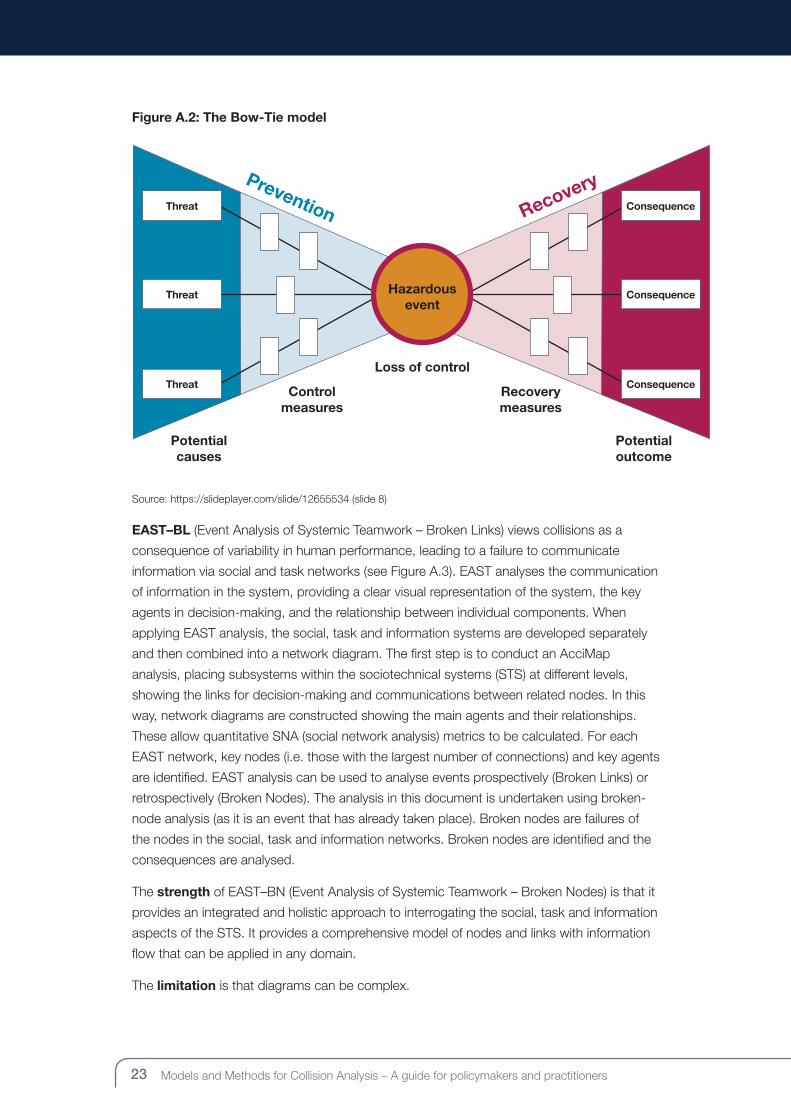
EAST–BL (Event Analysis of Systemic Teamwork – Broken Links) views collisions as a
consequence of variability in human performance, leading to a failure to communicate
information via social and task networks (see Figure A.3). EAST analyses the communication
of information in the system, providing a clear visual representation of the system, the key
agents in decision-making, and the relationship between individual components. When
applying EAST analysis, the social, task and information systems are developed separately
and then combined into a network diagram. The first step is to conduct an AcciMap
analysis, placing subsystems within the sociotechnical systems (STS) at different levels,
showing the links for decision-making and communications between related nodes. In this
way, network diagrams are constructed showing the main agents and their relationships.
These allow quantitative SNA (social network analysis) metrics to be calculated. For each
EAST network, key nodes (i.e. those with the largest number of connections) and key agents
are identified. EAST analysis can be used to analyse events prospectively (Broken Links) or
retrospectively (Broken Nodes). The analysis in this document is undertaken using broken-
node analysis (as it is an event that has already taken place). Broken nodes are failures of
the nodes in the social, task and information networks. Broken nodes are identified and the
consequences are analysed.
The strength of EAST–BN (Event Analysis of Systemic Teamwork – Broken Nodes) is that it
provides an integrated and holistic approach to interrogating the social, task and information
aspects of the STS. It provides a comprehensive model of nodes and links with information
flow that can be applied in any domain.
The limitation is that diagrams can be complex.
23 Models and Methods for Collision Analysis – A guide for policymakers and practitioners 24www.racfoundation.org
Figure A.3: The EAST model
Task Network
Social Network
Information Network
Source: Stanton et al. (2018)
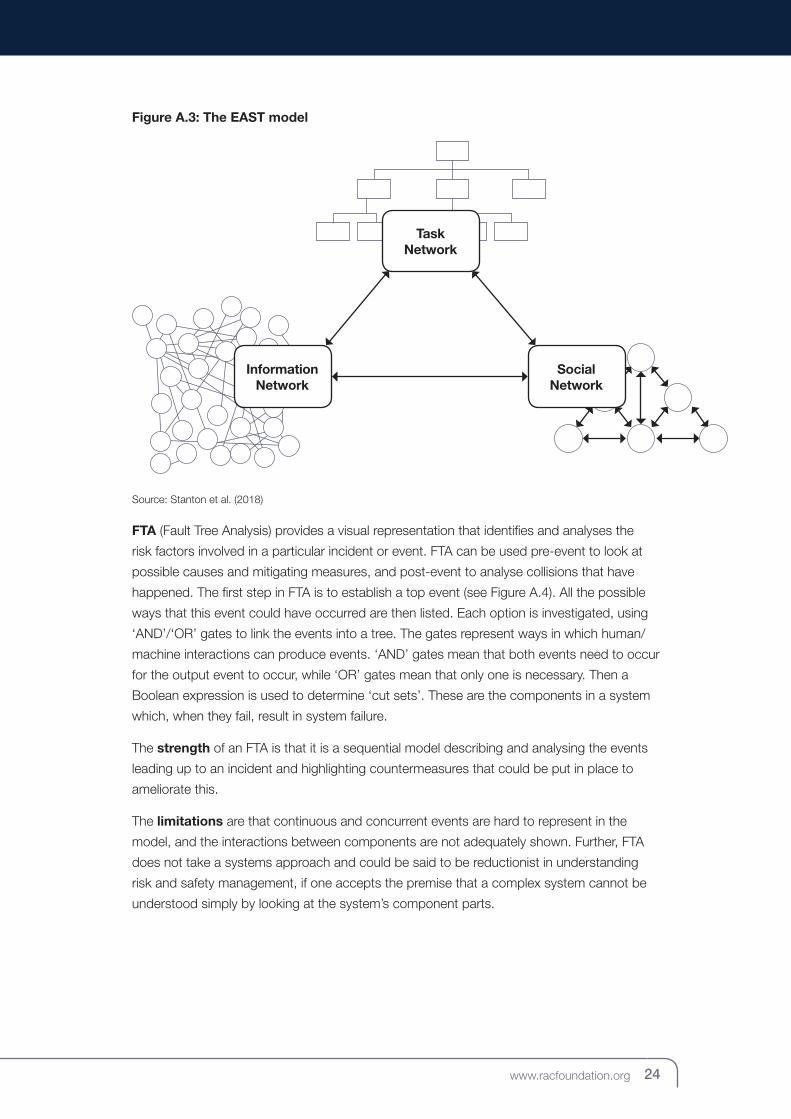
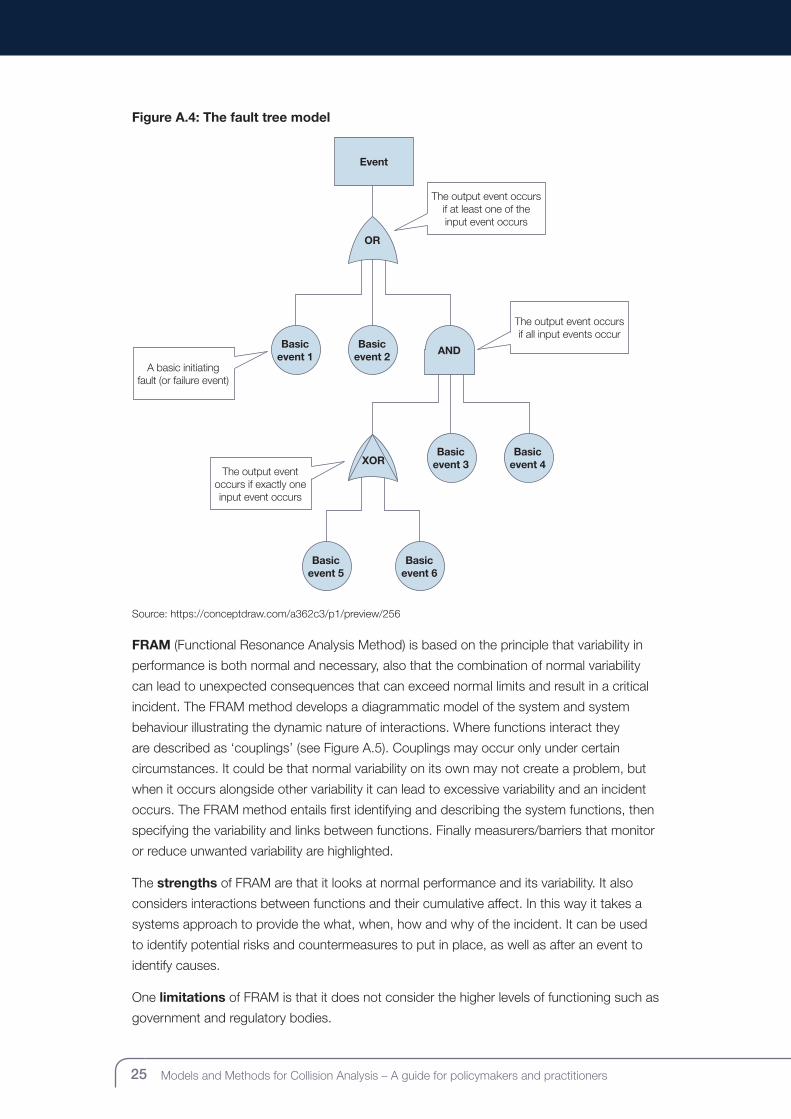
FTA (Fault Tree Analysis) provides a visual representation that identifies and analyses the
risk factors involved in a particular incident or event. FTA can be used pre-event to look at
possible causes and mitigating measures, and post-event to analyse collisions that have
happened. The first step in FTA is to establish a top event (see Figure A.4). All the possible
ways that this event could have occurred are then listed. Each option is investigated, using
‘AND’/‘OR’ gates to link the events into a tree. The gates represent ways in which human/
machine interactions can produce events. ‘AND’ gates mean that both events need to occur
for the output event to occur, while ‘OR’ gates mean that only one is necessary. Then a
Boolean expression is used to determine ‘cut sets’. These are the components in a system
which, when they fail, result in system failure.
The strength of an FTA is that it is a sequential model describing and analysing the events
leading up to an incident and highlighting countermeasures that could be put in place to
ameliorate this.
The limitations are that continuous and concurrent events are hard to represent in the
model, and the interactions between components are not adequately shown. Further, FTA
does not take a systems approach and could be said to be reductionist in understanding
risk and safety management, if one accepts the premise that a complex system cannot be
understood simply by looking at the system’s component parts.
25 Models and Methods for Collision Analysis – A guide for policymakers and practitioners 26www.racfoundation.org
Figure A.4: The fault tree model
Event
Basic event 1
Basic event 3
Basic event 5
Basic event 2
Basic event 4
Basic event 6
OR
AND
The output event occurs if exactly one input event occurs
A basic initiating fault (or failure event)
The output event occurs if at least one of the input event occurs
The output event occurs if all input events occur
XOR
Source: https://conceptdraw.com/a362c3/p1/preview/256
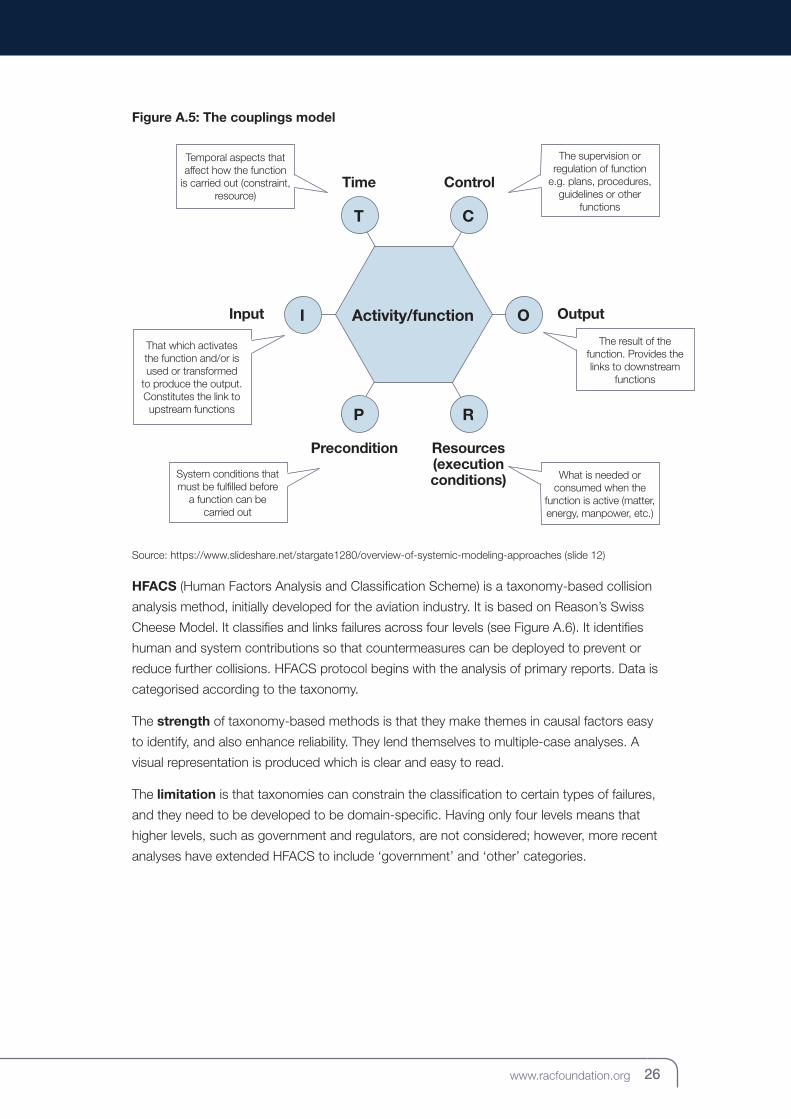
FRAM (Functional Resonance Analysis Method) is based on the principle that variability in
performance is both normal and necessary, also that the combination of normal variability
can lead to unexpected consequences that can exceed normal limits and result in a critical
incident. The FRAM method develops a diagrammatic model of the system and system
behaviour illustrating the dynamic nature of interactions. Where functions interact they
are described as ‘couplings’ (see Figure A.5). Couplings may occur only under certain
circumstances. It could be that normal variability on its own may not create a problem, but
when it occurs alongside other variability it can lead to excessive variability and an incident
occurs. The FRAM method entails first identifying and describing the system functions, then
specifying the variability and links between functions. Finally measurers/barriers that monitor
or reduce unwanted variability are highlighted.
The strengths of FRAM are that it looks at normal performance and its variability. It also
considers interactions between functions and their cumulative affect. In this way it takes a
systems approach to provide the what, when, how and why of the incident. It can be used
to identify potential risks and countermeasures to put in place, as well as after an event to
identify causes.
One limitations of FRAM is that it does not consider the higher levels of functioning such as
government and regulatory bodies.
25 Models and Methods for Collision Analysis – A guide for policymakers and practitioners 26www.racfoundation.org
Figure A.5: The couplings model
Activity/function
T
P
I O
C
R
The supervision or regulation of function
e.g. plans, procedures, guidelines or other
functions
Temporal aspects that affect how the function
is carried out (constraint, resource)
What is needed or consumed when the
function is active (matter, energy, manpower, etc.)
The result of the function. Provides the links to downstream
functions
System conditions that must be fulfilled before
a function can be carried out
That which activates the function and/or is used or transformed
to produce the output. Constitutes the link to upstream functions
Time
Precondition
Input
Control
Resources (execution conditions)
Output
Source: https://www.slideshare.net/stargate1280/overview-of-systemic-modeling-approaches (slide 12)
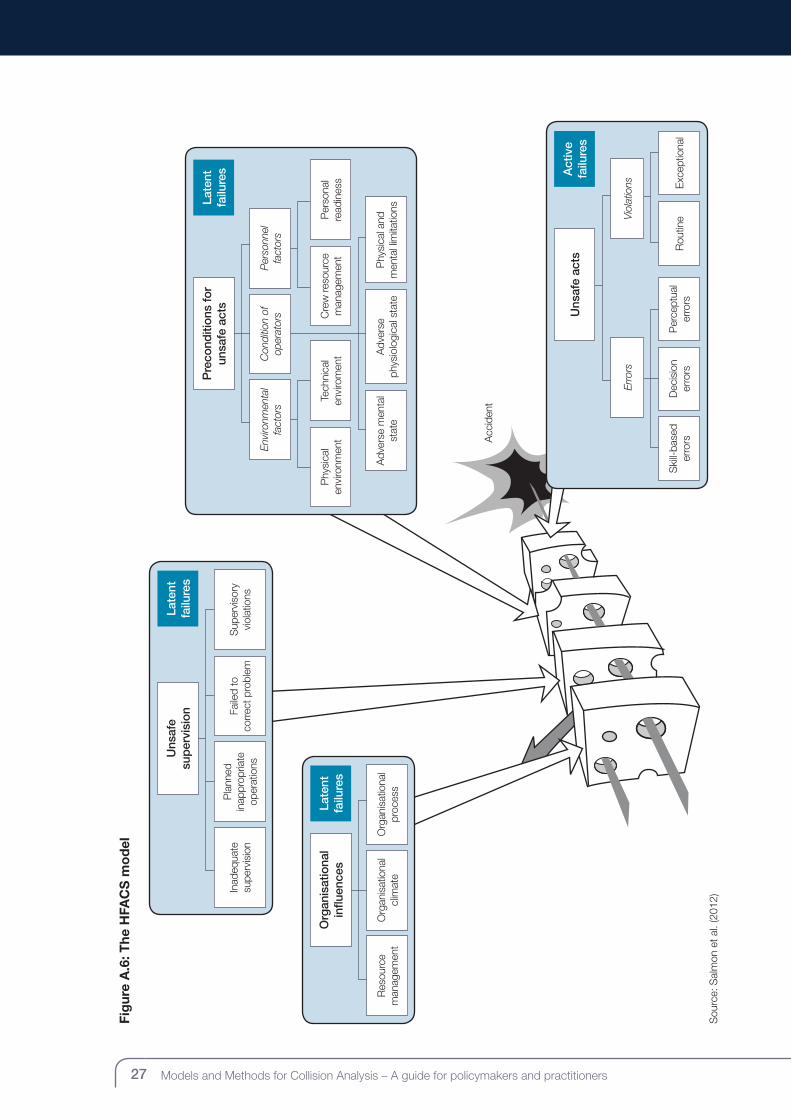
HFACS (Human Factors Analysis and Classification Scheme) is a taxonomy-based collision
analysis method, initially developed for the aviation industry. It is based on Reason’s Swiss
Cheese Model. It classifies and links failures across four levels (see Figure A.6). It identifies
human and system contributions so that countermeasures can be deployed to prevent or
reduce further collisions. HFACS protocol begins with the analysis of primary reports. Data is
categorised according to the taxonomy.
The strength of taxonomy-based methods is that they make themes in causal factors easy
to identify, and also enhance reliability. They lend themselves to multiple-case analyses. A
visual representation is produced which is clear and easy to read.
The limitation is that taxonomies can constrain the classification to certain types of failures,
and they need to be developed to be domain-specific. Having only four levels means that
higher levels, such as government and regulators, are not considered; however, more recent
analyses have extended HFACS to include ‘government’ and ‘other’ categories.
27 Models and Methods for Collision Analysis – A guide for policymakers and practitioners 28www.racfoundation.org
Fig
ure
A.6
: The
HFA
CS
mo
del
Sou
rce:
Sal
mon
et a
l. (2
012)
Acc
iden
t
Late
nt
failu
res
Inad
equa
te
supe
rvis
ion
Sup
ervi
sory
vi
olat
ions
Pla
nned
in
appr
opria
te
oper
atio
ns
Uns
afe
su
per
visi
on Faile
d to
co
rrec
t pro
blem
Late
nt
failu
res
Pre
cond
ition
s fo
r un
safe
act
s
Envi
ronm
enta
l fa
ctor
sP
erso
nnel
fa
ctor
sC
ondi
tion
of
oper
ator
s
Phy
sica
l en
viro
nmen
tC
rew
reso
urce
m
anag
emen
tTe
chni
cal
envi
rom
ent
Per
sona
l re
adin
ess
Adv
erse
men
tal
stat
eA
dver
se
phys
iolo
gica
l sta
teP
hysi
cal a
nd
men
tal l
imita
tions
Late
nt
failu
res
Org
anis
atio
nal
influ
ence
s
Res
ourc
e m
anag
emen
tO
rgan
isat
iona
l pr
oces
sO
rgan
isat
iona
l cl
imat
e
Act
ive
failu
res
Uns
afe
acts
Erro
rs
Ski
ll-ba
sed
erro
rs
Viol
atio
ns
Per
cept
ual
erro
rsEx
cept
iona
lD
ecis
ion
er
rors
Rou
tine
27 Models and Methods for Collision Analysis – A guide for policymakers and practitioners 28www.racfoundation.org
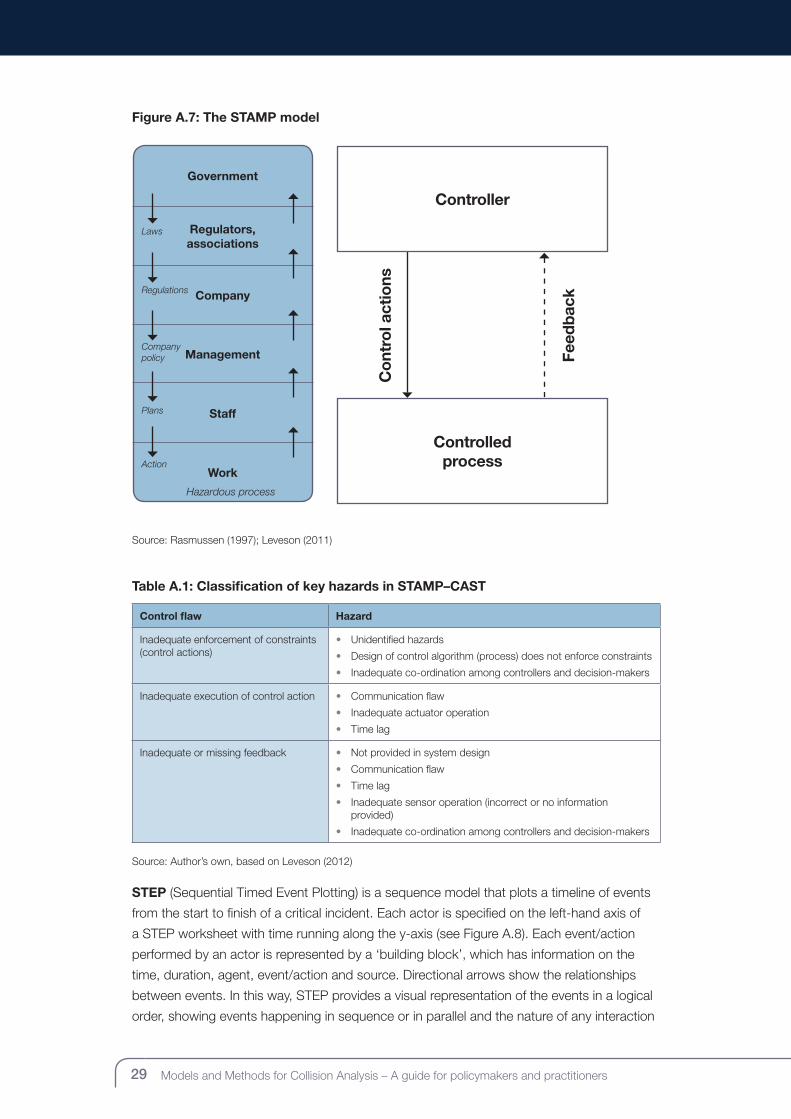
STAMP (Systems–Theoretic Accident Model and Processes) is based on Sociotechnical
Systems (STS) Theory, which is generic rather than domain-specific. It can be used for
collision analysis post-event and/or risk analysis pre-event, and provides an overview
whereby systems are seen as having hierarchical levels, each with a control structure.
Controls enforce constraints, resulting in safe behaviour. Controls and constraints operate
bottom-up and top-down between levels. Rather than incidents being viewed as the
consequence of events, they are seen as resulting from control failures (i.e. inadequate
enforcement of constraints or lacking/inaccurate constraints). The system must have an
adaptive feedback mechanism of control and information. Systems–Theoretic Accident
Model and Processes – Causal Analysis using Systems Theory (STAMP–CAST) proposes a
taxonomy of control failures using observations and scenarios as data collection methods.
It accounts for cognitive factors by considering the context for decisions and including a
‘mental model flaws’ category. The first step in carrying out a STAMP–CAST analysis is
to model levels of the STS (see Figure A.7). Next, the potential or actual collisions to be
considered, and the control flaws and hazards are identified (see Table A.1). Then a model
of the functional control structure is created, specifying potential unsafe control actions and
how they could occur. Lastly, remedies are suggested. The output consists of two stages:
the control structure and then a more detailed analysis of key personnel selected from the
control structure.
The strength of constructing a control structure diagram is that a deeper representation
of the system is developed, which provides a more comprehensive understanding than
linear models and allows modelling of future scenarios to aid collision prevention. The whole
system, including social and organisational factors, is considered, with the interactions that
lead to collisions being identified. Thus appropriate countermeasures can be specified and
put in place.
The limitations of this approach are the time taken and knowledge required to construct the
control structure diagram. Moreover, it can be more suited to technical and control failures,
with environmental factors being more challenging to fully consider, and complex human
and organisational factors being harder to place. It also assumes a hierarchical model but
relationships between the agencies and agents are not necessarily hierarchical.
29 Models and Methods for Collision Analysis – A guide for policymakers and practitioners 30www.racfoundation.org
Figure A.7: The STAMP model
Laws
Regulations
Plans
Action
Company policy
Government
Regulators, associations
Company
Management
Staff
Work
Hazardous process
Controlled process
Controller
Co
ntro
l act
ions
Feed
bac
k
Source: Rasmussen (1997); Leveson (2011)
Table A.1: Classification of key hazards in STAMP–CAST
Control flaw Hazard
Inadequate enforcement of constraints (control actions)
• Unidentified hazards
• Design of control algorithm (process) does not enforce constraints
• Inadequate co-ordination among controllers and decision-makers
Inadequate execution of control action • Communication flaw
• Inadequate actuator operation
• Time lag
Inadequate or missing feedback • Not provided in system design
• Communication flaw
• Time lag
• Inadequate sensor operation (incorrect or no information provided)
• Inadequate co-ordination among controllers and decision-makers
Source: Author’s own, based on Leveson (2012)
STEP (Sequential Timed Event Plotting) is a sequence model that plots a timeline of events
from the start to finish of a critical incident. Each actor is specified on the left-hand axis of
a STEP worksheet with time running along the y-axis (see Figure A.8). Each event/action
performed by an actor is represented by a ‘building block’, which has information on the
time, duration, agent, event/action and source. Directional arrows show the relationships
between events. In this way, STEP provides a visual representation of the events in a logical
order, showing events happening in sequence or in parallel and the nature of any interaction
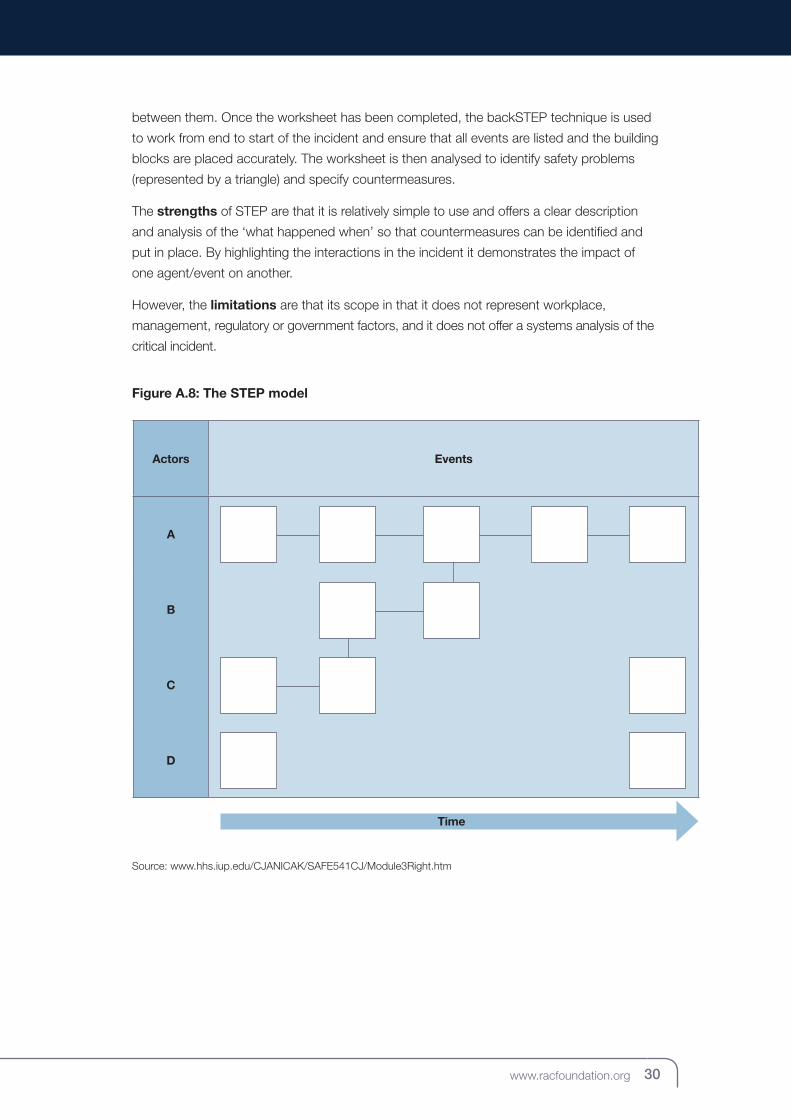
29 Models and Methods for Collision Analysis – A guide for policymakers and practitioners 30www.racfoundation.org
between them. Once the worksheet has been completed, the backSTEP technique is used
to work from end to start of the incident and ensure that all events are listed and the building
blocks are placed accurately. The worksheet is then analysed to identify safety problems
(represented by a triangle) and specify countermeasures.
The strengths of STEP are that it is relatively simple to use and offers a clear description
and analysis of the ‘what happened when’ so that countermeasures can be identified and
put in place. By highlighting the interactions in the incident it demonstrates the impact of
one agent/event on another.
However, the limitations are that its scope in that it does not represent workplace,
management, regulatory or government factors, and it does not offer a systems analysis of the
critical incident.
Figure A.8: The STEP model
Actors Events
A
B
C
D
Time
Source: www.hhs.iup.edu/CJANICAK/SAFE541CJ/Module3Right.htm
31 Models and Methods for Collision Analysis – A guide for policymakers and practitioners 32www.racfoundation.org
Appendix B: Case Studies Applying the Methods to the Uber CollisionThe further seven case studies are presented in alphabetical order of the method name
(the AcciMap analysis, recall, was presented in Chapter 4). Each is accompanied by a brief
description of the way in which the method represents the Uber collision with the pedestrian.
This analysis is based upon information that was available at the time of writing the report.
As the investigation progresses, these details may change and/or further details may come
to light. However this is unlikely to change the nature of the comparison of methods, which
was the purpose of this exercise.
BOW-TIE represents the threats on the left-hand side of Figure B.1 (i.e. the pedestrian
intoxicated with methamphetamine and marijuana, the pedestrian crossing the road at an
inappropriate point, the disablement of the Volvo City Safety system by the Uber engineers,
the unlit street, the driver scanning the road ahead only intermittently, and the driver allegedly
watching The Voice on a smartphone). The corresponding system defences are highlighted
in red after each of the threats. These defences, if activated, are supposed to prevent each
of the threats from leading to a hazard (which is represented in the circle in the centre of the
figure, i.e. failure to detect pedestrian).
None of the defences worked in this case. Potential recovery mechanisms are presented
before the consequences as they could, if activated, mitigate the outcome. In this case,
although the Uber system did eventually detect and classify the pedestrian, it was unable to
activate the AEB system because it had already been disabled by the Uber engineers. This
led to the consequences: the collision between the Uber vehicle and the pedestrian, the
suspension of the Uber testing programme, and the police considering whether the driver
should be prosecuted.
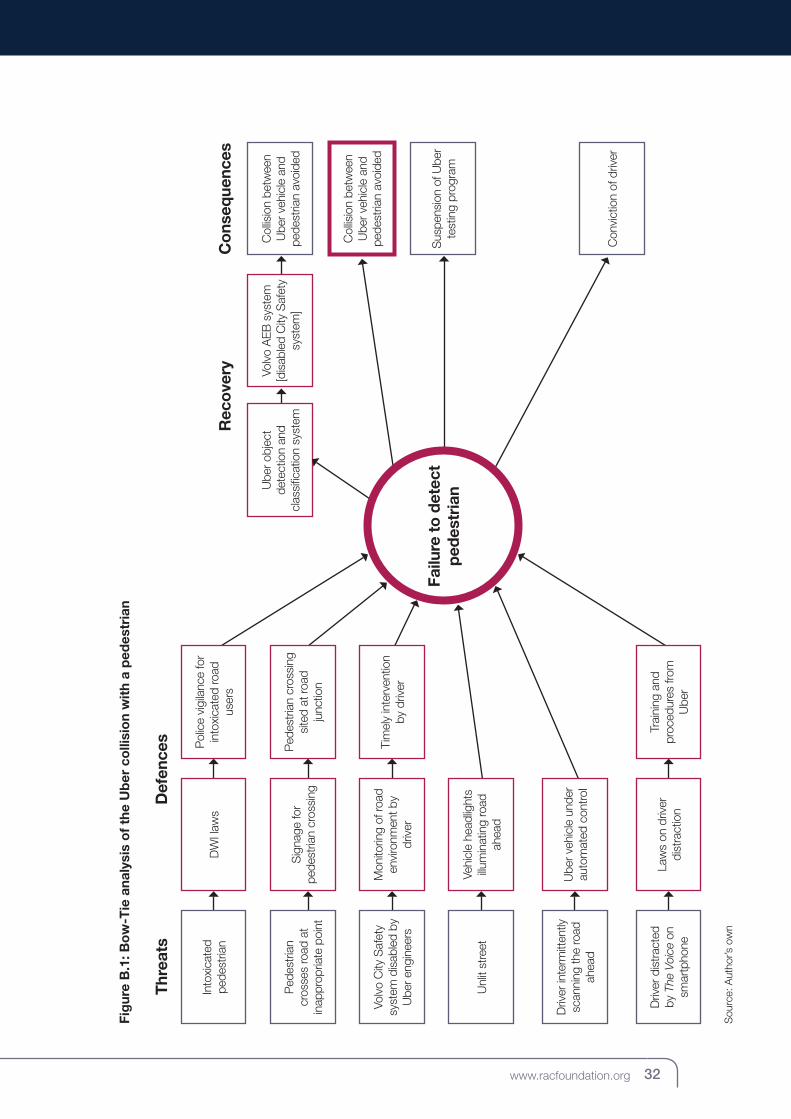
31 Models and Methods for Collision Analysis – A guide for policymakers and practitioners 32www.racfoundation.org
Fig
ure
B.1
: Bo
w-T
ie a
naly
sis
of
the
Ub
er c
olli
sio
n w
ith
a p
edes
tria
n
Sou
rce:
Aut
hor’s
ow
n
Thr
eats
Def
ence
s
Rec
ove
ryC
ons
eque
nces
Col
lisio
n be
twee
n U
ber v
ehic
le a
nd
pede
stria
n av
oide
d
Sus
pens
ion
of U
ber
test
ing
prog
ram
Con
vict
ion
of d
river
Col
lisio
n be
twee
n U
ber v
ehic
le a
nd
pede
stria
n av
oide
d
Volv
o A
EB s
yste
m
[dis
able
d C
ity S
afet
y sy
stem
]
Ube
r obj
ect
dete
ctio
n an
d cl
assi
ficat
ion
syst
em
Vehi
cle
head
light
s illu
min
atin
g ro
ad
ahea
d
Pol
ice
vigi
lanc
e fo
r in
toxi
cate
d ro
ad
user
s
Ped
estr
ian
cros
sing
si
ted
at ro
ad
junc
tion
Tim
ely
inte
rven
tion
by d
river
Trai
ning
and
pr
oced
ures
from
U
ber
Into
xica
ted
pede
stria
nD
WI l
aws
Ped
estr
ian
cros
ses
road
at
inap
prop
riate
poi
nt
Volv
o C
ity S
afet
y sy
stem
dis
able
d by
U
ber e
ngin
eers
Unl
it st
reet
Driv
er in
term
itten
tly
scan
ning
the
road
ah
ead
Driv
er d
istr
acte
d by
The
Voi
ce o
n sm
artp
hone
Sig
nage
for
pede
stria
n cr
ossi
ng
Mon
itorin
g of
road
en
viro
nmen
t by
driv
er
Law
s on
driv
er
dist
ract
ion
Ube
r veh
icle
und
er
auto
mat
ed c
ontro
l
Failu
re t
o d
etec
t p
edes
tria
n

33 Models and Methods for Collision Analysis – A guide for policymakers and practitioners 34www.racfoundation.org
EAST–BN (Event Analysis of Systemic Teamwork – Broken Nodes) represents the task
(bottom left), information (top right) and social (bottom right) networks for the Uber collision
analysis in Figure B.2. (Recall that the BN – ‘Broken Nodes’ – version of this method is used
to analyse retrospectively.) The broken nodes are represented by the red dashes in the three
networks. A broken node is one that is performing suboptimally. There were 9/16 broken
nodes in the task network, 8/26 broken nodes in the information network and 5/19 broken
nodes in the social network.
For example, in the social network Figure B.2a, the pedestrian did not obey the no-crossing
sign, but the no-crossing sign was small and unlit. Similarly, the vehicle did not brake for the
pedestrian, but the AEB system had been disabled.
In the task network Figure B.2b, the pedestrian did not read the sign and find a safe place
to cross, nor check the road for traffic. The vehicle did not monitor the driver’s alertness, nor
provide them with warnings when the need to take manual control arose. Similarly, the driver
did not monitor the driving environment or behaviour of the vehicle adequately, nor did they
take over manual control before the collision was unavoidable.
In the information network Figure B.2c, the pedestrian did not use the information from the
signage to cross further up the road. The Uber vehicle automation system had problems
in classifying the pedestrian, first classifying it as unknown, then as a car and finally as a
bicycle. With the obstacle detected, it could not evoke the AEB as it had been disabled.
Finally, it has been alleged that the driver was attending to The Voice rather than the road
environment, which led to a very late detection of the pedestrian.
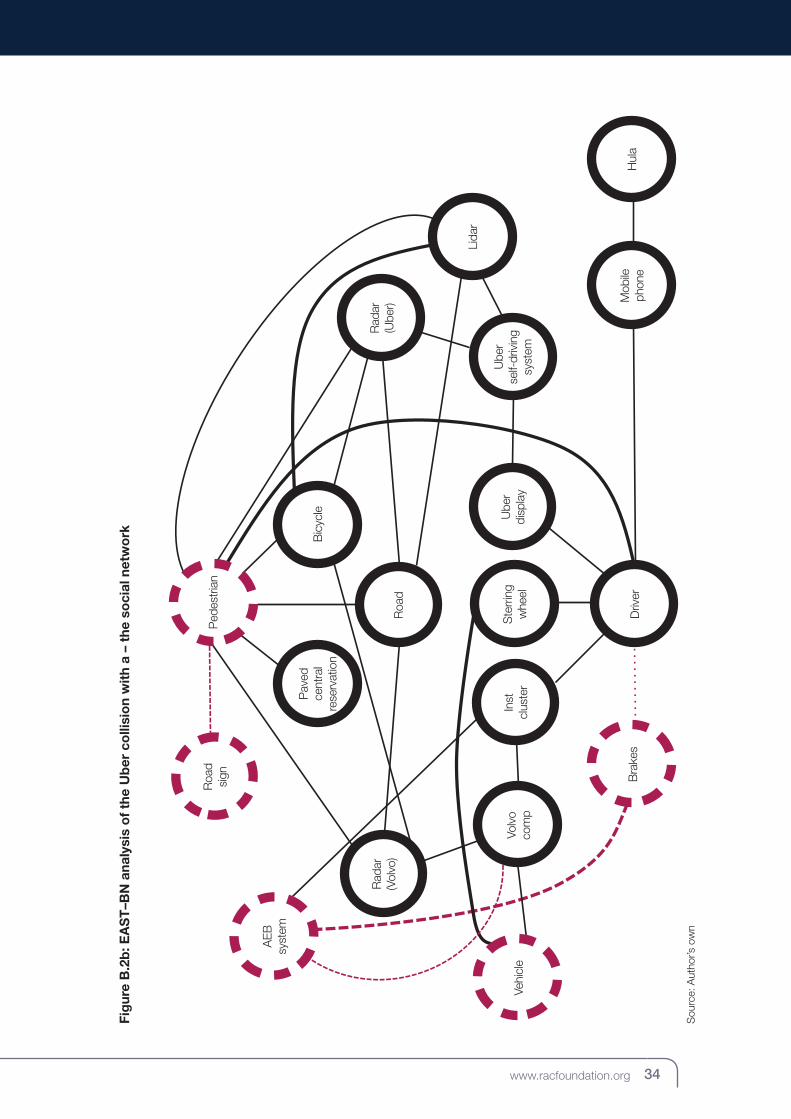
33 Models and Methods for Collision Analysis – A guide for policymakers and practitioners 34www.racfoundation.org
Fig
ure
B.2
b: E
AS
T–B
N a
naly
sis
of
the
Ub
er c
olli
sio
n w
ith
a –
the
soci
al n
etw
ork
Sou
rce:
Aut
hor’s
ow
n
Mob
ile
phon
eD
river
Bra
kes
Hul
a
Lida
r
Rad
ar
(Ube
r)
Ube
r se
lf-dr
ivin
g sy
stem
Ube
r di
spla
yS
terr
ing
whe
elIn
st
clus
ter
Volv
o
com
p
Rad
ar
(Vol
vo)
Roa
d
Bic
ycle
Pav
ed
cent
ral
rese
rvat
ion
Vehi
cle
AEB
sy
stem
Roa
d
sign
Ped
estr
ian
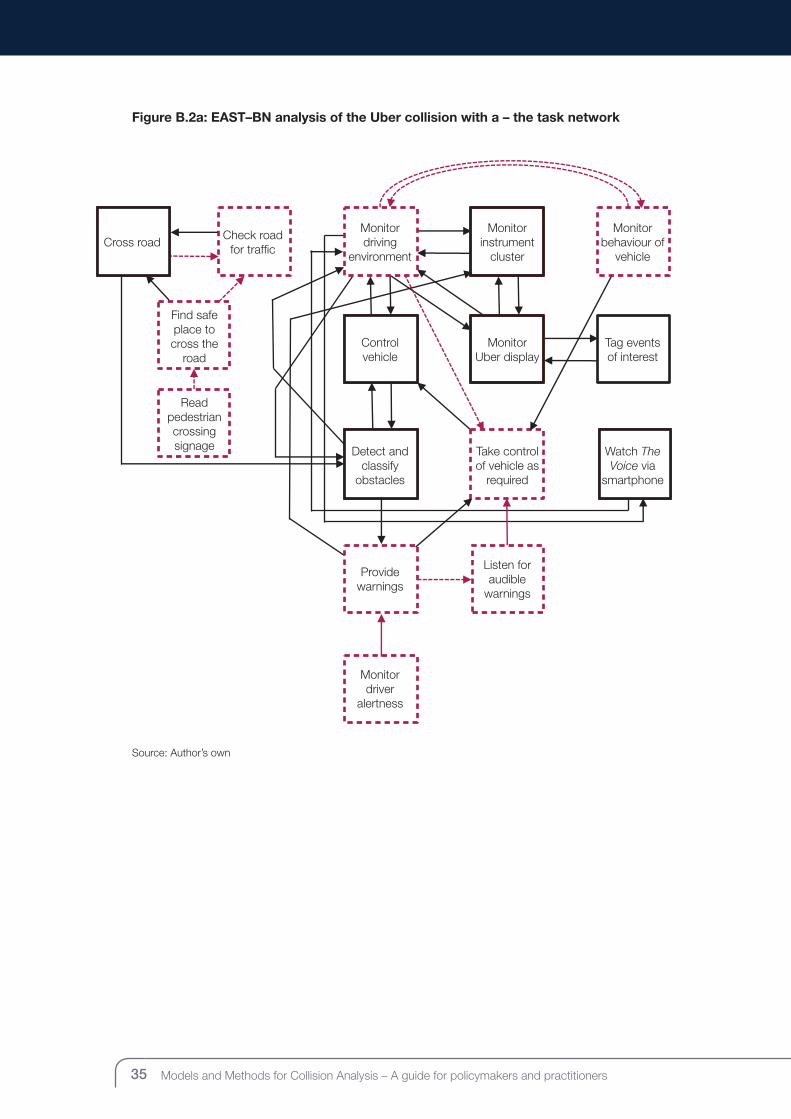
35 Models and Methods for Collision Analysis – A guide for policymakers and practitioners 36www.racfoundation.org
Figure B.2a: EAST–BN analysis of the Uber collision with a – the task network
Source: Author’s own
Cross roadCheck road
for traffic
Find safe place to cross the
roadControl vehicle
Detect and classify
obstacles
Monitor driver
alertness
Take control of vehicle as
required
Listen for audible
warnings
Watch The Voice via
smartphone
Monitor Uber display
Tag events of interest
Read pedestrian crossing signage
Monitor driving
environment
Monitor instrument
cluster
Monitor behaviour of
vehicle
Provide warnings
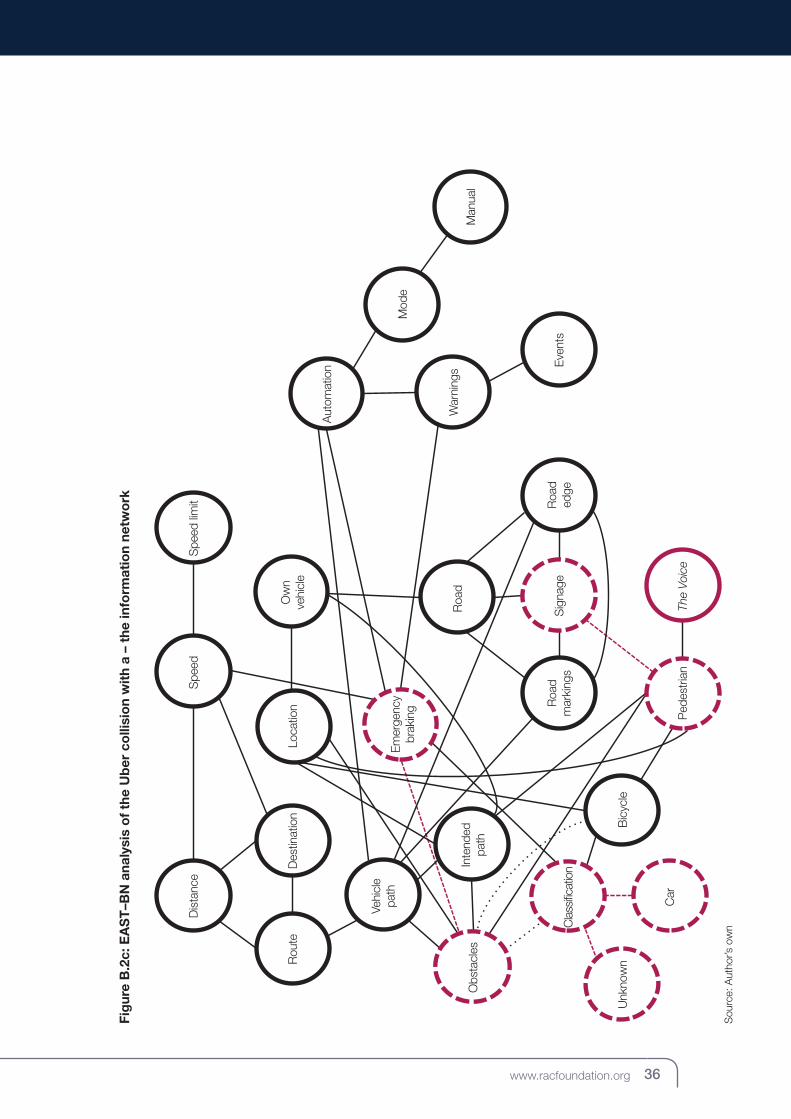
35 Models and Methods for Collision Analysis – A guide for policymakers and practitioners 36www.racfoundation.org
Fig
ure
B.2
c: E
AS
T–B
N a
naly
sis
of
the
Ub
er c
olli
sio
n w
ith
a –
the
info
rmat
ion
netw
ork
Sou
rce:
Aut
hor’s
ow
n
Emer
genc
y br
akin
g
Dis
tanc
e
Rou
te
Vehi
cle
pa
th
Obs
tacl
esIn
tend
ed
path
Roa
d
Roa
d m
arki
ngs
Ped
estr
ian
Sig
nage
The
Voic
e
Roa
d
edge
Even
ts
Aut
omat
ion
War
ning
s
Mod
e
Man
ual
Cla
ssific
atio
n
Car
Unk
now
nB
icyc
le
Des
tinat
ion
Loca
tion
Ow
n
vehi
cle
Spe
edS
peed
lim
it

37 Models and Methods for Collision Analysis – A guide for policymakers and practitioners 38www.racfoundation.org
FTA (Fault Tree Analysis) presents all of the immediate factors that led to the collision
between the Uber vehicle and the pedestrian (which is the top event in Figure B.3). As this
analysis is representing a real event, there are no ‘OR’ gates, just ‘AND’ gates.
In this case, the pedestrian chose to cross the road at an inappropriate point, which was
probably due to a combination of being under the influence of drugs, the paved central
reservation having the appearance of a pedestrian crossing, the pedestrian crossing signage
being small and unlit, and the paved area being in the desire line to the homeless shelter (the
path the pedestrian was taking). The AEB failed to activate because it had been disabled
by the Uber engineers (because they thought the Volvo City Safety system would trigger
at false obstacles and cause erratic driving of the autonomous vehicle). Finally, the driver
intervened too late to prevent the collision, which was probably due to a combination of
allegedly watching The Voice on a smartphone, being required to monitor the Uber display
on the centre console, and the absence of a warning to alert the driver to the presence of an
obstacle in the path of the vehicle. The reasons why the driver was allegedly watching The
Voice on a smartphone could be related to the design of eight-hour shifts in an automated
vehicle with repetitive work, being alone in the vehicle, and a sense of complacency about
the reliability of the automation. All of these factors combined to produce the collision.
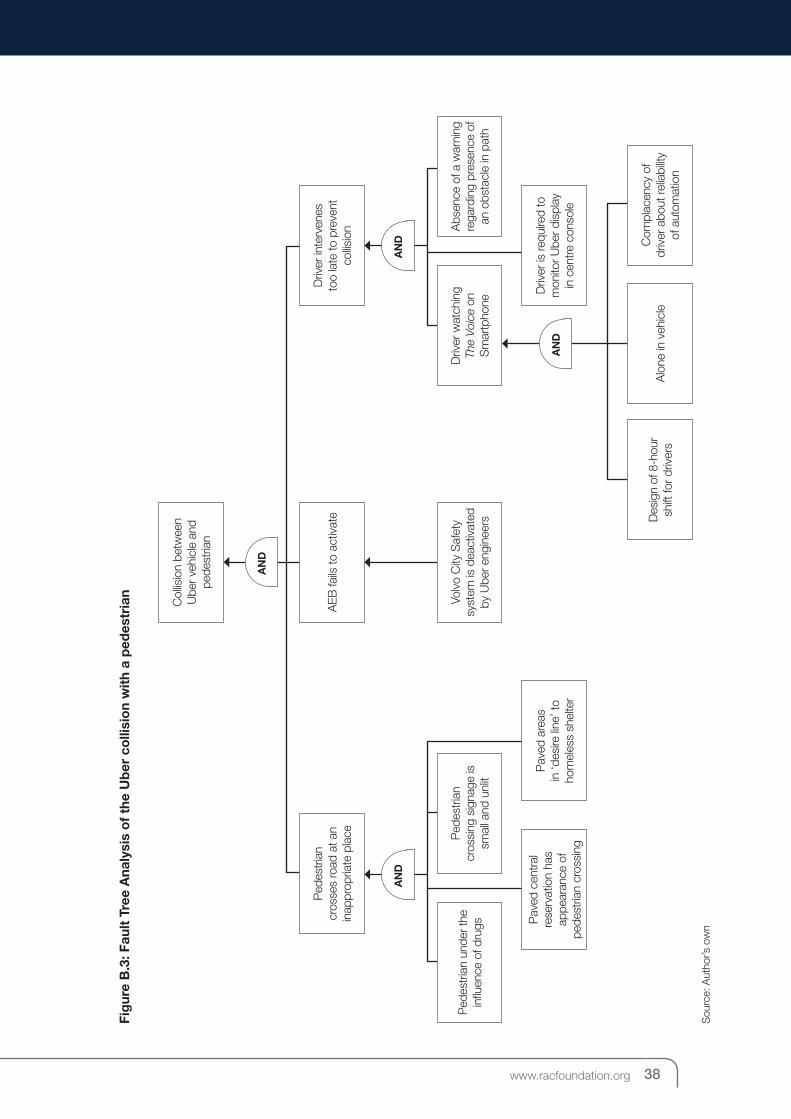
37 Models and Methods for Collision Analysis – A guide for policymakers and practitioners 38www.racfoundation.org
Fig
ure
B.3
: Fau
lt T
ree
Ana
lysi
s o
f th
e U
ber
co
llisi
on
wit
h a
ped
estr
ian
Ped
estr
ian
cr
ossi
ng s
igna
ge is
sm
all a
nd u
nlit
Pav
ed c
entr
al
rese
rvat
ion
has
appe
aran
ce o
f pe
dest
rian
cros
sing
AEB
fails
to a
ctiv
ate
Col
lisio
n be
twee
n U
ber v
ehic
le a
nd
pede
stria
n
Volv
o C
ity S
afet
y sy
stem
is d
eact
ivat
ed
by U
ber e
ngin
eers
Driv
er is
requ
ired
to
mon
itor U
ber d
ispl
ay
in c
entre
con
sole
Abs
ence
of a
war
ning
re
gard
ing
pres
ence
of
an o
bsta
cle
in p
ath
Driv
er w
atch
ing
Th
e Vo
ice
on
Sm
artp
hone
Com
plac
ency
of
driv
er a
bout
relia
bilit
y of
aut
omat
ion
Des
ign
of 8
-hou
r sh
ift fo
r driv
ers
Alo
ne in
veh
icle
Driv
er in
terv
enes
to
o la
te to
pre
vent
co
llisio
n
Ped
estr
ian
cros
ses
road
at a
n in
appr
opria
te p
lace
Pav
ed a
reas
in
‘des
ire li
ne’ t
o ho
mel
ess
shel
ter
Ped
estr
ian
unde
r the
in
fluen
ce o
f dru
gs
AN
DA
ND
AN
D
AN
D
Sou
rce:
Aut
hor’s
ow
n

39 Models and Methods for Collision Analysis – A guide for policymakers and practitioners 40www.racfoundation.org
FRAM (Functional Resonance Analysis Method) represents the function involved in
the collision between the Uber vehicle and the pedestrian. Those functions associated
with performance variability (i.e. functions can become off-nominal and abnormal) are
represented with a red outline in Figure B.4. All other functions performed normally.
The functions in the bottom left of Figure B.4 relate to the pedestrian who, apparently,
did not read the pedestrian crossing sign, find a safe place to cross or check the road for
traffic. The functions on the right-hand side of Figure B.4 relate to the Uber automation and
the driver. The Uber automation had some initial difficulty in classifying the pedestrian, but
did not warn the driver. The Uber automation was also unable to control the vehicle in an
emergency because the Uber engineers had disengaged the AEB. Finally, the driver did not
monitor the driving environment adequately nor control the vehicle before the collision.
So, as can be seen in Figure B.4, 7/13 functions did not behave in the manner expected
for safe operation of the system. In terms of FRAM, the performance variability of these
functions by the pedestrian, the Uber vehicle and the driver led to the collision.
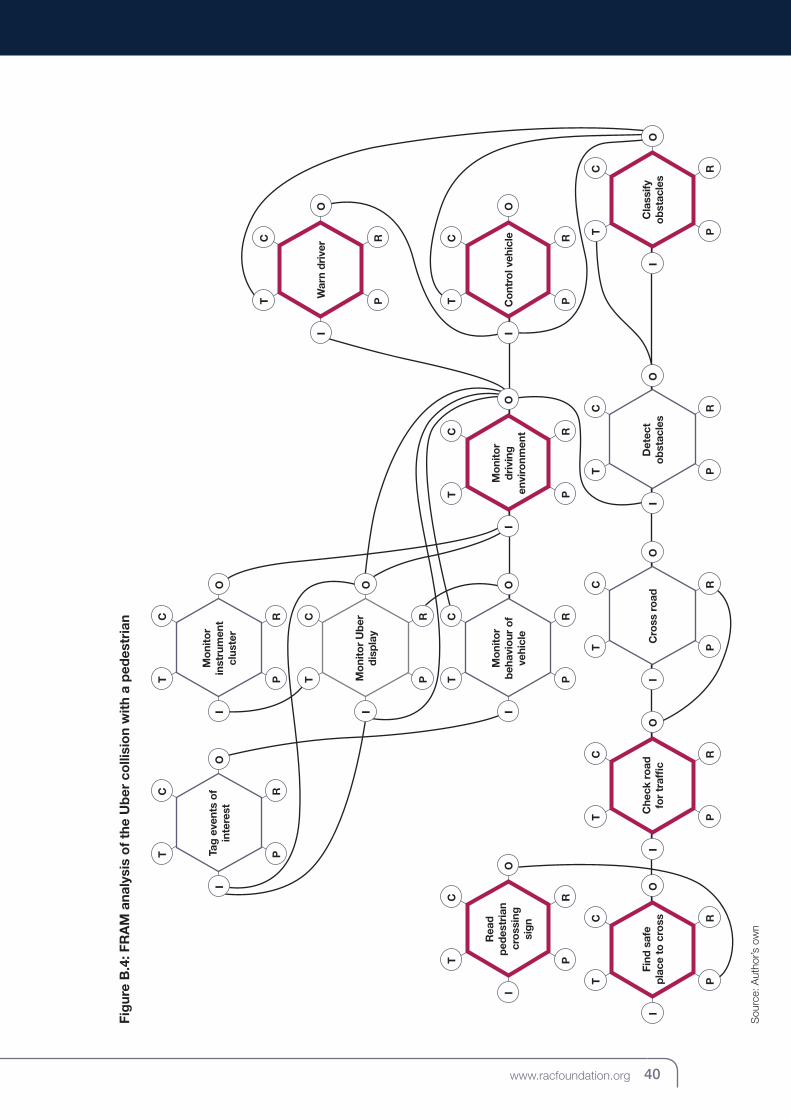
39 Models and Methods for Collision Analysis – A guide for policymakers and practitioners 40www.racfoundation.org
Fig
ure
B.4
: FR
AM
ana
lysi
s o
f th
e U
ber
co
llisi
on
wit
h a
ped
estr
ian
Sou
rce:
Aut
hor’s
ow
n
Mo
nito
r b
ehav
iour
of
vehi
cle
T P
IO
C R
Mo
nito
r U
ber
d
isp
lay
T P
IO
C R
Mo
nito
r in
stru
men
t cl
uste
r
T P
IO
C R
Tag
eve
nts
of
inte
rest
T P
IO
C R
Det
ect
o
bst
acle
s
T P
IO
C R
Cro
ss r
oad
T P
IO
C R
Mo
nito
r d
rivi
ng
envi
ronm
ent
T P
IO
C R
Co
ntro
l veh
icle
T P
IO
C R
Cla
ssify
o
bst
acle
s
T P
IO
C R
Che
ck r
oad
fo
r tr
affi
c
T P
IO
C R
Find
saf
e
pla
ce t
o c
ross
T P
IO
C R
Rea
d
ped
estr
ian
cro
ssin
g
sig
n
T P
IO
C R
War
n d
rive
r
T P
IO
C R

41 Models and Methods for Collision Analysis – A guide for policymakers and practitioners 42www.racfoundation.org
HFACS (Human Factors Analysis and Classification Scheme) is used to classify the system
failure for the Uber collision with a pedestrian in Table B.1. The four system categories are
in the left-hand column, subcategories in the middle column, and failures in the right-hand
column.
As shown in Table B.1, under ‘organisational influences’, the Uber organisation had failed
to identify risky behaviours (by the engineers and drivers) in the testing programme (such
as disabling safety systems and allegedly attending to smartphones instead of the road). A
comprehensive human and technical risk assessment is required to identify these factors.
Under ‘supervisory factors’, the prescribed tasks could be too much for one driver: monitor
the road environment for hazards, monitor the instrument cluster, monitor the Uber vehicle
for problems, monitor the Uber console for anomalies, note any issues on the Uber tablet,
and be prepared to take manual control of the vehicle in case of problems. Despite this
overtasking, there was also a failure to identify risky behaviours of drivers in the plans for
the testing programme. This analysis could have alerted Uber to the issue of the driver not
attending to the road environment.
Four ‘preconditions for unsafe acts’ were noted. For the physical environment, the paved
area in the central reservation looked like a crossing, which is probably why the no-crossing
signage was posted. Additionally, the signage was small and unlit and would be difficult
to see at night. As for the technical environment preconditions, the Uber engineers had
disabled the Volvo City Safety system and with it the AEB. The Uber automation also
had problems classifying the pedestrian. Regarding the adverse psychological state, the
pedestrian was intoxicated with methamphetamine and marijuana; and for physical/mental
limitations, the driver had many competing tasks.
Finally, the ‘unsafe acts’ comprised decision errors (the pedestrian not using the proper
pedestrian crossing), perceptual errors (driver not having appropriate awareness of the road
environment) and routine violations (driver allegedly watching The Voice on a smartphone).
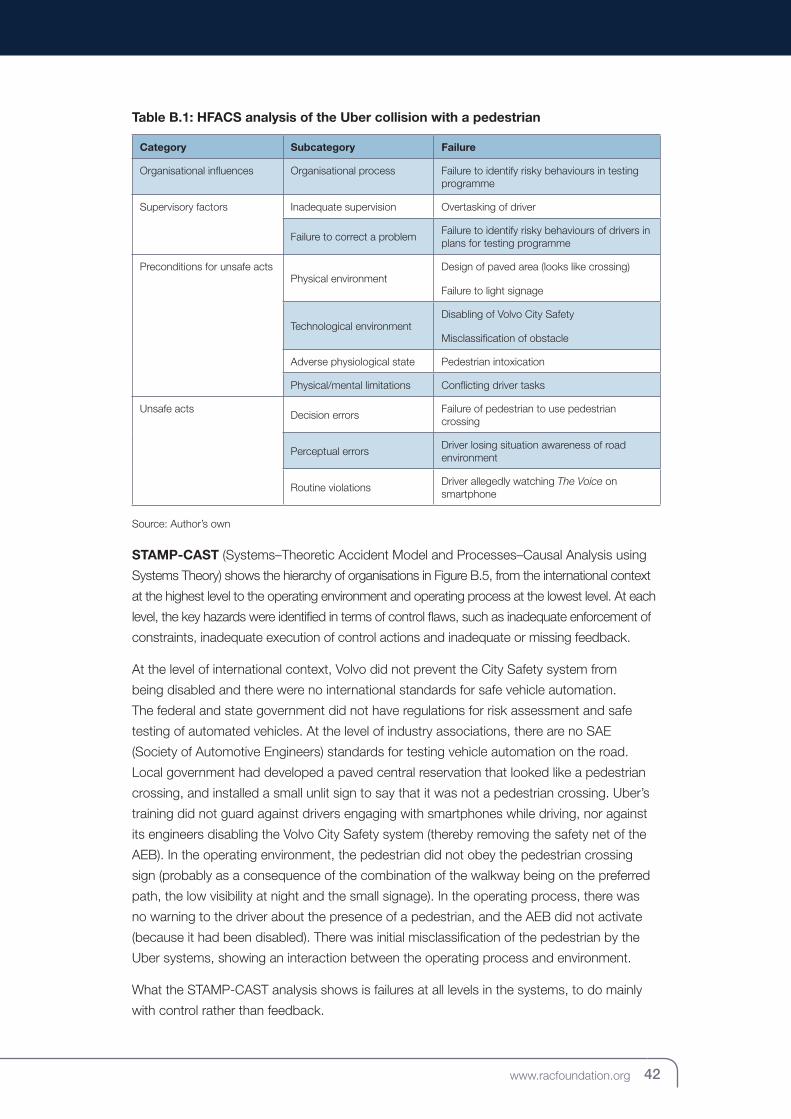
41 Models and Methods for Collision Analysis – A guide for policymakers and practitioners 42www.racfoundation.org
Table B.1: HFACS analysis of the Uber collision with a pedestrian
Category Subcategory Failure
Organisational influences Organisational process Failure to identify risky behaviours in testing programme
Supervisory factors Inadequate supervision Overtasking of driver
Failure to correct a problemFailure to identify risky behaviours of drivers in plans for testing programme
Preconditions for unsafe actsPhysical environment
Design of paved area (looks like crossing)
Failure to light signage
Technological environmentDisabling of Volvo City Safety
Misclassification of obstacle
Adverse physiological state Pedestrian intoxication
Physical/mental limitations Conflicting driver tasks
Unsafe actsDecision errors
Failure of pedestrian to use pedestrian crossing
Perceptual errorsDriver losing situation awareness of road environment
Routine violationsDriver allegedly watching The Voice on smartphone
Source: Author’s own
STAMP-CAST (Systems–Theoretic Accident Model and Processes–Causal Analysis using
Systems Theory) shows the hierarchy of organisations in Figure B.5, from the international context
at the highest level to the operating environment and operating process at the lowest level. At each
level, the key hazards were identified in terms of control flaws, such as inadequate enforcement of
constraints, inadequate execution of control actions and inadequate or missing feedback.
At the level of international context, Volvo did not prevent the City Safety system from
being disabled and there were no international standards for safe vehicle automation.
The federal and state government did not have regulations for risk assessment and safe
testing of automated vehicles. At the level of industry associations, there are no SAE
(Society of Automotive Engineers) standards for testing vehicle automation on the road.
Local government had developed a paved central reservation that looked like a pedestrian
crossing, and installed a small unlit sign to say that it was not a pedestrian crossing. Uber’s
training did not guard against drivers engaging with smartphones while driving, nor against
its engineers disabling the Volvo City Safety system (thereby removing the safety net of the
AEB). In the operating environment, the pedestrian did not obey the pedestrian crossing
sign (probably as a consequence of the combination of the walkway being on the preferred
path, the low visibility at night and the small signage). In the operating process, there was
no warning to the driver about the presence of a pedestrian, and the AEB did not activate
(because it had been disabled). There was initial misclassification of the pedestrian by the
Uber systems, showing an interaction between the operating process and environment.
What the STAMP-CAST analysis shows is failures at all levels in the systems, to do mainly
with control rather than feedback.
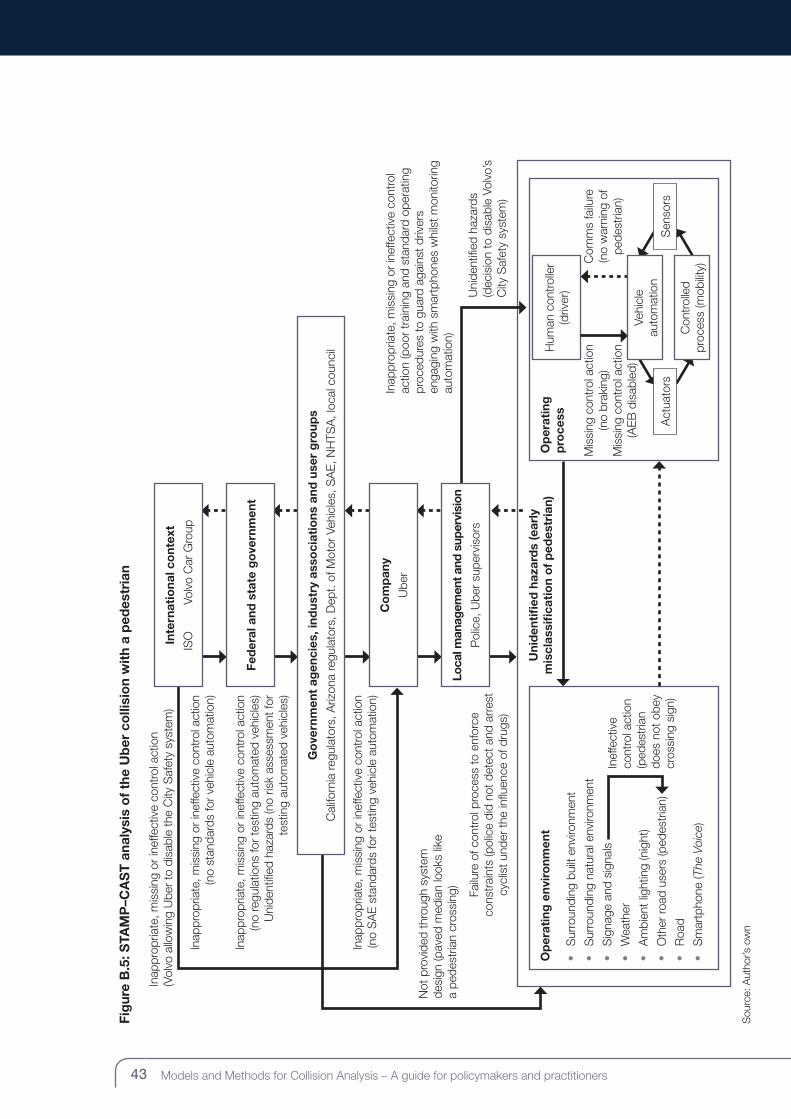
43 Models and Methods for Collision Analysis – A guide for policymakers and practitioners 44www.racfoundation.org
Fig
ure
B.5
: STA
MP
–CA
ST
ana
lysi
s o
f th
e U
ber
co
llisi
on
wit
h a
ped
estr
ian
Sou
rce:
Aut
hor’s
ow
n
Inap
prop
riate
, mis
sing
or
inef
fect
ive
cont
rol a
ctio
n (V
olvo
allo
win
g U
ber
to d
isab
le th
e C
ity S
afet
y sy
stem
)
Inap
prop
riate
, mis
sing
or
inef
fect
ive
cont
rol
actio
n (p
oor
trai
ning
and
sta
ndar
d op
erat
ing
proc
edur
es to
gua
rd a
gain
st d
river
s en
gagi
ng w
ith s
mar
tpho
nes
whi
lst m
onito
ring
auto
mat
ion)
Uni
dent
ified
haz
ards
(d
ecis
ion
to d
isab
le V
olvo
’s
City
Saf
ety
syst
em)
Inap
prop
riate
, mis
sing
or
inef
fect
ive
cont
rol a
ctio
n (n
o st
anda
rds
for
vehi
cle
auto
mat
ion)
Inap
prop
riate
, mis
sing
or
inef
fect
ive
cont
rol a
ctio
n (n
o re
gula
tions
for
test
ing
auto
mat
ed v
ehic
les)
Uni
dent
ified
haz
ards
(no
risk
asse
ssm
ent f
or
test
ing
auto
mat
ed v
ehic
les)
Inap
prop
riate
, mis
sing
or
inef
fect
ive
cont
rol a
ctio
n (n
o S
AE
sta
ndar
ds fo
r te
stin
g ve
hicl
e au
tom
atio
n)
Not
pro
vide
d th
roug
h sy
stem
de
sign
(pav
ed m
edia
n lo
oks
like
a pe
dest
rian
cros
sing
)
Failu
re o
f con
trol
pro
cess
to e
nfor
ce
cons
trai
nts
(pol
ice
did
not d
etec
t and
arr
est
cycl
ist u
nder
the
influ
ence
of d
rugs
)
Uni
den
tifi
ed h
azar
ds
(ear
ly
mis
clas
sifi
cati
on
of
ped
estr
ian)
Hum
an c
ontr
olle
r (d
river
)
Op
erat
ing
env
iro
nmen
t
• S
urro
undi
ng b
uilt
envi
ronm
ent
• S
urro
undi
ng n
atur
al e
nviro
nmen
t
• S
igna
ge a
nd s
igna
ls
• W
eath
er
• A
mbi
ent l
ight
ing
(nig
ht)
• O
ther
road
use
rs (p
edes
tria
n)
• R
oad
• S
mar
tpho
ne (T
he V
oice
)
Op
erat
ing
p
roce
ss
Inef
fect
ive
cont
rol a
ctio
n (p
edes
tria
n do
es n
ot o
bey
cros
sing
sig
n)
Mis
sing
con
trol
act
ion
(no
brak
ing)
Mis
sing
con
trol
act
ion
(AE
B d
isab
led)
Com
ms
failu
re
(no
war
ning
of
pede
stria
n)
Inte
rnat
iona
l co
ntex
t
ISO
Vol
vo C
ar G
roup
Co
mp
any
Ube
r
Loca
l man
agem
ent a
nd s
uper
visi
on
Pol
ice,
Ube
r su
perv
isor
s
Go
vern
men
t ag
enci
es, i
ndus
try
asso
ciat
ions
and
use
r g
roup
s
Cal
iforn
ia re
gula
tors
, Ariz
ona
regu
lato
rs, D
ept.
of M
otor
Veh
icle
s, S
AE
, NH
TSA
, loc
al c
ounc
il
Fed
eral
and
sta
te g
ove
rnm
ent
Vehi
cle
au
tom
atio
nS
enso
rs
Con
trol
led
pr
oces
s (m
obilit
y)
Act
uato
rs

43 Models and Methods for Collision Analysis – A guide for policymakers and practitioners 44www.racfoundation.org
STEP (Sequential Timed Event Plotting) shows the timed sequence of events leading up to
the collision between the Uber vehicle and the pedestrian in Figure B.6 (red box highlights
collision).
The sequence begins with the driver taking the Volvo out of the garage at 21.14. Then it is
alleged that The Voice is streamed on the driver’s phone. The driver engaged automation
mode at 21.39 and the vehicle proceeds around a preset route. A police report states that
the driver looks down 204 times over the course of 11.8 miles. It is calculated that the
driver’s eyes were off of the road for 6 min 47 sec in the period immediately prior to the
collision.
At some point during this time, a pedestrian wheeling a bicycle decides to cross the road.
The road is dark and unlit at the central reservation when the pedestrian crosses. There is a
small unlit sign stating that the pedestrian crossing is further up the road. The Uber system
detects an obstacle in its path and initially misclassifies it (originally as unclassified, then as a
car, then as a bicycle). Then the system called for the AEB to be activated, but it was already
disabled by the Uber engineers.
About half a second before the collision, the driver looks up and spots the pedestrian. The
driver attempts to steer the vehicle away from the pedestrian but they are struck at 39 mph.
Approximately one second after the collision, the driver applied the brakes. When the vehicle
stops the driver calls 911 to report the collision, and then switches off the phone.
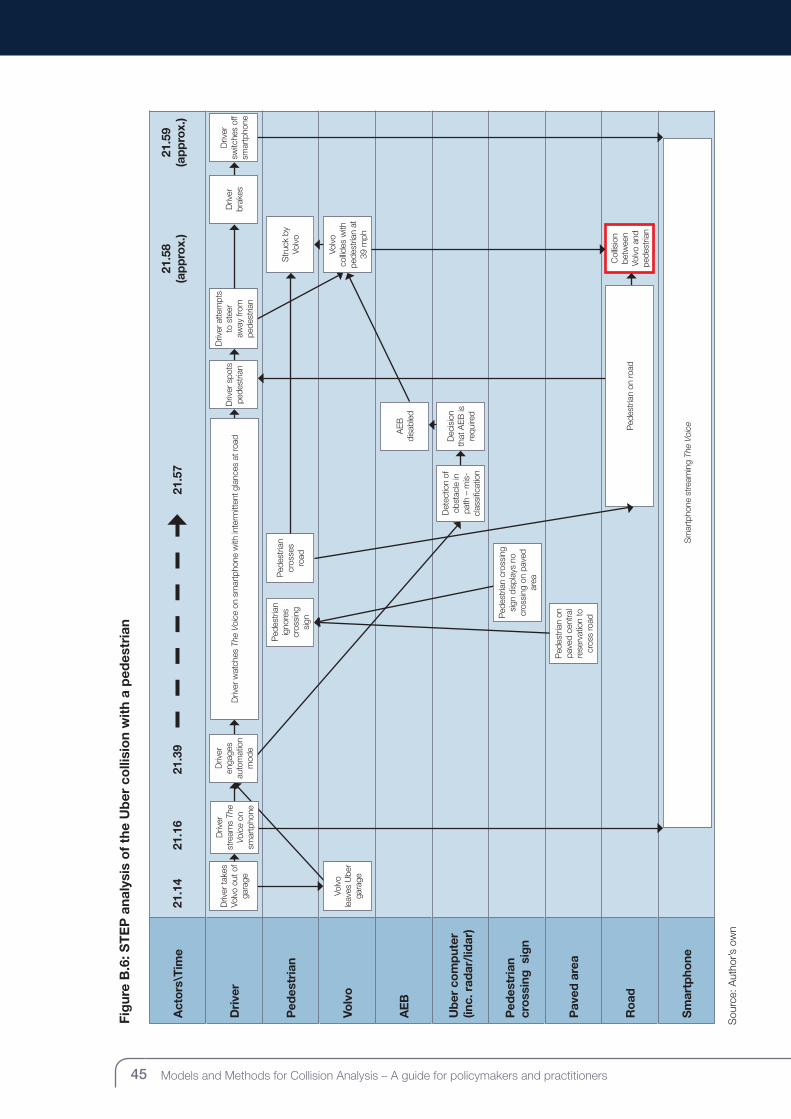
45 Models and Methods for Collision Analysis – A guide for policymakers and practitioners 46www.racfoundation.org
Fig
ure
B.6
: ST
EP
ana
lysi
s o
f th
e U
ber
co
llisi
on
wit
h a
ped
estr
ian
Sou
rce:
Aut
hor’s
ow
n
Act
ors
\Tim
e
Dri
ver
Ped
estr
ian
Volv
o
AE
B
Ub
er c
om
put
er
(inc.
rad
ar/l
idar
)
Ped
estr
ian
cro
ssin
g s
ign
Pav
ed a
rea
Ro
ad
Sm
artp
hone
Ped
estr
ian
igno
res
cros
sing
si
gn
Str
uck
by
Volv
o
AEB
di
sabl
ed
Sm
artp
hone
stre
amin
g Th
e Vo
ice
Col
lisio
n be
twee
n Vo
lvo
and
pede
stria
n
21.1
421
.16
21.3
921
.57
21.5
8 (a
pp
rox.
)21
.59
(ap
pro
x.)
Driv
er
stre
ams
The
Voic
e on
sm
artp
hone
Driv
er w
atch
es T
he V
oice
on
smar
tpho
ne w
ith in
term
itten
t gla
nces
at r
oad
Driv
er ta
kes
Volv
o ou
t of
gara
ge
Driv
er
enga
ges
auto
mat
ion
mod
e
Driv
er s
pots
pe
dest
rian
Driv
er
brak
es
Driv
er a
ttem
pts
to s
teer
aw
ay fr
om
pede
stria
n
Volv
o le
aves
Ube
r ga
rage
Ped
estr
ian
cros
ses
road
Volv
o co
llides
with
pe
dest
rian
at
39 m
ph
Dec
isio
n th
at A
EB is
re
quire
d
Det
ectio
n of
ob
stac
le in
pa
th –
mis
-cl
assi
ficat
ion
Ped
estr
ian
cros
sing
si
gn d
ispl
ays
no
cros
sing
on
pave
d ar
ea
Ped
estr
ian
on ro
ad
Driv
er
switc
hes
off
smar
tpho
ne
Ped
estr
ian
on
pave
d ce
ntra
l re
serv
atio
n to
cr
oss
road
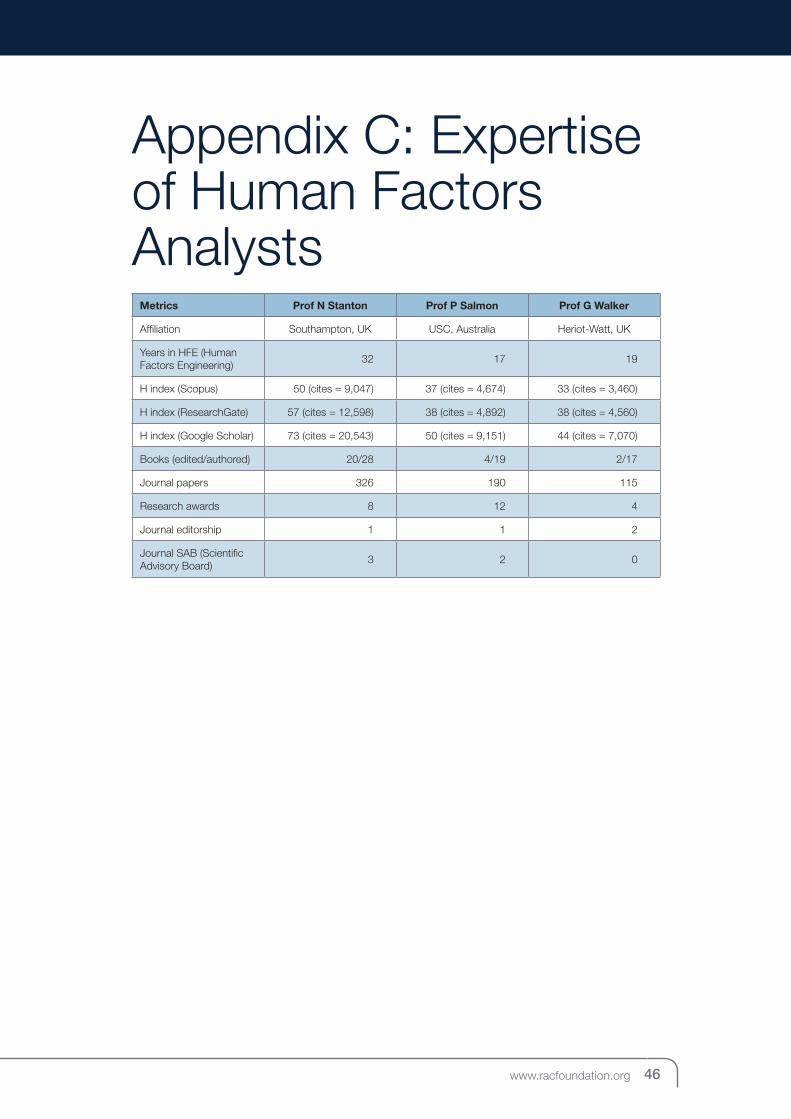
45 Models and Methods for Collision Analysis – A guide for policymakers and practitioners 46www.racfoundation.org
Appendix C: Expertise of Human Factors Analysts
Metrics Prof N Stanton Prof P Salmon Prof G Walker
Affiliation Southampton, UK USC, Australia Heriot-Watt, UK
Years in HFE (Human Factors Engineering)
32 17 19
H index (Scopus) 50 (cites = 9,047) 37 (cites = 4,674) 33 (cites = 3,460)
H index (ResearchGate) 57 (cites = 12,598) 38 (cites = 4,892) 38 (cites = 4,560)
H index (Google Scholar) 73 (cites = 20,543) 50 (cites = 9,151) 44 (cites = 7,070)
Books (edited/authored) 20/28 4/19 2/17
Journal papers 326 190 115
Research awards 8 12 4
Journal editorship 1 1 2
Journal SAB (Scientific Advisory Board)
3 2 0
47 Models and Methods for Collision Analysis – A guide for policymakers and practitioners 48www.racfoundation.org
ReferencesCheckland, P. (1981). Systems Thinking, Systems Practice. Chichester: Wiley.
DfT (Department for Transport) (2017). Reported Road Casualties in Great Britain: 2017
summary. Accessed 28 January 2019 from https://assets.publishing.service.gov.uk/
government/uploads/system/uploads/attachment_data/file/744078/infographic-2017-
annual-report.pdf
Eurostat (2018). Air Safety Statistics in the EU. Accessed 28 January 2019 from https://
ec.europa.eu/eurostat/statistics-explained/index.php/Air_safety_statistics_in_the_EU
Gooding, S. (2017). Towards an Accident Investigation Branch for Roads? RAC
Foundation. Accessed 28 January 2019 from https://www.racfoundation.org/wp-content/
uploads/2017/12/Towards_an_Accident_Investigation_Branch_for_Roads_Steve_Gooding_
December_2017.pdf
Greenwood, M. & Woods, H. M. (1919). The Incidence of Industrial Accidents upon
Individuals: With special reference to multiple accidents (Report No. 4). London: HMSO.
Heinrich, H. W. (1931). Industrial Accident Prevention: A scientific approach. New York:
McGraw-Hill.
Hendrick, K. & Benner, L. Jr. (1987). Investigating Accidents with STEP. New York: Marcel
Dekker.
Hollnagel, E. (2012). FRAM: The Functional Resonance Analysis Method: Modelling complex
socio-technical systems. Farnham: Ashgate.
Hollnagel, E., Woods, D. D. & Leveson, N. (eds.) (2006). Resilience Engineering: Concepts
and Precepts. Aldershot: Ashgate.
ICI (c. 1979). Bowties: history. Accessed 5 February 2019 from https://web.archive.org/
web/20160414013947/http://bowtiepro.com/bowtie_history.asp
Kysor, H. D. (1973). Safety management system. Part I: the design of a system. National
Safety News, 108: 98–102.
Leveson, N.G. (2004). A new accident model for engineering safer systems. Safety Science,
42(4): 237–270.
Leveson, N.G. (2011). Engineering a Safer World: Systems thinking applied to safety.
Boston: MIT Press.
McIlroy, R. C., Plant, K. L., Hoque, M. S., Wu, J., Kokwaro, G. O., Vũ, N. H. & Stanton, N.
A. (2018). Who is responsible for global road safety? A cross-cultural comparison of Actor
Maps. Accident Analysis and Prevention, 122: 8–18.
47 Models and Methods for Collision Analysis – A guide for policymakers and practitioners 48www.racfoundation.org
MAIB (Marine Accident Investigation Branch) (2018). Annual Report 2017. Accessed
28 January 2019 from https://assets.publishing.service.gov.uk/government/uploads/system/
uploads/attachment_data/file/720443/MAIB_Annual_Report_2017.pdf
NTSB (National Transportation Safety Board) (2018). Preliminary Report Highway:
HWY18MH010. Accessed 28 January 2019 from https://www.ntsb.gov/investigations/
AccidentReports/Pages/HWY18MH010-prelim.aspx
ORR (Office of Rail and Road) (2017). Rail Safety Statistics: 2016–17 Annual statistical
release. Accessed 30 January 2019 from http://orr.gov.uk/__data/assets/pdf_
file/0017/25622/rail-safety-statistics-2016-17.pdf
Perrow, C. (1984). Normal Accidents: Living with high-risk technologies. New York: Basic
Books.
Rasmussen, J. (1997). Risk management in a dynamic society: a modelling problem.
Safety Science, 27(2–3): 183–213. Accessed 30 January 2019 from http://orbit.dtu.dk/ws/
files/158016663/SAFESCI.PDF
Reason, J. (1990). Human Error. Cambridge: Cambridge University Press.
Robinson, G.H. (1982). Accidents and sociotechnical systems: principles for design.
Accident Analysis and Prevention, 14(2): 121–130.
Salmon, P. M., Cornelissen, M. & Trotter, M. J. (2012). Systems-based accident analysis
methods: a comparison of Accimap, HFACS, and STAMP. Safety Science, 50(4): 1158–
1170.
Salmon, P. M & Lenné, M. G. (2015). Miles away or just around the corner? Systems
thinking in road safety research and practice. Accident Analysis and Prevention, 74: 243–
249.
Shappell, S. A. & Wiegmann, D. A. (2001). Applying reason: the human factors analysis and
classification system (HFACS). Human Factors and Aerospace Safety, 1(1): 59–86.
Stanton, N. A. & Harvey, C. (2017). Beyond human error taxonomies in assessment of
risk in sociotechnical systems: a new paradigm with the EAST ‘broken-links’ approach.
Ergonomics, 60(2): 221–233.
Stanton N. A., Salmon P. M. & Walker G. H. (2018). Systems Thinking in Practice:
Applications of the event analysis of systemic teamwork method. CRC Press: Boca Raton,
USA.
Svedung, I. & Rasmussen, J. (2002). Graphic representation of accident scenarios: mapping
system structure and the causation of accidents. Safety Science, 40: 397–417.
Taylor, F. W. (1911). The Principles of Scientific Management. New York: Harper & Brothers.
Titcomb, J. & Sabur, R. (2018). Driverless Uber car kills female pedestrian in first deadly
crash. Telegraph, 19 March. Accessed 31 January 2019 from https://www.telegraph.co.uk/
technology/2018/03/19/driverless-uber-car-kills-female-pedestrian-first-deadly-autonomous

49 Models and Methods for Collision Analysis – A guide for policymakers and practitioners PBwww.racfoundation.org
Trist, E. L. & Bamforth, K. W. (1951). Some Social and Psychological Consequences of
the Longwall Method of Coal-Getting: An examination of the psychological situation and
defences of a work group in relation to the social structure and technological content of the
work system. Human Relations, 4(1): 3–38.
Von Bertalanffy, L. (1950). An outline of general system theory. British Journal for the
Philosophy of Science, 1(2): 134–165.
ScienceDirect (undated). Fault-Tree Analysis. Elsevier. Accessed 14 February 2019 from
https://www.sciencedirect.com/topics/engineering/fault-tree-analysis

Mobility • Safety • Economy • Environment
The Royal Automobile Club Foundation for Motoring Ltd is a transport policy
and research organisation which explores the economic, mobility, safety and
environmental issues relating to roads and their users. The Foundation publishes
independent and authoritative research with which it promotes informed debate
and advocates policy in the interest of the responsible motorist.
RAC Foundation
89–91 Pall Mall
London
SW1Y 5HS
Tel no: 020 7747 3445
www.racfoundation.org
Registered Charity No. 1002705
March 2019 © Copyright Royal Automobile Club Foundation for Motoring Ltd
Designed and printed by The Javelin Partnership Ltd
Tel: 0118 907 3494
Produced on paper from a managed sustainable source which is FSC certified
as containing 50% recycled waste.
Main proofreader: Beneficial Proofreading Services
Tel: 07979 763116
ISBN: 978-1-9160527-1-0