Embed Size (px)
Citation preview

1
Modelling the Stability of Maltodextrin-Encapsulated Grape Skin Phenolics Used
as a New Ingredient in Apple Puree
Lavelli, V.*, a Sri Harsha, P. S. C.a, Spigno G.b
aDeFENS, Department of Food, Environmental and Nutritional Sciences, Università
degli Studi di Milano, via Celoria 2, 20133 Milano, Italy
bInstitute of Oenology and Agro-Food Engineering, Università Cattolica del Sacro
Cuore, via Emilia Parmense, 84 – 29122 Piacenza, Italy
Running title: From Grape Skin to Beverage Ingredients
*Corresponding author Tel: +39 2 50319172; Fax: +39 2 50316632; E-mail address:
1

2
Abstract 1
Highly soluble maltodextrin-encapsulated grape skin phenolics comprising 2
anthocyanins and less hydrophilic flavonoids were added as an ingredient to apple 3
puree. Upon formulation, heat treatments were applied to achieve 3-14 decimal 4
reductions (D) of the target microorganism (Alicyclobacillus acidoterrestris). A storage 5
study was performed at 15-35 °C for 1 month. Monomeric anthocyanins were retained 6
at 100 % after the 3 D treatment, while anthocyanin retention decreased to 72 % with 7
increasing heating intensity until 14 D. During storage, the concentration of monomeric 8
anthocyanins decreased following first-order kinetics (k25 °C = 34.4 d-1, activation energy 9
= 51.0 kJ/mol). The flavanols were more stable than the monomeric anthocyanins. The 10
hydroxycinnamic acid, dihydrochalcone and flavonol contents did not change. The 11
fortified puree had a two-fold higher reducing capacity with respect to apple puree. 12
Overall, this ingredient could meet the industrial demand for sustainable colouring 13
agents and health promoting compounds. 14
15
Keywords: grape skin, anthocyanins, phenolics, apple, maltodextrins, activation energy 16
Abbreviations: Abbreviations for chemicals: C, catechin; Ch, chlorogenic acid; Cy-glc,
cyanidin 3-O-glucoside; Dp-glc, delphinidin 3-O-glucoside; EC, epicatechin; HMF,
hydroxymethylfurfural; K, kaempferol; Mv-glc, malvidin 3-O-glucoside; Mv-pc-glc,
malvidin p-coumaroyl glucoside; PC B2, procyanidin B2; Ph-glc, phloretin 2’-O-
glucoside; Ph-xglc, phloretin 2’-O-xyloglucoside; Pn-glc, peonidin 3-O-glucoside; Pt-
glc, petunidin 3-O-glucoside; Q, quercetin; Q-glc, quercetin 3-O-glucoside; Q-gln,
quercetin 3-O-glucuronide. Other abbreviations: D, decimal reductions; Ea, activation
energy; k, rate constant; FRAP, Ferric ion reducing capacity; GAE, gallic acid
equivalents; GSM, grape skin phenolics encapsulated into maltodextrins.
17 Main chemical compounds studied in this article: 18
- delphinidin-3-O-glucoside, PubChem CID 443650 19
- malvidin-3-O-glucoside, PubChem CID 443652 20
- petunidin-3-O-glucoside, PubChem CID 443651 21
- cyanidin-3-O-glucoside, PubChem CID 441667 22

3
- peonidin 3-O-glucoside, PubChem CID 443654 1
1. Introduction
The winemaking industry generates a substantial volume of by-products, which 2
can be recovered as organic fertilizers (Ferrer, Paez, Marmol, Ramones, Chandler, 3
Marin, & Ferrer, 2001), substrates for fermentation for biomass production (Fiori, 4
Valbusa, & Castello, 2012) and sources of value-added compounds that can be used as 5
functional food ingredients (Spagna, Barbagallo, Todaro, Durante, & Pifferi, 2003; 6
Teixeira, Baenas, Dominguez-Perles, Barros, Rosa, Moreno & Garcia-Viguera, 2014). 7
So-called “nutraceuticals” are used as additives or ingredients in foods due to their 8
ability to provide advanced technological properties and health claims, respectively, to 9
the final product (Galanakis, 2015). 10
Red grape skin, the main residue of winemaking, is a rich source of phenolic 11
compounds, mainly anthocyanins, flavanols and flavonols (Texeira et al., 2014). The 12
anthocyanins in grape skin range from 2.5 to 132 g/kg depending on the grape’s genetic, 13
climatic and agronomic factors and winemaking conditions (Kammerer, Claus, Carle, & 14
Schieber, 2004; Sri Harsha, Gardana, Simonetti, Spigno, & Lavelli, 2013). 15
Anthocyanins are increasingly being recognized for their nutritional value. In vitro 16
studies have demonstrated that these compounds can act not only as potent radical 17
scavengers but also as inhibitors of enzymes that are involved in oxidative stress, 18
inflammation, and hypertension, such as xanthine oxidase, myeloperoxidase (Lavelli, 19
2008) and angiotensin I-converting enzyme, respectively (Kwon, Apostolidis, & Shetty, 20
2008). Anthocyanins also inhibit α-glucosidase, thus controlling glucose absorption 21
(Kwon et al., 2008). Thus, anthocyanins could play a role in decreasing the risk of 22
cardiovascular disease, oxidative stress and hyperglycaemia-induced pathogenesis 23
(Konczak & Zhang, 2004; Zafra-Stone, Yasmin, Bagchi, Chatterjee, Vinson, & Bagchi, 24
4
2008). Moreover, anthocyanins have potential as natural food colourants (Castaneva-1
Ovando, Pacheco-Hernandez, Paez-Hernandez, Rodriguez, & Galan-Vidal, 2009). 2
However, anthocyanins easily undergo oxidation, and thus, the processing and 3
storage of foods can lead to the degradation of these compounds (Nayak, Liu, & Tang, 4
2015). Oxygen exclusion has been proposed to improve anthocyanin stability during the 5
pasteurization and storage of strawberry puree. This technology is efficient during heat 6
treatment, but additional technologies are needed to prevent anthocyanin losses that 7
occur during storage even under anaerobic conditions (Howard, Brownmiller, & Prior, 8
2014). Moreover, grape skin anthocyanins that are obtained by hydroalcoholic 9
extraction in a complex phenolic mixture and that are subsequently freeze-dried exhibit 10
a very low water and lipid solubility, making their use considerably difficult (Cano-11
Chauca, Stringheta, Ramos, & Cal-Vidal, 2005; Amendola, De Faveri, & Spigno, 12
2010). To overcome these issues, encapsulation techniques have been proposed, which 13
could considerably increase anthocyanin solubility and stability. The encapsulating 14
agents investigated in these techniques include calcium alginate (Celli, Ghanem, & 15
Brooks, 2015; Aizpurua-Olaizola, Navarro, Vallejo, Olivares, Etxebarria, & Usobiaga, 16
2016), gum arabic, partially hydrolysed guar gum, polydextrose (Kuck, & Noreña, 17
2016) and maltodextrins (Souza, Fujita, Thomazini, da Silva, Lucon, Genovese, & 18
Favaro-Trindade, 2014). Maltodextrins are among the most important carrier agents, 19
mainly because they form low viscosity solutions in high concentrations that can be 20
efficiently spray-dried (Souza et al., 2014). Grape skin extract was spray-dried with 21
maltodextrins, which were used as encapsulating agents to obtain a powder with low 22
moisture content, low hygroscopicity and high solubility (Souza, Thomazini, de 23
Carvalho Balieiro, & Fávaro-Trindade, 2015). Anthocyanins encapsulated in 24
maltodextrins and subsequently spray-dried or freeze-dried formed microparticles that 25
were more stable than the directly freeze-dried anthocyanin extract. Thus, these 26

5
microparticles could be used as food ingredients (Souza et al., 2015; Celli, Dibazar, 1
Ghanem & Brooks, 2016). In a previous study, grape skin phenolics encapsulated with 2
maltodextrins were incorporated into hazelnut paste to increase oxidative stability 3
(Spigno, Donsì, Amendola, Sessa, Ferrari, & De Faveri, 2013). In the present study, 4
grape skin phenolics encapsulated in maltodextrins were used as a functional ingredient 5
for apple puree. 6
Anthocyanin stability during food processing is greatly dependent on the food 7
matrix, and thus model systems cannot predict anthocyanin stability in food 8
formulations. Indeed, Maccarone, Maccarone, & Rapisarda (1985) found that 9
anthocyanins of blood orange are more stable in a buffer solution (pH 3.2) than in blood 10
orange juice under the same storage conditions. The negative effect of sugars, the main 11
components of juices and beverages, on anthocyanin stability has further been 12
confirmed in a stability study in which grape anthocyanins were added to a non-13
carbonated soft drink (Dyrby, Westergaard, & Stapelfeldt, 2001). In contrast, non-14
coloured phenolics can enhance anthocyanin stability (Nayak et al., 2015). 15
In the present study, the degradation of anthocyanins, non-coloured phenolics 16
and the reducing capacity of a new apple puree containing encapsulated grape skin 17
phenolics were investigated during heat treatment and storage. A kinetic model for 18
anthocyanin degradation was then devised. The overall aim was to meet the increasing 19
industrial demand for natural colouring agents and health promoting compounds by 20
proposing a sustainable carrier for anthocyanins and less hydrophilic phenolics to be 21
used in beverages and purees. 22
Materials and Methods 23
2.1. Chemicals 24
Maltodextrin Glucidex® 12 was purchased from Roquette Italy (Cassano 25
Spinola, Italy). Malvidin-, cyanidin-, delphinidin-, peonidin- and petunidin- 3-O-26

6
glucosides were obtained from Polyphenols (Sandes, Norway). All other standards and 1
chemicals were purchased from Sigma Aldrich (Milan, Italy). 2
2.2. Grape skin phenolics encapsulated in maltodextrin (GSM) 3
Grape pomace of the Barbera variety was kindly provided by a winery located in 4
Northern Italy. At the winery, grape pomace was sieved (with a 5-mm sieve) to separate 5
the skins from the seeds and then frozen. The frozen samples were transported to the lab 6
and dried at 50 °C for approximately 24 h until the residual moisture content was < 5 %. 7
After drying, the samples were milled and sieved to obtain fractions with particle sizes 8
≤ 2 mm. 9
The crude ethanol extract was obtained according to the method reported by 10
Spigno, Amendola, Dahmoune, & Jauregi (2015). Briefly, 125 g of grape skin powder 11
was extracted with 1 L of 60 % aqueous ethanol with continuous stirring for 2 h at 60 12
°C. The mixture was then centrifuged at 2000 x g for 10 min and the supernatant 13
recovered. The drying process was performed in a laboratory scale spray dryer (Büchi 14
Mini Spray Dryer B-290, Switzerland), with a 0.7-mm diameter nozzle. Compressed 15
gas (air) was used to disperse the liquid into fine droplets. The following operation 16
conditions were adopted: 4 mL/min feeding rate with 13 % w/v total solids 17
concentration; 667 L/h drying air flow rate, aspirator rate set at 100 %; 150 °C inlet air 18
temperature. An outlet temperature of 83 °C was recorded. Maltodextrins with a 19
dextrose equivalence of 12 were used as a carrier at a dosing level of 1:1 dry weight 20
maltodextrins:dry weight total solids of extract. The maltodextrins were swollen in 21
distilled water at a 1:1 (w:w) ratio the day before use. Based on the dry weight of 22
maltodextrins, the total solid content of the initial extract and the total solids of grape 23
skin phenolics encapsulated in maltodextrins (GSM), a total solids recovery of 83.96 ± 24
5.58 % was calculated. 25
2.3. Scanning electron microscope (SEM) observation 26

7
SEM (FEI Quanta Feg 250 Esem, FEI, Hillsboro, OR, USA) was performed to 1
examine the GSM. 2
2.4. Grape Skin Phenolic Solubility at pH 3.5 3
An amount of 1.25 g of GSM was added to 15 mL of 0.15 M citrate buffer, pH 4
3.5. The mixture was incubated in a water bath at 30 °C for 30 min and then centrifuged 5
at 10000 x g for 20 min. The residue was discarded, the supernatant was collected, and 6
the total phenolic content was measured as described under Section 2.10. Grape skin 7
powder was extracted in parallel. The solubility of the phenolics of grape skin powders 8
and spray dried extract encapsulated in maltodextrins was evaluated in duplicate and 9
expressed as grams of gallic acid equivalents (GAE) per litre of buffer. 10
2.5. Formulation of the fortified apple purees 11
Apple puree was provided by a fruit processing company. Fortified apple puree 12
was prepared by the addition of 1.4 % of GSM. The apple/GSM ratio used was chosen 13
to have an anthocyanin content that was approximately double that used to formulate 14
anthocyanin-enriched juices and nectars (Kırca, Ozkan, & Cemeroglu, 2006). 15
2.6. Heat treatments 16
The fortified GSM apple puree and control apple puree were added to various 17
10-mL glass tubes and were subjected to heat treatment at 100 ºC in a water bath with 18
continuous temperature monitoring using a thermosensor. Upon the attainment of a 19
given pasteurization or sterilization effect, the bottles were cooled by immersion in ice. 20
Different heating conditions were applied, and the resulting time/temperature 21
curves were obtained. To model the pasteurization/sterilization effectiveness during heat 22
treatment, Alicyclobacillus acidoterrestris was used as a target (Silva & Gibbs, 2004). D 23
values for the target microorganism were calculated as a function of temperature using 24
Bigelow’s model: 25
D = Dref*10(Tref-T)/z (1) 26
8
where for the target microorganism, Dref = 1.5 min, Tref = 95 ºC and z = 7 ºC 1
(Bevilacqua & Corbo, 2011). 2
The efficacy of each non-isothermal heat treatment was then calculated considering the 3
variation of D with time, as: 4
t 5
the number of decimal reductions achieved = ∫o (dt/D) (2) 6
where t is the processing time. 7
3 D, 6 D and 14 D treatments were applied in parallel. 8
To model the effect of heat treatments on anthocyanin degradation, the rate 9
constants (k) were calculated as a function of temperature using the Arrhenius equation: 10
k = ko*e(-Ea/RT) (3) 11
where ko is the frequency factor (min-1), Ea is the activation energy (J/mol), R is the 12
universal gas constant (8.314 J.K-1.mol-1), and T is the absolute temperature (Kelvin). 13
For grape anthocyanins in McIlvaine buffer (citric acid-Na2HPO4), pH 3.0, K80°C = 14
2.5*103 and Ea = 57.5 kJ/mol; for grape anthocyanins in non-carbonated soft drinks 15
(containing the following ingredients per 1000 g: sucrose, 86.0 g; sodium benzoate, 16
0.14 g; potassium sorbate, 0.18 g; ascorbic acid, 0.02 g; and citric acid, 1.52 g), pH 3.0, 17
k80°C = 5.3*103 min-1 and Ea = 75.9 kJ/mol (values derived from data by Dyrby et al., 18
2001); for black carrot anthocyanins in an apple puree (having 18.7 °Brix and 19
containing the following ingredients per 1000 g: citric acid, 4.6 g and ascorbic acid, 20
0.022 g), K80°C = 2.3*103 min-1 and Ea = 62.2 kJ/mol (Kirca et al., 2006). 21
Anthocyanin degradation has been reported to follow first-order reaction kinetics 22
(Patras, Brunton, O’Donnel, & Tiwari, 2010). The expected anthocyanin content (C) 23
upon non-isothermal heat treatment conditions applied in this study was calculated 24
considering the variation of k with time, as: 25

9
t 1
ln(C) = ln (Co) - ∫o (dt*k) (4) 2
3 where Co is the initial anthocyanin content and t is the processing time. 4
The theoretical degradation trends obtained for grape anthocyanins in a buffer solution 5
at pH 3, grape anthocyanins in a non-carbonated soft drink and black carrot 6
anthocyanins in apple puree were then calculated for the time-temperature conditions 7
applied in the present study. 8
2.7. Storage study 9
The samples subjected to the 14 D heat treatment were stored in triplicate in 10
thermostatic heating cabinets at 15, 25 and 35 ºC and analysed at different time 11
intervals. 12
2.8. Moisture, fibre, protein, carbohydrates, fat and ash contents, 13
titratable acidity and pH 14
The moisture contents of the apple puree and GSM were determined by drying 15
in a vacuum oven at 70 °C and 50 Torr for 18 h. Protein, fat, and ash contents of apple 16
puree were measured according to the AOAC official methods of analysis (Tseng & 17
Zhao, 2013). Glucose, fructose and sucrose were determined as described in Guerrieri, 18
Eynard, Lavelli, & Cerletti, (1997). The fibre contents were determined using the 19
Megazyme total dietary fibre assay procedure (based on AOAC 991.43). The pH was 20
determined with a model 62 pH metre (Radiometer Copenhagen, Denmark). Titratable 21
acidity was determined by titration with 0.1 M NaOH to pH 8.1. These results were 22
expressed as grams of malic acid equivalents per 100 g of dry product (d.w.). Duplicate 23
determinations were performed for each sample. 24
2.9. Phenolic extraction 25
For phenolic extraction from GSM, an amount of 100 mg was added with 8-mL 26
methanol:water:HCl (80:20:0.1, v/v/v), for 2 h at room temperature with continuous 27
10
stirring. The mixture was centrifuged at 10000 x g for 10 min, the supernatant was 1
recovered, and the solid residue was re-extracted using 6 mL of the same solvent twice 2
(Sri Harsha et al., 2013). For phenolic extraction from the fortified and control apple 3
purees, an amount of 1.6 g was extracted in 20 mL of methanol:water:HCl (80:20:0.1, 4
v/v/v) using the same 3-step procedure. Duplicate determinations were performed for 5
each sample. The extracts were stored in the dark, at -20 °C, until further 6
characterization studies. 7
2.10. Total phenolics 8
The Folin–Ciocalteu assay was performed on sample extracts according to Sri 9
Harsha et al. (2013). Briefly, the reaction mixture contained 0.5 mL of the extracts 10
diluted with methanol:water:HCl (80 : 20 : 0.1, v/v/v), 6.0 mL of distilled water, 0.5 mL 11
of Folin–Ciocalteu reagent and 3 mL of 10 % Na2CO3. The mixtures were incubated for 12
90 min at room temperature and the absorbance was recorded at 760 nm against a blank 13
with no extract addition. For each extract, 2 - 4 dilutions were assessed in duplicate. A 14
calibration curve was built using gallic acid. Total phenolics were expressed as GAE per 15
kilogram of dry product. 16
2.11. Soluble proanthocyanidins 17
Proanthocyanidin content was analysed as described previously (Sri Harsha et 18
al., 2013). Briefly, for evaluation of soluble proanthocyanidins 1 mL of the sample 19
extract diluted with methanol:water:HCl (80:20:0.1, v/v/v) was added to 6 mL of n-20
butanol:HCl (95:5, v/v) and 0.2 mL of 2 % NH4Fe(SO4)2.12 H2O in 2 M HCl. For 21
evaluation of insoluble proanthocyanidins, 10 mg of the extraction residue was 22
weighted in quadruplicate and added to 20 mL methanol, 120 mL n-butanol:HCl (95:5, 23
v/v) and 4 mL of 2 % NH4Fe(SO4)2.12 H2O in 2 M HCl. Hydrolysis was carried out at 24
95 °C for 40 min. The reaction mixtures were cooled and the absorbance was recorded 25
at 550 nm by a Jasco UVDEC-610 spectrophotometer (Jasco Europe, Cremella, Italy) 26
11
against a blank made as for the sample but incubated at room temperature. For each 1
sample extract, 2 - 4 dilutions were assessed in duplicate. Proanthocyanidin amount was 2
determined using 0.1736 (mg/mL) as conversion factor (Travaglia, Bordiga, Locatelli, 3
Coïsson, & Arlorio, 2011) and expressed as grams per kilogram of dry product. 4
2.12. HPLC analysis of phenolics 5
The phenolic profile of the extracts was analysed using a model Shimadzu LC-6
20 AD pump coupled to a model Shimadzu SPD-M20A photodiode array detector and 7
an RF-20 AXS operated by Labsolution Software Shimadzu, Kyoto, Japan). A 2.6 μm 8
Kinetex C18 column (150 x 4.6 mm; Phenomenex, Bologna, Italy) was used for the 9
separation, at a flow-rate of 1.5 mL/min. The column was maintained at 40 °C. The 10
separation was performed by means of a linear gradient elution. Eluents were: (A) 0.1 % 11
H3PO4; (B) acetonitrile. The gradient was as follows: from 6% B to 20% B in 18 min; 12
from 20 % B to 60 % B in 7 min; from 60 % B to 90 % B in 19 min; 90 % B for 10 min 13
and then 6 % B for 5 min. DAD analysis was carried out in the range of 200 - 600 nm. 14
Anthocyanins, flavonols, dihydrochalcones, hydroxycinnamic acids and HMF were 15
quantified by calibration curves built with external standards, namely, malvidin-3-O-16
glucoside at 520 nm for anthocyanins, quercetin-3-O-glucoside at 354 nm for flavonols, 17
phlorizin at 280 nm for dihydrochalcones, HMF at 280 nm, chlorogenic acid at 330 nm. 18
Flavanols were quantified by catechin, epicatechin and procyanidin B2 standard with 19
the fluorimetric detector set at λex 230 and λem 320. Results were expressed as milligram 20
per kilogram of product. 21
2.13. Monomeric and total anthocyanin determination using the pH differential 22
method 23
Anthocyanin content was analysed as described previously (Lee, Durst, & Wrolstad, 24
2005). In brief, each extract was diluted in both 0.025 M potassium chloride buffer, pH 25
1.0, and 0.4 M sodium acetate pH, 4.5. Dilution factor was chosen until absorbance at 26

12
520 nm was within the linear range. The absorbance of sample diluted with pH 1.0 and 1
pH 4.5 buffer was then determined at both 520 and 700 nm versus distilled water. For 2
each extract, 2 dilutions were assessed in duplicate. Monomeric and total anthocyanin 3
concentration were expressed as mg of cyanidin-3-glucoside equivalents per kilogram 4
of dry product, as follows: 5
Monomeric anthocyanins (mg/kg d.w.) = [(A520nm – A700nm)pH 1.0 – (A520nm – A700nm)pH 6
4.5]*MW*d*1000/ε*C; 7
Total anthocyanins (mg/kg d.w.) = [(A500nm – A700nm)pH 1.0]*MW*d*1000/ε*C; 8
where MW is the molecular weight of cyanidin-3-glucoside (449.2 g/mol), d is the 9
dilution factor, ε is the molar extinction coefficient of cyanidin-3-glucoside (26,900 M-10
1cm-1), C is the concentration of the extract. 11
2.14. Ferric ion reducing antioxidant power (FRAP) assay 12
The FRAP assay was performed as described previously (Sri Harsha et al., 13
2013). Briefly, FRAP reagent was prepared by adding 25 mL of 300 mM acetate buffer, 14
pH 3.6; 2.5 mL of 10 mM 2,4,6-tripyridyl-s-triazine in 40 mM HCl and 2.5 mL of 20 15
mM FeCl3. The reaction mixture contained 0.4 mL of sample extracts diluted with 16
methanol:water:HCl (80:20:0.1, v/v/v) and 3 mL of FRAP reagent. The absorbance at 17
593 nm was evaluated on a Jasco UVDEC-610 spectrophotometer (Jasco Europe, 18
Cremella, Italy) after 4 min of incubation at 37 °C against a blank with no extract 19
addition. For each sample extract, 2 - 4 dilutions were assessed in duplicate. A 20
methanolic solution of FeSO4·7H2O was used for calibration. Results were expressed as 21
millimoles of Fe(II) sulfate equivalents per kilogram of product. 22
2.15. Statistical analysis of data 23
Experimental data were analysed using one-way ANOVA with the least 24
significant difference (LSD) as a multiple range test, and by linear regression analysis 25

13
using Statgraphics 5.1 (STCC Inc.; Rockville, MD). These results are reported as the 1
average ± standard error (SE) or average ± standard deviation (SD), as specified. 2
3. Results and Discussion 3
3.1. Characterization of the fortified and control apple purees 4
The apple puree composition was as follows: 2.2 ± 0.1 % dietary fibre, 0.30 ± 5
0.01 % protein, 0.20 ± 0.01 % fat, 0.20 ± 0.03 % ash, 11.9 ± 0.1 % soluble sugars (50 % 6
fructose, 28 % glucose and 22 % sucrose), 0.36 ± 0.01 % acidity as malic acid 7
equivalents, and a pH of 3.7. The main antioxidants in the apple puree were chlorogenic 8
acid, catechin, epicatechin procyanidin B2, phloridzin (phloretin glucoside) and 9
phloretin xyloglucoside (Table 1), as previously observed (Lavelli & Vantaggi, 2009). 10
SEM revealed that GSM was a fine powder, consisting of spherical and partly 11
collapsed particles of variable sizes between 0.4 and 3.5 m (Figure 1). The solubility 12
of GSM phenolics in 0.1 M citrate buffer, pH 3.5 at 30 °C was 3.7 ± 0.1 g/L. This value 13
was found to be far higher than the solubility of grape skin phenolics under the same 14
conditions, i.e., 0.4 g/L. Thus, GSM can be considered a good vehicle for both 15
anthocyanins and less hydrophilic grape flavonoids in low pH beverages. Indeed, upon 16
the addition of 1.4 % GSM to the apple puree, the main anthocyanins of red skin, 17
namely the 3-O glucosides of five common anthocyanidins, including cyanidin, 18
peonidin, petunidin, delphinidin and malvidin; malvidin p-coumaryl-glucoside; and the 19
3-O glucoside and 3-O glucuronide of quercetin, quercetin and kaempferol were 20
observed (Table 2). The sum of monomeric anthocyanins in the GSM fortified apple 21
puree was 654 mg/kg d.w., which corresponded to 80 mg/L. This value was double the 22
value of those used previously in the formulation of anthocyanin-rich beverages (Kirca 23
et al., 2006). Furthermore, the levels of low molecular weight flavanols and 24
proanthocyanidins increased in the fortified puree with respect to the apple puree. The 25
amounts of these compounds were exactly as expected based on GSM composition (not 26
14
shown) and the amount added to the apple puree. The total phenolic content of the 1
fortified puree increased by 60 %, while the FRAP increased by 100 % with respect to 2
the control apple puree, indicating that grape skin phenolics are, on average, more 3
efficient reducing agents than apple phenolics. 4
3.2. Thermal treatments 5
The incorporation of grape skin-derived ingredients into liquid food, such as 6
apple puree, requires the design of an effective heat treatment because the presence of 7
spores in these ingredients cannot be ruled out. The pH value of the apple purees was 8
3.7. For low pH foods (pH < 4.6), A. acidoterrestris was suggested as the target of 9
pasteurization processes (Silva & Gibbs, 2004). Indeed, A. acidoterrestris is a 10
thermoacidophilic, non-pathogenic and spore-forming bacterium that has been isolated 11
and identified in spoiled commercial fruit products, such as apple juices. No common 12
criterion has been defined for the severity of pasteurization conditions for high-acid 13
foods. Currently, the industry designs pasteurization processes using an empirical 14
approach, resulting in decimal reduction times ranging from 2 D - 3 D to 6 D of the 15
target microorganism, but higher D values have also been proposed (Gaze & Betts, 16
1992; Silva & Gibbs, 2004). 17
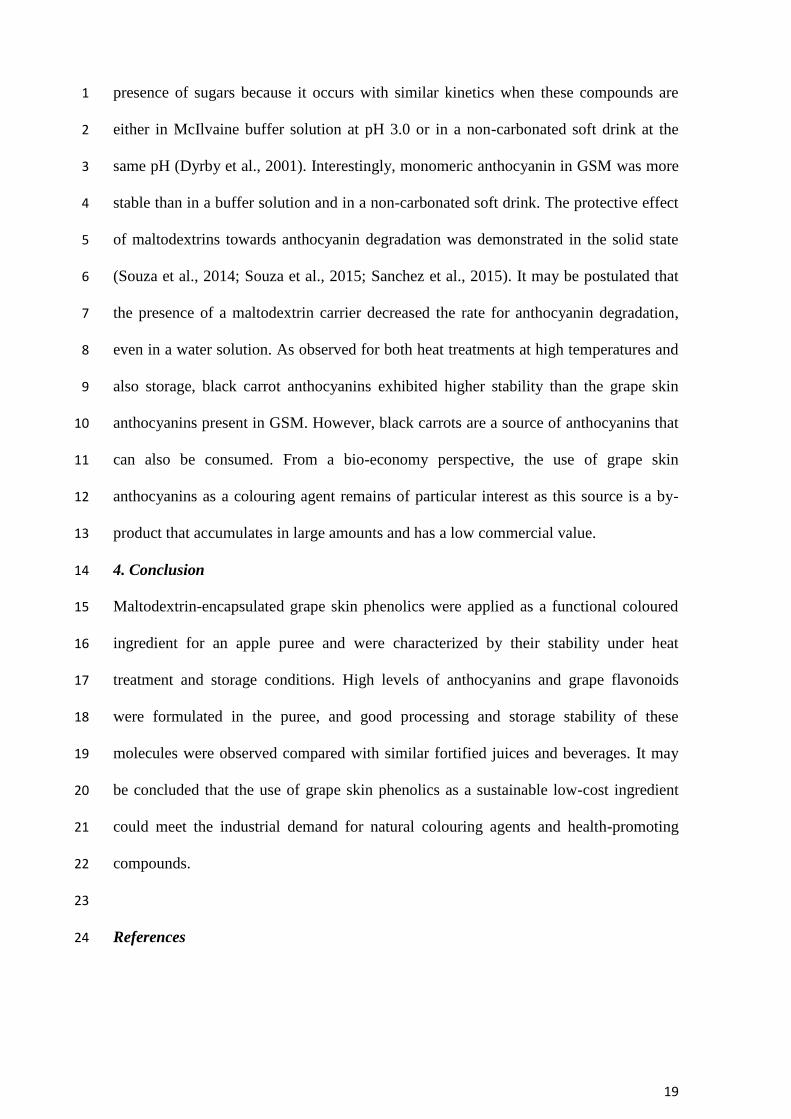
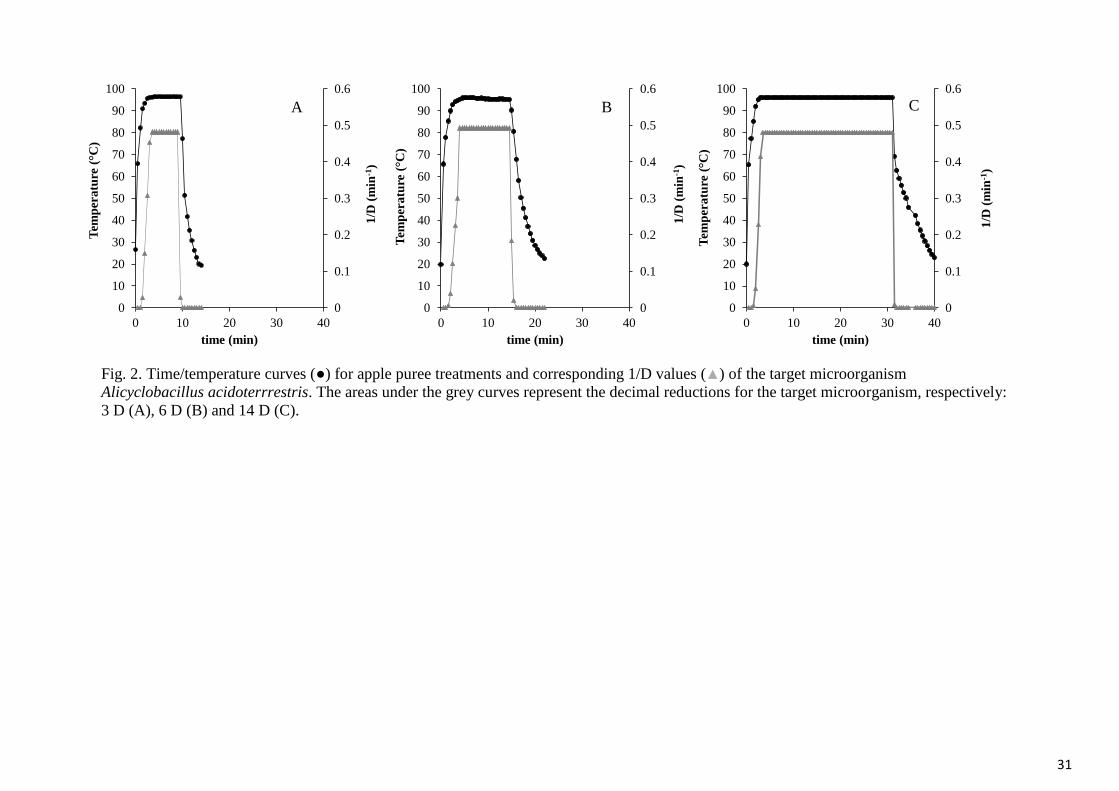
In the present study, the fortified and control apple purees were subjected to 3 D, 6 D 18
and 14 D treatments. The time-temperature curves did not differ between the control 19
apple puree and GSM fortified apple puree, and exemplary trends are shown in Figure 20
2. The 3 D treatment did not significantly affect antioxidant stability (data not shown). 21
The effect of the 6 D and 14 D treatments on antioxidant contents and FRAP values are 22
shown in Tables 1 and 2. Phloridzin, phloretin xyloglucoside, flavonols and 23
proanthocyanidins were stable even after the most intensive conditions were applied. 24
The stability of these compounds during processing has already been observed (Lavelli 25
& Vantaggi, 2009; Lavelli & Torresani, 2011). Monomeric and dimeric flavanols were 26

15
not affected by the 6 D treatment but they were affected by the 14 D treatment applied 1
to the apple puree, with an average retention higher than 80 % (Table 1). Conversely, 2
these compounds did not vary significantly in the GSM fortified apple puree even after 3
the 14 D treatment (Table 2). Regarding the monomeric anthocyanins present in the 4
GSM fortified apple puree, both the 6 D treatment and 14 D treatment affected stability. 5
The percent retentions were similar among the six major anthocyanin compounds 6
identified in grape skin (Table 2). Indeed, grape anthocyanins comprise glucosides and a 7
p-coumaroyl glucoside of malvidin 3-O glucoside, whereas polyacylated and 8
polyglycosylated anthocyanidins, which are more stable (Patras et al., 2010), are not 9
present in grape skin. The percentage retentions of total monomeric anthocyanins were 10
84 % and 72 % after the 6 D and 14 D treatments, respectively. The sum of the 11
monomeric anthocyanins determined by HPLC was correlated to the total monomeric 12
anthocyanins determined using the spectrophotometric assay (R = 0.97, p = 0.007). The 13
total anthocyanins showed similar degradation percentages (Table 2). 14
In a previous study, the thermal degradation of grape monomeric anthocyanins 15
was examined in McIlvaine buffer at pH 3.0 and in a non-carbonated soft drink medium 16
(containing sugars) with the same pH. The degradation rates were approximately twice 17
as high in the non-carbonated solution compared with the buffer. This result indicated a 18
detrimental effect of sugars on monomeric anthocyanin stability (Dyrby et al., 2001). 19
The kinetic data (Eatt, ko) obtained by Dyrby et al. (2001) were used to calculate the 20
expected retentions of a grape skin anthocyanin water extract added to a non-carbonated 21
soft drink (containing sugars) at pH 3.0 or in the McIlvaine buffer (not containing 22
sugars) at pH 3.0, which were subjected to the same time-temperature conditions 23
applied in our study. The calculated retention percentages of monomeric anthocyanins 24
in the buffer were 95 and 88 upon the 6 D and 14 D treatments, respectively. 25
Interestingly, the calculated retention percentages for monomeric anthocyanins in the 26

16
non-carbonated drink were 81 and 56, respectively. Thus, upon prolonged heat 1
treatment, the puree with GSM was a better matrix for anthocyanins than the non-2
carbonated drink. It may be hypothesized that maltodextrins prevented a reaction 3
between the anthocyanins and reducing sugars present in apple puree. However, the 4
observed anthocyanin retention in the GSM fortified puree was slightly lower than in 5
the buffer. The degradation of black carrot anthocyanins added to apple puree was also 6
calculated for the time-temperature conditions applied in the current study, using the 7
kinetic data (Eatt, ko) obtained by Kırca, Ozkan, & Cemeroglu (2006). The calculated 8
percentage of degradation of black carrot anthocyanins was found to be lower than 10 9
even for the most intensive heating conditions applied (14 D). Indeed, black carrots are 10
known to contain polyglycosylated anthocyanins, and 41 % of these compounds have 11
been found to be acylated (Stintzing, Stintzing, Carle, Frei, & Wrolstad, 2002). This 12
anthocyanin composition accounts for the much higher stability of black carrots 13
compared with other anthocyanin sources (Sadilova, Stintzing, & Carle, 2006). 14
Regarding the FRAP values, the retentions upon 6 D and 14 D treatments were 15
83 and 68 %, respectively, in apple puree, and 100 % and 67 % in the GSM fortified 16
apple puree, respectively. Thus, after the most intensive treatment, the FRAP values in 17
the fortified puree remained double that of the control puree. The HMF content 18
increased upon heat treatment in both the apple puree and GSM fortified apple puree up 19
to 32 mg/kg d.w., which corresponded to 5 mg/L. This value can be considered as low 20
because according to the AIJN Code of Practice, the HMF in apple juice should not 21
exceed 20 mg/L (Schilling et al., 2008). 22
3.3. Storage study 23
During the 1-month storage period at the temperature range of 15 – 35 °C, 24
chlorogenic acid, phloridzin and phloretin xyloglucoside and flavonol contents did not 25
significantly change in both GSM fortified and control purees. Monomeric and dimeric 26

17
flavanols decreased in the control apple puree, with retention percentages in the range of 1
43 – 54 for catechin and procyanidin B2 and in the range of 62 – 78 for epicatechin, 2
respectively. Proanthocyanidins decreased only upon storage at 35 °C, with a retention 3
percentage of 66 %. The addition of GSM increased the contents and stability of 4
monomeric and dimeric flavanols, which were degraded only at temperatures ≥ 25 °C, 5
with retention percentages in the range of 53 – 80. The proanthocyanidin content also 6
increased upon GSM addition and the degradation of these compounds in the fortified 7
puree occurred only at 35 °C, with 74 % retention. Monomeric anthocyanins were less 8
stable, with minor differences observed among the individual compounds, as discussed 9
in the previous paragraph. The average retention percentages of monomeric 10
anthocyanins decreased from 60 to 15 with increasing storage temperature from 15 to 11
35 °C. The percent retention was generally higher for total anthocyanin than for 12
monomeric anthocyanins. FRAP values also decreased to a smaller extent than 13
monomeric anthocyanins after storage at the highest temperature (Table 2). This result 14
was consistent with findings obtained in a previous study involving antioxidant changes 15
in elderberry juice during storage, which demonstrated that despite a significant 16
decrease in anthocyanin content, the antioxidant activity decrease was lower. This effect 17
was attributed to condensation reactions between anthocyanins and other antioxidants, 18
resulting in the formation of polymerized phenolic compounds that maintained 19
antioxidant activity (Busso Casati, Baeza, Sanchez, Catalano, López, & Zamora, 2015). 20
HMF formation was below the threshold limit discussed in the previous paragraph, both 21
for apple and GSM apple (Tables 1, 2). 22
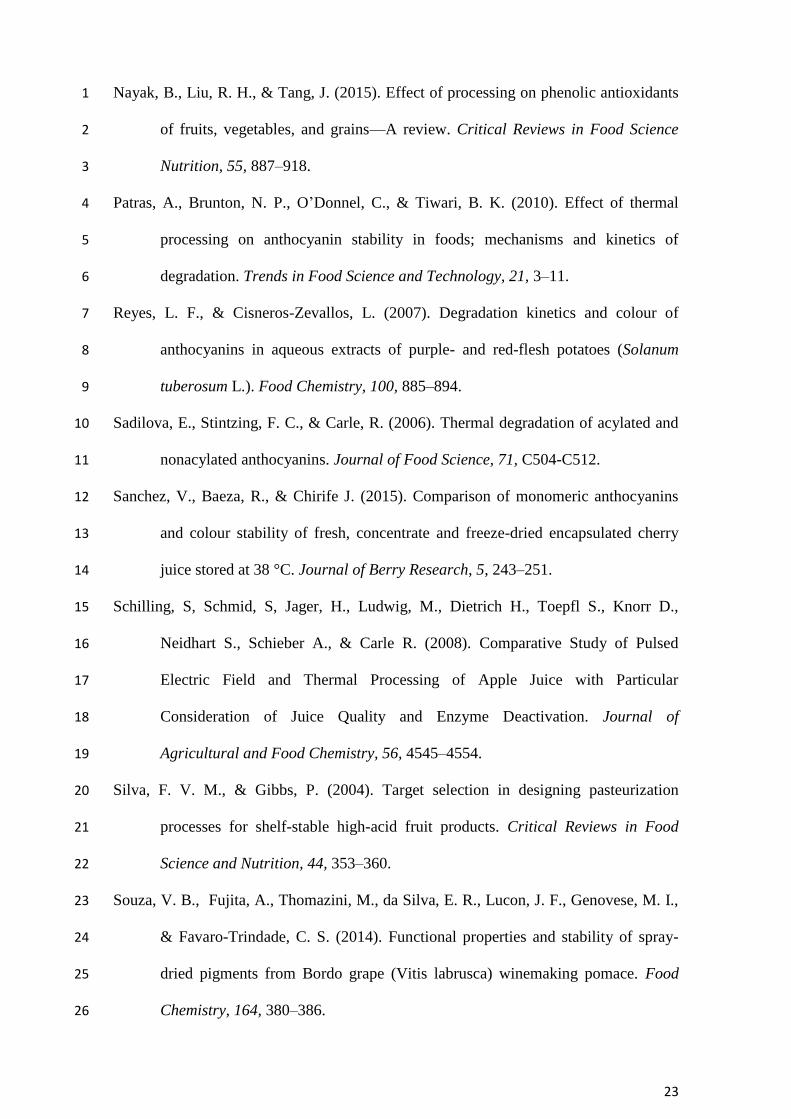
To compare the anthocyanin stability in GSM apple puree with respect to the 23
stability of these compounds in various anthocyanin-rich beverages, the decrease was 24
fitted to first order kinetics (Figure 3). The resulting rate constants and activation energy 25
for anthocyanin degradation are shown in Table 3. From these kinetic data, it was 26

18
calculated that the half-life for monomeric anthocyanins decreased from 45 to 11 days 1
when the storage temperature was increased from 15 to 35 °C. The half-life of 7 days 2
for monomeric anthocyanins was then calculated for the storage temperature of 37 °C. 3
In a previous study, the half-lives of monomeric anthocyanins in various juices stored at 4
37 °C ranged between 2.1 days and 31.5 days, with the lowest value found for blood 5
orange juice and the highest value found for black carrot juice (Sanchez, Baeza, & 6
Chirife, 2015). As expected, black carrot demonstrated the highest stability, most likely 7
due to its content of acylated and polyglycosylated anthocyanins (Stintzing, Stintzing, 8
Carle, Frei, & Wrolstad, 2002). However, the stability of monomeric anthocyanins in 9
the GSM apple puree was relatively good with respect to other juices. 10
Considering grape as a source of anthocyanins for model solutions and 11
beverages, Table 3 summarizes the results of previous studies evaluating the rate 12
constants for the degradation of these compounds during storage. Regarding total 13
anthocyanins, the rate constant for degradation observed at 25 °C in GSM was similar to 14
that found by Reyes & Cisneros-Zevallos (2007) for a grape skin water extract, whereas 15
the activation energy was lower. Thus, the degradation rate at 35 °C for anthocyanins in 16
GSM was also lower than that found by Reyes & Cisneros-Zevallos (2007) for the 17
grape skin water extract. It may be postulated that total anthocyanins and thus colour 18
were more stable in GSM, in which these molecules are encapsulated with other 19
phenolics that have low solubility in water, such as flavonols. Indeed, anthocyanins are 20
protected by both self-association and co-pigmentation. Self-association causes the 21
formation of helical stacks via the hydrophobic attraction and hydrogen bonding 22
between the flavylium nuclei. Stacking protects the chromophores behind the sugar 23
groups from the hydration reaction. Co-pigmentation occurs via hydrogen bonding of 24
the phenolic groups between anthocyanin and flavone molecules (Nayak et al., 2015). 25
Regarding monomeric anthocyanins, the decrease during storage is not affected by the 26
19
presence of sugars because it occurs with similar kinetics when these compounds are 1
either in McIlvaine buffer solution at pH 3.0 or in a non-carbonated soft drink at the 2
same pH (Dyrby et al., 2001). Interestingly, monomeric anthocyanin in GSM was more 3
stable than in a buffer solution and in a non-carbonated soft drink. The protective effect 4
of maltodextrins towards anthocyanin degradation was demonstrated in the solid state 5
(Souza et al., 2014; Souza et al., 2015; Sanchez et al., 2015). It may be postulated that 6
the presence of a maltodextrin carrier decreased the rate for anthocyanin degradation, 7
even in a water solution. As observed for both heat treatments at high temperatures and 8
also storage, black carrot anthocyanins exhibited higher stability than the grape skin 9
anthocyanins present in GSM. However, black carrots are a source of anthocyanins that 10
can also be consumed. From a bio-economy perspective, the use of grape skin 11
anthocyanins as a colouring agent remains of particular interest as this source is a by-12
product that accumulates in large amounts and has a low commercial value. 13
4. Conclusion 14
Maltodextrin-encapsulated grape skin phenolics were applied as a functional coloured 15
ingredient for an apple puree and were characterized by their stability under heat 16
treatment and storage conditions. High levels of anthocyanins and grape flavonoids 17
were formulated in the puree, and good processing and storage stability of these 18
molecules were observed compared with similar fortified juices and beverages. It may 19
be concluded that the use of grape skin phenolics as a sustainable low-cost ingredient 20
could meet the industrial demand for natural colouring agents and health-promoting 21
compounds. 22
23
References 24

20
Aizpurua-Olaizola, O., Navarro, P., Vallejo, A., Olivares, M., Etxebarria, N., & 1
Usobiaga, A. (2016). Microencapsulation and storage stability of polyphenols 2
from Vitis vinifera grape wastes. Food Chemistry, 190, 614–621. 3
Amendola, D., De Faveri, D. M., & Spigno, G. (2010). Grape marc phenolics: 4
extraction kinetics, quality and stability of extracts. Journal of Food 5
Engineering, 97, 384–392. 6
Bevilacqua, A., & Corbo, M. R. (2011). Characterization of a wild strain of 7
Alicyclobacillus acidoterrestris: Heat resistance and implications for tomato 8
juice. Journal of Food Science, 76, 130–136. 9
Busso Casati, C., Baeza, R., Sanchez, V., Catalano, A., López, P., & Zamora, M. C. 10
(2015). Thermal degradation kinetics of monomeric anthocyanins, colour 11
changes and storage effect in elderberry juices. Journal of Berry Research, 5, 12
29–39. 13
Cano-Chauca, M., Stringheta, P.C., Ramos, A.M., & Cal-Vidal, J. (2005). Effect of the 14
carriers on the microstructure of mango powder obtained by spray drying and its 15
functional characterization. Innovative Food Science and Emerging Technology, 16
5, 420–428. 17
Castaneva-Ovando, A., Pacheco-Hernandez, M. D., Paez-Hernandez, M. E., Rodriguez, 18
J. A., & Galan-Vidal, C. A. (2009). Chemical studies of anthocyanins: A review. 19
Food Chemistry, 113, 859-871. 20
Celli, G. B., Dibazar, R., Ghanem, A., & Brooks, M. S. (2016). Degradation kinetics of 21
anthocyanins in freeze-dried microencapsulates from Lowbush Blueberries 22
(Vaccinium angustifolium Aiton) and Prediction of Shelf-Life. Drying 23
Technology, DOI: 10.1080/07373937.2015.1099546 24
Celli, G. B., Ghanem, A., & Brooks M. S. (2016). Optimized encapsulation of 25
anthocyanin- rich extract from haskap berries (Lonicera caerulea L.) in calcium-26

21
alginate microparticles. Journal of Berry Research, DOI: 10.3233/JBR-150107, 1
in press. 2
3 Dyrby, M., Westergaard, N., & Stapelfeldt, H. (2001). Light and heat sensitivity of red 4
cabbage extract in soft drink model systems. Food Chemistry, 72, 431-437. 5
Ferrer, J., Paez, G., Marmol, Z., Ramones, E., Chandler, C., Marin, M., & Ferrer, A. 6
(2001). Agronomic use of biotechnologically processed grape wastes. 7
Bioresource Technology, 76, 39–44. 8
Fiori, L., Valbusa, M., & Castello, D. (2012). Supercritical water gasification of 9
biomass for H2 production: process design. Bioresource Technology, 121, 139–10
147. 11
Galanakis, C. M. (2015). Separation of functional macromolecules and micromolecules: 12
From ultrafiltration to the border of nanofiltration. Trends in Food Science & 13
Technology, 42, 44-63. 14
Gaze, J. E., & Betts, G. D. (1992). Food Pasteurisation Treatments, Gloucestershire. 15
United Kingdom: Campden Food and Drink Research Association Technical 16
Manual No. 27. 17
Guerrieri, N., Eynard, L., Lavelli, V., & Cerletti, P. (1997). Interaction of protein and 18
starch studied through amyloglucosidase action. Cereal Chemistry, 74, 846-850. 19
Howard, L. R., Brownmiller, C., & Prior R. L. (2014). Improved color and anthocyanin 20
retention in strawberry puree by oxygen exclusion. Journal of Berry Research, 21
4, 107–116. 22
Kammerer, D., Claus, A., Carle, R., & Schieber, A. (2004). Polyphenol screening of 23
pomace from red and white grape varieties (Vitis vinifera L.) by HPLC-DAD-24
MS/MS. Journal of Agricultural and Food Chemistry, 52, 4360–4367. 25

22
Kırca, A., Ozkan, M., & Cemeroglu, B. (2006). Stability of black carrot anthocyanins in 1
various fruit juices and nectars. Food Chemistry, 97, 598–605. 2
Konczak I., & Zhang, W. (2004). Anthocyanins - More than nature's colours. Journal of 3
Biomedicine and Biotechnology, 5, 239-240. 4
Kuck, L. S., & Norena, C. P. Z. (2016). Microencapsulation of grape (Vitis labrusca 5
var. Bordo) skin phenolic extract using gum arabic, polydextrose, and partially 6
hydrolyzed gum as encapsulating agents. Food Chemistry, 194, 569–576. 7
Kwon, Y.-I., Apostolidis, E., & Shetty, K. (2008). In vitro studies of eggplant (Solanum 8
melongena) phenolics as inhibitors of key enzymes relevant for type 2 diabetes 9
and hypertension. Bioresource Technology, 99, 2981–2988. 10
Lavelli, V. (2008). Antioxidant activity of minimally processed red chicory (Cichorium 11
intybus L.) evaluated in xanthine oxidase-, myeloperoxidase-, and diaphorase-12
catalyzed reactions. Journal of Agricultural and Food Chemistry, 56, 7194-13
7200. 14
Lavelli, V., & Torresani, M. C. (2011). Modelling the stability of lycopene-rich by-15
products of tomato processing. Food Chemistry, 125, 529-535. 16
Lavelli, V., & Vantaggi, C. (2009). Rate of antioxidant degradation and color variations 17
in dehydrated apples as related to water activity. Journal of Agricultural Food 18
Chemistry, 57, 4733−4738. 19
Lee, J., Durst, R.W., & Wrolstad, R. E. (2005). Determination of natural colorants, total 20
monomeric anthocyanin pigment content of fruit juice, beverages, and wines by 21
the pH differential method: collaborative study. Journal of AOAC International, 22
88, 1269–1278. 23
Maccarone, E., Maccarone, A., & Rapisarda, P. (1985). Stabilization of anthocyanins of 24
blood orange fruit juice. Journal of Food Science, 50, 901–904. 25
23
Nayak, B., Liu, R. H., & Tang, J. (2015). Effect of processing on phenolic antioxidants 1
of fruits, vegetables, and grains—A review. Critical Reviews in Food Science 2
Nutrition, 55, 887–918. 3
Patras, A., Brunton, N. P., O’Donnel, C., & Tiwari, B. K. (2010). Effect of thermal 4
processing on anthocyanin stability in foods; mechanisms and kinetics of 5
degradation. Trends in Food Science and Technology, 21, 3–11. 6
Reyes, L. F., & Cisneros-Zevallos, L. (2007). Degradation kinetics and colour of 7
anthocyanins in aqueous extracts of purple- and red-flesh potatoes (Solanum 8
tuberosum L.). Food Chemistry, 100, 885–894. 9
Sadilova, E., Stintzing, F. C., & Carle, R. (2006). Thermal degradation of acylated and 10
nonacylated anthocyanins. Journal of Food Science, 71, C504-C512. 11
Sanchez, V., Baeza, R., & Chirife J. (2015). Comparison of monomeric anthocyanins 12
and colour stability of fresh, concentrate and freeze-dried encapsulated cherry 13
juice stored at 38 °C. Journal of Berry Research, 5, 243–251. 14
Schilling, S, Schmid, S, Jager, H., Ludwig, M., Dietrich H., Toepfl S., Knorr D., 15
Neidhart S., Schieber A., & Carle R. (2008). Comparative Study of Pulsed 16
Electric Field and Thermal Processing of Apple Juice with Particular 17
Consideration of Juice Quality and Enzyme Deactivation. Journal of 18
Agricultural and Food Chemistry, 56, 4545–4554. 19
Silva, F. V. M., & Gibbs, P. (2004). Target selection in designing pasteurization 20
processes for shelf-stable high-acid fruit products. Critical Reviews in Food 21
Science and Nutrition, 44, 353–360. 22
Souza, V. B., Fujita, A., Thomazini, M., da Silva, E. R., Lucon, J. F., Genovese, M. I., 23
& Favaro-Trindade, C. S. (2014). Functional properties and stability of spray-24
dried pigments from Bordo grape (Vitis labrusca) winemaking pomace. Food 25
Chemistry, 164, 380–386. 26
24
Souza, V. B., Thomazini, M., de Carvalho Balieiro, J. C., & Fávaro-Trindade, C. S. 1
(2015). Effect of spray drying on the physicochemical properties and color 2
stability of the powdered pigment obtained from vinification byproducts of the 3
Bordo grape (Vitis labrusca). Food and Bioproducts Processing, 93, 39–50. 4
Spagna, G., Barbagallo, R. N., Todaro, A., Durante, M. J., & Pifferi, P. G. (2003). A 5
method for anthocyanin extraction from fresh grape skin. Italian Journal of 6
Food Science, 15, 337-346. 7
Spigno, G., Amendola D., Dahmoune F., & Jauregi P. (2015). Colloidal gas aphrons 8
based separation process for the purification and fractionation of natural 9
phenolic extracts. Food and Bioproducts Processing, 94, 434-442. 10
Spigno, G., Donsì, F., Amendola, D., Sessa. M., Ferrari, & De Faveri, M. D. (2013). 11
Nanoencapsulation systems to improve solubility and antioxidant efficiency of a 12
grape marc extract into hazelnut paste. Journal of Food Engineering, 114, 207–13
214. 14
Sri Harsha, P. S. C., Gardana, C., Simonetti, P., Spigno, G., & Lavelli, V. (2013). 15
Characterization of phenolics, in vitro reducing capacity and anti-glycation 16
activity of red grape skins recovered from winemaking by-products. Bioresource 17
Technology, 140, 263-268. 18
Stintzing, F. C., Stintzing, A. S., Carle, R., Frei, B., & Wrolstad, R. E. (2002). Color 19
and antioxidant properties of cyanidin-based anthocyanin pigments. Journal of 20
Agricultural and Food Chemistry, 50, 6172–6181. 21
Teixeira, A., Baenas, N., Dominguez-Perles, R., Barros A., Rosa E., Moreno D. A., & 22
Garcia-Viguera, C. (2014). Natural bioactive compounds from winery by-23
products as health promoters: A review. International Journal of Molecular 24
Sciences, 15, 15638-15678. 25
25
Travaglia, F., Bordiga, M., Locatelli, M., Coïsson, J. D., & Arlorio, M. (2011). 1
Polymeric proanthocyanidins in skins and seeds of 37 Vitis vinifera L. cultivars: 2
a methodological comparative study. Journal of Food Science, 76, C742-9. 3
Tseng, A., & Zhao, Y. (2013). Wine grape pomace as antioxidant dietary fibre for 4
enhancing nutritional value and improving storability of yogurt and salad 5
dressing. Food Chemistry, 138, 356–365. 6
Zafra-Stone, S., Yasmin, T., Bagchi, M., Chatterjee, A., Vinson, J. A., & Bagchi, D. 7
(2008). Berry anthocyanins as novel antioxidants in human health and disease 8
prevention. Molecular Nutrition and Food Research, 51, 675-683. 9
10
26
Figure Legends 1
2
Fig. 1 SEM image of maltodextrin-encapsulated grape skin phenolics. 3
4
Fig. 2. Time/temperature curves (●) for apple puree treatments and corresponding 1/D 5
values (▲) of the target microorganism Alicyclobacillus acidoterrestris. The areas under 6
the grey curves represent the decimal reductions for the target microorganism, 7
respectively: 3 D (A), 6 D (B) and 14 D (C). 8
9
Fig. 3. First-order degradation of monomeric anthocyanins (A) and total anthocyanins 10
(B) during storage at 15 °C (▲), 25 (♦) and 35 °C (●) and Arrhenius plot (C) for 11
monomeric anthocyanin (□) and total anthocyanin (○) degradation. 12
27
Table 1. Phenolic and HMF contents (mg/kg d.w.) and FRAP values (meq FeSO4/kg d.w.) of apple puree before and after heat treatments
corresponding to 6 D and 14 D reductions of the target microorganism A. acidoterrestris and of the 14 D treated apple puree after storage for 1
month at 15, 25 and 35 °C.
The results are expressed as the average ± SE. Different letters within the same row indicate significant differences (LSD; p < 0.05). The values in
brackets indicate the percentage of retention with respect to raw puree for the 6 D and 14 D treated purees and with respect to the 14 D treated puree for
the 1-month stored purees (when no value is indicated, the decrease was not significant).
Heat Treatment Intensity 1-Month Storage
Raw 6 D 14 D 15 °C 25 °C 35 °C
Flavanols
C 57c ± 3 46b ± 1 (80) 46b ± 2 (80) 20a ± 1 (43) 21a ± 2 (46) 22a ± 1 (48)
PC B2 180d ± 10 169cd ± 5
162c ± 6 (89) 87b ± 1 (54) 76b ± 4 (47) 56a ± 6 (35)
EC 245b ± 25 210b ± 1
187b ± 31 146a ± 1 (78) 128a ± 6 (68) 117a ± 17 (62)
Proanthocyanins 5000b ± 100 4900b ± 130 5000b ± 100 5000b ± 100 4900b ± 100 3300a ± 140 (66)
Hydroxycinnamic acid
Ch 1016a ± 22 1016a ± 63 1086a ± 73 1100a ± 60 1084a ± 70 1080a ± 50
Dihydrochalcones
Ph-xglc 282a ± 11 255a ± 22 244a ± 17 243a ± 4 242a ± 24 244a ± 3
Ph-glc 457a ± 36 408a ± 26
396a ± 27
399a ± 7
398a ± 63
396a ± 27
Total phenolics 8100c ± 140 7500bc ± 110 7200bc ± 300 7400bc ± 100 6440b ± 630 4900a ± 500 (65)
FRAP values 55e ± 1 46d ± 2 (83) 38c ± 2 (68) 33b ± 1 (88) 32b ± 1 (85) 25a ± 1 (67)
HMF
12a ± 3
31b ± 1
47c ± 3
81d ± 4
109e ± 6
28
Table 2. Phenolic and HMF contents (mg/kg d.w.) and FRAP values (meq FeSO4/kg d.w.) of apple puree added with maltodextrin-encapsulated grape
skin phenolics (GSM) before and after heat treatments corresponding to 6 D and 14 D reductions of the target microorganism A. acidoterrestris and of
the 14 D treated apple puree after storage for 1 month at 15, 25 and 35 °C.
Heat Treatment Intensity 1-Month Storage
raw 6 D 14 D 15 °C 25 °C 35 °C
Anthocyanins
Dp-glc 89d ± 16 77cd ± 3 67c ± 1 (75) 33b ± 5 (50) 18ab ± 1 (27) 8a ± 1 (12)
Cy-glc 34e ± 5 30de ± 1 29d ± 1 (85) 15c ± 2 (54) 10b ± 1 (35) 4a ± 1 (13)
Pt-glc 123f ± 3 105e ± 3 (85) 85d ± 1 (69) 47c ± 3 (56) 24b ± 1 (29) 12a ± 1 (14)
Pn-glc 56e ± 5 45d ± 3 (80) 35c ± 1 (62) 22b ± 3 (63) 11a ± 1 (33) 6a ± 1 (17)
Mv-glc 293e ± 28 238d ± 16 (81) 213d ± 1 (73) 138c ± 5 (65) 76b ± 2 (36) 35a ± 1 (16)
Mv-pc-glc 59d ± 7 51d ± 3
40c ± 3 (69) 27b ± 3 (67) 19b ± 1 (47) 6a ± 2 (16)
Monomers 654f ± 64 547e ± 9 (84) 468d ± 4 (72) 283c ± 32 (60) 159b ± 6 (34) 71a ± 5 (15)
Total 1136f ± 50 949e ± 16 (84) 773d ± 10 (68) 619c ± 3 (80) 476b ± 7 (62) 362a ± 5 (47)
Flavanols
C 180c ± 3 160c ± 6 167bc ± 2 159bc ± 8 141b ± 2
94a ± 21 (56)
PC B2 174b ± 7 157b ± 10 168b ± 7 149b ± 4 104a ± 1 (62) 91a ± 22 (54)
EC 254c ± 24 236c ± 31 229c ± 27 228c ± 3 184b ± 1 (80) 122a ± 2 (53)
Proanthocyanins 7100c ± 30 6900c ± 700 7000c ± 140 6900bc ± 140 6800bc ± 70 5100a ± 130 (74)
Flavonols
Q-gln + Q-glc 116a ± 3 120a ± 1 116a ± 1 117a ± 1 121a ± 7 117a ± 1
Q 151a ± 6 138a ± 1 150a ± 21 154a ± 8 160a ± 2 154a ± 8
K 28a ± 2 28a ± 2 29a ± 1 29a ± 2 28a ± 2 29a ± 2
Hydroxycinnamic acid
Ch 970a ± 1 979a ± 45 976a ± 51 979a ± 69 956a ± 39 949a ± 54
Dihydrochalcones
Ph-xglc 219a ± 22 226a ± 9 202a ± 56 215a ± 22 215a ± 22 200a ± 1
Ph-glc 354a ± 24 382a ± 16 330a ± 90 362a ± 33 362a ± 33 343a ± 2
Total phenolics 12950b ± 70 12500b ± 300 12400b ± 300
12400b ± 700 11800b ± 700 8230a ± 400 (64)
FRAP values 101d ± 1 97d ± 2
68c ± 2 (67) 49b ± 1 (72) 45b ± 1 (66) 40a ± 1 (59)
HMF
14a ± 2
32b ± 2
65c ± 6
82d ± 1
88d ± 3
The results are expressed as the average ± SE. Different letters within the same row indicate significant differences (LSD; p < 0.05)The values in
brackets indicate the percentage of retention with respect to raw puree for the 6 D and 14 D treated purees and with respect to the 14 D treated
puree for the 1-month stored purees (when no value is indicated, the decrease was not significant).

29
Table 3. First-order rate constants (k, d-1) at the specified temperature (T, °C) and activation energy (Ea, kJ/mol)
in the specified temperature range (T, °C) for total and monomeric anthocyanin degradation in liquid systems
under storage conditions.
The asterisk indicates that the value was calculated using the Arrhenius equation with the parameters provided in
the reference paper, while values without an asterisk were provided by the reference paper. The values found in
the present study are expressed as the average ± SD.
1
2
T k*103
Ea Temperature range Reference
Total anthocyanins
Grape water extract pH 3.0 25
35
14.4
35.6*
75.2
25 - 98 Reyes & Cisneros-Zevallos, 2007
Apple + GSM 15
25
35
7.1 ± 1.1
14.8 ± 2.5
24.2 ± 3.2
45.3 ± 4.3
15 - 35
Present study
Monomeric anthocyanins
Soft drink pH 3.0 25
35
57.6
158*
75.9
25 - 80 Dyrby et al., 2001
Buffer pH 3.0 25
35
86
135*
57.5
25 - 80 Dyrby et al., 2001
Apple + black carrot 18.7 °Brix 15
25
35
6.0*
17*
45*
72.7
4 - 37
Kırca et al., 2006
Apple + GSM 15
25
35
15.2 ± 3.1
34.4 ± 1.9
60.5 ± 5.8
51.0 ± 4.5
15 - 35
Present study

30
1
2
Fig. 1 SEM image of maltodextrin-encapsulated grape skin phenolics. 3
4
5
31
1 2
0
0.1
0.2
0.3
0.4
0.5
0.6
0
10
20
30
40
50
60
70
80
90
100
0 10 20 30 40
1/D
(m
in-1
)
Tem
per
atu
re ( C
)
time (min)
0
0.1
0.2
0.3
0.4
0.5
0.6
0
10
20
30
40
50
60
70
80
90
100
0 10 20 30 40
1/D
(m
in-1
)
Tem
per
atu
re ( C
)
time (min)
0
0.1
0.2
0.3
0.4
0.5
0.6
0
10
20
30
40
50
60
70
80
90
100
0 10 20 30 40
1/D
(m
in-1
)
Tem
per
atu
re ( C
)
time (min) 3
Fig. 2. Time/temperature curves (●) for apple puree treatments and corresponding 1/D values (▲) of the target microorganism 4 Alicyclobacillus acidoterrrestris. The areas under the grey curves represent the decimal reductions for the target microorganism, respectively: 5
3 D (A), 6 D (B) and 14 D (C). 6 7
8 9
10
A B C

32
1
-2
-1.8
-1.6
-1.4
-1.2
-1
-0.8
-0.6
-0.4
-0.2
0
0 10 20 30
ln (
C/C
o)
time (days)
-2
-1.8
-1.6
-1.4
-1.2
-1
-0.8
-0.6
-0.4
-0.2
0
0 10 20 30
ln (
C/C
o)
time (days)
-5.5
-5
-4.5
-4
-3.5
-3
-2.5
0.0032 0.0033 0.0034 0.0035
ln [
k],
d-1
1/T, K-1
2 3
Fig 3. First-order degradation of monomeric anthocyanins (A) and total anthocyanins (B) during storage at 15 °C (▲), 25 (♦) and 35 °C (●) and 4
Arrhenius plot (C) for monomeric anthocyanin (□) and total anthocyanin (○) degradation. 5 6
A B C
R2 0.981
R2 0.992
R2 0.922
R2 0.949
R2 0.945
R2 0.946
R2 0.992
R2 0.991
![Resistant Maltodextrin Alleviates Dextran Sulfate Sodium ...downloads.hindawi.com/journals/bmri/2020/7694734.pdfresistant maltodextrin) showed anticancer activity in vitro [18] and](https://img.pdfslide.us/doc/110x75/60693b01102554338e0fc375/resistant-maltodextrin-alleviates-dextran-sulfate-sodium-resistant-maltodextrin.jpg)