Embed Size (px)
Citation preview
Modelling the Soil-Plant-Atmosphere System: Prospects, Problems and Pitfalls
Clothier, B.E., S.R. Green and M. Deurer
Sustainable Land Use, HortResearch, PB 11-030, Palmerston North, New Zealand 4442 Email: [email protected]
Keywords: Measurement technologies, Decision Support Tools, soil, water, land use, contaminants
EXTENDED ABSTRACT
The soil-plant-atmosphere ecosystems which cloak the lands of our earth are the planet’s critical zones, and they provide valuable ecosystem services (NRC, 2004). Through these systems there are massive fluxes and storages of mass and energy, and these provide both valuable productive and ecosystem goods and services. The annual value of 17 terrestrial ecosystem services, all involving the soil-plant-atmosphere system, Costanza et al. (1997) estimated to be US$5.74 trillion. When oceanic services were added in, the global value of the earth-surface’s natural capital and ecosystem services amounted to US$33 trillion per year. Gross global productivity only sums to $18 trillion yr-1. Thus, understanding and managing the soil-plant-atmosphere system is critical, not only for our economic futures, but also for the health of our environment, and the wealth of our social systems (van der Velde et al. 2007). New Zealand’s former Parliamentary Commissioner for the Environment commented in 2004 that “…New Zealanders are highly dependent on our natural capital – our waters, soils and biodiversity – for sustaining wealth-generating capabilities [yet] our farming systems are financially and environmentally brittle [and] fundamental redesign of farming systems is required” (PCE, 2004). Quantitative modelling is a valuable means by which we can organise our knowledge so that it can be applied to manage better our productive ecosystems, and so that it can be used for developing policies, implementing actions, and monitoring outcomes to protect our natural capital and ecosystem services. There is a strong end-user pull for scientists to develop better models and sophisticated decision-support tools to realise these outcomes (Green et al., 2006). Huge prospects. Unfortunately, as Joseph Fourier (1768-1830) lamented, “… nature is indifferent to the difficulties it causes [modellers]”, for the fluxes
and fate of mass and energy in the soil-plant-atmosphere system are governed by a myriad of linked and non-linear processes. Not only is the ‘biophysics’ of the soil-plant-atmosphere system complex, but there is the end-user need for simple models to provide results at larger spatial scales and greater temporal orders than our detailed knowledge of the local mechanisms easily allows (Corwin, et al., 2006). Big problems. Fortunately, the computing power we currently have at our disposal, as evidenced by Moore’s Law, now more simply enables us to solve complex, non-linear, inter-dependent equations. But, there are pitfalls. In this address, we discuss how models can be used to describe fate and transport processes in the soil-plant-atmosphere systems. We draw from a range of examples to highlight prospects, problems and pitfalls. These include: the fluxes of water in the rootzones of grapevines and fruit trees and the need for sustainable irrigation; the transport of copper-chromium-arsenic (CCA) from treated-timber posts in vineyards and the need to protect soils and regional groundwater systems; valuing the natural capital of soil and its ecosystem services to quantify terroir in viticulture, as well as the catchment-scale, non-point source pollution of rivers as a result of nitrogen leakage from a mosaic of diverse farming enterprises. We show how detailed modelling can be used to reveal patterns and thresholds that permit the upscaling of knowledge in time and space via the application of simpler means, such as stochastic analyses, mass-balance schemes, ecological econometrics, and transfer functions. These larger-scale results are then more easily useable by end-users and policy agencies. Through our discussions of these we seek to refute Philip’s (1991) jeremiad that “… by 2066 we shall be deep into the electronic Dark Ages, [where modelling, the] shadow-boxing surrogate for science, [has led to] a battery of expert systems, some of them designed on the self-fulfilling premise that the user is an imbecile”.
k10
1. INTRODUCTION
Some 20% of New Zealand’s Gross Domestic Product (GDP) comes from the top 150 mm of our soil. The natural capital value and ecosystem goods and services provided by New Zealand’s soil-plant-atmosphere systems are our pots-of-gold. Over the last decade, agriculture has grown at twice the rate, about 4% per annum, more than twice that of other sectors of the economy. This growth spurt has been sustained by intensification of our existing land uses, and the move of intensive land uses onto new soils. Are these sustainable – either production-wise, or from an environmental perspective? Through intensification we can, as Hawken et al. (1999) suggest, “… temporarily exceed the carrying capacity of the earth, but put our natural capital into decline”. This is a fool’s paradise, for as Hawken et al. (1999) put it “… another way, the ability to accelerate a car that is low on gasoline does not prove the tank is full”. So it is imperative for our productive and ecological futures that we sustainably use our natural capital. Sustainable use of natural capital will derive from sound policies for resource management, and good land-management practices within agricultural enterprises. Modelling of the soil-plant-atmosphere systems that cloak our landscapes is a vital means by which we can develop good policies and sustainable practices (Green et al. 2006). There is a strong end-user pull for scientists to develop better models and sophisticated Decision-Support Tools (DST) to realise these outcomes (Green et al., 2006). Huge prospects. There is the end-user need for simple models to provide results at larger spatial scales and greater temporal orders than our detailed knowledge of the local mechanisms easily allows (Corwin, et al., 2006). Big problems. The computing power we currently have at our disposal, as evidenced by Moore’s Law, now more simply enables us to solve the complex, non-linear, inter-dependent equations that describe the state of, and fluxes through the soil-plant atmosphere system. But, there are pitfalls. We show how detailed modelling can be used to reveal patterns and thresholds that permit the upscaling of knowledge in time and space via the application of simpler means, such as stochastic analyses, mass-balance schemes, ecological econometrics, and transfer functions. These
larger-scale results are then more easily useable by end-users and policy agencies.
2. WATER – BLUE GOLD
The world’s consumption of water is doubling every 20 years, which is more than twice the rate of our population increase. New sources of water are becoming scarcer, or more expensive to treat and remediate. It is no wonder that water is being increasingly referred to as ‘blue gold’ (Barlow & Clarke, 2002; Vidal 2002). Soil is a buffer, and the first filter of the world’s water. In the soil-plant-atmosphere system, the key flux is that of water. Soil is both the bufferer and filterer of water (Clothier et al. 2008), as well as providing care and provisioning for the plant (Clothier & Green, 1997). The ecosystem goods and services provided to the plant by the atmosphere include incident sunlight and warmth, carbon supply, pollination resources, and a sink for oxygen and water (Green et al. 2008). Water is the key, and we need to protect its stocks and its quality. Here we discuss the modelling of the soil-plant-atmosphere system to protect water quantity and water quality through the development of good policy and sustainable practices.
3. WATER QUANTITY
Even under the conservative emissions scenarios and moderate storylines of the predictions of the Intergovernmental Panel on Climate Change (IPCC), say scenario B2 ( www.ipcc.ch ), there will, in the future, very likely be less precipitation in the major horticultural regions of the world: Chile, Argentina and South Africa, southeast Australia, eastern New Zealand, Mexico, California, and southern Europe. Already irrigation consumes 80% of the world’s fresh water, and in the future, water for irrigation will increasingly be in shorter supply, and there will be more strident demands for its use elsewhere, such as in urban areas, as well as the requirement for it to remain in situ to provide ecosystem services in our ground and surface water bodies. Measurements and modelling of the soil-plant-atmosphere system will enable us to allocate wisely our precious water resources and sustainably manage their uses for irrigation.
3.1. Measurements and Modelling
Moore’s Law states that the number of transistors in an integrated circuit doubles every 24 months.
k11
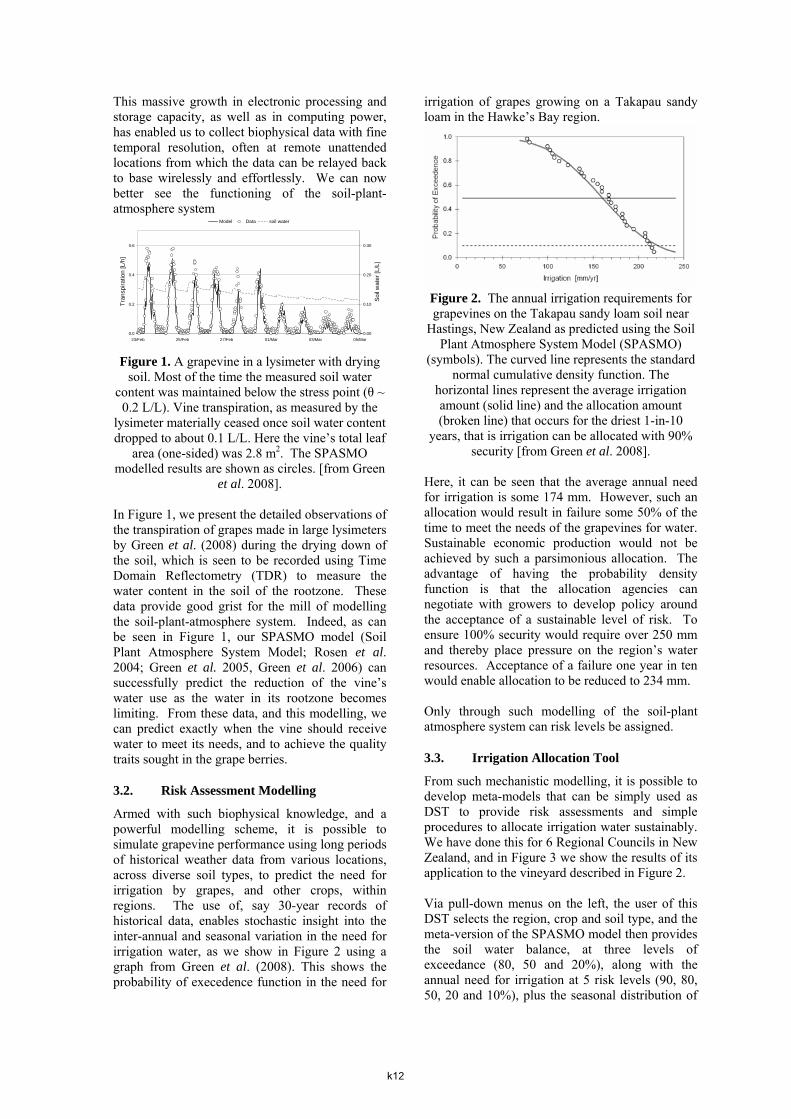
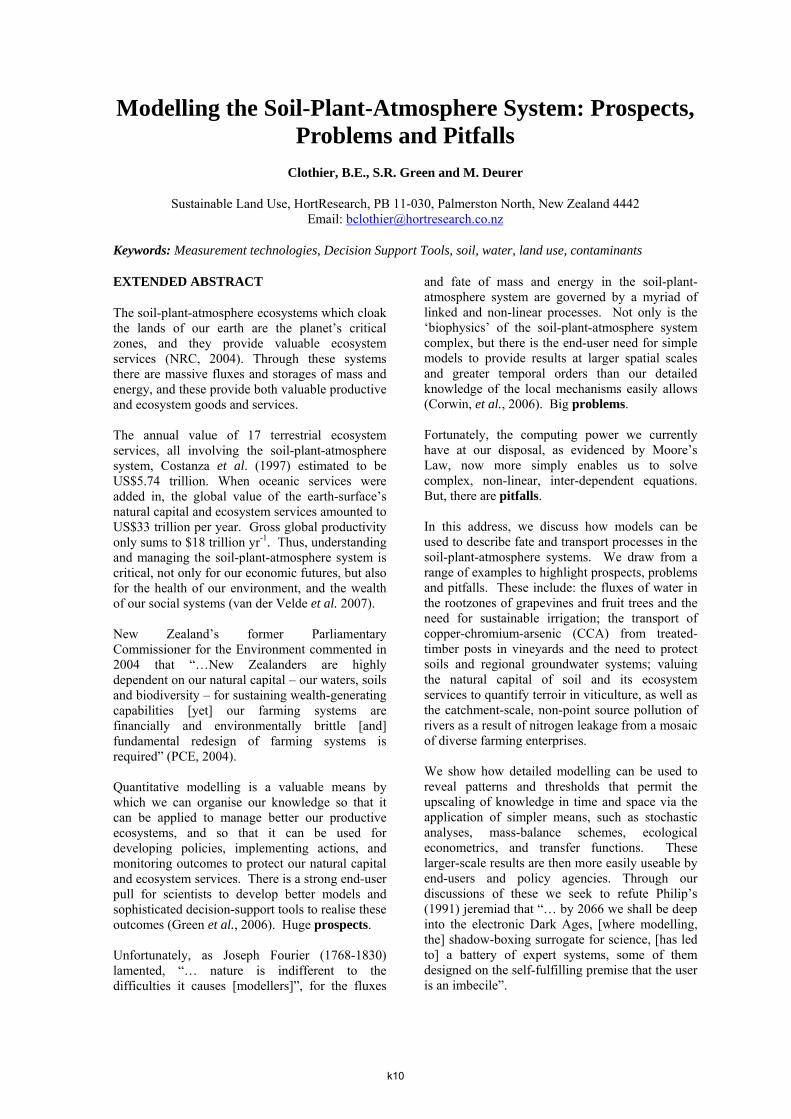
This massive growth in electronic processing and storage capacity, as well as in computing power, has enabled us to collect biophysical data with fine temporal resolution, often at remote unattended locations from which the data can be relayed back to base wirelessly and effortlessly. We can now better see the functioning of the soil-plant-atmosphere system Figure 1. A grapevine in a lysimeter with drying
soil. Most of the time the measured soil water content was maintained below the stress point (θ ~
0.2 L/L). Vine transpiration, as measured by the lysimeter materially ceased once soil water content dropped to about 0.1 L/L. Here the vine’s total leaf
area (one-sided) was 2.8 m2. The SPASMO modelled results are shown as circles. [from Green
et al. 2008]. In Figure 1, we present the detailed observations of the transpiration of grapes made in large lysimeters by Green et al. (2008) during the drying down of the soil, which is seen to be recorded using Time Domain Reflectometry (TDR) to measure the water content in the soil of the rootzone. These data provide good grist for the mill of modelling the soil-plant-atmosphere system. Indeed, as can be seen in Figure 1, our SPASMO model (Soil Plant Atmosphere System Model; Rosen et al. 2004; Green et al. 2005, Green et al. 2006) can successfully predict the reduction of the vine’s water use as the water in its rootzone becomes limiting. From these data, and this modelling, we can predict exactly when the vine should receive water to meet its needs, and to achieve the quality traits sought in the grape berries.
3.2. Risk Assessment Modelling
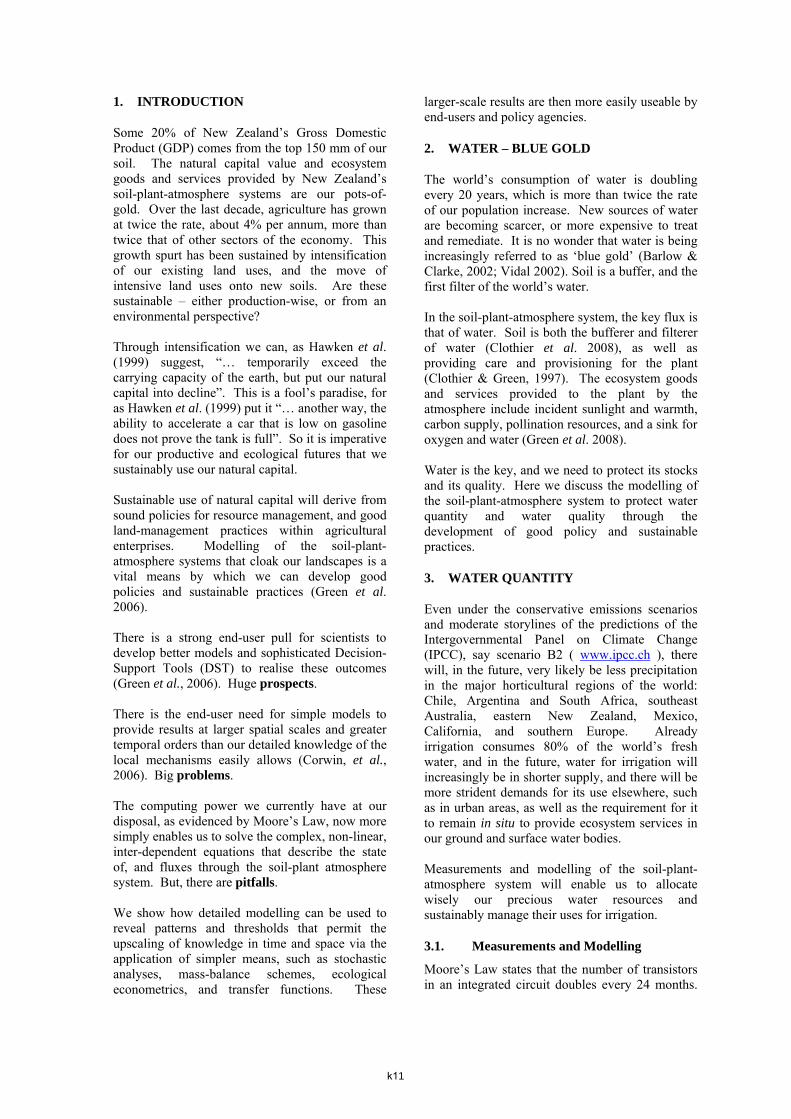
Armed with such biophysical knowledge, and a powerful modelling scheme, it is possible to simulate grapevine performance using long periods of historical weather data from various locations, across diverse soil types, to predict the need for irrigation by grapes, and other crops, within regions. The use of, say 30-year records of historical data, enables stochastic insight into the inter-annual and seasonal variation in the need for irrigation water, as we show in Figure 2 using a graph from Green et al. (2008). This shows the probability of execedence function in the need for
irrigation of grapes growing on a Takapau sandy loam in the Hawke’s Bay region.
Figure 2. The annual irrigation requirements for grapevines on the Takapau sandy loam soil near
Hastings, New Zealand as predicted using the Soil Plant Atmosphere System Model (SPASMO)
(symbols). The curved line represents the standard normal cumulative density function. The
horizontal lines represent the average irrigation amount (solid line) and the allocation amount (broken line) that occurs for the driest 1-in-10
years, that is irrigation can be allocated with 90% security [from Green et al. 2008].
Here, it can be seen that the average annual need for irrigation is some 174 mm. However, such an allocation would result in failure some 50% of the time to meet the needs of the grapevines for water. Sustainable economic production would not be achieved by such a parsimonious allocation. The advantage of having the probability density function is that the allocation agencies can negotiate with growers to develop policy around the acceptance of a sustainable level of risk. To ensure 100% security would require over 250 mm and thereby place pressure on the region’s water resources. Acceptance of a failure one year in ten would enable allocation to be reduced to 234 mm. Only through such modelling of the soil-plant atmosphere system can risk levels be assigned.
3.3. Irrigation Allocation Tool
From such mechanistic modelling, it is possible to develop meta-models that can be simply used as DST to provide risk assessments and simple procedures to allocate irrigation water sustainably. We have done this for 6 Regional Councils in New Zealand, and in Figure 3 we show the results of its application to the vineyard described in Figure 2. Via pull-down menus on the left, the user of this DST selects the region, crop and soil type, and the meta-version of the SPASMO model then provides the soil water balance, at three levels of exceedance (80, 50 and 20%), along with the annual need for irrigation at 5 risk levels (90, 80, 50, 20 and 10%), plus the seasonal distribution of
0.0
0.2
0.4
0.6
23/Feb 25/Feb 27/Feb 01/Mar 03/Mar 05/Mar
Tran
spira
tion
[L/h
]
0.00
0.10
0.20
0.30
Soil
wat
er [L
/L]
Model Data soil water
k12
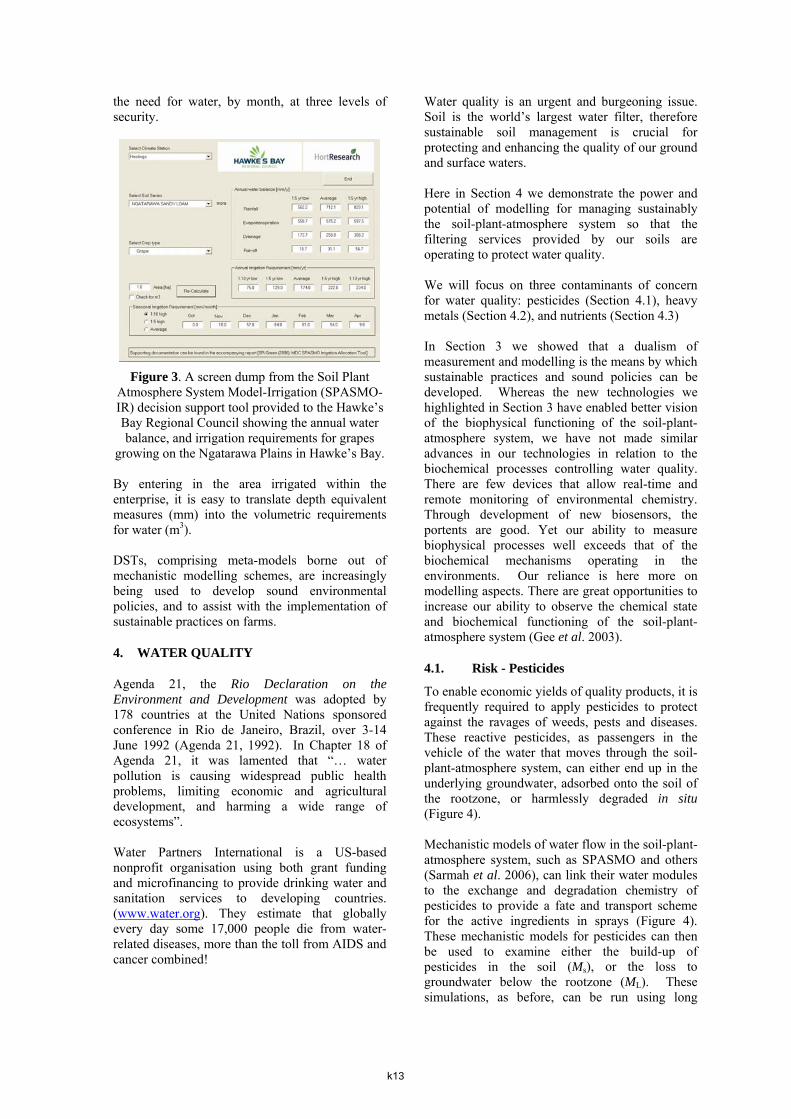
the need for water, by month, at three levels of security.
Figure 3. A screen dump from the Soil Plant Atmosphere System Model-Irrigation (SPASMO-IR) decision support tool provided to the Hawke’s Bay Regional Council showing the annual water balance, and irrigation requirements for grapes
growing on the Ngatarawa Plains in Hawke’s Bay. By entering in the area irrigated within the enterprise, it is easy to translate depth equivalent measures (mm) into the volumetric requirements for water (m3). DSTs, comprising meta-models borne out of mechanistic modelling schemes, are increasingly being used to develop sound environmental policies, and to assist with the implementation of sustainable practices on farms.
4. WATER QUALITY
Agenda 21, the Rio Declaration on the Environment and Development was adopted by 178 countries at the United Nations sponsored conference in Rio de Janeiro, Brazil, over 3-14 June 1992 (Agenda 21, 1992). In Chapter 18 of Agenda 21, it was lamented that “… water pollution is causing widespread public health problems, limiting economic and agricultural development, and harming a wide range of ecosystems”. Water Partners International is a US-based nonprofit organisation using both grant funding and microfinancing to provide drinking water and sanitation services to developing countries. (www.water.org). They estimate that globally every day some 17,000 people die from water-related diseases, more than the toll from AIDS and cancer combined!
Water quality is an urgent and burgeoning issue. Soil is the world’s largest water filter, therefore sustainable soil management is crucial for protecting and enhancing the quality of our ground and surface waters. Here in Section 4 we demonstrate the power and potential of modelling for managing sustainably the soil-plant-atmosphere system so that the filtering services provided by our soils are operating to protect water quality. We will focus on three contaminants of concern for water quality: pesticides (Section 4.1), heavy metals (Section 4.2), and nutrients (Section 4.3) In Section 3 we showed that a dualism of measurement and modelling is the means by which sustainable practices and sound policies can be developed. Whereas the new technologies we highlighted in Section 3 have enabled better vision of the biophysical functioning of the soil-plant-atmosphere system, we have not made similar advances in our technologies in relation to the biochemical processes controlling water quality. There are few devices that allow real-time and remote monitoring of environmental chemistry. Through development of new biosensors, the portents are good. Yet our ability to measure biophysical processes well exceeds that of the biochemical mechanisms operating in the environments. Our reliance is here more on modelling aspects. There are great opportunities to increase our ability to observe the chemical state and biochemical functioning of the soil-plant-atmosphere system (Gee et al. 2003).
4.1. Risk - Pesticides
To enable economic yields of quality products, it is frequently required to apply pesticides to protect against the ravages of weeds, pests and diseases. These reactive pesticides, as passengers in the vehicle of the water that moves through the soil-plant-atmosphere system, can either end up in the underlying groundwater, adsorbed onto the soil of the rootzone, or harmlessly degraded in situ (Figure 4). Mechanistic models of water flow in the soil-plant-atmosphere system, such as SPASMO and others (Sarmah et al. 2006), can link their water modules to the exchange and degradation chemistry of pesticides to provide a fate and transport scheme for the active ingredients in sprays (Figure 4). These mechanistic models for pesticides can then be used to examine either the build-up of pesticides in the soil (Ms), or the loss to groundwater below the rootzone (ML). These simulations, as before, can be run using long
k13
records of historical weather data so that the impact of timing, frequency and amount of active ingredient in sprays can easily be accounted for, along with the appropriate soil properties and cultural practices.
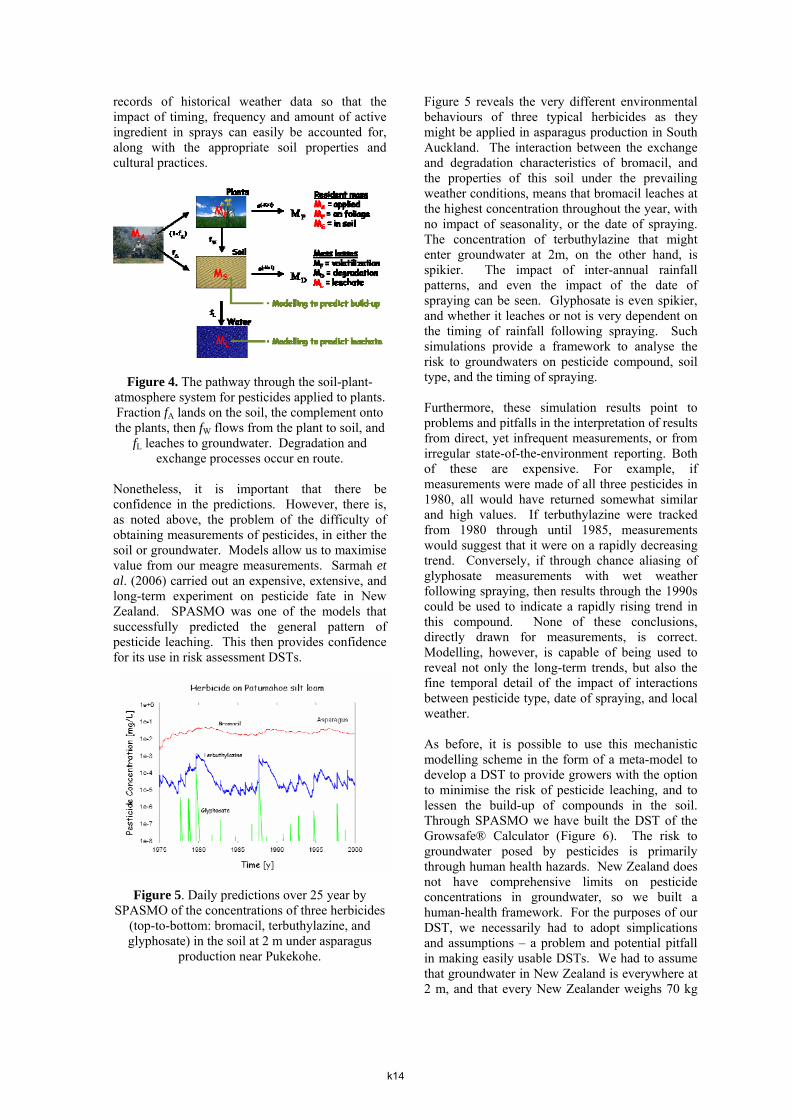
Figure 4. The pathway through the soil-plant-atmosphere system for pesticides applied to plants. Fraction fA lands on the soil, the complement onto the plants, then fW flows from the plant to soil, and
fL leaches to groundwater. Degradation and exchange processes occur en route.
Nonetheless, it is important that there be confidence in the predictions. However, there is, as noted above, the problem of the difficulty of obtaining measurements of pesticides, in either the soil or groundwater. Models allow us to maximise value from our meagre measurements. Sarmah et al. (2006) carried out an expensive, extensive, and long-term experiment on pesticide fate in New Zealand. SPASMO was one of the models that successfully predicted the general pattern of pesticide leaching. This then provides confidence for its use in risk assessment DSTs.
Figure 5. Daily predictions over 25 year by
SPASMO of the concentrations of three herbicides (top-to-bottom: bromacil, terbuthylazine, and glyphosate) in the soil at 2 m under asparagus
production near Pukekohe.
Figure 5 reveals the very different environmental behaviours of three typical herbicides as they might be applied in asparagus production in South Auckland. The interaction between the exchange and degradation characteristics of bromacil, and the properties of this soil under the prevailing weather conditions, means that bromacil leaches at the highest concentration throughout the year, with no impact of seasonality, or the date of spraying. The concentration of terbuthylazine that might enter groundwater at 2m, on the other hand, is spikier. The impact of inter-annual rainfall patterns, and even the impact of the date of spraying can be seen. Glyphosate is even spikier, and whether it leaches or not is very dependent on the timing of rainfall following spraying. Such simulations provide a framework to analyse the risk to groundwaters on pesticide compound, soil type, and the timing of spraying. Furthermore, these simulation results point to problems and pitfalls in the interpretation of results from direct, yet infrequent measurements, or from irregular state-of-the-environment reporting. Both of these are expensive. For example, if measurements were made of all three pesticides in 1980, all would have returned somewhat similar and high values. If terbuthylazine were tracked from 1980 through until 1985, measurements would suggest that it were on a rapidly decreasing trend. Conversely, if through chance aliasing of glyphosate measurements with wet weather following spraying, then results through the 1990s could be used to indicate a rapidly rising trend in this compound. None of these conclusions, directly drawn for measurements, is correct. Modelling, however, is capable of being used to reveal not only the long-term trends, but also the fine temporal detail of the impact of interactions between pesticide type, date of spraying, and local weather. As before, it is possible to use this mechanistic modelling scheme in the form of a meta-model to develop a DST to provide growers with the option to minimise the risk of pesticide leaching, and to lessen the build-up of compounds in the soil. Through SPASMO we have built the DST of the Growsafe® Calculator (Figure 6). The risk to groundwater posed by pesticides is primarily through human health hazards. New Zealand does not have comprehensive limits on pesticide concentrations in groundwater, so we built a human-health framework. For the purposes of our DST, we necessarily had to adopt simplications and assumptions – a problem and potential pitfall in making easily usable DSTs. We had to assume that groundwater in New Zealand is everywhere at 2 m, and that every New Zealander weighs 70 kg
k14

and drinks 2 litres of groundwater a day. With this schema, we then used a comprehensive Australian database of acceptable daily intake values for pesticides to assign a critical value (CV) for risk.
Figure 6. The chart screen of the Growsafe® Calculator as presented for the range of pesticides
applied to grapes growing on the Omahu gravels in Hawke’s Bay. The greatest risk is posed by
Fenamirol (top), yet it only reaches 4% of the critical value (CV).
The Growsafe® Calculator was developed in conjunction with policy agencies, chemical manufacturers, and the land-based industries. The latter provided the typical spray schedules for each crop type. In Figure 6, the Calculator is applied to grapes, and the range of herbicides, insecticides and fungicides are listed on the left, ranked according to their propensity to leach. This ranking enables the grower to add a third leg to their pesticide purchase decision. They would already be in possession of some knowledge about price and efficacy. The ranking in Figure 6 enables them to make a green choice to protect groundwater. The fungicide fenamirol is more a ‘leacher’ than the other fungicides. It would, therefore, seem to be the ‘greenest’ of purchase choices. However, even in terms of short-term risk, the 10% of worst days in the 30 year simulation, fenamirol only reaches 4% of its critical value. So these risk predictions can also be used in another sense. Because, the DST has identified low levels of leaching risk for the suite of pesticides used, the Calculator has provided a form of eco-verification that the industry can use to overcome ‘green’ market-entry regulations such as EUREGAP, or supermarket requirements for environmental credentials. Measurement of pesticides in soil and groundwater is both difficult and expensive. So, without modelling to complement our scarce measurements, it would be difficult to provide decision support for the selections of pesticides
which best protect the quality of receiving water bodies (Vanclooster et al. 2004).
4.2. Risk – Heavy Metals
Historically, metals or metalloids, have long been used as a means to control pests and disease. In 1882, the Bordeaux mixture of copper sulphate and slaked lime was developed to control fungal diseases in grapes. Copper is still in widespread use as a pesticide, especially in organic production systems, which do not use modern chemicals. Modern agricultural systems are sill using a wide range of heavy metals or metalloids, as part of their land management practices. Mercury has been used to coat seeds to protect them against fungal attack. Cadmium is a contaminant in superphosphate fertilisers. Zinc is used in drenches to protect animals from facial eczema, and other maladies. There are mounting concerns that heavy metal accumulation is affecting the biological functioning of our soils, and its impact on natural capital values Timber treated with copper chromium and arsenic (CCA) is widely used in agriculture, and especially in viticulture where CCA-treated posts are used to provide support for the grapevine trellises. Treated timber posts are used within vineyards at a spatial density of 580 posts per hectare, which for H4-treated posts results in an areal loading in the posts of 12 kg-Cu ha-1, 21 kg-Cr ha-1 and 17 kg-As ha-1. The posts are rammed into the soil to a depth of 600 mm. The Marlborough District Council (MDC) commissioned a survey to measure the levels of CCA in the soil surrounding the posts. Robinson et al. (2006) measured the metals in the soil close to the posts. Guideline values for the concentration of these metals in soil are provided for copper (1000 mg-Cu kg-1) and chromium (100 mg-Cr kg-
1) by the Australian National Environment and Protection Council (NEPC, 1999), and by the New Zealand Ministry of Health (MoH, 1997) for arsenic (30 mg-As kg-1). In the 112 soil samples of the survey of Robinson et al. (2006) there were no exceedances for copper, whereas 10% of the chromium samples were above the guideline value, and 65% of cores exceeded the arsenic value. Obviously, the CCA, and especially As, does leak out of the posts. From this programme of measurement, the MDC wished to know about the long-term impact of this leakage on the regional water resources. The Wairau aquifer which underlies many vineyards meets an aquiclude half way down the Wairau Valley, so the regional impact would be on both ground and surface waters. The MDC wished to know what the
k15
impact would be to the region’s main aquifers and surface waters after 500 years of using CCA-treated timber posts. They noted that the posts generally have a lifetime of around 20 years, so there is a 5% replacement rate for the posts. Necessarily then, to provide such a risk assessment would require simulation modelling. The results of this work are given in Clothier et al. (2006), and a synopsis of the modelling approach is given here. The modelling involved simulation using a mechanistic model of local leakage from the post into the soil, local transport though the soil with aggregation up to the scale of the vineyard and region, and the linking of this to the aquifer systems of the valley to determine whether the New Zealand Drinking Water Standard (NZDWS, MoH, 2000) of 10 µg-As l-1 would be exceeded.
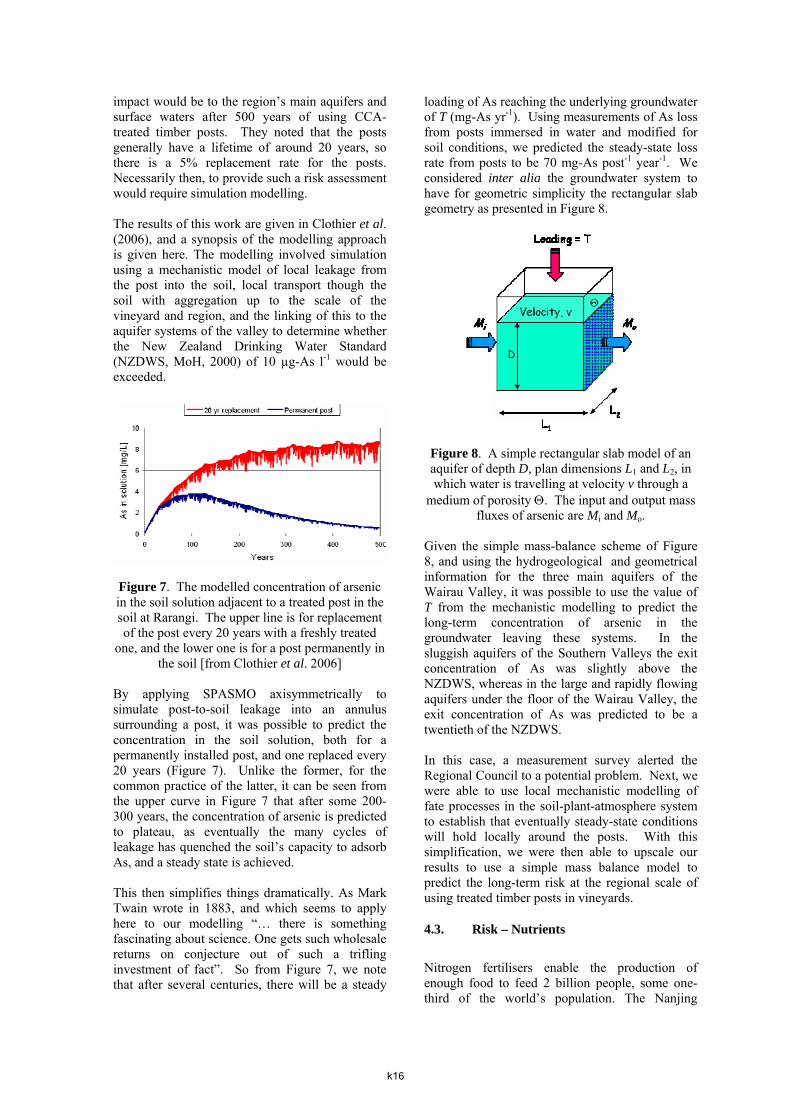
Figure 7. The modelled concentration of arsenic in the soil solution adjacent to a treated post in the soil at Rarangi. The upper line is for replacement of the post every 20 years with a freshly treated
one, and the lower one is for a post permanently in the soil [from Clothier et al. 2006]
By applying SPASMO axisymmetrically to simulate post-to-soil leakage into an annulus surrounding a post, it was possible to predict the concentration in the soil solution, both for a permanently installed post, and one replaced every 20 years (Figure 7). Unlike the former, for the common practice of the latter, it can be seen from the upper curve in Figure 7 that after some 200-300 years, the concentration of arsenic is predicted to plateau, as eventually the many cycles of leakage has quenched the soil’s capacity to adsorb As, and a steady state is achieved. This then simplifies things dramatically. As Mark Twain wrote in 1883, and which seems to apply here to our modelling “… there is something fascinating about science. One gets such wholesale returns on conjecture out of such a trifling investment of fact”. So from Figure 7, we note that after several centuries, there will be a steady
loading of As reaching the underlying groundwater of T (mg-As yr-1). Using measurements of As loss from posts immersed in water and modified for soil conditions, we predicted the steady-state loss rate from posts to be 70 mg-As post-1 year-1. We considered inter alia the groundwater system to have for geometric simplicity the rectangular slab geometry as presented in Figure 8. Figure 8. A simple rectangular slab model of an aquifer of depth D, plan dimensions L1 and L2, in which water is travelling at velocity v through a
medium of porosity Θ. The input and output mass fluxes of arsenic are Mi and Mo.
Given the simple mass-balance scheme of Figure 8, and using the hydrogeological and geometrical information for the three main aquifers of the Wairau Valley, it was possible to use the value of T from the mechanistic modelling to predict the long-term concentration of arsenic in the groundwater leaving these systems. In the sluggish aquifers of the Southern Valleys the exit concentration of As was slightly above the NZDWS, whereas in the large and rapidly flowing aquifers under the floor of the Wairau Valley, the exit concentration of As was predicted to be a twentieth of the NZDWS. In this case, a measurement survey alerted the Regional Council to a potential problem. Next, we were able to use local mechanistic modelling of fate processes in the soil-plant-atmosphere system to establish that eventually steady-state conditions will hold locally around the posts. With this simplification, we were then able to upscale our results to use a simple mass balance model to predict the long-term risk at the regional scale of using treated timber posts in vineyards.
4.3. Risk – Nutrients
Nitrogen fertilisers enable the production of enough food to feed 2 billion people, some one-third of the world’s population. The Nanjing
k16
Declaration on Nitrogen Management was signed in China on October 16, 2004 (Nanjing Declaration, 2004). The signatories of the Declaration, whilst acknowledging the vital role that nitrogen plays in the production of food and fibre, vowed to commit to facilitate the optimisation of nitrogen management in food and energy production and environmental production. The declaration was motivated by the increasing leakage of nutrients from the rootzone of farms, which is already a serious concern in many regions around the world. Elsewhere, it is a burgeoning issue as our surface and groundwaters are undergoing euthrophication from the increased nutrient loads resulting from agricultural intensification and the greater use of fertilisers. Nitrogen is of prime concern. In New Zealand, the application on nitrogen fertiliser to our agricultural lands has risen from under 50 MT-N year-1 in the late 1980s, to over 350 MT-N year-1. Roots are the big movers of water and nitrogen in the soil-plant-atmosphere system (Clothier & Green 1997). We have used SPASMO to model the nitrogen economy of many agricultural scenarios (Rosen et al. 2005, Green et al. 2005, Mills et al. 2005). For vineyards near Rarangi, we simulated the leachate leaving the rootzone of grapes receiving 40 kg-N ha-1 of calcium ammonium nitrate fertiliser in October of every year. SPASMO was run over a 30-year simulation period, and the concentration of nitrate in the leachate entering groundwater predicted as if the unconfined water-table were at the depths of either 2, 3, or 4m, as is common at various times throughout the year at Rarangi.
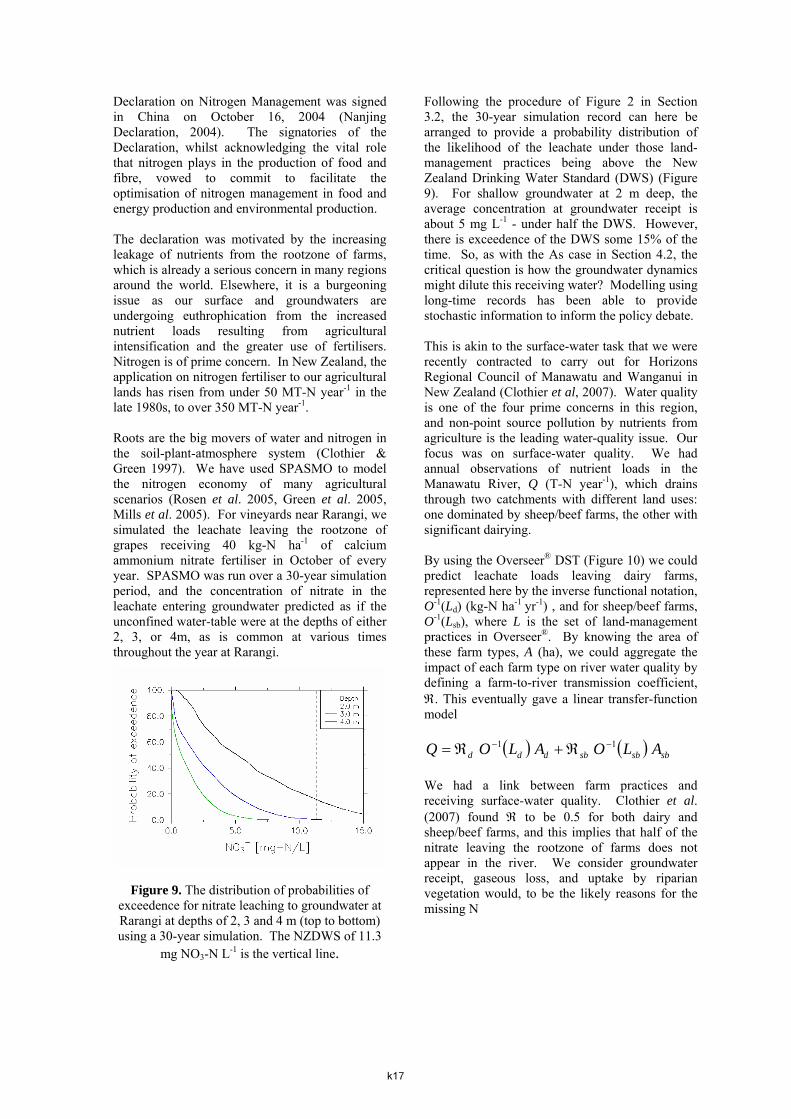
Figure 9. The distribution of probabilities of
exceedence for nitrate leaching to groundwater at Rarangi at depths of 2, 3 and 4 m (top to bottom) using a 30-year simulation. The NZDWS of 11.3
mg NO3-N L-1 is the vertical line.
Following the procedure of Figure 2 in Section 3.2, the 30-year simulation record can here be arranged to provide a probability distribution of the likelihood of the leachate under those land-management practices being above the New Zealand Drinking Water Standard (DWS) (Figure 9). For shallow groundwater at 2 m deep, the average concentration at groundwater receipt is about 5 mg L-1 - under half the DWS. However, there is exceedence of the DWS some 15% of the time. So, as with the As case in Section 4.2, the critical question is how the groundwater dynamics might dilute this receiving water? Modelling using long-time records has been able to provide stochastic information to inform the policy debate. This is akin to the surface-water task that we were recently contracted to carry out for Horizons Regional Council of Manawatu and Wanganui in New Zealand (Clothier et al, 2007). Water quality is one of the four prime concerns in this region, and non-point source pollution by nutrients from agriculture is the leading water-quality issue. Our focus was on surface-water quality. We had annual observations of nutrient loads in the Manawatu River, Q (T-N year-1), which drains through two catchments with different land uses: one dominated by sheep/beef farms, the other with significant dairying. By using the Overseer® DST (Figure 10) we could predict leachate loads leaving dairy farms, represented here by the inverse functional notation, O-1(Ld) (kg-N ha-1 yr-1) , and for sheep/beef farms, O-1(Lsb), where L is the set of land-management practices in Overseer®. By knowing the area of these farm types, A (ha), we could aggregate the impact of each farm type on river water quality by defining a farm-to-river transmission coefficient, ℜ. This eventually gave a linear transfer-function model
( ) ( ) sbsbsbddd ALOALOQ 11 −− ℜ+ℜ= We had a link between farm practices and receiving surface-water quality. Clothier et al. (2007) found ℜ to be 0.5 for both dairy and sheep/beef farms, and this implies that half of the nitrate leaving the rootzone of farms does not appear in the river. We consider groundwater receipt, gaseous loss, and uptake by riparian vegetation would, to be the likely reasons for the missing N
k17
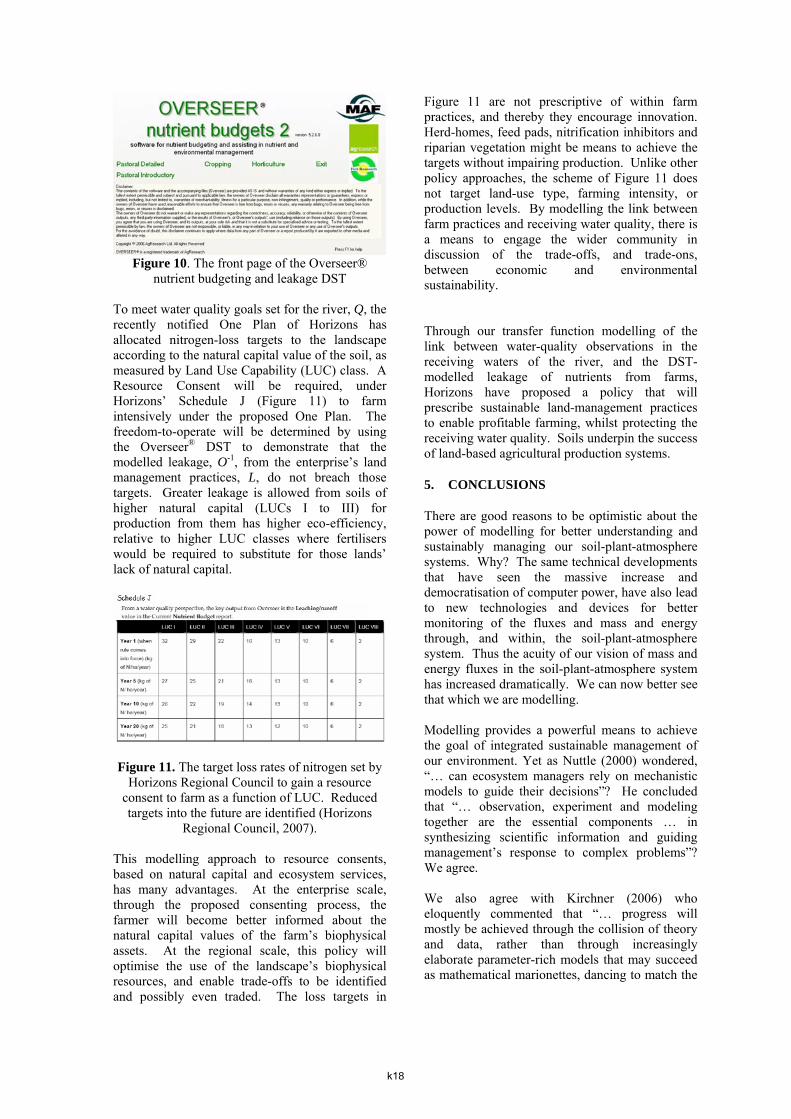
Figure 10. The front page of the Overseer®
nutrient budgeting and leakage DST
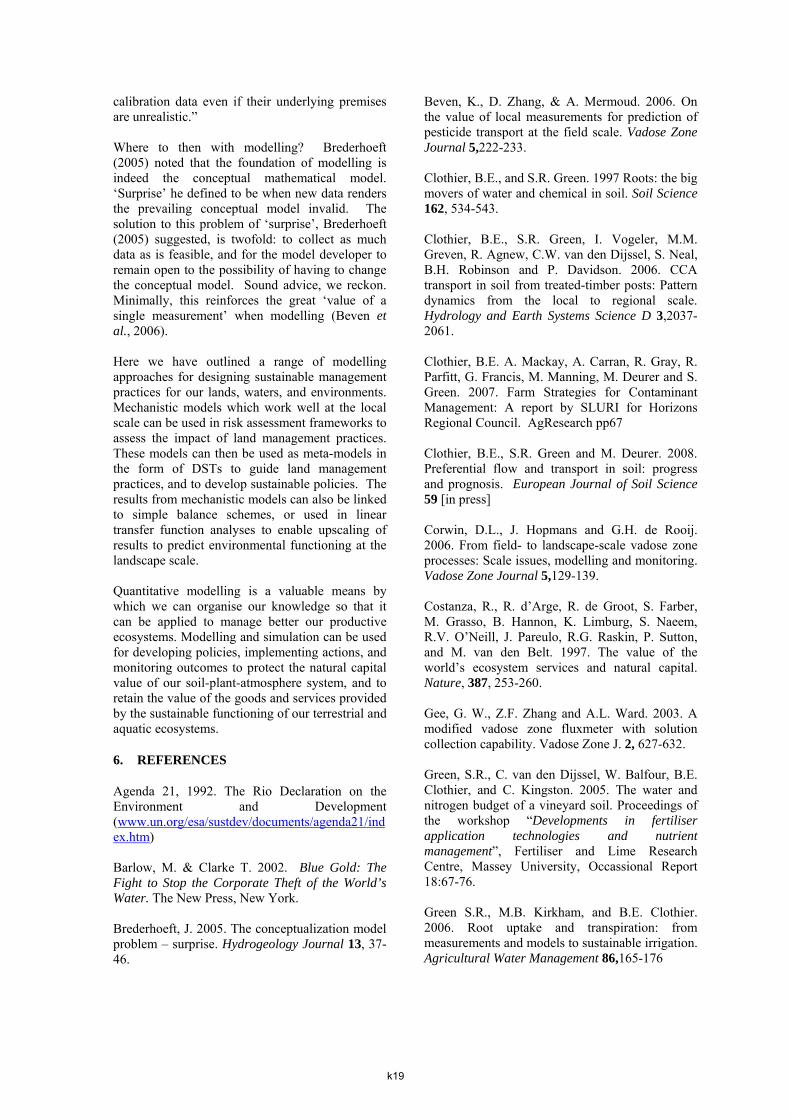
To meet water quality goals set for the river, Q, the recently notified One Plan of Horizons has allocated nitrogen-loss targets to the landscape according to the natural capital value of the soil, as measured by Land Use Capability (LUC) class. A Resource Consent will be required, under Horizons’ Schedule J (Figure 11) to farm intensively under the proposed One Plan. The freedom-to-operate will be determined by using the Overseer® DST to demonstrate that the modelled leakage, O-1, from the enterprise’s land management practices, L, do not breach those targets. Greater leakage is allowed from soils of higher natural capital (LUCs I to III) for production from them has higher eco-efficiency, relative to higher LUC classes where fertilisers would be required to substitute for those lands’ lack of natural capital.
Figure 11. The target loss rates of nitrogen set by
Horizons Regional Council to gain a resource consent to farm as a function of LUC. Reduced targets into the future are identified (Horizons
Regional Council, 2007). This modelling approach to resource consents, based on natural capital and ecosystem services, has many advantages. At the enterprise scale, through the proposed consenting process, the farmer will become better informed about the natural capital values of the farm’s biophysical assets. At the regional scale, this policy will optimise the use of the landscape’s biophysical resources, and enable trade-offs to be identified and possibly even traded. The loss targets in
Figure 11 are not prescriptive of within farm practices, and thereby they encourage innovation. Herd-homes, feed pads, nitrification inhibitors and riparian vegetation might be means to achieve the targets without impairing production. Unlike other policy approaches, the scheme of Figure 11 does not target land-use type, farming intensity, or production levels. By modelling the link between farm practices and receiving water quality, there is a means to engage the wider community in discussion of the trade-offs, and trade-ons, between economic and environmental sustainability. Through our transfer function modelling of the link between water-quality observations in the receiving waters of the river, and the DST-modelled leakage of nutrients from farms, Horizons have proposed a policy that will prescribe sustainable land-management practices to enable profitable farming, whilst protecting the receiving water quality. Soils underpin the success of land-based agricultural production systems.
5. CONCLUSIONS
There are good reasons to be optimistic about the power of modelling for better understanding and sustainably managing our soil-plant-atmosphere systems. Why? The same technical developments that have seen the massive increase and democratisation of computer power, have also lead to new technologies and devices for better monitoring of the fluxes and mass and energy through, and within, the soil-plant-atmosphere system. Thus the acuity of our vision of mass and energy fluxes in the soil-plant-atmosphere system has increased dramatically. We can now better see that which we are modelling. Modelling provides a powerful means to achieve the goal of integrated sustainable management of our environment. Yet as Nuttle (2000) wondered, “… can ecosystem managers rely on mechanistic models to guide their decisions”? He concluded that “… observation, experiment and modeling together are the essential components … in synthesizing scientific information and guiding management’s response to complex problems”? We agree. We also agree with Kirchner (2006) who eloquently commented that “… progress will mostly be achieved through the collision of theory and data, rather than through increasingly elaborate parameter-rich models that may succeed as mathematical marionettes, dancing to match the
k18
calibration data even if their underlying premises are unrealistic.” Where to then with modelling? Brederhoeft (2005) noted that the foundation of modelling is indeed the conceptual mathematical model. ‘Surprise’ he defined to be when new data renders the prevailing conceptual model invalid. The solution to this problem of ‘surprise’, Brederhoeft (2005) suggested, is twofold: to collect as much data as is feasible, and for the model developer to remain open to the possibility of having to change the conceptual model. Sound advice, we reckon. Minimally, this reinforces the great ‘value of a single measurement’ when modelling (Beven et al., 2006). Here we have outlined a range of modelling approaches for designing sustainable management practices for our lands, waters, and environments. Mechanistic models which work well at the local scale can be used in risk assessment frameworks to assess the impact of land management practices. These models can then be used as meta-models in the form of DSTs to guide land management practices, and to develop sustainable policies. The results from mechanistic models can also be linked to simple balance schemes, or used in linear transfer function analyses to enable upscaling of results to predict environmental functioning at the landscape scale. Quantitative modelling is a valuable means by which we can organise our knowledge so that it can be applied to manage better our productive ecosystems. Modelling and simulation can be used for developing policies, implementing actions, and monitoring outcomes to protect the natural capital value of our soil-plant-atmosphere system, and to retain the value of the goods and services provided by the sustainable functioning of our terrestrial and aquatic ecosystems.
6. REFERENCES
Agenda 21, 1992. The Rio Declaration on the Environment and Development (www.un.org/esa/sustdev/documents/agenda21/index.htm) Barlow, M. & Clarke T. 2002. Blue Gold: The Fight to Stop the Corporate Theft of the World’s Water. The New Press, New York. Brederhoeft, J. 2005. The conceptualization model problem – surprise. Hydrogeology Journal 13, 37-46.
Beven, K., D. Zhang, & A. Mermoud. 2006. On the value of local measurements for prediction of pesticide transport at the field scale. Vadose Zone Journal 5,222-233. Clothier, B.E., and S.R. Green. 1997 Roots: the big movers of water and chemical in soil. Soil Science 162, 534-543. Clothier, B.E., S.R. Green, I. Vogeler, M.M. Greven, R. Agnew, C.W. van den Dijssel, S. Neal, B.H. Robinson and P. Davidson. 2006. CCA transport in soil from treated-timber posts: Pattern dynamics from the local to regional scale. Hydrology and Earth Systems Science D 3,2037-2061. Clothier, B.E. A. Mackay, A. Carran, R. Gray, R. Parfitt, G. Francis, M. Manning, M. Deurer and S. Green. 2007. Farm Strategies for Contaminant Management: A report by SLURI for Horizons Regional Council. AgResearch pp67 Clothier, B.E., S.R. Green and M. Deurer. 2008. Preferential flow and transport in soil: progress and prognosis. European Journal of Soil Science 59 [in press] Corwin, D.L., J. Hopmans and G.H. de Rooij. 2006. From field- to landscape-scale vadose zone processes: Scale issues, modelling and monitoring. Vadose Zone Journal 5,129-139. Costanza, R., R. d’Arge, R. de Groot, S. Farber, M. Grasso, B. Hannon, K. Limburg, S. Naeem, R.V. O’Neill, J. Pareulo, R.G. Raskin, P. Sutton, and M. van den Belt. 1997. The value of the world’s ecosystem services and natural capital. Nature, 387, 253-260. Gee, G. W., Z.F. Zhang and A.L. Ward. 2003. A modified vadose zone fluxmeter with solution collection capability. Vadose Zone J. 2, 627-632. Green, S.R., C. van den Dijssel, W. Balfour, B.E. Clothier, and C. Kingston. 2005. The water and nitrogen budget of a vineyard soil. Proceedings of the workshop “Developments in fertiliser application technologies and nutrient management”, Fertiliser and Lime Research Centre, Massey University, Occassional Report 18:67-76. Green S.R., M.B. Kirkham, and B.E. Clothier. 2006. Root uptake and transpiration: from measurements and models to sustainable irrigation. Agricultural Water Management 86,165-176
k19
Green, S.R., B.E. Clothier, C. van den Dijssel, M. Deurer and P. Davidson. 2008. Measuerment and modelling the stress response of grapevines to soil-water deficits in their rootzone.. In: Modeling the response of crops to limited water: Recent advances in understanding and modelling water stress effects on plant growth processes, (ed. Laj Ahuja), Soil Science Society America, Madison, Wisconsin [in press] Growsafe® Calculator (http://www.growsafe.co.nz/projects/calculator.html) Hawken, P., A. Lovins and L.H. Hunter. 1999. Natural Capitalism, Little, Brown and Company, New York, pp396 Horizons Regional Council. 2007. One Plan, http://www.horizons.govt.nz/default.asp?pageid=217. Kirchner, J.W. 2006. Getting the right answers for the right reasons: Linking measurements, analyses, and models to advance the science of hydrology. Water Resources Research 42, W033SO4, doi:10.1029/2005WR004362. Mills, T.M., S.R. Green, C. van den Dijssel, M. Clearwater, P. Blattman, W. Snelgar, M. Astill, P. Prendergast, I. McIvor, S. Sivakumaran, I. Vogeler, B.H. Robinson, and B.E. Clothier. 2005. Fertiliser transport and fate in gold kiwifruit production systems. Proceedings of the workshop “Developments in fertiliser application technologies and nutrient management”, Fertiliser and Lime Research Centre, Massey University, Occassional Report 18,228-231. Ministry of Health. 1997. Health and Environmental Guidelines for Selected Timber Treatment Chemicals. June 1997, MoH, Wellington, pp 341. Ministry of Health. 2000. New Zealand Drinking Water Standards, MoH, Wellington. Nanjing Declaration on Nitrogen Management. 2004. www.initrogen.org/nanjing_declaration.0.html National Environmental Protection Council. 1999. Guidelines on the Investigation Levels for Soil and Groundwater Schedule B(1). Environmental Protection and Heritage Council (www.ephc.gov.au) .
National Research Council. 2004. Valuing ecosystem services: Toward better environmental decision making. National Academic Press, Washington, DC. Nuttle, W. 2000. EOS (Forum), American Geophysical Union, 81(25) Overseer® Nutrient Budget Version 5.2.6.0. www.agresearch.co.nz/overseerweb/modeldescription.aspx Parliamentary Commission for the Environment. 2004. Growing for Good. PCE, Wellington. Philip, J.R. 1991. Soils, natural science and models. Soil Science 151,91-98 Robinson, B.H., M.M. Greven, S.R. Green, S. Sivakumaran, P. Davidson, and B.E. Clothier. 2006. Leaching of copper, chromium and arsenic from treated timber vineyard posts in Marlborough, New Zealand, Science of the Total Environment 364,113-123 Rosen, M.R., R.R. Reeves, S.R. Green, B.E. Clothier and N. Ironside. 2004. Prediction of groundwater nitrate contamination after closure of an unlined sheep feedlot in New Zealand. Vadose Zone Journal 3, 990-1006 Sarmah, A.K., M.E. Close, R. Dann, L. Pang, and S.R. Green. 2006. Parameter estimation through inverse modelling of four leaching models using experimental data from two contrasting pesticide field trials in New Zealand. Australian Journal of Soil Research 44,581-597. Twain, Mark. 1883. Life on the Mississippi Vanclooster, M., J. Boesten, A. Tiktak, N. Jarvis, J.G. Kroes, R. Muñoz-Carpena, B.E. Clothier and S.R. Green. 2004. On the use of unsaturated flow and transport models in nutrient and pesticide management In Unsaturated zone modelling: Progress, Challenges and Applications (Eds R.A Feddes, G.H. Rooij, J.C. van Dam), Kluwer, pp 331-361. van der Velde, M., S.R. Green, M. Vanclooster and B.E. Clothier. 2007. Sustainable development in small island developing states: agricultural intensification, economic development and freshwater resources management on the coral atoll of Tongatapu. Ecological Economics 61,456-468
k20

Vidal, J. 2002. Blue gold: Earth’s liquid asset. The Guardian, August 22, 2002 At: http://www.guardian.co.uk/worldsummit2002/earth/story/0,,777661,00.html
k21