Embed Size (px)
Citation preview
University of Wollongong University of Wollongong
Research Online Research Online
SMART Infrastructure Facility - Papers Faculty of Engineering and Information Sciences
1-1-2014
Modelling the rejection of N-nitrosamines by a spiral-wound reverse Modelling the rejection of N-nitrosamines by a spiral-wound reverse
osmosis system: mathematical model development and validation osmosis system: mathematical model development and validation
Takahiro Fujioka University of Wollongong, [email protected]
Stuart J. Khan University of New South Wales, [email protected]
James A. McDonald University of New South Wales
Annalie Roux Seqwater
Yvan Poussade Veolia Water Australia, [email protected]
See next page for additional authors
Follow this and additional works at: https://ro.uow.edu.au/smartpapers
Part of the Engineering Commons, and the Physical Sciences and Mathematics Commons
Recommended Citation Recommended Citation Fujioka, Takahiro; Khan, Stuart J.; McDonald, James A.; Roux, Annalie; Poussade, Yvan; Drewes, Jorg E.; and Nghiem, Long D., "Modelling the rejection of N-nitrosamines by a spiral-wound reverse osmosis system: mathematical model development and validation" (2014). SMART Infrastructure Facility - Papers. 116. https://ro.uow.edu.au/smartpapers/116
Research Online is the open access institutional repository for the University of Wollongong. For further information contact the UOW Library: [email protected]
Modelling the rejection of N-nitrosamines by a spiral-wound reverse osmosis Modelling the rejection of N-nitrosamines by a spiral-wound reverse osmosis system: mathematical model development and validation system: mathematical model development and validation
Abstract Abstract A mathematical model was developed based on the irreversible thermodynamic principle and hydro- dynamic calculation to predict the rejection of N-nitrosamines by spiral-wound reverse osmosis (RO) membrane systems. The developed model is able to accurately describe the rejection of N-nitrosamines under a range of permeate flux and system recovery conditions. The modelled N-nitrosamine rejections were in good agreement with values obtained experimentally using a pilot-scale RO filtration system. Simulation from the model revealed that an increase in permeate flux from10 to 30L/m2h led to an increase in the rejection of low molecular weight N-nitrosamines such as N-nitrosodimethylamine (NDMA) (from31% to 54%), which was validated by experimental results. The modelling results also revealed that an increase in recovery caused a decrease in the rejection of these N-nitrosamines, which is consistent with the experimental results. Further modelling investigations suggested that NDMA rejection by a spiral-wound system can drop from 49% to 35% when the overall recovery increased from 10% to 50%. The model developed from this study can be a useful tool for water utilities and regulators fo rsystem design and evaluating the removal of N-nitrosamine by RO membranes.
Keywords Keywords reverse, validation, development, wound, spiral, nitrosamines, n, rejection, modelling, model, mathematical, system, osmosis
Disciplines Disciplines Engineering | Physical Sciences and Mathematics
Publication Details Publication Details Fujioka, T., Khan, S. J., McDonald, J. A., Roux, A., Poussade, Y., Drewes, J. E. & Nghiem, L. D. (2014). Modelling the rejection of N-nitrosamines by a spiral-wound reverse osmosis system: mathematical model development and validation. Journal of Membrane Science, 454 (March), 212-219.
Authors Authors Takahiro Fujioka, Stuart J. Khan, James A. McDonald, Annalie Roux, Yvan Poussade, Jorg E. Drewes, and Long D. Nghiem
This journal article is available at Research Online: https://ro.uow.edu.au/smartpapers/116
Modelling the rejection of N-nitrosamines by a Spiral-Wound
Reverse Osmosis System: Mathematical model development and
validation
Revised Manuscript Submitted to
Journal of Membrane Science
Dec 2013
Takahiro Fujioka 1, Stuart J. Khan 2, James A. McDonald 2, Annalie Roux 3,
Yvan Poussade 4, and Jörg E. Drewes 2, 5, Long D. Nghiem 1,*
1 Strategic Water Infrastructure Laboratory, School of Civil Mining and Environmental
Engineering, The University of Wollongong, NSW 2522, Australia
2 UNSW Water Research Centre, School of Civil and Environmental Engineering, The
University of New South Wales, NSW 2052, Australia
3 Seqwater, Level 2, 240 Margaret Street, Brisbane, QLD 4000, Australia
4 Veolia Water Australia, Level 15, 127 Creek Street, Brisbane, QLD 4000, Australia
5 Chair of Urban Water Systems Engineering, Technische Universität München, 85748
Garching, Germany
_______________________
* Corresponding author: Long Duc Nghiem, Email: [email protected], Ph +61 2 4221 4590
1
Abstract
A mathematical model was developed based on the irreversible thermodynamic principle and
hydrodynamic calculation to predict the rejection of N-nitrosamines by spiral-wound reverse
osmosis (RO) membrane systems. The developed model is able to accurately describe the
rejection of N-nitrosamines under a range of permeate flux and system recovery conditions.
The modelled N-nitrosamine rejections were in good agreement with values obtained
experimentally using a pilot-scale RO filtration system. Simulation from the model revealed
that an increase in permeate flux from 10 to 30 L/m2h led to an increase in the rejection of
low molecular weight N-nitrosamines such as N-nitrosodimethylamine (NDMA) (from 31 to
54%), which was validated by experimental results. The modelling results also revealed that
an increase in recovery caused a decrease in the rejection of these N-nitrosamines, which is
consistent with the experimental results. Further modelling investigations suggested that
NDMA rejection by a spiral-wound system can drop from 49 to 35% when the overall
recovery increased from 10 to 50%. The model developed from this study can be a useful tool
for water utilities and regulators for system design and evaluating the removal of N-
nitrosamine by RO membranes.
Keywords: Solute rejection modelling; NDMA; N-nitrosamines; reverse osmosis (RO);
spiral-wound elements; water reuse.
2
1. Introduction
Augmenting potable water sources using reclaimed water is an important part of the water
management portfolio in many regions of the world [1]. The planned use of reclaimed water
to augment water supply is stringently regulated for the protection of public health. Thus,
reclaimed water is commonly treated by a series of advanced treatment processes before
being added to aquifers or reservoirs as the source of potable water supply. In many cases,
these include reverse osmosis (RO) filtration to ensure the removal of pathogenic organisms,
total dissolved solids and trace organic chemicals [1-4]. N-nitrosodimethylamine (NDMA) is
one of several trace organic chemicals that are of particular concern due to its highly variable
rejection efficiency by RO membranes as reported in several recent pilot- and full-scale
studies [5-7]. NDMA is a disinfection by-product formed during the chloramination of
biologically treated effluent [8] and is often found in the RO feed at up to a few hundred parts
per trillion [9]. In addition to NDMA, other N-nitrosamines that are often present in raw
wastewater and secondary treated effluents including N-nitrosomethylethylamine (NMEA),
N-nitrosopyrrolidine (NPYR), N-nitrosodiethylamine (NDEA), N-nitrosopiperidine (NPIP),
N-nitrosomorpholine (NMOR), N-nitrosodipropylamine (NDPA) and N-nitrosodi-n-
butylamine (NDBA) [10-12]. Several of these N-nitrosamines (including NDMA) have been
classified as probable human carcinogens by the US EPA [13]. Thus, their concentrations in
drinking water have been regulated by regulatory authorities around the world. For examples,
the Australian Guidelines for Water Recycling have recommended their concentrations at 10
ng/L (NDMA and NDEA) and at 1 ng/L (NMOR) for the augmentation of drinking water
sources [14].
Modelling the rejection of N-nitrosamines under various conditions is essential for the design
of RO plants and compliance monitoring. NDMA and several other N-nitrosamines have
been frequently detected in the feed water to RO treatment at concentration higher than the
regulatory levels [15]. In addition, N-nitrosamine rejection by RO membranes is sensitive to
operating conditions and feed solution characteristics [16]. Difficulties associated with
analytical determination of N-nitrosamines in the permeate at regulatory concentrations (i.e. 1
to 10 ng/L) [5, 17, 18] also underscore the need for a model that can accurately describe the
rejection of N-nitrosamines. N-nitrosamine concentrations in aqueous samples can be
determined by chromatography (GC) or high pressure liquid chromatography (HPLC) with

3
tandem mass spectrometry (MS/MS) detector. However, the number of commercial
laboratories capable of trace level N-nitrosamine analysis is still limited and regular
monitoring of N-nitrosamines remains difficult and expensive. Thus, a capacity to describe
and predict the rejection of N-nitrosamines by the RO process is particularly useful for the
management of these trace organic chemicals in water recycling applications.
The rejection of inorganic salts by multi-stage RO membrane systems can be simulated with
a high level of accuracy using commercially available RO design software packages (e.g.
IMSDesign, TorayDS/DS2, and ROSA provided by Hydranautics, Toray, and Dow/FilmTec,
respectively). The development of mathematical models for simulating specific trace organic
and inorganic chemicals by spiral wound RO membrane systems has been reported in several
recent studies. Kim and co-workers have successfully developed a model for predicting boron
rejection by applying the irreversible thermodynamic principle and sub-dividing a spiral
wound element into a number of small sub-sections [19-21]. Using a similar approach,
Verliefde et al. [22] have also developed a full-scale rejection model for several
pharmaceutically active compounds (PhACs) using nanofiltration (NF) membranes. These
models significantly enhance our understanding of the permeation of boron and PhACs
through RO membranes under realistic conditions. However, to date, there have yet been any
software packages or mathematical models that can simulate the rejection of N-nitrosamines.
The aim of this study was to develop a mathematical model to predict the rejection of N-
nitrosamines by RO systems under a range of operating conditions. The developed model was
validated using experimental data obtained from a pilot RO system. The potential application
of this model for predicting N-nitrosamine rejection at full-scale level was also discussed.
2. Theoretical background
2.1. Membrane element characteristics
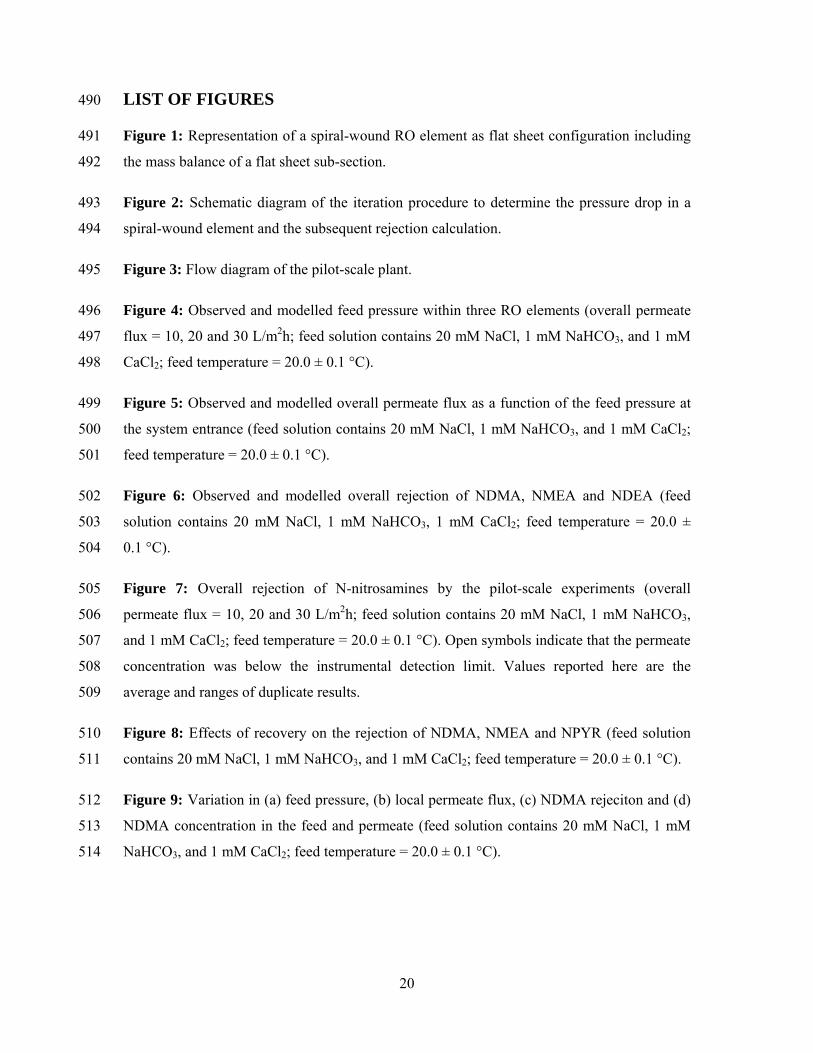
A commercial spiral-wound element has one or several membrane leaves. Each leaf consists
of two flat sheet membranes sealed on three sides with the forth side attached to a perforated
tube called the permeate collector. The membrane leaf is wound around the permeate
collector. As a result, each spiral-wound element can essentially be presented by a large flat
sheet membrane. In this study, each element is geometrically described with the length (L),
4
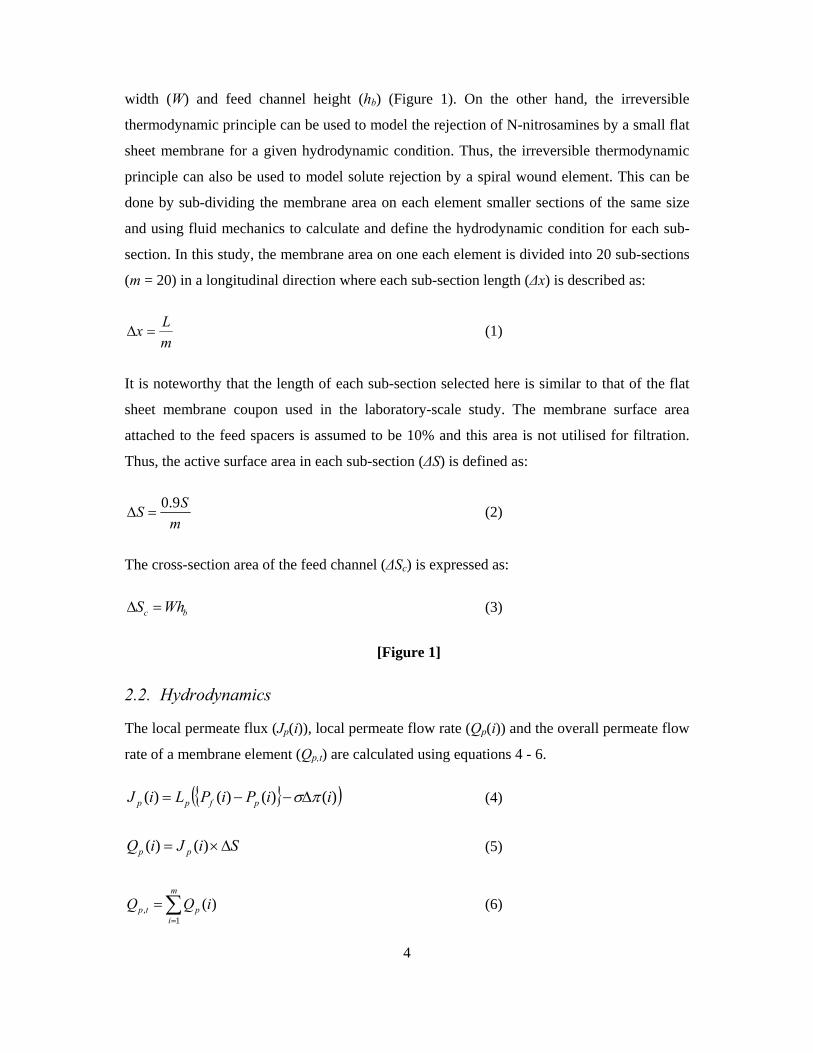
width (W) and feed channel height (hb) (Figure 1). On the other hand, the irreversible
thermodynamic principle can be used to model the rejection of N-nitrosamines by a small flat
sheet membrane for a given hydrodynamic condition. Thus, the irreversible thermodynamic
principle can also be used to model solute rejection by a spiral wound element. This can be
done by sub-dividing the membrane area on each element smaller sections of the same size
and using fluid mechanics to calculate and define the hydrodynamic condition for each sub-
section. In this study, the membrane area on one each element is divided into 20 sub-sections
(m = 20) in a longitudinal direction where each sub-section length (Δx) is described as:
m
Lx (1)
It is noteworthy that the length of each sub-section selected here is similar to that of the flat
sheet membrane coupon used in the laboratory-scale study. The membrane surface area
attached to the feed spacers is assumed to be 10% and this area is not utilised for filtration.
Thus, the active surface area in each sub-section (ΔS) is defined as:
m
SS
9.0 (2)
The cross-section area of the feed channel (ΔSc) is expressed as:
bc WhS (3)
[Figure 1]
2.2. Hydrodynamics
The local permeate flux (Jp(i)), local permeate flow rate (Qp(i)) and the overall permeate flow
rate of a membrane element (Qp,t) are calculated using equations 4 - 6.
)()()()( iiPiPLiJ pfpp (4)
SiJiQ pp )()( (5)
m
iptp iQQ
1, )( (6)
5
where Lp = pure water permeability which is obtained from bench-scale tests and σ =
reflection coefficient. Because permeate pressure (Pp) is negligible compared to feed pressure
(Pf), local permeate pressure (Pp(i)) is assumed to be zero in this study. Local osmotic
pressure (π(i)) shown in equation 4 is computed with feed solution temperature (T) and molar
concentrations of ions (msalt(i)).
i
imTi1
)()273(19.1)( (7)
Concentration of the solute (msalt(i)) increases in the feed in the subsequent sub-sections since
the solute is retained by the membrane. Changes in solute concentration can be calculated
using the following equation:
)1(
)()1()()()1(
iQ
iQRiQimim
f
psaltfsaltsalt (8)
where Qf(i) = local feed flow rate. In the model, overall feed flow measured in the pilot
system is used as the feed flow of the first sub-section Qf(1). Local feed flow rate (Qf(i+1)) is
calculated from the feed and permeate flow rates of the previous sub-section (Qf(i)):
)()()1( iQiQiQ pff (9)
Using the local feed flow rate (Qf(i)), local bulk velocity of the feed within the feed channel
(Ub(i)) is defined as:
c
fb S
iQiU
)()( (10)
The pressure drop in the feed stream (ΔPf(i)) and overall pressure drop of an element in the
feed stream (ΔPf,t) is calculated using the following formula [23, 24]:
hbfbf d
xiUifiP
)()(2
1)( 2 (11)
saltCMMMi 4.7522484004.498)( 2 (12)
6
TM 410757.20069.1 (13)
m
iftf iPP
1, )( (14)
where ffb = feed friction parameter, ρ(i) = local solution density [25], T = feed temperature
and dh = hydraulic diameter (dh = 2hb) [23]. Friction parameter (ffb) is determined by an
approach minimising the difference between the experimentally modelled and measured
overall pressure drops. Feed pressure which is experimentally measured at the entrance of the
first membrane element is used as the feed pressure of the first sub-section in the model.
Then local feed pressure (Pf(i+1)) is calculated from the feed pressure (Pf(i)) and the feed
pressure loss (ΔPf(i)) of the previous section:
)()()1( iPiPiP fff (15)
[Figure 2]
2.3. Solute permeation through membranes
Local real rejection (Rreal(i)) of various solutes such as ions and organic chemicals including
N-nitrosamines [26-29] can be commonly expressed by the Spiegler-Kedem equation [30]:
))(1(
))(1(
)(
)(1)(
iF
iF
iC
iCiR
m
preal
(16)
)(
1exp)( iJ
PiF p
s
(17)
where Ps = permeability coefficient and σ = reflection coefficient both of which can be
obtained from bench-scale experiments. Local observed rejection (Robs(i)) can be calculated
with the local real rejection (Rreal(i)) and local mass transfer coefficient (k(i)) as follows [31]:
)()(
)(exp)(1
)()(
iRik
iJiR
iRiR
realp
real
realobs
(18)
7
5.0
6/15.0
)(2
753.0)(
L
PehiSc
h
D
K
Kik b
b
(19)
where K = efficiency of mixing net (K = 0.5), Sc = Schmidt number (μ/ρ(i)D), Pe = Peclet
number (Pe = 2hbUb(i)/D) and μ = viscosity of feed solution.
140
8.2475 1010141.2 T (20)
Once the local observed rejection (Robs(i)) is determined, the local permeate concentration
(Cp(i)) can also be calculated using local feed concentration (Cf(i)) using equation 21. Then
local feed concentration in the following sub-section (Cf(i+1)) can be expressed by equation
22. The overall permeate concentration of an element j (Cp(j)) can be calculated by totalling
mass transport in all sub-sections of the membrane element as described in equation 23.
))(1)(()( iRiCiC obsfp (21)
)(
)()()()()1(
iQ
iCiQiCiQiC
c
ppfff
(22)
m
ip
m
ipp
p
iQ
iQiCjC
1
1
)(
)()()( (23)
Because permeate streams from each membrane element blend in the combined permeate
stream, solute rejection by a certain number (n) of membrane elements need to be evaluated
using the combined concentration. The combined permeate concentration of n elements
(Cp(n)), combined observed solute rejection of n elements (Robs(n)), and recovery of n
elements (Rc(n)) can be calculated as follows:
n
jp
n
jpp
p
jQ
jQjC
nC
1
1
)(
)()(
)( (24)
8
)(
)()()(
jC
nCjCnR
f
pfobs
, j = 1 (25)
)(
)(
)( 1
jQ
jQ
nRf
n
jp
c
, j = 1 (26)
The iterative procedure to determine the hydrodynamic constants (Eqs 1 – 15) and solute
transport following the irreversible thermodynamic principle described Eqs 16 – 26 above
provide the basis for this mathematical model as schematically summarised in Figure 2.
3. Materials and methods
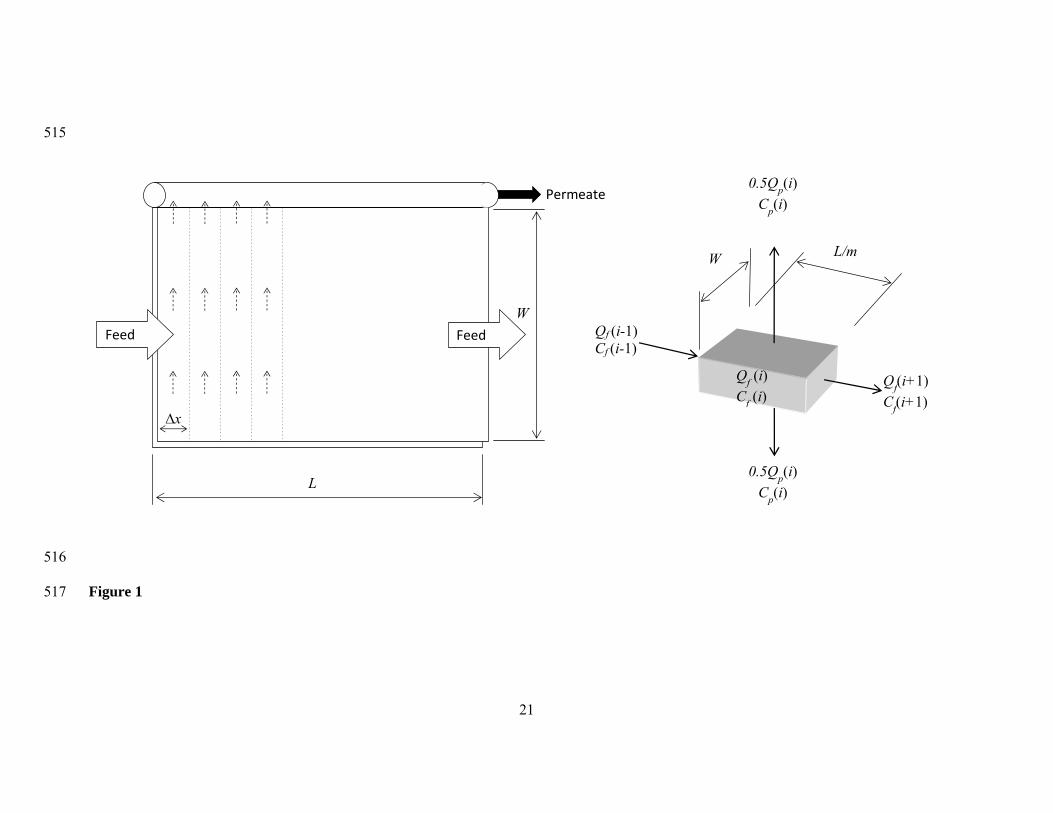
3.1. Pilot-scale filtration system and RO element
A pilot-scale cross-flow RO filtration system was used in this investigation. The pilot system
comprises three 4 inch glass-fibre pressure vessels, 300 L feed reservoir, stainless steel pipes
in the feed stream and PVC pipes in the permeate stream (Figure 3). Each pressure vessel
holds one 4 inch × 40 inch RO membrane element. The feed solution was delivered from the
feed reservoir to the first stage by a pump (CRN 3-25, Grundfos, Bjerringbro, Denmark) and
the concentrate of the first stage was transferred to the second stage followed by the third
stage. The permeate and concentrate streams were returned back into the feed reservoir. The
permeate flow rate and cross flow rate were both monitored by flow meters and regulated by
a globe valve and speed controller of the pump. Feed solution temperature was conditioned in
the feed reservoir using stainless steel heat exchanging pipes connected to a chillier/heater
unit (Aqua Cooler S360PD-CT, Chester Hill, NSW, Australia).
[Figure 3]
Three ESPA2-4040 (Hydranautics, Oceanside, CA, USA) spiral wound elements were used.
The ESPA2-4040 membrane element has an equivalent length of 1.016 m, actual membrane
sheet length (L) of 0.9 m, membrane area (S) of 7.9 m2, and feed channel height (hb) of 6.60 ×
10-4 m. According to the manufacturer, permeability of individual membrane element may
vary by up to 25%. It is noteworthy that the ESPA2 membrane is commonly deployed in full-
scale RO installations in the USA and Australia for water reuse application [5, 32].
9
3.2. Chemicals
Analytical grade N-nitrosamines were obtained from by Sigma-Aldrich (St Louis, MO, USA).
An N-nitrosamine stock solution containing 10 mg/L of each N-nitrosamine was prepared in
pure methanol. All N-nitrosamines used in this investigation exist as an uncharged solute in
treated wastewater (pH 6-8) [16]. Deuterated N-nitrosamines (N-nitrosodimethylamine-D6,
N-nitrosomethylethylamine-D3, N-nitrosopyrrolidine-D8, N-nitrosodiethylamine-D10, N-
nitrosopiperidine-D10, N-nitrosomorpholine-D8, N-nitrosodipropylamine-D14 and N-
nitrosodi-n-butylamine-D9) were supplied by CDN isotopes (Pointe-Claire, Quebec, Canada)
and a surrogate stock solution of 100 µg/L of each deuterated N-nitrosamine was also
prepared in pure methanol. These stock solutions were kept at -18 ºC in the dark and were
used within 1 month of preparation. Key physicochemical properties and transport parameters
of these N-nitrosamines through the ESPA2 membrane which was obtained from a previous
study [33] are summarised in Table 1. Analytical grade NaCl, CaCl2 and NaHCO3 were also
purchased from Ajax Finechem (Taren Point, NSW, Australia). Stock solutions of these
chemicals were also prepared in Milli-Q water at 2M (NaCl) and 0.1M (CaCl2 and NaHCO3)
concentrations and used as the background electrolytes during the filtration experiments.
[Table 1]
3.3. Filtration experiments
Prior to the first filtration experiment, the membrane system was operated at approximately
1000 kPa for 12 hours using 100 L Milli-Q water. Following the start-up stage, the Milli-Q
water in the feed was conditioned with 20 mM NaCl, 1 mM CaCl2 and 1 mM NaHCO3 to
simulate the background electrolyte composition typically found in treated wastewater. The
stock solution of N-nitrosamines was also introduced into the feed to obtain approximately
250 ng/L of each N-nitrosamine. The permeate flux was then adjusted to 10 L/m2h, and
stepwise increased up to 30 L/m2h. The overall system recovery was adjusted to 25% because
only three membrane elements were used. During the experiments, feed pressure was
measured at the entrance of the each element and the exit of the third element. The system
was operated for at the least 12 h before the first samples were taken for analysis to ensure
the separation efficiency has been stabilised. A previous laboratory-scale study revealed no
significant changes in the rejection of almost all N-nitrosamines after one hour of filtration

10
[16]. From each sampling point, a sample of 200 mL was collected using amber glass bottles
for N-nitrosamine analysis. Immediately after the sample collection, the surrogate stock
solution was added to the sampling bottles to obtain 50 ng/L of each isotope labelled N-
nitrosamine. The feed temperature during the experiments was kept at 20±0.1°C. It is
noteworthy that the overall recovery of each vessel (or stage) which holds six to seven RO
elements is about 50% in most full-scale wastewater recycling RO plants.
3.4. Analytical technique
N-nitrosamine concentrations were determined using an analytical method previously
developed by McDonald et al. [18]. The method uses solid phase extraction (SPE), followed
by gas chromatography and analysis by tandem mass spectrometry with electron impact
ionization. SPE was conducted using SupelcleanTM Coconut Charcoal SPE cartridges
purchased from Supelco (St Louis, MO, USA). The concentrations of N-nitrosamines were
quantified using an Agilent 7890A gas chromatograph coupled with an Agilent 7000B triple
quadrupole mass spectrometer. Calibration curves were established for each N-nitrosamine
with a range of 0.5-500 ng/L. The quantitative detection limits established in this
investigation were 3 ng/L for NDMA, NDEA, NPIP, and NMOR, and 5 ng/L for NMEA,
NPYR, NDPA, and NDBA. Conductivity and pH were measured using an Orion 4-Star Plus
pH/conductivity meter (Thermo Scientific, USA).
4. Results and discussion
4.1. Determination of model parameters
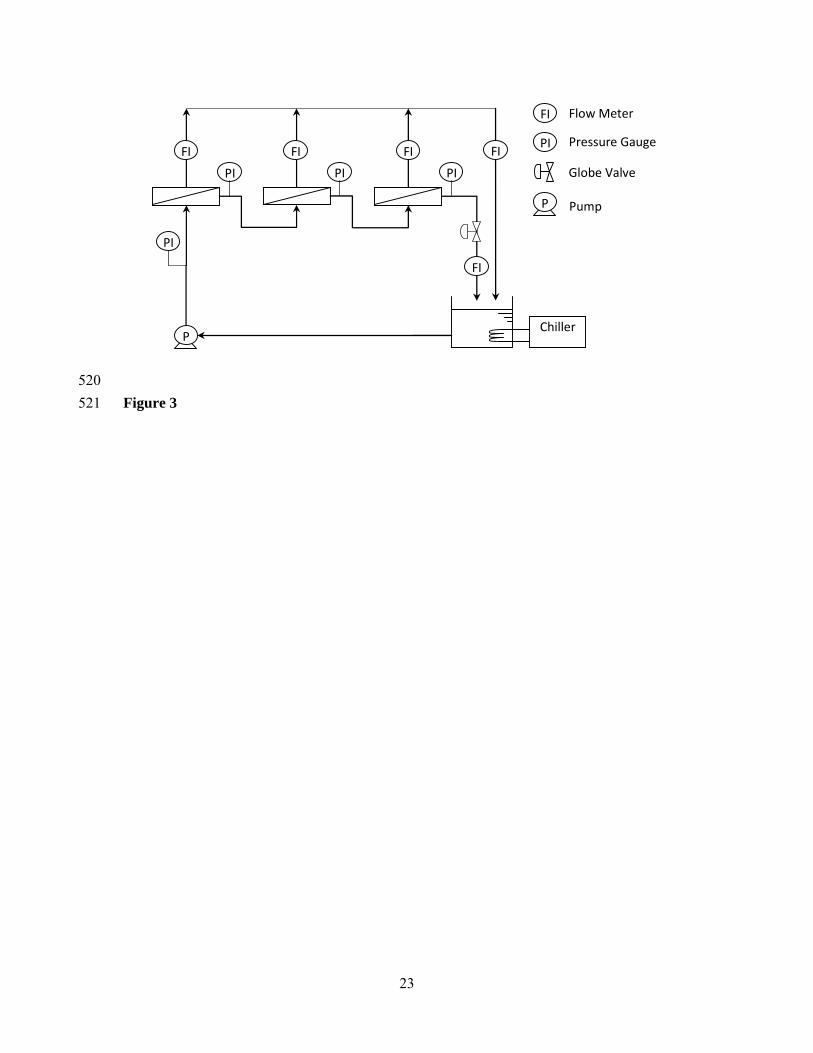
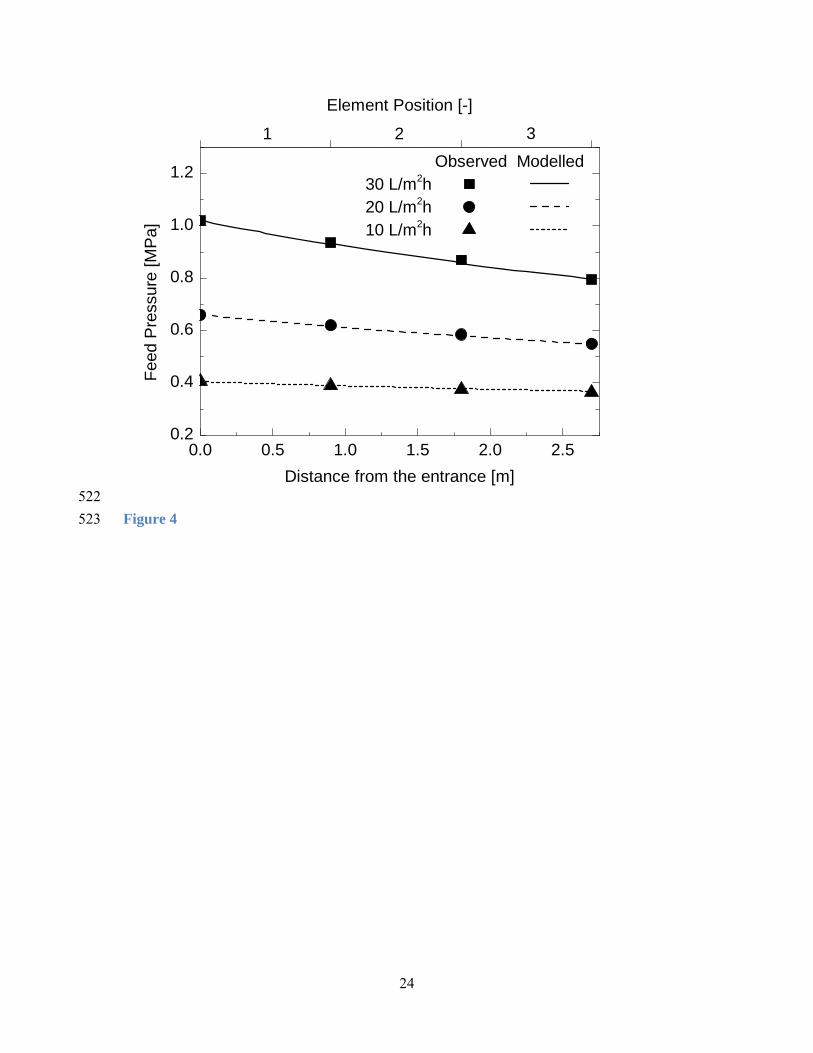
The pressure of each sub-section within the membrane system was calculated from the
pressure of the previous sub-section and the local pressure drop. The local pressure drop
(ΔP(i)) was determined using equation 11. The feed friction parameter (ffb), which is
dependent upon the geometry of membrane element and operating conditions [23, 24], was
obtained using the iteration procedure outline in Figure 2 to minimise the difference between
the modelled and observed feed pressure to less than 5% at an average permeate flux of 10,
20, and 30 Lm2/h (Figure 4). In this study, ffb values of 10, 20 and 30 Lm2/h were 3.9, 4.3 and
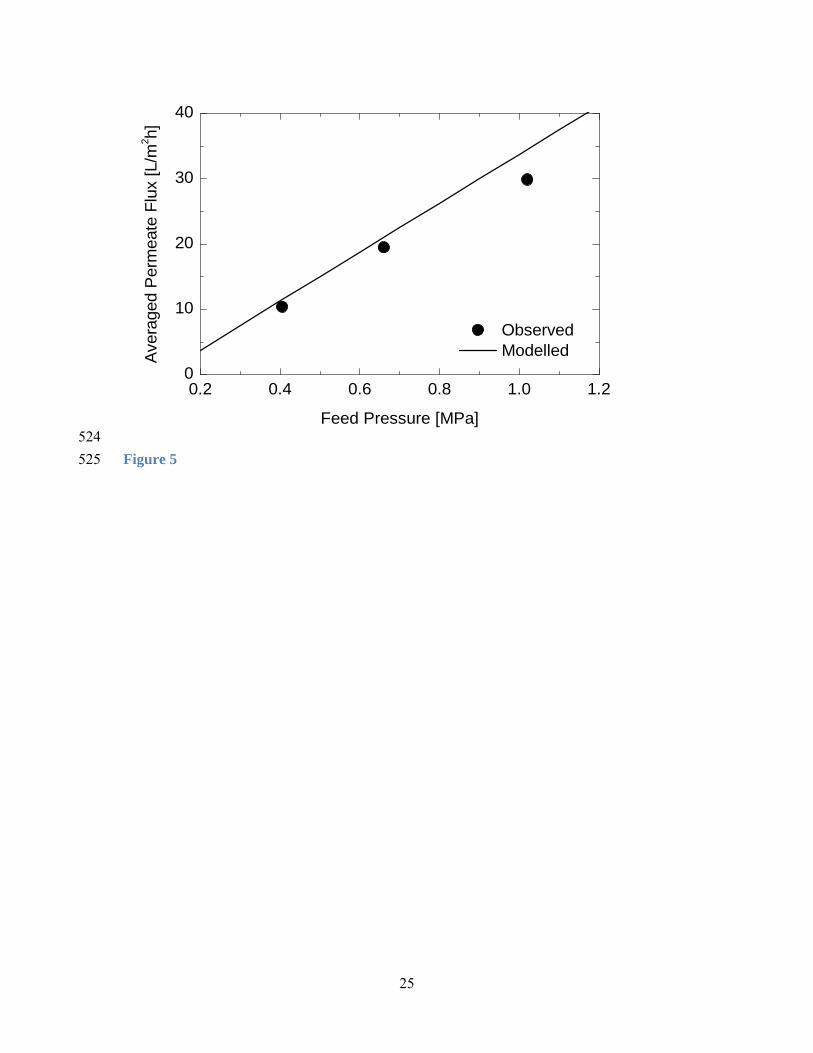
5.5, respectively. Knowing the membrane permeability, the local permeate flux can then be
calculated based on the local pressure. Subsequently, the overall permeate flux can also be
calculated. In fact, the simulated permeate flux only deviated slightly from the observed
11
value at the applied pressure of 1.0 MPa (Figure 5). These results indicate that the model can
adequately simulate the hydrodynamic condition (i.e. feed pressure and permeate flow)
within the RO membrane elements. The small deviation observed in Figure 5 may be
attributed to the fact that the determined ffb value was used for the entire system as well as the
difference in permeability of membranes that were used in the fundamental and pilot-scale
experiments. There can be some variation in permeability between different areas of the same
membrane element or between different batches of production (Section 3.1). As the applied
pressure increases, the pressure drop across the membrane element increases resulting in a
larger deviation between the simulated and experimentally obtained values.
[Figure 4]
[Figure 5]
4.2. N-nitrosamine rejection
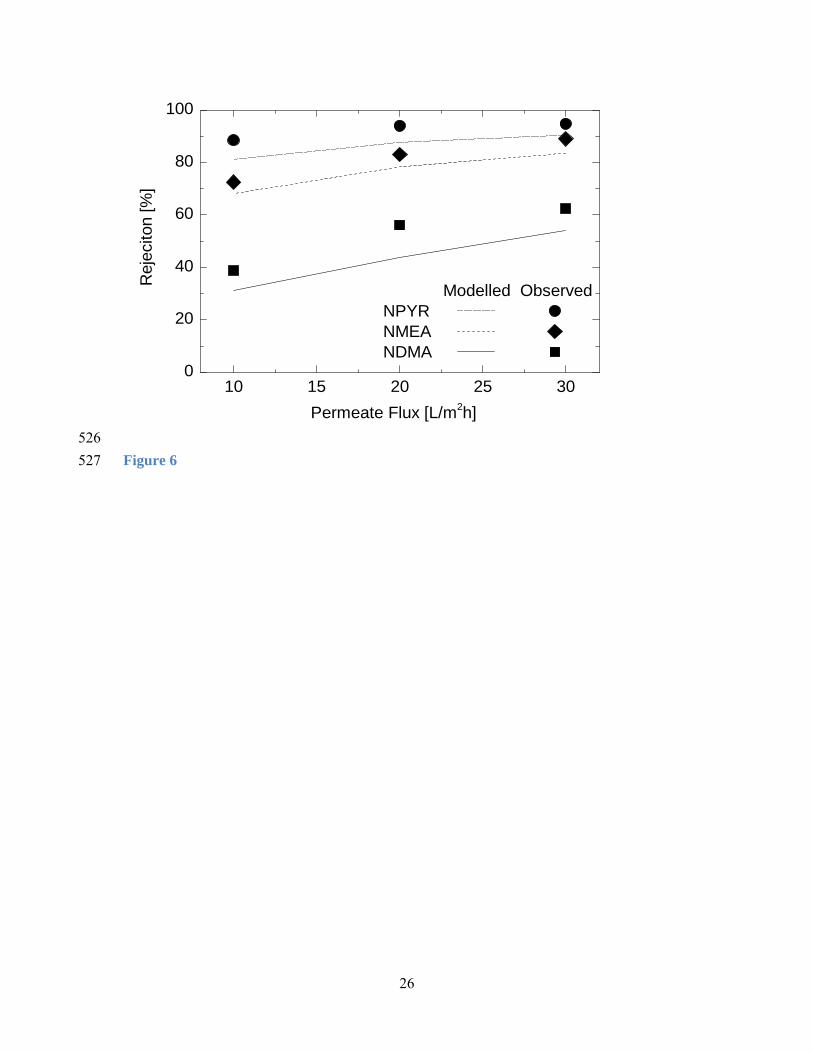
All N-nitrosamines used in this study are uncharged in the tested solution (pH 8). In general,
the rejection of uncharged solutes by NF/RO membranes generally increases as permeate flux
increases [22]. A similar trend using N-nitrosamines was also reported in a previous
laboratory-scale study by Fujioka et al. [16]. As expected, the simulated rejection values of
three lowest molecular weight N-nitrosamines (i.e. NDMA, NMEA and NPYR) increased
when the overall (system) permeate flux increased (Figure 6). Among these three N-
nitrosamines, modelled NDMA rejection showed the most significant increase from 31 to
54% with increasing overall permeate flux from 10 to 30 L/m2h, respectively. The impact of
permeate flux on N-nitrosamine rejection was less significant as their molecular weights
increase. The modelled rejections were comparable with the observed rejections at three
different overall permeate fluxes (i.e. 10, 20 and 30 L/m2h) investigated here. Results from
Figure 6 indicate that the developed model is capable of describing N-nitrosamine rejection at
a range of permeate flux. It is also noteworthy that rejection values obtained from the model
are conservative. In other word, the modelled rejections of NDMA, NMEA, and NPYR were
slightly smaller than values obtained experimentally.
Modelled rejections of the other N-nitrosamines (i.e. NDEA, NPIP, NDPA, NMOR and
NDBA) were over 90%. As a result, only a slight increase in rejection was found with
increasing overall permeate flux (data not shown). In fact, pilot-scale experiments conducted
12
in this study revealed that the observed rejections of these N-nitrosamines were over 90% and
no discernible variation in rejection was observed for changes in permeate flux (Figure 7).
[Figure 6]
[Figure 7]
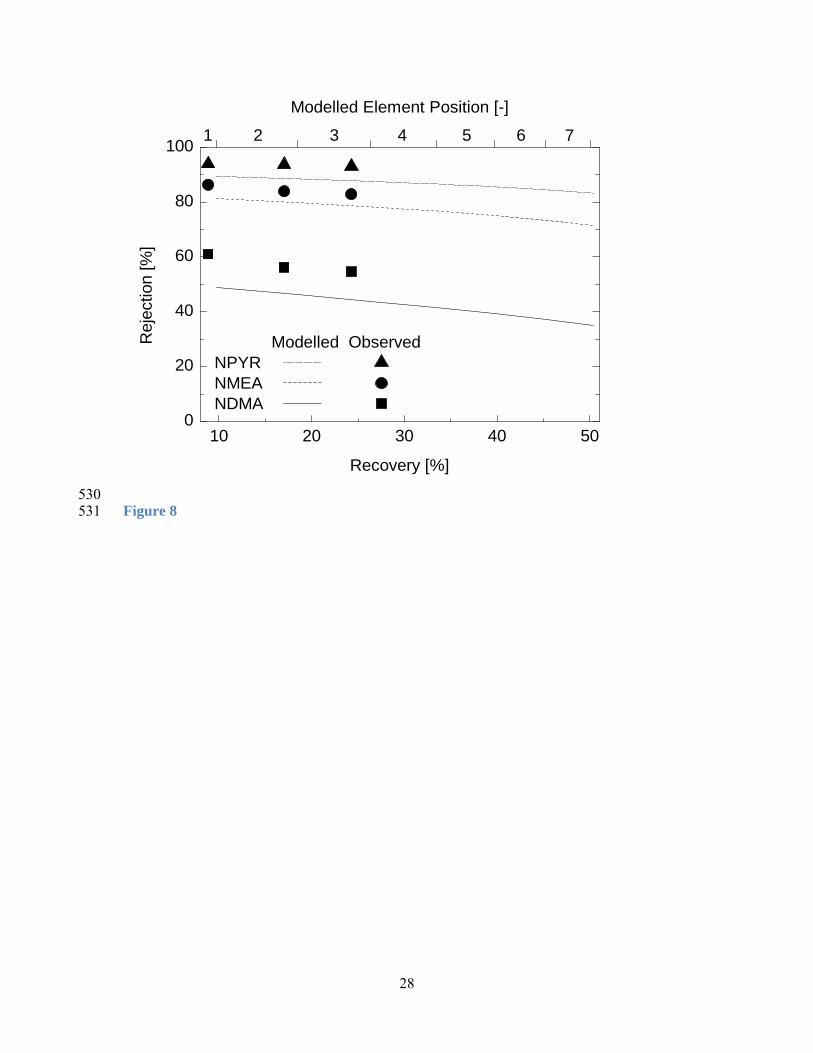
4.3. Impact of recoveries
In full-scale RO plants, solute rejection can vary depending on the element position within a
vessel and the overall train due to changes in hydrodynamic states and solution characteristics.
The variation in solute rejection was investigated by extending the model calculation from
three elements to seven elements and the rejections were plotted against recovery (Figure 8).
The model showed approximately 50% recovery with seven RO membrane elements, which
is equivalent to one vessel of the first stage in a full-scale RO train deployed for water
reclamation applications. The simulated rejections of the three N-nitrosamines decreased
when recovery increased (Figure 8). When the recovery of the RO system increased from 10
to 50%, the modelled rejection of NDMA decreased remarkably from 49 to 35%. Likewise,
for the same change in recovery, the rejections of NMEA and NPYR also decreased from 81
to 72% and from 89 to 83%, respectively. The observed rejections of these three N-
nitrosamines were similar to the modelled rejections (Figure 8).
[Figure 8]
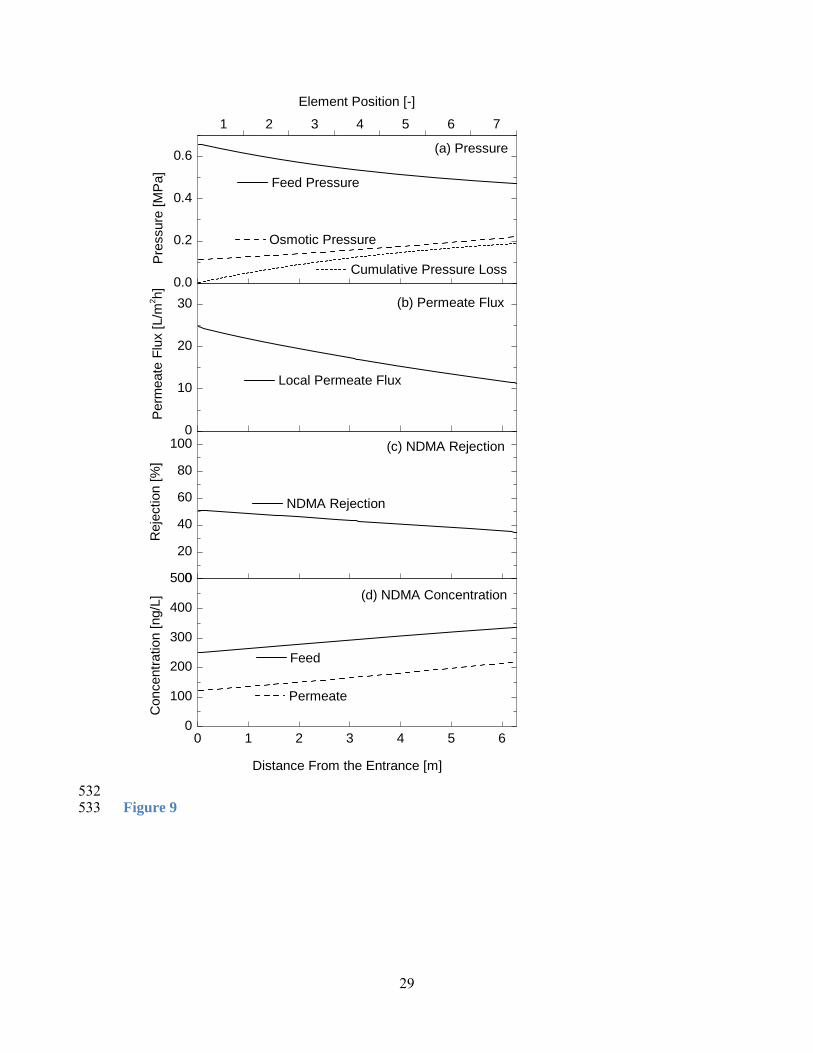
Changes in the localised rejection of NDMA within a membrane vessel containing several
elements were further investigated by examining the variation in hydrodynamic states and
mass transfers. As filtration progresses, local feed pressure decreases due to an increase in
pressure loss (Figure 9). As a result of the reduced driving force, local permeate flux
decreases along with the progress of the filtration. Since permeate flux affects the rejection of
N-nitrosamines [33], the local NDMA rejection could also decrease. It is also noteworthy that
an increase in TDS along with filtration also causes a slight decrease in N-nitrosamine
rejection [33]. In addition, rejected compounds remain in the feed stream, leading to an
increase in NDMA concentration in the subsequent feed and permeate. The increased NDMA
concentration in the permeate stream contributes to deteriorations in the overall rejection of
solutes, since the overall rejection is calculated based on solute concentrations in the feed
13
solution and combined permeate solution as described in equation 25. Thus, the simulation
results reported here could explain the discrepancy between laboratory scale results with very
low recovery and those from full-scale RO plants for water recycling applications with about
85% recovery [15].
[Figure 9]
5. Conclusions
The developed model successfully simulated the hydrodynamic states (i.e. pressure and
permeate flow) of the pilot-stale plant. The modelled results revealed that changes in
permeate flux (from 10 to 30 L/m2h) considerably affected the rejection of low molecular
weight N-nitrosamines such as NDMA (from 31 to 54%). The modelled N-nitrosamine
rejections at each permeate flux were in a good agreement with experimentally determined
N-nitrosamine rejections. Modelling conditions simulating a vessel with seven spiral-wound
membrane elements revealed that recovery plays an important role in the rejection of low-
molecular weight N-nitrosamines. In particular, when recovery changed from 10 to 50% by
increasing the number of elements from one to seven, NDMA rejection decreased
considerably from 49 to 35%. Additional simulation using the model revealed that the local
NDMA rejection decreased with NDMA concentration increasing along the flow path from
the first to the last stage, resulting in a decrease in the overall rejection of NDMA. The
presented results demonstrate that the developed model can be used for simulating N-
nitrosamine rejections during full-scale plant design and operation. Further work is required
to examine the effects of several other factors (e.g. feed water characteristics, fouling and
chemical cleaning) on N-nitrosamine rejection using a pilot-scale plant and incorporate these
effects into the model.
6. Acknowledgements
This work was supported by the Australian Research Council Linkage Projects LP0990705
(with industry support from Veolia Water and Seqwater). The authors acknowledge the
University of Wollongong for a PhD scholarship awarded to Takahiro Fujioka.
7. Nomenclature
Cf feed concentration [kg/m3]
14
Cp permeate concentration [kg/m3]
hb feed channel height [m]
i number of sub-section [-]
j number of element [-]
ffb feed friction parameter [-]
Jp permeate flux [m3/m2s]
k mass transfer coefficient [m/s]
K efficiency of mixing net [-]
L membrane sheet length [m]
Lp pure water permeability [L/m2hPa]
m number of sub-sections in a membrane sheet [-]
msalt molar concentrations of ions [mol/L]
n quantity of elements [-]
Pe Peclet number [-]
Pf feed pressure [Pa]
Pp feed pressure [Pa]
ΔP pressure drop [Pa]
Ps permeability coefficient of a compound [m/s]
Qf feed flow [m3/s]
Qp permeate flow [m3/s]
Rc recovery [-]
Robs observed rejection [-]
Rreal real rejection [-]
ΔS valid surface area [m]
15
ΔSc cross-section area [m]
Sc Schmidt number [-]
T feed solution temperature [°C]
Ub bulk velocity of the feed within the feed channel [m/s]
W membrane sheet width [m]
Δx sub-section length [m]
ρ density of solution [kg/m3]
σ reflection coefficient [-]
π osmotic pressure [Pa]
µ viscosity of feed solution [Pa-s]
8. References
[1] M.A. Shannon, P.W. Bohn, M. Elimelech, J.G. Georgiadis, B.J. Marinas, A.M. Mayes, Science and technology for water purification in the coming decades, Nature, 452 (2008) 301-310.
[2] C. Bellona, J.E. Drewes, P. Xu, G. Amy, Factors affecting the rejection of organic solutes during NF/RO treatment - A literature review, Water Res., 38 (2004) 2795-2809.
[3] A.R.D. Verliefde, S.G.J. Heijman, E.R. Cornelissen, G.L. Amy, B. Van der Bruggen, J.C. van Dijk, Rejection of trace organic pollutants with high pressure membranes (NF/RO), Environ. Prog., 27 (2008) 180-188.
[4] G. Oron, L. Gillerman, A. Bick, N. Buriakovsky, Y. Manor, E. Ben-Yitshak, L. Katz, J. Hagin, A two stage membrane treatment of secondary effluent for unrestricted reuse and sustainable agricultural production, Desalination, 187 (2006) 335-345.
[5] M.H. Plumlee, M. López-Mesas, A. Heidlberger, K.P. Ishida, M. Reinhard, N-nitrosodimethylamine (NDMA) removal by reverse osmosis and UV treatment and analysis via LC-MS/MS, Water Res., 42 (2008) 347-355.
[6] M.J. Farré, K. Döderer, L. Hearn, Y. Poussade, J. Keller, W. Gernjak, Understanding the operational parameters affecting NDMA formation at Advanced Water Treatment Plants, J. Hazard. Mater., 185 (2011) 1575-1581.
[7] S.J. Khan, J.A. McDonald, Quantifying human exposure to contaminants for multiple-barrier water reuse systems, Water Sci. Technol., 61 (2010) 77-83.
16
[8] W.A. Mitch, J.O. Sharp, R.R. Trussell, R.L. Valentine, L. Alvarez-Cohen, D.L. Sedlak, N-Nitrosodimethylamine (NDMA) as a drinking water contaminant: A review, Environ. Eng. Sci., 20 (2003) 389-404.
[9] S.W. Krasner, P. Westerhoff, B. Chen, B.E. Rittmann, G. Amy, Occurrence of disinfection byproducts in United States wastewater treatment plant effluents, Environ. Sci. Technol., 43 (2009) 8320-8325.
[10] M. Krauss, P. Longrée, E. van Houtte, J. Cauwenberghs, J. Hollender, Assessing the fate of Nitrosamine precursors in wastewater treatment by physicochemical fractionation, Environ. Sci. Technol., 44 (2010) 7871-7877.
[11] C. Reyes-Contreras, C. Domínguez, J.M. Bayona, Determination of nitrosamines and caffeine metabolites in wastewaters using gas chromatography mass spectrometry and ionic liquid stationary phases, J. Chromatogr. A, 1261 (2012) 164-170.
[12] S. Yoon, N. Nakada, H. Tanaka, A new method for quantifying N-nitrosamines in wastewater samples by gas chromatography—triple quadrupole mass spectrometry, Talanta, 97 (2012) 256-261.
[13] USEPA, N-Nitrosodimethylamine (CASRN 62-75-9) - Integrated risk information system (IRIS), http://www.epa.gov/iris/subst/0045.htm (1993).
[14] NRMMC, EPHC, AHMC, Australian guidelines for water recycling: Managing health and environmental risks (Phase 2): Augmentation of drinking water supplies, Environment Protection and Heritage Council, National Health and Medical Research Council, Natural Resource Management Ministerial Council, Canberra, 2008.
[15] T. Fujioka, S.J. Khan, Y. Poussade, J.E. Drewes, L.D. Nghiem, N-nitrosamine removal by reverse osmosis for indirect potable water reuse – A critical review based on observations from laboratory-, pilot- and full-scale studies, Sep. Purif. Technol., 98 (2012) 503-515.
[16] T. Fujioka, L.D. Nghiem, S.J. Khan, J.A. McDonald, Y. Poussade, J.E. Drewes, Effects of feed solution characteristics on the rejection of N-nitrosamines by reverse osmosis membranes, J. Membr. Sci., 409–410 (2012) 66-74.
[17] J.W. Munch, M.V. Bassett, METHOD 521 Determination of nitrosamines in drinking water by solid phase extraction and capillary column gas chromatography with large volume injection and chemical ionization tandem mass spectrometry (MS/MS) Version 1.0, in, National Exposure Research Laboratory Office of Research and Development, U.S. Environmental Protection Agency, Cincinnati, 2004.
[18] J.A. McDonald, N.B. Harden, L.D. Nghiem, S.J. Khan, Analysis of N-nitrosamines in water by isotope dilution gas chromatography-electron ionisation tandem mass spectrometry, Talanta, 99 (2012) 146-152.
[19] P.P. Mane, P.-K. Park, H. Hyung, J.C. Brown, J.-H. Kim, Modeling boron rejection in pilot- and full-scale reverse osmosis desalination processes, J. Membr. Sci., 338 (2009) 119-127.

17
[20] P.-K. Park, S. Lee, J.-S. Cho, J.-H. Kim, Full-scale simulation of seawater reverse osmosis desalination processes for boron removal: Effect of membrane fouling, Water Res., 46 (2012) 3796-3804.
[21] H. Hyung, J.-H. Kim, A mechanistic study on boron rejection by sea water reverse osmosis membranes, J. Membr. Sci., 286 (2006) 269-278.
[22] A.R.D. Verliefde, E.R. Cornelissen, S.G.J. Heijman, J.Q.J.C. Verberk, G.L. Amy, B. Van der Bruggen, J.C. van Dijk, Construction and validation of a full-scale model for rejection of organic micropollutants by NF membranes, J. Membr. Sci., 339 (2009) 10-20.
[23] G. Schock, A. Miquel, Mass transfer and pressure loss in spiral wound modules, Desalination, 64 (1987) 339-352.
[24] E.M.V. Hoek, J. Allred, T. Knoell, B.-H. Jeong, Modeling the effects of fouling on full-scale reverse osmosis processes, J. Membr. Sci., 314 (2008) 33-49.
[25] K.M. Sassi, I.M. Mujtaba, Effective design of reverse osmosis based desalination process considering wide range of salinity and seawater temperature, Desalination, 306 (2012) 8-16.
[26] Y. Miyashita, S.-H. Park, H. Hyung, C.-H. Huang, J.-H. Kim, Removal of N-Nitrosamines and their precursors by nanofiltration and reverse osmosis membranes, J. Environ. Eng., 135 (2009) 788-795.
[27] C. Bellona, K. Budgell, D. Ball, K. Spangler, J.E. Drewes, S. Chellam, Models to predict organic contaminant removal by RO and NF membranes, IDA Journal, 3 (2011) 40-44.
[28] T. Tsuru, K. Ogawa, M. Kanezashi, T. Yoshioka, Permeation characteristics of electrolytes and neutral solutes through titania nanofiltration membranes at high temperatures, Langmuir, 26 (2010) 10897-10905.
[29] T. Tsuru, S. Izumi, T. Yoshioka, M. Asaeda, Temperature effect on transport performance by inorganic nanofiltration membranes, AIChE Journal, 46 (2000) 565-574.
[30] O. Kedem, A. Katchalsky, Permeability of composite membranes. Part 1.-Electric current, volume flow and flow of solute through membranes, Trans. Faraday Soc., 59 (1963) 1918-1930.
[31] S. Senthilmurugan, A. Ahluwalia, S.K. Gupta, Modeling of a spiral-wound module and estimation of model parameters using numerical techniques, Desalination, 173 (2005) 269-286.
[32] M.J. Farré, J. Keller, N. Holling, Y. Poussade, W. Gernjak, Occurrence of NDMA precursors in wastewater treatment plant effluent and their fate during UF-RO membrane treatment, Water Sci. Technol., 63 (2011) 605-612.
18
[33] T. Fujioka, S.J. Khan, J.A. McDonald, A. Roux, Y. Poussade, J.E. Drewes, L.D. Nghiem, N-nitrosamine rejection by nanofiltration and reverse osmosis membranes: The importance of membrane characteristics, Desalination, 316 (2013) 67-75.

19
Table 1: Physicochemical characteristics and transport parameters of the selected N-nitrosamines. 486 Name NDMA NMEA NPYR NDEA NPIP NMOR NDPA NDBA
Structure
Molecular weight [g/mol]
74.05 88.06 100.06 102.08 114.08 116.06 130.11 158.14
Log Kowa -0.50 0.01 -0.09 0.52 0.44 -0.81 1.54 2.56
Diffusion coefficient b, D [m2/s]
9.7 × 10⁻¹⁰
8.0 × 10⁻¹⁰ 8.0 × 10⁻¹⁰ 8.0 × 10⁻¹⁰ 8.6 × 10⁻¹⁰ 9.2 × 10⁻¹⁰ 8.2 × 10⁻¹⁰ 8.0 × 10⁻¹⁰
Permeability coefficient c, Ps
[m/s]
5.35 × 10⁻⁶ 1.14 × 10⁻⁶ 5.12 × 10⁻⁷ 2.26 × 10⁻⁷ 9.25 × 10⁻⁸ 2.06 × 10⁻⁷ 6.02 × 10⁻⁸ 4.33 × 10⁻⁸
Reflection coefficient c, σ [-]
0.953 0.958 0.973 0.985 0.993 0.991 0.992 0.990
a ACD/PhysChem Suite software (Advanced Chemistry Development, Inc., Ontario, Canada). 487 b GSI chemical properties database (GSI Environmental Inc.), http://www.gsi-net.com/en/publications/gsi-chemical-database.html. 488 c [33]. 489
NN
ON
NO
NN
ON
NO
NN
ON
NO
ON
NO
NN
O
20
LIST OF FIGURES 490
Figure 1: Representation of a spiral-wound RO element as flat sheet configuration including 491
the mass balance of a flat sheet sub-section. 492
Figure 2: Schematic diagram of the iteration procedure to determine the pressure drop in a 493
spiral-wound element and the subsequent rejection calculation. 494
Figure 3: Flow diagram of the pilot-scale plant. 495
Figure 4: Observed and modelled feed pressure within three RO elements (overall permeate 496
flux = 10, 20 and 30 L/m2h; feed solution contains 20 mM NaCl, 1 mM NaHCO3, and 1 mM 497
CaCl2; feed temperature = 20.0 ± 0.1 °C). 498
Figure 5: Observed and modelled overall permeate flux as a function of the feed pressure at 499
the system entrance (feed solution contains 20 mM NaCl, 1 mM NaHCO3, and 1 mM CaCl2; 500
feed temperature = 20.0 ± 0.1 °C). 501
Figure 6: Observed and modelled overall rejection of NDMA, NMEA and NDEA (feed 502
solution contains 20 mM NaCl, 1 mM NaHCO3, 1 mM CaCl2; feed temperature = 20.0 ± 503
0.1 °C). 504
Figure 7: Overall rejection of N-nitrosamines by the pilot-scale experiments (overall 505
permeate flux = 10, 20 and 30 L/m2h; feed solution contains 20 mM NaCl, 1 mM NaHCO3, 506
and 1 mM CaCl2; feed temperature = 20.0 ± 0.1 °C). Open symbols indicate that the permeate 507
concentration was below the instrumental detection limit. Values reported here are the 508
average and ranges of duplicate results. 509
Figure 8: Effects of recovery on the rejection of NDMA, NMEA and NPYR (feed solution 510
contains 20 mM NaCl, 1 mM NaHCO3, and 1 mM CaCl2; feed temperature = 20.0 ± 0.1 °C). 511
Figure 9: Variation in (a) feed pressure, (b) local permeate flux, (c) NDMA rejeciton and (d) 512
NDMA concentration in the feed and permeate (feed solution contains 20 mM NaCl, 1 mM 513
NaHCO3, and 1 mM CaCl2; feed temperature = 20.0 ± 0.1 °C). 514
21
515
516
Figure 1517
L
W
Feed
Permeate
∆x
Feed Qf (i-1) Cf (i-1)
Qf(i+1)
Cf(i+1)
0.5Qp(i)
Cp(i)
0.5Qp(i)
Cp(i)
L/m W
Qf (i)
Cf (i)

22
518 Figure 2 519
Inputs a. Membrane element characteristics b. Feed solution characteristics c. Transport parameters (Lp, Ps, σ):
obtained from bench‐scale experiments
Overall feed pressure loss ΔPf,actual
Calculate overall feed pressure loss (ΔPf,t)
Input parameters (nF, kfb)
ΔPf,t ≈ ΔPf,actual
No
Yes
Outputa. Local and overall rejection b. Hydrodynamic states c. Local compound concentrations
Calculate local rejection (Robs(i)) and apply mass balance calculation
Model Hydrodynamic characteristics of the spiral–wound system
Feed flow and feed pressure measured at the entrance of the first element
23
P
PI PI PI
PI
FI FI FI PI
FI Flow Meter
Pressure Gauge
P Pump
Globe Valve
Chiller
FI
FI
520 Figure 3 521
24
0.0 0.5 1.0 1.5 2.0 2.50.2
0.4
0.6
0.8
1.0
1.2 Observed Modelled 30 L/m2h 20 L/m2h 10 L/m2h
Feed
Pre
ssur
e [M
Pa]
Distance from the entrance [m]
21
Element Position [-]
3
522 Figure 4 523
25
0.2 0.4 0.6 0.8 1.0 1.20
10
20
30
40
Observed ModelledA
vera
ged
Per
mea
te F
lux
[L/m
2 h]
Feed Pressure [MPa] 524
Figure 5525
26
10 15 20 25 300
20
40
60
80
100
Permeate Flux [L/m2h]
Modelled Observed
NPYR NMEA NDMA
Rej
ecito
n [%
]
526 Figure 6 527

27
80 100 120 140 1600
20
40
60
80
100
30 L/m2h 20 L/m2h 10 L/m2h
Rej
ectio
n [%
]
Molecular Weight [g/mol]
ND
MA
NM
EA
NM
OR
NPY
RN
DEA
NPI
P
ND
PA
ND
BA
528 Figure 7 529
28
10 20 30 40 500
20
40
60
80
100
Modelled Observed NPYR NMEA NDMA
Rej
ectio
n [%
]
Recovery [%]
765432
Modelled Element Position [-]
1
530 Figure 8 531
29
0.0
0.2
0.4
0.6
0
10
20
30
0
20
40
60
80
100
0 1 2 3 4 5 60
100
200
300
400
500
Feed Pressure
Cumulative Pressure Loss
Osmotic Pressure
(d) NDMA Concentration
(c) NDMA Rejection
(b) Permeate Flux
(a) PressureP
ress
ure
[MP
a]
Local Permeate Flux
Per
mea
te F
lux
[L/m
2 h]
NDMA Rejection
Rej
ectio
n [%
]
1 2 3 4 5 6 7
Element Position [-]
Permeate
Feed
Con
cent
ratio
n [n
g/L]
Distance From the Entrance [m]
532 Figure 9 533