Embed Size (px)
Citation preview

HAL Id: pasteur-02908234https://hal-pasteur.archives-ouvertes.fr/pasteur-02908234
Submitted on 13 Aug 2020
HAL is a multi-disciplinary open accessarchive for the deposit and dissemination of sci-entific research documents, whether they are pub-lished or not. The documents may come fromteaching and research institutions in France orabroad, or from public or private research centers.
L’archive ouverte pluridisciplinaire HAL, estdestinée au dépôt et à la diffusion de documentsscientifiques de niveau recherche, publiés ou non,émanant des établissements d’enseignement et derecherche français ou étrangers, des laboratoirespublics ou privés.
Distributed under a Creative Commons Attribution - NonCommercial - NoDerivatives| 4.0International License
Modelling the inactivation of viruses from theCoronaviridae family in response to temperature and
relative humidity in suspensions or surfaces.Laurent Guillier, Sandra Martin-Latil, Estelle Chaix, Anne Thébault, NicolePavio, Sophie Le Poder, Christophe Batéjat, Fabrice Biot, Lionel Koch, Don
Schaffner, et al.
To cite this version:Laurent Guillier, Sandra Martin-Latil, Estelle Chaix, Anne Thébault, Nicole Pavio, et al.. Modellingthe inactivation of viruses from the Coronaviridae family in response to temperature and relativehumidity in suspensions or surfaces.. Applied and Environmental Microbiology, American Society forMicrobiology, 2020, �10.1128/AEM.01244-20�. �pasteur-02908234�

1
Modelling the inactivation of viruses from the Coronaviridae family in response to 1
temperature and relative humidity in suspensions or surfaces. 2
3
Authors: 4
Laurent Guillier,a Sandra Martin-Latil,b Estelle Chaix,a Anne Thébault,a Nicole Pavio,c 5
Sophie Le Poder,c on behalf of Covid-19 Emergency Collective Expert Appraisal Group,d 6
Christophe Batéjat,e Fabrice Biot,f, Lionel Koch,f Don Schaffner,g Moez Sanaa,a 7
8
Affiliations: 9
aRisk Assessment Department, French Agency for Food, Environmental and 10
Occupational Health & Safety, 14, rue Pierre et Marie Curie, Maisons‐Alfort, France 11
bLaboratory for food safety French Agency for Food, Environmental and Occupational 12
Health & Safety, University of Paris-EST, Maisons-Alfort, France 13
cUMR Virologie 1161, ENVA, INRAE, Anses, Maisons-Alfort, France 14
dMembership of the Covid-19 Emergency Collective Expert Appraisal Group is provided 15
in the Acknowledgments 16
eEnvironment and Infectious Risks Unit, Laboratory for Urgent Response to Biological 17
Threats (CIBU), Institut Pasteur, Paris, France 18
fBacteriology Unit, French Armed Forces Biomedical Research Institute (IRBA), 19
Brétigny-sur-Orge, France 20
gDepartment of Food Science, Rutgers University, New Brunswick, NJ, USA 21
22
Affiliations: 23
Running Head: Modelling the inactivation of coronaviruses on fomites 24
#Address correspondence to [email protected] 25

2
Abstract: 26
Temperature and relative humidity are major factors determining virus inactivation in the 27
environment. This article reviews inactivation data of coronaviruses on surfaces and in 28
liquids from published studies and develops secondary models to predict coronaviruses 29
inactivation as a function of temperature and relative humidity. A total of 102 D-values 30
(time to obtain a log10 reduction of virus infectivity), including values for SARS-CoV-2, 31
were collected from 26 published studies. The values obtained from the different 32
coronaviruses and studies were found to be generally consistent. Five different models 33
were fitted to the global dataset of D-values. The most appropriate model considered 34
temperature and relative humidity. A spreadsheet predicting the inactivation of 35
coronaviruses and the associated uncertainty is presented and can be used to predict 36
virus inactivation for untested temperatures, time points or any coronavirus strains 37
belonging to Alphacoronavirus and Betacoronavirus genera. 38
Importance: The prediction of the persistence of SARS-CoV-2 on fomites is essential to 39
investigate the importance of contact transmission. This study collects available 40
information on inactivation kinetics of coronaviruses in both solid and liquid fomites and 41
creates a mathematical model for the impact of temperature and relative humidity on 42
virus persistence. The predictions of the model can support more robust decision‐43
making and could be useful in various public health contexts. Having a calculator for the 44
natural clearance of SARS-CoV-2 depending on temperature and relative humidity could 45
be a valuable operational tool for public authorities. 46
Keywords: Persistence, coronavirus, modelling, fomites, SARS-CoV-2 47
48

3
1. Introduction49
The pandemic of coronavirus respiratory infectious disease (COVID-19) initiated in 50
Wuhan, China in December 2019 was caused by an emergent virus named Severe 51
Acute Respiratory Syndrome Coronavirus 2 (SARS-CoV-2). SARS-CoV-2 belongs to the 52
order Nidovirales, family Coronaviridae. These enveloped viruses have a positive, 53
single-stranded RNA genome (directly translated) surrounded by a nucleocapsid protein. 54
Coronaviruses are classified into four genera: alpha (αCoV), beta (βCoV), gamma 55
(ƔCoV), and delta (ẟCoV). SARS-CoV-2 belongs to the Betacoronavirus genus and the 56
Sarbecovirus sub-genus. 57
The route of transmission of respiratory viruses is airborne via inhalation of droplets and 58
aerosols or through contact with contaminated intermediate objects (fomites), e.g. by 59
self-inoculation of mucous membranes (mouth, eyes) by contaminated hands (1). The 60
transmission route for SARS-CoV-2, SARS-CoV and Middle East respiratory syndrome 61
(MERS-CoV) is primarily airborne (2-5) while environmental contamination through 62
surfaces is uncertain (6-8). No study has currently quantified the importance of surface 63
contact transmission in the spread of coronavirus diseases (9). Viral genomes have 64
been detected in the stools of COVID-19 patients and sewage (10), but the role of liquid 65
fomites has not yet been addressed. 66
Working with highly virulent coronavirus requires biosafety level 3 laboratory 67
containment conditions and since SARS-CoV2 emerged very recently, few data on its 68
survival related to environmental conditions are available (11, 12). The use of surrogate 69
coronaviruses has been suggested to overcome these challenges and expand the 70
available data on coronavirus survival likelihood (13). Surrogates can be used under the 71

4
assumption that they have similar physicochemical properties that mimic the viruses 72
they represent (14, 15). 73
Temperature and relative humidity have been shown to impact the kinetics of 74
inactivation of coronaviruses. Increased temperatures have been shown to increase the 75
rate of the inactivation (11, 16), and decreased relative humidity have been associated 76
with a reduction of coronaviruses inactivation rate on surfaces (13, 17-19). Inactivation 77
rates were lower in suspensions compared to surfaces in studies that tested both 78
suspensions and surfaces at similar temperatures (11, 20). 79
Hence, the prediction of the persistence of SARS-CoV-2 on fomites is essential to 80
investigate the importance of contact transmission. This study collects available 81
information on inactivation kinetics of coronaviruses in both solid and liquid fomites and 82
models the impact of temperature and relative humidity on virus persistence. 83
84
2. Materials & methods85
2.1. Selection of the studies 86
Four inclusion criteria were used to identify studies that characterized inactivation of 87
coronaviruses according to temperature and relative humidity. Selected studies had to 88
focus on one virus from the Coronaviridae family. Inactivation must have been carried 89
out in suspensions or on inert non-porous surfaces. Only surfaces without antimicrobial 90
properties were considered. The quantification of infectious viruses had to be assessed 91
by cell culture, since RT-qPCR can underestimate actual virus infectivity (21, 22). 92
Finally, the available kinetics data points should be sufficient to allow precise statistical 93
estimation of the rate of viral inactivation without bias. In this context, kinetic data with 94

5
no significant inactivation observed during the experiment or with values below the 95
quantification limit in the first time interval were not included. 96
2.2. Data collection 97
The kinetics were gathered from either the figures or the tables of the selected studies. 98
The digitize R package (23) was used to retrieve data from scatter plots in figures. This 99
package loads a graphical file of a scatterplot (in jpeg format) in the graphical window of 100
R and calibrates and extracts the data. Data were manually reported in R vector for data 101
provided in tables. A key was attributed to kinetics collected in each study (Table 1). The 102
specific list of tables and figures used for each kinetics is given in appendix 1. 103
2.3. Modelling of inactivation 104
A simple primary model was used for describing each inactivation kinetics. The D-values 105
(or decimal reduction times) were determined from the kinetics of the log10 number of 106
infectious viruses (N) over time at each experimental temperature. D is the inverse of 107
the slope of the inactivation kinetics. 108
𝑙𝑜𝑔10(𝑁) = 𝑙𝑜𝑔10(𝑁0) − 𝑡 𝐷⁄ eq. (1)109
Several secondary models describing the impact of temperature (T) and relative 110
humidity (RH) on D values were tested. The gamma concept of inactivation was used 111
(24, 25). In this approach, the inactivation of a microbial population could be estimated 112
by: 113
𝑙𝑜𝑔10(𝐷) = 𝑙𝑜𝑔10(𝐷𝑟𝑒𝑓) − ∑ 𝑙𝑜𝑔10(𝜆𝑥𝑖(𝑥𝑖)) eq. (2) 114

6
Where λxi quantifies the influence of each environmental factors (xi corresponds to 115
temperature and relative humidity in this study) on the microbial resistance (Dref) 116
observed in reference conditions. 117
Based on eq. (2), five different secondary models were established. Models #1, #2 and 118
#3 do not consider the nature of the fomite. 119
Model #1 is the classical Bigelow model (26). It models only the effect of temperature. 120
The zT, the increase of temperature which leads to a tenfold reduction of D, value was 121
determined as the negative inverse slope of the plot of log10(D) versus temperature. zT is 122
the increase of temperature which leads to a ten-fold reduction of the decimal reduction 123
time. Tref is the reference temperature (set to 4°C in our study) and log10(Dref) is the 124
log10(D) at Tref. 125
Model #1 126
𝑙𝑜𝑔10(𝜆𝑇(𝑇)) =𝑇−𝑇𝑟𝑒𝑓
𝑧and 𝑙𝑜𝑔10(𝜆𝑅𝐻(𝑅𝐻)) = 0127
Model #2 considers the effect of temperature, however D values were fitted according to 128
temperature using a semi-log approach, derived from Mafart (25). 129
𝑙𝑜𝑔10(𝜆𝑇(𝑇)) = (𝑇−𝑇𝑟𝑒𝑓
𝑍𝑇)
2and 𝑙𝑜𝑔10(𝜆𝑅𝐻(𝑅𝐻)) = 0130
Model #3 is similar to model #2 but the shape parameter n was estimated instead of 131
being set to 2. 132
𝑙𝑜𝑔10(𝜆𝑇(𝑇)) = (𝑇−𝑇𝑟𝑒𝑓
𝑍𝑇)
𝑛and 𝑙𝑜𝑔10(𝜆𝑅𝐻(𝑅𝐻)) = 0133
134

7
The last two models (#4 and #5) consider the effect of temperature and the nature of the 135
fomites. The type of fomite was taken into account through the use of relative humidity. 136
Suspensions correspond to more than 99% RH conditions while surfaces are associated 137
with RH conditions below to this threshold. The models consider that surfaces at higher 138
relative humidity allow for more rapid inactivation and that inactivation in suspensions is 139
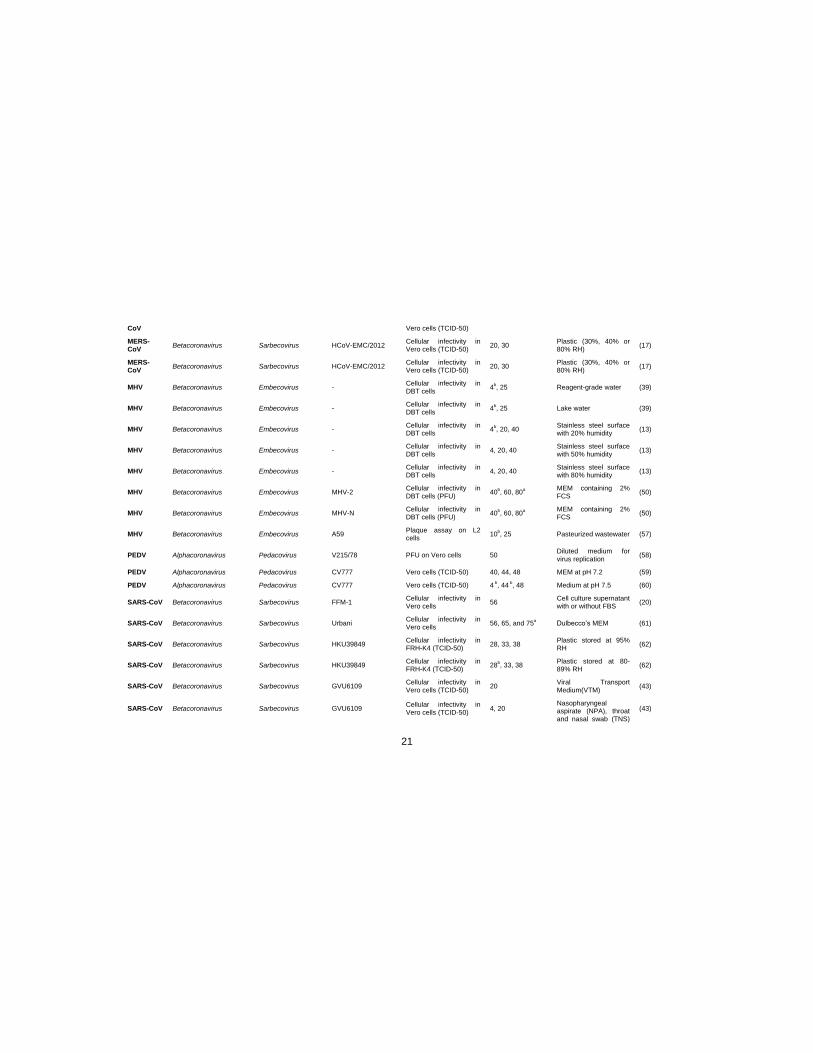
equivalent to inactivation on surfaces exposed to low RH. In model #4, the shape 140
parameter for temperature was set to 2 as in model #2. 141
𝑙𝑜𝑔10(𝜆𝑇(𝑇)) = (𝑇−𝑇𝑟𝑒𝑓
𝑍𝑇)
2and 𝑙𝑜𝑔10(𝜆𝑅𝐻(𝑅𝐻)) = {
RH
𝑧𝑅𝐻𝑅𝐻 < 99%
0 𝑅𝐻 ≥ 99%142
In model #5, n is a model parameter to be estimated. 143
𝑙𝑜𝑔10(𝜆𝑇(𝑇)) = (𝑇−𝑇𝑟𝑒𝑓
𝑍𝑇)
𝑛and 𝑙𝑜𝑔10(𝜆𝑅𝐻(𝑅𝐻)) = {
RH
𝑧𝑅𝐻𝑅𝐻 < 99%
0 𝑅𝐻 ≥ 99%144
In models #4 and #5, zRH is the increase of relative humidity, which leads to a ten-fold 145
reduction of the decimal reduction time. 146
2.4. Model’s parameters estimation 147
The model’s parameters were fitted with nls() R function. Confidence intervals of fitted 148
parameters were assessed by bootstrap using nlsBoot() function from nlsMicrobio R 149
package (27). The five models were compared according to penalized-likelihood criteria, 150
the Aikaike information criterion (AIC) (28) and Bayesian information criterion (BIC) (29). 151
𝐴𝐼𝐶 = 𝑝. 𝐿𝑛 (𝑅𝑆𝑆
𝑝) + 2𝑘
𝐵𝐼𝐶 = 𝑝. 𝐿𝑛 (𝑅𝑆𝑆
𝑝) + 𝑘. 𝐿𝑛(𝑝)
8
Where RSS is the residual sum of squares, p is the number of experimental points and k 152
the number of parameters in the model. The lower the AIC and BIC, the better the model 153
fits the dataset. 154
2.5. Data availability 155
The detailed information on the tables and figures where the data were collected are 156
given in appendix 1. All the scripts and data used to prepare figures and tables of this 157
manuscript are available in a Github repository (30). 158
159
3. Results160
3.1. Literature review results 161
Table 1 shows the detailed characteristics of the twenty-six studies that characterized 162
inactivation of a virus from the Coronaviridae family according to temperature and or 163
relative humidity. Some kinetics were not appropriate for characterizing inactivation rate 164
either because the duration of the experiments was too short to observe any significant 165
decrease of virus infectivity, or because the quantification limit was reached before the 166
first time point (Table 1). A total of 102 estimates of D-value were collected from 25 of 167
the 26 studies (Appendix 1). These kinetic values represent 605 individual data points. 168
For each curve, a D-value (i.e. decimal reduction time) was estimated. The 102 D-values 169
are given in Appendix 1. Among the 102 kinetic values, 44 are from members of the 170
Alphacoronavirus genus including one from Canine coronavirus (CCV), two for the feline 171
infectious peritonitis virus (FIPV), five for the porcine epidemic diarrhea virus (PEDV), 14 172
for the Human coronavirus 229E (HCoV-229E) and 22 from the porcine transmissible 173
gastroenteritis coronavirus (TGEV). The remaining 58 kinetics are related to the 174

9
Betacoronavirus genus, including two Human coronavirus - OC43 (HCoV-OC43), two for 175
the bovine coronavirus, 13 for the murine hepatitis virus (MHV), eight for the MERS-176
CoV, 22 for the SARS-CoV and 11 for the SARS-CoV-2. Figure 1 shows the 102 177
estimates of D-values, including 40 values on inert surfaces and 62 values in 178
suspension from temperatures ranging from 4°C to 68°C. Different suspensions were 179
noted, but most were laboratory media (Table 1). 180
3.2. Modelling the inactivation 181
The 102 D-values were fitted with five different models. Table 2 shows the performance 182
of these models to describe D-values according to temperature and relative humidity. 183
For the tested range of temperatures (between 4 and 68°C), model #1 (the classical 184
Bigelow model) based on a log-linear relation between D-values and temperature does 185
not perform as well as model #2 that considers a linear second-degree equation. Model 186
#3 offers a further refinement over model #2 by also fitting the degree of the equation (n 187
parameter). The fitted value of n was equal to 1.9 with a confidence interval that 188
includes 2 (i.e. model #2). Accordingly, the values taken by the parsimony criterions for 189
model selection AIC and BIC for model #2 and #3, indicate that n can be set to 2. 190
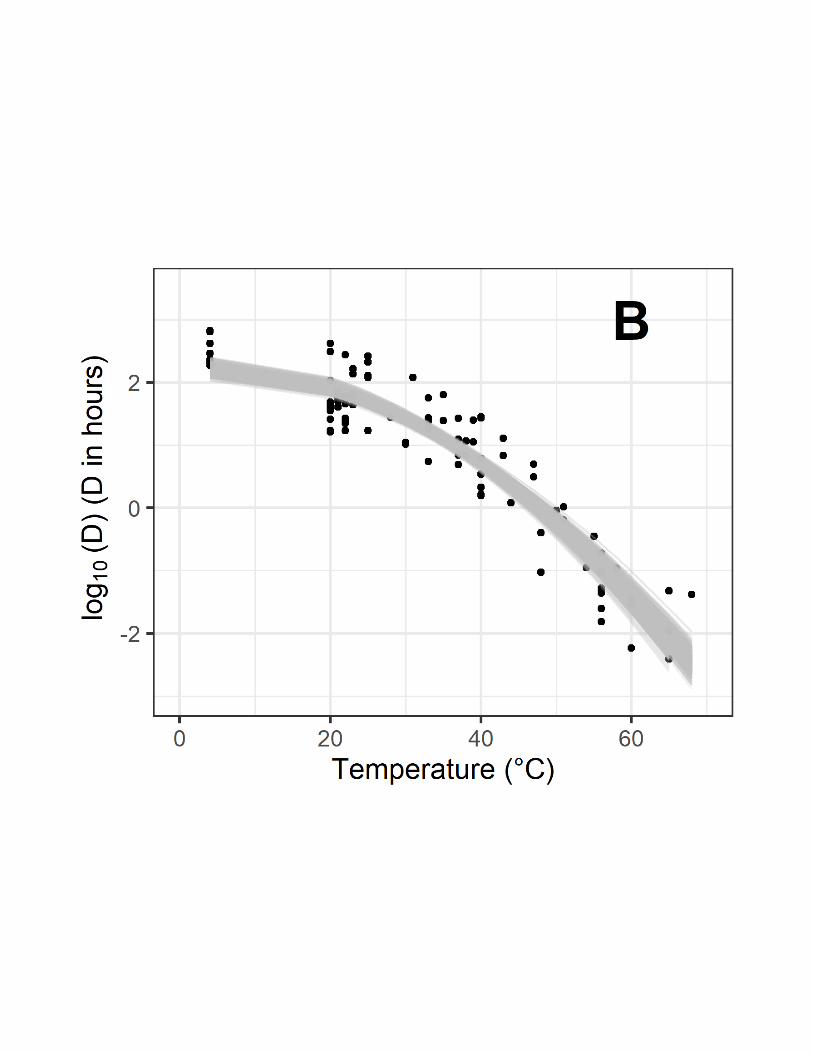
Figure 2 illustrates the performance of models #1 (Fig. 2A), #2 (Fig. 2B) and #3 (Fig. 3C) 191
for which only temperature effect is considered for predicting D-values. 192
Table 2 demonstrates that the inclusion of relative humidity should be considered. 193
Models #4 and #5 that describe the D-values according to temperature and relative 194
humidity were more appropriate models than models #1, #2 and #3 with a decrease of 195
AIC of more than 2 points in comparison with other models (31). The estimated value for 196
the shape parameter in model #5 is not different from the value two. According to BIC 197

10
criterion, model #4 and model #2 were the most appropriate and undistinguishable. 198
Based on these comparisons, model #4 was retained. Figure 3A shows the prediction of 199
inactivation rate according to T and RH for this model. The high zRH value (Table 2) 200
indicates that the impact of RH is far less important than temperature. For example, 201
increasing the relative humidity by 80%, e.g. from 10% to 90%, only reduces the D 202
values by a factor of 1.7. The same reduction factor of D-values can be obtained by a 203
small change of temperature, (e.g. changing from 10 to 15°C or from 60 to 61°C). Model 204
#2 was retained as well as it provides very similar performance. Figures 3B shows the 205
residuals for model #4. Comparative analysis of residuals of models #2 and #4 are 206
provided in Appendix 2 (Figure A2-1). 207
208
3.3. Potential use of the model 209
An Excel spreadsheet implementing model #4 has been prepared and is available in 210
Appendix 3. The spreadsheet can be used to estimate the number of decimal reductions 211
of infectivity of coronaviruses according to user defined time, temperature and relative 212
humidity. For example, the predicted inactivation at a temperature of 70°C for 1 minute 213
in liquid is -11.8 log10 with a 95% CI [-6.4; -22.1] for model #4 and -11.1 log10 with a 214
95% CI [-5.7; -21.4] for model #2. The spreadsheet also allows an estimate of the time 215
necessary to reach a target number of decimal reductions of infectivity with a certain 216
confidence level for both model #4 and model #2. For example, the time to reach a 5 217
log10 inactivation at 20°C and 75% relative humidity is 304 h with a 95% CI of [215; 426]. 218
It will be much longer at 20% relative humidity as the time to reach a 5 log10 inactivation 219
is predicted to be 438 h with a 95% CI of [339; 569]. Model #2 (that does not take into 220

11
account relative humidity), provides an estimate of the time to reach a 5 log10 221
inactivation at 20°C of 412 h with a 95% CI of [322; 539]. 222
223
4. Discussion224
Our study identified 102 kinetic values for inactivation of coronaviruses on surfaces and 225
in suspensions. The included studies cover those identified in three recently published 226
articles that conducted a systematic review on coronaviruses inactivation (32-34). These 227
data were used to suggest a novel inactivation model specific to the Coronaviridae 228
family. The modelling approach identified temperature and relative humidity as major 229
factors needed to predict infectious coronavirus persistence on fomites. 230
The log10 of D values was not linearly related to temperature in the range of 231
temperatures studied (4 – 68°C). Bertrand et al. (15) made a similar observation in a 232
meta-analysis for virus and phage inactivation in foods and water and proposed two 233
different models on either side of the threshold temperature of 50°C. Laude (16) 234
suggested a similar approach for TGEV with a threshold temperature at 45°C (16). The 235
modelling approach we used in our study allows fitting the inactivation values with a 236
single relation. In other meta-analysis on inactivation of viruses, Boehm et al. (22) and 237
Heßling et al. (35) did not observe such different trends but also studied smaller 238
temperature ranges. In the highest range of temperature (above 60°C), coronaviruses 239
are found to be far less heat resistant than non-enveloped viruses (36). 240
The present modelling approach considers the non-monotonous impact of relative 241
humidity on inactivation. Coronaviruses persisted better at low RHs and at 100% RH, 242
than for intermediate RHs. Another study has confirmed that low RH makes viruses 243

12
more resistant to thermal inactivation (37). Lin and Marr (38) recently observed the 244
same relation for two bacteriophages, where the observed RH where survival was worst 245
is close to 80% while in the present study, the less favorable condition for coronaviruses 246
was set to 99%. The data collected in the present study do not cover a uniform 247
distribution of temperatures and RH values. Further data corresponding to inactivation of 248
coronaviruses on surfaces at low humidities for temperature between 40 and 60°C 249
would help to refine assessment of impact of RH. Using a worst-case RH set to 99% 250
may be appropriate to estimate reductions in those situations until the model can be 251
refined. 252
As noted in the methods, all the kinetic values analyzed were established based on the 253
quantification of coronavirus infectivity with cell cultures. The model prediction did not 254
include other inactivation results from methods combining dyes with RT-qPCR. This 255
method (although more appropriate than classical RT-qPCR) can underestimate virus 256
infectivity (21, 22). 257
The data collected from the literature does not permit models specific to species at this 258
time. Our findings suggest that persistence potential of different coronaviruses is similar. 259
It confirms previous finding that advocates for the use of surrogates’ coronavirus such 260
as TGEV (39). This could considerably simplify the acquisition of relevant data for 261
persistence potential for other environmental factors. The data analyzed here only 262
include Alpha- and Betacoronavirus, as no data for the two other major genera, Delta- 263
and Gammacoronavirus, were identified. Inclusion of such data would help to challenge 264
the present model robustness. 265
The models developed in our study are specific to viruses from the Coronaviridae family. 266
Several studies on the inactivation of other viruses have suggested that the impact of 267

13
temperature can be modelled, as a whole, with a unique parameter (15, 22, 40). 268
Variability of behavior by virus type has been observed and model parameters to 269
account these differences have been proposed (22, 40), e.g. non-enveloped viruses are 270
known to show greater persistence in the environment (40). Like a recently proposed 271
model for SARS-CoV-2 (41), our model takes into consideration of relative humidity in 272
the prediction of inactivation. This integration is of high interest in the perspective of 273
assessment of seasonality on virus persistence (42). 274
It’s also worth noting our model is specific to fomites. Survival kinetics in fecal materials 275
were identified (43) but not considered for inclusion. The level of matrix contamination 276
with fecal materials has been shown to significantly increase the inactivation rate of 277
viruses (40), so by excluding these data, model predictions are biased to be fail-safe. 278
Inactivation data on porous surfaces were also not considered since it may be difficult to 279
determine if any measured inactivation is associated with real loss of infectivity or 280
difficulty in recovering viruses absorbed inside the porous material. That said, there is no 281
reason to consider that model predictions for coronaviruses are not pertinent to survival 282
on porous material (e.g. face masks). 283
Inactivation on anti-microbial surfaces, such as copper and silver, was also not 284
considered. For the same reason, model predictions are fail safe as surfaces including 285
copper or other antimicrobial compounds increase the inactivation rate of coronaviruses 286
(12, 44). 287
The predictions of the present model could support more robust decision‐making and 288
could be useful in various contexts such as blood safety assessment (45) or validation of 289
thermal inactivating treatments for room air, surfaces or suspensions. Indeed, an 290
important issue is the possibility of reusing privates or public offices, rooms of hotels, or 291

14
vehicles that are difficult to decontaminate. Moreover, many devices like electronics or 292
more sensitive materials, are not suitable for chemical decontamination processes which 293
could make them inoperative. Another aspect of decontamination is the economical 294
challenge as large scale decontamination of buildings can cost billions of dollars (46). 295
Furthermore, the use of detergents and/or disinfectants may have environmental 296
consequences. Thus the large scale decontamination of surfaces for SARS-CoV-2 that 297
are not necessarily in contact with people may not be required. For these reasons the 298
waiting time needed before handling suspected contaminated materials in absence of 299
decontamination is more than ever an important question. Having a calculator for the 300
natural clearance of SARS-CoV-2 depending on temperature could be a valuable 301
operational tool for public authorities (41). 302
The present model also opens the way for risk assessment for SARS-CoV-2 303
transmission through contact (47). Further model developments including data on matrix 304
pH, salinity and exposure to visible and UV light would also be important to consider (40, 305
48). 306
5. Acknowledgements307
The Covid-19 Emergency Collective Expert Appraisal Group members included the co-308
authors LG, S.M-L, E.C, N.P, S.L.P, M.S. and (in alphabetical order): Paul Brown, 309
Charlotte Dunoyer, Florence Etore, Elissa Khamisse, Meriadeg Legouil, François 310
Meurens, Gilles Meyer, Elodie Monchatre-Leroy, Gaëlle Simon and Astrid Vabret. 311
312
313
314

15
6. References315
1. Kutter JS, Spronken MI, Fraaij PL, Fouchier RA, Herfst S. 2018. Transmission316 routes of respiratory viruses among humans. Current Opinion in Virology 28:142-317 151.318
2. Lu J, Gu J, Li K, Xu C, Su W, Lai Z, Zhou D, Yu C, Xu B, Yang Z. 2020. COVID-319 19 Outbreak associated with air conditioning in restaurant, Guangzhou, China,320 2020. Emerging Infectious Diseases 26.321
3. Lee N, Hui D, Wu A, Chan P, Cameron P, Joynt GM, Ahuja A, Yung MY, Leung322 C, To K. 2003. A major outbreak of severe acute respiratory syndrome in Hong323 Kong. New England Journal of Medicine 348:1986-1994.324
4. Kim S-H, Chang SY, Sung M, Park JH, Bin Kim H, Lee H, Choi J-P, Choi WS,325 Min J-Y. 2016. Extensive viable Middle East respiratory syndrome (MERS)326 coronavirus contamination in air and surrounding environment in MERS isolation327 wards. Reviews of Infectious Diseases 63:363-369.328
5. Liu J, Liao X, Qian S, Yuan J, Wang F, Liu Y, Wang Z, Wang F, Liu L, Zhang Z.329 2020. Community transmission of Severe Acute Respiratory Syndrome330 Coronavirus 2, Shenzhen, China, 2020. Emerging Infectious Diseases 26.331
6. Chen Y-C, Huang L-M, Chan C-C, Su C-P, Chang S-C, Chang Y-Y, Chen M-L,332 Hung C-C, Chen W-J, Lin F-Y. 2004. SARS in hospital emergency room.333 Emerging Infectious Diseases 10:782.334
7. Danis K, Epaulard O, Bénet T, Gaymard A, Campoy S, Bothelo-Nevers E,335 Bouscambert-Duchamp M, Spaccaferri G, Ader F, Mailles A, Boudalaa Z, Tolsma336 V, Berra J, Vaux S, Forestier E, Landelle C, Fougere E, Thabuis A, Berthelot P,337 Veil R, Levy-Bruhl D, Chidiac C, Lina B, Coignard B, Saura C, Team I. 2020.338 Cluster of coronavirus disease 2019 (Covid-19) in the French Alps, 2020. Clinical339 Infectious Diseases doi:10.1093/cid/ciaa424.340
8. Otter JA, Donskey C, Yezli S, Douthwaite S, Goldenberg SD, Weber DJ. 2016.341 Transmission of SARS and MERS coronaviruses and influenza virus in342 healthcare settings: the possible role of dry surface contamination. Journal of343 Hospital Infection 92:235-250.344
9. Wolff MH, Sattar SA, Adegbunrin O, Tetro J. 2005. Environmental survival and345 microbicide inactivation of coronaviruses, p 201-212, Coronaviruses with special346 emphasis on first insights concerning SARS. Springer.347
10. Medema G, Heijnen L, Elsinga G, Italiaander R, Brouwer A. 2020. Presence of348 SARS-Coronavirus-2 in sewage. medRxiv349 doi:https://doi.org/10.1101/2020.03.29.20045880.350
11. Chin A, Chu J, Perera M, Hui K, Yen H-L, Chan M, Peiris M, Poon L. 2020.351 Stability of SARS-CoV-2 in different environmental conditions. . The Lancet352 Microbe https://doi.org/10.1016/S2666-5247(20)30003-3.353
12. van Doremalen N, Bushmaker T, Morris DH, Holbrook MG, Gamble A, Williamson354 BN, Tamin A, Harcourt JL, Thornburg NJ, Gerber SI. 2020. Aerosol and surface355 stability of SARS-CoV-2 as compared with SARS-CoV-1. New England Journal of356 Medicine.357
13. Casanova LM, Jeon S, Rutala WA, Weber DJ, Sobsey MD. 2010. Effects of air358 temperature and relative humidity on coronavirus survival on surfaces. Appl359 Environ Microbiol 76:2712-2717.360

16
14. Bozkurt H, D'Souza DH, Davidson PM. 2015. Thermal inactivation kinetics of361 human norovirus surrogates and hepatitis A virus in turkey deli meat. Appl362 Environ Microbiol 81:4850-4859.363
15. Bertrand I, Schijven J, Sánchez G, Wyn‐Jones P, Ottoson J, Morin T, Muscillo M,364 Verani M, Nasser A, de Roda Husman A. 2012. The impact of temperature on the365 inactivation of enteric viruses in food and water: a review. Journal of Applied366 Microbiology 112:1059-1074.367
16. Laude H. 1981. Thermal inactivation studies of a coronavirus, transmissible368 gastroenteritis virus. Journal of General Virology 56:235-240.369
17. Van Doremalen N, Bushmaker T, Munster V. 2013. Stability of Middle East370 respiratory syndrome coronavirus (MERS-CoV) under different environmental371 conditions. Eurosurveillance 18:20590.372
18. Ijaz M, Brunner A, Sattar S, Nair RC, Johnson-Lussenburg C. 1985. Survival373 characteristics of airborne human coronavirus 229E. Journal of General Virology374 66:2743-2748.375
19. Ijaz M, Karim Y, Sattar S, Johnson-Lussenburg C. 1987. Development of376 methods to study the survival of airborne viruses. Journal of Virological Methods377 18:87-106.378
20. Rabenau H, Cinatl J, Morgenstern B, Bauer G, Preiser W, Doerr H. 2005. Stability379 and inactivation of SARS coronavirus. Medical Microbiology and Immunology380 194:1-6.381
21. Coudray-Meunier C, Fraisse A, Martin-Latil S, Guillier L, Perelle S. 2013.382 Discrimination of infectious hepatitis A virus and rotavirus by combining dyes and383 surfactants with RT-qPCR. BMC microbiology 13:216.384
22. Boehm AB, Silverman AI, Schriewer A, Goodwin K. 2019. Systematic review and385 meta-analysis of decay rates of waterborne mammalian viruses and coliphages in386 surface waters. Water research 164:114898.387
23. Poisot T. 2011. The digitize package: extracting numerical data from scatterplots.388 The R Journal 3:25-26.389
24. Coroller L, Kan-King-Yu D, Leguerinel I, Mafart P, Membré J-M. 2012. Modelling390 of growth, growth/no-growth interface and nonthermal inactivation areas of391 Listeria in foods. International Journal of Food Microbiology 152:139-152.392
25. Mafart P. 2000. Taking injuries of surviving bacteria into account for optimising393 heat treatments. International Journal of Food Microbiology 55:175-179.394
26. Bigelow W. 1921. The logarithmic nature of thermal death time curves. The395 Journal of Infectious Diseases:528-536.396
27. Baty F, Delignette-Muller M. 2017. nlsMicrobio: data sets and nonlinear397 regression models dedicated to predictive microbiology. R package version 0.0-1.398
28. Akaike H. 1974. A new look at the statistical model identification. IEEE399 Transactions on Automatic Control 19:716-723.400
29. Schwarz G. 1978. Estimating the dimension of a model. The Annals of Statistics401 6:461-464.402
30. Guillier L. 2020. Data and models related to coronaviruses inactivation.403 https://github.com/lguillier/Persistence-Coronavirus.404
31. Burnham KP, Anderson DR. 1998. Practical use of the information-theoretic405 approach, p 75-117, Model selection and inference. Springer.406

17
32. Kampf G, Voss A, Scheithauer S. 2020. Inactivation of coronaviruses by heat. 407 Journal of Hospital Infection. 408
33. La Rosa G, Bonadonna L, Lucentini L, Kenmoe S, Suffredini E. 2020.409 Coronavirus in water environments: Occurrence, persistence and concentration410 methods-A scoping review. Water Research:115899.411
34. Kampf G, Todt D, Pfaender S, Steinmann E. 2020. Persistence of coronaviruses412 on inanimate surfaces and its inactivation with biocidal agents. Journal of Hospital413 Infection.414
35. Heßling M, Hoenes K, Lingenfelder C. 2020. Selection of parameters for thermal415 Coronavirus inactivation–A data-based recommendation. GMS Hygiene and416 Infection Control in press.417
36. Firquet S, Beaujard S, Lobert P-E, Sané F, Caloone D, Izard D, Hober D. 2014.418 Viruses contained in droplets applied on warmed surface are rapidly inactivated.419 Microbes and Environments 29:408-412.420
37. Sauerbrei A, Wutzler P. 2009. Testing thermal resistance of viruses. Archives of421 virology 154:115-119.422
38. Lin K, Marr LC. 2019. Humidity-Dependent Decay of Viruses, but Not Bacteria, in423 Aerosols and Droplets Follows Disinfection Kinetics. Environmental Science &424 Technology 54:1024-1032.425
39. Casanova L, Rutala WA, Weber DJ, Sobsey MD. 2009. Survival of surrogate426 coronaviruses in water. Water research 43:1893-1898.427
40. Brainard J, Pond K, Hunter PR. 2017. Censored regression modeling to predict428 virus inactivation in wastewaters. Environmental science & technology 51:1795-429 1801.430
41. United States Department of Homeland Security. 2020. SARS-CoV-2 Indoor431 Environmental Stability Predictive Model. Available at:432 https://www.dhs.gov/sites/default/files/publications/sars-cov-433 2_environment_predictive_model_factsheet_2.pdf434
42. Prussin AJ, Schwake DO, Lin K, Gallagher DL, Buttling L, Marr LC. 2018.435 Survival of the enveloped virus Phi6 in droplets as a function of relative humidity,436 absolute humidity, and temperature. Appl Environ Microbiol 84:e00551-18.437
43. Lai MY, Cheng PK, Lim WW. 2005. Survival of severe acute respiratory438 syndrome coronavirus. Clinical Infectious Diseases 41:e67-e71.439
44. Warnes SL, Little ZR, Keevil CW. 2015. Human coronavirus 229E remains440 infectious on common touch surface materials. MBio 6:e01697-15.441
45. Chang L, Yan Y, Wang L. 2020. Coronavirus Disease 2019: Coronaviruses and442 Blood Safety. Transfusion Medicine Reviews443 doi:https://doi.org/10.1016/j.tmrv.2020.02.003.444
46. Schmitt K, Zacchia NA. 2012. Total decontamination cost of the anthrax letter445 attacks. Biosecurity and bioterrorism: biodefense strategy, practice, and science446 10:98-107.447
47. Haas C. 2020. Coronavirus and Risk Analysis. Risk Analysis 40:660-661.448 48. Heßling M, Hönes K, Vatter P, Lingenfelder C. 2020. Ultraviolet irradiation doses449
for coronavirus inactivation–review and analysis of coronavirus photoinactivation450 studies. GMS Hygiene and Infection Control 15.451

18
49. Mullis L, Saif LJ, Zhang Y, Zhang X, Azevedo MS. 2012. Stability of bovine452 coronavirus on lettuce surfaces under household refrigeration conditions. Food453 Microbiology 30:180-186.454
50. Saknimit M, Inatsuki I, Sugiyama Y, Yagami K. 1988. Virucidal efficacy of455 physico-chemical treatments against coronaviruses and parvoviruses of456 laboratory animals. Jikken dobutsu Experimental animals 37:341.457
51. Christianson K, Ingersoll J, Landon R, Pfeiffer N, Gerber J. 1989.458 Characterization of a temperature sensitive feline infectious peritonitis459 coronavirus. Archives of Virology 109:185-196.460
52. Gundy PM, Gerba CP, Pepper IL. 2009. Survival of coronaviruses in water and461 wastewater. Food and Environmental Virology 1:10.462
53. Bucknall RA, King LM, Kapikian AZ, Chanock RM. 1972. Studies with human463 coronaviruses II. Some properties of strains 229E and OC43. Proceedings of the464 Society for Experimental Biology and Medicine 139:722-727.465
54. Sizun J, Yu M, Talbot P. 2000. Survival of human coronaviruses 229E and OC43466 in suspension and after drying onsurfaces: a possible source ofhospital-acquired467 infections. Journal of Hospital Infection 46:55-60.468
55. Lamarre A, Talbot PJ. 1989. Effect of pH and temperature on the infectivity of469 human coronavirus 229E. Canadian Journal of Microbiology 35:972-974.470
56. Leclercq I, Batejat C, Burguière AM, Manuguerra JC. 2014. Heat inactivation of471 the Middle East Respiratory Syndrome coronavirus. Influenza and Other472 Respiratory Viruses 8:585-586.473
57. Ye Y, Ellenberg RM, Graham KE, Wigginton KR. 2016. Survivability, partitioning,474 and recovery of enveloped viruses in untreated municipal wastewater.475 Environmental Science & Technology 50:5077-5085.476
58. Hofmann M, Wyler R. 1989. Quantitation, biological and physicochemical477 properties of cell culture-adapted porcine epidemic diarrhea coronavirus (PEDV).478 Veterinary Microbiology 20:131-142.479
59. Quist-Rybachuk G, Nauwynck H, Kalmar I. 2015. Sensitivity of porcine epidemic480 diarrhea virus (PEDV) to pH and heat treatment in the presence or absence of481 porcine plasma. Veterinary microbiology 181:283-288.482
60. Hulst MM, Heres L, Hakze‐van der Honing R, Pelser M, Fox M, van der Poel WH.483 2019. Study on inactivation of porcine epidemic diarrhoea virus, porcine484
sapelovirus 1 and adenovirus in the production and storage of laboratory spray‐485 dried porcine plasma. Journal of Applied Microbiology 126:1931-1943.486
61. Darnell ME, Subbarao K, Feinstone SM, Taylor DR. 2004. Inactivation of the487 coronavirus that induces severe acute respiratory syndrome, SARS-CoV. Journal488 of virological methods 121:85-91.489
62. Chan K, Peiris J, Lam S, Poon L, Yuen K, Seto W. 2011. The effects of490 temperature and relative humidity on the viability of the SARS coronavirus.491 Advances in Virology 2011.492
63. Pagat A-M, Seux-Goepfert R, Lutsch C, Lecouturier V, Saluzzo J-F, Kusters IC.493 2007. Evaluation of SARS-Coronavirus decontamination procedures. Applied494 Biosafety 12:100-108.495
64. Kariwa H, Fujii N, Takashima I. 2006. Inactivation of SARS coronavirus by means496 of povidone-iodine, physical conditions and chemical reagents. Dermatology497 212:119-123.498

19
65. Batejat C, Grassin Q, Manuguerra J-C, Leclercq I. 2020. Heat inactivation of the499 Severe Acute Respiratory Syndrome Coronavirus 2. 500 bioRxiv:https://doi.org/10.1101/2020.05.01.067769. 501
502

20
Table 1. Characteristics of the studies that explored inactivation of infectivity of coronavirus. 503
Virus Genus Sub-genus Strain Measurement Temperatures
(°C)
Conditions associated with treatment
Study reference
BCoV Betacoronavirus Embecovirus Strain 88 PFU in Human rectal tumor (HRT)-18 cells
4
Salad, Minimal Essential Media (MEM) containing 2% Fetal Bovine Serum (FBS)
(49)
CCV Alphacoronavirus Tegacovirus I-71 CRFK cells (PFU) 60, 80a
MEM containing 2% Fetal Calf Serum (FCS)
(50)
FIPV Alphacoronavirus Tegacovirus DF2-WT Feline kidney (NLFK) cells
54 Basal Medium Eagle (51)
FIPV Alphacoronavirus Tegacovirus ATCC-990 Crandell Reese feline kidney cell line
4b, 23
Dechlorinated, filtered tap water
(52)
HCoV Alphacoronavirus Duvinacovirus 229E Cellular infectivity in cell strain (HDCS) WI38
33, 37 Maintenance medium 2% FCS
(53)
HCoV Alphacoronavirus Duvinacovirus 229E Cellular infectivity in lung cell line L132
21b
PBS, Earle’s MEM, Earle’s MEM to with added suspended cells
(54)
HCoV Alphacoronavirus Duvinacovirus 229E Cellular infectivity in lung cell line L132
21b
Aluminum, sponge, latex at 65% RH
(54)
HCoV Alphacoronavirus Duvinacovirus 229E CPE on MRC-5 cells 21 Teflon, PVC, Rubber, Steel, Plastic
(44)
HCoV Alphacoronavirus Duvinacovirus 229E - 23 Cell culture supernatant with or without FBS
(20)
HCoV Alphacoronavirus Duvinacovirus 229E MRC-5 cells (TCID-50) 4b, 23
Dechlorinated, filtered tap water
(52)
HCoV Alphacoronavirus Duvinacovirus 229E Cellular infectivity in lung cell line L132
4b, 22, 33, 37 Earle’s MEM (55)
HCoV Betacoronavirus Embecovirus OC43 Cellular infectivity in cell strain (HDCS) WI38
33, 37 Maintenance medium 2% FCS
(53)
HCoV Betacoronavirus Embecovirus OC43 Cellular infectivity in human rectal tumor cell line HRT-18
21b
PBS, Earle’s MEM, Earle’s MEM to with added suspended cells
(54)
HCoV Betacoronavirus Embecovirus OC43 Cellular infectivity in human rectal tumor cell line HRT-18
21b
Aluminum, spongea,
latexa at 65% RH
(54)
MERS- Betacoronavirus Sarbecovirus FRA2 Cellular infectivity in 25b, 56, 65 Cell culture supernatant (56)
21
CoV Vero cells (TCID-50)
MERS-CoV
Betacoronavirus Sarbecovirus HCoV-EMC/2012 Cellular infectivity in Vero cells (TCID-50)
20, 30 Plastic (30%, 40% or 80% RH)
(17)
MERS-CoV
Betacoronavirus Sarbecovirus HCoV-EMC/2012 Cellular infectivity in Vero cells (TCID-50)
20, 30 Plastic (30%, 40% or 80% RH)
(17)
MHV Betacoronavirus Embecovirus - Cellular infectivity in DBT cells
4b, 25 Reagent-grade water (39)
MHV Betacoronavirus Embecovirus - Cellular infectivity in DBT cells
4b, 25 Lake water (39)
MHV Betacoronavirus Embecovirus - Cellular infectivity in DBT cells
4b, 20, 40
Stainless steel surface with 20% humidity
(13)
MHV Betacoronavirus Embecovirus - Cellular infectivity in DBT cells
4, 20, 40 Stainless steel surface with 50% humidity
(13)
MHV Betacoronavirus Embecovirus - Cellular infectivity in DBT cells
4, 20, 40 Stainless steel surface with 80% humidity
(13)
MHV Betacoronavirus Embecovirus MHV-2 Cellular infectivity in DBT cells (PFU)
40b, 60, 80
a
MEM containing 2% FCS
(50)
MHV Betacoronavirus Embecovirus MHV-N Cellular infectivity in DBT cells (PFU)
40b, 60, 80
a
MEM containing 2% FCS
(50)
MHV Betacoronavirus Embecovirus A59 Plaque assay on L2 cells
10b, 25 Pasteurized wastewater (57)
PEDV Alphacoronavirus Pedacovirus V215/78 PFU on Vero cells 50 Diluted medium for virus replication
(58)
PEDV Alphacoronavirus Pedacovirus CV777 Vero cells (TCID-50) 40, 44, 48 MEM at pH 7.2 (59)
PEDV Alphacoronavirus Pedacovirus CV777 Vero cells (TCID-50) 4 b, 44
b, 48 Medium at pH 7.5 (60)
SARS-CoV Betacoronavirus Sarbecovirus FFM-1 Cellular infectivity in Vero cells
56 Cell culture supernatant with or without FBS
(20)
SARS-CoV Betacoronavirus Sarbecovirus Urbani Cellular infectivity in Vero cells
56, 65, and 75a Dulbecco’s MEM (61)
SARS-CoV Betacoronavirus Sarbecovirus HKU39849 Cellular infectivity in FRH-K4 (TCID-50)
28, 33, 38 Plastic stored at 95% RH
(62)
SARS-CoV Betacoronavirus Sarbecovirus HKU39849 Cellular infectivity in FRH-K4 (TCID-50)
28b, 33, 38
Plastic stored at 80-89% RH
(62)
SARS-CoV Betacoronavirus Sarbecovirus GVU6109 Cellular infectivity in Vero cells (TCID-50)
20 Viral Transport Medium(VTM)
(43)
SARS-CoV Betacoronavirus Sarbecovirus GVU6109 Cellular infectivity in Vero cells (TCID-50)
4, 20 Nasopharyngeal aspirate (NPA), throat and nasal swab (TNS)
(43)

22
or VTM
SARS-CoV Betacoronavirus Sarbecovirus Tor2 AY274119.3 Cellular infectivity in Vero cells (TCID-50)
22 Plastic and stainless steel stored at 40°C
(12)
SARS-CoV Betacoronavirus Sarbecovirus Utah Cellular infectivity in Vero cells (TCID-50)
58, 68 Iscove’s 4% FCS medium
(63)
SARS-CoV Betacoronavirus Sarbecovirus Utah Cellular infectivity in Vero cells (TCID-50)
22 Glass surface store at 10-25% RH
(63)
SARS-CoV Betacoronavirus Sarbecovirus Hanoi Cellular infectivity in Vero cells (TCID-50)
56 MEM (64)
SARS-CoV2
Betacoronavirus Sarbecovirus - Cellular infectivity in Vero cells (TCID-50)
4, 22, 37, 56, 70 a VTM (11)
SARS-CoV2
Betacoronavirus Sarbecovirus - Cellular infectivity in Vero cells (TCID-50)
22 Plastic and stainless steel at 65% RH
(11)
SARS-CoV2
Betacoronavirus Sarbecovirus WA1-2020 (MN985325.1)
Cellular infectivity in Vero cells (TCID-50)
22 Plastic and stainless steel stored at 40°C
(12)
SARS-CoV2
Betacoronavirus Sarbecovirus - Cellular infectivity in Vero cells (TCID-50)
56, 65a
Cell culture supernatants
(65)
SARS-CoV2
Betacoronavirus Sarbecovirus - Cellular infectivity in Vero cells (TCID-50)
65, 95a
Nasopharyngal samples
(65)
SARS-CoV2
Betacoronavirus Sarbecovirus - Cellular infectivity in Vero cells (TCID-50)
56 Sera (65)
TGEV Alphacoronavirus Tegacovirus. D52 Cellular infectivity in RPtg cells
31, 35, 39, 43, 47, 51 and 55
In HEPES solution at pH 7
(16)
TGEV Alphacoronavirus Tegacovirus. D52 Cellular infectivity in RPtg cells
35, 39, 43, 47, and 51
In HEPES solution at pH 8
(16)
TGEV Alphacoronavirus Tegacovirus. - Cellular infectivity in ST cells
4b, 20, 40
Stainless steel surface with 20% RH
(13)
TGEV Alphacoronavirus Tegacovirus. - Cellular infectivity in ST cells
4, 20, 40 Stainless steel surface with 50% RH
(13)
TGEV Alphacoronavirus Tegacovirus. - Cellular infectivity in ST cells
4, 20, 40 Stainless steel surface with 80% RH
(13)
TGEV Alphacoronavirus Tegacovirus. - Cellular infectivity in ST cells
4b, 25 Reagent-grade water (39)
TGEV Alphacoronavirus Tegacovirus. - Cellular infectivity in ST cells
4b, 25 Lake water (39)
a not included: limit of quantification reached for the first sample time 504
b not included: not enough decrease observed during experimentation 505
- data not specified 506

23
Table 2. Characteristics of the different models fitted to the 102 decimal reduction time 507
data of coronaviruses according to temperature (Tref set at 4°C) and relative humidity 508
Model Fitted parameters Best fit values [95%CI bootstrap intervals]
Bayesian information criterion Aikaike information criterion
Model #1 log10Dref zT
3.1 [2.8 - 3.3] 13.8 [12.7 - 15.1]
-124.7 -130.0
Model #2 log10Dref zT
2.2 [2.1 - 2.3] 29.4 [28.4 - 30.5]
-160.6 -165.9
Model #3 log10Dref zT n
2.3 [2.1 - 2.6] 27.7 [23.2 – 31.6] 1.9 [1.5 - 2.2]
-156.7 -164.6
Model #4 log10Dref zT zRH
2.3 [2.2 - 2.5] 29.1 [28.1 - 30.1] 341.4.7 [190.1 - 5631.4]
-160.2 -168.0
Model #5 log10Dref zT zRH n
2.4 [2.2 - 2.6] 27.5 [23.6 - 31.2] 330.7 [182.8 – 7020,1] 1.9 [1.6 - 2.2]
-156.2 -166.6
509
510

24
511
Figure 1. Decimal reduction times of ten coronaviruses according to temperature in 512
suspension or on inert surfaces. 513
514
Figure 2. Observed (points) and fitted (grey lines) log decimal reduction time values 515
according to temperature for model #1 (A), model #2 (B) and #3 (C). One thousand (1000) 516
bootstrap values of uncertainty characterization are shown. Estimates of model 517
parameters are given in Table 2. 518
519
Figure 3. (A) Observed inactivation rate values (grey points) according to temperature 520
(°C) and relative humidity (%) and Model #4 surface predictions. Scatter points of 521
observed versus predicted D-values (D in hours) for model #4 (B). The dashed line 522
represents a perfect match between observations and predictions. 523