Embed Size (px)
Citation preview

Niamh Holton
NERI (Nevin Economic Research Institute)
Dublin
www.NERInstitute.net
Modelling the Impact of an Increase in Low Pay in the
Republic of Ireland
ISPA Conference
1st July 2016
Outline 1. Context
2. Motivation
3. Data
4. Methodology
5. Who is Effected?
6. What will be the effect on the Wage Bill
and Employment Levels?
7. Conclusion
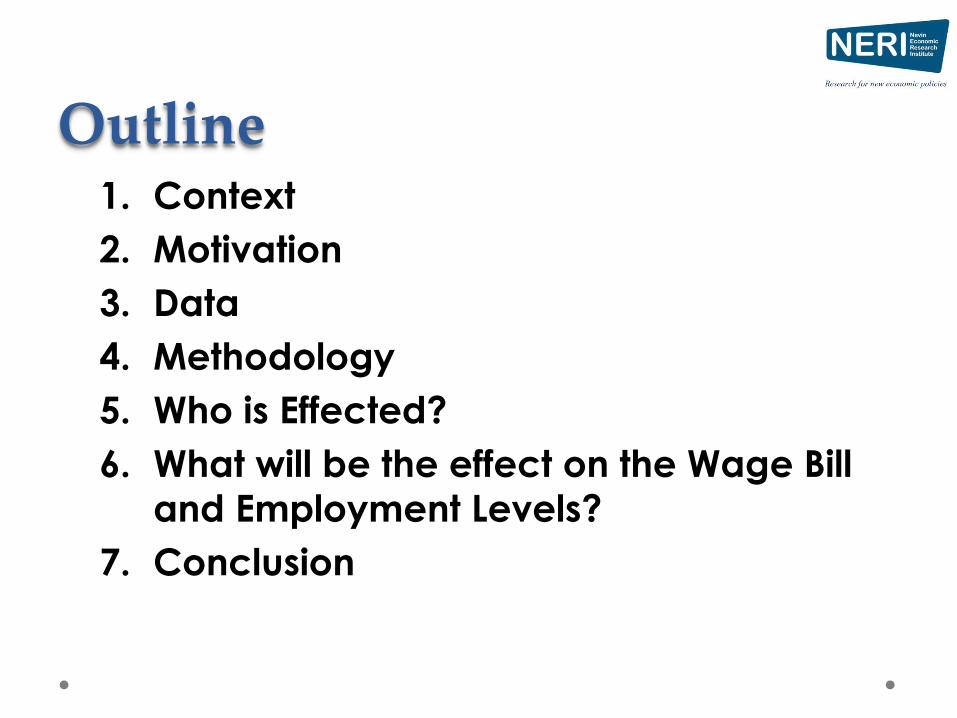
Context • Low Pay is back on the agenda
o Predistribution; Low Pay Commission; Government commitments…
• Introduction of National Living Wage in the UK for those aged 25+ as part of the intention to “tackle low pay and ensure that lower wage workers can take a greater share of the gains from growth” o 2016 – 55% of 25+ median wage
o 2020 – 60% of 25+ median wage
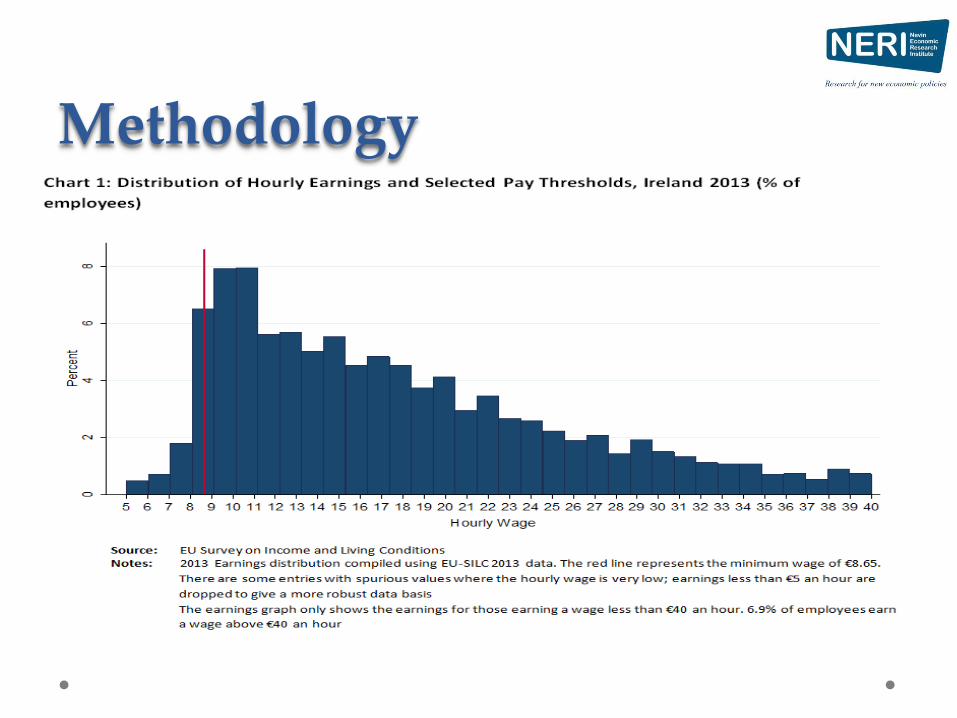
• Eurostat (2012) define someone who is on low pay as an employee earning a wage that is below two thirds of the median hourly wage in that country.
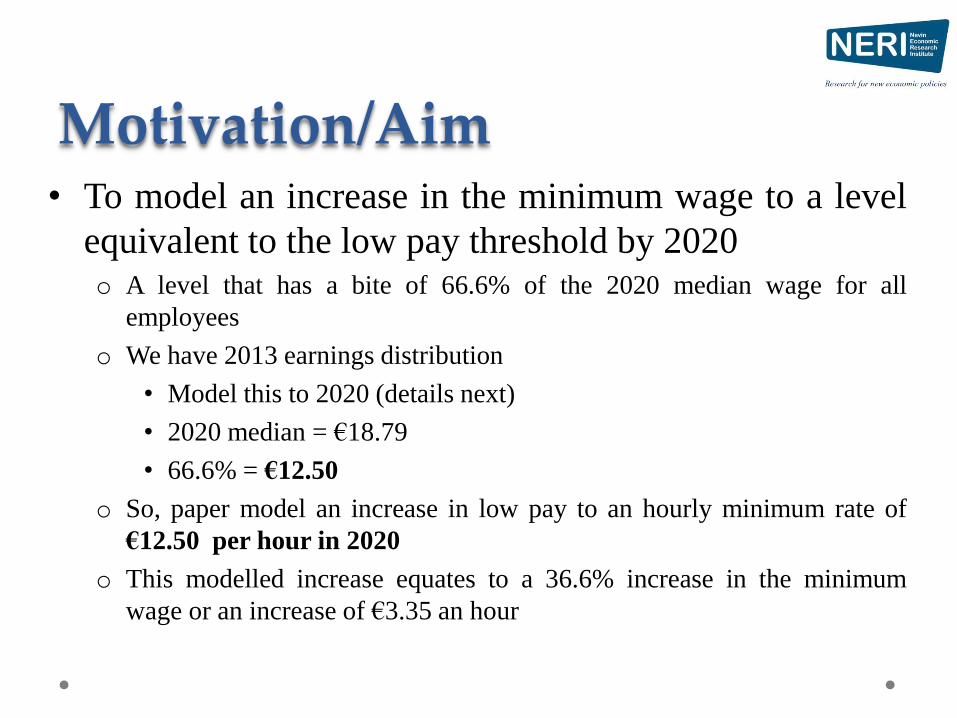
Motivation/Aim • To model an increase in the minimum wage to a level
equivalent to the low pay threshold by 2020 o A level that has a bite of 66.6% of the 2020 median wage for all
employees
o We have 2013 earnings distribution
• Model this to 2020 (details next)
• 2020 median = €18.79
• 66.6% = €12.50
o So, paper model an increase in low pay to an hourly minimum rate of
€12.50 per hour in 2020
o This modelled increase equates to a 36.6% increase in the minimum
wage or an increase of €3.35 an hour
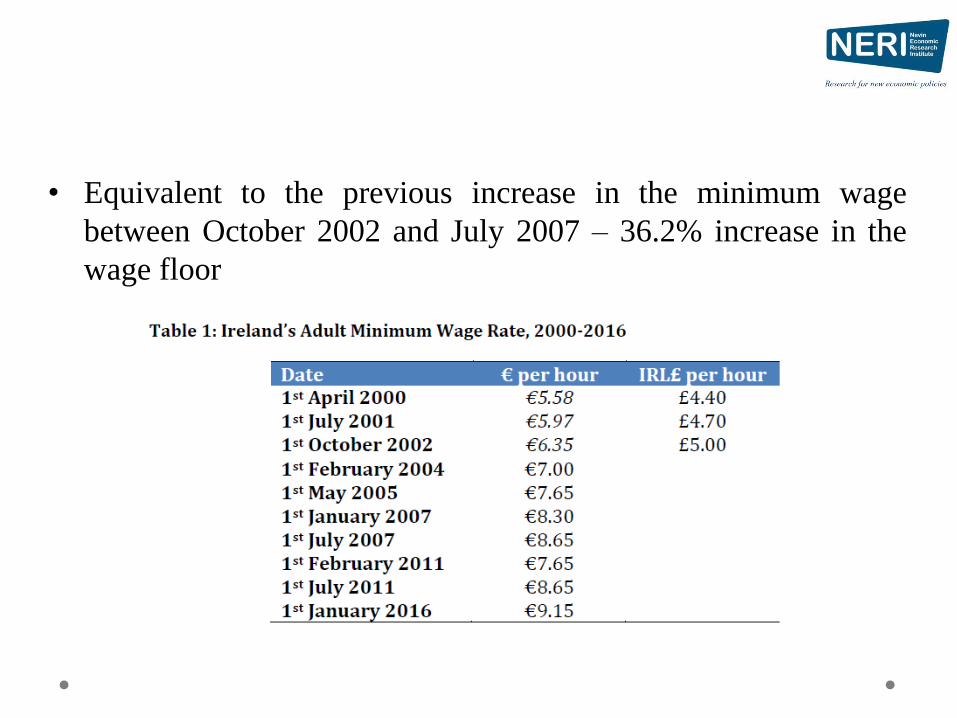
• Equivalent to the previous increase in the minimum wage
between October 2002 and July 2007 – 36.2% increase in the
wage floor
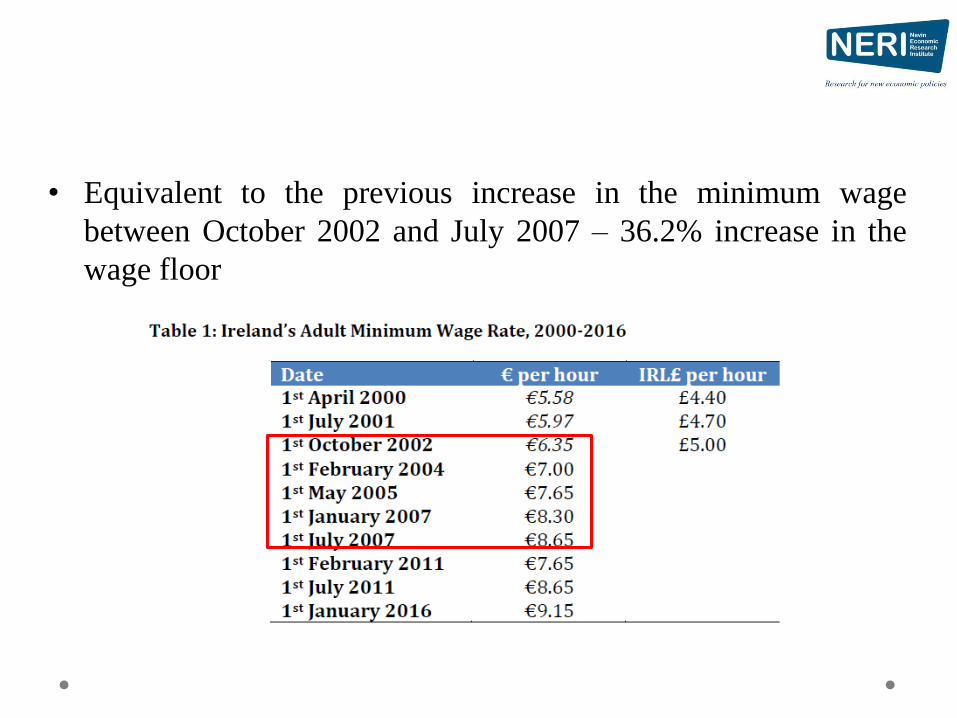
• Equivalent to the previous increase in the minimum wage
between October 2002 and July 2007 – 36.2% increase in the
wage floor
Data • CSO’s 2013 EU Survey on Income and Living Conditions
o 4,922 Households and 12,663 Individuals
• Detailed data on income, earnings and living conditions
o Income data cross checked with tax and welfare records
o Sampling frame and weighting procedures are designed to ensure the
sample is representative of the population
• Employees
o 3,369 employees
o PES=at work
o Detailed personal and household characteristics
o Hourly wage
Methodology
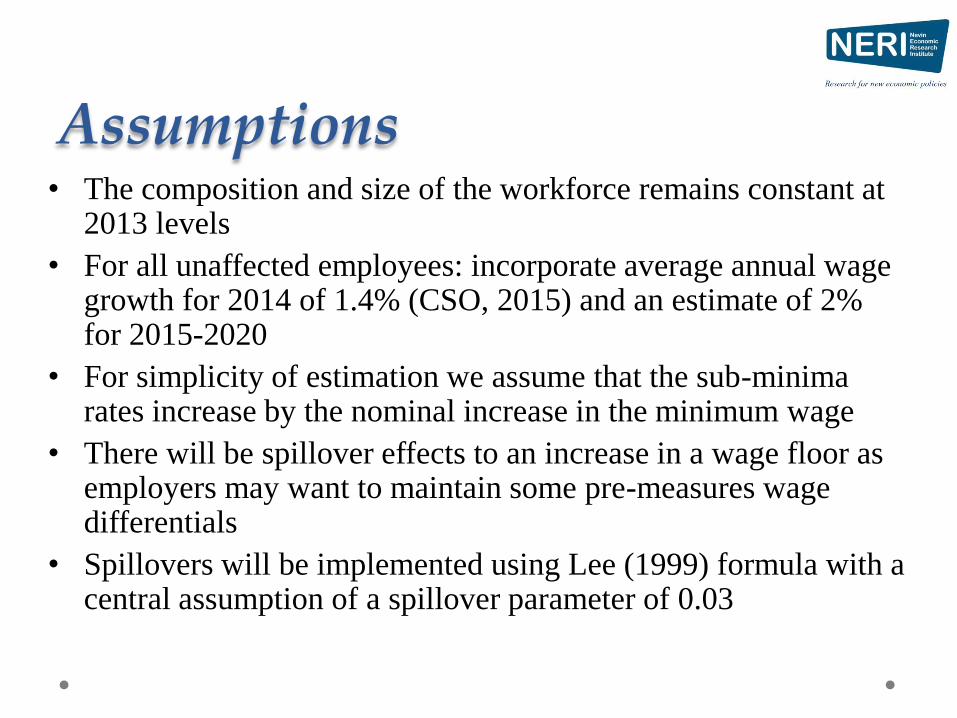
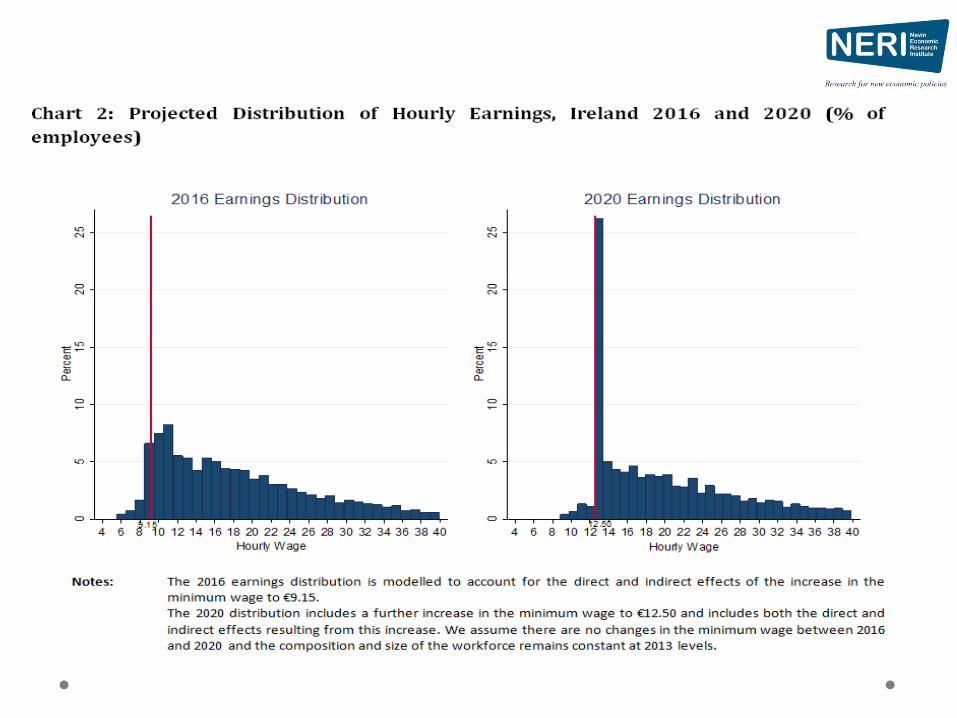
Assumptions • The composition and size of the workforce remains constant at
2013 levels
• For all unaffected employees: incorporate average annual wage growth for 2014 of 1.4% (CSO, 2015) and an estimate of 2% for 2015-2020
• For simplicity of estimation we assume that the sub-minima rates increase by the nominal increase in the minimum wage
• There will be spillover effects to an increase in a wage floor as employers may want to maintain some pre-measures wage differentials
• Spillovers will be implemented using Lee (1999) formula with a central assumption of a spillover parameter of 0.03
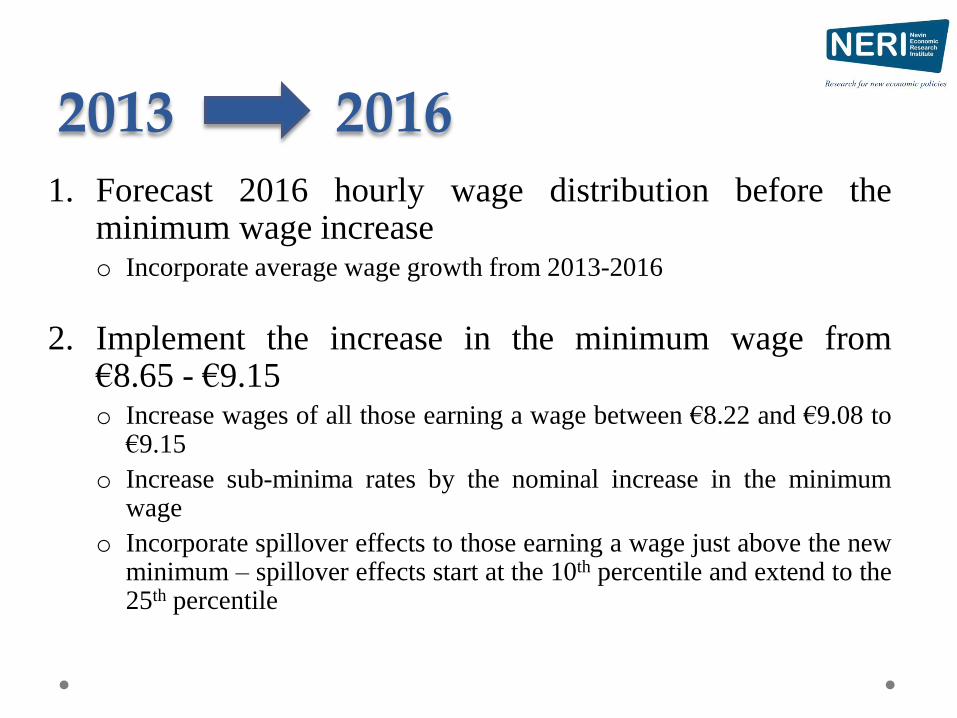
2013 2016 1. Forecast 2016 hourly wage distribution before the
minimum wage increase o Incorporate average wage growth from 2013-2016
2. Implement the increase in the minimum wage from €8.65 - €9.15 o Increase wages of all those earning a wage between €8.22 and €9.08 to
€9.15
o Increase sub-minima rates by the nominal increase in the minimum wage
o Incorporate spillover effects to those earning a wage just above the new minimum – spillover effects start at the 10th percentile and extend to the 25th percentile
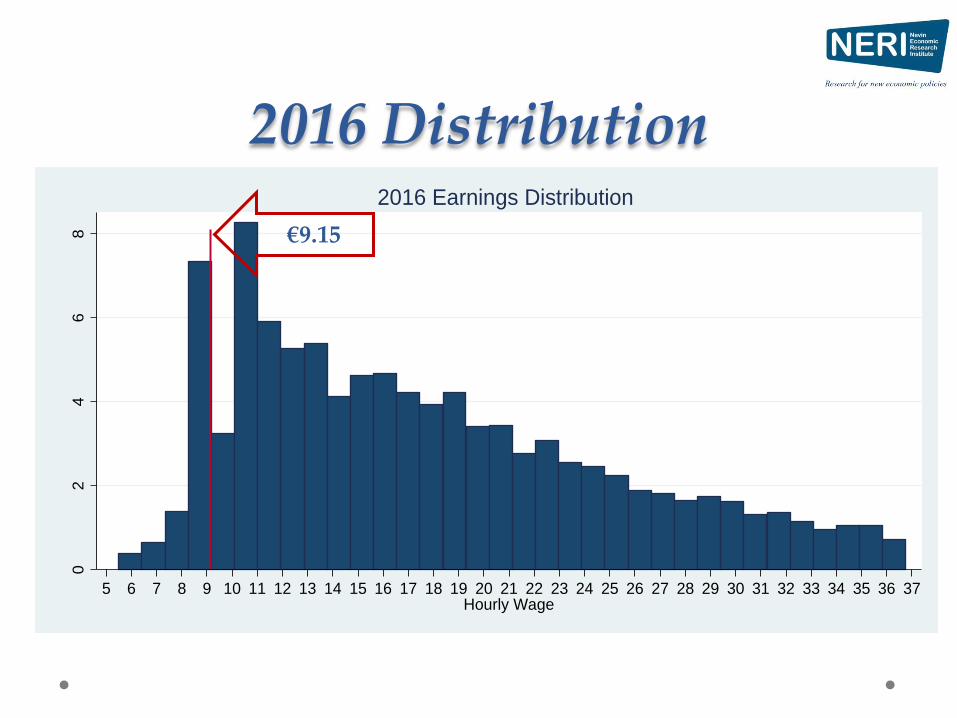
2016 Distribution 0
24
68
Perc
ent
5 6 7 8 9 10 11 12 13 14 15 16 17 18 19 20 21 22 23 24 25 26 27 28 29 30 31 32 33 34 35 36 37Hourly Wage
2016 Earnings Distribution
€9.15
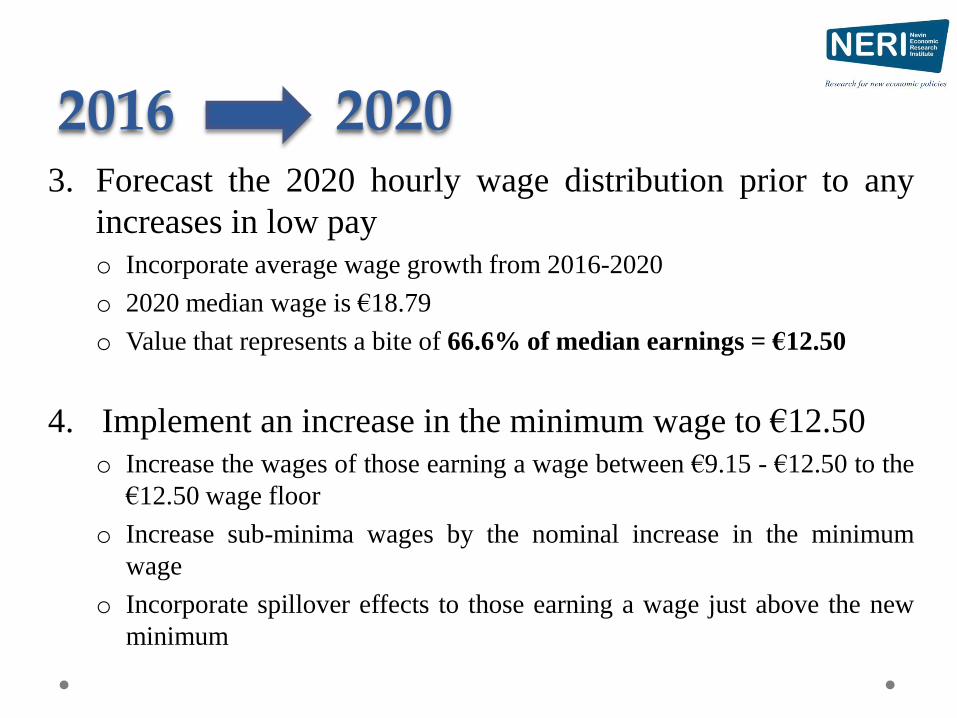
2016 2020 3. Forecast the 2020 hourly wage distribution prior to any
increases in low pay
o Incorporate average wage growth from 2016-2020
o 2020 median wage is €18.79
o Value that represents a bite of 66.6% of median earnings = €12.50
4. Implement an increase in the minimum wage to €12.50
o Increase the wages of those earning a wage between €9.15 - €12.50 to the
€12.50 wage floor
o Increase sub-minima wages by the nominal increase in the minimum
wage
o Incorporate spillover effects to those earning a wage just above the new
minimum
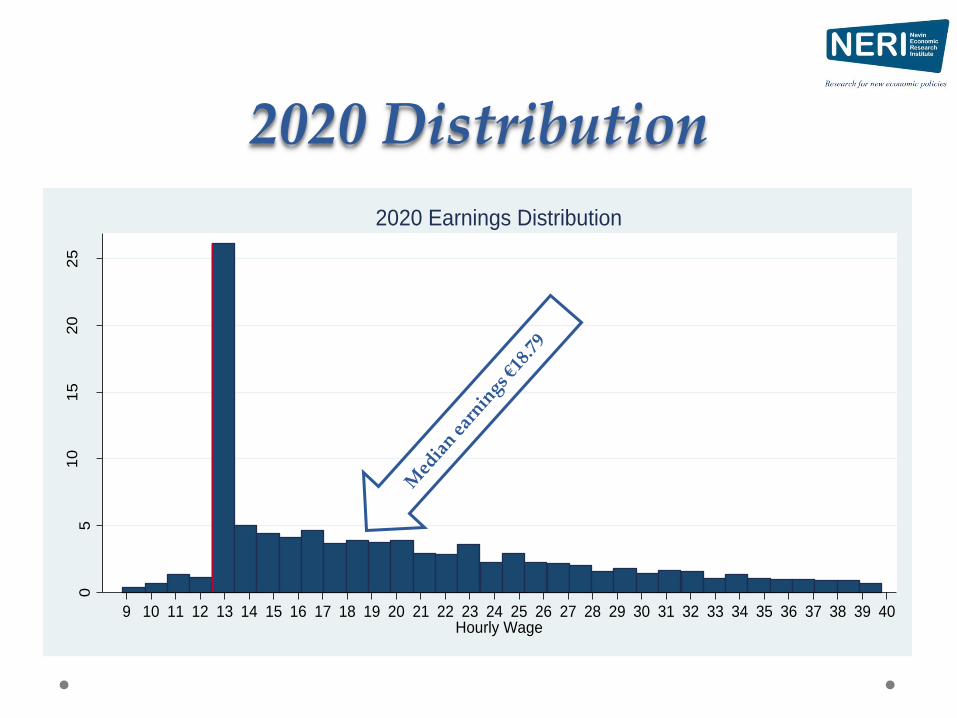
05
10
15
20
25
Perc
ent
9 10 11 12 13 14 15 16 17 18 19 20 21 22 23 24 25 26 27 28 29 30 31 32 33 34 35 36 37 38 39 40Hourly Wage
2020 Earnings Distribution
2020 Distribution

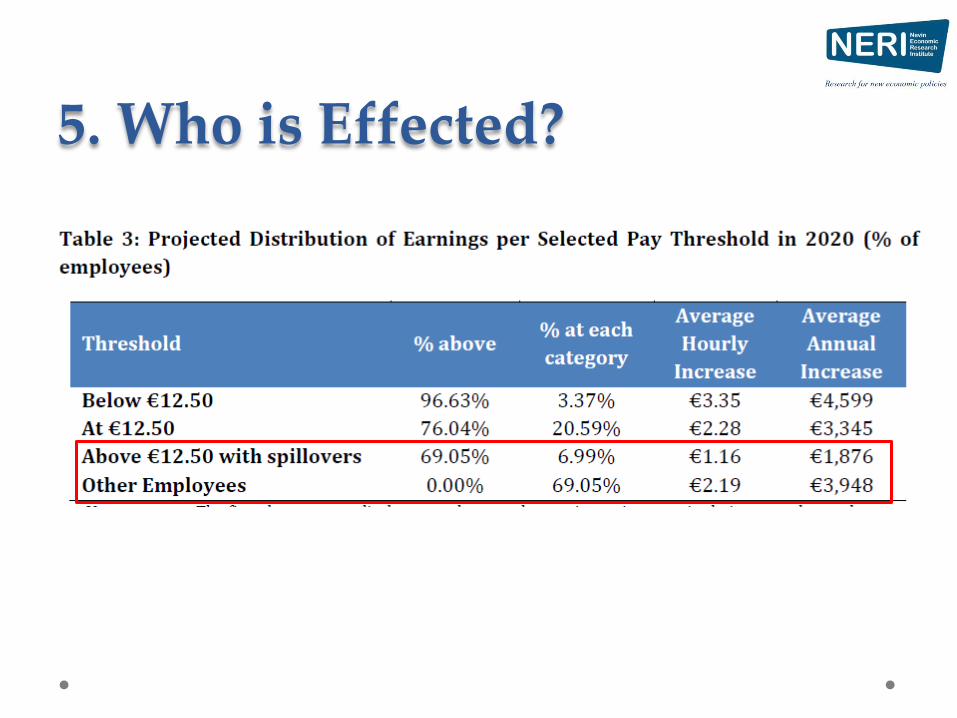
5. Who is Effected?
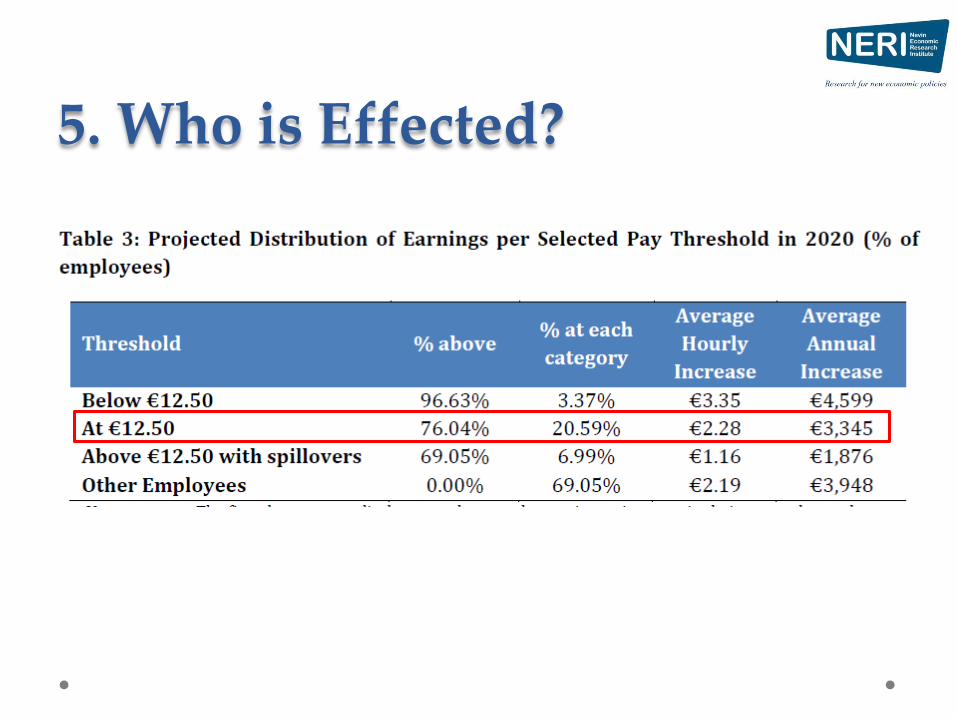
5. Who is Effected?

5. Who is Effected?
5. Who is Effected?

Share
of
Employees Affected
(%)
Share of
all
Affected (%)
Average Hourly
Gain Average Yearly Gain
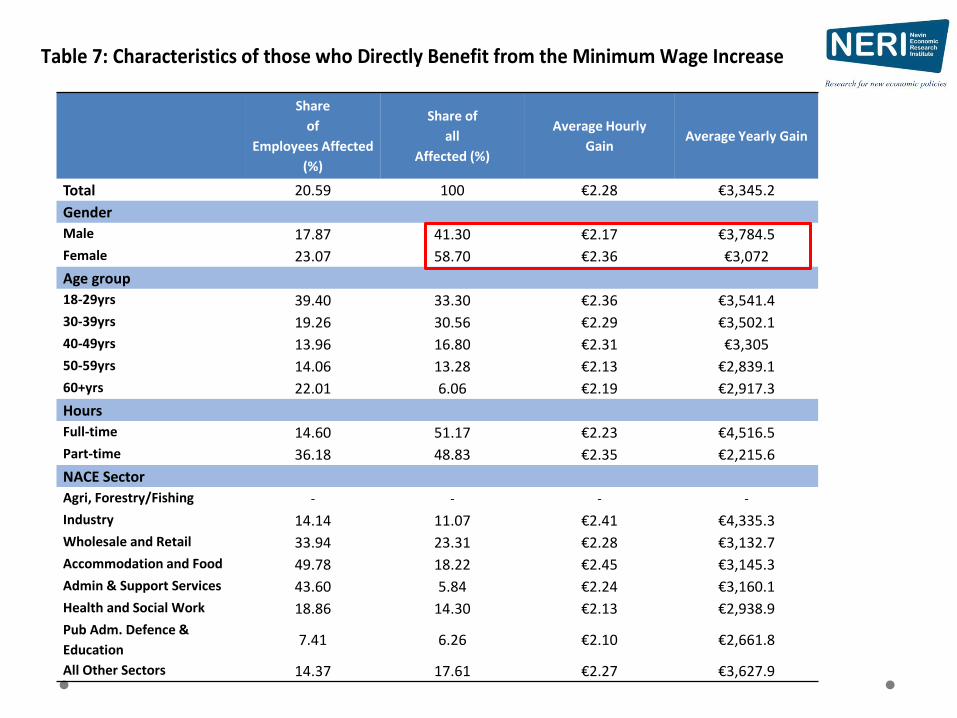
Total 20.59 100 €2.28 €3,345.2
Gender
Male 17.87 41.30 €2.17 €3,784.5
Female 23.07 58.70 €2.36 €3,072
Age group
18-29yrs 39.40 33.30 €2.36 €3,541.4
30-39yrs 19.26 30.56 €2.29 €3,502.1
40-49yrs 13.96 16.80 €2.31 €3,305
50-59yrs 14.06 13.28 €2.13 €2,839.1
60+yrs 22.01 6.06 €2.19 €2,917.3
Hours
Full-time 14.60 51.17 €2.23 €4,516.5
Part-time 36.18 48.83 €2.35 €2,215.6
NACE Sector
Agri, Forestry/Fishing - - - -
Industry 14.14 11.07 €2.41 €4,335.3
Wholesale and Retail 33.94 23.31 €2.28 €3,132.7
Accommodation and Food 49.78 18.22 €2.45 €3,145.3
Admin & Support Services 43.60 5.84 €2.24 €3,160.1
Health and Social Work 18.86 14.30 €2.13 €2,938.9
Pub Adm. Defence &
Education 7.41 6.26 €2.10 €2,661.8
All Other Sectors 14.37 17.61 €2.27 €3,627.9
Table 7: Characteristics of those who Directly Benefit from the Minimum Wage Increase
Share
of
Employees Affected
(%)
Share of
all
Affected (%)
Average Hourly
Gain Average Yearly Gain
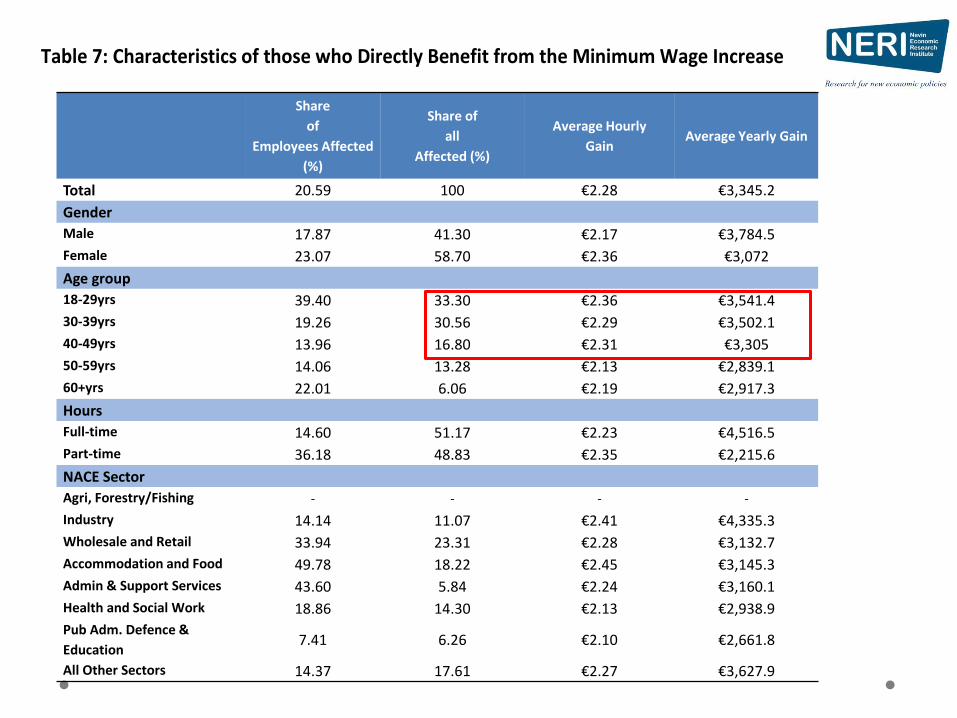
Total 20.59 100 €2.28 €3,345.2
Gender
Male 17.87 41.30 €2.17 €3,784.5
Female 23.07 58.70 €2.36 €3,072
Age group
18-29yrs 39.40 33.30 €2.36 €3,541.4
30-39yrs 19.26 30.56 €2.29 €3,502.1
40-49yrs 13.96 16.80 €2.31 €3,305
50-59yrs 14.06 13.28 €2.13 €2,839.1
60+yrs 22.01 6.06 €2.19 €2,917.3
Hours
Full-time 14.60 51.17 €2.23 €4,516.5
Part-time 36.18 48.83 €2.35 €2,215.6
NACE Sector
Agri, Forestry/Fishing - - - -
Industry 14.14 11.07 €2.41 €4,335.3
Wholesale and Retail 33.94 23.31 €2.28 €3,132.7
Accommodation and Food 49.78 18.22 €2.45 €3,145.3
Admin & Support Services 43.60 5.84 €2.24 €3,160.1
Health and Social Work 18.86 14.30 €2.13 €2,938.9
Pub Adm. Defence &
Education 7.41 6.26 €2.10 €2,661.8
All Other Sectors 14.37 17.61 €2.27 €3,627.9
Table 7: Characteristics of those who Directly Benefit from the Minimum Wage Increase
Share
of
Employees Affected
(%)
Share of
all
Affected (%)
Average Hourly
Gain Average Yearly Gain
Total 20.59 100 €2.28 €3,345.2
Gender
Male 17.87 41.30 €2.17 €3,784.5
Female 23.07 58.70 €2.36 €3,072
Age group
18-29yrs 39.40 33.30 €2.36 €3,541.4
30-39yrs 19.26 30.56 €2.29 €3,502.1
40-49yrs 13.96 16.80 €2.31 €3,305
50-59yrs 14.06 13.28 €2.13 €2,839.1
60+yrs 22.01 6.06 €2.19 €2,917.3
Hours
Full-time 14.60 51.17 €2.23 €4,516.5
Part-time 36.18 48.83 €2.35 €2,215.6
NACE Sector
Agri, Forestry/Fishing - - - -
Industry 14.14 11.07 €2.41 €4,335.3
Wholesale and Retail 33.94 23.31 €2.28 €3,132.7
Accommodation and Food 49.78 18.22 €2.45 €3,145.3
Admin & Support Services 43.60 5.84 €2.24 €3,160.1
Health and Social Work 18.86 14.30 €2.13 €2,938.9
Pub Adm. Defence &
Education 7.41 6.26 €2.10 €2,661.8
All Other Sectors 14.37 17.61 €2.27 €3,627.9
Table 7: Characteristics of those who Directly Benefit from the Minimum Wage Increase
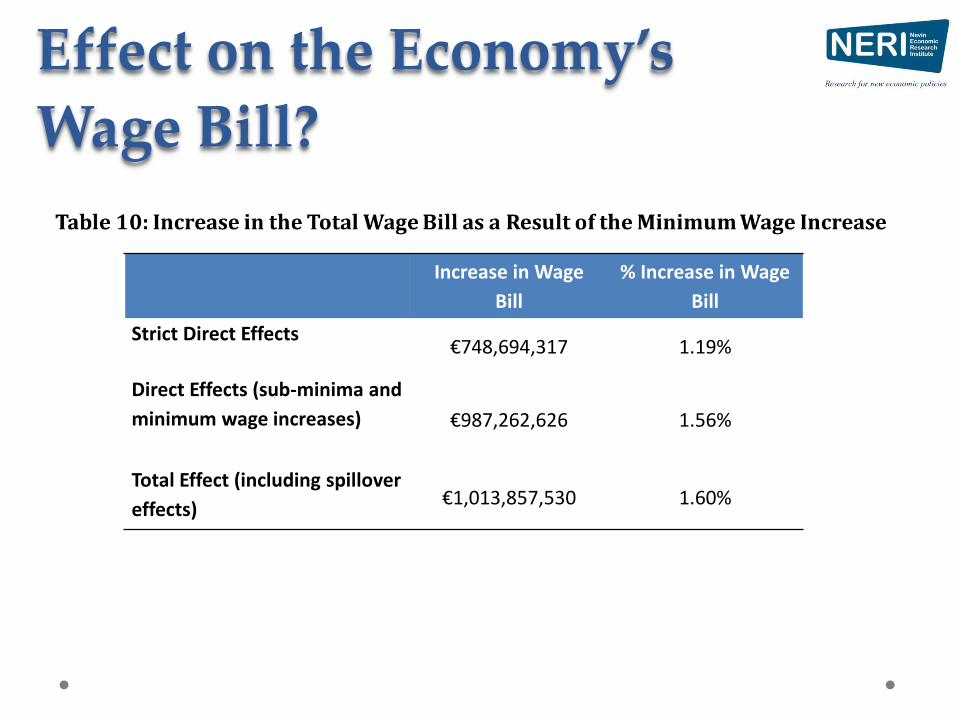
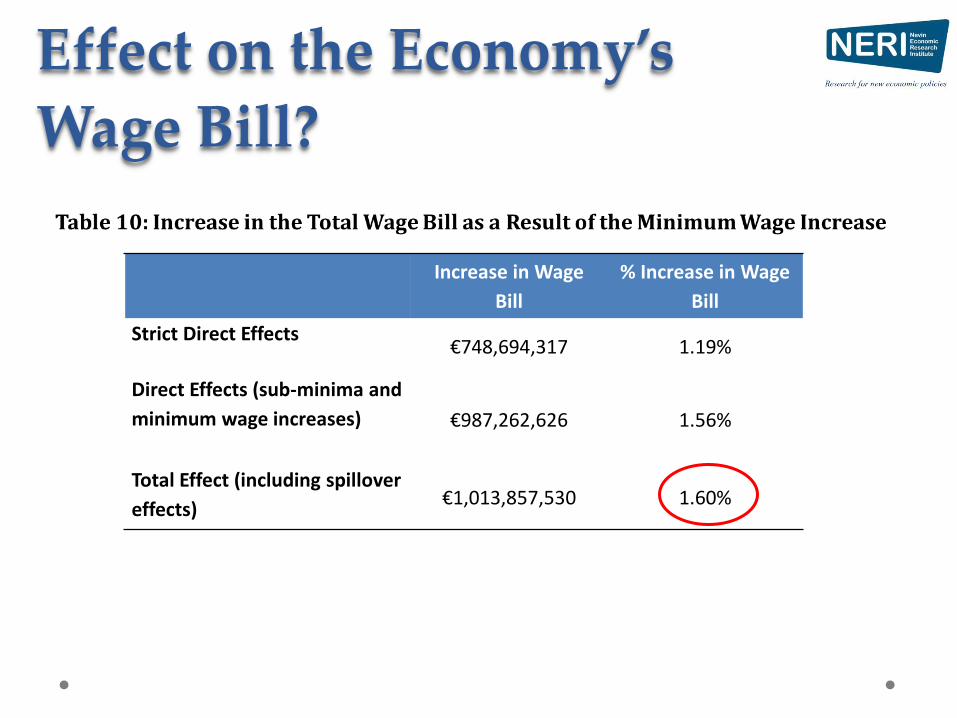
Effect on the Economy’s
Wage Bill?
Increase in Wage
Bill
% Increase in Wage
Bill
Strict Direct Effects €748,694,317 1.19%
Direct Effects (sub-minima and
minimum wage increases) €987,262,626 1.56%
Total Effect (including spillover
effects) €1,013,857,530 1.60%
Effect on the Economy’s
Wage Bill?
Increase in Wage
Bill
% Increase in Wage
Bill
Strict Direct Effects €748,694,317 1.19%
Direct Effects (sub-minima and
minimum wage increases) €987,262,626 1.56%
Total Effect (including spillover
effects) €1,013,857,530 1.60%
Effect on Employment? • Contrasting views in the literature
• Negative employment effects in previous literature is limited o Only minor increases in the minimum wage
• We are modelling a substantial increase in the minimum wage so it is likely to have some impact on employment levels o The extent to which employment levels are effected will depend on the economic
environment at the time of its increase
o Employment effects are likely to vary from sector to sector and from firm to firm
• Likely to be first round and second round effects of the minimum wage increase in firms
• May have an affect on the wider economy o Increase in minimum wage increases disposable income and consumption
o Increase in consumption may increases consumer demand that may result in an increase in sales for firms, increasing profits
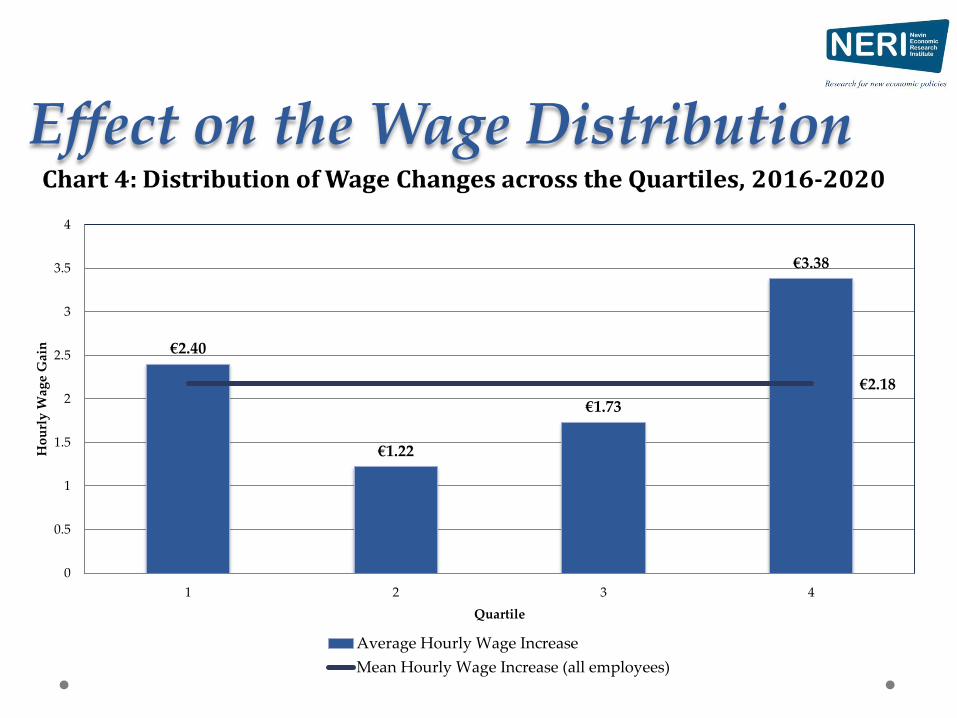
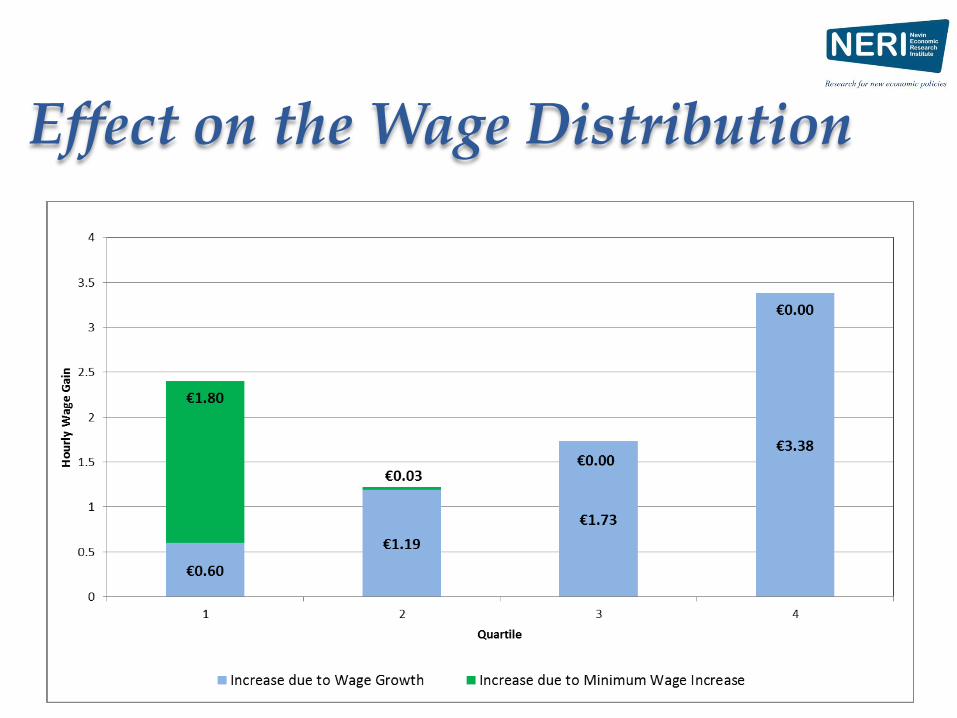
Effect on the Wage Distribution
€2.40
€1.22
€1.73
€3.38
€2.18
0
0.5
1
1.5
2
2.5
3
3.5
4
1 2 3 4
Ho
url
y W
age
Gai
n
Quartile
Average Hourly Wage Increase
Mean Hourly Wage Increase (all employees)
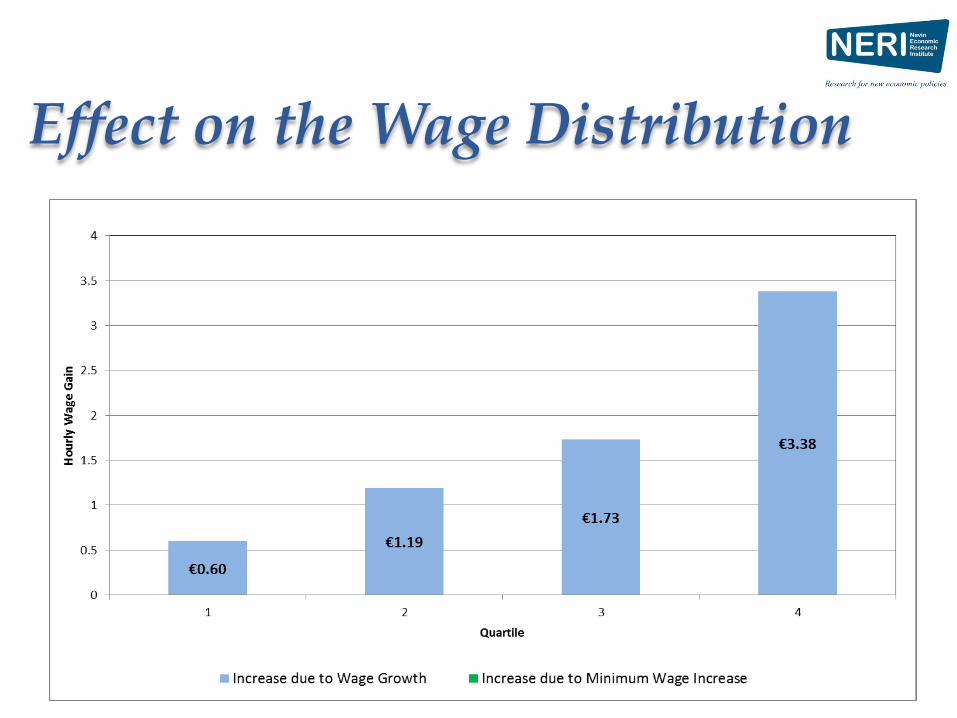
Effect on the Wage Distribution
Effect on the Wage Distribution
7. Conclusion • Low Pay is back on the agenda
• Merit in linking low pay to earnings distribution
o A relative benchmark…better than arbitrary nominal targets
• Paper models an increase in the Minimum Wage to the Low
Pay Threshold in 2020
o It is modelled as a once off increase. In reality it would be implemented
incrementally over a couple of years
• An increase in the Minimum Wage by 36.6% to €12.50:
o 31% of employees benefitting in total with 24% benefitting directly while 7%
benefit indirectly
o wage inequality by wages of the bottom third of the wage distribution
closer to the median
o A likely increase in the wage bill of between 1.19% -1.60%
o Likely employment and wider economic effects
Niamh Holton
NERI (Nevin Economic Research Institute)
Dublin
www.NERInstitute.net
Modelling the Impact of an Increase in Low Pay in the
Republic of Ireland
ISPA Conference
1st July 2016