Embed Size (px)
Citation preview

Modelling the Impact of Accessibility Modelling the Impact of Accessibility to Services on House Prices:to Services on House Prices:A Comparative Analysis of A Comparative Analysis of
Two Methodological ApproachesTwo Methodological Approaches
François Des Rosiers, Marius Thériault & Yan Kestens
European Real Estate Society10th Annual Meeting, June 11-13, 2003
Research funded by

This paper is an attempt to bridge the gap between, on the one hand, the mobility behaviour of households and their perception of accessibility to urban amenities and, on the other hand, house price dynamics as captured through hedonic modellingIt consists of an empirical test of the impact of accessibility on house prices, whereby hedonic modelling is applied to some 952 single-family houses sold in Quebec City between 1993 and 1996Two accessibility measures are compared: the former measure is based on simulated travel times to nearest amenities aggregated through factor analysis (PCA)The latter rests on perceived accessibility indices obtained via a fuzzy logic approach applied to observed trips patterns derived from the 2001 QMA O-D survey
Introduction

Our hypothesis is that different people having a heterogeneous perception of space, they will adjust their willingness to pay for additional centrality/accessibility when choosing their home location depending on their needs and preferences The main objective of this paper is to test whether perceptual indices of accessibility are actually internalized in housing pricesSecondary objectives are:Testing for the marginal contribution to value of access to
various amenities: work places, schools, shops, groceries, health care centres, restaurants, leisure places
Testing for the differential impact of accessibility among types of individuals and households
Testing for the way life cycle and income impact upon the perception of accessibility and is translated into house prices
Hypothesis and objectives

Traditional urban models are currently based on the centrality concept (distance decay function) and on accessibility to the CBD (monocentric model)
McMillen’s (2003 – Chicago): decades of urban sprawl in North American cities did not weaken the prominence of the centrality concept
Impact of proximity and accessibility to services on property values: Guntermann and Colwell 1983, Colwell, Gujral and Coley 1985, Colwell 1990, Grieson and White 1989, Sirpal 1994, So et al. 1997, Smersh and Smith 2000, Des Rosiers et al. (1996, 2001 & 2003 – Quebec City)
Not all authors though agree on the actual influence of accessibility upon house prices and residential mobility (McGreal et al. 1999 – Belfast & Bordeaux)
Accessibility and House Values (1)

Polycentric cities: mere Euclidean distances to the CBD falls short of integrating all relevant aspects of accessibility (Jackson 1979, Dubin and Sung 1987, Niedercorn and Ammari 1987, Hoch and Waddell 1993)
Despite use of minimum travel time and walking distance (Bateman et al. 2001), the faulty specification of accessibility descriptors may explain rather poor performances
Travel surveys, commuting patterns and accessibility to jobs and houses:Levinson (1996 – Washington, DC): suburbanization of jobs
maintains stability in commuting durations despite rising congestion and increasing work and non-work trip making and length
Helling (1996 - Atlanta): Effect of residential car accessibility to jobs on the quantity and nature of travel by men and women - Accessibility do not affect everyone while gravity indices only provide partial information
Srour et al. (2002 - Dallas-Fort Worth): Apply both general and specific accessibility indices to the modelling of residential and commercial markets - While common accessibility measures do not perform that well, job accessibility indices impact positively on residential land values
Accessibility and House Values (2)

Database: hedonic modelling applied to 952 single-family houses sold in Quebec City between 1993 and 1996 - sale prices range from $50 000 to $460 000 (Can.$)
High variance on prices: use of a multiplicative functional form (ln of sale price – ln SP)
Three steps:Model 1: Ln SP = f [Property SSpecifics, IInflation, TTaxation]Model 2: Ln SP = f [SS, II, TT, PCAPCA of travel times to nearest amenities]Model 3: Ln SP = f [SS, II, TT, PAIPAI : Perceived Accessibility Indices]
Phone survey among buyers revealed that accessibility to services, jobs, schools, highways and transit networks was an important criteria for choosing new neighbourhoods:Model 3a : Ln SP = f [SS, II, TT, PAIPAI * Buyer’s AgeAge]Model 3b : Ln SP = f [SS, II, TT, PAIPAI ** Buyer’s IncomeIncome]
Database & Modelling Approach

Step 1: compute 15 travel times (car and walking) to the nearest local & regional amenities : primary & high schools, colleges, universities; regional, neighbourhood & local shopping centres; CBD
Step 2: PCA - extract 2 principal components using Varimax rotation Factor 1 : access to nearest regional-level services (42% of
variance)
Factor 2 : access to nearest local-level services (34% of variance)
Already used by Des Rosiers et al., 2000 – Quebec City
Mutually independent factors help control multicollinearity
Step 3: Model 2 - Factor scores are substituted for access attributes
Factor Analysis - PCA (Nearest Amenities)

Factor Analysis - PCA (Nearest amenities)
Regional-level services
Local-level services

where :Ai : Raw suitability of residential location i (sum of suitable opportunities)Sij : Suitability index of travelling from residential location i to activity location j : Total number of potential activities at location j
where :Ai* : Accessibility index of residential location i relative to the most suitable place
Modelling Perceptual Accessibility
Model 3 : Accessibility indices were computed for significantly different types of persons and activities using
mjniPSAm
jjiji ,...,1,...,1,
1
niAAAAA
n
ii ,...,1,),...,,max(100
21
*
jP

Perceived Accessibility to Restaurants
0 5 10
kilometres
Restaurants
3 000
1 500
300
Accessibility Index (%)90 to 10080 to 9070 to 8060 to 7050 to 6040 to 5030 to 4020 to 3010 to 200 to 10
C50 : 5,3 min.C90 : 12,6 min.

Analysis of Results (1)Model Summary
Model R R Square Adjusted R Square Std. Error of the Estimate Maximum VIF Residuals Moran’s I
Sig.
1 .858 .736 .731 .17959 3.050 0.2827 .002
2 .884 .782 .777 .16330 3.053 0.2376 .008
3 .874 .763 .758 .17040 3.060 0.2732 .003
ANOVA
Model Sum of Squares df Mean Square F Sig.
1 Regression 83.884 18 4.660 144.487 .000
Residual 30.093 933 .032
Total 113.977 951
2 Regression 89.126 20 4.456 166.951 .000
Residual 24.851 931 .027
Total 113.977 951
3 Regression 86.973 21 4.142 142.631 .000
Residual 27.004 930 .029
Total 113.977 951
All models do perform well in spite of remaining spatial autocorrelation among residuals
Model 2 performs better in all respects
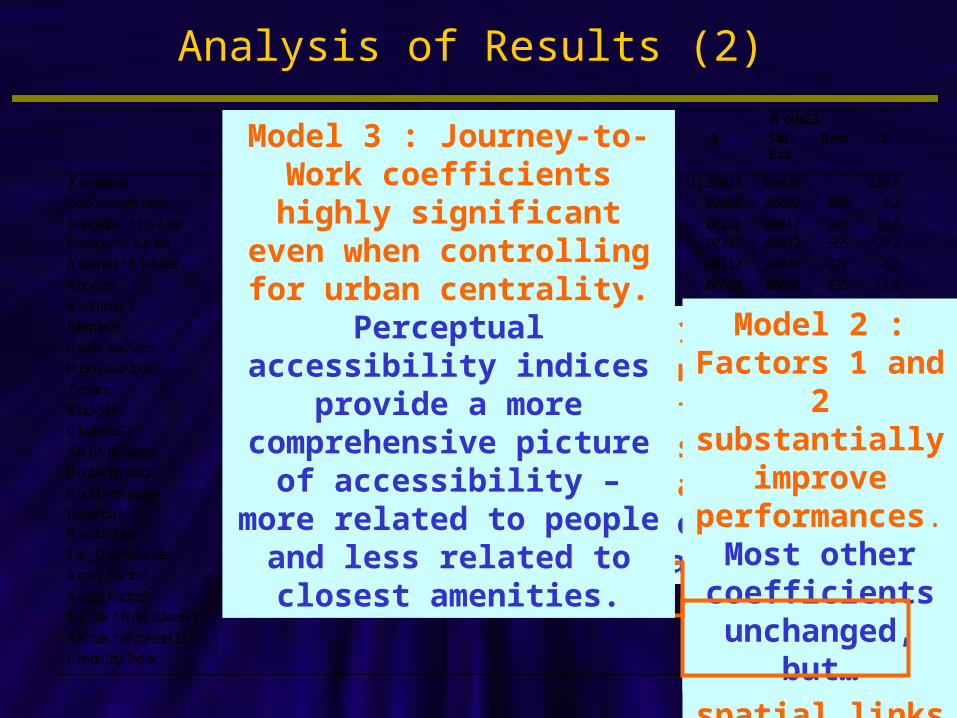
Analysis of Results (2)
Model 1 Model 2 Model 3
B Std. Err
Beta t B Std. Err
Beta t B Std. Err
Beta t
(Constant) 11.68731 .04746 246.3 11.55619 .05250 220.1 11.50028 .05038 228.3
LotSizeSqrMetres .00003 .00002 .031 1.6 .00008 .00002 .078 4.3 .00008 .00002 .080 4.2
Bungalow * LivArea .00235 .00018 .357 13.3 .00231 .00016 .351 14.4 .00228 .00017 .346 13.6
Cottage * LivArea .00249 .00013 .569 19.4 .00250 .00012 .571 21.3 .00247 .00012 .565 20.2
Attached * LivArea .00149 .00027 .101 5.5 .00098 .00025 .067 3.9 .00112 .00026 .076 4.3
AppAge -.00387 .00057 -.138 -6.8 -.00853 .00062 -.303 -13.8 -.00662 .00060 -.235 -11.0
Washrooms .09517 .01252 .144 7.6 .07281 .01151 .110 6.3 .08150 .01197 .124 6.8
Fireplace .05082 .01209 .079 4.2 .04970 .01101 .077 4.5 .05106 .01149 .079 4.4
HardWoodStair .07454 .01623 .096 4.6 .05922 .01489 .076 4.0 .06646 .01544 .085 4.3
HighQualFloor .06689 .01295 .097 5.2 .04912 .01185 .071 4.1 .05814 .01232 .084 4.7
Terrace .12394 .04813 .045 2.6 .10813 .04382 .039 2.5 .10856 .04577 .039 2.4
Brick51FC .04567 .01420 .064 3.2 .03660 .01294 .051 2.8 .04089 .01349 .057 3.0
Clapbord51 -.05414 .01565 -.069 -3.5 -.04675 .01425 -.060 -3.3 -.05210 .01489 -.067 -3.5
SimpAttGarage .13307 .02731 .085 4.9 .11599 .02488 .074 4.7 .12187 .02598 .078 4.7
DoubAttGarage .16945 .03793 .080 4.5 .13446 .03459 .063 3.9 .15802 .03626 .074 4.4
DoubDetGarage .10959 .03132 .062 3.5 .12144 .02857 .069 4.3 .11030 .02974 .062 3.7
ExcaPool .18383 .02617 .125 7.0 .16487 .02386 .112 6.9 .16491 .02495 .112 6.6
Month93Jan -.00184 .00045 -.070 -4.0 -.00167 .00041 -.063 -4.1 -.00191 .00043 -.072 -4.5
Tax_OvUnzdRate -.25656 .01589 -.292 -16.1 -.14557 .02068 -.166 -7.0 -.25032 .01575 -.285 -15.9
Acces_Factor1 .12485 .00959 .322 13.0
Acces_Factor2 .04177 .00871 .090 4.8
AWork * NoWorkerHld .00287 .00042 .181 6.8
AWork * WorkerHld .00273 .00035 .216 7.7
Centrality Index .00173 .00051 .068 3.4
… Size and Age coefficients are strengthened.Tax rate effect
declines.This suggests
structural spatial links among these
variables and urban form.
Model 1 : All coefficients highly significant
and consistent with expectations.Prominence of age, size and
taxation
Model 2 : Factors 1 and 2
substantially improve
performances.Most other coefficients
unchanged, but…
Model 3 : Journey-to-Work coefficients highly significant
even when controlling for urban centrality.
Perceptual accessibility indices provide a more comprehensive picture of accessibility – more
related to people and less related to closest amenities.

Analysis of Results (3)
Model Accessibility index R Square SE Estimate B Std. Err Beta t VIF
4 ASchool * Family .765 .1678 .00333 .00035 .279 9.6 3.431 Schools ASchool * ChildlessHld .00255 .00032 .220 8.0 3.068
Centrality Index .00146 .00050 .058 2.9 1.572
9 AHealthCare * Family .766 .1673 .00342 .00035 .265 9.9 2.947 Health care AHealthCare *
ChildlessHld .00262 .00033 .199 7.9 2.574
Centrality Index .00124 .00050 .049 2.4 1.618
10 ARestaurant .768 .1668 .00323 .00032 .212 10.1 1.801 Restaurants Centrality Index .00120 .00050 .047 2.4 1.608
Models 4, 9 and 10 : Accessibility to schools and health care facilities for families as well as to restaurants exerts strong influence on prices.
Perceived accessibility indices overcome centrality.
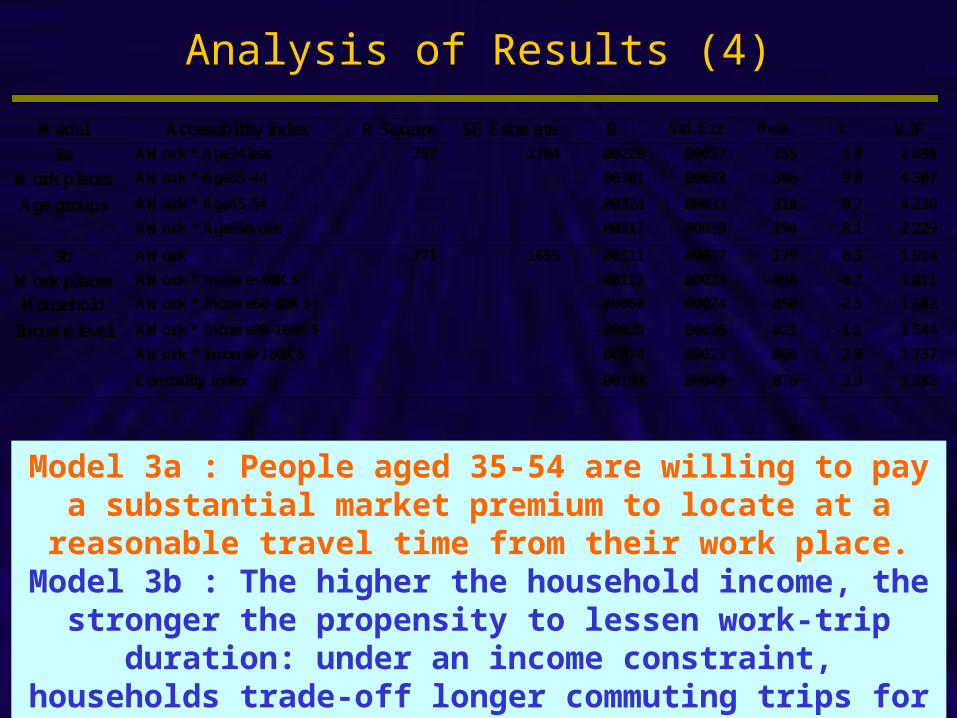
Analysis of Results (4)
Model Accessibility index R Square SE Estimate B Std. Err Beta t VIF
3a AWork * Age34less .757 .1704 .00220 .00037 .155 5.9 2.698
Work places AWork * Age35-44 .00301 .00033 .306 9.0 4.507
Age groups AWork * Age45-54 .00324 .00033 .318 9.7 4.236
AWork * Age55more .00317 .00039 .194 8.1 2.229
3b AWork .771 .1655 .00311 .00037 .179 8.3 1.914
Work places AWork * Income<60K$ -.00111 .00024 -.098 -4.7 1.811
Household AWork * Income60-80K$ -.00060 .00024 -.050 -2.5 1.682
Income level AWork * Income80-100K$ -.00029 .00026 -.021 -1.1 1.544
AWork * income>100K$ .00074 .00025 .060 2.9 1.737
Centrality Index .00192 .00049 .076 3.9 1.582
Model 3a : People aged 35-54 are willing to pay a substantial market premium to locate at a reasonable travel time from their
work place.Model 3b : The higher the household income, the stronger the
propensity to lessen work-trip duration: under an income constraint, households trade-off longer commuting trips for
cheaper land.

The two sub-hypothesis of this research were: [1] Various types of persons experience different constraints and are not
equally willing to travel in order to reach various kinds of activities, meaning that they have an heterogeneous perception of space
[2] Households will adjust their willingness to pay for additional centrality/accessibility when choosing their home location depending on their needs and preferences
Both sub-hypotheses are supported by empirical results, suggesting the accessibility concept might be less straightforwardless straightforward than is usually considered in the literature
The physical, absolute concept of accessibility ought to be complemented by behavioural approachesbehavioural approaches integrating people wills and needs in their valuation of urban space
Considering they are a paramount determinant of location choices and property values, accessibility/centrality issues deserve being further investigated using novel toolsnovel tools, including travel and activity surveys and modelling
Conclusion & Research Agenda