Embed Size (px)
Citation preview
Instituto Nacional de Investigación y Tecnología Agraria y Alimentaria (INIA)Available online at www.inia.es/sjarhttp://dx.doi.org/10.5424/sjar/2012104-3256
Spanish Journal of Agricultural Research 2012 10(4), 986-992ISSN: 1695-971-XeISSN: 2171-9292
Modelling the faecal worm egg count curve during the periparturient period in Uruguayan Merino sheep
V. Goldberg1, *, G. Ciappesoni1 and I. Aguilar1
1 Instituto Nacional de Investigación Agropecuaria, INIA Las Brujas, Ruta 48 km.10, Rincón del Colorado, CP 90200, Canelones, Uruguay
Abstract Disease caused by gastrointestinal nematodes (GIN) is one of the main constraints for sheep production worldwide. Although
adult categories are more resistant to GIN, a temporary loss of acquired immunity is presented around parturition, which results in the so-called “periparturient rise” (PPR) in fecal excretion of GIN eggs. The objective of the present work was to study the dynamic of the PPR and to model the faecal worm egg count (FEC) curve during the periparturient period in Uruguayan Merino sheep. Faecal samples were collected from lambing ewes during 2009 and 2010 parturitions. FEC and infective larvae cultures of each sampling were recorded. A total of 2,121 records from 748 ewes, the progeny of 107 sires, were used in the statistical analysis. FEC data were normalized using two logarithmic transformations: Log FEC = Loge (FEC + 100) and Log FEC_st (Log FEC with the variance standardized within contemporary group). Three functions were compared to shape the PPR curve. Haemonchus spp. was the most prevalent parasite. Log FEC_st was the selected response variable of the model, for its better adjustment to a normal distribution and a more homogeneous residual variance. The fixed regression model with Legendre polynomials was the selected one, based on the selection model criteria (Akaike & Schwarz Bayesian Information Criteria). The highest egg output was observed between two and four weeks post-lambing. In conclusion, the PPR observed in Uruguayan Merino lambing ewes had the maximum egg output matched with the milk production peak.
Additional key words: gastrointestinal nematodes; Haemonchus contortus; lambing ewes; periparturient rise.
ResumenModelación de la curva del recuento de huevos de parásitos durante el período del periparto en ovinos Merino uruguayo
La infección por nematodos gastrointestinales (GIN) es una de las principales limitantes de la producción ovina mundial. Si bien los adultos son más resistentes a los GIN, una pérdida temporal de la inmunidad adquirida se presen-ta en el período del periparto, resultando en el “alza de lactación” (PPR) en la eliminación de huevos de GIN (HPG). El objetivo del presente trabajo fue estudiar la dinámica del PPR y obtener la curva del recuento del HPG durante el periparto en ovejas Merino uruguayo. Se recogieron muestras de heces de ovejas en las pariciones 2009 y 2010, rea-lizándose HPG y coprocultivo de cada muestreo. Para el análisis estadístico se utilizaron 2,121 datos de 748 ovejas, hijas de 107 padres. Se llevaron a cabo dos transformaciones logarítmicas de manera que los datos siguieran una dis-tribución normal: Log HPG = Loge (HPG+100) y Log HPG_st (Log HPG con la varianza normalizada dentro del grupo contemporáneo). Se compararon tres funciones para modelar la curva del PPR. Haemonchus spp. fue el género más frecuente. Log HPG_st fue la variable de respuesta del modelo seleccionada, por el mejor ajuste a la distribución normal y mayor homogeneidad de la varianza residual. Se seleccionó el modelo con polinomios de Legendre, en base a los criterios de selección del modelo (Akaike y Schwarz Bayesian Information Criteria). La mayor eliminación de huevos se observó entre las dos y cuatro semanas posparto. En conclusión, se observó el PPR en ovejas Merino uru-guayo, coincidiendo la máxima eliminación de huevos de GIN con el pico máximo de producción de leche.
Palabras clave adicionales: alza de lactación; Haemonchus contortus; nematodos gastrointestinales; ovejas parturientas.
*Corresponding author: [email protected]: 21-06-12. Accepted: 08-11-12
Abbreviations used: AIC (Akaike information criteria); BIC (Schwarz bayesian information criteria); CG (contemporary group); DML (days of faecal egg count measurement respect to lambing); FEC (faecal worm egg count); FMN (Fine Merino Nucleus); GIN (gastrointestinal nematodes); INIA (Instituto Nacional de Investigación Agropecuaria, National Institute for Agricultural Research); Log FEC_st (natural logarithm of Faecal egg count with the variance standardized within contemporary group); PER (faecal egg count measurement period); PPR (periparturient rise).
987The periparturient rise in Merino ewes
guay, characterized by a warm and wet climate, with a mean annual temperature of 18-19°C, relative hu-midity of 70-72% and an average annual rainfall of 1,400-1,500 mm (Castaño et al., 2011). These condi-tions are favorable for the development and survival of larvae of GIN throughout the year, varying the presence and predominance of different parasite genus according to the season.
In FMN, ewes are managed in parturition groups according to the average expected day of lambing. A pre-partum strategic drenching is performed every year as a management control measure, approximately one month prior to the expected beginning of lambing. Anthelmintic used were DOVENIX® in 2009 and TRIMIX® in 2010. In “Talitas” and “La Gringa”, ewes are managed in a single parturition group. In these stud flocks, ewes are not always dewormed before parturi-tion because drenching is performed strategically; i.e. periodically stool samples are collected from a random sample of animals, and if FEC average is higher than 500 eggs per gram, all the parturition group is drenched immediately. For the present study, it was not necessary anthelmintic treatment in these flocks.
Ewe records
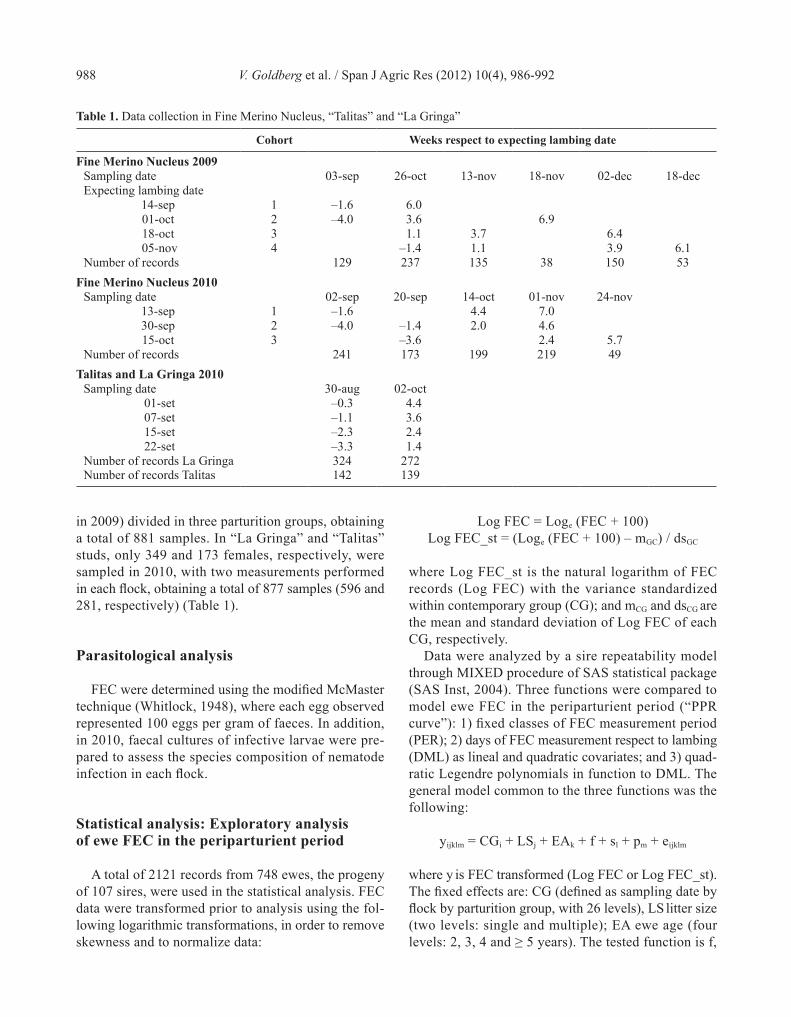
A total of 2,500 faecal samples were collected in 2009 and 2010, during lambing season. The age of ewes ranged between of 2 and 10 years-old and litter size was recorded as single or multiple (≥ two lambs). The experiment was conducted between days –50 and +68 respect to lambing (day 0). Each ewe was sampled on average three times, under natural mixed-species para-site challenge on pasture. All ewes in the same cohort were sampled on the same day. The first sample was collected in late pregnancy and the others in early and mid-lactation. The number of post-lambing measure-ments depended on the degree of parasitic infection; if FEC counts within a cohort reached certain levels such that animal health and welfare might be compromised, then all animals in that cohort were immediately drenched. Cohorts were defined as a parturition group in case of FMN or all the flock in case of “Talitas” and “La Gringa” studs. In FMN, ewes were sampled in the two years of the experiment (Table 1). In 2009, a total of six measurements were performed on 293 ewes di-vided in four parturition groups, obtaining a total of 742 records. In 2010, five measurements were per-formed on 345 ewes (of which 185 were also sampled
Introduction
Gastrointestinal nematodes (GIN) are one of the main constraints for sheep production in Uruguay and worldwide (Castells et al., 1995; Perry & Randolph, 1999). Although lambs are the most susceptible cate-gory to GIN infection, lambing ewes also experience a relaxation in acquired immunity around parturition through a phenomenon called periparturient rise (PPR). The PPR was firstly documented by Taylor (1935) and it can be defined as a temporary but marked increase in nematode eggs output by lambing ewes; that begins in the last weeks of gestation and reaches the maximum peak in the first weeks post-parturition. It is an impor-tant event because it represents a pasture larval con-tamination source for newborn lambs (Bishop & Stear, 2001; Romero & Boero, 2001). The cause has not yet been determined, but it is generally accepted that the rise occurs after an immunity depression of the host by stressful factors such as pregnancy, parturition, lacta-tion, climate and malnutrition (Barger, 1993).
The PPR was firstly described in Uruguay by Nari et al. (1977a) in the Ideal breed, where Haemonchus spp. represented 82% of the total of the parasite genera presented. They worked with only 71 animals which were divided in three groups: lambing ewes that were dewormed before parturition, lambing ewes without a pre-partum anthelmintic treatment and non-treated barren ewes (control group). These authors observed that the maximum egg output took place between six and eight weeks post-lambing, but they did not model the shape of the PPR curve.
Because it is important to know the dynamic of the PPR for the flock management and parasite control, the aim of the present study was to model the phenotypic curve of faecal worm egg count (FEC) during the periparturient period in Uruguayan Merino sheep.
Material and methods
Animals and management
Animals belong to three flocks genetically con-nected by reference rams: the Fine Merino Nucleus (FMN) belonging to “Glencoe”, a research station of the Instituto Nacional de Investigación Agropecuaria (INIA) of Uruguay, and two Merino studs: “Talitas” and “La Gringa”, belonging to the same breeder. The three flocks are located in the northern part of Uru-
V. Goldberg et al. / Span J Agric Res (2012) 10(4), 986-992988
in 2009) divided in three parturition groups, obtaining a total of 881 samples. In “La Gringa” and “Talitas” studs, only 349 and 173 females, respectively, were sampled in 2010, with two measurements performed in each flock, obtaining a total of 877 samples (596 and 281, respectively) (Table 1).
Parasitological analysis
FEC were determined using the modified McMaster technique (Whitlock, 1948), where each egg observed represented 100 eggs per gram of faeces. In addition, in 2010, faecal cultures of infective larvae were pre-pared to assess the species composition of nematode infection in each flock.
Statistical analysis: Exploratory analysis of ewe FEC in the periparturient period
A total of 2121 records from 748 ewes, the progeny of 107 sires, were used in the statistical analysis. FEC data were transformed prior to analysis using the fol-lowing logarithmic transformations, in order to remove skewness and to normalize data:
Log FEC = Loge (FEC + 100)Log FEC_st = (Loge (FEC + 100) – mGC) / dsGC
where Log FEC_st is the natural logarithm of FEC records (Log FEC) with the variance standardized within contemporary group (CG); and mCG and dsCG are the mean and standard deviation of Log FEC of each CG, respectively.
Data were analyzed by a sire repeatability model through MIXED procedure of SAS statistical package (SAS Inst, 2004). Three functions were compared to model ewe FEC in the periparturient period (“PPR curve”): 1) fixed classes of FEC measurement period (PER); 2) days of FEC measurement respect to lambing (DML) as lineal and quadratic covariates; and 3) quad-ratic Legendre polynomials in function to DML. The general model common to the three functions was the following:
yijklm = CGi + LSj + EAk + f + sl + pm + eijklm
where y is FEC transformed (Log FEC or Log FEC_st). The fixed effects are: CG (defined as sampling date by flock by parturition group, with 26 levels), LS litter size (two levels: single and multiple); EA ewe age (four levels: 2, 3, 4 and ≥ 5 years). The tested function is f,
Table 1. Data collection in Fine Merino Nucleus, “Talitas” and “La Gringa”
Cohort Weeks respect to expecting lambing date
Fine Merino Nucleus 2009Sampling date 03-sep 26-oct 13-nov 18-nov 02-dec 18-decExpecting lambing date
14-sep 1 –1.6 6.001-oct 2 –4.0 3.6 6.918-oct 3 1.1 3.7 6.4
05-nov 4 –1.4 1.1 3.9 6.1Number of records 129 237 135 38 150 53
Fine Merino Nucleus 2010Sampling date 02-sep 20-sep 14-oct 01-nov 24-nov
13-sep 1 –1.6 4.4 7.030-sep 2 –4.0 –1.4 2.0 4.615-oct 3 –3.6 2.4 5.7
Number of records 241 173 199 219 49Talitas and La Gringa 2010
Sampling date 30-aug 02-oct 01-set –0.3 4.4 07-set –1.1 3.6 15-set –2.3 2.4 22-set –3.3 1.4
Number of records La Gringa 324 272Number of records Talitas 142 139
989The periparturient rise in Merino ewes
that according to the model is: PER (4 levels: ≤–15, >–15, >15 and >30 days of FEC measurement respect to lambing), DML and DML2 as covariates, or second-order Legendre polynomials. The random effects are: s the additive genetic effect of the sire (107 levels), p the permanent environmental effect of the animal (748 levels) and e is the residual term.
The criteria used for choosing the model with the better adjustment were the Akaike Information Criteria (AIC) and the Schwarz Bayesian Information Criteria (BIC). Once the model was selected, studentized re-siduals of Log FEC and Log FEC_st were calculated, in order to detect possible extreme values. Records with studentized residuals ≥ to 3.0 or ≤ to –3.0 were elimi-nated as outliers (Ott & Longnecker, 2001).
Descriptive statistic for FEC, Log FEC, Log FEC_st and the studentized residuals was estimated, through UNIVARIATE procedure of SAS statistical package (2004). Based on residuals analysis and descriptive statistical values of Log FEC and Log FEC_st, it was selected the response variable (y) of the model.
Results
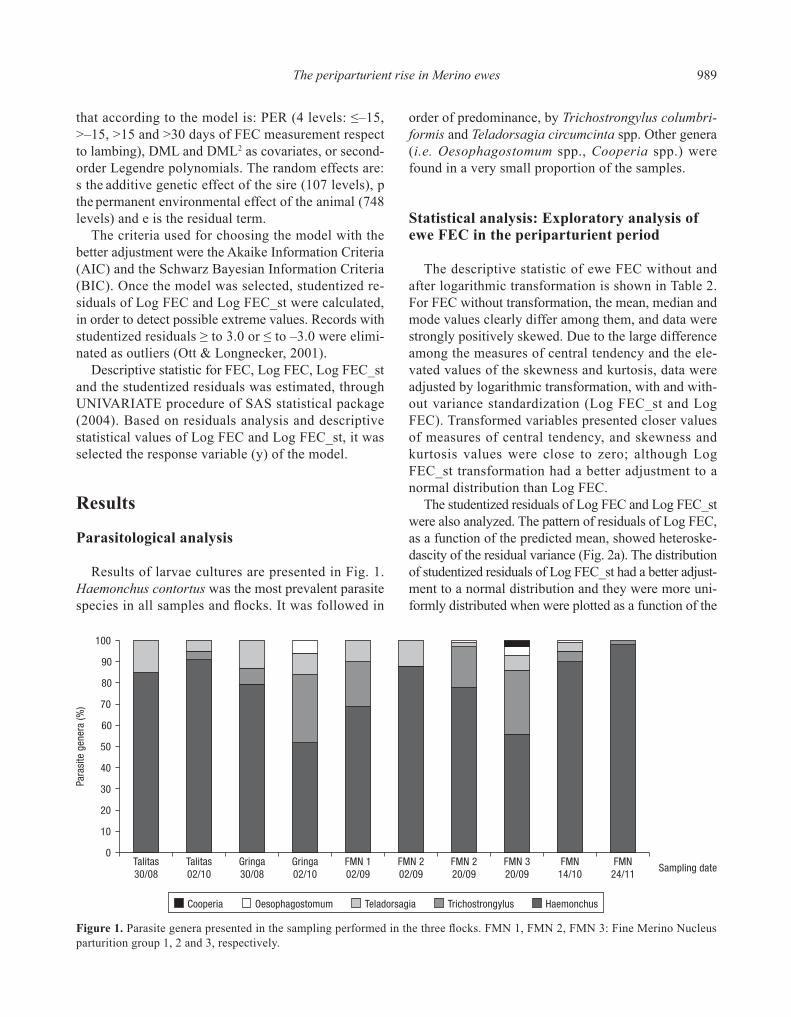
Parasitological analysis
Results of larvae cultures are presented in Fig. 1. Haemonchus contortus was the most prevalent parasite species in all samples and flocks. It was followed in
order of predominance, by Trichostrongylus columbri-formis and Teladorsagia circumcinta spp. Other genera (i.e. Oesophagostomum spp., Cooperia spp.) were found in a very small proportion of the samples.
Statistical analysis: Exploratory analysis of ewe FEC in the periparturient period
The descriptive statistic of ewe FEC without and after logarithmic transformation is shown in Table 2. For FEC without transformation, the mean, median and mode values clearly differ among them, and data were strongly positively skewed. Due to the large difference among the measures of central tendency and the ele-vated values of the skewness and kurtosis, data were adjusted by logarithmic transformation, with and with-out variance standardization (Log FEC_st and Log FEC). Transformed variables presented closer values of measures of central tendency, and skewness and kurtosis values were close to zero; although Log FEC_st transformation had a better adjustment to a normal distribution than Log FEC.
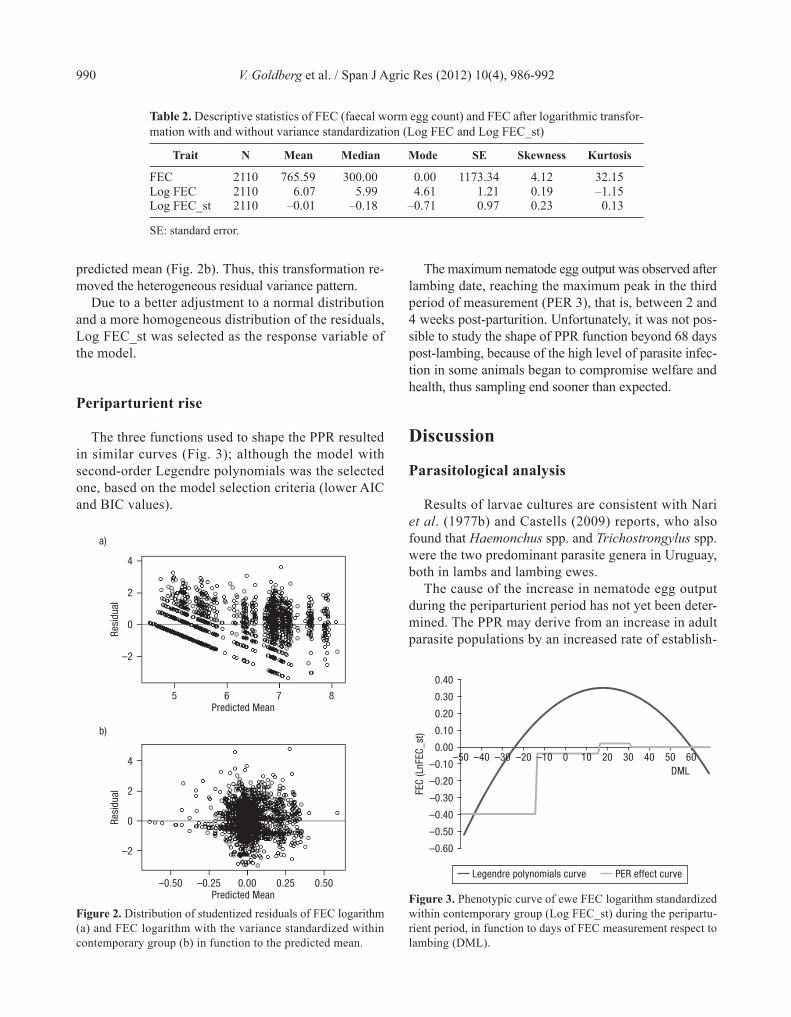
The studentized residuals of Log FEC and Log FEC_st were also analyzed. The pattern of residuals of Log FEC, as a function of the predicted mean, showed heteroske-dascity of the residual variance (Fig. 2a). The distribution of studentized residuals of Log FEC_st had a better adjust-ment to a normal distribution and they were more uni-formly distributed when were plotted as a function of the
0
100
90
80
70
60
Talitas 30/08
Talitas 02/10
Gringa 30/08
Gringa 02/10
FMN 1 02/09
FMN 2 02/09
FMN 2 20/09
FMN 3 20/09
FMN 14/10
FMN 24/11
Sampling date
Para
site
gen
era
(%)
50
40
30
20
10
Cooperia Oesophagostomum Teladorsagia Trichostrongylus Haemonchus
Figure 1. Parasite genera presented in the sampling performed in the three flocks. FMN 1, FMN 2, FMN 3: Fine Merino Nucleus parturition group 1, 2 and 3, respectively.
V. Goldberg et al. / Span J Agric Res (2012) 10(4), 986-992990
predicted mean (Fig. 2b). Thus, this transformation re-moved the heterogeneous residual variance pattern.
Due to a better adjustment to a normal distribution and a more homogeneous distribution of the residuals, Log FEC_st was selected as the response variable of the model.
Periparturient rise
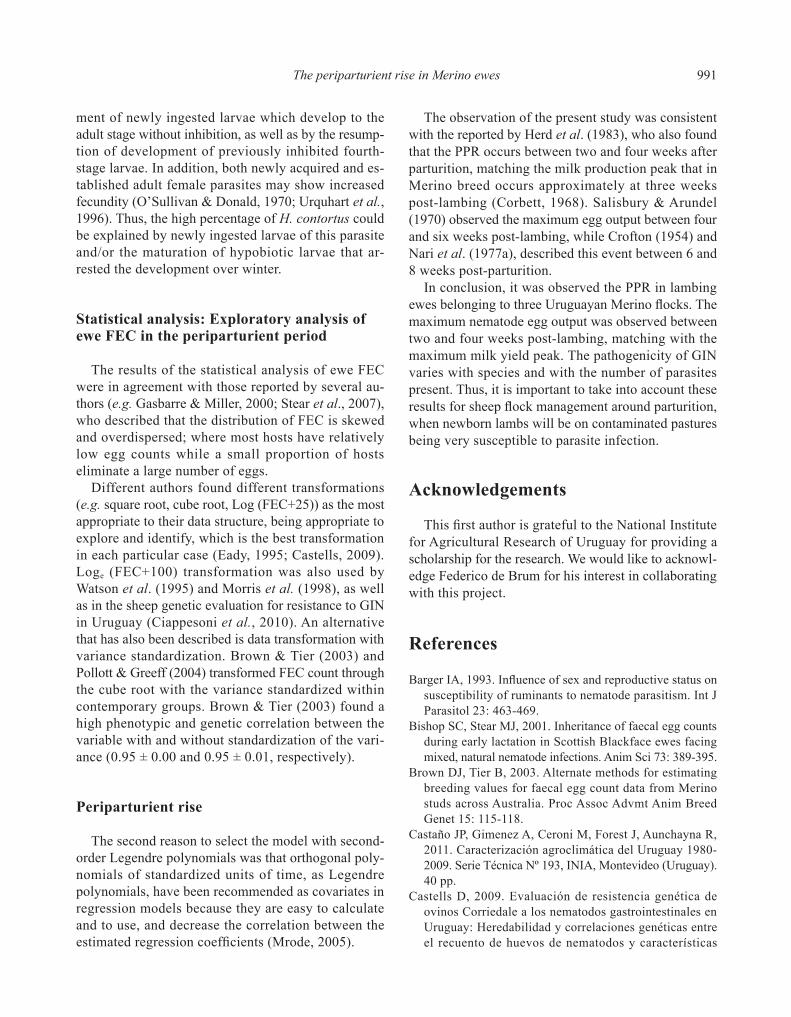
The three functions used to shape the PPR resulted in similar curves (Fig. 3); although the model with second-order Legendre polynomials was the selected one, based on the model selection criteria (lower AIC and BIC values).
The maximum nematode egg output was observed after lambing date, reaching the maximum peak in the third period of measurement (PER 3), that is, between 2 and 4 weeks post-parturition. Unfortunately, it was not pos-sible to study the shape of PPR function beyond 68 days post-lambing, because of the high level of parasite infec-tion in some animals began to compromise welfare and health, thus sampling end sooner than expected.
Discussion
Parasitological analysis
Results of larvae cultures are consistent with Nari et al. (1977b) and Castells (2009) reports, who also found that Haemonchus spp. and Trichostrongylus spp. were the two predominant parasite genera in Uruguay, both in lambs and lambing ewes.
The cause of the increase in nematode egg output during the periparturient period has not yet been deter-mined. The PPR may derive from an increase in adult parasite populations by an increased rate of establish-
Table 2. Descriptive statistics of FEC (faecal worm egg count) and FEC after logarithmic transfor-mation with and without variance standardization (Log FEC and Log FEC_st)
Trait N Mean Median Mode SE Skewness Kurtosis
FEC 2110 765.59 300.00 0.00 1173.34 4.12 32.15Log FEC 2110 6.07 5.99 4.61 1.21 0.19 –1.15Log FEC_st 2110 –0.01 –0.18 –0.71 0.97 0.23 0.13
SE: standard error.
4
Resi
dual
a)
Predicted Mean
2
5 6 7 8
0
–2
b)
Resi
dual
Predicted Mean–0.50 –0.25 0.00 0.25 0.50
4
2
0
–2
Figure 2. Distribution of studentized residuals of FEC logarithm (a) and FEC logarithm with the variance standardized within contemporary group (b) in function to the predicted mean.
0.40
FEC
(LnF
EC_s
t)
DML
0.30
0.10
0.20
0.00
–0.10
–0.50
–0.40
–0.30
–0.60
–50
–0.20
0–10 10–40 –30 –20 20 30 40 50 60
Legendre polynomials curve PER effect curve
Figure 3. Phenotypic curve of ewe FEC logarithm standardized within contemporary group (Log FEC_st) during the peripartu-rient period, in function to days of FEC measurement respect to lambing (DML).
991The periparturient rise in Merino ewes
ment of newly ingested larvae which develop to the adult stage without inhibition, as well as by the resump-tion of development of previously inhibited fourth-stage larvae. In addition, both newly acquired and es-tablished adult female parasites may show increased fecundity (O’Sullivan & Donald, 1970; Urquhart et al., 1996). Thus, the high percentage of H. contortus could be explained by newly ingested larvae of this parasite and/or the maturation of hypobiotic larvae that ar-rested the development over winter.
Statistical analysis: Exploratory analysis of ewe FEC in the periparturient period
The results of the statistical analysis of ewe FEC were in agreement with those reported by several au-thors (e.g. Gasbarre & Miller, 2000; Stear et al., 2007), who described that the distribution of FEC is skewed and overdispersed; where most hosts have relatively low egg counts while a small proportion of hosts eliminate a large number of eggs.
Different authors found different transformations (e.g. square root, cube root, Log (FEC+25)) as the most appropriate to their data structure, being appropriate to explore and identify, which is the best transformation in each particular case (Eady, 1995; Castells, 2009). Loge (FEC+100) transformation was also used by Watson et al. (1995) and Morris et al. (1998), as well as in the sheep genetic evaluation for resistance to GIN in Uruguay (Ciappesoni et al., 2010). An alternative that has also been described is data transformation with variance standardization. Brown & Tier (2003) and Pollott & Greeff (2004) transformed FEC count through the cube root with the variance standardized within contemporary groups. Brown & Tier (2003) found a high phenotypic and genetic correlation between the variable with and without standardization of the vari-ance (0.95 ± 0.00 and 0.95 ± 0.01, respectively).
Periparturient rise
The second reason to select the model with second-order Legendre polynomials was that orthogonal poly-nomials of standardized units of time, as Legendre polynomials, have been recommended as covariates in regression models because they are easy to calculate and to use, and decrease the correlation between the estimated regression coefficients (Mrode, 2005).
The observation of the present study was consistent with the reported by Herd et al. (1983), who also found that the PPR occurs between two and four weeks after parturition, matching the milk production peak that in Merino breed occurs approximately at three weeks post-lambing (Corbett, 1968). Salisbury & Arundel (1970) observed the maximum egg output between four and six weeks post-lambing, while Crofton (1954) and Nari et al. (1977a), described this event between 6 and 8 weeks post-parturition.
In conclusion, it was observed the PPR in lambing ewes belonging to three Uruguayan Merino flocks. The maximum nematode egg output was observed between two and four weeks post-lambing, matching with the maximum milk yield peak. The pathogenicity of GIN varies with species and with the number of parasites present. Thus, it is important to take into account these results for sheep flock management around parturition, when newborn lambs will be on contaminated pastures being very susceptible to parasite infection.
Acknowledgements
This first author is grateful to the National Institute for Agricultural Research of Uruguay for providing a scholarship for the research. We would like to acknowl-edge Federico de Brum for his interest in collaborating with this project.
References
Barger IA, 1993. Influence of sex and reproductive status on susceptibility of ruminants to nematode parasitism. Int J Parasitol 23: 463-469.
Bishop SC, Stear MJ, 2001. Inheritance of faecal egg counts during early lactation in Scottish Blackface ewes facing mixed, natural nematode infections. Anim Sci 73: 389-395.
Brown DJ, Tier B, 2003. Alternate methods for estimating breeding values for faecal egg count data from Merino studs across Australia. Proc Assoc Advmt Anim Breed Genet 15: 115-118.
Castaño JP, Gimenez A, Ceroni M, Forest J, Aunchayna R, 2011. Caracterización agroclimática del Uruguay 1980-2009. Serie Técnica Nº 193, INIA, Montevideo (Uruguay). 40 pp.
Castells D, 2009. Evaluación de resistencia genética de ovinos Corriedale a los nematodos gastrointestinales en Uruguay: Heredabilidad y correlaciones genéticas entre el recuento de huevos de nematodos y características
V. Goldberg et al. / Span J Agric Res (2012) 10(4), 986-992992
productivas. Master’s thesis. Univ. de la República, Mon-tevideo, Uruguay. 40 pp.
Castells D, Nari A, Rizzo E, Marmol E, Acosta D, 1995. Efecto de los nematodes gastrointestinales sobre diversos parámetros productivos del ovino en la etapa de recría. Producción Ovina 8: 17-31.
Ciappesoni G, Gimeno D, Ravagnolo O, 2010. Genetic re-lationships between faecal worm egg count and production traits in Merino sheep of Uruguay. Proc 9th World Congr Genet Appl Livest Prod, Leipzig (Germany), August 1-6. pp: 4-142.
Corbett JL, 1968. Variation in the yield and composition of milk of grazing Merino ewes. Aust J Agric Res 19: 283-294.
Crofton HD, 1954. Nematode parasite populations in sheep on lowland farms. I. Worm egg counts in ewes. Parasitol 44: 465-477.
Eady SJ, 1995. Implications of non-normal distribution of faecal egg count for measuring worm resistance in Me-rino sire evaluation schemes. Proc Assoc Advmt Anim Breed Genet 11: 79-83.
Gasbarre LC, Miller JE, 2000. Genetics of helminth resist-ance. In: Breeding for disease resistance in farm animal (Axford RFE, Bishop SC, Nicholas FW, Owen JB, eds), 2nd edition, CAB Int, Wallingford (UK), pp: 129-152.
Herd RP, Streitel RH, McClure KE, Parker CF, 1983. Control of periparturient rise in worm egg counts of lambing ewes. J Am Vet Med Assoc 182: 375-379.
Morris CA, Bisset SA, Vlassoff A, West CJ, Wheeler M, 1998. Faecal nematode egg counts in lactating ewes from Romney flocks selectively bred for divergence in lamb faecal egg count. Anim Sci 67: 283-288.
Mrode RA, 2005. Analysis of longitudinal data. In: Linear models for the prediction of animal breeding values (Mrode RA, ed), 2nd edition, CAB Int, Wallingford (UK), pp: 135-162.
Nari A, Cardozo H, Berdie J, 1977a. Alza de lactación (Spring rise) para nematodos gastrointestinales en ovinos. Primera comprobación en el Uruguay. Veterinaria 12: 147-156.
Nari A, Cardozo H, Berdié J, Canábez F, Bawden R, 1977b. Dinámica de población para nematodes gastrointestinales de ovinos en el Uruguay. Veterinaria 14: 11-24.
O’Sullivan BM, Donald, AD, 1970. A field study of nema-tode parasite populations in the lactating ewe. Parasitol 61: 301-315.
Ott RL, Longnecker M, 2001. More on multiple regression. In: An introduction to statistical methods and data analysis (Ott RL, Longnecker M, eds), 5th edition, Dux-bury, Pacific Grove, CA (USA), pp: 758-782.
Perry BD, Randolph TF, 1999. Improving the assessment of the economic impact of parasitic diseases and of their control in production animals. Vet Parasitol 84: 145-168.
Pollott GE, Greeff JC, 2004. Genetic relationships between faecal egg count and production traits in commercial Merino sheep flock. Anim Sci 79: 21-32.
Romero JR, Boero CA, 2001. Epidemiología de la gastro-enteritis verminosa de los ovinos en regiones templadas y cálidas de la Argentina. Analecta Veterinaria 21: 21-37.
Salisbury JR, Arundel JH, 1970. Periparturient deposition of nematode eggs by ewes and residual pasture con-tamination as sources of infection for lambs. Aust Vet J 46: 523-529.
SAS Inst, 2004. SAS 9.1.3 help and documentation. SAS Institute Inc., 2002-2004, Cary, NC, USA.
Stear MJ, Fitton L, Innocent GT, Murphy L, Rennie K, Matthews L, 2007. The dynamic influence of genetic variation on the susceptibility of sheep to gastrointesti-nal nematode infection. J R Soc Interface 4: 767-776.
Taylor EL, 1935. Seasonal fluctuation in the number of eggs of Trichostrongylid worms in the faeces of ewes. J Parasitol 21: 175-179.
Urquhart GM, Armour J, Duncan JL, Dunn AM, Jennings FW, 1996. Veterinary Helminthology. In: Veterinary Parasitology (Urquhart GM et al., eds) 2nd edition, Blackwell Sci, University of Glasgow (Scotland), pp. 3-10.
Watson TG, Hosking BC, Morris CA, Hurford AP, 1995. Faecal nematode egg counts and haematology in Peren-dale ewes near lambing. Proc N Z Soc Anim Prod 55: 202-204.
Whitlock HV, 1948. Some modifications of the McMaster helminth egg counting technique and apparatus. J Coun-cil Sci Industrial Res 21: 177-180.