Embed Size (px)
Citation preview
Hydropower'15 Stavanger, Norway 15-16 June 2015
Modelling Southeast Asian subduction zones for seismic hazard assessments using global tectonics and GIS techniques V-A. Dimas1, A.M. Kaynia2,3 & G. Gibson1 Seismology Research Centre, ESS Earth Sciences Pty Ltd, Australia1 Norwegian Geotechnical Institute, Norway2
Norwegian University of Science and Technology, Norway3
ABSTRACT: A three-dimensional earthquake recurrence model for the Asia-Pacific region (ASIA-1) has been developed for use in Probabilistic Seismic Hazard Assessments (PSHA) of various engineered structures, including water storage dams, hydro-electric dams, offshore platforms, LNG plants and mine sites. Subduction zones are of great importance globally as they are the most seismically active plate boundaries, as well as being the source of the largest recorded seismic events. The model includes shallow crustal sources and complex deep sources covering the subduction interface and slab. The full model, with 226 crustal surface zones and 142 subduction source zones, extends from Iran in the Near East, Mongolia in northern Asia, covering all of Southeast Asia, Papua New Guinea and the Pacific Islands of New Caledonia, Fiji and Tonga. Visualizing the seismic activity by mapping all earthquakes in three dimensions allows the hazard analyst to develop a suitable seismic source model. Differentiating between shallow crustal and deep subduction earthquakes, allows more appropriate determination of earthquake recurrence rates in calculating a PSHA. A novel approach to the ASIA-1 model is the segmentation of the surface zones of the subduction plate into an outer rise, prism and a shallow crustal zone to differentiate the bending and deformation within the subducting and over-riding plates, and therefore associated varying levels of seismicity. The complex relationships at plate boundaries are fundamental to developing appropriate seismic hazard assessments. The paper will highlight the importance of accounting for all seismogenic sources in design applications, particularly the shallow crustal events associated with deformation during subduction. The frequency ranges to which different sources contribute have direct bearing on the seismic hazard for the built environment. In addition, the earthquake motions at bedrock level are amplified by the local soil deposit; so the relation between the frequency content of the seismic source and the natural frequencies of the surface sediments are important issues in the overall earthquake hazard at a site. INTRODUCTION: A three-dimensional crustal and subduction source model for the Asia-Pacific region (herein the ASIA-1 model) has been developed for use in seismic hazard assessments of various engineered structures, including large water storage dams, hydro-electric dams, LNG plants, offshore platforms and mine sites. Subduction zones are of great importance globally as they are the most seismically active of all plate boundaries, whilst also producing the largest recorded seismic events. A seismic source model for use in Probabilistic Seismic Hazard Assessments (PSHA) has been developed incorporating shallow crustal sources, and more complex deep sources to account for the subduction interface and slab components. The model is composed of a total of 226 shallow crustal source zones, 142 deep subduction source zones and four large segments for the main trench-line along the south-western edge of the Sunda Plate, as well as other notable active continental faults. This paper presents an approach in modelling the three-dimensional nature of the Arakan-Andaman, Sumatra-Java and Philippines Trenches using global earthquake data and GIS techniques. It is defined using an amalgamation of the International Seismological Centre (ISC) earthquake data and other source data to define the subduction slabs motion as it descends into the mantle. The relative amount of earthquake activity is mapped in a series of cross sections for the study area in the design of appropriate source boundaries, parameters and depths.
Hydropower'15 Stavanger, Norway 15-16 June 2015
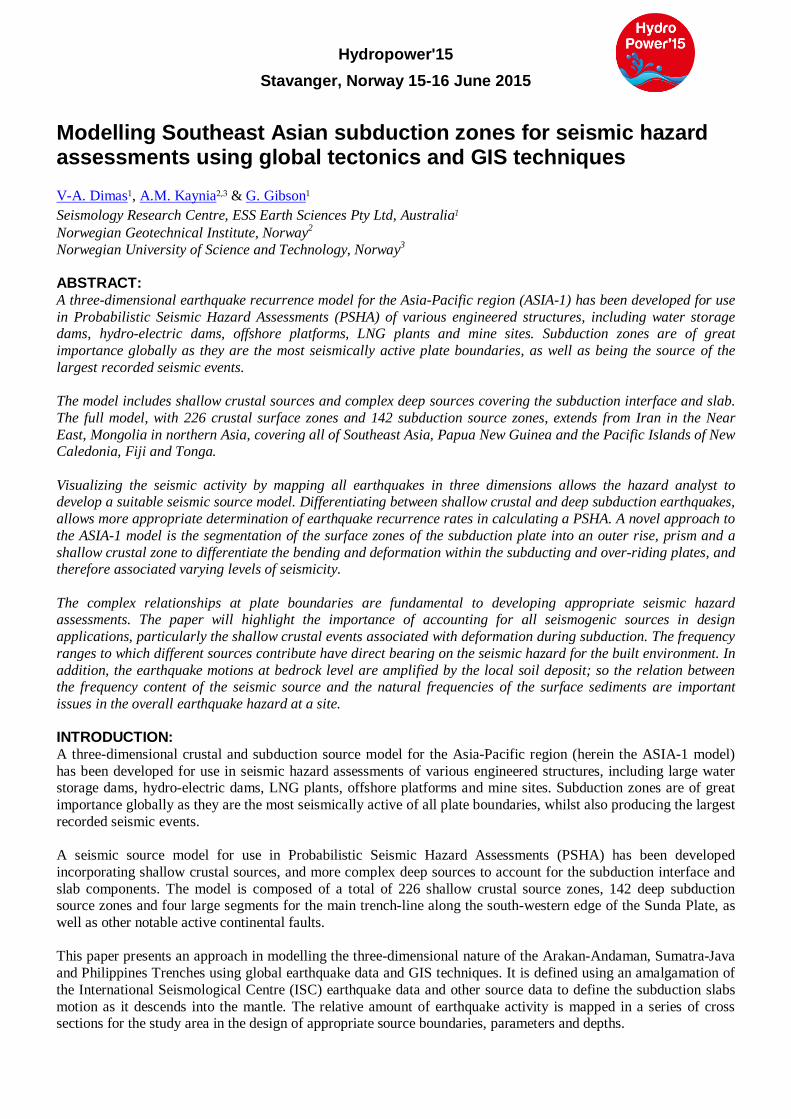
Improved understanding of the complex relationships at plate boundaries is fundamental to developing and determining appropriate seismic hazard assessments in design applications. The frequency ranges to which different sources contribute have a direct impact on the level of seismicity of the built environment and varied constructions such as large dams, LNG facilities (both on and offshore) and mining sites. Three examples from sites located along the subduction trenches are represented by earthquake motions at bedrock levels with hazard results varying depending on a number of parameters, such as the soil amplification, applicable ground motion models and distance from active continental faults and subduction sources. TECTONICS: The study area (black inset box in Figure 1) is located within the geographic region of Southeast Asia. It is located within the Sunda Plate, which experiences the forces of the surrounding plates including the Indo-Australian plate from the south and south-west, the Burma micro-plate from the north-west, the Eurasian-Yangtze plates to the north, the Philippines Mobile Belt from the east and a series of smaller fragmented plates between Australia and Borneo in the south-east. The larger surrounding plates exerting greatest forces are the Indo-Australian, Eurasian and Philippines-Pacific Plates. These are the driving forces influencing the rate and amount of movement of the enclosed micro-plates.
Figure 1: The 52 plates of model PB2002 (extracted from Bird, 2003) represented by contrasting plate boundary mechanisms: (purple are convergent boundaries, red are spreading ridges, green are transform faulting and blue are subduction zones). Source: Eric Gaba.
In Southeast Asia, the largest magnitude earthquakes occur along the plate boundaries where the Indo-Australian Plate is subducting beneath the Sunda Plate. The subducting plates of the Arakan-Andaman, Sumatra and Java Trenches are more uniform and planar form of subduction, whilst the Timor and Philippines Trenches on the east and south-eastern edges of the Sunda Plate have a more complex form of subduction as the micro-plates move relative to each other, also causing smaller subduction processes. These long trenches, often over 1,000 kilometres in length, can produce large rupture areas and hence very large magnitude earthquakes. SEISMICITY: Five of the seventeen largest recorded magnitude earthquakes since 1900 have occurred in Southeast Asia, with the largest of these the ML 9.1 off the west coast of northern Sumatra on December 26th 2004 (USGS, 2015). All of the seventeen largest recorded earthquakes since 1900 (except the ML 8.6 Assam-Tibet earthquake on August 15th 1950) have occurred along the Pacific Ring of Fire, which includes most of the world’s largest and deepest subduction trenches. SEISMIC CATALOGUE: In PSHA studies it is important to use both global and local earthquake catalogues to give a reliable completeness magnitude range that is appropriate for the study area. Good seismograph coverage and subsequent collection of earthquake data is important in defining a lower magnitude of completeness (especially important in less active areas) for the better approximation of small to large earthquakes in determining the Gutenberg-Richter b-value. For most parts of the study area we have used a completeness magnitude of ML 4.0 or lower since 1965. World seismograph coverage improved dramatically in about 1960, following the International Geophysical Year during 1957-1958. All larger earthquakes in the study area after that time would have been detected by the global network. Local seismograph networks in many countries are however under-funded and dependent on key staff that may be promoted to senior administrative roles, resulting in the removal of seismographs (due to lack of funding) also has an impact in increasing the magnitude for relative completeness for a given period of time. Since the ML 9.1 Sumatra 2004 earthquake the importance of improving both local and global networks has begun with new instruments installed, however some of these projects have since ended, and will also affect completeness coverage.
Hydropower'15 Stavanger, Norway 15-16 June 2015
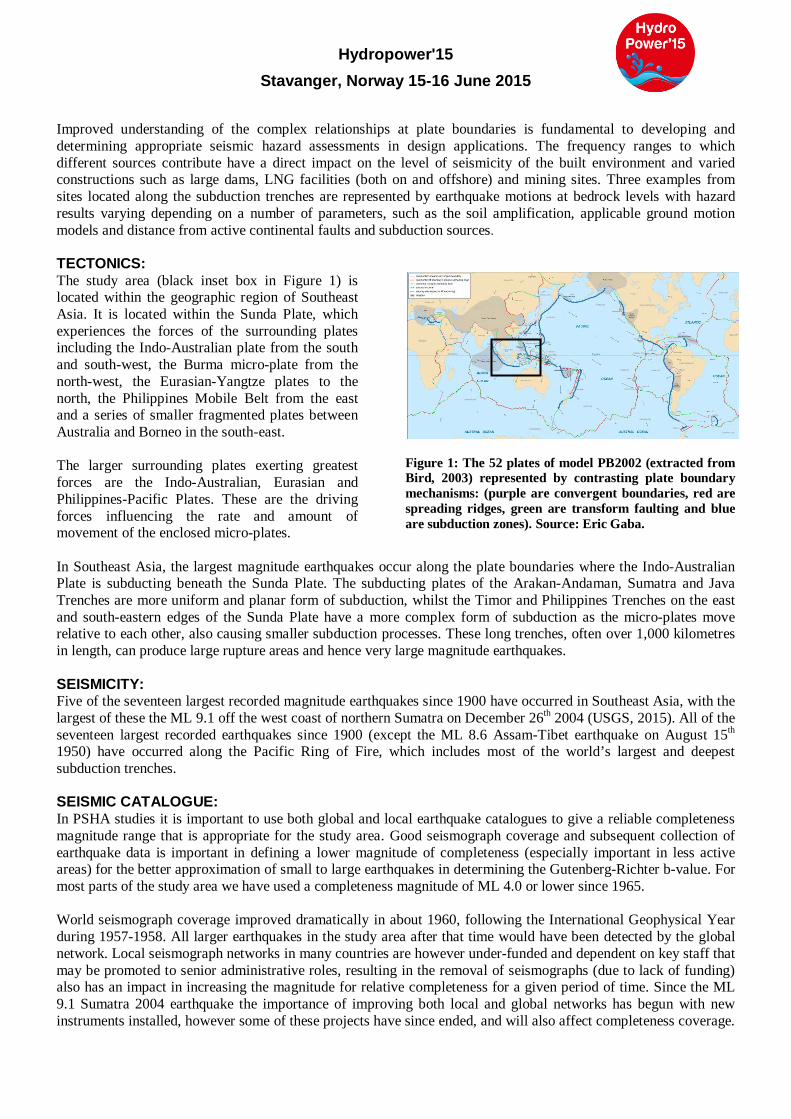
This study used the ISC Comprehensive Catalogue, which includes the United States Geological Survey (USGS) data, plus other collected data and results provided by many other authorities; including the Chinese Earthquake Administration, the Indian Meteorological Department, as well as authorities in Vietnam, Thailand, Indonesia, Myanmar and the Philippines. This combined dataset includes all known events with a magnitude of 4.0+ from 1900 to the end of July 2012, with historical events added where available. A problem of adding many more events to a catalogue is that it will tend to increase estimates of hazard. If most added events are relatively small, increasing the ratio of small to large events (Gutenberg-Richter b-value), will tend to decrease the extrapolated rate of large infrequent events, and hence decreasing estimates of hazard. This effect depends on several factors, ranging from a significant increase in estimated hazard to a significant decrease. The seismicity of the study area is shown in Figure 2 with depth and size of each event categorised by colour and size respectively, with shallow events over-written by deep events. This map also shows the plate boundaries (in black), as defined by Bird (2003) with a series of cross section references marked as A-A' to N-N' (in grey).
Figure 2: Map of seismicity in study area (earthquakes are colour coded for depth and by size for magnitude). The earthquake data plotted in this map is used to delineate the earthquake recurrence model. EARTHQUAKE RECURRENCE MODEL: The Earthquake Magnitude Recurrence (EMR) model gives the distribution and probability of recurrence of all earthquakes expected in the region defined using GIS techniques. Each source zone is represented by polygonal prisms with horizontal upper and lower surfaces with a specified depth range. It is assumed that earthquake magnitude recurrence is uniform throughout the prism, and that a rate of activity is assigned (number of events exceeding some magnitude per year), as well as a relative number of small to large earthquakes (Gutenberg-Richter b-value) and a maximum credible magnitude for the zone. Gradational activity is often represented by parallel zones, particularly important in further segmentation of the subduction zone itself. Active faults are represented as a dipping surface, defined by an upper trace (a line at the surface outcrop of the fault), a dip angle and a depth. Earthquakes are assumed to occur at any point on the fault plane with equal probability of rupturing along this plane. Earthquake activity is specified by the long-term average slip rate (in
Hydropower'15 Stavanger, Norway 15-16 June 2015
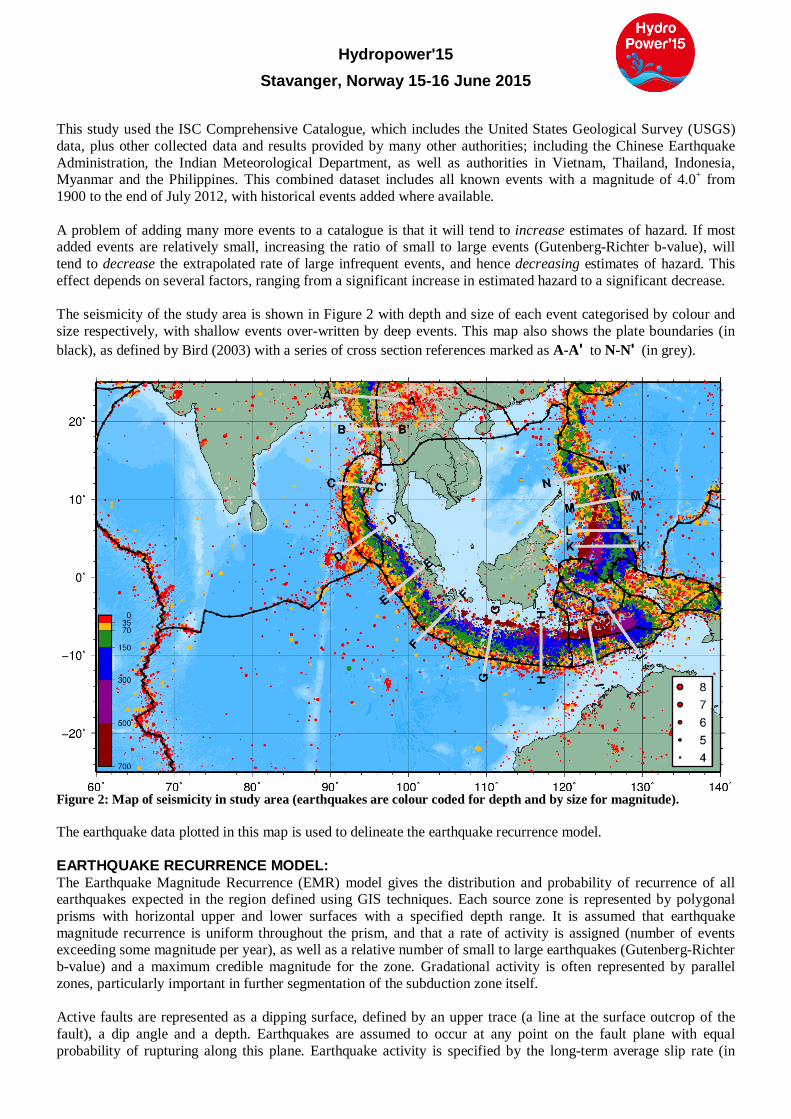
metres per million years or m/Myr) and a model of exponential, characteristic, or normal is applied. The maximum earthquake magnitude (Mmax) is limited by the fault length, surface rupture area. INTERNAL STRUCTURE OF THE CRUST AND MANTLE: The depth ranges used in the EMR are directly related to the internal structure of the Earth, taking into account the changes in both chemical and physical composition of the Earth, see Figure 3.The ranges used in our EMR model have been used to separate earthquakes relative to these depth ranges. These include crustal surface areal source zones categorised according to either thin oceanic (typical depths 0-20 km) or thicker continental crusts (typical depths 2-20 km and for thicker crustal zones with 2-35 km depth). The subduction areal source zones are defined according to the following depth ranges taking into account crust and mantle changes: E as 35-70 km deep; F as 70-150 km deep; G as 150-300 km deep; H as 300-500 km deep and I as 500-700+ km deep.
Figure 3: A cross-section of Earth’s outer layers (By courtesy of Encyclopaedia Britannica, Inc.,
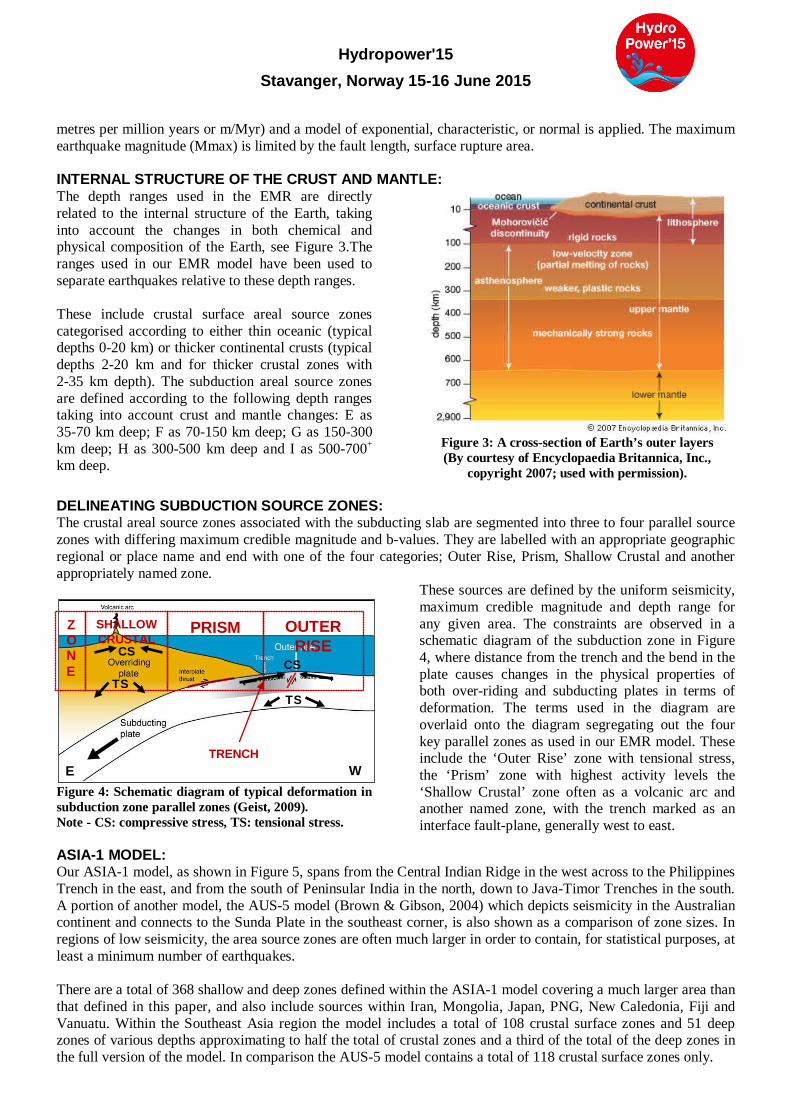
copyright 2007; used with permission). DELINEATING SUBDUCTION SOURCE ZONES: The crustal areal source zones associated with the subducting slab are segmented into three to four parallel source zones with differing maximum credible magnitude and b-values. They are labelled with an appropriate geographic regional or place name and end with one of the four categories; Outer Rise, Prism, Shallow Crustal and another appropriately named zone.
Figure 4: Schematic diagram of typical deformation in subduction zone parallel zones (Geist, 2009). Note - CS: compressive stress, TS: tensional stress.
These sources are defined by the uniform seismicity, maximum credible magnitude and depth range for any given area. The constraints are observed in a schematic diagram of the subduction zone in Figure 4, where distance from the trench and the bend in the plate causes changes in the physical properties of both over-riding and subducting plates in terms of deformation. The terms used in the diagram are overlaid onto the diagram segregating out the four key parallel zones as used in our EMR model. These include the ‘Outer Rise’ zone with tensional stress, the ‘Prism’ zone with highest activity levels the ‘Shallow Crustal’ zone often as a volcanic arc and another named zone, with the trench marked as an interface fault-plane, generally west to east.
ASIA-1 MODEL: Our ASIA-1 model, as shown in Figure 5, spans from the Central Indian Ridge in the west across to the Philippines Trench in the east, and from the south of Peninsular India in the north, down to Java-Timor Trenches in the south. A portion of another model, the AUS-5 model (Brown & Gibson, 2004) which depicts seismicity in the Australian continent and connects to the Sunda Plate in the southeast corner, is also shown as a comparison of zone sizes. In regions of low seismicity, the area source zones are often much larger in order to contain, for statistical purposes, at least a minimum number of earthquakes. There are a total of 368 shallow and deep zones defined within the ASIA-1 model covering a much larger area than that defined in this paper, and also include sources within Iran, Mongolia, Japan, PNG, New Caledonia, Fiji and Vanuatu. Within the Southeast Asia region the model includes a total of 108 crustal surface zones and 51 deep zones of various depths approximating to half the total of crustal zones and a third of the total of the deep zones in the full version of the model. In comparison the AUS-5 model contains a total of 118 crustal surface zones only.
OUTER RISE
PRISM SHALLOW CRUSTAL
ZONE
TRENCH W E
TS TS
CS CS
Hydropower'15 Stavanger, Norway 15-16 June 2015
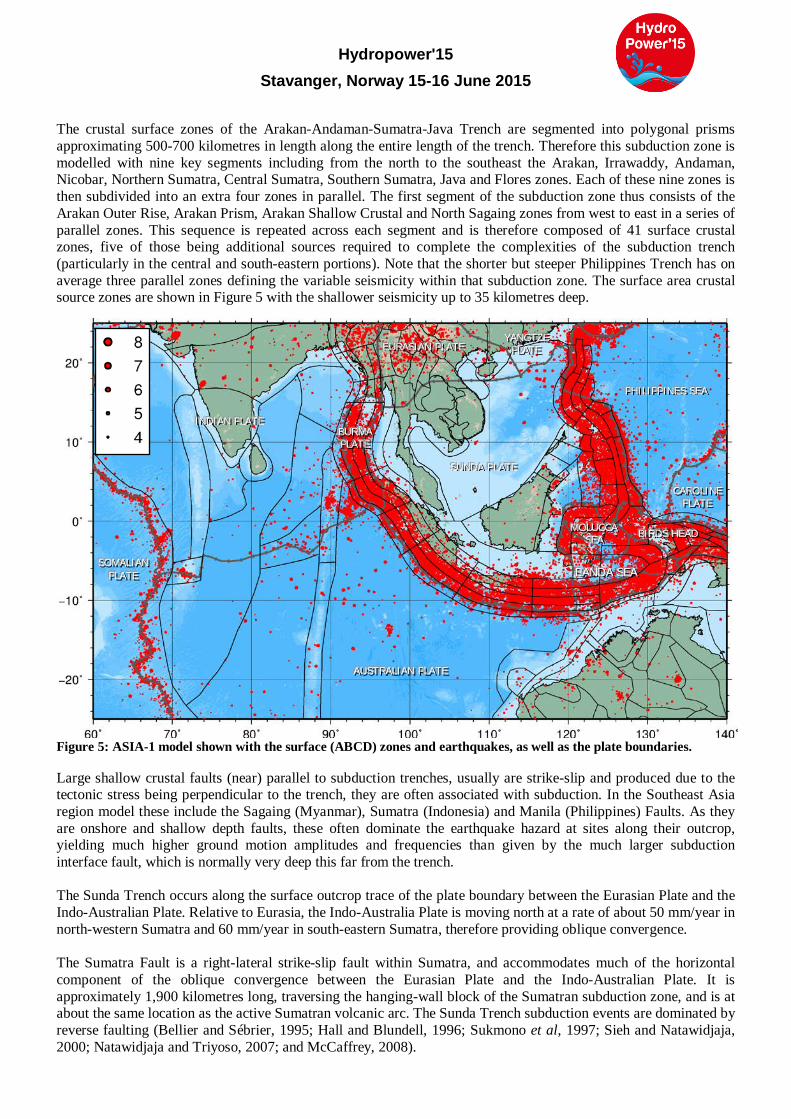
The crustal surface zones of the Arakan-Andaman-Sumatra-Java Trench are segmented into polygonal prisms approximating 500-700 kilometres in length along the entire length of the trench. Therefore this subduction zone is modelled with nine key segments including from the north to the southeast the Arakan, Irrawaddy, Andaman, Nicobar, Northern Sumatra, Central Sumatra, Southern Sumatra, Java and Flores zones. Each of these nine zones is then subdivided into an extra four zones in parallel. The first segment of the subduction zone thus consists of the Arakan Outer Rise, Arakan Prism, Arakan Shallow Crustal and North Sagaing zones from west to east in a series of parallel zones. This sequence is repeated across each segment and is therefore composed of 41 surface crustal zones, five of those being additional sources required to complete the complexities of the subduction trench (particularly in the central and south-eastern portions). Note that the shorter but steeper Philippines Trench has on average three parallel zones defining the variable seismicity within that subduction zone. The surface area crustal source zones are shown in Figure 5 with the shallower seismicity up to 35 kilometres deep.
Figure 5: ASIA-1 model shown with the surface (ABCD) zones and earthquakes, as well as the plate boundaries. Large shallow crustal faults (near) parallel to subduction trenches, usually are strike-slip and produced due to the tectonic stress being perpendicular to the trench, they are often associated with subduction. In the Southeast Asia region model these include the Sagaing (Myanmar), Sumatra (Indonesia) and Manila (Philippines) Faults. As they are onshore and shallow depth faults, these often dominate the earthquake hazard at sites along their outcrop, yielding much higher ground motion amplitudes and frequencies than given by the much larger subduction interface fault, which is normally very deep this far from the trench. The Sunda Trench occurs along the surface outcrop trace of the plate boundary between the Eurasian Plate and the Indo-Australian Plate. Relative to Eurasia, the Indo-Australia Plate is moving north at a rate of about 50 mm/year in north-western Sumatra and 60 mm/year in south-eastern Sumatra, therefore providing oblique convergence. The Sumatra Fault is a right-lateral strike-slip fault within Sumatra, and accommodates much of the horizontal component of the oblique convergence between the Eurasian Plate and the Indo-Australian Plate. It is approximately 1,900 kilometres long, traversing the hanging-wall block of the Sumatran subduction zone, and is at about the same location as the active Sumatran volcanic arc. The Sunda Trench subduction events are dominated by reverse faulting (Bellier and Sébrier, 1995; Hall and Blundell, 1996; Sukmono et al, 1997; Sieh and Natawidjaja, 2000; Natawidjaja and Triyoso, 2007; and McCaffrey, 2008).
AAAUUUSSSTTTRRRAAALLL IIIAAANNN PPPLLLAAA TTTEEE
IIINNNDDDIIIAAANNN PPPLLLAAA TTTEEE
EEEUUURRRAAASSSIIIAAANNN PPPLLLAAATTTEEE
PPPHHHIII LLLIII PPPPPP IIINNNEEESSS SSSEEEAAA
YYYAAANNNGGGTTTZZZEEE PPPLLLAAATTTEEE
SSSUUUNNNDDDAAA PPPLLLAAATTTEEE
BBBIIIRRRDDDSSS HHHEEEAAADDD
BBBAAANNNDDDAAA SSSEEEAAA
MMMOOOLLLUUUCCCCCCAAA SSSEEEAAA
CCCAAARRROOOLLLIIINNNEEE PPPLLLAAATTTEEE
BBBUUURRRMMMAAA PPPLLLAAATTTEEE
SSSOOOMMMAAALLL IIIAAANNN PPPLLLAAATTTEEE
Hydropower'15 Stavanger, Norway 15-16 June 2015
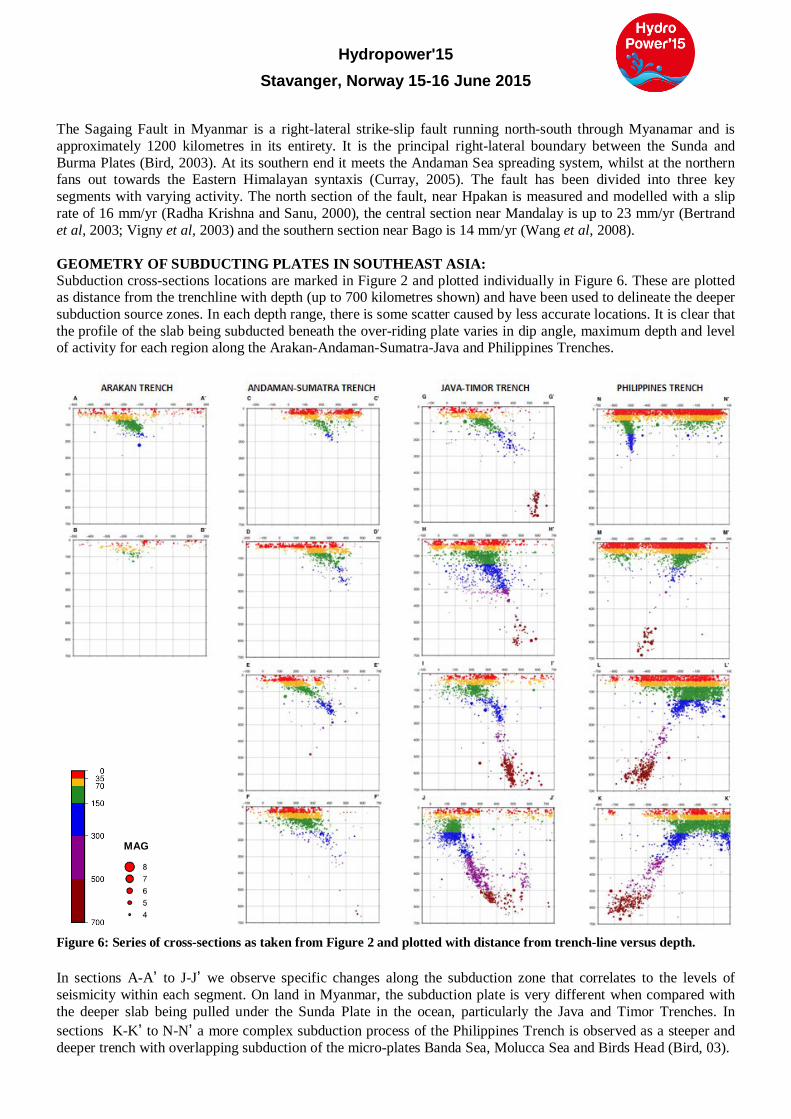
The Sagaing Fault in Myanmar is a right-lateral strike-slip fault running north-south through Myanamar and is approximately 1200 kilometres in its entirety. It is the principal right-lateral boundary between the Sunda and Burma Plates (Bird, 2003). At its southern end it meets the Andaman Sea spreading system, whilst at the northern fans out towards the Eastern Himalayan syntaxis (Curray, 2005). The fault has been divided into three key segments with varying activity. The north section of the fault, near Hpakan is measured and modelled with a slip rate of 16 mm/yr (Radha Krishna and Sanu, 2000), the central section near Mandalay is up to 23 mm/yr (Bertrand et al, 2003; Vigny et al, 2003) and the southern section near Bago is 14 mm/yr (Wang et al, 2008). GEOMETRY OF SUBDUCTING PLATES IN SOUTHEAST ASIA: Subduction cross-sections locations are marked in Figure 2 and plotted individually in Figure 6. These are plotted as distance from the trenchline with depth (up to 700 kilometres shown) and have been used to delineate the deeper subduction source zones. In each depth range, there is some scatter caused by less accurate locations. It is clear that the profile of the slab being subducted beneath the over-riding plate varies in dip angle, maximum depth and level of activity for each region along the Arakan-Andaman-Sumatra-Java and Philippines Trenches.
Figure 6: Series of cross-sections as taken from Figure 2 and plotted with distance from trench-line versus depth. In sections A-A’ to J-J’ we observe specific changes along the subduction zone that correlates to the levels of seismicity within each segment. On land in Myanmar, the subduction plate is very different when compared with the deeper slab being pulled under the Sunda Plate in the ocean, particularly the Java and Timor Trenches. In sections K-K’ to N-N’ a more complex subduction process of the Philippines Trench is observed as a steeper and deeper trench with overlapping subduction of the micro-plates Banda Sea, Molucca Sea and Birds Head (Bird, 03).
MAG
Hydropower'15 Stavanger, Norway 15-16 June 2015
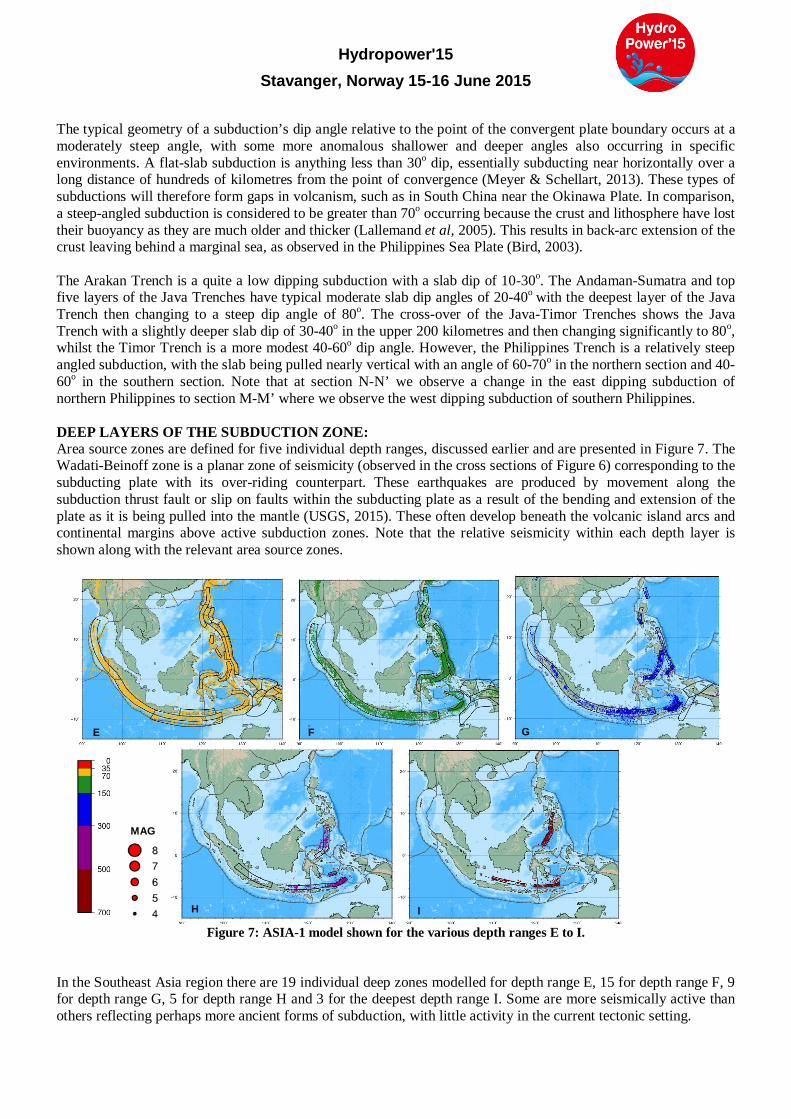
The typical geometry of a subduction’s dip angle relative to the point of the convergent plate boundary occurs at a moderately steep angle, with some more anomalous shallower and deeper angles also occurring in specific environments. A flat-slab subduction is anything less than 30o dip, essentially subducting near horizontally over a long distance of hundreds of kilometres from the point of convergence (Meyer & Schellart, 2013). These types of subductions will therefore form gaps in volcanism, such as in South China near the Okinawa Plate. In comparison, a steep-angled subduction is considered to be greater than 70o occurring because the crust and lithosphere have lost their buoyancy as they are much older and thicker (Lallemand et al, 2005). This results in back-arc extension of the crust leaving behind a marginal sea, as observed in the Philippines Sea Plate (Bird, 2003). The Arakan Trench is a quite a low dipping subduction with a slab dip of 10-30o. The Andaman-Sumatra and top five layers of the Java Trenches have typical moderate slab dip angles of 20-40o with the deepest layer of the Java Trench then changing to a steep dip angle of 80o. The cross-over of the Java-Timor Trenches shows the Java Trench with a slightly deeper slab dip of 30-40o in the upper 200 kilometres and then changing significantly to 80o, whilst the Timor Trench is a more modest 40-60o dip angle. However, the Philippines Trench is a relatively steep angled subduction, with the slab being pulled nearly vertical with an angle of 60-70o in the northern section and 40-60o in the southern section. Note that at section N-N’ we observe a change in the east dipping subduction of northern Philippines to section M-M’ where we observe the west dipping subduction of southern Philippines. DEEP LAYERS OF THE SUBDUCTION ZONE: Area source zones are defined for five individual depth ranges, discussed earlier and are presented in Figure 7. The Wadati-Beinoff zone is a planar zone of seismicity (observed in the cross sections of Figure 6) corresponding to the subducting plate with its over-riding counterpart. These earthquakes are produced by movement along the subduction thrust fault or slip on faults within the subducting plate as a result of the bending and extension of the plate as it is being pulled into the mantle (USGS, 2015). These often develop beneath the volcanic island arcs and continental margins above active subduction zones. Note that the relative seismicity within each depth layer is shown along with the relevant area source zones.
Figure 7: ASIA-1 model shown for the various depth ranges E to I.
In the Southeast Asia region there are 19 individual deep zones modelled for depth range E, 15 for depth range F, 9 for depth range G, 5 for depth range H and 3 for the deepest depth range I. Some are more seismically active than others reflecting perhaps more ancient forms of subduction, with little activity in the current tectonic setting.
MAG
E F G
H I
Hydropower'15 Stavanger, Norway 15-16 June 2015
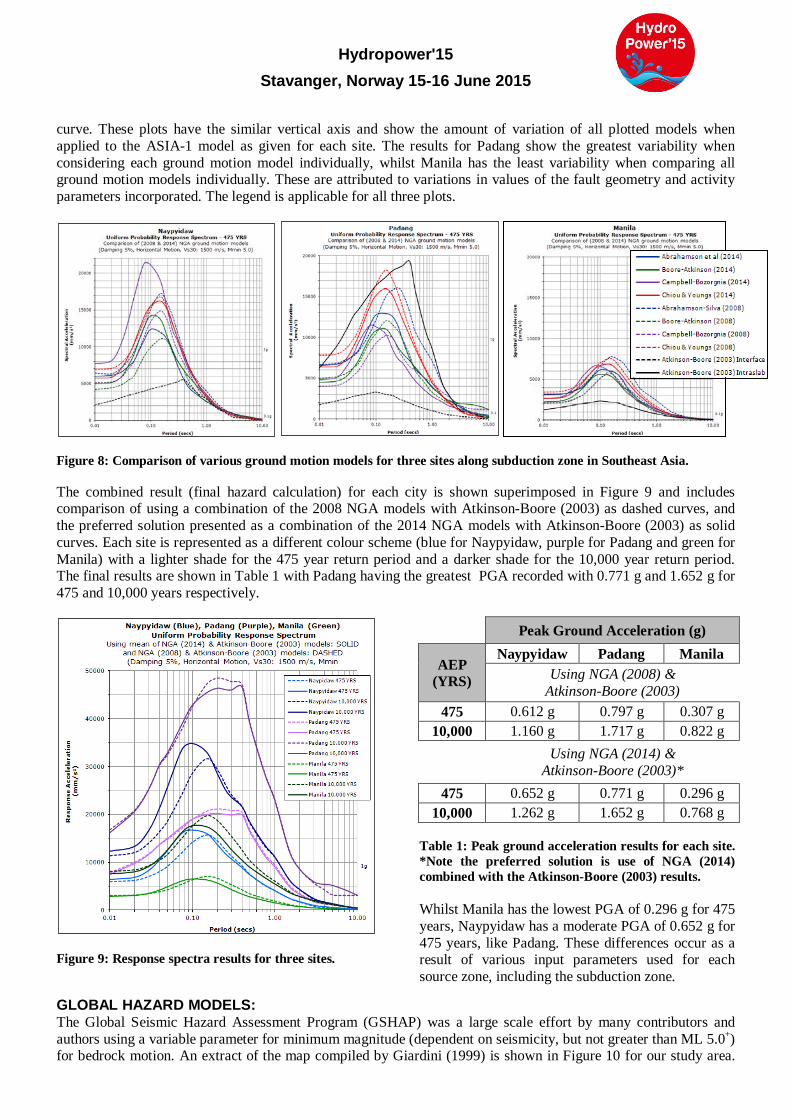
GROUND MOTION MODELS: Various ground motion models have been developed for use in PSHA studies and are intended to define specific regional conditions in recording ground motion from a fault rupturing and reducing in amplitude with distance from a given site. Earthquake ground motion can be measured as ground displacement, ground velocity or ground acceleration. A crude measure of the amplitude of the motion is the peak ground displacement, peak ground velocity (PGV) or peak ground acceleration (PGA). Ground motion models have been published for different geological and tectonic settings. At one extreme are stable continental shields (e.g. Canada, Australia) where cold, hard and/or old rocks transmit seismic waves without absorbing significant energy; whilst at the other extreme at active plate boundary regions (e.g. subduction zones) where hot, soft and/or young rocks absorb considerable seismic wave energy. Earthquake ground motion studies invariably require spectral analysis to examine the variation of ground motion with frequency (or its inverse, period). Two types of spectra commonly used are the Fourier spectrum and the response spectrum. In PSHA studies a Uniform Probability Response Spectra is used to account for the cumulative result from probabilities of all possible earthquakes, small and large, near and far, for a particular return period. In 2008 the Next Generation Attenuation (NGA) models were published. These are a new series of ground motion models, which were derived using more and better strong motion data. Due to these improvements they perform better than older functions at extremes, particularly earthquake size, distance and frequency motion. In 2014, an upgraded set of ground motion models were developed, the NGA-2 West models which include contributions from five key authors; Abrahamson et al, (2014) NGA-2 West, Boore et al, (2014) NGA-2 West, Campbell-Bozorgnia (2014) NGA-2 West and Idriss (2014) NGA-2 West. Strong motion data from subduction earthquakes are more difficult to obtain because there are limited sites that are close and on good quality bedrock. More consistent results will be developed in the future after data from the Chile 2010 Mw 8.8 and Honshu 2011 Mw 9.0 earthquakes are included, especially when local data become available. Currently the Atkinson-Boore (2003) worldwide subduction models are considered most suitable for the subduction zones within the Southeast Asia region. APPLICATION OF GROUND MOTION MODELS: In conducting a suitable PSHA study for any given site, the intended application of each ground motion model is considered. Generally, for sites within our study area it is appropriate to use a combined equal weighting of the first four NGA-2 West (2014) models for all crustal surface zones and a user based choice on either equal weighting or a selection of the Atkinson-Boore (2003) worldwide interface or intraslab subduction models for all deep zones. For example, when assigning a ground motion model for the trench itself, the Atkinson-Boore (2003) worldwide interface model is only used, as it accounts for the larger magnitude events on the planar face of the slab, greater than ML 7.5 and up to 200 kilometres distance. Whereas the Atkinson-Boore (2003) worldwide intraslab model is more appropriate when taking into account the whole slab within which more mid to large magnitude events occur, generally within ML 6.5 to 7.5 and up to 100 kilometres distance. CASE STUDIES: Three sites situated along the Andaman-Arakan-Java and Philippines Trenches are presented, that of Naypyidaw in Myanmar, Padang in Sumatra, Indonesia and Manila, in the Philippines. A selection of most suitable ground motion models were used for each site and calculated for peak ground acceleration (PGA) for both a return period of 475 years (10% chance of exceedance in 50 years) and 10,000 years (0.5% chance of exceedance in 50 years). All calculations are presented for bedrock (shear wave velocity or Vs30 value in top 30 metres of 1500 m/s) and considering earthquakes of Richter magnitude ML 5 and above only. The response spectra results are presented as a series of log-linear plots of period (seconds) versus the spectral acceleration (mm/s2). Figure 8 shows the variation in spectral response for each site when showing the spectral acceleration versus period for a number of suitable ground motion models as applied to each source zone. The (2008) NGA ground motion models are shown as dashed curves, whilst the preferred (2014) NGA ground motion models are represented by solid curves and are the same colour for each author. The subduction zone ground motion model of Atkinson-Boore (2003) is plotted in black with the intraslab model shown as a solid curve and the interface model as a dashed
Hydropower'15 Stavanger, Norway 15-16 June 2015
curve. These plots have the similar vertical axis and show the amount of variation of all plotted models when applied to the ASIA-1 model as given for each site. The results for Padang show the greatest variability when considering each ground motion model individually, whilst Manila has the least variability when comparing all ground motion models individually. These are attributed to variations in values of the fault geometry and activity parameters incorporated. The legend is applicable for all three plots.
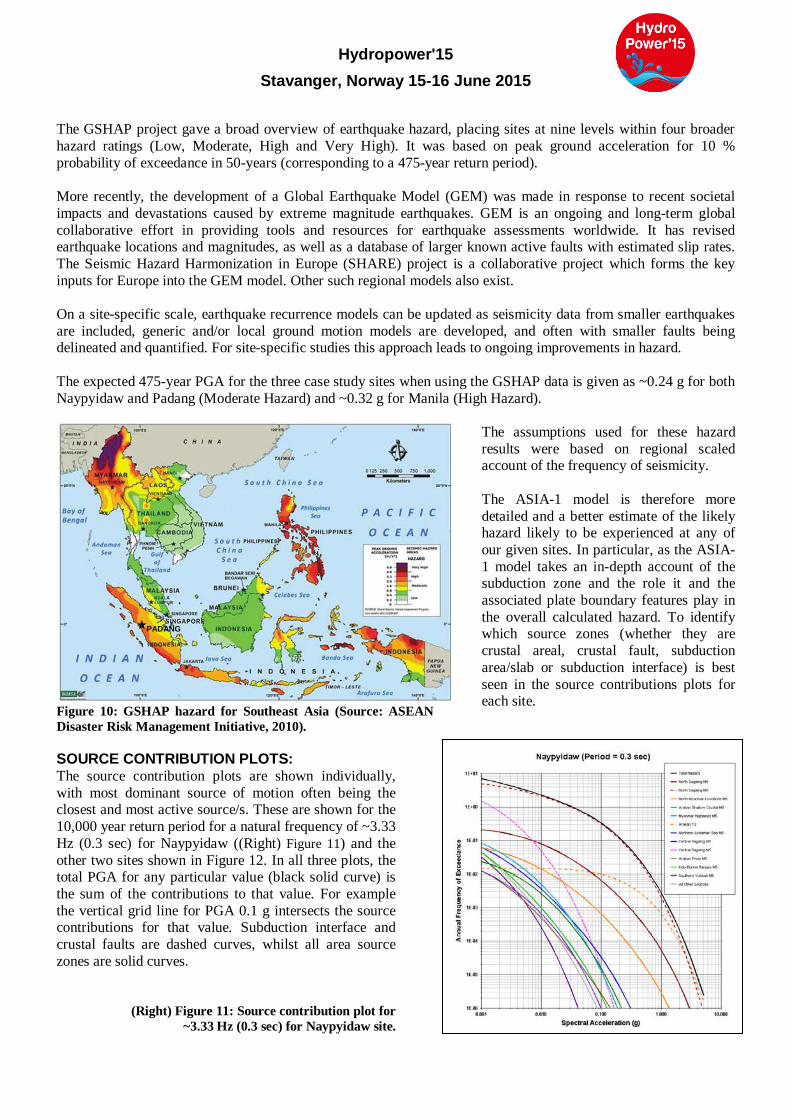
Figure 8: Comparison of various ground motion models for three sites along subduction zone in Southeast Asia. The combined result (final hazard calculation) for each city is shown superimposed in Figure 9 and includes comparison of using a combination of the 2008 NGA models with Atkinson-Boore (2003) as dashed curves, and the preferred solution presented as a combination of the 2014 NGA models with Atkinson-Boore (2003) as solid curves. Each site is represented as a different colour scheme (blue for Naypyidaw, purple for Padang and green for Manila) with a lighter shade for the 475 year return period and a darker shade for the 10,000 year return period. The final results are shown in Table 1 with Padang having the greatest PGA recorded with 0.771 g and 1.652 g for 475 and 10,000 years respectively.
Figure 9: Response spectra results for three sites. GLOBAL HAZARD MODELS:
Peak Ground Acceleration (g)
AEP (YRS)
Naypyidaw Padang Manila Using NGA (2008) &
Atkinson-Boore (2003) 475 0.612 g 0.797 g 0.307 g
10,000 1.160 g 1.717 g 0.822 g
Using NGA (2014) &
Atkinson-Boore (2003)* 475 0.652 g 0.771 g 0.296 g
10,000 1.262 g 1.652 g 0.768 g Table 1: Peak ground acceleration results for each site. *Note the preferred solution is use of NGA (2014) combined with the Atkinson-Boore (2003) results. Whilst Manila has the lowest PGA of 0.296 g for 475 years, Naypyidaw has a moderate PGA of 0.652 g for 475 years, like Padang. These differences occur as a result of various input parameters used for each source zone, including the subduction zone.
The Global Seismic Hazard Assessment Program (GSHAP) was a large scale effort by many contributors and authors using a variable parameter for minimum magnitude (dependent on seismicity, but not greater than ML 5.0+) for bedrock motion. An extract of the map compiled by Giardini (1999) is shown in Figure 10 for our study area.
Hydropower'15 Stavanger, Norway 15-16 June 2015
The GSHAP project gave a broad overview of earthquake hazard, placing sites at nine levels within four broader hazard ratings (Low, Moderate, High and Very High). It was based on peak ground acceleration for 10 % probability of exceedance in 50-years (corresponding to a 475-year return period). More recently, the development of a Global Earthquake Model (GEM) was made in response to recent societal impacts and devastations caused by extreme magnitude earthquakes. GEM is an ongoing and long-term global collaborative effort in providing tools and resources for earthquake assessments worldwide. It has revised earthquake locations and magnitudes, as well as a database of larger known active faults with estimated slip rates. The Seismic Hazard Harmonization in Europe (SHARE) project is a collaborative project which forms the key inputs for Europe into the GEM model. Other such regional models also exist. On a site-specific scale, earthquake recurrence models can be updated as seismicity data from smaller earthquakes are included, generic and/or local ground motion models are developed, and often with smaller faults being delineated and quantified. For site-specific studies this approach leads to ongoing improvements in hazard. The expected 475-year PGA for the three case study sites when using the GSHAP data is given as ~0.24 g for both Naypyidaw and Padang (Moderate Hazard) and ~0.32 g for Manila (High Hazard).
Figure 10: GSHAP hazard for Southeast Asia (Source: ASEAN Disaster Risk Management Initiative, 2010).
The assumptions used for these hazard results were based on regional scaled account of the frequency of seismicity. The ASIA-1 model is therefore more detailed and a better estimate of the likely hazard likely to be experienced at any of our given sites. In particular, as the ASIA-1 model takes an in-depth account of the subduction zone and the role it and the associated plate boundary features play in the overall calculated hazard. To identify which source zones (whether they are crustal areal, crustal fault, subduction area/slab or subduction interface) is best seen in the source contributions plots for each site.
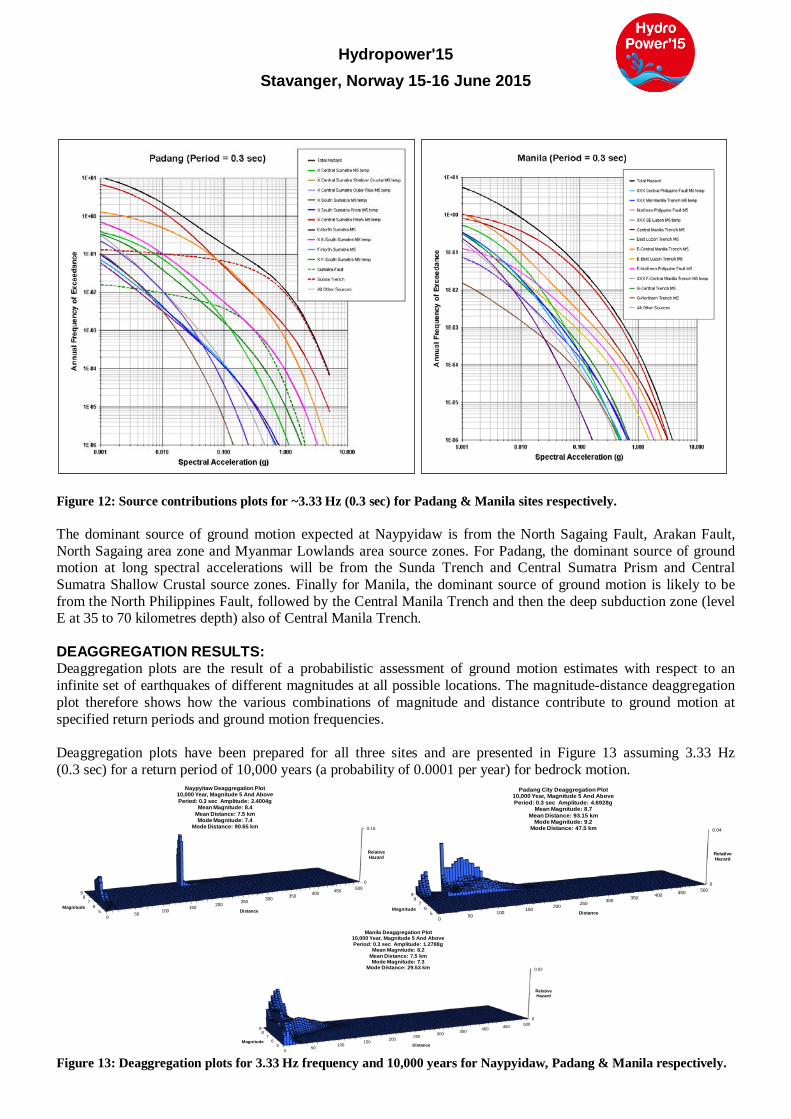
SOURCE CONTRIBUTION PLOTS: The source contribution plots are shown individually, with most dominant source of motion often being the closest and most active source/s. These are shown for the 10,000 year return period for a natural frequency of ~3.33 Hz (0.3 sec) for Naypyidaw ((Right) Figure 11) and the other two sites shown in Figure 12. In all three plots, the total PGA for any particular value (black solid curve) is the sum of the contributions to that value. For example the vertical grid line for PGA 0.1 g intersects the source contributions for that value. Subduction interface and crustal faults are dashed curves, whilst all area source zones are solid curves. (Right) Figure 11: Source contribution plot for
~3.33 Hz (0.3 sec) for Naypyidaw site.
PADANG
Hydropower'15 Stavanger, Norway 15-16 June 2015
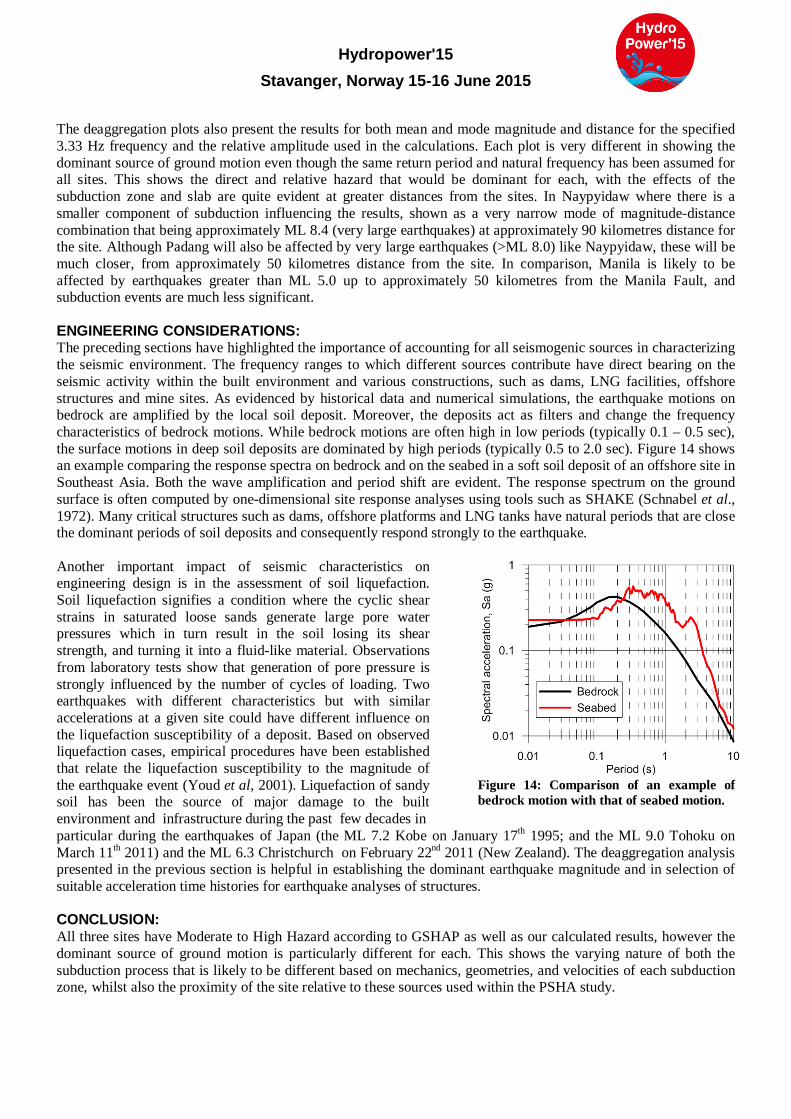
Figure 12: Source contributions plots for ~3.33 Hz (0.3 sec) for Padang & Manila sites respectively. The dominant source of ground motion expected at Naypyidaw is from the North Sagaing Fault, Arakan Fault, North Sagaing area zone and Myanmar Lowlands area source zones. For Padang, the dominant source of ground motion at long spectral accelerations will be from the Sunda Trench and Central Sumatra Prism and Central Sumatra Shallow Crustal source zones. Finally for Manila, the dominant source of ground motion is likely to be from the North Philippines Fault, followed by the Central Manila Trench and then the deep subduction zone (level E at 35 to 70 kilometres depth) also of Central Manila Trench. DEAGGREGATION RESULTS: Deaggregation plots are the result of a probabilistic assessment of ground motion estimates with respect to an infinite set of earthquakes of different magnitudes at all possible locations. The magnitude-distance deaggregation plot therefore shows how the various combinations of magnitude and distance contribute to ground motion at specified return periods and ground motion frequencies. Deaggregation plots have been prepared for all three sites and are presented in Figure 13 assuming 3.33 Hz (0.3 sec) for a return period of 10,000 years (a probability of 0.0001 per year) for bedrock motion.
Figure 13: Deaggregation plots for 3.33 Hz frequency and 10,000 years for Naypyidaw, Padang & Manila respectively.
56
78
9
0
0.15
050
100150
200 250 300 350 400 450 500
Magnitude
Relative Hazard
Distance
Naypyitaw Deaggregation Plot 10,000 Year, Magnitude 5 And AbovePeriod: 0.3 sec Amplitude: 2.4004g
Mean Magnitude: 8.4Mean Distance: 7.5 kmMode Magnitude: 7.4
Mode Distance: 90.65 km
56
78
9
0
0.04
050
100150
200 250 300 350 400 450 500
Magnitude
Relative Hazard
Distance
Padang City Deaggregation Plot 10,000 Year, Magnitude 5 And AbovePeriod: 0.3 sec Amplitude: 4.6928g
Mean Magnitude: 8.7Mean Distance: 93.15 km
Mode Magnitude: 9.2Mode Distance: 47.5 km
56
78
9
0
0.02
050
100150
200 250 300 350 400 450 500
Magnitude
Relative Hazard
Distance
Manila Deaggregation Plot 10,000 Year, Magnitude 5 And AbovePeriod: 0.3 sec Amplitude: 1.2788g
Mean Magnitude: 8.2Mean Distance: 7.5 kmMode Magnitude: 7.3
Mode Distance: 29.53 km
Hydropower'15 Stavanger, Norway 15-16 June 2015
The deaggregation plots also present the results for both mean and mode magnitude and distance for the specified 3.33 Hz frequency and the relative amplitude used in the calculations. Each plot is very different in showing the dominant source of ground motion even though the same return period and natural frequency has been assumed for all sites. This shows the direct and relative hazard that would be dominant for each, with the effects of the subduction zone and slab are quite evident at greater distances from the sites. In Naypyidaw where there is a smaller component of subduction influencing the results, shown as a very narrow mode of magnitude-distance combination that being approximately ML 8.4 (very large earthquakes) at approximately 90 kilometres distance for the site. Although Padang will also be affected by very large earthquakes (>ML 8.0) like Naypyidaw, these will be much closer, from approximately 50 kilometres distance from the site. In comparison, Manila is likely to be affected by earthquakes greater than ML 5.0 up to approximately 50 kilometres from the Manila Fault, and subduction events are much less significant. ENGINEERING CONSIDERATIONS: The preceding sections have highlighted the importance of accounting for all seismogenic sources in characterizing the seismic environment. The frequency ranges to which different sources contribute have direct bearing on the seismic activity within the built environment and various constructions, such as dams, LNG facilities, offshore structures and mine sites. As evidenced by historical data and numerical simulations, the earthquake motions on bedrock are amplified by the local soil deposit. Moreover, the deposits act as filters and change the frequency characteristics of bedrock motions. While bedrock motions are often high in low periods (typically 0.1 – 0.5 sec), the surface motions in deep soil deposits are dominated by high periods (typically 0.5 to 2.0 sec). Figure 14 shows an example comparing the response spectra on bedrock and on the seabed in a soft soil deposit of an offshore site in Southeast Asia. Both the wave amplification and period shift are evident. The response spectrum on the ground surface is often computed by one-dimensional site response analyses using tools such as SHAKE (Schnabel et al., 1972). Many critical structures such as dams, offshore platforms and LNG tanks have natural periods that are close the dominant periods of soil deposits and consequently respond strongly to the earthquake. Another important impact of seismic characteristics on engineering design is in the assessment of soil liquefaction. Soil liquefaction signifies a condition where the cyclic shear strains in saturated loose sands generate large pore water pressures which in turn result in the soil losing its shear strength, and turning it into a fluid-like material. Observations from laboratory tests show that generation of pore pressure is strongly influenced by the number of cycles of loading. Two earthquakes with different characteristics but with similar accelerations at a given site could have different influence on the liquefaction susceptibility of a deposit. Based on observed liquefaction cases, empirical procedures have been established that relate the liquefaction susceptibility to the magnitude of the earthquake event (Youd et al, 2001). Liquefaction of sandy soil has been the source of major damage to the built environment and infrastructure during the past few decades in
Figure 14: Comparison of an example of bedrock motion with that of seabed motion.
particular during the earthquakes of Japan (the ML 7.2 Kobe on January 17th 1995; and the ML 9.0 Tohoku on March 11th 2011) and the ML 6.3 Christchurch on February 22nd 2011 (New Zealand). The deaggregation analysis presented in the previous section is helpful in establishing the dominant earthquake magnitude and in selection of suitable acceleration time histories for earthquake analyses of structures. CONCLUSION: All three sites have Moderate to High Hazard according to GSHAP as well as our calculated results, however the dominant source of ground motion is particularly different for each. This shows the varying nature of both the subduction process that is likely to be different based on mechanics, geometries, and velocities of each subduction zone, whilst also the proximity of the site relative to these sources used within the PSHA study.
Hydropower'15 Stavanger, Norway 15-16 June 2015
ACKNOWLEDGEMENTS: The authors would like to thank Russell Cuthbertson (from the Seismology Research Centre) for comments on early revisions of this paper, as well as the production of maps using GMT software at short notice. An independent reviewer is also acknowledged for his time and efforts with productive comments that have improved this paper. REFERENCES: Abrahamson, N., W. Silva and R. Kamai, 2014. Summary of the ASK14
Ground Motion Relation for Active Crustal Regions. Earthquake Spectra. Vol 3(3): 1025-1055.
Atkinson, G.M. and D.M. Boore, 2003. Empirical Ground-Motion Relations for Subduction-Zone Earthquakes and their Application to Cascadia and other Regions. Bulletin of the Seismological Society of America. Vol 93(4): 1703-1729.
Bellier, O. and M. Sébrier, 1995. Is the slip rate variation on the Great Sumatran Fault accommodated by fore-arc stretching? Geophys Res Letters. Vol 22(5): 1996-1972.
Bertrand, G., C. Rangin, H. Maluski and H. Bellon, 2003. Diachronous cooling along the Mogok Metamorphic Belt (Shan scarp, Myanmar): The trace of the northward migration of the Indian syntaxis. J. Asian Earth Sci. Vol 19: 649-659.
Bird, P., 2003. An updated digital model of plate boundaries. Geochem. Geophys. Geosyst., Vol 4(3): 1027, doi:10.1029/2001GC000252, 2003.
Boore, D.M., J.P. Stewart, E. Seyhan and G.M. Atkinson. 2014. NGA-West2 Equations for Predicting PGA, PGV, and 5% Damped PSA for Shallow Crustal Earthquakes. Earthquake Spectra. Vol 30(3): 1057-1085.
Brown, A. and G. Gibson, 2004. A multi-tiered earthquake hazard model for Australia. Tectonophysics. Vol 390: 25-43.
Campbell, K.W. & Bozorgnia, Y. 2014. NGA-West2 Ground Motion Model for the Average Horizontal Components of PGA, PGV, and 5% Damped Linear Acceleration Response Spectra. Earthquake Spectra. Vol 30(3): 1087-1115.
Chiou, B.S.-J. & Youngs, R.R., 2008. Earthquake Spectra. Vol 24(1): 173-215.
Chiou, B.S.-J. and R.R. Youngs, 2013. Update of the Chiou and Youngs NGA Ground Motion Model for Average Horizontal Component of Peak Ground Motion and Response Spectra. Earthquake Spectra. Vol 30(3): 1117-1153.
Curray, J.R., 2005. Tectonics and history of the Andaman Sea region. J. Asian Earth Sci. Vol 25(1): 187-232.
Garcia-Castellanos, D., M. Torné and M. Fernàndez, 2000. Slab pull effects from a flexural analysis of the Tonga and Kermadec Trenches (Pacific Plate)". Geophys. J. Int. Vol 141: 479–485. Bibcode:2000GeoJI.141..479G. doi:10.1046/j.1365-246x.2000.00096.x
Geist, E., S. Kirby, S. Ross, P. Dartnell, 2009. Samoa disaster highlights danger of tsunamis generated from outer-rise earthquakes. Sound Waves Monthly Newsletter. Dec Issue, USGS. http://soundwaves.usgs.gov/2009/12/research.html
Giardini, D., 1999. The Global Seismic Hazard Assessment Program (GSHAP) – 1992/1999, Annali di Geofisica. Vol 42(6): 957-974, introduction to a special volume with 18 papers and 274 pages.
Gupta, S., 2010. Synthesis Report on Ten ASEAN Countries Disaster Risk Assessment. ASEAN Disaster Risk Management Initiative. http://www.unisdr.org/we/inform/publications/18872.
Hall, R., 1996. Reconstructing Cenozoic SE Asia, in Hall, R. and D. Blundell (eds), Tectonic evolution of Southeast Asia, Geol Soc of London Special Publication. Vol 106: 153-184.
Idriss I. M., 2014. An NGA-West2 Empirical Model for Estimating the Horizontal Spectral Values Generated by Shallow Crustal Earthquakes. Earthquake Spectra. Vol 30(3): 1155-1177.
Radha Krishna, M. and T.D. Sanu, 2000. Seismotectonics and rates of active crustal deformation in the Burmese arc and adjacent regions. J. Geodyn. Vol 30: 401-421.
Lallemand, S., A. Heuret and D. Boutelier, 2005. On the relationships between slab dip, back-arc stress, upper plate absolute motion, and crustal nature in subduction zones. Geochemistry Geophysics Geosystems. Vol 6(9): Q09006. Bibcode:2005GGG.....609006L. doi:10.1029/2005GC000917.
McCaffrey, R., 2008. The tectonic framework of the Sumatran subduction zone. Annual Rev Earth Planet Sci. Vol 2009: 345-366, DOI 10.1146/annurev.earth.031208.10021227.
Meyer, C. and W.P. Schellart, 2013. Three-dimensional dynamic models of subducting plate-overriding plate-upper mantle interaction. Journal of Gephysical Research: Solid Earth. Vol 118: 1-16, doi:10.1002/jgrb.50078,2013.
Natawidjaja, D. and W. Triyoso, 2007. The Sumatran Fault Zone – from source to hazard. Journal of Earthquake and Tsunami. Vol 1(1): 21-47.
Schnabel, P.B., Lysmer, J. and Seed, H.B., 1972. SHAKE a computer program for earthquake response analysis of horizontally layered sites. Report EERC 72-12. College of Engineering, University of California, Berkeley.
Sieh, K. and D. Natawidjaja, 2000. Neotectonics of the Sumatran fault, Indonesia, Journal of Geophysical Research. Vol 105(B12): 28295-28326.
Sukmono, S., M.T. Zen, L. Hendrajaya, W.G.A. Kadir, D. Santoso and J. Dubois, 1997. Fractal pattern of the Sumatra Fault seismicity and its possible application to earthquake prediction. BSSA. Vol 87(6): 1685-1690.
Vingy, C., A. Socquet, C. Rangin, N. Chamot-Rooke, M. Pubellier, M-N. Bouin, G. Bertrand and M. Becker, 2003. Present-day crustal deformation around Sagaing fault, Myanmar. J. Geophys. Res. Solid Earth. Vol 108(B11): 2533.
Wang, Q., P.Z. Zhang, J.T. Freymueller, R. Bilham, K.M. Larson, X. Lai, X.Z. You, Z.J. Niu, C. Wu, Y.X. Li, J.N. Liu, Z.Q. Yang and Q.Z. Chen, 2008. Present day crustal deformation in China constrained by global positioning system measurements. Science. Vol 294: 574-577.
Wegener, A., 1929. Die Entstehung der Kontinente und Ozeane (4 ed.). Braunschweig: Friedrich Vieweg & Sohn Akt. Ges. ISBN 3-443-01056-3.
Youd, T.L., Idriss, I.M., Andrus, R.D., Arango, I., Castro, G., Christian, J.T., Dobry, R., Liam Finn, W.D., Harder, L.F., Hynes, M.E., Ishihara, K., Koester, J.P., Liao, S.S.C., Marcuson III, W.F., Martin, G.R., Mitchell, J.K., Moriwaki, Y., Power, M.S., Robertson, P.K., Seed, R.B., and Stokoe II, K.H., 2001. Liquefaction Resistance of Soils. ASCE Journal of Geotechnical and Geoenvironmental Engineering. Vol 127(October): 817-833.