Embed Size (px)
Citation preview
Modelling Rotating Detonative Combustion Fueled by Partially
Pre-vaporized n-Heptane Sprays
Majie Zhao (赵马杰) and Huangwei Zhang (张黄伟)*
Department of Mechanical Engineering, National University of Singapore, 9 Engineering Drive 1,
Singapore 117576, Republic of Singapore
Abstract
Eulerian−Lagrangian simulations are conducted for two-dimensional Rotating Detonative Combustion
(RDC) fueled by partially prevaporized n-heptane sprays. The influences of droplet diameter and total
equivalence ratio on detonation combustion and droplet dynamics are studied. It is found that small n-
heptane droplets (e.g. 5 µm) are completely vaporized around the detonation wave, while intermediate
n-heptane droplets (e.g. 20 µm) are consumed in or behind the detonation wave, with the escaped ones
be continuously evaporated and deflagrated. The droplet distributions in the RDE combustor are
significantly affected by the droplet evaporation behaviors. Mixed premixed and non-premixed
combustion modes are seen in two-phase RDC. The detonated fuel fraction is high when the droplet
diameters are small or large, reaching its minimal value with diameter being 20 µm. The detonation
propagation speed decreases with increased droplet diameter and is almost constant when the diameter
is larger (> 30 µm). The velocity deficits are 2−18% compared to the respective gaseous cases. Moreover,
the propagation speed increases as the total equivalence ratio increases for the same droplet diameter. It
is also found that the detonation propagation speed and detonated fuel fraction are considerably affected
by the pre-vaporized gas equivalence ratio. The specific impulse first decreases for cases with initial
diameter less than 5 μm, then increases with droplet diameter between 5 μm and 20 μm, and finally
decreases with droplet diameter larger than 20 μm.
Keywords: Rotating detonation combustion, n-heptane spray, partial pre-vaporization, reactant mixing,
combustion mode, specific impulse
* Corresponding author. E-mail: [email protected]. Tel: +65 6516 2557.
1
1. Introduction
Rotating Detonation Engine (RDE), as one of the pressure-gain combustion technologies, has the
great potential to be commercialized. It has numerous advantages over other detonation engines (e.g.
pulse detonation engines), including compact configuration, high frequency, high specific power output,
and continuous existence of Rotating Detonation Waves (RDW’s) 1,2. In previous studies, gaseous fuels
are mainly tested, including hydrogen and simple hydrocarbons 1–5. However, a critical step towards
practical RDE applications is to use liquid fuels, due to their higher energy density and easier storage.
Early interests in liquid fuelled RDE’s date back to 1960s−70s 6, which was mainly motivated by
rocket propulsion technology development for space exploration. In recent years, they have been revived,
to develop pressure-gain combustion technology, and a series of laboratory-scale RDE experiments have
been successfully performed with various liquid fuels. For instance, Bykovskii et al. 5,7,8 achieved two-
phase Rotating Detonation Combustion (RDC) by liquid kerosene sprays. In their tests with an annular
cylindrical combustor (diameter 306 mm), the oxygen-enriched air is used as the oxidant to initiate the
detonation wave 5. More recently, hydrogen or syngas is added in their experiments with a larger
combustor (diameter 503 mm) using standard air and kerosene sprays 7,8. In this combustor, Rotating
Detonation Waves (RDW’s) cannot be initiated without gaseous hydrogen or syngas. They systematically
discussed the RDW propagation characteristics and propulsive performance of liquid kerosene fuelled
RDE’s 7,8, and found that stable RDW’s cannot be achieved without addition of more chemically reactive
reactant, like hydrogen or syngas.
In addition, Kindracki 9 investigated kerosene atomization characteristics in cold nitrogen flows by
changing nitrogen velocity and fuel injection pattern of a model detonation chamber. They found that
most of the droplets in their experiments have diameters of 20−40 µm, which can quickly evaporate and
form a combustible mixture in the chamber. Kindracki 10 used liquid kerosene and gaseous air to study
initiation and propagation of RDW’s. In his work, continuous propagation of detonation wave was
2
successfully achieved for a mixture of liquid kerosene and air with hydrogen addition, and velocity
deficits of 20−25% are observed. Furthermore, based on a rocket-type combustor, Xue et al. 11 used
liquid nitrogen TetrOxide (NTO) and liquid MonomethylHydrazine (MMH) as the propellants to study
the RDW propagation mode under different mass flow rates and outlet structures. In the experiments of
Xue et al. 11, the feasibility of RDE’s with liquid hypergolic propellants was demonstrated and it was also
found that two combustion patterns, i.e. single-wave mode and counter-rotating double-wave mode, were
observed for the sustained RDWs.
The foregoing experimental studies have provided significant scientific insights about the two-phase
RDC. However, detailed information about detonation and flow fields (e.g. droplet evaporation and fuel
detonation) inside the channel are difficult to be measured. Alternatively, numerical simulation based on
fully compressible reacting two-phase flows is a promising method to understand fundamental physics
and assisting practical design and optimization of liquid fuelled RDE’s. For instance, based on
Eulerian− Lagrangian method, uun and Ma 12 used octane and air as the reactants to numerically
investigate the effects of air total temperature and fuel inlet spacing on the two-phase RDW. They found
that increasing the fuel inlet spacing results in reduction of RDW propagation speed. They also observed
that increasing air total temperature would increase the fuel inlet spacing limit for stable RDC. Moreover,
Hayashi et al. 13 used Eulerian−Eulerian method to simulate the JP-10/air RDE’s with different droplet
sizes (i.e. 1−10 m) and pre-evaporation factors (i.e. 0−100%). From their results, high liquid droplet
densities are found along the contact surface between the fresh and burned gas. They also observed that
the non-reactive fuel pockets behind the detonation wave and highlighted the possible detonation
quenching mechanisms caused by the interactions between the detonation front and fuel droplets.
In this work, we aim to investigate the influences of liquid n-heptane properties (e.g. droplet
diameter and pre-vaporization) on rotating detonation combustion and sprayed droplet evolutions in a
modelled rotating detonation combsutor. The effects of initial droplet diameter and pre-vaporized gas
3
equivalence ratio on detonation propagation speed, detonated fuel fraction in two-phase RDEs and its
relevance to droplet properties, and the distributions of droplet diameter along the RDE chamber height
will be discussed in detail. These have not been explored in the previous work (e.g. Ref. 5,7,8,12,13) but are
of great importance for utilization of liquid fuels in detonation propulsion innovations. Two-dimensional
unrolled RDC model is used and the liquid fuel is injected into the chamber with a lean pre-vaprozied n-
heptane / air mixture. The manuscript is organized as below. In uection 2 the computational method and
the physical model are introduced. Results are presented in uection 3 and conclusions are made in uection
4.
2. Mathematical and physical models
2.1 Governing equation
In the present investigations, Eulerian–Lagrangian method is adopted to study the two-phase
rotating detonation combustion. For the gas phase, the governing equations of continuity, momentum,
energy and species mass fraction, together with the ideal gas equation of state, are solved 14. They
respectively read
𝜕𝜌
𝜕𝑡+ ∇ ∙ [𝜌𝐮] = 𝑆𝑚, (1)
𝜕(𝜌𝐮)
𝜕𝑡+ ∇ ∙ [𝐮(𝜌𝐮)] + ∇𝑝 + ∇ ∙ 𝐓 = 𝐒𝑭, (2)
𝜕(𝜌𝑬)
𝜕𝑡+ ∇ ∙ [𝐮(𝜌𝑬)] + ∇ ∙ [𝐮𝑝] + ∇ ∙ [𝐓 ∙ 𝐮] + ∇ ∙ 𝐪 = �̇�𝑇 + 𝑆𝑒, (3)
𝜕(𝜌𝑌𝑚)
𝜕𝑡+ ∇ ∙ [𝐮(𝜌𝑌𝑚)] + ∇ ∙ 𝐬𝐦 = �̇�𝑚 + 𝑆𝑌𝑚 , (𝑚 = 1,…𝑀 − 1), (4)
𝑝 = 𝜌𝑅𝑇. (5)
Here t is time, ∇ ∙ (∙) is divergence operator. 𝜌 is the density, 𝐮 is the velocity vector, 𝑇 is gas
temperature, and 𝑝 is the pressure which is updated from the equation of state, i.e. Eq. (5). 𝑌𝑚 is the
mass fraction of m-th species, 𝑀 is the total species number. Only (𝑀 − 1) equations are solved in Eq.
4
(4) and the mass fraction of the inert species (e.g. nitrogen) can be calculated from ∑ 𝑌𝑚 = 1𝑀𝑚=1 . 𝑬 is
the total energy, defined as 𝑬 ≡ 𝑒 + |𝐮|2 2⁄ with e being the specific internal energy. R in Eq. (5) is the
specific gas constant and is calculated from 𝑅 = 𝑅𝑢 ∑ 𝑌𝑚𝑀𝑚=1 𝑀𝑊𝑚
−1. 𝑀𝑊𝑚 is the molar weight of m-
th species and 𝑅𝑢 = 8.314 J/(mol∙K) is the universal gas constant. The source terms in Eqs. (1) - (4),
i.e. 𝑆𝑚 , 𝐒𝑭 , 𝑆𝑒 and 𝑆𝑌𝑚 , account for the exchanges of mass, momentum, energy and species. Their
expressions are given in Eqs. (12) - (15).
The viscous stress tensor 𝐓 in Eq. (2) modelled by
𝐓 = −2𝜇dev(𝐃). (6)
Here 𝜇 is the dynamic viscosity and is dependent on gas temperature following the uutherland’s law 15.
Moreover, 𝐃 ≡ [𝛁𝐮 + (𝛁𝐮)𝑻] 𝟐⁄ is the deformation gradient tensor and its deviatoric component in Eq.
(6), i.e. dev(𝐃), is defined as dev(𝐃) ≡ 𝐃 − tr(𝐃)𝐈 𝟑⁄ with 𝐈 being the unit tensor.
In addition, 𝐣 in Eq. (3) is the diffusive heat flux and can be represented by Fourier’s law, i.e.
𝐣 = −𝑘∇𝑇. (7)
Thermal conductivity k is calculated using the Eucken approximation 16, i.e. 𝑘 = 𝜇𝐶𝑣(1.32 +
1.37 ∙ 𝑅 𝐶𝑣⁄ ), where 𝐶𝑣 is the heat capacity at constant volume and derived from 𝐶𝑣 = 𝐶𝑝 − 𝑅. Here
𝐶𝑝 = ∑ 𝑌𝑚𝐶𝑝,𝑚𝑀𝑚=1 is the heat capacity at constant pressure, and 𝐶𝑝,𝑚 is the heat capacity at constant
pressure of m-th species, which is estimated from JANAF polynomials 17.
In Eq. (4), 𝐬𝐦 = −𝐷𝑚∇(𝜌𝑌𝑚) is the species mass flux. The mass diffusivity 𝐷𝑚 can be derived
from heat diffusivity 𝛼 = 𝑘/𝜌𝐶𝑝 through 𝐷𝑚 = 𝛼/𝐿𝑒𝑚 . With unity Lewis number assumption (i.e.
𝐿𝑒𝑚 = 1 ), the mass diffusivity 𝐷𝑚 is calculated through 𝐷𝑚 = 𝑘 𝜌𝐶𝑝⁄ . Moreover, �̇�𝑚 is the
production or consumption rate of m-th species by all N reactions, and can be calculated from the reaction
rate of each reaction 𝜔𝑚,𝑗𝑜 , i.e.
�̇�𝑚 = 𝑀𝑊𝑚 ∑ 𝜔𝑚,𝑗𝑜𝑁
𝑗=1 . (8)

5
Also, the term �̇�𝑇 in Eq. (3) accounts for the heat release from chemical reactions and is estimated as
�̇�𝑇 = −∑ �̇�𝑚∆ℎ𝑓,𝑚𝑜𝑀
𝑚=1 . Here ∆ℎ𝑓,𝑚𝑜 is the formation enthalpy of m-th species.
The liquid phase is modeled as a spray of spherical droplets tracked by Lagrangian method 18. The
inter-droplet interactions are neglected since dilute sprays (volume fraction < 0.001 19) are considered.
Also, the shock-induced break-up is not considered in our studies, and its effects on RDC will be assessed
in uection 3.6.3. The equations of mass, momentum and energy for the liquid phase respectively read 19
𝑑𝑚𝑑
𝑑𝑡= −�̇�𝑑 , (8)
𝑑𝐮𝑑
𝑑𝑡=
𝐅𝑑
𝑚𝑑, (9)
𝑐𝑝,𝑑𝑑𝑇𝑑
𝑑𝑡=
�̇�𝑐+�̇�𝑙𝑎𝑡
𝑚𝑑. (10)
Here md=𝜋𝜌𝑑𝑑3 6⁄ is the mass of a single droplet, where ρd and d are the droplet density and diameter,
respectively. 𝐮𝑑 is the droplet velocity vector, cp,d is the droplet heat capacity, and Td is the droplet
temperature. Infinite thermal conductivity of the droplet is assumed since small droplets are investigated.
The evaporation rate, ṁd, in Eq. (8) is calculated with Abramzon and uirignano model 20
�̇�𝑑 = 𝜋𝑑𝜌𝑓𝐷𝑓𝑆ℎ̃𝑙𝑛(1 + 𝐵𝑀), (11)
where 𝜌𝑓 = 𝑝𝑆𝑀𝑊𝑚/𝑅𝑇𝑆 and 𝐷𝑓 = 3.6059 × 10⁻³ ∙ (1.8𝑇𝑠)1.75 ∙
𝛼
𝑝𝑠𝛽 are the density and mass
diffusivity at the film 20, respectively. 𝛼 and 𝛽 are the constants related to specific species 21. 𝑝𝑆 = 𝑝 ∙
𝑒𝑥𝑝 (𝑐1 +𝑐2
𝑇𝑠+ 𝑐3𝑙𝑛𝑇𝑠 + 𝑐4𝑇𝑠
𝑐5) is the surface vapor pressure, with 𝑇𝑆 = (𝑇 + 2𝑇𝑑)/3 being the
droplet surface temperature. The parameters ci are constants and can be found from Ref. 22.
The modified uherwood number 𝑆ℎ̃ in Eq. (11) is calculated as 𝑆ℎ̃ = 2 + [(1 +
𝑅𝑒𝑑𝑆𝑐)1/3max (1, 𝑅𝑒𝑑)
0.077 − 1]/𝐹(𝐵𝑀) , with the uchmidt number being Sc = 1.0. 𝐹(𝜗) =
(1 + 𝜗)0.7 ln(1 + 𝜗) /𝜗 is introduced to consider the variation of the film thickness due to utefan flow
effects 20. Here 𝜗 represents the upalding mass transfer number 𝐵𝑀 = (𝑌𝐹𝑠 − 𝑌𝐹∞)/(1 − 𝑌𝐹𝑠). 𝑌𝐹𝑠 =

6
𝑀𝑊𝑑𝑋𝑠
𝑀𝑊𝑑𝑋𝑠+𝑀𝑊𝑒𝑑(1−𝑋𝑠) and 𝑌𝐹∞ are the fuel vapor mass fractions at the droplet surface and gas phase,
respectively. 𝑀𝑊𝑑 is the molecular weight of the vapor, 𝑀𝑊𝑒𝑑 is the averaged molecular weight of
the mixture excluding the fuel vapor, and 𝑋𝑆 = 𝑋𝑚𝑝𝑠𝑎𝑡
𝑝 is the mole fraction of the vapor at the droplet
surface. Here 𝑝𝑠𝑎𝑡 is the saturated pressure and is a function of droplet temperature 𝑇𝑑 based on
Raoult's Law 23, i.e. 𝑝𝑠𝑎𝑡 = 𝑝 ∙ 𝑒𝑥𝑝 (𝑐1 +𝑐2
𝑇𝑑+ 𝑐3𝑙𝑛𝑇𝑑 + 𝑐4𝑇𝑑
𝑐5).
Only the utokes drag is included in Eq. (9), which is modelled as 𝐅𝑑 =18𝜇
𝜌𝑑𝑑2
𝐶𝑑𝑅𝑒𝑑
24𝑚𝑑(𝐮 − 𝐮𝑑)
24. 𝐶𝑑 is the drag coefficient and estimated using the uchiller and Naumann model 25, and 𝑅𝑒𝑑 ≡
𝜌𝑑𝑑|𝐮𝑑−𝐮|
𝜇 is the droplet Reynolds number.
In Eq. (10), �̇�𝑐 = ℎ𝑐𝐴𝑑(𝑇𝑔 − 𝑇𝑑) denotes the convective heat transfer between gas and liquid
phases. Here Ad is surface area of a single droplet. hc is the convective heat transfer coefficient, and
estimated using the correlation of Ranz and Marshall 26 through the modified Nusselt number, i.e. 𝑁�̃� =
2 + [(1 + 𝑅𝑒𝑑𝑃𝑟)1/3max (1, 𝑅𝑒𝑑)
0.077 − 1]/𝐹(𝐵𝑇) , where Pr is the gas Prandtl number. 𝐵𝑇 is the
upalding heat transfer number 20. Furthermore, �̇�𝑙𝑎𝑡 = −�̇�𝑑ℎ(𝑇𝑑) in Eq. (3) accounts for the heat
transfer caused by the latent heat of evaporation, where h(Td) is the vapor enthalpy at the droplet
temperature Td.
Two-way coupling between gas and liquid phases are considered, in terms of mass, momentum,
energy and species exchanges. Therefore, the source terms for the gas phase equations read (Vc is cell
volume and Nd is the droplet number in a CFD cell)
𝑆𝑚 =1
𝑉𝑐∑ �̇�𝑑𝑁𝑑1 , (12)
𝐒𝑭 = −1
𝑉𝑐∑ (−�̇�𝑑𝐮𝑑 +𝐅𝑑),𝑁𝑑1 (13)
𝑆𝑒 = −1
𝑉𝑐∑ (�̇�𝑐 + �̇�𝑙𝑎𝑡),𝑁𝑑1 (14)
7
𝑆𝑌𝑚 = {𝑆𝑚 for the liquid fuel species,0 for other species,
(15)
where −�̇�𝑑𝐮𝑑 in Eq. (13) is the momentum transfer due to droplet evaporation.
2.2 Physical model
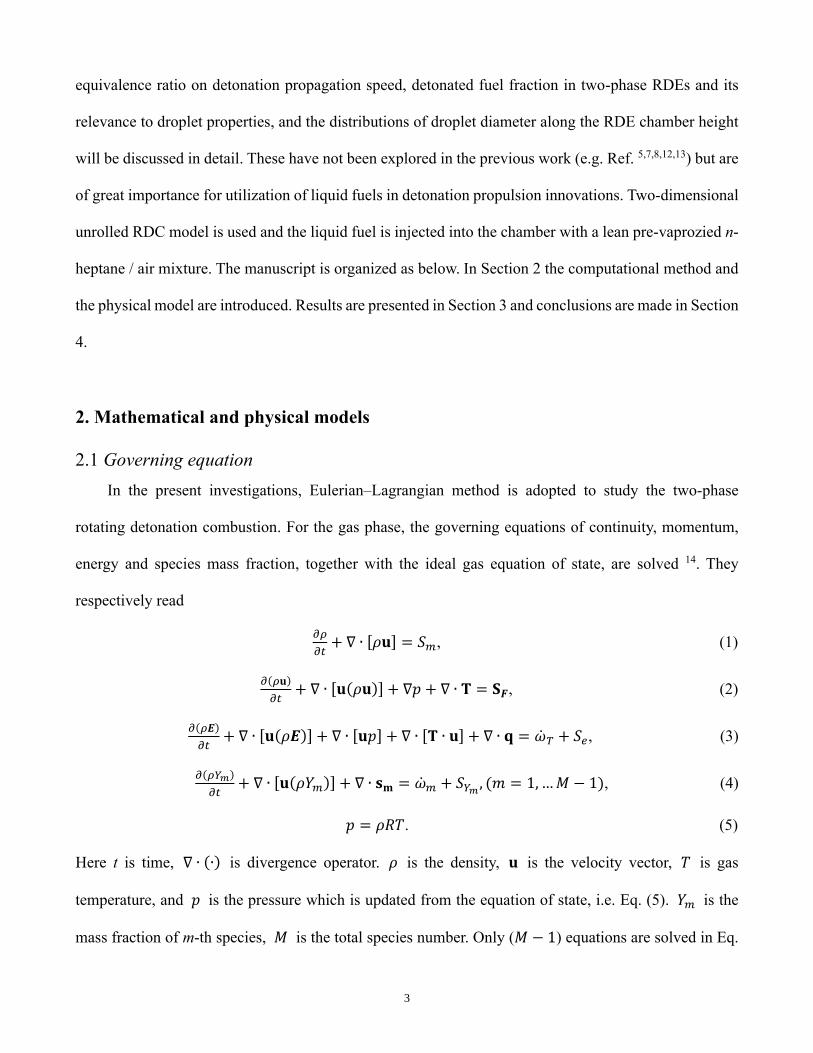
Figure 1 shows a two-dimensional (2D) rectangular domain, to mimic an annular RDE combustor.
The soundness of 2D RDE modelling has been confirmed by numerous previous work (e.g. 14,27,28). The
length (x-direction) of the domain is 280 mm (the equivalent diameter is around 90 mm), whereas the
height (y-direction) is 100 mm. These scales have been used in our previous modelling 14,28, and
successful RDC is achieved. They are also comparable to those of laboratory-scale RDE combustors 29.
Fig. 1. Computational domain and boundary condition in two-dimensional RDE with n-heptane
sprays. Background contour: gas temperature (200-3,000 K) of Case 2a (see details in uection 2.2).
The red zone with high pressure and temperature is used for RDW initiation at t = 0.
The boundary conditions are marked in Fig. 1. The outlet is assumed to be non-reflective. Periodic
boundaries at the left and right sides are enforced, such that the RDW can continuously propagate inside
Wall Wall WallInlet Inlet Inlet
Deflagration surfaceDetonation wave
Oblique shock wave
Gas and
droplets
Region with
high T and pP
erio
dic
Bo
un
dary
Perio
dic
Bo
un
dary
Fuel refill zone
Slip line
Outlet
8
the domain. The mono-sized liquid n-heptane droplets are injected into the domain through 56 discrete
inlets at the top head as schematically shown in Fig. 1. The initial temperature and density of the droplet
are 300 K and 680 kg/m3, respectively. They are carried by a premixture of air and n-heptane vapour,
which is used to model the droplet partial pre-vaporization occurring in the upstream manifold before
they enter the combustor. In the practical liquid fueled RDE experiments 3,10, it has been shown that
some level of partial pre-vaporization is desirable to increase the detonability of the liquid propellant.
The wall surfaces between the discrete spray injectors (see Fig. 1) are assumed to be non-slip,
impermeable and adiabatic. Here following our previous work 30, the area ratio (in 2D case, length ratio)
of the injector and wall is fixed to be 2:3. Although variation in area ratio may result in different RDC
behaviors (e.g. specific impulse, total pressure loss and velocity deficit) 31, these effects are not studied
here.
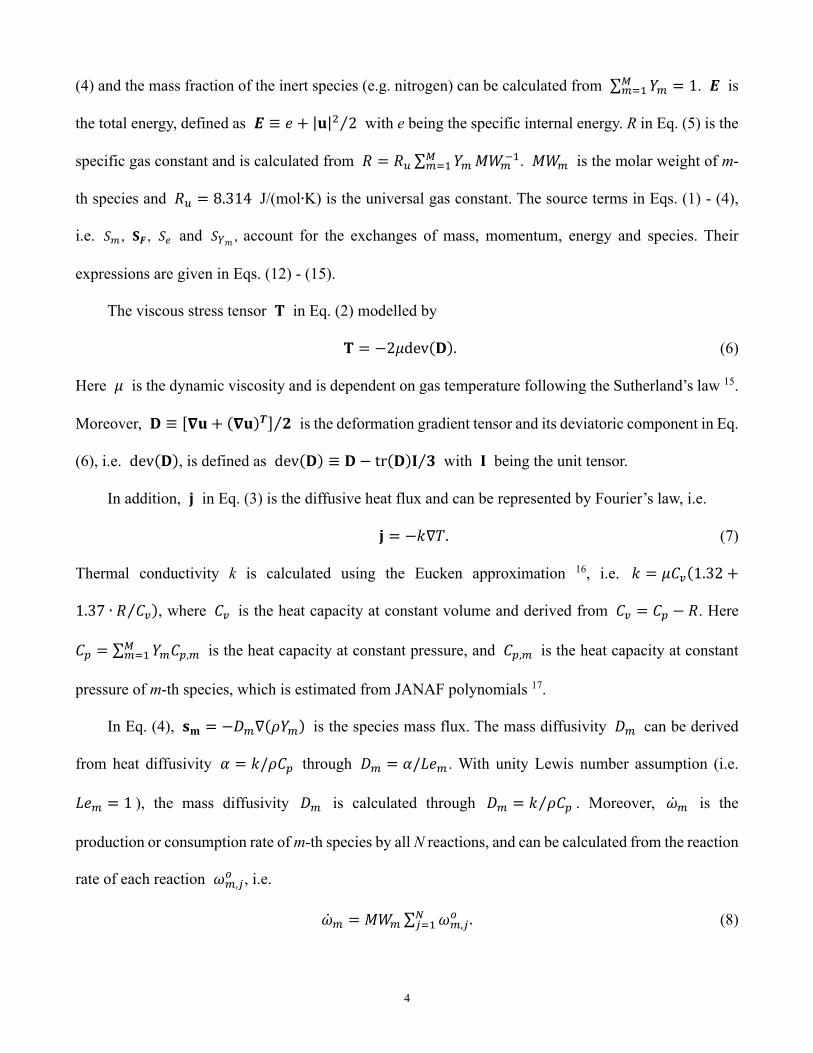
Table 1. Liquid fuel spray information.
Case
group
Total equivalence
ratio
𝜙𝑡
Equivalence ratio of
droplets
𝜙𝑙
Initial
droplet diameter
d0 (µm)
Initial volume
fraction
α
1 0.8 0.2
2, 5, 10, 20, 30,
50 and 80
0.00014
2 1.0 0.4 0.00028
3 1.5 0.9 0.00064
4 2.0 1.4 0.00099
Four case groups parameterized by total equivalence ratio, 𝜙𝑡 = 𝜙𝑔 + 𝜙𝑙, are considered, as listed
in Table 1. Here 𝜙𝑙 and 𝜙𝑔 are the equivalence ratios of liquid phase and pre-vaporized premixed gas
phase, respectively. Here 𝜙𝑙 is defined as the mass ratio of the droplets to the oxidizer normalized by
9
the mass ratio of n-C7H16 vapor to air under stoichiometric condition. Unless otherwise stated (in Figs.
8 and 10), the equivalence ratio of the pre-vaporized premixed gas is fixed to be 𝜙𝑔 = 0.6, whilst the
liquid equivalence ratio 𝜙𝑙 varies from 0.2 to 1.4 in Cases 1−4, corresponding to 𝜙𝑡 = 0.8−2.0. In
each group, various initial diameters d0 of mono-dispersed droplets are considered, ranging from 2 to 80
µm. Five cases from Group 2 (i.e. 𝜙𝑡 = 1.0) with d0 = 5, 10, 20, 50 and 80 µm will be studied in detail
in uection 3. Hereafter, they are termed as Case 2a, 2b, 2c, 2d and 2e, respectively. The number of
droplets in the whole computational domain ranges from about 40,000 to 290,000 in these cases, and the
volume fractions α of the injected liquid sprays are below 0.001 (see Table 1), confirming the dilute
characteristics of the sprays.
2.3 Numerical implementation
Both gas and liquid phase equations in uection 2.1 are solved by a multi-component, two-phase,
and reactive solver, RYrhoCentralFoam 32, with two-way interphase coupling in terms of mass,
momentum, energy and species (i.e. Eqs. 12-15). For gas phase, it has been validated and successfully
used for gaseous supersonic flows and detonative combustion problems 30,33–35. For liquid phase, detailed
validations and verifications of the solver and sub-models are performed in our recent work 36.
uatisfactory accuracies are achieved in predicting shock wave, detonation propagation speed, and
detonation cell size. More information about the numerical schemes and solution strategies can be found
in Refs. 14,36,37.
For gas phase equations (Eqs. 1-4), a second-order implicit backward method is employed for
temporal discretization and the time step is on the order of 10-9 s (maximum Courant number ≤ 0.1).
uecond-order Godunov-type upwind-central KNP scheme 38 is used for discretizing the convective terms
in momentum equation, i.e. Eq. (2). To ensure the numerical stability, van Leer limiter 39 is adopted for
correct flux calculations with KNP scheme. The TVD scheme is used for discretizing the convective
10
terms in the energy and species mass fraction equations along with a second-order central differencing
scheme for the diffusion terms. Computational cost associated with the latter is minimized by an efficient
Operator uplitting (Ou) method for both momentum and energy equations. In the first fractional step, an
explicit predictor equation is solved for the convection of conserved variables (i.e. 𝜌𝐮 and 𝜌𝑬), and in
the second fractional step, an implicit corrector equation is solved for the diffusion transport for primitive
variables (i.e. 𝐮 and 𝑬).
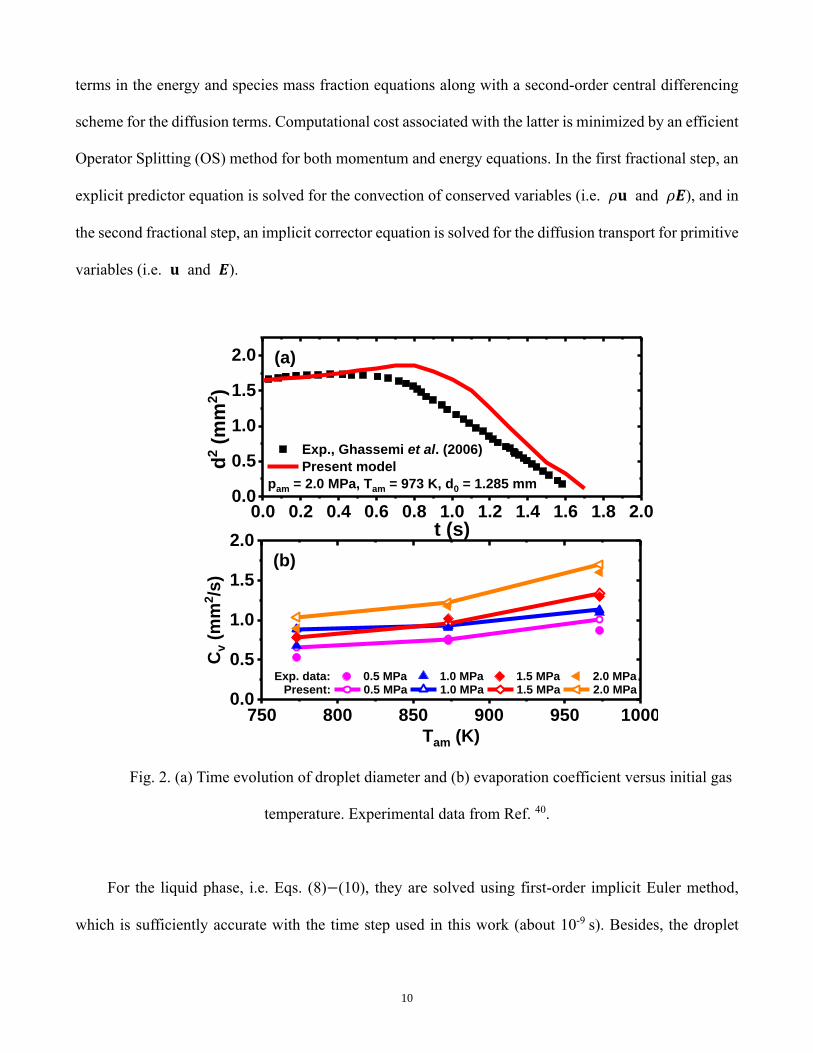
Fig. 2. (a) Time evolution of droplet diameter and (b) evaporation coefficient versus initial gas
temperature. Experimental data from Ref. 40.
For the liquid phase, i.e. Eqs. (8)−(10), they are solved using first-order implicit Euler method,
which is sufficiently accurate with the time step used in this work (about 10-9 s). Besides, the droplet
750 800 850 900 950 10000.0
0.5
1.0
1.5
2.0
Cv (
mm
2/s
)
Tam (K)
Exp. data: 0.5 MPa 1.0 MPa 1.5 MPa 2.0 MPa Present: 0.5 MPa 1.0 MPa 1.5 MPa 2.0 MPa
(b)
0.0 0.2 0.4 0.6 0.8 1.0 1.2 1.4 1.6 1.8 2.00.0
0.5
1.0
1.5
2.0
d2 (
mm
2)
t (s)
Exp., Ghassemi et al. (2006)
Present model
pam = 2.0 MPa, Tam = 973 K, d0 = 1.285 mm
(a)

11
evaporation model by Abramzon and uirignano 20 in the RYrhoCentralFoam solver, which estimates the
mass transfer in Eq. (8), is validated here. Figure 2 compares the diameter evolution against the measured
data of single droplet (initial diameter d0 = 1.285 mm) evaporation under high ambient temperature (973
K) and pressure (2.0 MPa) 40. From Fig. 2(a), one can see that the evaporation model well reproduces the
change of the droplet diameter. The duration of initial expansion, caused by the heat conduction from the
surrounding gas, is slightly over-predicted. The evaporation coefficient (𝐶𝑉 , slope of 𝑑2~𝑡 curve)
corresponding to the steady evaporation (> 1.2 s) is reasonably predicted, i.e. 1.68, which is close to the
measured value 1.60. The evaporation coefficients over a range of RDC relevant operating conditions
(i.e. elevated pressures and temperatures) are further compared in Fig. 2(b) and the results demonstrate
that the errors for the predicted 𝐶𝑉 are generally less than 15%. Note that extra heat conduction from
the droplet holder and radiation existing in the experiments are not considered in the simulations, which
may result in the foregoing deviations. Detailed discussion on the sensitivity of the simulated diameter
decaying rate of single droplet to various factors are made in Ref. 33. Validations of the same model 20
under spray detonation conditions are also available in Ref. 41. In general, one can confirm that the
accuracy of this evaporation model is reasonable in predicting droplet evaporation under detonated flow
conditions.
The domain in Fig. 1 is discretized with 352,800 Cartesian cells. The cell size in the x-direction
(RDW propagation direction) is uniform at 0.2 mm, whereas it increases from 0.1 mm at the top head
(where the RDW resides) to 1 mm at the outlet in the y-direction. The above resolution is larger than the
considered droplet diameters, which can ensure that the gas phase quantities near the droplet surfaces
(critical for estimating the two-phase coupling, e.g. evaporation) can be well approximated using the
interpolated ones at the location of the sub-grid droplet 41. The mesh sensitivity will be analyzed in
uection 3.6.1.
One-step reaction of 5 species (n-C7H16, O2, CO2, H2O and N2) 42 is used for n-heptane detonation.
12
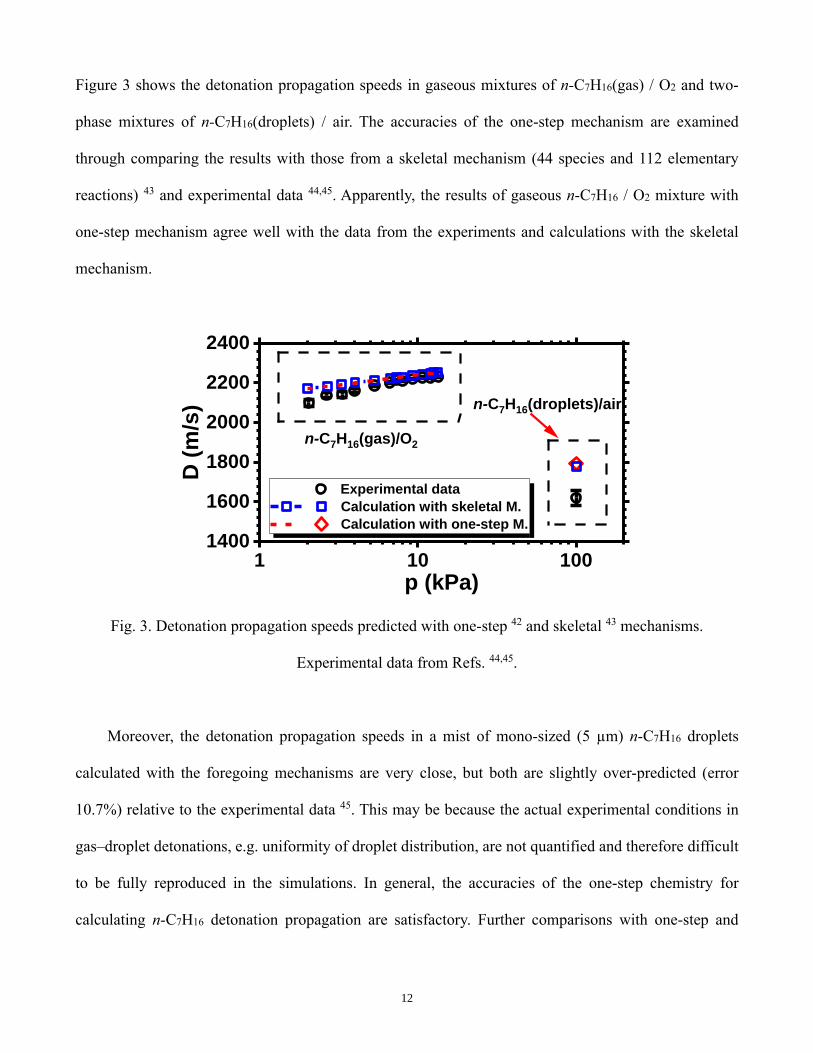
Figure 3 shows the detonation propagation speeds in gaseous mixtures of n-C7H16(gas) / O2 and two-
phase mixtures of n-C7H16(droplets) / air. The accuracies of the one-step mechanism are examined
through comparing the results with those from a skeletal mechanism (44 species and 112 elementary
reactions) 43 and experimental data 44,45. Apparently, the results of gaseous n-C7H16 / O2 mixture with
one-step mechanism agree well with the data from the experiments and calculations with the skeletal
mechanism.
Fig. 3. Detonation propagation speeds predicted with one-step 42 and skeletal 43 mechanisms.
Experimental data from Refs. 44,45.
Moreover, the detonation propagation speeds in a mist of mono-sized (5 µm) n-C7H16 droplets
calculated with the foregoing mechanisms are very close, but both are slightly over-predicted (error
10.7%) relative to the experimental data 45. This may be because the actual experimental conditions in
gas–droplet detonations, e.g. uniformity of droplet distribution, are not quantified and therefore difficult
to be fully reproduced in the simulations. In general, the accuracies of the one-step chemistry for
calculating n-C7H16 detonation propagation are satisfactory. Further comparisons with one-step and
1 10 1001400
1600
1800
2000
2200
2400
D (
m/s
)
p (kPa)
Experimental data
Calculation with skeletal M.
Calculation with one-step M.
n-C7H16(gas)/O2
n-C7H16(droplets)/air
13
skeletal mechanisms in 2D RDC are also made later in uection 3.6.2, including detonation propagation
speed, detonated fuel fraction and mean droplet diameters.
In our simulations, a rectangular region (280 mm × 12 mm) near the inlets are initially patched with
stoichiometric n-heptane / air mixture, whilst the rest domain is filled with air. At the left end, a
rectangular hot pocket (1 mm × 12 mm, see red zone in Fig. 1) with high temperature (2,000 K) and
pressure (40 atm) is used to ignite the detonation wave. In this study, the total temperature 𝑇𝑜 and total
pressure 𝑃𝑜 of the injected fuels are fixed to be 300 K and 10 atm, respectively. The inlet pressure,
temperature and velocity in the flow field are modelled based on the isentropic expansion relations
between the top head pressure and total pressure 46,47. Therefore, spray injection is activated if, and only
if, the top head gas pressure is lower than the total pressure when the carrier gas (i.e. premixed n-
C7H16/air gas) is active. Moreover, the interphase kinetic equilibrium is assumed because small droplets
are considered 19, and hence the droplet injection velocity is equal to that of the carrier gas.
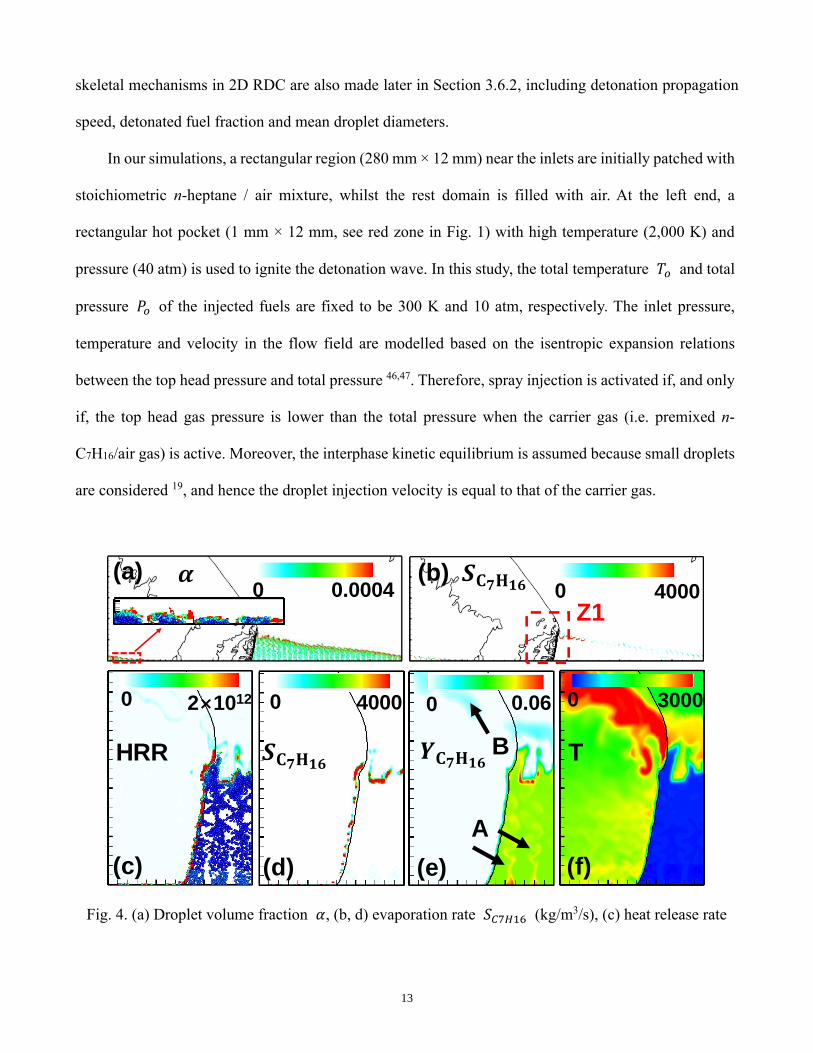
Fig. 4. (a) Droplet volume fraction 𝛼, (b, d) evaporation rate 𝑆𝐶7𝐻16 (kg/m3/s), (c) heat release rate
(a) (b)
(d) (e)
Z1
(c)
HRR
(f)
T
0 0.0004 0 4000
0 2×10¹² 0 4000 0 0.06 0 3000
A
B

14
(J/m3/s), (e) n-C7H16 mass fraction 𝑌𝐶7𝐻16, and (f) temperature T (K). The results from Case 2a.
Black lines: pressure iso-lines of (a, b) 1–15 MPa and (c)−(f) 1 MPa. Domain size for (a, b): 280
mm × 100 mm. (c)−(f) correspond to zone Z1 in (b). Droplets colored with their temperatures are
visualized in (c) and the inset of (a).
3. Results and discussion
3.1 General feature of two-phase rotating detonations
Figure 4 shows the distributions of droplet volume fraction α, n-heptane evaporation rate 𝑆𝐶7𝐻16,
Heat Release Rate (HRR), n-heptane mass fraction (YC7H16) and temperature (T) for Case 2a (𝜙𝑡 = 1
and d0 = 5 μm). Note that 𝑆𝐶7𝐻16 is the volumetric evaporation rate and predicted with Eq. (15), which
will be termed as “evaporation rate” hereafter for brevity. The present simulation captures the main RDC
structures, including the detonation front, oblique shock wave, and deflagration surface, as shown from
Figs. 4(b), 4(c) and 4(f). They are similar to those of the purely gaseous RDC 47. Due to the existence of
dispersed droplets, new features arise. upecifically, the n-heptane droplets, after injected, are mainly
distributed in the triangular fuel refill zone, confirmed by the high local volume fraction α in Fig. 4(a).
In most of the refill zone, n-C7H16 mass fraction is close to that in the carrier gas, i.e. 3.82%, indicated
the limited evaporation in the interior of the refill zone before the RDW approaches, because of the low
local temperature (e.g. about 250 - 300 K). Nevertheless, all the droplets are vaporized along the
deflagration and detonation fronts due to local high temperature, and large evaporation rate 𝑆𝐶7𝐻16 can
be seen there (see Figs. 4b and 4d). Therefore, almost no droplets can be found beyond the refill zone,
which is also true for other simulated cases with initial droplet diameters of 2 and 5 μm. This directly
leads to high n-C7H16 concentration around them (Fig. 4e). Ribbon-shaped zones ahead of detonation
wave with locally high n-C7H16 concentration can be seen (see the arrows A) in Fig. 4(e), which
correspond to the recirculation zone due to the walls between the spray injectors. This accumulation of

15
n-C7H16 vapour results from the evaporation of droplets between the two injectors (see the inset of Fig.
4a). However, the foregoing n-C7H16 non-uniformity in the refill zone does not affect the RDW overall
stability, and it steadily propagates at a mean speed of about 1,537 m/s. It is about 16% lower compared
to the purely gaseous RDC speed, i.e. 1,830 m/s. Although the droplets are depleted inside the refill zone,
however, finite n-C7H16 gas can still be found along the slip line (see the arrow B in Fig. 4e).
Nevertheless, limited deflagrative combustion occurs there, with relatively low heat release (Fig. 4c).
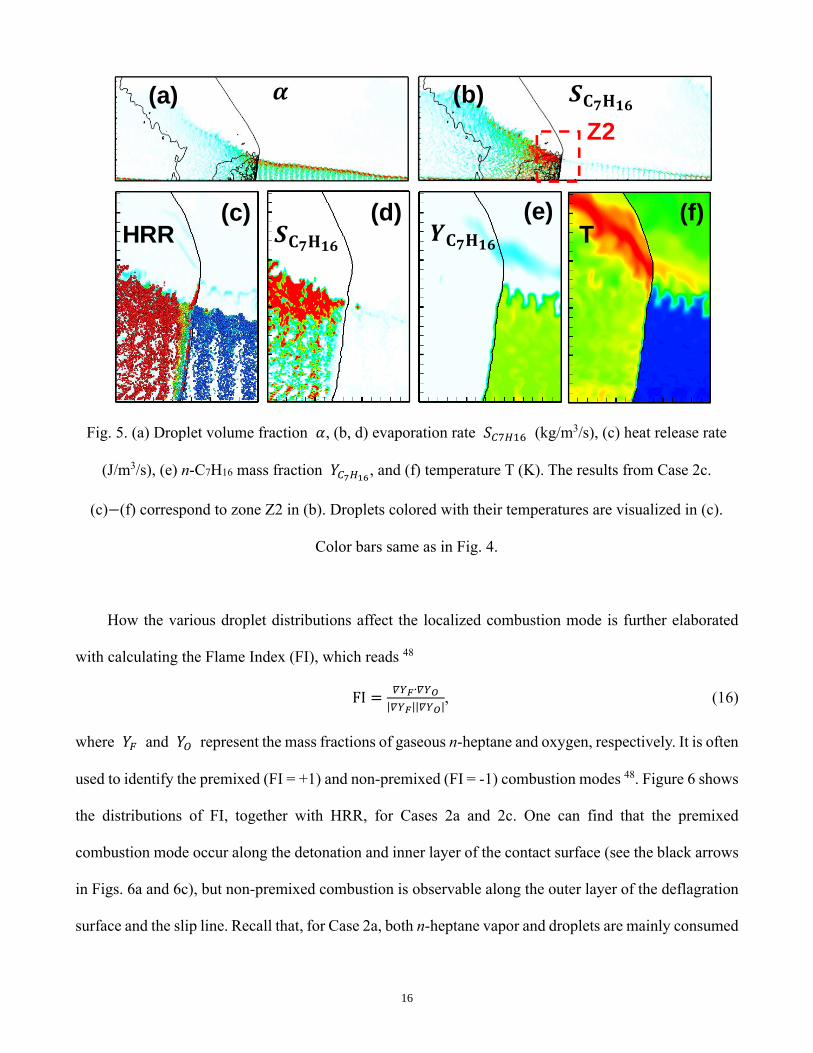
Plotted in Figure 5 are the counterpart results from Case 2c with 𝜙𝑡 = 1 but larger initial diameter,
i.e. d0 = 20 μm. The main RDC structures are similar to those in Fig. 4, and the RDW propagation is also
stable with the speed of 1,519 m/s, about 1.2% lower than that of Case 2a. This is about 16.9% lower
than the corresponding purely gaseous RDC result. However, besides in the refill zone, there are a large
number of n-heptane droplets behind the detonation wave (see Fig. 5c), between the slip line and
deflagration surface, which is characterized by the high volume fraction there. Besides droplet
evaporation along the deflagrative and detonation fronts, even stronger evaporation (hence higher
𝑆𝐶7𝐻16, greater than 4000 kg/m3/s) proceeds immediately behind the RDW. However, local n-C7H16
concentration does not increase accordingly, which may be due to the distributed deflagrative
combustion behind the RDW. Moreover, the mean droplet residence time in the refill zone is about 67
μs for Case 2c, much smaller than that in the whole domain (about 91 μs). However, for Case 2a with
droplets fully evaporated in the refill zone, the mean droplet residence time in the refill zone is about 42
μs. Moreover, one should note that these above phenomena, e.g. the distributions of the droplets, n-
C7H16 vapor and HRR, are also seen in the other cases with relatively larger droplet diameters.
16
Fig. 5. (a) Droplet volume fraction 𝛼, (b, d) evaporation rate 𝑆𝐶7𝐻16 (kg/m3/s), (c) heat release rate
(J/m3/s), (e) n-C7H16 mass fraction 𝑌𝐶7𝐻16, and (f) temperature T (K). The results from Case 2c.
(c)−(f) correspond to zone Z2 in (b). Droplets colored with their temperatures are visualized in (c).
Color bars same as in Fig. 4.
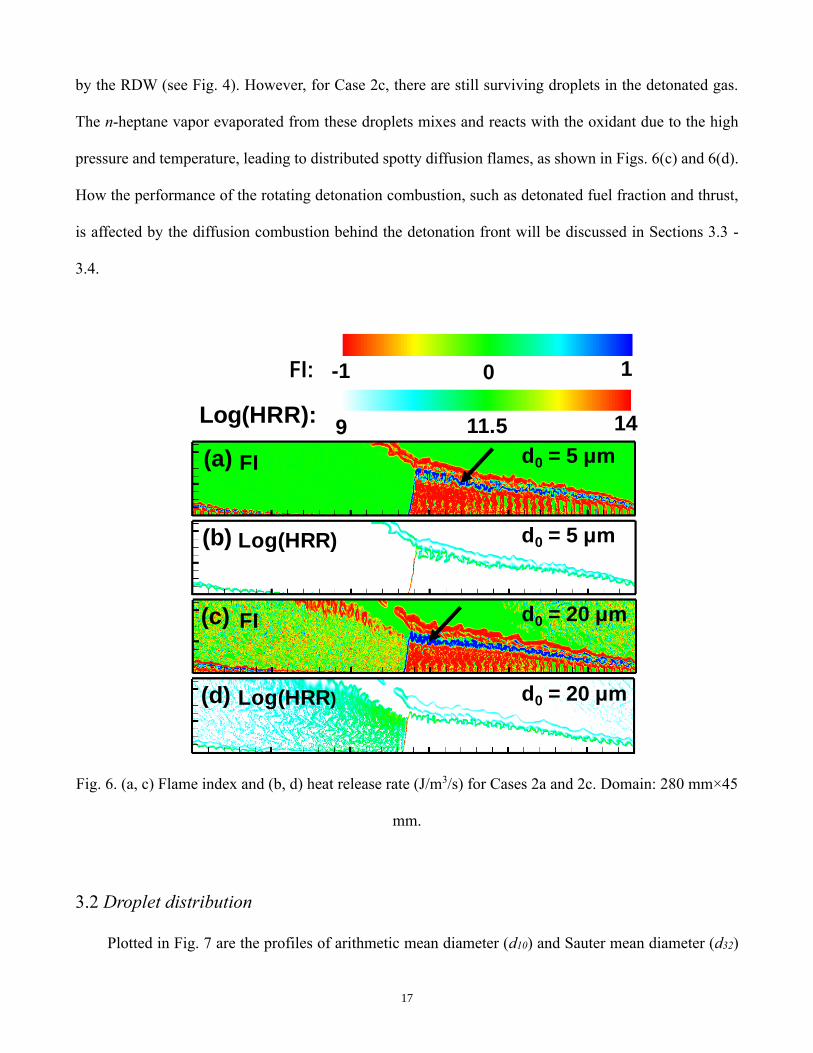
How the various droplet distributions affect the localized combustion mode is further elaborated
with calculating the Flame Index (FI), which reads 48
FI =𝛻𝑌𝐹∙𝛻𝑌𝑂
|𝛻𝑌𝐹||𝛻𝑌𝑂|, (16)
where 𝑌𝐹 and 𝑌𝑂 represent the mass fractions of gaseous n-heptane and oxygen, respectively. It is often
used to identify the premixed (FI = +1) and non-premixed (FI = -1) combustion modes 48. Figure 6 shows
the distributions of FI, together with HRR, for Cases 2a and 2c. One can find that the premixed
combustion mode occur along the detonation and inner layer of the contact surface (see the black arrows
in Figs. 6a and 6c), but non-premixed combustion is observable along the outer layer of the deflagration
surface and the slip line. Recall that, for Case 2a, both n-heptane vapor and droplets are mainly consumed
(a) (b)
Z2
(c)HRR
(d) (e) (f)T
17
by the RDW (see Fig. 4). However, for Case 2c, there are still surviving droplets in the detonated gas.
The n-heptane vapor evaporated from these droplets mixes and reacts with the oxidant due to the high
pressure and temperature, leading to distributed spotty diffusion flames, as shown in Figs. 6(c) and 6(d).
How the performance of the rotating detonation combustion, such as detonated fuel fraction and thrust,
is affected by the diffusion combustion behind the detonation front will be discussed in uections 3.3 -
3.4.
Fig. 6. (a, c) Flame index and (b, d) heat release rate (J/m3/s) for Cases 2a and 2c. Domain: 280 mm×45
mm.
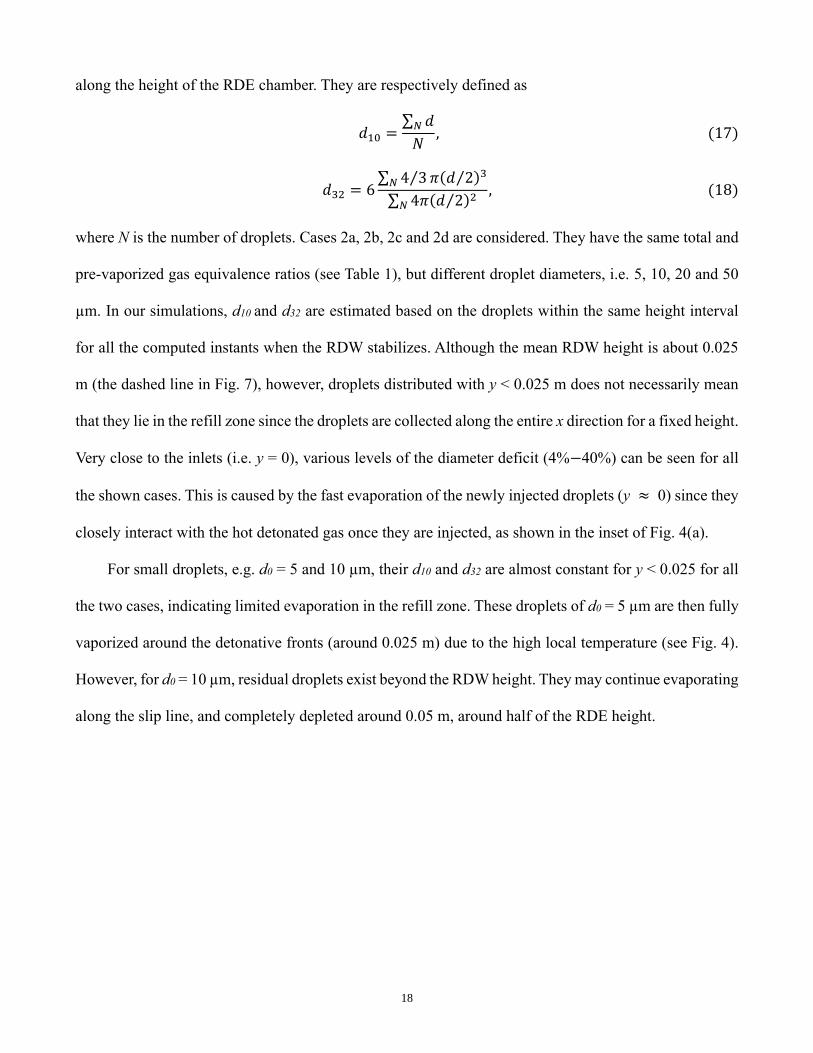
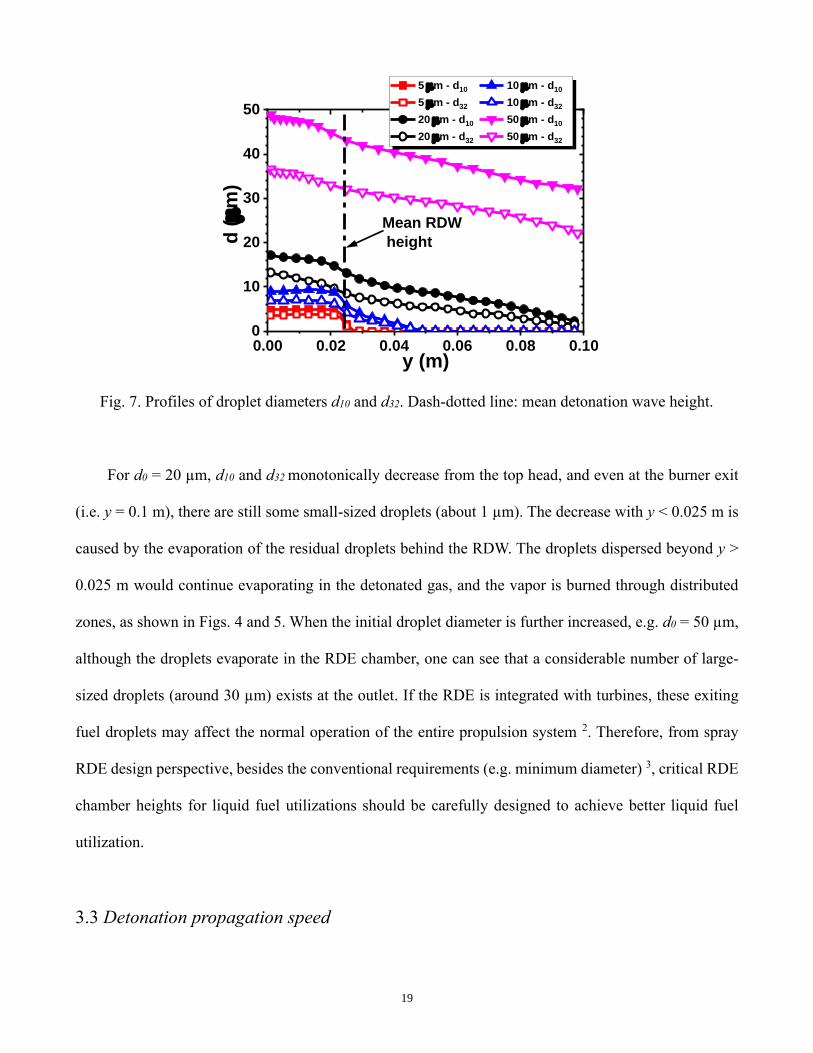
3.2 Droplet distribution
Plotted in Fig. 7 are the profiles of arithmetic mean diameter (d10) and uauter mean diameter (d32)
(a)
(b)
(c)
(d)
d0 = 5 μm
d0 = 5 μm
d0 = 20 μm
d0 = 20 μm
FI
FI
Log(HRR)
Log(HRR)
Log(HRR)9 1411.5
FI-1 1
-1 10
9 1411.5
FI:
Log(HRR):
18
along the height of the RDE chamber. They are respectively defined as
𝑑10 =∑ 𝑑𝑁
𝑁, (17)
𝑑32 = 6∑ 4 3⁄ 𝜋(𝑑 2⁄ )3𝑁
∑ 4𝜋(𝑑 2⁄ )2𝑁, (18)
where N is the number of droplets. Cases 2a, 2b, 2c and 2d are considered. They have the same total and
pre-vaporized gas equivalence ratios (see Table 1), but different droplet diameters, i.e. 5, 10, 20 and 50
µm. In our simulations, d10 and d32 are estimated based on the droplets within the same height interval
for all the computed instants when the RDW stabilizes. Although the mean RDW height is about 0.025
m (the dashed line in Fig. 7), however, droplets distributed with y < 0.025 m does not necessarily mean
that they lie in the refill zone since the droplets are collected along the entire x direction for a fixed height.
Very close to the inlets (i.e. y = 0), various levels of the diameter deficit (4%−40%) can be seen for all
the shown cases. This is caused by the fast evaporation of the newly injected droplets (y ≈ 0) since they
closely interact with the hot detonated gas once they are injected, as shown in the inset of Fig. 4(a).
For small droplets, e.g. d0 = 5 and 10 µm, their d10 and d32 are almost constant for y < 0.025 for all
the two cases, indicating limited evaporation in the refill zone. These droplets of d0 = 5 µm are then fully
vaporized around the detonative fronts (around 0.025 m) due to the high local temperature (see Fig. 4).
However, for d0 = 10 µm, residual droplets exist beyond the RDW height. They may continue evaporating
along the slip line, and completely depleted around 0.05 m, around half of the RDE height.
19
Fig. 7. Profiles of droplet diameters d10 and d32. Dash-dotted line: mean detonation wave height.
For d0 = 20 µm, d10 and d32 monotonically decrease from the top head, and even at the burner exit
(i.e. y = 0.1 m), there are still some small-sized droplets (about 1 µm). The decrease with y < 0.025 m is
caused by the evaporation of the residual droplets behind the RDW. The droplets dispersed beyond y >
0.025 m would continue evaporating in the detonated gas, and the vapor is burned through distributed
zones, as shown in Figs. 4 and 5. When the initial droplet diameter is further increased, e.g. d0 = 50 µm,
although the droplets evaporate in the RDE chamber, one can see that a considerable number of large-
sized droplets (around 30 µm) exists at the outlet. If the RDE is integrated with turbines, these exiting
fuel droplets may affect the normal operation of the entire propulsion system 2. Therefore, from spray
RDE design perspective, besides the conventional requirements (e.g. minimum diameter) 3, critical RDE
chamber heights for liquid fuel utilizations should be carefully designed to achieve better liquid fuel
utilization.
3.3 Detonation propagation speed
0.00 0.02 0.04 0.06 0.08 0.100
10
20
30
40
50
d (
m)
y (m)
5 m - d10 10 m - d10
5 m - d32 10 m - d32
20 m - d10 50 m - d10
20 m - d32 50 m - d32
Mean RDW
height
20
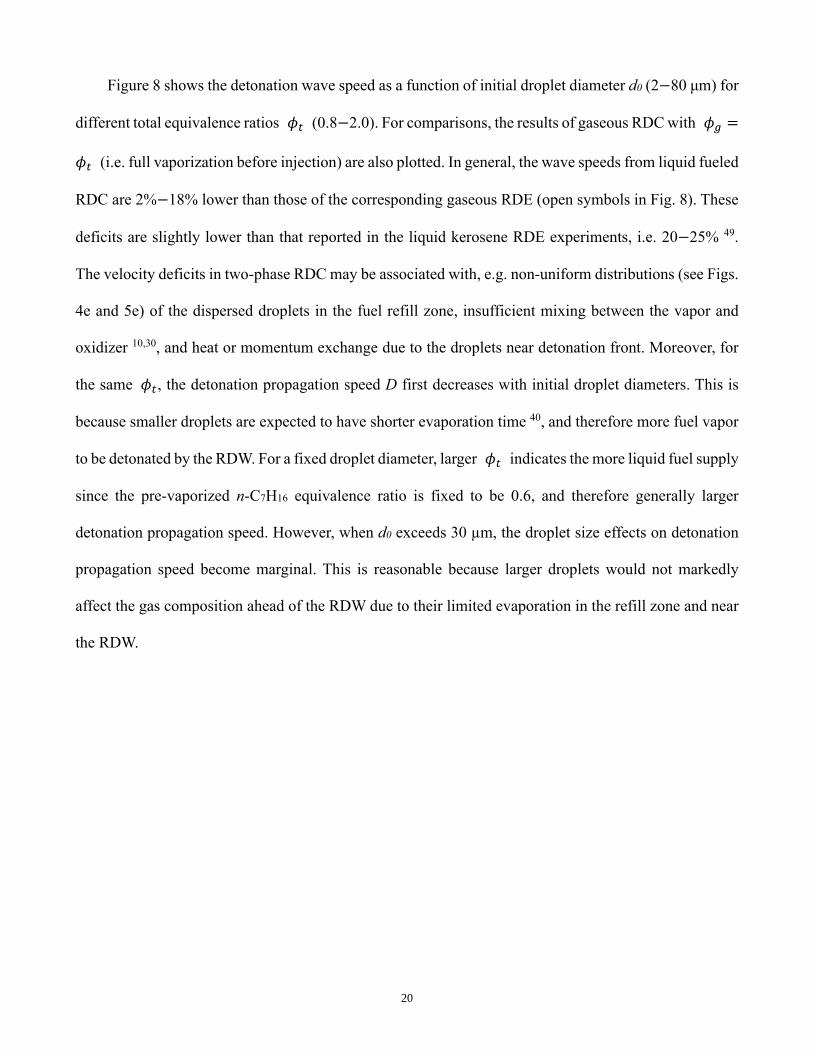
Figure 8 shows the detonation wave speed as a function of initial droplet diameter d0 (2−80 μm) for
different total equivalence ratios 𝜙𝑡 (0.8−2.0). For comparisons, the results of gaseous RDC with 𝜙𝑔 =
𝜙𝑡 (i.e. full vaporization before injection) are also plotted. In general, the wave speeds from liquid fueled
RDC are 2%−18% lower than those of the corresponding gaseous RDE (open symbols in Fig. 8). These
deficits are slightly lower than that reported in the liquid kerosene RDE experiments, i.e. 20−25% 49.
The velocity deficits in two-phase RDC may be associated with, e.g. non-uniform distributions (see Figs.
4e and 5e) of the dispersed droplets in the fuel refill zone, insufficient mixing between the vapor and
oxidizer 10,30, and heat or momentum exchange due to the droplets near detonation front. Moreover, for
the same 𝜙𝑡, the detonation propagation speed D first decreases with initial droplet diameters. This is
because smaller droplets are expected to have shorter evaporation time 40, and therefore more fuel vapor
to be detonated by the RDW. For a fixed droplet diameter, larger 𝜙𝑡 indicates the more liquid fuel supply
since the pre-vaporized n-C7H16 equivalence ratio is fixed to be 0.6, and therefore generally larger
detonation propagation speed. However, when d0 exceeds 30 µm, the droplet size effects on detonation
propagation speed become marginal. This is reasonable because larger droplets would not markedly
affect the gas composition ahead of the RDW due to their limited evaporation in the refill zone and near
the RDW.

21
Fig. 8. Detonation wave speed as a function of initial droplet diameter and total equivalence ratio.
Open symbols: gaseous RDC; solid symbols: two-phase RDC.
In Fig. 8, the equivalence ratio of pre-vaporized n-C7H16 / air mixture is fixed to be 𝜙𝑔 = 0.6.
Figure 9 further shows the detonation wave speed with variable pre-vaporized gas equivalence ratios, i.e.
𝜙𝑔 = 0.5 and 0.8. Note that the total equivalence ratio is fixed to be 𝜙𝑡 = 1.0 here. For a given 𝜙𝑔, the
trends of detonation wave speed are similar to those of 𝜙𝑔 = 0.6 shown in Fig. 8. It can also be found
that the detonation wave speed increases with pre-vaporized gas equivalence ratios 𝜙𝑔 with the same
initial droplet diameter 𝑑0 . The wave speeds with different 𝜙𝑔 and 𝑑0 are always much smaller
(6%−24%) than that of purely gaseous RDW with the same total equivalence ratio, i.e. 𝜙𝑡 = 1.0 for
these cases, due to the heterogeneous distributions of the gas reactants and liquid droplets in the fuel
refill zone (see Figs. 4 and 5).
0 20 40 60 801450
1500
1550
1600
1650
1700
1750
1800
1850
ft = fg = 0.6
ft = 0.8
ft = 1.0
ft = 1.5
ft = 2.0W
av
e s
pe
ed
(m
/s)
Diameter (m)
Gaseous detonation
22
Fig. 9. Detonation wave speed as a function of initial droplet diameter and pre-vaporized gas
equivalence ratio. Open symbols: gaseous RDC; solid symbols: two-phase RDC.
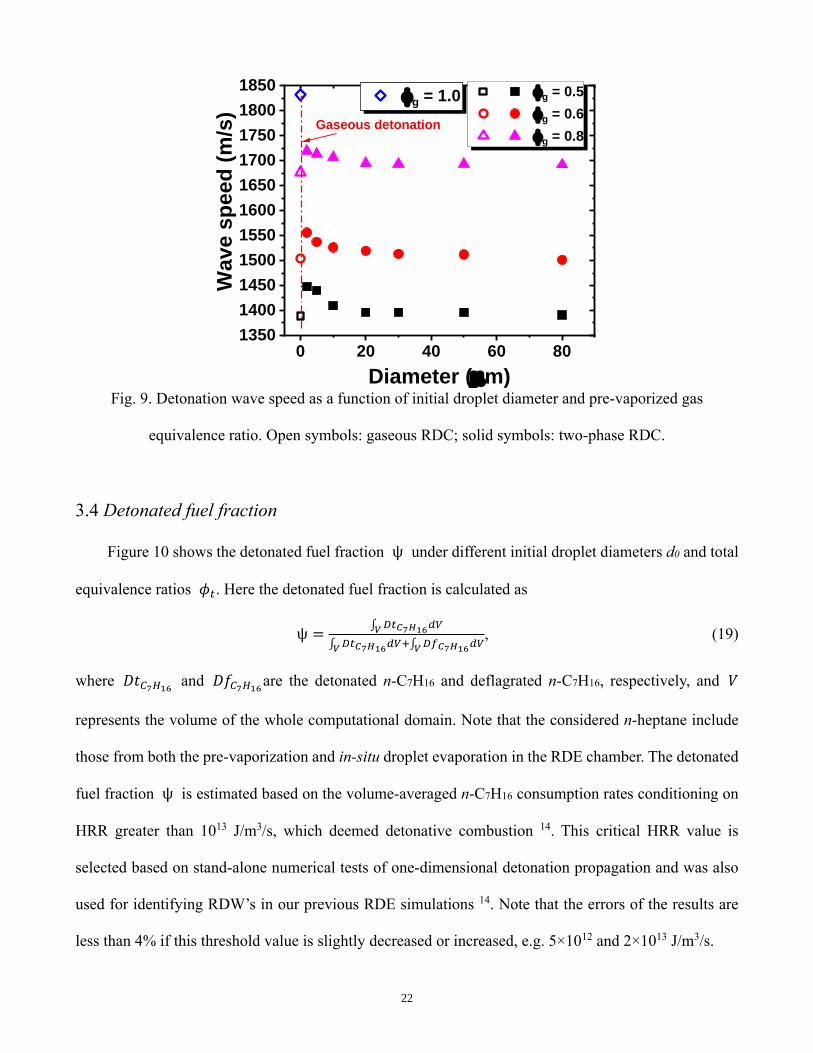
3.4 Detonated fuel fraction
Figure 10 shows the detonated fuel fraction ψ under different initial droplet diameters d0 and total
equivalence ratios 𝜙𝑡. Here the detonated fuel fraction is calculated as
ψ =∫ 𝐷𝑡𝐶7𝐻16𝑑𝑉 𝑉
∫ 𝐷𝑡𝐶7𝐻16𝑑𝑉 𝑉 +∫ 𝐷𝑓𝐶7𝐻16𝑑𝑉
𝑉
, (19)
where 𝐷𝑡𝐶7𝐻16 and 𝐷𝑓𝐶7𝐻16 are the detonated n-C7H16 and deflagrated n-C7H16, respectively, and 𝑉
represents the volume of the whole computational domain. Note that the considered n-heptane include
those from both the pre-vaporization and in-situ droplet evaporation in the RDE chamber. The detonated
fuel fraction ψ is estimated based on the volume-averaged n-C7H16 consumption rates conditioning on
HRR greater than 1013 J/m3/s, which deemed detonative combustion 14. This critical HRR value is
selected based on stand-alone numerical tests of one-dimensional detonation propagation and was also
used for identifying RDW’s in our previous RDE simulations 14. Note that the errors of the results are
less than 4% if this threshold value is slightly decreased or increased, e.g. 5×10¹² and 2×10¹³ J/m3/s.
0 20 40 60 801350
1400
1450
1500
1550
1600
1650
1700
1750
1800
1850 fg = 1.0 fg = 0.5
fg = 0.6
fg = 0.8
Wa
ve
sp
ee
d (
m/s
)
Diameter (m)
Gaseous detonation

23
Overall, when the droplet diameter is small, i.e. d0 < 20 μm, ψ decreases with increased d0. umall
droplets can be fully vaporized around the detonation front, thereby a higher ψ. When d0 > 20 μm,
increasing d0 leads to high ψ. As seen in Fig. 5, large droplets continue evaporating in the denoted gas.
However, with increased droplet size, the droplets take longer time to finish the evaporation and release
the vapor, and therefore their kinetic effects on the RDC become weaker. The droplets with large 𝑑0
cannot be fully vaporized in the RDE chamber and then exit through the outlet, and the spotty diffusion
combustion behind RDW is weakened due to less fuel vapor. As such, detonated fuel fraction increases
again with droplet diameter. 𝑑0 = 20 μm is a critical diameter corresponding to a minimal detonated
fuel fraction based on our simulations.
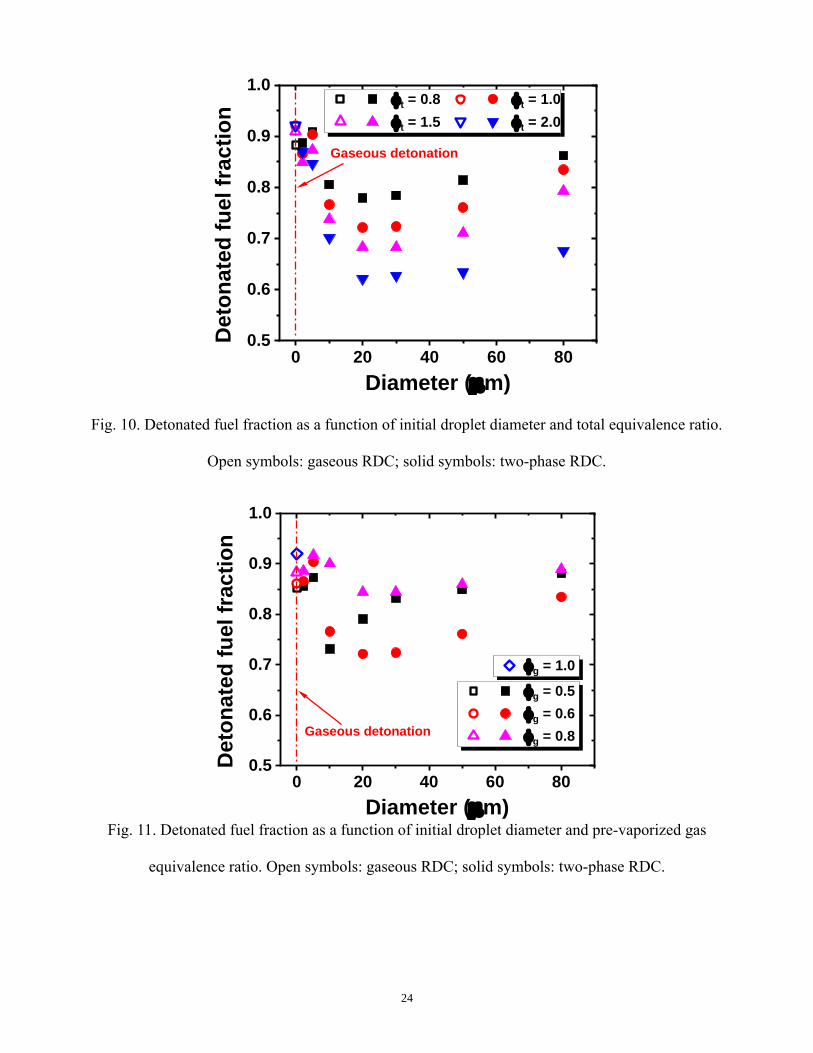
The detonated fuel fractions (ψ) with different pre-vaporized gas equivalence ratios, i.e. 𝜙𝑔 = 0.5,
0.6 and 0.8, are also calculated and shown in Fig. 11. Here the total equivalence ratio 𝜙𝑡 is 1.0. For a
given 𝜙𝑔, the trends of ψ are also similar to those of 𝜙𝑔 = 0.6 shown in Fig. 10. The critical diameter
corresponding to the minimum detonated fuel fraction increases with 𝜙𝑔, i.e. about 10, 20 and 30 μm
for 𝜙𝑔 = 0.5, 0.6 and 0.8, respectively. Moreover, when the initial droplet diameter 𝑑0 is smaller than
the critical diameter, increased gas equivalence ratio would lead to high ψ. However, for 𝑑0 greater
than the critical diameter, ψ of 𝜙𝑔 = 0.5 is higher than that of 𝜙𝑔 = 0.6, but close to that of 𝜙𝑔 = 0.8.
This may be due to the less deflagrated vapor with lower detonation temperature of 𝜙𝑔 = 0.5 than that
of 𝜙𝑔 = 0.6.
24
Fig. 10. Detonated fuel fraction as a function of initial droplet diameter and total equivalence ratio.
Open symbols: gaseous RDC; solid symbols: two-phase RDC.
Fig. 11. Detonated fuel fraction as a function of initial droplet diameter and pre-vaporized gas
equivalence ratio. Open symbols: gaseous RDC; solid symbols: two-phase RDC.
0 20 40 60 800.5
0.6
0.7
0.8
0.9
1.0 ft = 0.8 ft = 1.0
ft = 1.5 ft = 2.0
De
ton
ate
d f
ue
l fr
ac
tio
n
Diameter (m)
Gaseous detonation
0 20 40 60 800.5
0.6
0.7
0.8
0.9
1.0
Gaseous detonation
fg = 1.0
fg = 0.5
fg = 0.6
fg = 0.8
De
ton
ate
d f
ue
l fr
ac
tio
n
Diameter (m)
25
3.5 Propulsion performance
In order to evaluate the overall propulsion performance of rotating detonation combustion with
sprayed liquid fuels, the specific impulse (𝐼𝑠𝑝 = ∫ [𝜌𝑢2 + (𝑝 − 𝑝𝑏)]𝑑𝐴𝑜
𝐴𝑜𝑔�̇�𝐹⁄ ) is analyzed in this
section. Here 𝐴𝑜 is the area of the outlet, 𝑢 is the gaseous velocity at the outlet, �̇�𝐹 is the mass flow
rate of fuel (including the gaseous and liquid fuel), 𝑔 is gravity acceleration, p is the local pressure at
the outlet and 𝑝𝑏 is the backpressure (taken as 1 atm in this work).
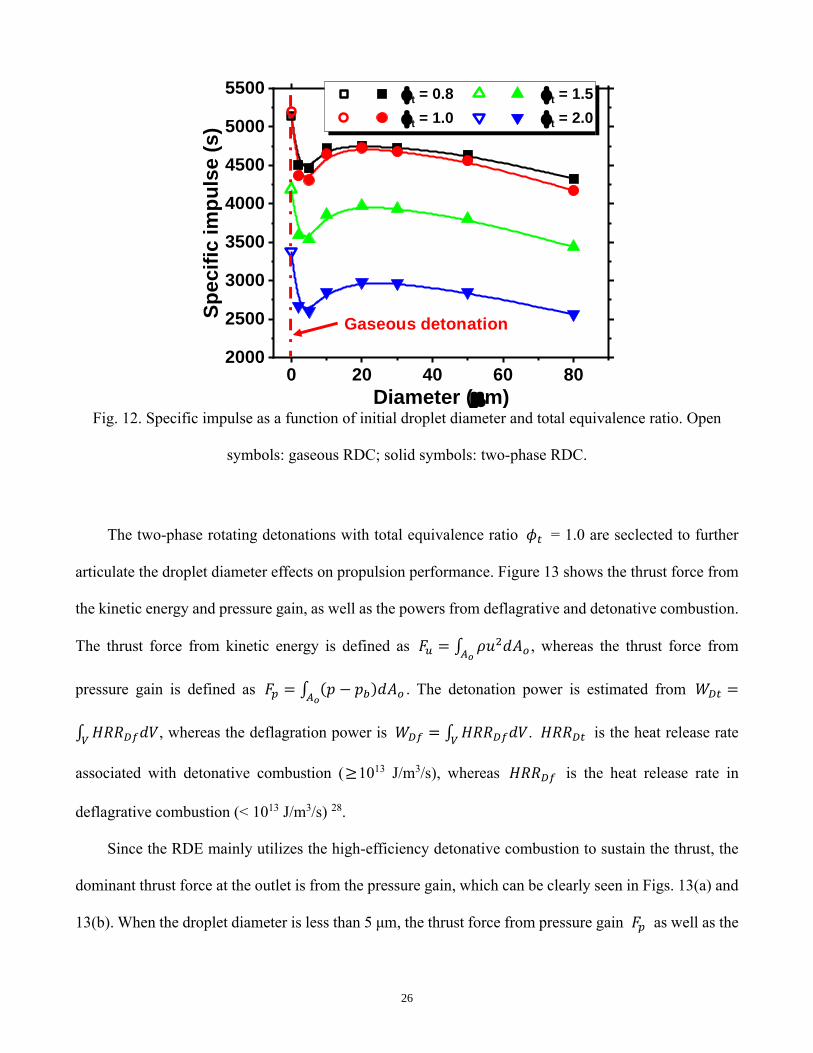
Figure 12 shows the specific impulse 𝐼𝑠𝑝 as a function of initial droplet diameter and total
equivalence ratio. Note that the pre-vaporized gas equivalence ratio is 𝜙𝑔 = 0.6 for all the cases in Fig.
12. For 𝜙𝑡 = 0.8 and 1.0, they have close specific impulses for a given droplet diameter. However, with
𝜙𝑡 = 1.5 and 2.0, their specific impulses are significantly reduced. This may be because the fuels from
the pre-vaporization and droplet evaporation are completely reacted for 𝜙𝑡 ≤ 1, but only part of the fuel
is consumed with 𝜙𝑡 > 1 due to deficient oxidizer.
The dependece of specific impulse 𝐼𝑠𝑝 on initial droplet diameter d0 is L-shaped. upecifically, for
a given total equivalence ratio, the case with purely gaseous fuel injection (open symbols in Fig. 12) has
the greatest specific impulse, compared to those in two-phase scenarios, as shown in Fig. 12. This may
be because a considerable part of the liquid fuel is deflagrated after evaporation along the contact surface
and behind the detonation front (see Figs. 4 and 5). Also, with increased droplet diameter, the specific
impulse first decreases with 𝑑0 < 5 μm, then increases with 𝑑0 between 5 μm and 20 μm, and finally
decreases with 𝑑0 > 20 μm. Although there is a peak specific impulse when the droplet diameter is
around 20 μm, it has the smallest detonation fraction (see Fig. 10). This indicates that the specific impulse
is affected by the deflagration and detonation as the droplet diameter changes, which will be further
discussed in the following.
26
Fig. 12. upecific impulse as a function of initial droplet diameter and total equivalence ratio. Open
symbols: gaseous RDC; solid symbols: two-phase RDC.
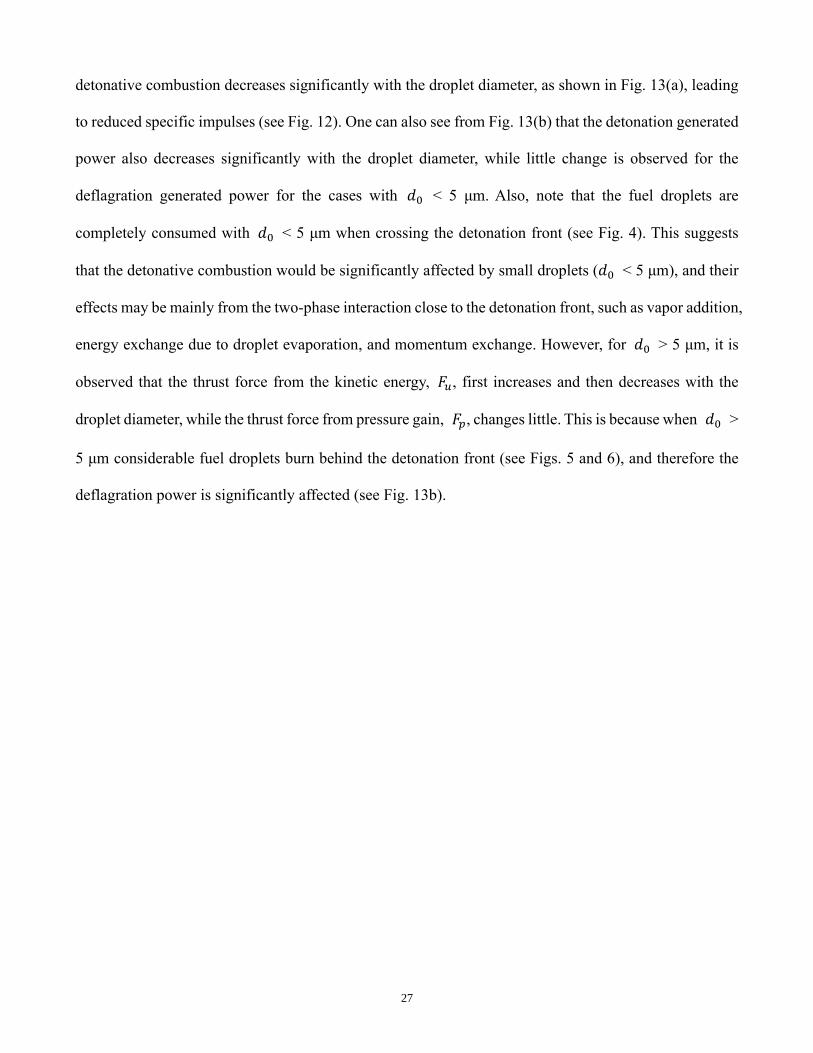
The two-phase rotating detonations with total equivalence ratio 𝜙𝑡 = 1.0 are seclected to further
articulate the droplet diameter effects on propulsion performance. Figure 13 shows the thrust force from
the kinetic energy and pressure gain, as well as the powers from deflagrative and detonative combustion.
The thrust force from kinetic energy is defined as 𝐹𝑢 = ∫ 𝜌𝑢2𝑑𝐴𝑜
𝐴𝑜 , whereas the thrust force from
pressure gain is defined as 𝐹𝑝 = ∫ (𝑝 − 𝑝𝑏)𝑑𝐴𝑜
𝐴𝑜 . The detonation power is estimated from 𝑊𝐷𝑡 =
∫ 𝐻𝑅𝑅𝐷𝑓𝑑𝑉
𝑉, whereas the deflagration power is 𝑊𝐷𝑓 = ∫ 𝐻𝑅𝑅𝐷𝑓𝑑𝑉
𝑉. 𝐻𝑅𝑅𝐷𝑡 is the heat release rate
associated with detonative combustion (≥ 1013 J/m3/s), whereas 𝐻𝑅𝑅𝐷𝑓 is the heat release rate in
deflagrative combustion (< 1013 J/m3/s) 28.
uince the RDE mainly utilizes the high-efficiency detonative combustion to sustain the thrust, the
dominant thrust force at the outlet is from the pressure gain, which can be clearly seen in Figs. 13(a) and
13(b). When the droplet diameter is less than 5 μm, the thrust force from pressure gain 𝐹𝑝 as well as the
0 20 40 60 802000
2500
3000
3500
4000
4500
5000
5500 ft = 0.8 ft = 1.5
ft = 1.0 ft = 2.0
Sp
ec
ific
im
pu
lse
(s
)
Diameter (m)
Gaseous detonation
27
detonative combustion decreases significantly with the droplet diameter, as shown in Fig. 13(a), leading
to reduced specific impulses (see Fig. 12). One can also see from Fig. 13(b) that the detonation generated
power also decreases significantly with the droplet diameter, while little change is observed for the
deflagration generated power for the cases with 𝑑0 < 5 μm. Also, note that the fuel droplets are
completely consumed with 𝑑0 < 5 μm when crossing the detonation front (see Fig. 4). This suggests
that the detonative combustion would be significantly affected by small droplets (𝑑0 < 5 μm), and their
effects may be mainly from the two-phase interaction close to the detonation front, such as vapor addition,
energy exchange due to droplet evaporation, and momentum exchange. However, for 𝑑0 > 5 μm, it is
observed that the thrust force from the kinetic energy, 𝐹𝑢, first increases and then decreases with the
droplet diameter, while the thrust force from pressure gain, 𝐹𝑝, changes little. This is because when 𝑑0 >
5 μm considerable fuel droplets burn behind the detonation front (see Figs. 5 and 6), and therefore the
deflagration power is significantly affected (see Fig. 13b).
28
Fig. 13. (a) Thrust force from kinetic energy and pressure gain and (b) deflagrative and detonative
combustion power (J/s). Total equivalence ratio is 1.0. Open symbols: gaseous RDC; solid symbols:
two-phase RDC.
3.6 Discussion
To examine the effects of mesh resolution, reaction mechanism and droplet break-up on predictions
of two-phase rotating detonation combustion, extra numerical experiments are performed in this section.
0 20 40 60 80
3000
3500
4000
4500
5000
5500
ft = 1.0, Fu
ft = 1.0, Fp
Fu,
Fu (
N)
Diameter (m)
(a)
0 20 40 60 800.0
4.0x10⁶
8.0x10⁶
1.2x10⁷
1.6x10⁷
2.0x10⁷
ft = 1.0, Detonation
ft = 1.0, Deflagration
Co
mb
usti
on
po
wer
(J/s
)
Diameter (m)
(b)
Gaseous detonation
0 20 40 60 80
3000
3500
4000
4500
5000
5500
ft = 1.0, Fu
ft = 1.0, Fp
Fu,
Fp (
N)
Diameter (m)
(a)

29
3.6.1 Mesh resolution
uimulations of Cases 2a (d0 = 5 µm) and 2c (d0 = 20 µm) are repeated with a finer mesh, for which
the cell numbers in both x- and y-directions are doubled. For brevity, the original mesh used for the above
analysis is referred to as M1, and the refined one is M2.
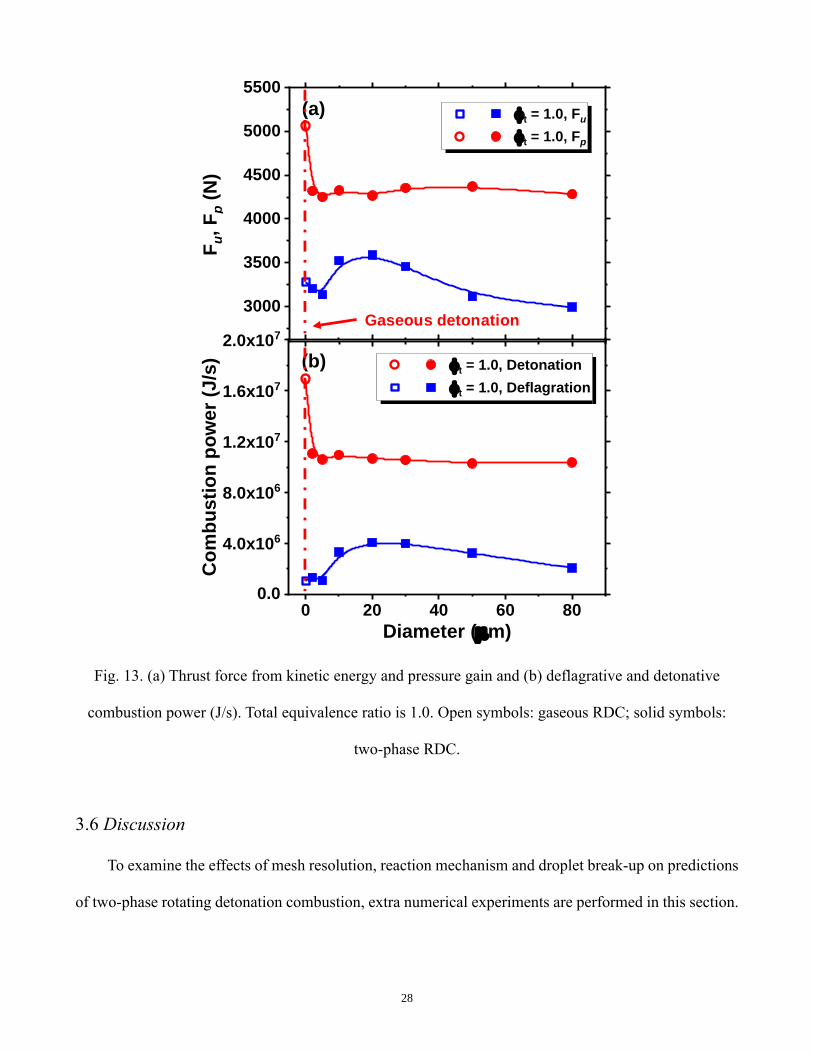
Figure 14 shows the time history of RDW propagation speed, and the instantaneous propagation
speed is estimated based on two adjacent time instants (i.e. ∆𝑡 = 1 × 10⁻⁵ s), and the detonation wave
position is defined as the point with maximum heat release rate. Due to the non-uniform distributions of
droplets and reactants in the fuel refill zone (see Figs. 4 and 5), all their instantaneous RDW propagation
speeds slightly fluctuate. However, their mean propagation speeds and their Root-Mean-uquare (RMu)
values predicted with M1 and M2 are quite similar for both Cases 2a and 2c. For instance, in Case 2a,
the mean RDW speeds from M1 and M2 are 1,537 m/s and 1,540 m/s, respectively, and the corresponding
RMu values are 71 m/s and 69 m/s, respectively. Moreover, the instantaneous and stochastic differences
in RDW propagation speed for two meshes are probably from local resolution differences in the predicted
gas phase 28,50.
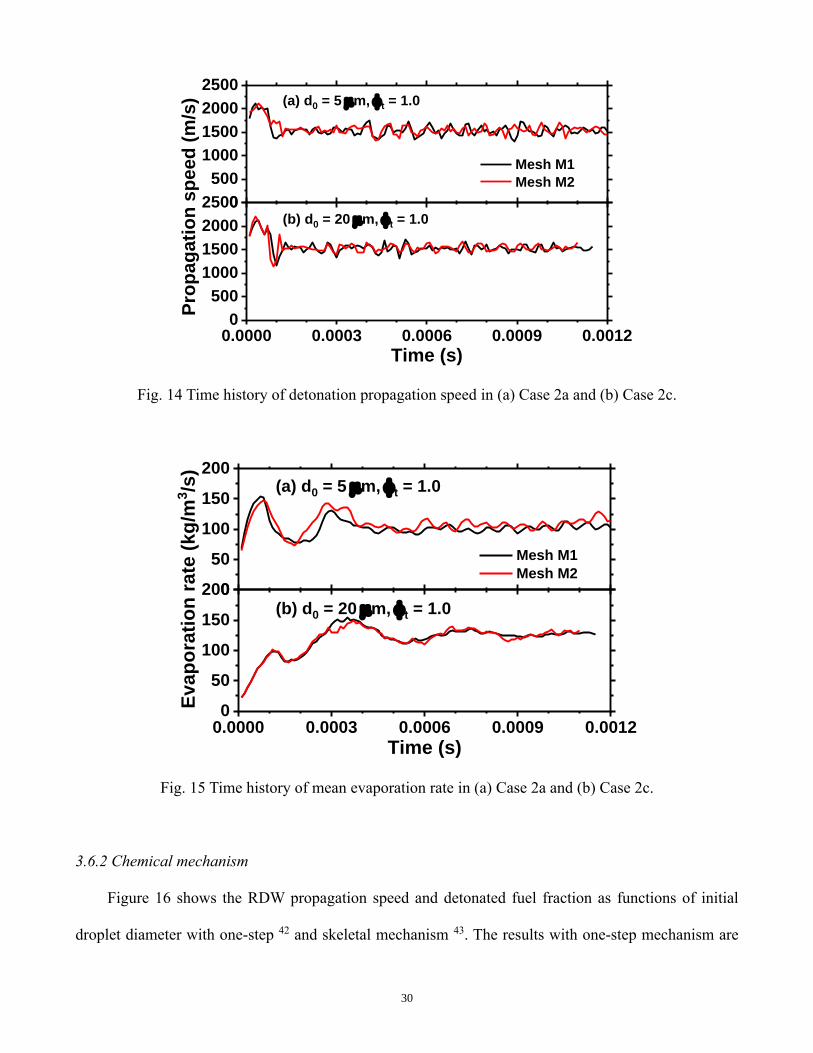
Moreover, to examine how the mesh resolution affects the interactions between gas and liquid
phases, Fig. 15 shows the mean evaporation rate for Cases 2a and 2c predicted with M1 and M2. They
are calculated based on the volume-averaged evaporation rate (i.e. Eq. 15) in the computational domain.
It is seen that the mean evaporation rates are almost not affected by the mesh size. uimilar observations
are also made for the mean exchange rates of energy and momentum (results are not shown here).
Therefore, in general, the above discussion about two-phase RDC have low sensitivity to the mesh
resolution.
30
Fig. 14 Time history of detonation propagation speed in (a) Case 2a and (b) Case 2c.
Fig. 15 Time history of mean evaporation rate in (a) Case 2a and (b) Case 2c.
3.6.2 Chemical mechanism
Figure 16 shows the RDW propagation speed and detonated fuel fraction as functions of initial
droplet diameter with one-step 42 and skeletal mechanism 43. The results with one-step mechanism are
0.0000 0.0003 0.0006 0.0009 0.00120
500
1000
1500
2000
25000
500
1000
1500
2000
2500
Pro
pa
ga
tio
n s
pe
ed
(m
/s)
Time (s)
(b) d0 = 20 m, ft = 1.0
Mesh M1
Mesh M2
(a) d0 = 5 m, ft = 1.0
0.0000 0.0003 0.0006 0.0009 0.00120
50
100
150
2000
50
100
150
200
Time (s)
Mesh M1
Mesh M2
(b) d0 = 20 m, ft = 1.0
(a) d0 = 5 m, ft = 1.0
Ev
ap
ora
tio
n r
ate
(k
g/m
3/s
)

31
very close to those from the skeletal mechanism. For instance, the stoichiometric purely gaseous
detonation propagation speeds with the one-step and skeletal detailed mechanisms are 1,830 m/s and
1,807 m/s, respectively, which are close to the Chapman–Jouguet speed, i.e. 1,850 m/s. Moreover, for
two-phases case with different droplet diameters (i.e. 5, 20 and 80 𝜇m), the differences of the detonation
propagation speeds are less than about 2.5%. In addition, the detonated fuel fractions from the skeletal
mechanism is slightly lower than those from one-step mechanism. This is probably because more
deflagrations along the contact surface are captured with the skeletal mechanism 14.
Fig. 16. (a) Detonation wave speed and (b) detonated fuel fraction as functions of initial droplet
diameter. Open symbols: gaseous RDC; solid symbols: two-phase RDC.
0 20 40 60 801450
1500
1550
1600
1650
1700
1750
1800
1850Cases with
one-step mechanism
ft = 1.0
Wa
ve
sp
ee
d (
m/s
)
Diameter (m)
Gaseous detonation Cases with
skeletal mechanism
ft = 1.0
0 20 40 60 800.5
0.6
0.7
0.8
0.9
1.0
ft = 0.8 ft = 1.0
ft = 1.5 ft = 2.0
De
ton
ate
d f
ue
l fr
ac
tio
n
Diameter (m)
Cases with skeletal mechanism
ft = 1.0
Gaseous detonation
(a)
(b)
32
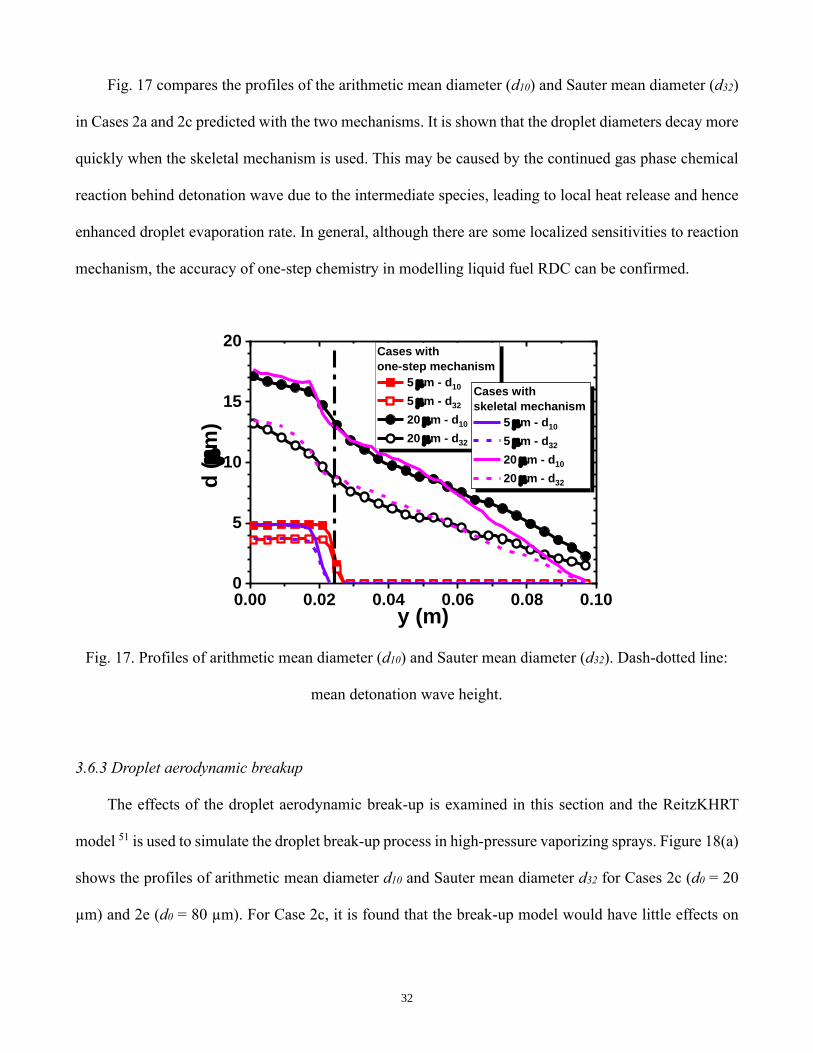
Fig. 17 compares the profiles of the arithmetic mean diameter (d10) and uauter mean diameter (d32)
in Cases 2a and 2c predicted with the two mechanisms. It is shown that the droplet diameters decay more
quickly when the skeletal mechanism is used. This may be caused by the continued gas phase chemical
reaction behind detonation wave due to the intermediate species, leading to local heat release and hence
enhanced droplet evaporation rate. In general, although there are some localized sensitivities to reaction
mechanism, the accuracy of one-step chemistry in modelling liquid fuel RDC can be confirmed.
Fig. 17. Profiles of arithmetic mean diameter (d10) and uauter mean diameter (d32). Dash-dotted line:
mean detonation wave height.
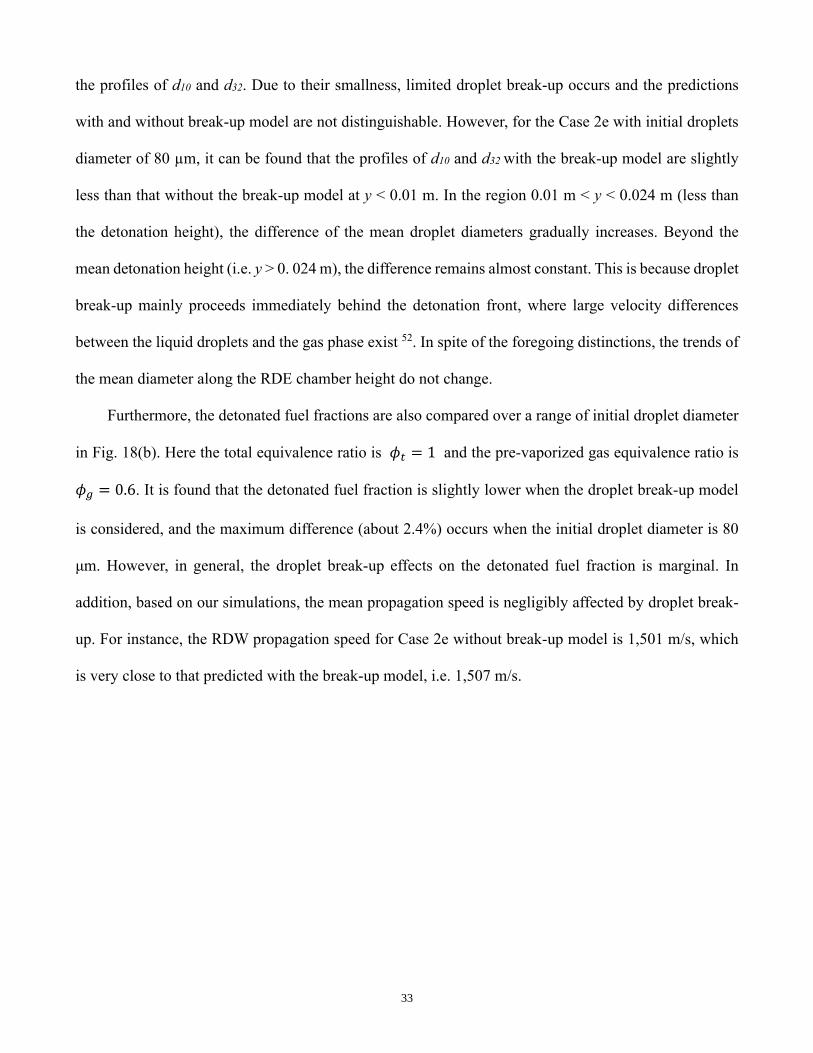
3.6.3 Droplet aerodynamic breakup
The effects of the droplet aerodynamic break-up is examined in this section and the ReitzKHRT
model 51 is used to simulate the droplet break-up process in high-pressure vaporizing sprays. Figure 18(a)
shows the profiles of arithmetic mean diameter d10 and uauter mean diameter d32 for Cases 2c (d0 = 20
µm) and 2e (d0 = 80 µm). For Case 2c, it is found that the break-up model would have little effects on
0.00 0.02 0.04 0.06 0.08 0.100
5
10
15
20
d (
m)
y (m)
Cases with
one-step mechanism
5 m - d10
5 m - d32
20 m - d10
20 m - d32
Cases with
skeletal mechanism
5 m - d10
5 m - d32
20 m - d10
20 m - d32
33
the profiles of d10 and d32. Due to their smallness, limited droplet break-up occurs and the predictions
with and without break-up model are not distinguishable. However, for the Case 2e with initial droplets
diameter of 80 µm, it can be found that the profiles of d10 and d32 with the break-up model are slightly
less than that without the break-up model at y < 0.01 m. In the region 0.01 m < y < 0.024 m (less than
the detonation height), the difference of the mean droplet diameters gradually increases. Beyond the
mean detonation height (i.e. y > 0. 024 m), the difference remains almost constant. This is because droplet
break-up mainly proceeds immediately behind the detonation front, where large velocity differences
between the liquid droplets and the gas phase exist 52. In spite of the foregoing distinctions, the trends of
the mean diameter along the RDE chamber height do not change.
Furthermore, the detonated fuel fractions are also compared over a range of initial droplet diameter
in Fig. 18(b). Here the total equivalence ratio is 𝜙𝑡 = 1 and the pre-vaporized gas equivalence ratio is
𝜙𝑔 = 0.6. It is found that the detonated fuel fraction is slightly lower when the droplet break-up model
is considered, and the maximum difference (about 2.4%) occurs when the initial droplet diameter is 80
μm. However, in general, the droplet break-up effects on the detonated fuel fraction is marginal. In
addition, based on our simulations, the mean propagation speed is negligibly affected by droplet break-
up. For instance, the RDW propagation speed for Case 2e without break-up model is 1,501 m/s, which
is very close to that predicted with the break-up model, i.e. 1,507 m/s.
34
Fig. 18. (a) Profiles of droplet diameter d10 and d32 along the RDE height with and without break-up
model. (b) Detonated fuel fraction as a function of initial droplet diameter with and without droplet
break-up model. Dash-dotted line: mean detonation wave height.
4. Conclusions
Two-dimensional RDE’s with partially pre-vaporized n-heptane sprays are simulated with
Eulerian−Lagrangian method. Emphasis is laid on the influences of droplet diameter and total (or liquid
phase) equivalence ratio on rotating detonation combustion.
The results show that the small n-heptane droplets are completely consumed around the
0 20 40 60 800.5
0.6
0.7
0.8
0.9
1.0 fg = 0.6, ft = 1.0
Case with break-up model
Case without break-up model
De
ton
ate
d f
ue
l fr
ac
tio
n
Diameter (m)
(b)
0.00 0.02 0.04 0.06 0.08 0.100
20
40
60
80
100
d (
m)
y (m)
d10 without break-up model
d32 without break-up model
d10 with break-up model
d32 with break-up model
(a)
Case 2e, d0 = 80 m
Case 2c, d0 = 20 m
35
detonation wave, while for larger ones, the droplets can cross and continue evaporating behind the
detonation wave. Mixed premixed and non-premixed combustion modes exist in the two-phase RDC.
Moreover, for large n-heptane droplets, the n-heptane vapor evaporated from these droplets mixes and
reacts with the oxidant behind the detonation wave due to the high temperature, leading to a distribution
of spotty diffusion flames.
The detonation propagation speed decreases with increased droplet diameter, and beyond a
critical diameter (about 30 µm), it almost does not change with the droplet diameter. The detonated fuel
fraction first decreases and then increases with the droplet diameter. It is also found that the detonation
propagation speed and detonated fuel fraction change considerably with the pre-vaporized gas
equivalence ratio. With increased droplet diameter, the specific impulse first decreases for cases with 𝑑0
< 5 μm, then increases with 𝑑0 between 5 μm and 20 μm, and finally decreases with 𝑑0 > 20 μm. For
the cases with small droplets (𝑑0 < 5 μm), decreasing of specific impulse with droplet diameter is mainly
because of interphase interaction near the detonation front. However, for the cases with larger droplets
(𝑑0 > 5 μm), the change of specific impulse is mainly due to the deflagrative combustion affected by the
droplet evaporation behind the detonation wave. Moreover, the droplet distributions in the RDE
combustor are considerably affected by the droplet evaporation behaviors.
Finally, sensitivity analysis of mesh resolution, reaction mechanism and droplet break-up model
is performed and it is shown that they do not influence the predictions of major RDC features, including
rotating detonation propagation, detonated fuel fraction and droplet diameter distribution.
36
Acknowledgement
The simulations used the AuPIRE 1 Cluster from National uupercomputing Centre, uingapore (NuCC)
(https://www.nscc.sg/). This work is supported by MOE Tier 1 research grant (R-265-000-653-114).
Data Availability
The data that support the findings of this study are available from the corresponding author upon
reasonable request.
References
1 P. Wolański, Proc. Combust. Inst. 34, 125 (2013). 2 V. Anand and E. Gutmark, Prog. Energy Combust. Sci. 73, 182 (2019). 3 F.A. Bykovskii, S.A. Zhdan, and E.F. Vedernikov, J. Propuls. Power 22, 1204 (2006). 4 B.A. Rankin, D.R. Richardson, A.W. Caswell, A.G. Naples, J.L. Hoke, and F.R. Schauer, Combust.
Flame 176, 12 (2017). 5 F.A. Bykovskii, S.A. Zhdan, and E.F. Vedernikov, Combust. Explos. Shock Waves 42, 463 (2006). 6 P. W. Shen and T.C. Adamson Jr, Astronaut. Acta 17, 715 (1972). 7 F.A. Bykovskii, S.A. Zhdan, and E.F. Vedernikov, Combust. Explos. Shock Waves 52, 371 (2016). 8 F.A. Bykovskii, S.A. Zhdan, and E.F. Vedernikov, Combust. Explos. Shock Waves 55, 589 (2019). 9 J. Kindracki, J. Power Technol. 92, 80 (2012). 10 J. Kindracki, Aerosp. Sci. Technol. 43, 445 (2015). 11 S. Xue, H. Liu, L. Zhou, W. Yang, H. Hu, and Y. Yan, Chinese J. Aeronaut. 31, 2199 (2018). 12 B. Sun and H. Ma, AIP Adv. 9, 115307 (2019). 13 A.K. Hayashi, N. Tsuboi, and E. Dzieminska, AIAA J. 1 (2020). 14 M. Zhao, J.-M. Li, C.J. Teo, B.C. Khoo, and H. Zhang, Flow, Turbul. Combust. 104, 261 (2019). 15 W. Sutherland, London, Edinburgh, Dublin Philos. Mag. J. Sci. 36, 507 (1893). 16 R.C. Reid, J.M. Prausnitz, and B.E. Poling, The properties of gases and liquids (McGraw-Hill, New
York, 1987). 17 B.J. McBride, Coefficients for Calculating Thermodynamic and Transport Properties of Individual
Species (National Aeronautics and Space Administration, Office of Management, 1993). 18 G.B. Macpherson, N. Nordin, and H.G. Weller, Commun. Numer. Methods Eng. 25, 263 (2009). 19 C.T. Crowe, M. Sommerfeld, and Y. Tsuji, Multiphase Flows with Droplets and Particles (CRC press,
2011). 20 B. Abramzon and W.A. Sirignano, Int. J. Heat Mass Transf. 32, 1605 (1989). 21 E.N. Fuller, P.D. Schettler, and J.C. Giddings, Ind. Eng. Chem. 58, 18 (1966). 22 R.H. Perry, D.W. Green, and J.O. Maloney, Perry’s Chemical Engineers’ Handbook, 7th Editio (1998). 23 T.E. Daubert and R.P. Danner, Data Compilation Tables of Properties of Pure Compounds (Design
Institute for Physical Property Data, American Institute of Chemical Engineers, 1985). 24 A.B. Liu, D. Mather, and R.D. Reitz, SAE Tech. Pap. Ser. 1, (2010).

37
25 Z. Naumann and L. Schiller, Z Ver Deutsch Ing 77, 318 (1935). 26 W.E. Ranz and J. W. R. Marshall, Chem. Eng. Prog. 48, 141 (1952). 27 J. Fujii, Y. Kumazawa, A. Matsuo, S. Nakagami, K. Matsuoka, and J. Kasahara, Proc. Combust. Inst.
36, 2665 (2017). 28 M. Zhao, C. Matthew, and H. Zhang, Combust. Flame 225, 291 (2020). 29 M.D. Bohon, R. Bluemner, C.O. Paschereit, and E.J. Gutmark, Flow, Turbul. Combust. 103, 271
(2019). 30 M. Zhao and H. Zhang, Fuel 275, 117986 (2020). 31 D. Schwer and K. Kailasanath, in 50th AIAA Aerosp. Sci. Meet. Incl. New Horizons Forum Aerosp.
Expo. (2012), p. 617. 32 https://blog.nus.edu.sg/huangwei/nus-ryrhocentralfoam-solver/. 33 Z. Huang, M. Zhao, and H. Zhang, Fuel 264, 116809 (2020). 34 Z. Huang, M.J. Cleary, and H. Zhang, Phys. Fluids 32, 105120 (2020). 35 Z. Huang and H. Zhang, Appl. Energy 265, 114795 (2020). 36 Z. Huang, M. Zhao, Y. Xu, G. Li, and H. Zhang, Fuel 286, 119402 (2020). 37 H. Jasak, Error analysis and estimation for the finite volume method with applications to fluid flows,
(PhD Thesis, Imperial College London, London, UK, 1996). 38 A. Kurganov, S. Noelle, and G. Petrova, Siam. J. Sci. Comput. 23, 707 (2001). 39 B. van Leer, J. Comput. Phys. 14, 361 (1974). 40 H. Ghassemi, S.W. Baek, and Q.S. Khan, Combust. Sci. Technol. 178, 1031 (2006). 41 H. Watanabe, A. Matsuo, and K. Matsuoka, Proc. Combust. Inst. 37, 3617 (2019). 42 C.K. Westbrook and F.L. Dryer, Combust. Sci. Technol. 27, 31 (1981). 43 S. Liu, J.C. Hewson, J.H. Chen, and H. Pitsch, Combust. Flame 137, 320 (2004). 44 B. Imbert, L. Catoire, N. Chaumeix, G. Dupré, and C. Paillard, Proc. Combust. Inst. 30, 1925 (2005). 45 G.D. Roy, S.M. Frolov, R.J. Santoro, and S.A. Tsyganov, Confined detonations and pulse detonation
engines, (Semenov Inst of Chemical Physics Moscow, 2003). 46 S. Yao and J. Wang, Appl. Therm. Eng. 108, 927 (2016). 47 M. Hishida, T. Fujiwara, and P. Wolanski, Shock Waves 19, 1 (2009). 48 H. Yamashita, M. Shimada, and T. Takeno, in Symp. Combust. (Elsevier, 1996), pp. 27–34. 49 J. Kindracki, Aerosp. Sci. Technol. 43, 445 (2015). 50 V.N. Gamezo, T. Ogawa, and E.S. Oran, Combust. Flame 155, 302 (2008). 51 R. Reitz, At. Spray Technol. 3, 309 (1987). 52 H. Watanabe, A. Matsuo, A. Chinnayya, K. Matsuoka, A. Kawasaki, and J. Kasahara, J. Fluid Mech.
887, (2020).