Embed Size (px)
Citation preview
Full Terms & Conditions of access and use can be found athttp://www.tandfonline.com/action/journalInformation?journalCode=gcmb20
Download by: [Q.-H. Qin] Date: 02 May 2017, At: 12:41
Computer Methods in Biomechanics and BiomedicalEngineering
ISSN: 1025-5842 (Print) 1476-8259 (Online) Journal homepage: http://www.tandfonline.com/loi/gcmb20
Modelling osteoblast adhesion on surface-engineered biomaterials: optimisation ofnanophase grain size
Song Chen, Cheuk Y. Lee, Rachel W. Li, Paul N. Smith & Qing H. Qin
To cite this article: Song Chen, Cheuk Y. Lee, Rachel W. Li, Paul N. Smith & Qing H. Qin (2017)Modelling osteoblast adhesion on surface-engineered biomaterials: optimisation of nanophasegrain size, Computer Methods in Biomechanics and Biomedical Engineering, 20:8, 905-914, DOI:10.1080/10255842.2017.1314468
To link to this article: http://dx.doi.org/10.1080/10255842.2017.1314468
Published online: 07 Apr 2017.
Submit your article to this journal
Article views: 46
View related articles
View Crossmark data

Computer methods in BiomeChaniCs and BiomediCal engineering, 2017Vol. 20, no. 8, 905–914http://dx.doi.org/10.1080/10255842.2017.1314468
Modelling osteoblast adhesion on surface-engineered biomaterials: optimisation of nanophase grain size
Song Chena,c, Cheuk Y. Leea, Rachel W. Lib,c, Paul N. Smithb and Qing H. Qina
aresearch school of engineering, the australian national university, Canberra, australia; btrauma and orthopaedic research laboratory, the australian national university, Canberra, australia; cdepartment of immunology and infectious diseases, the australian national university, Canberra, australia
ABSTRACTA double-layered model is proposed for numerically simulating osteoblast adhesion on surface-engineered biomaterials. The proposed model consists of molecular and cellular motions based on theoretical and experimental evidence and creates predictive simulations from sparse experimental data. The comparison of numerical solutions and experimental data reveals that the proposed model can explain the nonlinear behaviour of osteoblast adhesion on material surfaces in respect to nanophase grain size (0–100 nm). The model further provides insight into the optimisation of nanophase grain size on the surface of the biomaterial.
1. Introduction
Consequent to the demographic changes in society with an ageing population and the corresponding increase in the incidence of the musculoskeletal diseases of ageing such as arthritis and osteoporosis, there is a pressing clinical need to develop new biomaterials for orthopaedic implants. In an ideal situation, these materials would be biocompat-ible, mechanically robust and actively direct osteogenic progenitor cells, such as osteoblasts (bone forming cells).
The interaction between a material substrate and the biological system is complex (Li et al. 2014). The inter-play between the substrate and the extracellular matrix (ECM) determines the cell response. In vitro and in vivo experimentation about materials and osteoblast cellular responses to the substrate are expensive and time-con-suming. Thus far because of the inherent complexity of the biological milieu, there is no alternative to these experiments and strategies in attempting to predict the response to a biomaterial at the cellular level. Therefore, creating mathematical models of osteoblast responses to implantable biomaterials is becoming increasingly pop-ular as a strategy in biomaterial and drug development. As an alternative to experimental approaches, a robust mathematical model will facilitate more efficient optimi-sation of the molecular interface between material surface and osteoblasts.
The development of a bone-implant biomaterial depends on the interactions of osteoblasts and material surfaces. The quality of cell and material interactions influences cellular proliferation and differentiation (Arifin et al. 2014). In surface engineering of biomaterials, the main strategy for enhancing the interactions between the cell and the material surface is to modulate the proper-ties of the material surface, such as surface charge and roughness, to a state in which ECM adhesion proteins can appropriately function (Ma et al. 2007). Experiments highlight the importance of optimising the roughness of the material surface in vitro and in vivo. (Deligianni et al. 2000) investigated the effect of surface roughness of hydroxyapatite (HA) on human bone marrow cells and found that cell adhesion, proliferation and detachment strength were sensitive to the surface roughness of HA. Intriguingly, osteoblast adhesion and proliferation appear to vary nonlinearly with the roughness of the material surface. Webster et al. (2000) reported that osteoblast proliferation was significantly greater on nanophase alu-mina and titanium. Their experiment (Webster et al. 1999) also showed that the ability of osteoblasts to adhere to these materials was not proportional to the reduction in grain size. Also, Huang et al. (2013) observed that sig-nificant enhancements of osteoblast adhesion, prolifera-tion, maturation and mineralisation were exhibited on the
KEYWORDSmathematical model; cell adhesion; material surface; osteoblast; nanophase grain size
ARTICLE HISTORYreceived 26 april 2016 accepted 29 march 2017
© 2017 informa uK limited, trading as taylor & Francis group
CONTACT Qing h. Qin [email protected]
906 S. CHEN ET AL.
constructed a multiscale model by PTH and TGF-β. A family of bone remodelling formulations were developed by concerning mechanical (Qin & Ye 2004; Qin et al. 2005) and electromagnetic loads (Qu et al. 2006). Komarova (2005) proposed a group of ordinary differential equations for predicting the proliferation of osteoblasts under the net effect of autocrine and paracrine signalling.
In this article, we develop a predictive mathematical model to investigate cell adhesion of osteoblasts on mate-rial surfaces of nano-grain size in Section 2 and 3. Using this model, we identify the osteoblast adhesion on two different material surfaces in Section 4. Furthermore, we investigate the functional importance of specific grain sizes at the nanophase in Section 5.
2. Governing equations for osteoblast adhesion on material surface
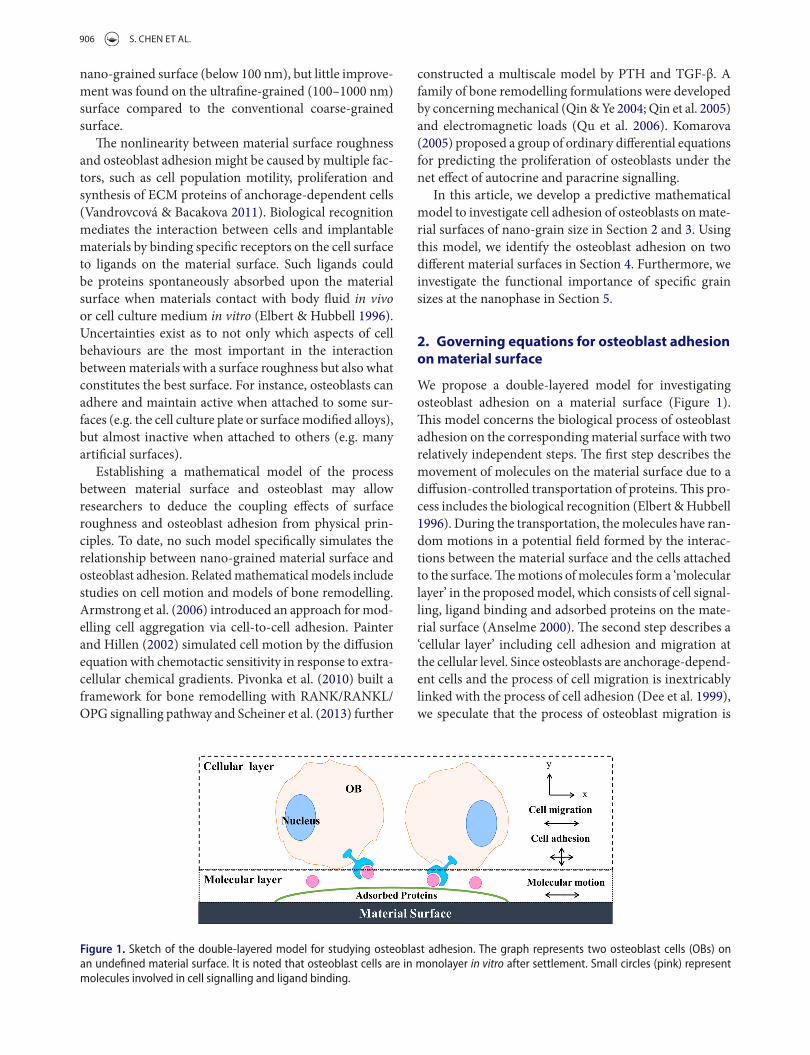
We propose a double-layered model for investigating osteoblast adhesion on a material surface (Figure 1). This model concerns the biological process of osteoblast adhesion on the corresponding material surface with two relatively independent steps. The first step describes the movement of molecules on the material surface due to a diffusion-controlled transportation of proteins. This pro-cess includes the biological recognition (Elbert & Hubbell 1996). During the transportation, the molecules have ran-dom motions in a potential field formed by the interac-tions between the material surface and the cells attached to the surface. The motions of molecules form a ‘molecular layer’ in the proposed model, which consists of cell signal-ling, ligand binding and adsorbed proteins on the mate-rial surface (Anselme 2000). The second step describes a ‘cellular layer’ including cell adhesion and migration at the cellular level. Since osteoblasts are anchorage-depend-ent cells and the process of cell migration is inextricably linked with the process of cell adhesion (Dee et al. 1999), we speculate that the process of osteoblast migration is
nano-grained surface (below 100 nm), but little improve-ment was found on the ultrafine-grained (100–1000 nm) surface compared to the conventional coarse-grained surface.
The nonlinearity between material surface roughness and osteoblast adhesion might be caused by multiple fac-tors, such as cell population motility, proliferation and synthesis of ECM proteins of anchorage-dependent cells (Vandrovcová & Bacakova 2011). Biological recognition mediates the interaction between cells and implantable materials by binding specific receptors on the cell surface to ligands on the material surface. Such ligands could be proteins spontaneously absorbed upon the material surface when materials contact with body fluid in vivo or cell culture medium in vitro (Elbert & Hubbell 1996). Uncertainties exist as to not only which aspects of cell behaviours are the most important in the interaction between materials with a surface roughness but also what constitutes the best surface. For instance, osteoblasts can adhere and maintain active when attached to some sur-faces (e.g. the cell culture plate or surface modified alloys), but almost inactive when attached to others (e.g. many artificial surfaces).
Establishing a mathematical model of the process between material surface and osteoblast may allow researchers to deduce the coupling effects of surface roughness and osteoblast adhesion from physical prin-ciples. To date, no such model specifically simulates the relationship between nano-grained material surface and osteoblast adhesion. Related mathematical models include studies on cell motion and models of bone remodelling. Armstrong et al. (2006) introduced an approach for mod-elling cell aggregation via cell-to-cell adhesion. Painter and Hillen (2002) simulated cell motion by the diffusion equation with chemotactic sensitivity in response to extra-cellular chemical gradients. Pivonka et al. (2010) built a framework for bone remodelling with RANK/RANKL/OPG signalling pathway and Scheiner et al. (2013) further
Figure 1. sketch of the double-layered model for studying osteoblast adhesion. the graph represents two osteoblast cells (oBs) on an undefined material surface. it is noted that osteoblast cells are in monolayer in vitro after settlement. small circles (pink) represent molecules involved in cell signalling and ligand binding.
COMPUTER METHODS IN BIOMECHANICS AND BIOMEDICAL ENGINEERING 907
highly dependent on the process of osteoblast adhesion at the ‘cellular layer’. We also assume that the osteoblast adhesion is related to the ‘molecular layer’ because the extracellular matrix (ECM) and specific transmembrane receptor (e.g. integrins) contribute critically to the cell adhesion (Anselme et al. 2010).
We introduce a local coordinate to describe behaviours of the model on a material surface. In the horizontal direc-tion (x-axis) of the molecular layer, the model describes the molecular motion by its probability distribution. Similarly, the model describes the process of cell migration by a cellular probability distribution. Then we separate the cell adhesion into two variables in the vertical direction (y-axis). One variable represents the interaction between the material surface and the molecular layer. Another variable represents the interaction between the molecu-lar layer and the cellular layer. Finally, the model links the variables in the vertical direction with the probability distribution of cells and molecules in the horizontal direc-tion. The double-layered model consequently studies the osteoblast adhesion on a material surface by identifying the probability distribution of molecules and cells. Based on the assumptions above, we apply continuum mathe-matical descriptions to finding the probability distribu-tion of molecules and cells. The descriptions assume the motions of molecules and cells in stochastic processes, which lead to the Fokker–Planck equations of stochastic processes for the probability density of molecules pm and cells pc.
where α and � refer to the environmental sensitivities of molecules and cells, which determine their motions under external perturbations. β and κ refer to the corresponding diffusion coefficients indicating the random walk. We then consider the influence of the cell adhesion and adsorbed proteins on the horizontal motions of molecules and cells,
where path modulator ω expresses modification from the vertical components (ω1 in the molecular layer and ω2 in the cellular layer). The vertical components work on the horizontal motions through friction and prevent the dis-persion of horizontal motions. Consequently, the vertical components are considered to modify the environmental
(1)
⎧⎪⎨⎪⎩
�pm
�t=
�
�x
��
�pm
�x− pm�
�
�pc
�t=
�
�x
��
�pc
�x− pc�
�
(2)
⎧⎪⎨⎪⎩
�pm
�t=
�
�x
��
�pm
�x− pm�(�1)
��1
�x
�
�pc
�t=
�
�x
��
�pc
�x− pc�(�2)
��2
�x
�
sensitivities of molecules and cells in a negative way about the diffusion. The microscopic functions of environmental sensitivities α and � are unknown at this stage correspond-ing to the path modulators ω1 and ω2. One character of path modulators ω1 and ω2 is that they continuously affect the interplay of the material surface, molecular layer and cellular layer. If we set a material surface property such as roughness by a parameter R, the probability density of molecules pm and cells pc are bounded by conditions such that
Together with Equations (2) and (3), mathematical descriptions of Figure 1 are established as followings. The material surface property can affect the molecular motions at the molecular layer and further affect cellular motions at the cellular layer. Osteoblast adhesion works as the transmission during this progress, deciding how strongly the double-layered system are disturbed.
3. Numerical solution methods for the double-layered model
Using the Ornstein–Uhlenbeck process as a reference for defining the motion of the molecular layer, we attempt to obtain a numerical solution of the model in Section 2. The Ornstein–Uhlenbeck process describes the velocity of diffusing particles under the influence of friction, in which there is a random walk tendency to move towards a cen-tral location. Here we assume that the molecular motions follow a standard process, thereby creating a probability distribution of molecules. The probability density of mol-ecules pm of the Ornstein–Uhlenbeck process satisfies
where α is environmental sensitivity and β is the diffusion coefficient of the molecular layer. Taking x0 = 0 for sim-plicity, the initial condition of Equation (4) is
Alternatively, the environmental sensitivity of molecules can be expressed as
We substitute Equation (6) into Equation (5) and solve the stationery solution,
(3)
{pm = f (R,�1, �)
pc = f (R,�1,�2, �)
(4)�pm�t
= �(�1)�
�x
[(x − x0)pm
]+ �
�2
�x2pm
(5)pm =
√�(�1)
2��(1 − e−2�(�1)t)exp
[−�(�1)x
2
2�(1 − e−2�(�1)t)
]
(6)�∗ = �(�1)∕�
(7)pm(x) =
√�∗
2�exp
(−�∗x2
2
)
908 S. CHEN ET AL.
Substituting Equation (11) into Equation (10) gives
Equations (13) are unconditionally stable for 0 ≤ pi(t) ≤ 1. For matching the experiment data, the probability den-sity of cells is converted to the cell density per unit area. We estimate the probability density of cells at the discrete position i and integrate the probability density by a circu-lar domain on the assumption that the cellular probability density pc is equal at each position with the same radius r (Figure 3).
where P0 is the initial cell density at i = 0, t = 0. x and t denote the spatial and temporal variables respectively. The number of points i is determined by the scale of the studied cell. The cell density Pk is the integration of cellular probability density pc.
4. Numerical solution on nano-grained surface based on experimental data
In this section, we used our model to simulate osteoblast adhesion on two different material surfaces of nanophase grain size by inputting the published experimental results (Webster et al. 1999). Webster et al. provided evidence that osteoblast adhesion enhanced on nanophase alumina (Al2O3) and titania (TiO2) in vitro. The method of eval-uating cell adhesion was to lift osteoblasts enzymatically using trypsin and to count the number of adherent cells in five random fields per substrate. The authors observed that the number of adherent osteoblasts increased with time, and the cell density of adherent osteoblasts varied on the surfaces of alumina and titania with different grain sizes. From their observation, they concluded that an increase in
(13)
⎧⎪⎨⎪⎩
dpi(t)∕dt + [pi(t)f1(t) − (1 − pi(t))f2(t)]∕h2 = 0
f1(t) = (1 − pi+1(t))(1 − �∗pi−1(t)) + (1 − pi−1(t))(1 − �∗pi+1(t))
f2(t) = pi−1(t)(1 − �∗pi−2(t)) + pi+1(t)(1 − �∗pi+2(t))
(14)Pk(t) = P0 ∫r
0
2�xpcdx
If the alternative environmental sensitivity of the molec-ular layer is dependent on the material surface property R, we obtain
Based on Equations (7) and (8), the surface property may hinder molecular motions and alter the molecular probability density. For the continuity, the initial cellular distribution should inherit the characteristics of the final molecular distribution. Thus, we assume the initial prob-ability density of osteoblasts to be approximately equal to the stationary probability density of molecules.
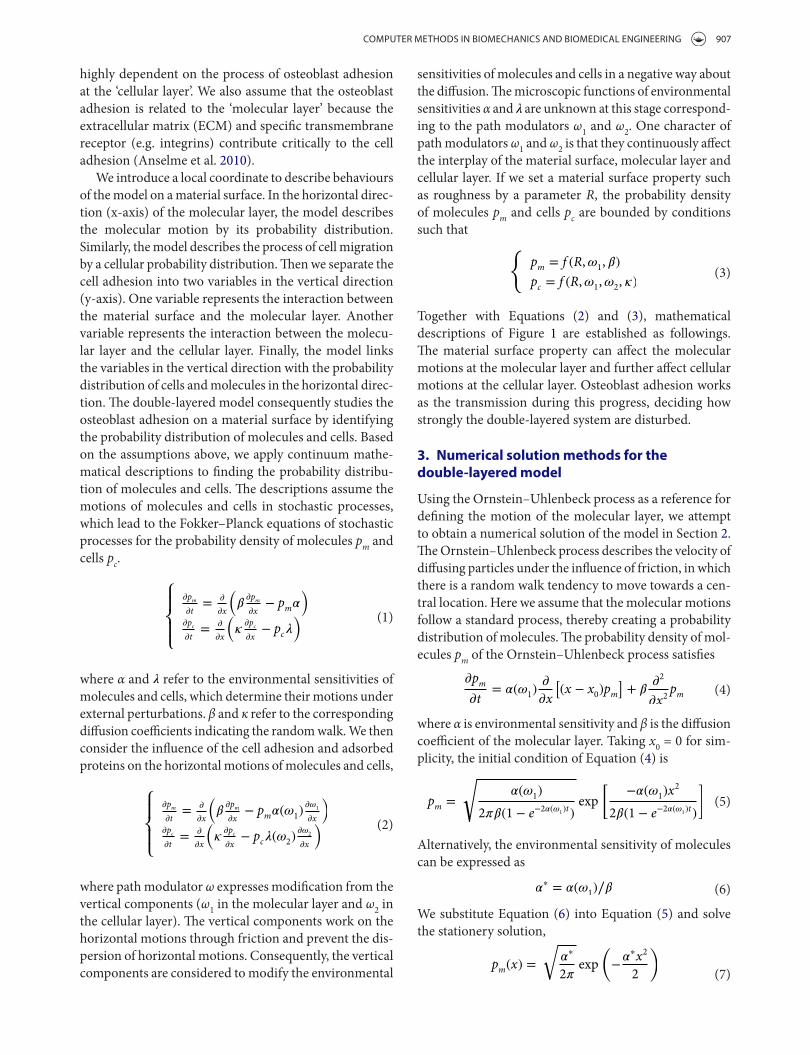
where pc(t0) is the initial solution for cellular probability density. Considering the evolution of the cell probability density pc in Equations (2) and (3), we find that the com-plexity of osteoblast adhesion leads to inhomogeneous cell distribution in the cellular layer. Using the approach of Stevens and Othmer (1997), we aim to generalise an inhomogeneous distribution for a continuous-time dis-crete-space random walk along the horizontal direction. This method restricts the time evolution to one-step time jumps and postulates the discrete quantity pi(t) as an approximation to cellular probability density pc at the position xi = ih, i ∈ � as well as time t beginning at i = 0, t = 0. Thus, pi(t) evolves in a manner such that
Here Γ−i denotes the transitional probability that cells enter
from i − 1 to i, and Γ+i denotes the transitional probability
that cells leave from i to i + 1 (Figure 2). The Equation (10) is highly dependent on the form of transitional probabil-ities Γ±
i that reflect physical parameters of the cell type
under investigation. In the context of the movement of osteoblasts, the transitional probabilities Γ±
i are deter-
mined by the ambient cellular probability density pi±1, the cellular environmental sensitivity � and the diffusion coefficient κ. The cellular environmental sensitivity � and diffusion coefficient κ work in a complex to prevent cells moving from the present position. Then, a simple form of Γ±
i may be constructed as
where �∗ represent the complex of the cellular environ-mental sensitivity � and diffusion coefficient κ which is like the alternative environmental sensitivity of molecules �∗. The alternative environmental sensitivity of cells �∗ inherits the correlation with surface property R from � as
(8)�∗ = fm(R)
(9)pc(x, t0) = pm(x)
(10)
dpi(t)∕dt =[Γ+i−1pi−1(t) − Γ−
i pi(t)]− [Γ+
i pi(t) − Γ−i+1pi+1(t)]
(11)Γ±i= (1 − pi±1)(1 − �∗pi∓1)∕h
2
(12)�∗ = fc(R)
Figure 2. Change of cellular probability density pi(t) during Δt. it indicates the difference between cells that stay at the transitional site from i − 1 to i and cells that stay at the transitional site from i to i + 1.

COMPUTER METHODS IN BIOMECHANICS AND BIOMEDICAL ENGINEERING 909
modified functions of molecular and cellular sensitivities by curve fitting. For alumina, the functions were cellular sensitivity �∗
Al = 0.24 + 0.11 exp(−0.018R) (Figure 5(a)) and molecular sensitivity �∗
Al = 2.27 − 0.90 exp(−0.027R) (Figure 5(b)). The functions for titania were found for cellular sensitivity �∗
Ti = 0.17 + 0.11 exp(−0.027R) and molecular sensitivity �∗
Ti = 1.37 − 1.29 exp(−0.02R) . For both alumina and titania, the molecular sensitivity increased with grain size whereas the cellular sensitivity decreased with grain size. We checked the correlation of exponential fitting for both materials (Table 1) and found that the sensitivity functions for titania had better con-sistency with the experimental data. The experimental data varied around the sensitivity functions of alumina, in particular for the cellular layer. These results may imply that the cell adhesion on titania might be stable whereas
osteoblast adhesion could be accompanied by a decrease in alumina and titania grain size.
Since the osteoblast size was around 20 μm (Wheeless’ Textbook of Orthopaedics 1996), 250 osteoblasts could be arrayed along a radius of 0.5 cm. In 1 cm2, the size was set at 500 points. The model was initialized with molec-ular sensitivity �∗ and cellular sensitivity �∗ by fitting the experimental data of adherent osteoblasts on alumina and titania. As an example, the model fitted the exper-imental results with �∗ = 2.2 and �∗ = 0.26 on alumina of grain size 77 nm (Figure 4(a)), and with �∗ = 0.6 and �∗ = 0.22 on titania of grain size 32 nm (Figure 4(b)). We then fitted the data for each grain size of alumina and titania in the experiment. All �∗ and �∗ were plotted along grain sizes to determine the functions of molecular and cellular sensitivities. Trendlines were added to find the
Figure 3. discrete distribution of cellular probability density on the interval [0, r]. this interval is separated into n subintervals of length h = r∕n, with endpoints xi = ih, i = 0, 1, …, n. the probability density at a point xi is denoted by pxi (t), and the sketch of an algorithm is shown aside for solving Pk.
Figure 4. two examples of experiment data fitting. (a) Fitting experimental data for 77 nm grain size alumina. (b) Fitting experimental data for 32 nm grain size titania. the time scale used 400 time-step to match 4 h experiment time.

910 S. CHEN ET AL.
predicted results inspired us to think about the existence of critical grain size on alumina and titania in the follow-ing section.
5. Comparison with experimental data and prediction
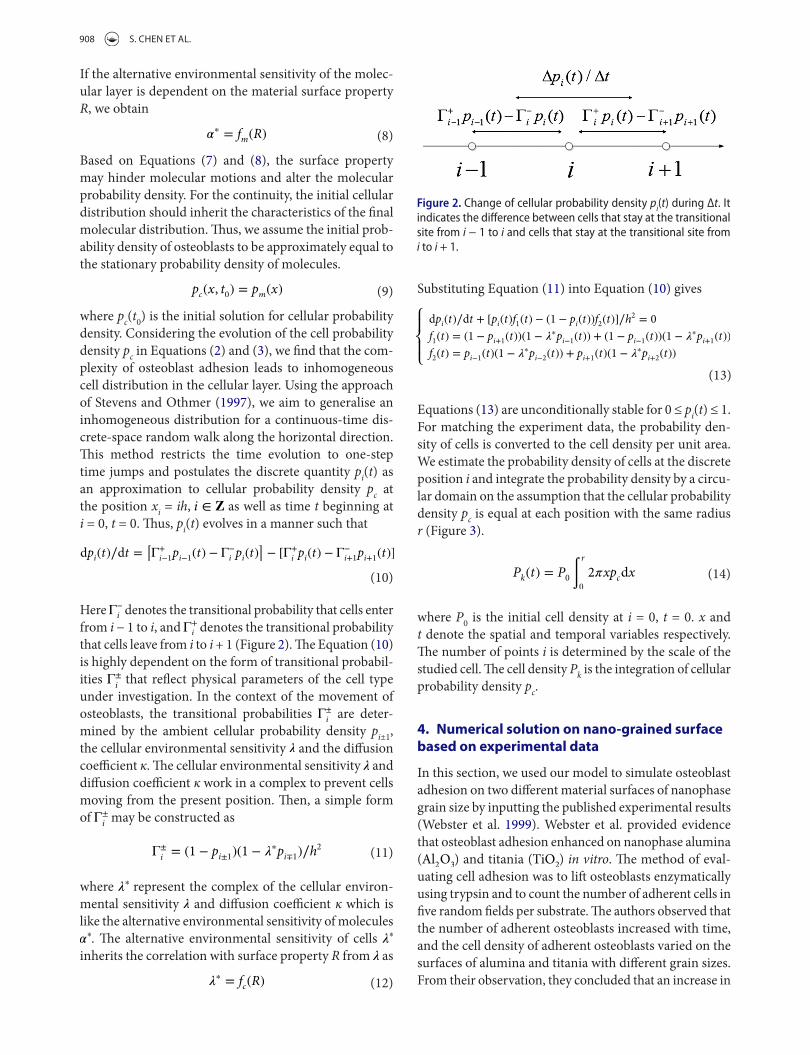
In this section, we compare the numerical results from the proposed model with the original experimental results (Webster et al. 1999). The numerical results reflect the his-torical profile of adherent cell density with time and grain size (Figure 6). Here we focus on discussing the influence of grain size on the adherent cell density. The numerical result of adherent cell density on alumina matches the Webster’s experimental data (Figure 7(a)). The adherent cell density is significantly greater on alumina with grain sizes in the range 0–40 nm than on alumina with grain sizes in the range 60–100 nm. Moreover, there is an expo-nential decay on alumina with grain sizes 40–60 nm. The numerical result on titania also agrees with the exper-imental data (Figure 7(b)). The adherent cell density is significantly greater on titania with grain sizes in the range 0–20 nm and followed by a linear decay from 20 to 100 nm. Webster et al. observed in their experiments that variation existed in the adherent cell density of adherent osteoblasts per grain size and concluded that there might
the cellular motions of osteoblasts on alumina are likely to be affected by the external perturbation.
Based on the modified functions (Figure 5), we recal-culated the model to show the cell adhesion in the profile of adherent cell density with both time and grain size. We further draw the profile with different colours indi-cating the various cell density. As can been seen, although both the cell density of adherent osteoblasts on alumina (Figure 6(a)) and titania (Figure 6(b)) increased with time, their paths were predicted to be in different ways. The predicted adherent cell density on alumina was observed that the adherent cell density keeps at the same number in the beginning, but the duration varied from 1 to 2 h in the range of grain size from 0 to 100 nm (Figure 6(a)). The duration approximately reached the average 1.5 h when the grain size was 35 nm. Then the predicted adherent cell density increased quickly and reached 3200 cells/cm2 after 4 h. This process was fast when the grain size of alumina under 40 nm. In contrast to the alumina, the predicted adherent cell density on titania increased in a lag phase but varied on the grain size (Figure 6(b)). When the grain size of titania was beyond 40 nm, the predicted adherent cell density increased in a linear approximation of time. Between 10 and 40 nm, the predicted path showed a simi-lar trend with that of alumina. Under 10 nm, the predicted adherent cell density appeared no longer to increase. The
Figure 5. Function determination for molecular and cellular sensitivity in grain size. (a) cellular sensitivity to alumina and titania; (b) molecular sensitivity to alumina and titania.
Table 1. Correlation of exponential fitting for sensitivities to alumina and titania in the model.
Exponential fitting Standard error
R-squarey = y0 + a * exp (b * x) y0 a balumina, molecular layer 0.0609 0.254 0.0109 0.914alumina, cellular layer 0.0152 0.0342 0.0127 0.821titania, molecular layer 0.123 0.0759 0.0063 0.987titania, cellular layer 0.0124 0.0167 0.0128 0.951
COMPUTER METHODS IN BIOMECHANICS AND BIOMEDICAL ENGINEERING 911
experimental data implied a range of the critical grain size for titania from 32 to 56 nm, whereas the model pre-dicts a continuous decline of adherent cell density from 30 to 100 nm. Further experiments, particularly examining grain sizes in the range of 40–70 nm, may well clarify this issue further.
The model surprisingly indicates that adherent cell density on titania drops significantly with the grain size smaller than 10 nm. There is limited published experi-mental data regarding culturing osteoblasts on a substrate surface made of titania with grain size under 10 nm. Park et al. (2009) demonstrated that the one-dimensional surface nano-topography of 15 nm titania nanotubes promoted osteoblast formation. They evaluated the
be a critical grain size of alumina and titania in mediat-ing osteoblast adhesion. A critical grain size here can be defined as a point on the axis of grain size in which the slope of adherent cell density and grain size dependence significantly changes. On alumina, our model identifies two critical grain sizes at 36 and 60 nm, an observation which agrees on the with the conclusion of Webster et al. that there may be a critical grain size between 49 and 67 nm. Moreover, our model predicts a critical grain size at 36 nm with cell density 3042 cells/cm2. This potential interaction between grain size and adherent cell density has not previously been identified. In contrast to the find-ings for alumina, our model predicts a different interac-tion between the osteoblast and titania. The Webster’s
Figure 6. numerical solutions for alumina and titania. (a) profile of adherent cell density on alumina with the scale of time and nanophase grain sizes and (b) profile of adherent cell density on titania with the scale of time and nanophase grain sizes. the colour bar represents the number of cell density (cells/cm2).

912 S. CHEN ET AL.
surfaces (Minagar et al. 2013). On the other hand, theo-retically, smaller grain sizes provide a more available sur-face area of higher energy to promote protein (specifically vitronectin and fibronectin) interactions for osteoblast adhesion (Sato et al. 2008).
The optimal spacing may well represent a combination of the coupling of focal contacts and topography between osteoblasts and material surfaces. The topography is a function not only of the material surface itself but also of the adherent protein layer intimate with that surface. The focal contacts at the protein layer can create an optimal
adhesion, spreading and growth of osteoblasts on the surface of titania nanotubes from 15 to 100 nm diame-ters. Cells were found to adhere and proliferate best on 15 nm tubes, and the adhesion decreased with an increase in the nanotube diameter. Although the topography of nanophase ceramic is different from the nanotube, it has been speculated that an optimal spacing between cell and substrate exists for osteoblast adhesion on titania. The putative optimal spacing may derive from focal con-tacts or adhesion plaques, which are junction locations of about 10–15 nm between adherent cells and material
Figure 7. Comparison of numerical results and experimental data. (a) Critical points for alumina at grain sizes 36 and 60 nm and (b) the critical points for titania at grain size 10 and 5 nm. the enlarged part shows the decline in adherent cell density on titania below the grain size 16 nm.
COMPUTER METHODS IN BIOMECHANICS AND BIOMEDICAL ENGINEERING 913
Dee KC, Andersen TT, Bizios R. 1999. Osteoblast population migration characteristics on substrates modified with immobilized adhesive peptides. Biomaterials. Feb 01;20:221–227.
Deligianni DD, Katsala ND, Koutsoukos PG, Missirlis YF. 2000. Effect of surface roughness of hydroxyapatite on human bone marrow cell adhesion, proliferation, differentiation and detachment strength. Biomaterials. 22:87–96.
Elbert DL, Hubbell JA. 1996. Surface treatments of polymers for biocompatibility. Annu Rev Mater Sci. 26:365–394.
Huang R, Lu S, Han Y. 2013. Role of grain size in the regulation of osteoblast response to Ti–25Nb–3Mo–3Zr–2Sn alloy. Colloids Surf B: Biointerfaces. 11;111:232–241.
Komarova SV. 2005. Mathematical model of paracrine interactions between osteoclasts and osteoblasts predicts anabolic action of parathyroid hormone on bone. Endocrinology. Aug 1;146:3589–3595.
Li RW, Kirkland NT, Truong J, Wang J, Smith PN, Birbilis N, Nisbet DR. 2014. The influence of biodegradable magnesium alloys on the osteogenic differentiation of human mesenchymal stem cells. J Biomed Mater Res A. Dec;102:4346–4357.
Ma Z, Mao Z, Gao C. 2007. Surface modification and property analysis of biomedical polymers used for tissue engineering. Colloids Surf B: Biointerfaces. Nov 15;60:137–157.
Minagar S, Wang J, Berndt CC, Ivanova EP, Wen C. 2013. Cell response of anodized nanotubes on titanium and titanium alloys. J Biomed Mater Res Part A. 101A:2726–2739.
Painter KJ, Hillen T. 2002. Volume-filling and quorum-sensing in models for chemosensitive movement. Can Appl Math Quart. 10:501–543.
Park J, Bauer S, Schlegel KA, Neukam FW, von der Mark K, Schmuki P. 2009. TiO2 nanotube surfaces: 15 nm – an optimal length scale of surface topography for cell adhesion and differentiation. Small. 5:666–671.
Pivonka P, Zimak J, Smith DW, Gardiner BS, Dunstan CR, Sims NA, John Martin T, Mundy GR. 20101/21. Theoretical investigation of the role of the RANK–RANKL–OPG system in bone remodeling. J Theor Biol. 262:306–316.
Qin QH, Ye JQ. 2004. Thermoelectroelastic solutions for internal bone remodeling under axial and transverse loads. Int J Solids Struct. 41:2447–2460.
Qin QH, Qu C, Ye JQ. 2005. Thermoelectroelastic solutions for surface bone remodeling under axial and transverse loads. Biomaterials. 26:6798–6810.
Qu C, Qin QH, Kang Y. 2006. A hypothetical mechanism of bone remodeling and modeling under electromagnetic loads. Biomaterials. 27:4050–4057.
Sato M, Aslani A, Sambito MA, Kalkhoran NM, Slamovich EB, Webster TJ. 2008. Nanocrystalline hydroxyapatite/titania coatings on titanium improves osteoblast adhesion. J Biomed Mater Res Part A. 84A:265–272.
Scheiner S, Pivonka P, Hellmich C. 2013. Coupling systems biology with multiscale mechanics, for computer simulations of bone remodeling. Comput Methods Appl Mech Eng. Feb;254:181–196.
Stevens A, Othmer HG. 1997. Aggregation, blowup, and collapse: The ABC’s of taxis in reinforced random walks. SIAM J Appl Math. 57:1044–1081.
Vandrovcová M, Bacakova L. 2011. Adhesion, growth and differentiation of osteoblasts on surface-modified materials developed for bone implants. Physiol Res. 60:403–417.
spacing where the osteoblast adhesion is the highest, and adhesion is reduced if the spacing becomes either smaller or larger. The spacing is altered by factors such as the thickness or the composition of adsorbed proteins, both of which are highly dependent on the grain size of the material surface. Smaller grain sizes promote protein interactions so that they form a thicker layer. This poten-tial mechanism may explain the trends seen in the model’s predicted curve of alumina with optimal grain sizes in the range 36–60 nm (Figure 7(a)) and of titania with grain sizes in the range 10–100 nm (Figure 7(b)). It is notable that these predicted curves of both alumina and titania show stable trends with increasing grain sizes beyond the above predicted critical values. This finding agrees with the previous experimental observation (Huang et al. 2013) as well as with the considerable clinical experience of the effective usage of both these biomaterials where grain size is not homogeneous in the end-use product. Other factors apart from nanophase grain size may also play a role in cell-substrate adhesion. The surface topog-raphies of alumina and titania differ, with the arrange-ment of alumina grains being more linear than that on the titania surface. As cell-substrate adhesion includes integrins that have nanoscale features, cells will respond to surfaces with nanoscale characteristics of the pores, ridges and fibres of the basement membranes (Yim & Leong 2005).
6. Conclusion
We present a model that, built on experimental data, is capable of quantitatively analysing osteoblast adhesion. The model demonstrates satisfactory concordance with the observations from experimental data. This finding may support the use of such modelling as a tool for screen-ing materials about biocompatibility.
Disclosure statement
No potential conflict of interest was reported by the authors.
References
Anselme K. 2000. Osteoblast adhesion on biomaterials. Biomaterials. 21:667–681.
Anselme K, Ploux L, Ponche A. 2010. Cell/material interfaces: influence of surface chemistry and surface topography on cell adhesion. J Adhes Sci Technol. Jan 01;24:831–852.
Arifin A, Sulong AB, Muhamad N, Syarif J, Ramli MI. 2014. Material processing of hydroxyapatite and titanium alloy (HA/Ti) composite as implant materials using powder metallurgy: a review. Mater Des. 55:165–175.
Armstrong NJ, Painter KJ, Sherratt JA. 2006. A continuum approach to modelling cell–cell adhesion. J Theor Biol. 243:98–113.

914 S. CHEN ET AL.
Wheeless CR. 1996. Wheeless’ textbook of orthopaedics. Available from: http://www.wheelessonline.com.
Yim EKF, Leong KW. 2005. Significance of synthetic nanostructures in dictating cellular response. Nanomed: Nanotechnol, Biol Med. Mar;1:10–21.
Webster TJ, Siegel RW, Bizios R. 1999. Osteoblast adhesion on nanophase ceramics. Biomaterials. 20:1221–1227.
Webster TJ, Ergun C, Doremus RH, Siegel RW, Bizios R. 2000. Enhanced functions of osteoblasts on nanophase ceramics. Biomaterials. 21:1803–1810.


![Yong-Peng Lei, Hui Wang and Qing-Hua Qin ...users.cecs.anu.edu.au/~Qinghua.Qin/publications/pap310E...composite, such as particle size, shape, and distribu-tion [27]. Later, the effect](https://img.pdfslide.us/doc/110x75/60c6acb5129b8e1d6c6757ff/yong-peng-lei-hui-wang-and-qing-hua-qin-userscecsanueduau-composite.jpg)
![Topology optimization for concurrent design of structures ...users.cecs.anu.edu.au/~Qinghua.Qin/publications/... · macro structural and microstructural designs [4,5]. Having regard](https://img.pdfslide.us/doc/110x75/5f2f3a4af2a02e7fff231c08/topology-optimization-for-concurrent-design-of-structures-userscecsanueduau.jpg)

![Green’s-function-based-finite element analysis of fully ...users.cecs.anu.edu.au/~Qinghua.Qin/publications/pap279-JMST.pdf · clude those for isotropic heat conduction [8], isotropic,](https://img.pdfslide.us/doc/110x75/5b8328757f8b9a64618c801e/greens-function-based-finite-element-analysis-of-fully-userscecsanueduau.jpg)