Embed Size (px)
Citation preview

Modelling of Toll Roads KUALA LUMPUR region Malaysia
Presentation to Emme/2 users Group Brisbane April 2004

Bio-data -- John Mundy
• Degrees in Transport Planning and Computer Science;
• 10 years with UK Local Authority;
• 11 years with consultants (the MVA Group) - resided in Europe, Hong Kong and Malaysia;
• 9 years with Malaysian “construction group” / toll road operator;
• 5 months back into consultancy with SKM.
Major Projects / Achievements
• Simulation of in-street LRT running Hong Kong
• Airport Rail Link planning Hong Kong;
• Development and implementation of privatised toll roads in Malaysia;
• Talk today will focus on the latter and the application of Emme / 2 to deriving traffic and revenue forecasts.
Malaysia - “in brief”
• Modern day Malaysia was driven by former Prime Minister Mahathir;
• He recognised the need for mobilisation of private sector in partnership with the public sector;
• In period mid 80’s to mid 90’s GDP grew at annual rates of around 7% to 10%.
• Obvious need for infrastructure.
• Klang Valley - the economic engine 35% of national GDP.
Klang Valley - KL Region
• Some 20% of Malaysia’s population
• About 40% of nations cars - car ownership now approaching 0.3 per head.
• National car project(s) fuelled the rapid growth through late 80’s to mid 90’s;
• Early 1990’s road congestion was an issue and received a lot of press coverage;
• In last 10 years private sector investment in rail and road has successfully (relatively) contained the ills of congestion
Klang Valley - “Toll” city
• Since the early 1990’s the KL region has seen construction of:-
• over 400 kilometres of toll road (mostly dual 3 lanes)
• imposition of 40 toll plazas
• Many different concessions, but a couple of key players:-
• PLUS operating North-South Highway “through” the region and the Federal Route 2;
• Litrak / Gamuda - 3 highways comprising of 130 kilometres and 10 plazas in operation. SMART under construction.

1. Shah Alam Expressway
Won by competitive tender
Capital costs of AUS$ 400 million.
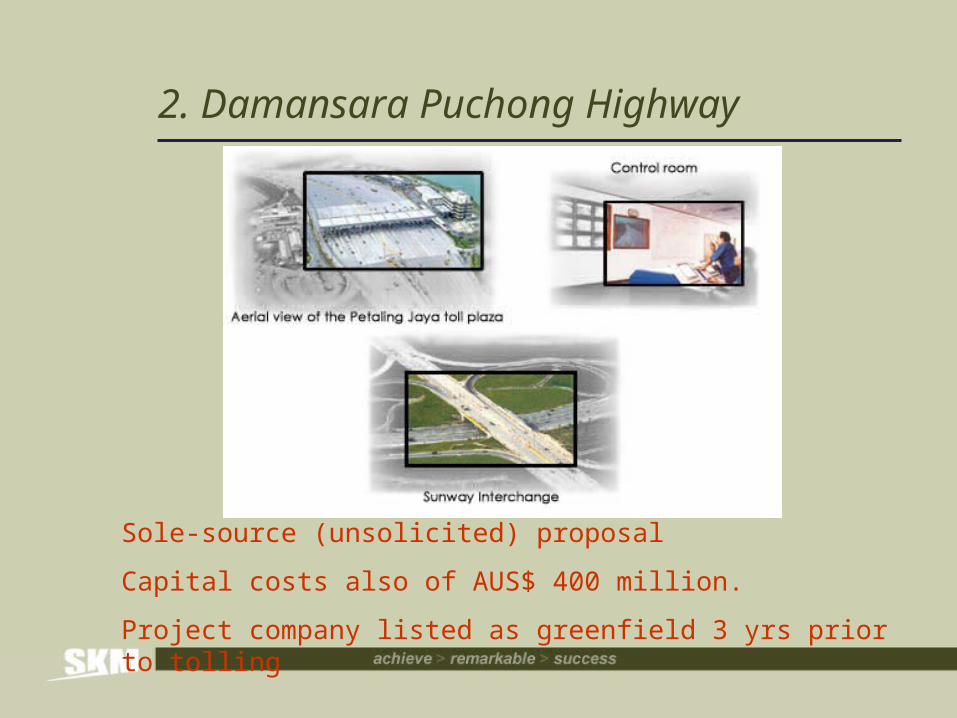
2. Damansara Puchong Highway
Sole-source (unsolicited) proposal
Capital costs also of AUS$ 400 million.
Project company listed as greenfield 3 yrs prior to tolling

3. Sprint Highway
Sole-source (unsolicited) proposal
Capital costs of AUS$ 500 million.
Project has Malaysia’s 1st urban double deck structure and dual 3 lane tunnel

Modelling the Klang Valley
• Gamuda / Litrak identified the needs and opportunities an in-house transport section could answer;
• Aim was to “protect, enhance existing assets and to search for & identify new opportunities”;
• “beauty contest” of 5 consultants conducted in 1996, with 4 nominating Emme/2 as the platform
• model has developed over the last 7 years - more complexity added to bring “forecast” volumes fully in line with “actuals”.
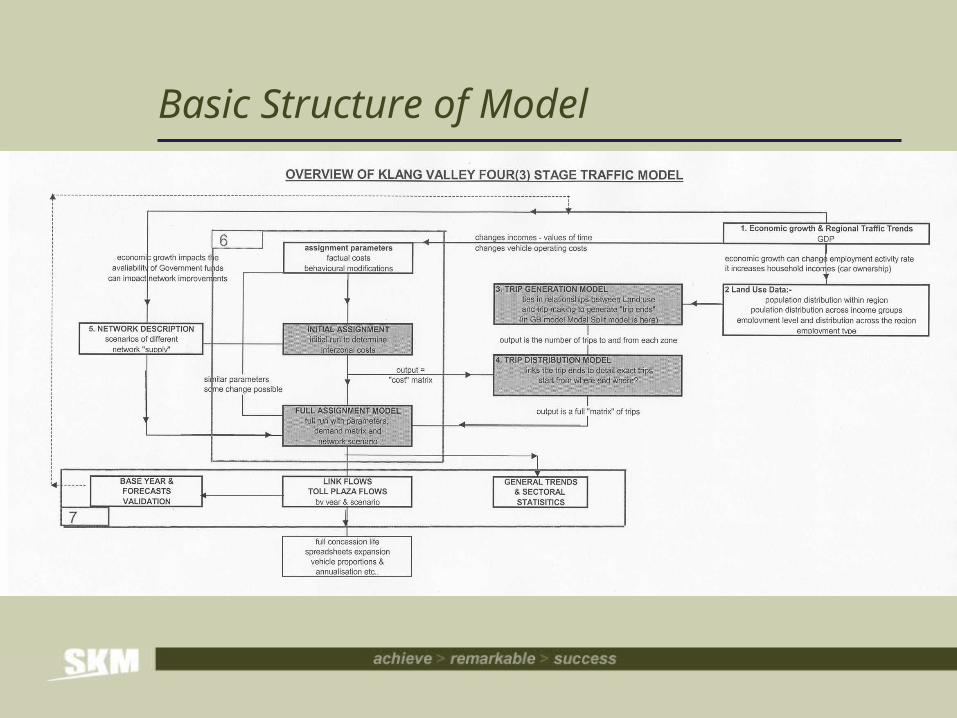
Basic Structure of Model

Simple Model in 1996
• Land use breakdown - population / employment
• Two vehicle types - privates and goods
• Matrix Estimated from counts
• 1 typical hour assignment - simple link and node network

More Complex Model by 2003
• Land use breakdown - population by four income groups / employment by six activity types
• Trip generation of 13 categories (4 incomes by 3 purposes for privates; goods)
• Trip distribution introduced, calibrated against roadside survey data and independent screenline counts.

More Complex Model by 2003
• Assignment of 10 separate matrices each with own values-of-time (9 privates and goods)
• Peak and inter-peak with appropriate weighting and combination to form daily forecasts.
•Junction delay modelling - both signalised and priority (including ramp entries)
Signalised Junction Modelling
• Total signalised junction capacity based on number of lanes approaching and the number of phases at the junction
• Volume through the junction was calculated and a junction volume / capacity ratio derived.
• Average delay at junction was relative to V/C
• Specific delay of turning movements through the junction - (left turns, throughs, rights and U’s were weighted differently)
Priority Junction Modelling
• Total junction capacity based on minimum of entry lane / exit lane capacity
• Volume through the junction was calculated and a junction volume / capacity ratio derived.
• Average delay at junction was relative to V/C
• Specific delay of turning movements through the junction - (left turns, throughs, rights and U’s were weighted differently).
• Also introduced the relative priorities of approach and exit

Incorporation of Junction Delay
• the signalised and priority junction delays were implemented through the Emme/2 macros and the VDF / turn penalty facilities.
• user data items were used to store the number of feeding lanes, stages at the signal and hence the junction capacity.
• extra attributes were used to identify signalised and priority junctions, the type of turn (L,T,R,U) and the type of move (non-priority to non-priority etc.)
“behavioural” factors in assignment
• drivers comfort bonus - hypotheses that 5 minutes on a congested stop-start route is ‘different’ to 5 minutes on a fee flow expressway.
• perceptions of delay at signals / priority junctions -- earlier calculations aimed at true values, concept that “stopped / delay” time would be weighted more highly than moving time.
• perceptions of toll cost -- true toll into model links but what of those that may not pay toll or use electronic means and thus may not perceive full amount.
• non-perception of vehicle operating (distance) costs.
other “behavioural” issues considered• infinite and zero values-of-time; concept that even lower income travellers have urgent “quickest route” trips. Whilst some drivers will not pay toll out of principle.
• distance of trip impacting toll / non-toll choice. Toll as proportion of overall journey cost.
• perfect knowledge / signposting. A model will assume driver knows all options, even very local alternatives routes. Concept of longer distance trips being “signposted” forced to certain road hierarchy.
• point tolls not perceived as such. Application of open tolls as point load in the network, whereas perceived as cost for extended use.

Issue of “Elasticity”

Conclusions
• Transport models are an essential tool in forecasting traffic and revenues on toll roads.
• The modelling of human behaviour will remain a challenge and the flexibility and analytical skills of the user are paramount.
• The experience of Malaysia was that Emme/2 provided great flexibility through its macro capabilities.
• Whether we like it or not “Tolls are the future”