Embed Size (px)
Citation preview

-
Markus Nuuttila
MODELLING OF THE PROTECTION RE-LAYS OF STATCOM
Faculty of Information Technology and Communication
Sciences
Master of Science Thesis
June 2019
i
ABSTRACT
Markus Nuuttila: Modelling of the Protection Relays of STATCOM Master of Science Thesis Tampere University Master’s Degree Programme in Electrical Engineering June 2019
Selective, fast and reliable protection measures are essential for the electric power system, par-ticularly for the transmission network operating at high power levels. Due to the dependence of the society on electric power, the protection systems are critical in minimizing the risks of personal injuries, economical losses and interruptions in the supply of electricity. For the same reason, the power quality is another important issue in the modern transmission systems. To compensate reactive power and reduce the harmonic content in the grid, power electronic solutions such as static synchronous compensators (STATCOMs) and static VAr compensators (SVCs) have been developed. The complex control systems of these compensators require an efficient design method, and simulations with Matlab and Simulink are used widely for this purpose. However, the protection system is still often designed conventionally by verifying the setting calculations with intensive stability tests in laboratory. Moreover, the effect of the trips on the control system must be analysed manually.
In this thesis, Simulink models for overcurrent and differential protection functions were imple-mented to reduce the need for testing. Two different commercial protection relay models were analysed for both functions with the results compared to each other and the standards defining the functions. For the overcurrent protection, a simplified simulation model was also created according to the standard. Particularly, operating characteristics of the functions as well as the differences between the relay models were examined by visualising them with the Simulink mod-elling. In the comparison of the performance of the relays, the focus was on the operating speed. The models were verified first with idealized unit test schemes and finally with a control system model from an actual STATCOM project.
In the tests performed, the simulation models succeeded in detecting the simulated problems and tripping the circuit accordingly to the specifications from manuals and standards. The har-monic blocking of differential protection, the reset process of the timers, as well as the sampling were identified as the main differences between the relay models. However, limited information is often available on these features. Therefore, the further development of them will require more detailed modelling of their structures and applications. Another challenge related to the stability simulations was found to be the large computational capacity required by the control system model.
Based on the successful results from this thesis, the simulation models will be developed fur-ther with the stability simulations in future commercial projects. In addition, new models will be developed to cover more typical functions found in STATCOM and SVC applications, as well as to include the setting calculations.
Keywords: protection relays, overcurrent protection, differential protection, STATCOM, SVC, Simulink, Matlab The originality of this thesis has been checked using the Turnitin OriginalityCheck service.

TIIVISTELMÄ
Markus Nuuttila: STATCOMin suojareleiden mallintaminen Diplomityö Tampereen yliopisto Sähkötekniikan diplomi-insinöörin tutkinto-ohjelma Kesäkuu 2019
Selektiivinen, nopea ja luotettava suojaus on välttämätön osa sähköenergiajärjestelmää, erityisesti suuritehoista siirtoverkkoa. Suojausjärjestelmät ovat kriittisiä henkilövahinkojen, taloudellisten menetysten ja sähkön toimituskatkojen minimoimiseksi sähköstä riippuvaisessa nyky-yhteiskunnassa. Sähkön suuri merkitys on tehnyt myös sähkön laadusta erityisen kiinnostavan ominaisuuden siirtoverkossa. Loistehon kompensoimiseksi ja yliaaltojen rajoittamiseksi on kehitetty tehoelektroniikkalaitteita, joista esimerkkejä ovat tässä työssä tutkittavat STATCOM ja SVC. Laitteiden monimutkaisten ohjausjärjestelmien suunnitteluun tarvitaan tehokkaita menetelmiä, joista mallinnus Matlab-ohjelmistoon kuuluvalla Simulinkillä on hyvin yleisesti käytetty. Vaikka kompensointilaite on jo mallinnettu laajasti Simulinkissä, suojauksen suunnittelussa saatetaan kuitenkin käyttää yhä pelkästään laboratoriossa suoritettavia stabiiliustestejä, jotka kuluttavat merkittävästi organisaation resursseja. Samalla suojareleiden toiminnan vaikutus ohjausjärjestelmän toimintaan jää simuloimatta havainnollisesti.
Tässä diplomityössä rakennettiin simulointimallit ylivirta- ja differentiaalisuojaukselle laboratoriotestien tarpeen vähentämiseksi. Tuloksia verrattiin suojausfunktiot määritteleviin standardeihin sekä suojareleiden käyttöohjeisiin. Kummastakin funktiosta mallinnettiin kahden eri kaupallisen valmistajan versiot, koska tavoitteena oli myös vertailla relemalleja keskenään ja identifioida niiden välisiä eroja. Ylivirtasuojauksesta rakennettiin lisäksi puhtaasti standardiin perustuva, yksinkertaisempi malli. Mallinnuksessa keskityttiin erityisesti suojausfunktioiden matemaattisiin toimintaperiaatteisiin ja suojareleiden vertailussa myös suojauksen nopeuteen. Mallit testattiin yksinkertaisissa, idealisoiduissa testiympäristöissä ennen niiden kytkemistä todelliseen STATCOM-projektiin perustuvaan ohjausjärjestelmän malliin.
Tulokset osoittivat mallien pystyvän havaitsemaan simuloidut viat ja ylikuormitukset sekä lähettämään avauskomennon katkaisijalle standardien ja käyttöohjeiden määrittelemien yhtälöiden ja toiminta-aikojen mukaisesti. Tutkittujen kaupallisten relemallien tärkeimmiksi eroiksi todettiin differentiaalisuojauksen esto erovirran harmonisten yliaaltojen perusteella, ajastimien nollautumislogiikat sekä näytteistys. Näistä ominaisuuksista havaittiin usein olevan saatavissa tietoa vain rajoitetusti, joten niiden jatkokehitys vaatii niiden rakenteen ja sovelluskohteiden yksityiskohtaisempaa mallinnusta. Simulointeihin liittyväksi haasteeksi osoittautui myös ohjausjärjestelmän mallin vaatima suuri laskentakapasiteetti.
Mallien kehitystä jatketaan tulevissa kaupallisissa projekteissa releasettelujen stabiiliuden simulointia varten. Myös releasettelujen laskenta siirretään tuolloin Matlabiin, ja mallien valikoimaa täydennetään muilla STATCOM- ja SVC-sovelluksille tyypillisillä suojausfunktioilla.
Avainsanat: suojareleet, ylivirtasuojaus, differentiaalisuojaus, STATCOM, SVC, Simulink, Matlab Tämän julkaisun alkuperäisyys on tarkastettu Turnitin OriginalityCheck –ohjelmalla.

PREFACE
This Master of Science thesis was written for GE Grid Solutions in Tampere between
December 2018 and June 2019.
I would like to thank Tiila Sallinen, the supervisor of this thesis project, for providing
guidance on protection systems and FACTS projects throughout the entire writing pro-
cess. We shared several useful pieces of advice together for the future design projects.
Thanks to PhD Juha Turunen for all comments on the text and assistance in understand-
ing the principles of the topic. Thanks to Juha Hälli for the introduction on the control
system and providing me the Simulink model of STATCOM utilized in the relay simula-
tions.
I would also like to thank Mika Kolehmainen for offering me this position. Moreover,
thanks to the examiners of this thesis, PhD Jenni Rekola and PhD Tuomas Messo for
their ideas. Thanks also to my colleagues at GE for inspiring conversations and assisting
me with different details.
Finally, special thanks to my friends and family for their support throughout my studies.
We have had a challenging, but also fun and motivating journey together, and now it is
continuing to a new, interesting direction.
Tampere, 26.6.2019
Markus Nuuttila
CONTENTS
1. INTRODUCTION .................................................................................................. 1
2. REACTIVE POWER COMPENSATION ................................................................ 3
2.1 Background ................................................................................................ 3
2.2 Static VAr Compensator (SVC) ................................................................... 5
2.3 Static Synchronous Compensator (STATCOM) .......................................... 9
3. PROTECTION RELAYS ..................................................................................... 16
3.1 Relays as a part of the power system ....................................................... 16
3.2 Structure of relay ...................................................................................... 18
3.3 Protection functions .................................................................................. 22
3.3.1 Overcurrent protection ................................................................ 22
3.3.2 Differential protection .................................................................. 25
3.3.3 Residual overvoltage protection .................................................. 28
3.3.4 Protection of capacitor banks ...................................................... 29
3.3.5 Thermal overload protection ....................................................... 32
3.4 Protection of STATCOMs and SVCs ........................................................ 33
4. SIMULINK MODELS OF THE RELAYS .............................................................. 36
4.1 Review of example models ....................................................................... 36
4.2 Models implemented ................................................................................ 41
4.2.1 Overcurrent protection ................................................................ 41
4.2.2 Differential protection of transformers ......................................... 46
5. INTEGRATION OF THE RELAY MODELS INTO THE CONTROL SYSTEM
MODEL ....................................................................................................................... 55
6. ANALYSIS OF THE RESULTS ........................................................................... 60
6.1 Unit tests .................................................................................................. 60
6.1.1 Overcurrent protection ................................................................ 60
6.1.2 Differential protection .................................................................. 64
6.2 STATCOM tests ....................................................................................... 68

6.2.1 Overcurrent protection ................................................................ 69
6.2.2 Differential protection .................................................................. 73
7. CONCLUSIONS .................................................................................................. 76
REFERENCES ........................................................................................................... 77
APPENDIX A: SIMULINK MODELS FOR OVERCURRENT RELAYS ........................ 82
APPENDIX B: SIMULINK MODELS FOR DIFFERENTIAL RELAYS .......................... 91
APPENDIX C: UNIT TEST RESULTS OF OVERCURRENT RELAYS ..................... 104
APPENDIX D: UNIT TEST RESULTS OF DIFFERENTIAL RELAYS ........................ 113
LIST OF FIGURES
Figure 1. Single-line circuit diagram of an SVC, modified from [3, p. 59]. .............. 6
Figure 2. Thyristor valve [12]. ................................................................................ 7
Figure 3. Operating area of the SVC [14]. ............................................................. 8
Figure 4. Single-line circuit diagram of a main reactor SVC [15]. ........................... 8
Figure 5. A main reactor SVC in Beauly, United Kingdom, main reactor
marked with a yellow circle, adapted from [16]. ...................................... 9
Figure 6. The connection principle and main parts of a STATCOM as a
single-line diagram, based on [7, p. 98]. ............................................... 10
Figure 7. A STATCOM by GE [18]. ..................................................................... 10
Figure 8. Operating area of the STATCOM [14]. ................................................. 11
Figure 9. Switching states of an individual H-bridge module, modified from
[21]. ...................................................................................................... 12
Figure 10. The output phase voltage of a STATCOM: a sum of waveforms
created with four cascaded H-bridge modules, adapted from [22]. ....... 13
Figure 11. Examples of IEDs: GE MiCOM P14D relays [35]. ................................ 19
Figure 12. Block diagram of a modern numerical relay, based on [30], [33]
and [34]. ............................................................................................... 20
Figure 13. IEC IDMT operating time curves [35, p. 77]. ......................................... 24
Figure 14. Currents associated with transformer differential protection and the
connection principle of current transformers, modified from [33, p.
211]. ..................................................................................................... 26
Figure 15. Operating characteristic of a capacitor overvoltage relay [38]. ............. 30
Figure 16. Capacitor bank topologies [37, p. 12]. .................................................. 30
Figure 17. H-bridge capacitor bank, symbols simplified from [39]. ......................... 31
Figure 18. The protection functions implemented with relays in a protection
scheme of SVC [13]. ............................................................................ 34
Figure 19. The logic of definite-time overcurrent relays from [43] and [44]. ........... 37
Figure 20. Logic of a differential relay, based on [46]. ........................................... 40

Figure 21. Test network for overcurrent relays. ..................................................... 42
Figure 22. Network model in the unit tests of differential protection. ...................... 46
Figure 23. Tripping characteristic of GE MiCOM P64x [50, p. 125]. ...................... 51
Figure 24. Tripping characteristic of the ABB RE 615 series relay, adapted
from [32, p. 489]. .................................................................................. 53
Figure 25. Block diagram of the main level structure of the STATCOM
simulation model. ................................................................................. 56
Figure 26. Circuit diagram and the protection scheme of the simulated
STATCOM. .......................................................................................... 58
Figure 27. Fundamental currents calculated by the generic relay simulation
model during a two-phase short circuit in the VSC branch. .................. 70
Figure 28. Fundamental reactor currents during energization of the
STATCOM. .......................................................................................... 71
Figure 29. Calculated operating time in phase B of the generic relay model,
STATCOM control system tests. .......................................................... 73
Figure 30. Fundamental components for the differential currents, measured
by GE MiCOM P64x model. ................................................................. 74

LIST OF SYMBOLS AND ABBREVIATIONS
AC Alternating Current A/D conversion Analog-to-Digital conversion CSC Current-Source Converter CT Current Transformer DC Direct Current DNP Distributed Network Protocol DRC Dynamic Reactive Compensator DSP Digital Signal Processing DT Definite Time FACTS Flexible Alternating Current Transmission Systems FFT Fast Fourier Transform FIR Finite Impulse Response FSIG Fixed-Speed Induction Generator GE General Electric Company GOOSE Generic Object-Oriented Substation Event GTO Gate Turn-off Thyristor HMI Human-Machine Interface HV High Voltage IDMT Inverse Definite Minimum Time IEC International Electrotechnical Commission IED Intelligent Electronic Device IEEE Institute of Electrical and Electronics Engineers IEGT Injection Enhanced Gate Transistor IGBT Insulated Gate Bipolar Transistor I/O Input / Output IP Internet Protocol MMC Modular Multilevel Converter Modbus a serial communications protocol for programmable logic controllers MV Medium Voltage PI controller proportional-integral controller pu per unit PWM Pulse-Width Modulation RMS Root Mean Square RS232 Recommended Standard 232, standard for serial communication RS485 Recommended Standard 485, standard for serial communication RTDS Real Time Digital Simulator SR flip flop Set Reset flip flop STATCOM Static Synchronous Compensator SVC Static VAr Compensator THD Total Harmonic Distortion TMS Time Multiplier Setting TCR Thyristor-Controlled Reactor TSC Thyristor-Switched Capacitor VAr Volt-Ampere reactive VSC Voltage-Source Converter WAMP Wide-Area Measurement and Protection XML Extensive Markup Language abc natural reference frame C capacitance c parameter in IDMT operating time curves
D distortion power f frequency fn nominal frequency I current I current phasor I* complex conjugate of current phasor iABC three-phase currents, high voltage side of the transformer iABC, comp three-phase currents after connection group compensation, high
voltage side of the transformer iabc three-phase currents, medium voltage side of the transformer ibias bias current ibias, abc three-phase bias currents IC capacitive current Ict, pri nominal current of current transformer, primary winding Ict, sec nominal current of current transformer, secondary winding Idiff differential current Idiff1 pickup setting in ABB differential protection Idiff2 second knee point in the ABB differential protection characteristic IL inductive current Ipu base value of current IQ reactive component of current Ir base value of current, notation used in ABB manuals Iref maximum allowed continuous current in thermal overload models Is pickup setting Is-HS1 differential current limit for immediate harmonic deblocking in differ-
ential relay Is-HS2 differential current limit for immediate tripping of differential relay It current level before thermal overload in thermal overload models Itot total current IUNB unbalance current of a capacitor bank j imaginary unit k time parameter in IDMT operating time curves kth unitless constant or variable parameter in thermal models K1 slope of the first part of the differential relay characteristic K2 slope of the second part of the differential relay characteristic Kamp factor for conversion to per unit values after a current transformer L inductance P active power p instantaneous active power p0 instantaneous zero-sequence active power Pload nominal active power of the load Q reactive power q instantaneous reactive power R resistance Rct resistive burden of a current transformer S apparent power S apparent power phasor Sct nominal apparent power of a current transformer Sn nominal apparent power t time top operating time of a relay tr reset time of an IDMT relay U voltage U voltage phasor UABC phasors of three-phase voltages
UDC DC capacitor voltage in the STATCOM ULL line-to-line voltage, high voltage side of the transformer Ull line-to-line voltage, medium voltage side of the transformer Uo phasor of residual voltage Z impedance ZC impedance of a capacitor unit α parameter in IDMT operating time curves αβ0 stationary reference frame τ thermal time constant
1
1. INTRODUCTION
Due to the high power levels required, a reliable transmission network designed with
safety prioritized is essential for satisfying the demands of the society. These require-
ments as well as the large size of the structures in the transmission grid make the grid
expensive to construct and maintain. Projects, in which the network is developed and
renovated, typically take several years to complete. Contrary, a fault occurring in the grid
will destroy components in the grid in less than a second. The following interruptions to
the supply of electricity to the customers increase the economical losses further. To man-
age these risks and protect people from any personal injuries, the protection system of
the network must be able to detect all faults in the transmission system and disconnect
the faulty part as quickly as possible. Moreover, the protection must be selective to avoid
any unnecessary interruptions of the supply. [1]
In addition, as the demand of electricity continues to grow, the power quality in the AC
(Alternating Current) networks is decreased without the use of FACTS (Flexible Alternat-
ing Current Transmission Systems) controllers. The Finnish part of Grid Solutions, which
belongs to the Renewable Energy industry of the General Electric Company (GE), de-
signs and constructs static VAr compensators (SVCs) and static synchronous compen-
sators (STATCOMs) for high power levels in Tampere. These power electronic systems
are controlled with advanced and complex automation systems, for which Matlab and
Simulink provide an efficient tool for control software design. With Simulink, the simula-
tion model originally implemented for design purposes can be directly converted to C
code and therefore used in the automation system.
Although the protection system of a STATCOM or an SVC is partially included in the
control system, it is mainly implemented with protection relays, also known as intelligent
electronic devices (IED). Conventionally, at Grid Solutions, the setting calculations and
the selection of the relays have been based on literature and specifications. The calcu-
lated settings are verified with time- and resource-consuming stability tests in the labor-
atory with a real time digital simulator (RTDS).
In this thesis, Simulink models for two protection functions are created to reduce the
need for stability testing. The functions considered are overcurrent protection of a reactor
and the differential protection of the main transformer. Like in the physical system, the
2
models are built to take measurement signals from the network as their inputs. The out-
put of the relay is the trip signal, which is transferred to the circuit breaker to disconnect
the STATCOM from the grid, as well as to the automation system to protect the system
against damage with a controlled shutdown of it. The entire simulation model of the
STATCOM therefore provides an authentic environment for the stability simulations of
the relays.
Together, the different IED manufacturers offer a wide selection of protection relays, and
individual models possess strengths for specific applications. To assist in the relay se-
lection, the features of the implemented simulation models are based on actual relay
models from the MiCOM series by GE and the RE 615 series from ABB. For the over-
current protection, a third simulation model is implemented based on the standard IEC
(International Electrotechnical Commission) 60255-151 [2], which defines the function.
In chapter 2, the basics of reactive power compensation with STATCOMs and SVCs are
introduced to explain the context and applications for the constructed relay models. The
focus of the chapter is in the structure and operation of the main circuits. Chapter 3
describes the mathematical principles of the typical protection functions of FACTS con-
trollers as defined in the corresponding standards. Moreover, the structure of an IED and
an example protection scheme of an SVC are introduced.
Chapter 4 begins with a review of the previously developed simulation models for the
protection relays before advancing to the creation process of the new models with their
unit test schemes. The STATCOM project utilized for the simulations is introduced in
chapter 5 alongside the integration principles of the relay models into the control system
model. Chapter 6 consists of the results and the analysis of them starting from the unit
tests and continuing with the simulations with the STATCOM model. Based on the re-
sults, future ideas and tasks are proposed in the final, seventh chapter besides the con-
clusions.
3
2. REACTIVE POWER COMPENSATION
2.1 Background
According to definition, flexible AC transmission systems take advantage of control so-
lutions and power electronics to improve and maximize the transmission capacity of an
AC power system. The transmission of reactive power reduces the capacity available for
active power. Therefore, it is viable to consume the reactive power as close to its pro-
ducer as possible. [3]
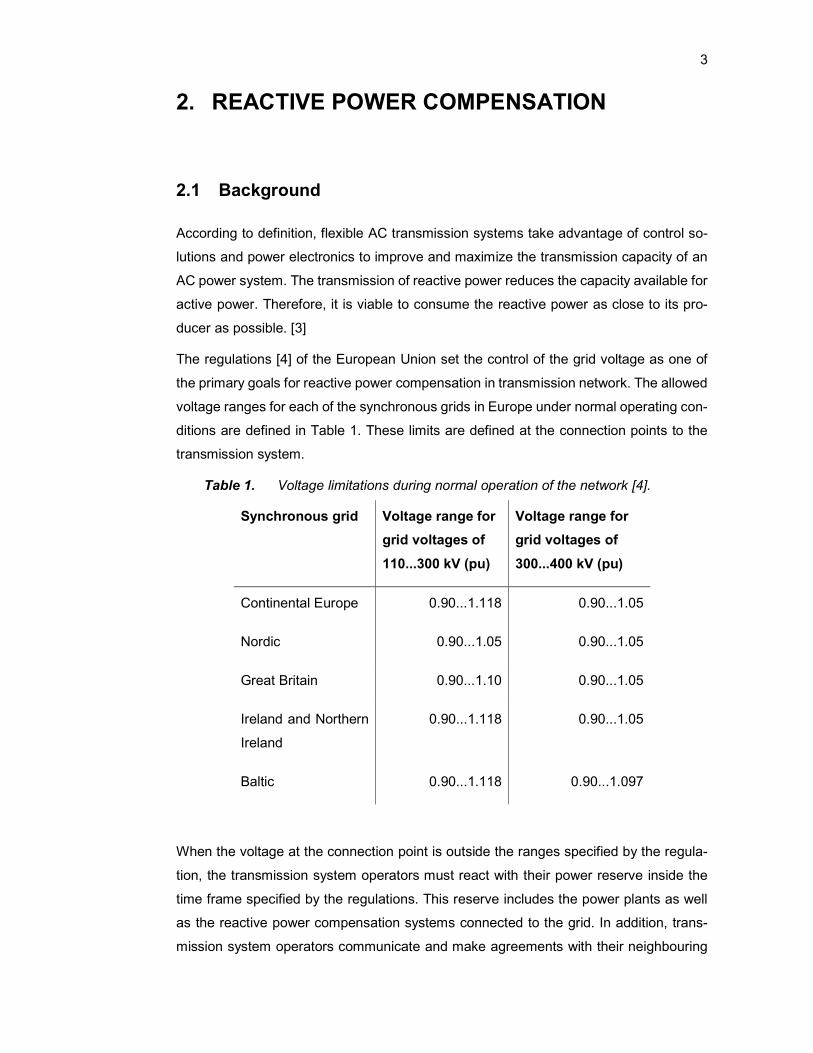
The regulations [4] of the European Union set the control of the grid voltage as one of
the primary goals for reactive power compensation in transmission network. The allowed
voltage ranges for each of the synchronous grids in Europe under normal operating con-
ditions are defined in Table 1. These limits are defined at the connection points to the
transmission system.
Table 1. Voltage limitations during normal operation of the network [4].
Synchronous grid Voltage range for
grid voltages of
110...300 kV (pu)
Voltage range for
grid voltages of
300...400 kV (pu)
Continental Europe 0.90...1.118 0.90...1.05
Nordic 0.90...1.05 0.90...1.05
Great Britain 0.90...1.10 0.90...1.05
Ireland and Northern
Ireland
0.90...1.118 0.90...1.05
Baltic 0.90...1.118 0.90...1.097
When the voltage at the connection point is outside the ranges specified by the regula-
tion, the transmission system operators must react with their power reserve inside the
time frame specified by the regulations. This reserve includes the power plants as well
as the reactive power compensation systems connected to the grid. In addition, trans-
mission system operators communicate and make agreements with their neighbouring
4
operators as well as the distribution network operators, powerplants and significant con-
sumers connected to their grid to maintain the reactive power balance.
When a fault occurs in the Finnish transmission grid, power plants change their active or
reactive power production under orders from the Finnish transmission system operator
Fingrid to ensure the electrical safety and system security. Fingrid also has the right to
disconnect the cause of the fault or disturbance from the grid to repair the situation. [5]
Conventionally under sinusoidal and balanced conditions, the apparent power 𝑆 is de-
fined using phasors as
𝑆 = 𝑃 + 𝑗𝑄 = 𝑈 𝐼∗, (1)
in which 𝑃 is the active power and 𝑄 is the reactive power. If absolute values are used,
the apparent power can also be expressed as a product of the voltage 𝑈 and the current
𝐼. This is possible even if the waveforms are nonsinusoidal by expressing the quantities
as Fourier series. In these situations, the reduced power quality is measured with the
distortion power calculated from the definition
𝐷 = 𝑆 − 𝑃 − 𝑄 . (2)
The introduction of power electronics into the power systems as nonlinear loads and the
need for power calculations during transients lead to the development of the instantane-
ous power theory by Akagi et al [6], in which the electrical quantities are expressed in
time domain. With the use of the stationary reference frame and the Clarke transfor-
mation in power-invariant form
𝑥𝑥𝑥
=
⎣⎢⎢⎢⎡ 1 − −
0√
−√
√ √ √ ⎦⎥⎥⎥⎤ 𝑥
𝑥𝑥
, (3)
in which 𝑥 can be voltage or current, the instantaneous three-phase powers can be cal-
culated as
𝑝𝑞 =
𝑢 𝑢𝑢 −𝑢
𝑖𝑖 (4)
in a three-wire system, with the zero-sequence component 𝑝 = 𝑢 𝑖 added to the active
power in a system with a neutral wire. [6]
This approach provides a way to control both active and reactive power in power elec-
tronic converters such as the STATCOMs. To enable the use of PI (proportional-integral)
controllers by producing sinusoidal input signals, the control signals are typically con-
verted to synchronous reference frame with Park’s transformation. In this reference

5
frame, the frame is rotating at the grid fundamental frequency. [7]
Reactive power compensation systems can be categorized to passive and active solu-
tions. The main components of passive solutions are capacitor banks and reactors. The
reactive power output of passive compensation can be either fixed or variable. [7] How-
ever, the conventional passive compensation systems do not have possibilities for fast
control required to eliminate instantaneous high-frequency disturbances occurring
quickly. Active solutions such as STATCOMs and active power filters utilize power elec-
tronic converters and the semiconductor switches of them to provide the control oppor-
tunities absent from the passive solutions. Simultaneously, they have additional benefits
compared to passive solutions, such as smaller size [3] and their ability to balance un-
balanced grids [7]. The control of these converters is based on the definitions introduced
above.
In addition, hybrid solutions combining the advantages of passive and active compensa-
tion are available. For example, the STATCOM considered in this thesis has been ex-
tended to a Dynamic Reactive Compensator (DRC) by complementing the design with a
thyristor-switched capacitor (TSC) in the GE projects.
Examples of issues with reactive power compensation are the resonances associated
with passive compensation, harmonics produced by the switching in static VAr compen-
sators and the high costs of the compensation projects for the network operators. Par-
ticularly, the passive series compensation solutions involve a risk of resonant phenom-
ena with the inductance of the grid. [7] Moreover, the compensation introduces rapid
transient phenomena to the network. The protection systems of the grid must adapt to
these fast dynamics as well as the harmonics present to operate correctly. When design-
ing the protection, the fault situations must therefore be analysed carefully due to an
active compensator trying to restore the voltage level. [8]
2.2 Static VAr Compensator (SVC)
Like passive compensation solutions, static VAr compensators are based on the funda-
mental properties of capacitor banks and reactors. Besides reactive power compensa-
tion, utility SVCs regulate the voltage level of transmission networks and damp oscilla-
tions [9]. In electricity distribution and industrial applications, SVCs are used to respond
to fast changes such as flicker in voltages and to compensate reactive power produced
by nonlinear loads [7]. To provide the fast control dynamics required for these applica-
tions, the SVC uses thyristors for switching instead of mechanical switches.
The SVC is a shunt compensation system consisting of thyristor-switched capacitors

6
(TSC), thyristor-controlled reactors (TCR) and passive harmonic filters. [10] Moreover,
mechanically switched capacitors and reactors can be present [9]. Figure 1 depicts the
circuit diagram of a typical SVC.
Figure 1. Single-line circuit diagram of an SVC, modified from [3, p. 59].
Switching the thyristors produces a large current spike if the voltage across the thyristor
is not close to zero. Thus, the thyristors are only turned on when this condition is fulfilled.
This does not allow continuous reactive power control with the capacitors. As there is
typically a voltage over the capacitors, it affects the thyristors as well, and the capacitors
can only be connected to and disconnected from the grid [11, p. 892]. The control of the
reactive power is accomplished by adjusting the reactor phase currents and thus the total
reactive power produced or consumed by the SVC.
To withstand the voltages present in the system, a thyristor valve consists of multiple
thyristors connected in series. Due to the high prices of the thyristor valves in high volt-
ages, the voltage of the entire SVC is reduced from 400 kV of the transmission network
to approximately 10-35 kV [9] with a transformer. The components are connected to each
other via a busbar. The coolant of the thyristor valves is de-ionized water, with glycol
added for better performance in extreme ambient temperatures [12]. An example of the
valve is shown in Figure 2.

7
Figure 2. Thyristor valve [12].
The valves are controlled from multiple thyristor control units, which communicate with
the control system through optical fibres. Before firing, the thyristor control unit checks
the condition and the voltage of the thyristor before allowing the firing pulse to be sent.
[12]
The TCRs and TSCs are typically connected in delta, which reduces the currents through
the components by √
. In addition, the delta connection prevents the triplen harmonics
from escaping to the grid in a balanced network, and thus their amount becomes rela-
tively small [9]. The 5th, 7th and 11th harmonics produced by the SVC are filtered out
with passive, single-tuned filters [13]. Simultaneously, these filters contribute to the re-
active power generation [10].
In theory, the firing angle of the thyristors in TCR can be varied between 90 and 180
degrees. At the minimum value of the angle, the inductive reactive power is at its maxi-
mum. The maximum firing angle creates the opposite situation, in which the reactors
are disconnected. The current of TCR is modelled by using the conduction angle [3],
which is defined from the time during which the current through the thyristor is nonzero.
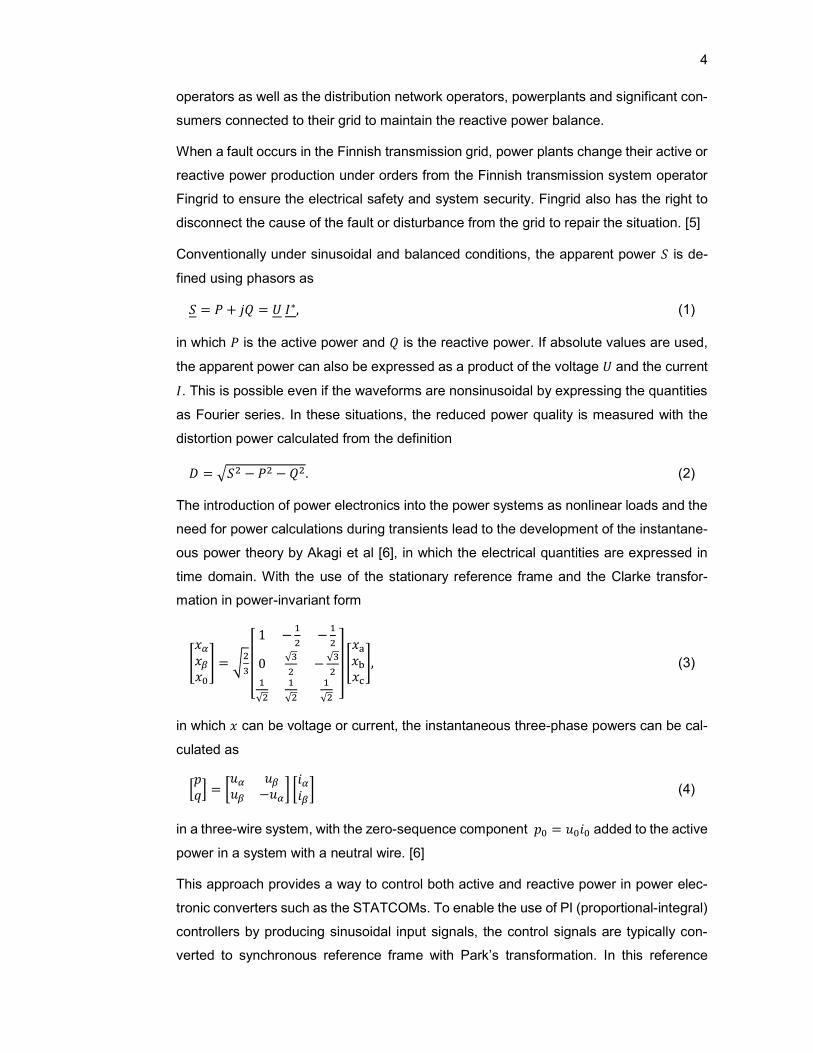
Figure 3 depicts the operating area of the SVC. In the figure, the operating point is ex-
pressed with the system voltage given as a per unit (pu) value and the reactive current
of the SVC. The symbol 𝐼 represents capacitive and 𝐼 inductive current, respectively.
The susceptances of the reactive elements determine the slopes for the lines limiting the
operating area [3].
8
Figure 3. Operating area of the SVC [14].
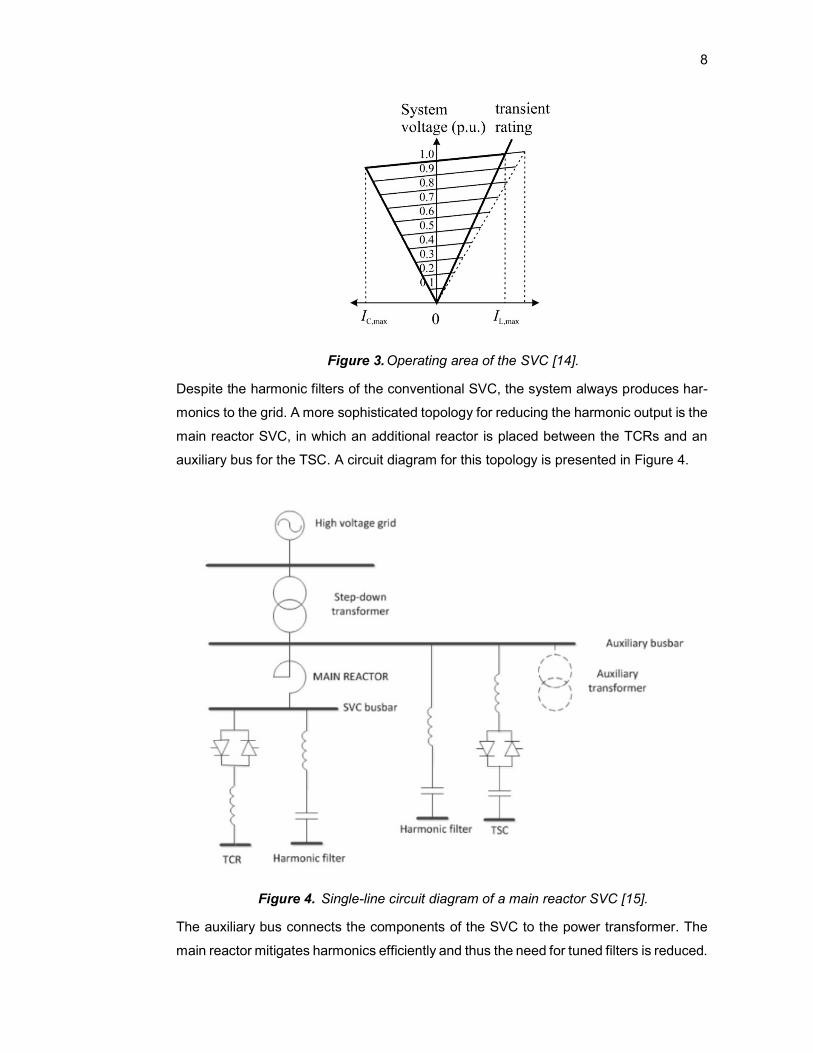
Despite the harmonic filters of the conventional SVC, the system always produces har-
monics to the grid. A more sophisticated topology for reducing the harmonic output is the
main reactor SVC, in which an additional reactor is placed between the TCRs and an
auxiliary bus for the TSC. A circuit diagram for this topology is presented in Figure 4.
Figure 4. Single-line circuit diagram of a main reactor SVC [15].
The auxiliary bus connects the components of the SVC to the power transformer. The
main reactor mitigates harmonics efficiently and thus the need for tuned filters is reduced.
9
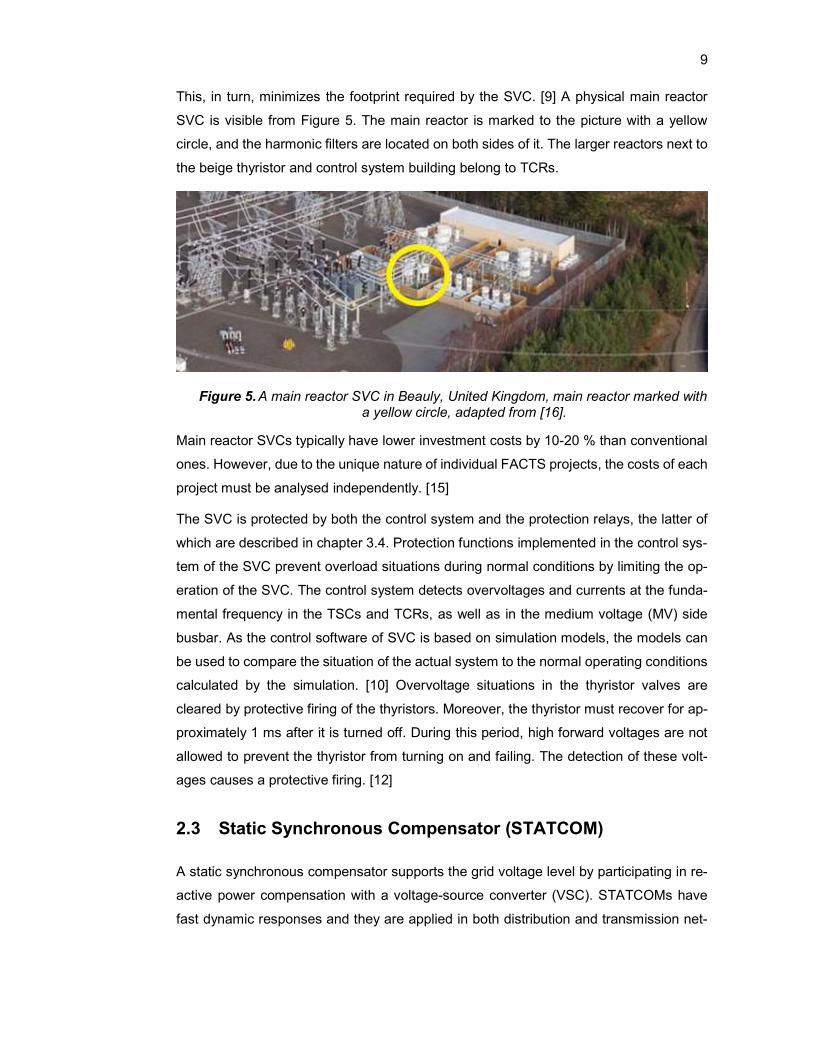
This, in turn, minimizes the footprint required by the SVC. [9] A physical main reactor
SVC is visible from Figure 5. The main reactor is marked to the picture with a yellow
circle, and the harmonic filters are located on both sides of it. The larger reactors next to
the beige thyristor and control system building belong to TCRs.
Figure 5. A main reactor SVC in Beauly, United Kingdom, main reactor marked with a yellow circle, adapted from [16].
Main reactor SVCs typically have lower investment costs by 10-20 % than conventional
ones. However, due to the unique nature of individual FACTS projects, the costs of each
project must be analysed independently. [15]
The SVC is protected by both the control system and the protection relays, the latter of
which are described in chapter 3.4. Protection functions implemented in the control sys-
tem of the SVC prevent overload situations during normal conditions by limiting the op-
eration of the SVC. The control system detects overvoltages and currents at the funda-
mental frequency in the TSCs and TCRs, as well as in the medium voltage (MV) side
busbar. As the control software of SVC is based on simulation models, the models can
be used to compare the situation of the actual system to the normal operating conditions
calculated by the simulation. [10] Overvoltage situations in the thyristor valves are
cleared by protective firing of the thyristors. Moreover, the thyristor must recover for ap-
proximately 1 ms after it is turned off. During this period, high forward voltages are not
allowed to prevent the thyristor from turning on and failing. The detection of these volt-
ages causes a protective firing. [12]
2.3 Static Synchronous Compensator (STATCOM)
A static synchronous compensator supports the grid voltage level by participating in re-
active power compensation with a voltage-source converter (VSC). STATCOMs have
fast dynamic responses and they are applied in both distribution and transmission net-

10
works [17]. In addition to reactive power compensation, they mitigate flicker and harmon-
ics and balance the voltages of the grid. In distribution network, STATCOMs compensate
nonlinear loads such as power supplies and arc furnaces as well as consumer electron-
ics and household appliances. [7] The STATCOM is a shunt compensation system, as
visible from Figure 6. It consists of the VSC with its DC (Direct Current) side capacitors
and phase reactors. The STATCOM in Figure 6 is connected to a distribution network.
Figure 6. The connection principle and main parts of a STATCOM as a single-line diagram, based on [7, p. 98].
The components of the STATCOM are shown in more detail in Figure 7. The green com-
ponent is the main transformer. The converter with its automation system is inside the
building, with the round phase reactors next to it. The other reactors in the picture are
parts of harmonic filters or related to additional components such as damping the TSCs
of hybrid solutions. On the left side of the control building, there are capacitor banks for
the filters in the figure.
Figure 7. A STATCOM by GE [18].
Like the SVC, the STATCOM is connected to grid with a transformer, which reduces the
voltage compared to the transmission network voltage level. Phase reactors functioning
as a filter are electrically located between the converter itself and the transformer. On
11
the DC side of the converter, the energy is stored in a capacitor. Compared to the SVC,
the footprint of the STATCOM is smaller, as the STATCOM is mostly based on active
components [3]. In addition, the STATCOM produces less harmonics to the grid than an
SVC. The harmonic content is located at higher frequencies, which reduces the com-
plexity and size of the filters as well as the need for them. [15] The switch components
in modern STATCOMs are insulated gate bipolar transistors (IGBT). Conventionally,
gate turn-off thyristors (GTO) [3] have been utilized, and an alternative for IGBT elimi-
nating the individual snubber circuits is an IEGT (Injection Enhanced Gate Transistor).
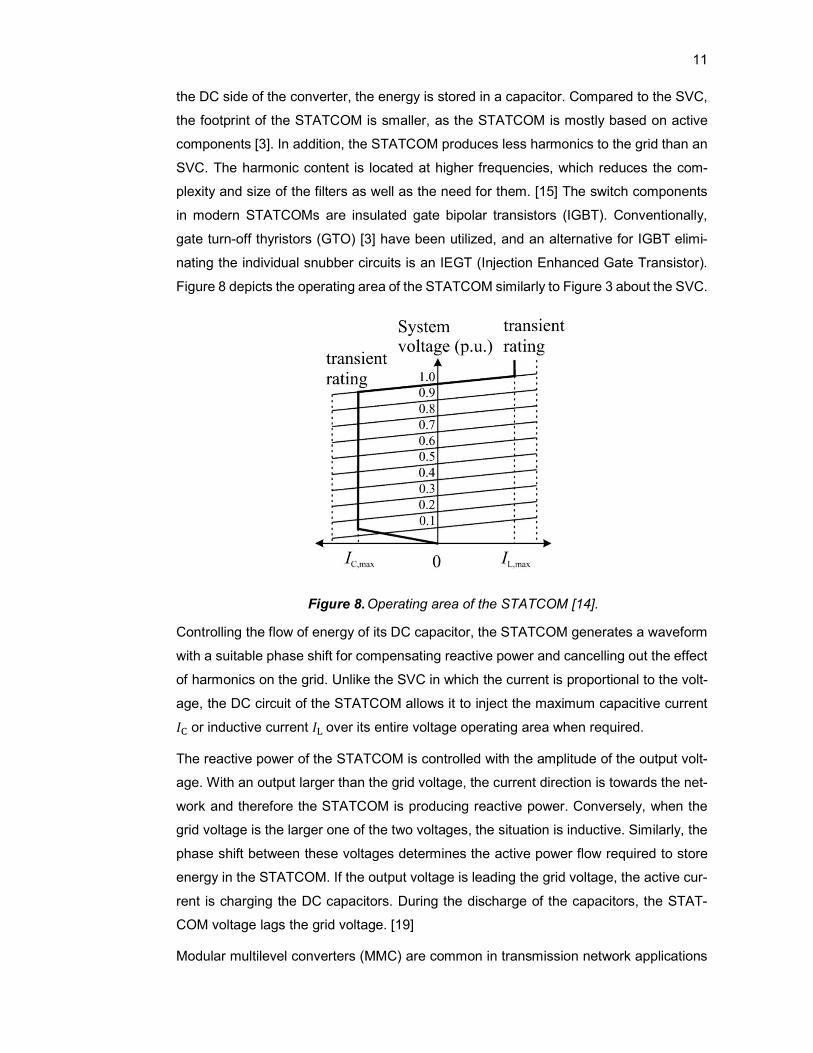
Figure 8 depicts the operating area of the STATCOM similarly to Figure 3 about the SVC.
Figure 8. Operating area of the STATCOM [14].
Controlling the flow of energy of its DC capacitor, the STATCOM generates a waveform
with a suitable phase shift for compensating reactive power and cancelling out the effect
of harmonics on the grid. Unlike the SVC in which the current is proportional to the volt-
age, the DC circuit of the STATCOM allows it to inject the maximum capacitive current
𝐼 or inductive current 𝐼 over its entire voltage operating area when required.
The reactive power of the STATCOM is controlled with the amplitude of the output volt-
age. With an output larger than the grid voltage, the current direction is towards the net-
work and therefore the STATCOM is producing reactive power. Conversely, when the
grid voltage is the larger one of the two voltages, the situation is inductive. Similarly, the
phase shift between these voltages determines the active power flow required to store
energy in the STATCOM. If the output voltage is leading the grid voltage, the active cur-
rent is charging the DC capacitors. During the discharge of the capacitors, the STAT-
COM voltage lags the grid voltage. [19]
Modular multilevel converters (MMC) are common in transmission network applications
12
[20]. They typically consist of several H-bridge modules. The switching states of an indi-
vidual module are presented below in Figure 9.
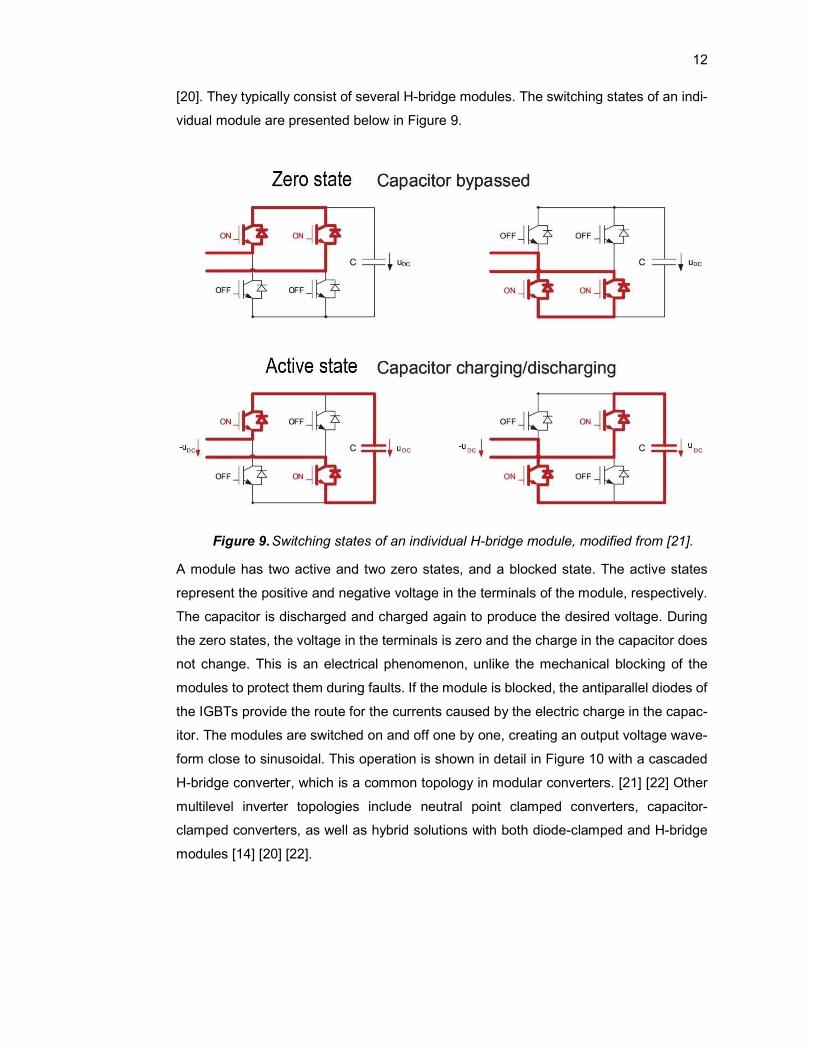
Figure 9. Switching states of an individual H-bridge module, modified from [21].
A module has two active and two zero states, and a blocked state. The active states
represent the positive and negative voltage in the terminals of the module, respectively.
The capacitor is discharged and charged again to produce the desired voltage. During
the zero states, the voltage in the terminals is zero and the charge in the capacitor does
not change. This is an electrical phenomenon, unlike the mechanical blocking of the
modules to protect them during faults. If the module is blocked, the antiparallel diodes of
the IGBTs provide the route for the currents caused by the electric charge in the capac-
itor. The modules are switched on and off one by one, creating an output voltage wave-
form close to sinusoidal. This operation is shown in detail in Figure 10 with a cascaded
H-bridge converter, which is a common topology in modular converters. [21] [22] Other
multilevel inverter topologies include neutral point clamped converters, capacitor-
clamped converters, as well as hybrid solutions with both diode-clamped and H-bridge
modules [14] [20] [22].

13
Figure 10. The output phase voltage of a STATCOM: a sum of waveforms created with four cascaded H-bridge modules, adapted from [22].
Topologies used in distribution STATCOMs include single-phase converters as both cur-
rent- (CSC) and voltage-source converters. Three-phase STATCOMs can be imple-
mented for example as conventional two-level converters for both three- and four-wire
systems or as H-bridge converters. [7] Isolation can be provided with a transformer, for
which Singh et al [7] list topologies extensively. Multilevel converters are also common
in industrial applications, as mentioned by Rodriguez et al [22].
In addition to producing the driving signals for the IGBTs, the electronics of the submod-
ule include protection functions against overcurrents as well as voltages, drive power
failures and thermal overloads. A recent design by Wang et al [23] uses a hysteresis
comparator for the fault detection. After filtering out the high-frequency components of
the input voltage, the input is compared to a threshold. The output of the comparator is
1 when the circuit operates normally and 0 during a fault. The control system of the
module handles the detected fault according to measurement information. Overcurrents,
voltages and drive power failures cause the blocking of the module, while undervoltages
and high temperatures are processed further by the main control system of STATCOM.
The redundant power supply of these electronics guarantees the proper operation of
protection if one supply fails.

14
The IGBT failures lead to the blocking and mechanical bypassing of the module in ques-
tion. Additional modules are present in the MMC STATCOMs to provide redundancy in
case of these failures. This increases the number of levels in the STATCOM topology.
However, the expensive duplication of all power electronic devices is not required. As an
example, one or two additional modules per phase can be added to a cascaded H-bridge
converter. A conventional but still relatively new solution to continue the operation of
STATCOM as normally as possible is to block the modules corresponding to the faulty
one from the healthy phase-legs as well. After the blocking, the DC voltages are bal-
anced by means of control. [24] Recently, Neyshabouri and Iman-Eini [25] have pro-
posed a new approach, in which the capacity of the STATCOM is kept at its rated value
despite a single IGBT failure. This is achieved by modifying the DC voltage balancing
logic of the modules and the PWM (pulse-width modulation) equations for operation after
the fault. All switches in the healthy phase-legs remain in use.
An important application of STATCOM is to support the connection of renewable energy
production into the grid. It has been a topic of large research interest in the 2010s [26]
[27] [28]. Barbeiro et al [26] examined the Portuguese transmission system, to which a
large amount of wind power is connected. In 2013, the active power capacity of wind
power in Portugal was approximately 4648 MW. First, scenarios for several combinations
of loads and weather conditions were created. Based on the identification of the worst-
case locations for faults, the sizes and locations of the required STATCOMs were opti-
mized. As a result, seven STATCOMs for six different substations were proposed: five
for the voltage level of 63 kV, one for 150 kV and one for 220 kV with their apparent
powers varying between 10-188 MVAr. The need for simultaneous tripping of wind power
production during a fault was reduced below 2000 MW in each of the cases considered,
fulfilling the requirement set by the Portuguese grid code. [26]
Mahfouz and El-Sayed [27] modelled a wind farm consisting of fixed-speed induction
generators (FSIG) as a single machine in Simulink to determine the dimensioning of the
STATCOM. The control system of this model was implemented in synchronous reference
frame with space vector modulation. A three-phase fault in network causes a voltage
sag, which in turn reduces the electrical torque of a generator. As this increases the slip
of the machine, the risk of instability and tripping of the wind farm due to the uncontrol-
lable acceleration of the rotor is high. With the STATCOM, reactive power is produced
for the generators to be consumed. Due to the inertia of the rotor, this restores the bal-
ance between electrical and mechanical torques and finally the voltage, stabilizing the
situation until the fault is cleared or its critical clearing time is exceeded.
15
Ramirez et al [28] approached the low voltage ride through capability of wind power sys-
tems from the aspect of grid impedances. To meet the Spanish grid code requirements,
both voltage support and reactive power compensation are required from the STATCOM.
Faults occurring close to the location of STATCOM are particularly challenging. A low
impedance between the fault and the STATCOM sets a demand of large currents to be
produced by the STATCOM to restore the system voltage. Connecting additional reac-
tance between the STATCOM and the grid enables achieving the support level required
by the grid code. The system under test was a simple two-level STATCOM in connection
with a 3 kW DC motor replacing the wind turbine for consistent test conditions. On the
DC side of STATCOM, a braking resistor is present for increasing the ratio of reactive
and total currents to the level specified in the grid code. For tests with unbalanced
faults, the results were similar to three-phase faults, but the assessment criterion in un-
balanced faults is based on the prohibition of active and reactive power absorption by
the wind farm.
16
3. PROTECTION RELAYS
3.1 Relays as a part of the power system
Protection relays are safety-critical components in the power system and thus several
goals apply universally for their design process. The Institute of Electrical and Electronics
Engineers (IEEE) defines the relays as devices reacting to their input as defined by con-
trolling the operation of the contacts of an electric circuit [29, p. 1]. In addition to the
functionality required to protect the power system, the prices of the protection measures
limit the design. Thus, the costs are optimized by minimizing them subject to the techno-
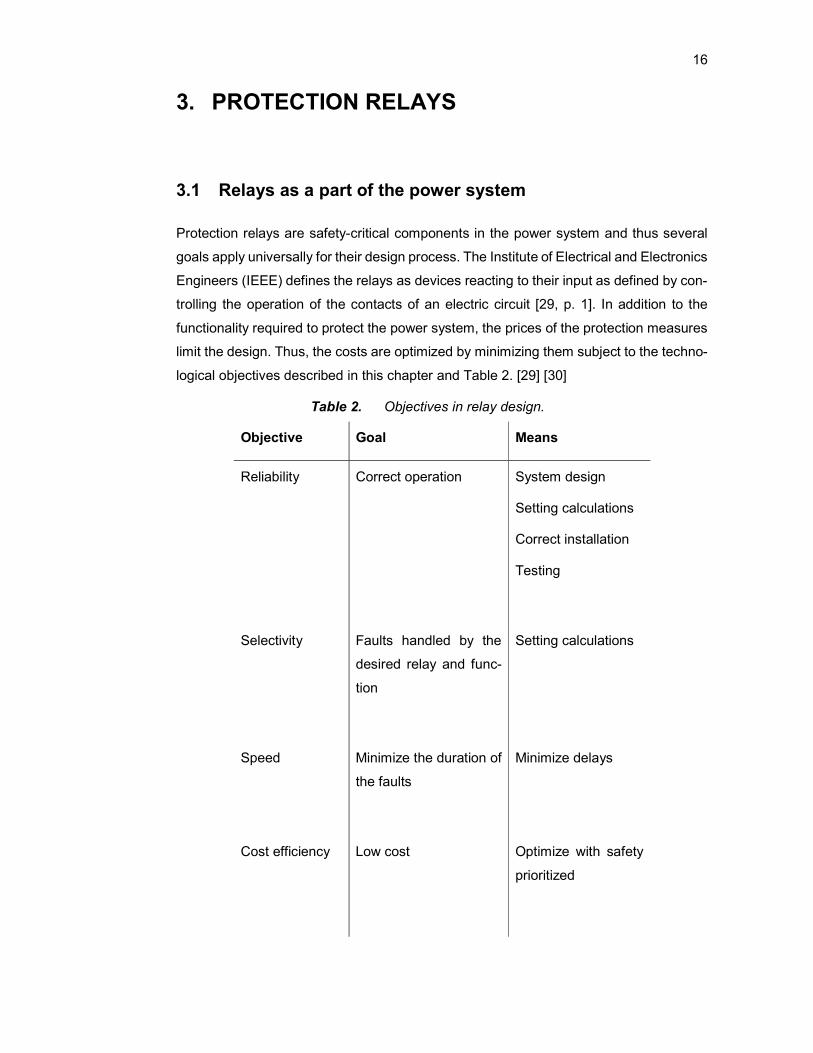
logical objectives described in this chapter and Table 2. [29] [30]
Table 2. Objectives in relay design.
Objective Goal Means
Reliability Correct operation
System design
Setting calculations
Correct installation
Testing
Selectivity Faults handled by the
desired relay and func-
tion
Setting calculations
Speed Minimize the duration of
the faults
Minimize delays
Cost efficiency Low cost Optimize with safety
prioritized

17
A protection system must be reliable. This objective consists of two desired features,
dependability and security. Combined, they mean the correct operation of the relay while
avoiding any incorrect operation as well as possible. [29] [30] The Network Protection
and Automation Guide by Alstom [1] explains the factors contributing to reliability. Be-
sides the suitable system design, a correct installation and setting of the relay is required
to achieve a reliable protection system. Moreover, special attention is required to ensure
the operation of the system during its entire lifetime. The time between two consecutive
operations of a relay is typically years, and the components are constantly under stress
from environmental and electrical conditions. Therefore, frequent testing and adequate
maintenance of the relay systems are necessary for reliability. Separate back-up power
supplies are available for both main and back-up protection systems to keep them oper-
ational during primary power failures.
According to Blackburn and Domin [29, p. 19], there is a trade-off between dependability
and security. For instance, a simple network and its protection system with a single relay
usually operate as desired, but a transient or a human error might lead to unnecessary
trips. If the trip signal is instead required simultaneously from two relays monitoring dif-
ferent quantities, there will be more information available on the physical phenomena
present and less risk for mistakes. However, the system will become more complex,
increasing the risk of malfunction. Blackburn and Domin define simplicity of the system
as one of the basic objectives in protection design.
Besides reliability, the protection system must operate selectively. Selectivity is also
known as discrimination [1] or relay coordination [29]. The primary goal of protection is
to minimize the size of the disconnected part of the network while isolating the location
of the fault. If a failure of the primary protection system occurs, a secondary back-up
protection scheme is initiated applying the same principles as with the primary system.
This is implemented by time grading, which involves setting the time delays of the relays
according to their distance from the fault zone. Only the relays significant for clearing the
fault finish their operation, while the rest acting as a back-up are interrupted when the
fault is cleared. Breaker failures are detected with a similar principle by monitoring the
current and status signals of the breaker. If the circuit has not been opened after a set
time, the relays will send a trip command to the neighbouring substations [29].
An alternative approach for time grading is the unit protection, which is used for protec-
tion zones having clear boundaries. The operation of these systems should be as inde-
pendent of the situation outside their protection zones as possible. [1] The protection
schemes of FACTS systems, transformers and generators are examples of unit protec-
tion. The differential protection examined in chapter 3.3.2 is a typical function used in

18
connection with these components. An example of the protection scheme for a FACTS
system is considered in chapter 3.4. For back-up, the unit protection system is duplicated
[30, p. 6].
A short duration of the fault minimizes the damage caused to the system [29] [30, p. 6]
and maximizes the security of supply by reducing the risk for the loss of grid synchroni-
zation or other stability issues [1] [29]. These phenomena expand quickly to large areas
[1] due to for example the acceleration of generators caused by the fault [29]. System
dynamics such as communication delays, computation performed in the relay and the
breaker operating time must be considered in the design in addition to the time delay
determined by the protection function. As an example, a breaker operates in approxi-
mately 17...83 ms and a high-speed relay in less than 50 ms according to Blackburn and
IEEE [29, p. 21]. The commercial relays compared by Leelaruji and Vanfretti [31] have
operation times of less than 30 ms in most of their applications. The differential protection
is slightly faster. For example, the fastest stage in a relay from ABB RE 615 series [32,
p. 513] operates in 22 ms.
With a protection system design based on these objectives, the damage to the power
system and people in fault and overload situations is minimized. In the ideal situation,
the end products are sensitive relays [1] with suitable settings for their applications.
These relays succeed in distinguishing between normal and abnormal conditions inde-
pendently from the relative magnitudes of the measured quantities during the abnormal
situation. The tools developed in this thesis provide an approach to identify the chal-
lenges related to reaching these goals in the commercial relay models. By reducing the
need for laboratory tests and producing data to support the selection of the most suitable
relay model, the simulation models also contribute to the optimization of the protection
system cost.
3.2 Structure of relay
The development of protection relays started in the beginning of the 20th century from
electromagnetic designs. An attracted armature relay, in which the circuit is kept closed
with an iron-cored electromagnet, still has some special applications in the power sys-
tem, such as inductive circuits with large currents. Its operational principle is instantane-
ous. During the normal operation of the system, the armature of the relay is attracted by
the magnet. If a fault exceeding the threshold occurs, a spring pulls the armature back
to its initial position, tripping the circuit. The threshold is adjusted by modifying the prop-
erties of the spring or the magnetic circuit. [1] [29] [30] [33] Time-delay characteristics

19
followed in the 1910s. They were implemented with induction relays having similar oper-
ational principles to conventional electrical energy meters. Moreover, the first distance
relays from the 1930s were electromechanical [34, p. 13].
Transistors made the transition to electronic relays possible. The static relays produced
in the 1960s took advantage of analog signal processing, and thus more complex oper-
ation characteristics were designed. The size of the relay was reduced, as well as its
operational delays. A single relay started to become suitable for multiple applications.
Microprocessors and integrated circuits continued the development in the 1980s, intro-
ducing digital signal processing (DSP), programmability and measurement of signals to
relays. [1] [30] [33] [34]
These principles formed the basis for modern numerical relays, which have extensive
communication possibilities with their environment. These relays are also known as in-
telligent electronic devices (IEDs). An example of a physical IED is shown in Figure 11.
Figure 11. Examples of IEDs: GE MiCOM P14D relays [35].
The use of algorithms for signal processing and integrated self-testing functionality are
other typical features in the modern relays. Control and monitoring functions, as well as
event and disturbance recorders are also present. [30] [34] In addition, the required wir-
ing is simple. The implementation of individual protection functions has become more
flexible, lowering the relative cost of the relays. [29, p. 560] Wide-area measurement and
protection (WAMP) systems based on synchronized phasor measurements are an ex-
ample of an application of numerical relays. These systems have increased the adaptivity
of the protection system related to the network. [33] [34] Although the relays have be-
come more reliable compared to old designs, failures involve a risk of multiple protection
functions becoming disabled simultaneously. The large amount of data present makes
the operation of the relays difficult to understand and can lead to excessive processing
of it depending on the situation. [29, p. 560]
20
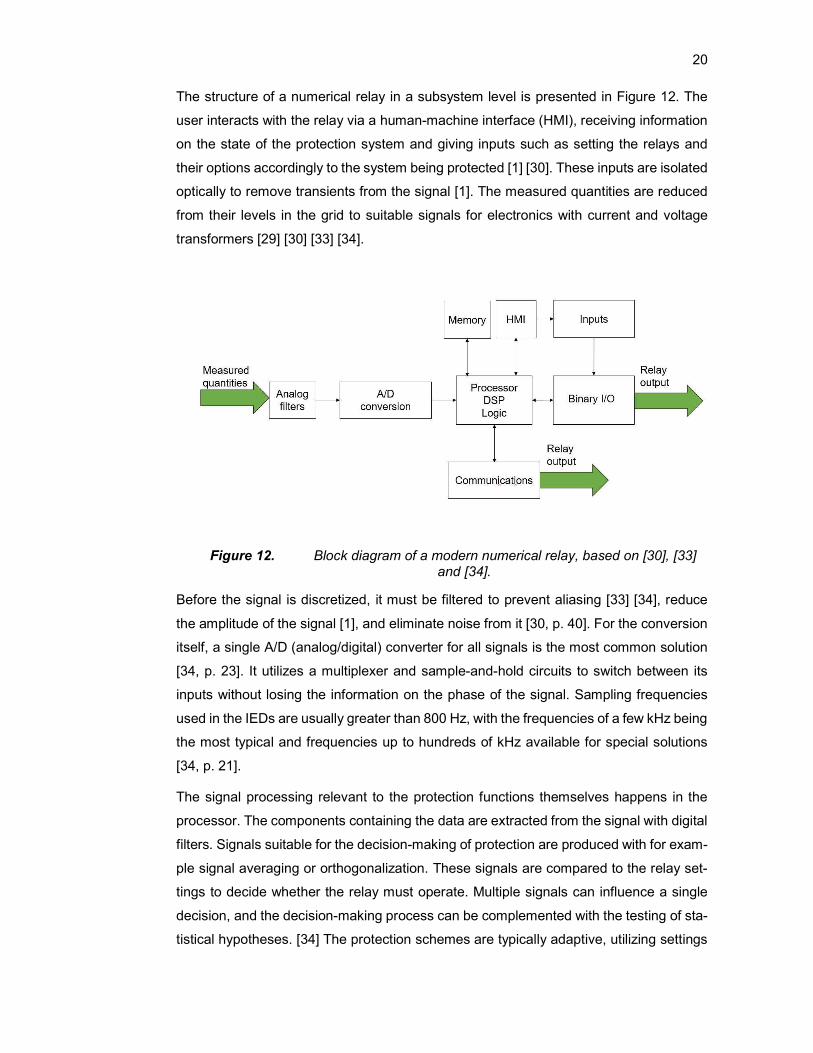
The structure of a numerical relay in a subsystem level is presented in Figure 12. The
user interacts with the relay via a human-machine interface (HMI), receiving information
on the state of the protection system and giving inputs such as setting the relays and
their options accordingly to the system being protected [1] [30]. These inputs are isolated
optically to remove transients from the signal [1]. The measured quantities are reduced
from their levels in the grid to suitable signals for electronics with current and voltage
transformers [29] [30] [33] [34].
Figure 12. Block diagram of a modern numerical relay, based on [30], [33] and [34].
Before the signal is discretized, it must be filtered to prevent aliasing [33] [34], reduce
the amplitude of the signal [1], and eliminate noise from it [30, p. 40]. For the conversion
itself, a single A/D (analog/digital) converter for all signals is the most common solution
[34, p. 23]. It utilizes a multiplexer and sample-and-hold circuits to switch between its
inputs without losing the information on the phase of the signal. Sampling frequencies
used in the IEDs are usually greater than 800 Hz, with the frequencies of a few kHz being
the most typical and frequencies up to hundreds of kHz available for special solutions
[34, p. 21].
The signal processing relevant to the protection functions themselves happens in the
processor. The components containing the data are extracted from the signal with digital
filters. Signals suitable for the decision-making of protection are produced with for exam-
ple signal averaging or orthogonalization. These signals are compared to the relay set-
tings to decide whether the relay must operate. Multiple signals can influence a single
decision, and the decision-making process can be complemented with the testing of sta-
tistical hypotheses. [34] The protection schemes are typically adaptive, utilizing settings

21
dependent on the system conditions [30] [33] [34]. An example of such process is the
percentage differential protection scheme introduced in chapter 3.3.2.
The trips and alarms are initiated according to the time-delay characteristics of the relay
if the tripping is not blocked due to a condition measured from the system. Finally, the
trip signal is transferred to the output module, in which a pulse for controlling the circuit
breakers is created and amplified from it. [30] Conventional binary outputs are becoming
replaced with communication networks, in which for example Ethernet and fibre cables
are used instead of copper wiring [30, p. 271]. Relays support different protocols and
fieldbuses widely. Examples of them include RS232, RS485, Modbus, DNP (Distributed
Network Protocol) 3.0 and Ethernet-based IEC 61850. [31]
The standard IEC 61850 defines the basis for substation communication network and its
methods of exchanging data. It introduces a concept of modelling data virtually with log-
ical devices and nodes. Physical devices are identified with their IP (Internet Protocol)
addresses, and they may contain several logical devices. A device communicates with
logical nodes and data objects, providing means for communication between physical
IEDs from different manufacturers. The standard supports several protocols for this com-
munication, such as Generic Object-Oriented Substation Events (GOOSE). For instance,
these events can be used to transfer the trip signals to the IEDs controlling the breakers.
[1] [29] - [31]
Moreover, the standard defines an XML (Extensive Markup Language) -based system
configuration language. It enables the efficient use of configuration software for a thor-
ough design and implementation process of the system from system specification to the
configuration of a single relay and control of the substation. [1] [30] Although the file types
for different levels are specified in the standard, creating a process independent from the
manufacturers, the support for protection devices in hardware level is often limited. This
increases the amount of software required to the process, increasing complexity. [31]
However, a more standardized process would narrow the range of functionalities in the
protection system [30, p. 277].
The IED manufacturers provide specific software for configuring the devices. The soft-
ware includes all settings for different protection functions, the I/O (input/output) config-
uration of the relay, communication settings as well as the configuration of the user in-
terface. Examples of the configuration software are the S1 Agile for GE MiCOM relays,
the PCM600 by ABB and the Vampset for the Vamp relays by Schneider Electric. The
settings are saved in the software as specific files. Moreover, they can be transferred
directly to the relay by establishing a connection to it.

22
3.3 Protection functions
As described in chapter 3.2, several protection functions for different applications are
available in the modern IEDs. This chapter concentrates on the basic functionality of the
overcurrent and differential protection functions, which are modelled in this thesis.
3.3.1 Overcurrent protection
Overcurrent relays protect the power system against faults occurring both between
phases and between one or more phases and ground [1] [29] [30] [33]. An overcurrent
relay measures the current and handles it either directly as phase currents or expressed
in symmetrical components. Comparing the measurement result to the threshold set-
tings, it activates the trip command after the specified time delay when necessary. As an
input, the function utilizes RMS (root mean square) currents, peak values or instantane-
ous values depending on its application. Moreover, the function can be sensitive to the
fundamental component, a specified harmonic component or the entire waveform of the
measured current according to IEC 60255-151, which is the European standard for over-
current relays. [2]
The most common types of these relays are definite-time (DT) and inverse-time relays.
These relay types are often used together for selectivity, and both types are included in
IEDs as protection functions. For example, in the protection of STATCOMs and SVCs in
this thesis, the definite-time stage is applied for protection against faults, while the in-
verse-time stage acts as overload protection during normal operating conditions. With
the settings available, the protection relay is set to not operate with the largest currents
occurring during normal operation. When a three or two-phase short circuit occurs in the
protected area, the relay must always trip.
The standard [2] specifies the operating time characteristics of inverse definite minimum
time (IDMT) relays as
𝑡 (𝐼) = 𝑇𝑀𝑆 ∗( )
+ 𝑐, (5)
in which 𝐼 is the measured current and 𝐼 the pickup setting. The constants 𝑘 and 𝑐 have
the unit of seconds, while 𝛼 is unitless. The constant 𝑐 is zero for the IEC curves, which
are used in Europe. The time multiplier setting TMS, which is used to scale the operating
times, is unitless. Its value is typically 1. Different curve types for IDMT relays are spec-
ified in Table 3.
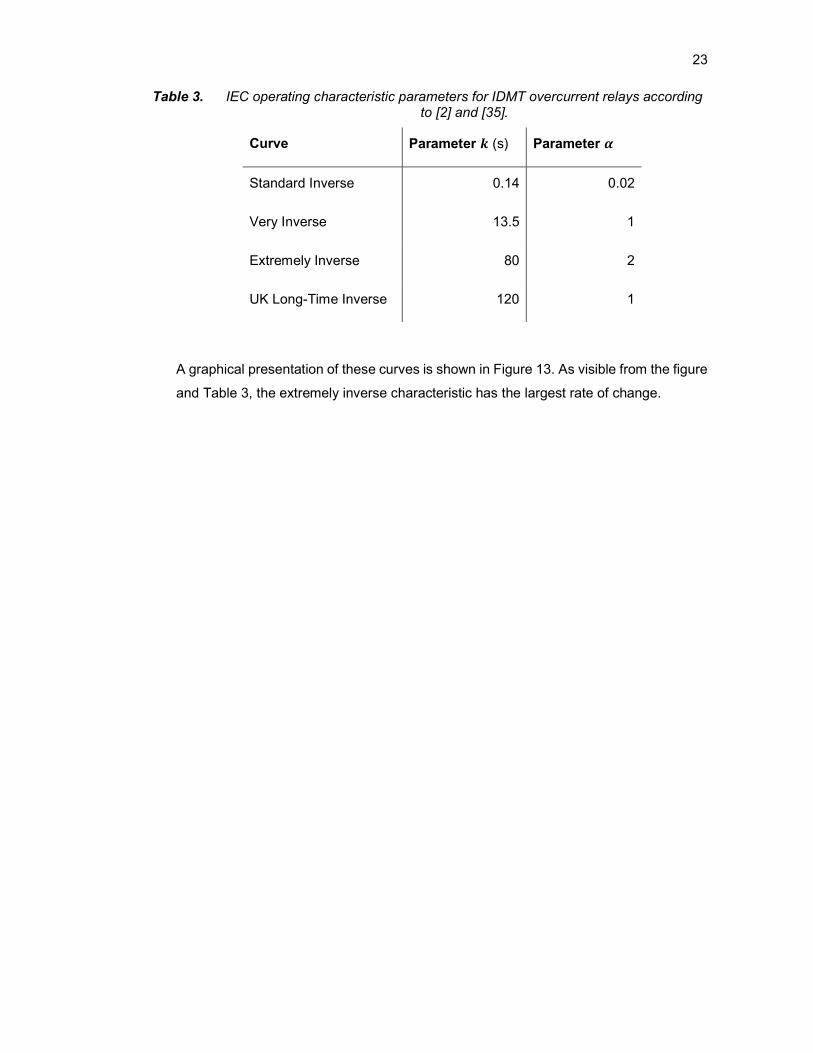
23
Table 3. IEC operating characteristic parameters for IDMT overcurrent relays according to [2] and [35].
Curve Parameter 𝒌 (s) Parameter 𝜶
Standard Inverse 0.14 0.02
Very Inverse 13.5 1
Extremely Inverse 80 2
UK Long-Time Inverse 120 1
A graphical presentation of these curves is shown in Figure 13. As visible from the figure
and Table 3, the extremely inverse characteristic has the largest rate of change.

24
Figure 13. IEC IDMT operating time curves [35, p. 77].
In addition to the operating time characteristics, reset characteristics of the form
𝑡 (𝐼) = 𝑇𝑀𝑆 ∗( )
(6)
25
are available in IDMT overcurrent protection functions. However, these characteristics
are more common in connection with the American IEEE characteristics. According to
the standard IEC 60255-151 [2, p. 29], the implementation of this reset time characteristic
is optional to the manufacturers. In Europe, the relay is usually reset with or without a
definite-time delay. In this thesis, the relays have been modelled to reset after a definite-
time delay, with a hysteresis between the pickup and dropdown values.
The definite-time overcurrent protection picks up with currents larger than the pickup
setting and operates if a time delay set by the user expires. Thus, this protection function
has a time characteristic independent from the currents, opposed to the current-depend-
ent time characteristic of an IDMT function. [2]
3.3.2 Differential protection
In this chapter, the main principles for differential protection of transformers, reactors,
rotating machines and busbars are introduced. The differential protection is a well-known
function with versatile applications in the protection of these components. Thus, it is used
widely in FACTS systems. Moreover, it forms the basis for pilot protection for transmis-
sion lines, in which two relays at the ends of a line communicate with each other by
means of communication technology to improve the fault detection possibilities. [29] [33]
In rotating machines and reactors, the fault types are similar to transformers. In addition
to short circuits, open circuits and earth faults, turn-to-turn faults must be considered in
the protection of the inductive components of the network. Therefore, the principles of
differential protection for these components are similar independent from the component.
[30] However, the change of voltage level in the transformer sets additional requirements
for transformer protection.
Fundamentally, the differential protection is based on Kirchhoff’s current law, as shown
in Figure 14 with a protection scheme for a power transformer. During normal operation
of the component being protected, the currents flowing in and out of it are equal. The
currents are measured with current transformers (CT) from both sides of the component.
If the component itself malfunctions, the currents become unequal, which is seen by the
relay as a nonzero differential current
𝑖 , = 𝑖 − 𝑖 . (7)
An external fault elsewhere in the power system leaves the monitored currents unaf-
fected. The currents 𝑖 in equation 7 are measured from the high voltage (HV) side
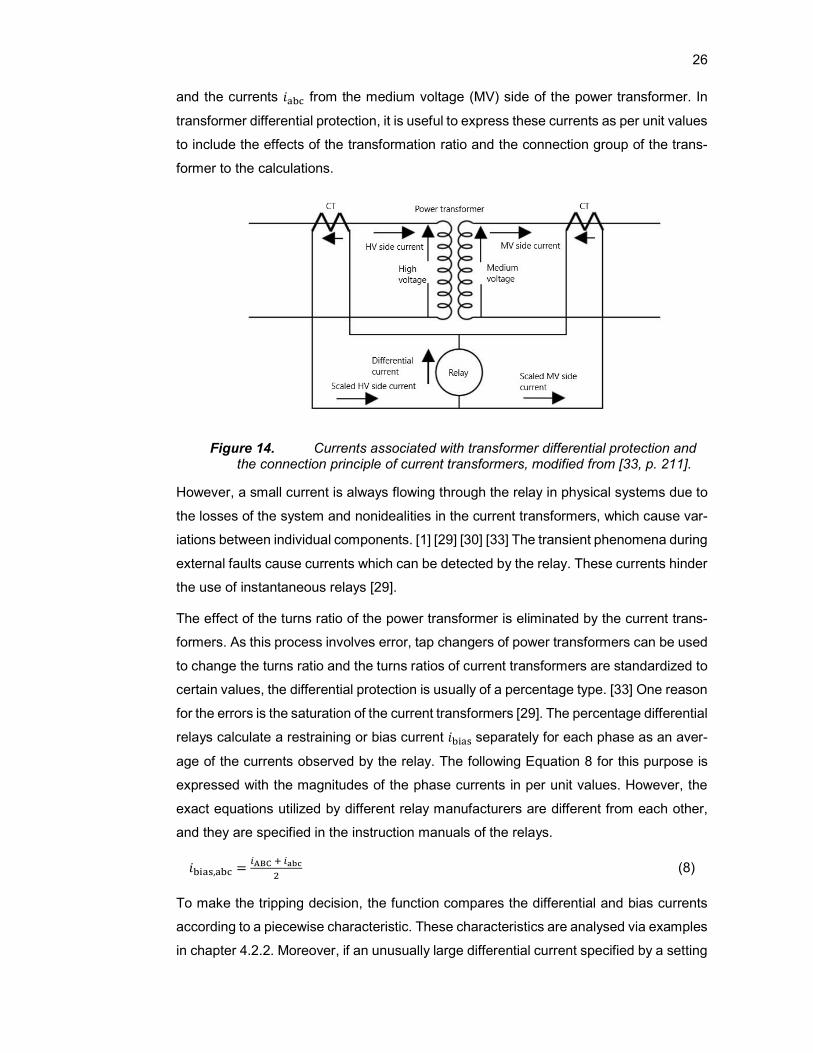
26
and the currents 𝑖 from the medium voltage (MV) side of the power transformer. In
transformer differential protection, it is useful to express these currents as per unit values
to include the effects of the transformation ratio and the connection group of the trans-
former to the calculations.
Figure 14. Currents associated with transformer differential protection and the connection principle of current transformers, modified from [33, p. 211].
However, a small current is always flowing through the relay in physical systems due to
the losses of the system and nonidealities in the current transformers, which cause var-
iations between individual components. [1] [29] [30] [33] The transient phenomena during
external faults cause currents which can be detected by the relay. These currents hinder
the use of instantaneous relays [29].
The effect of the turns ratio of the power transformer is eliminated by the current trans-
formers. As this process involves error, tap changers of power transformers can be used
to change the turns ratio and the turns ratios of current transformers are standardized to
certain values, the differential protection is usually of a percentage type. [33] One reason
for the errors is the saturation of the current transformers [29]. The percentage differential
relays calculate a restraining or bias current 𝑖 separately for each phase as an aver-
age of the currents observed by the relay. The following Equation 8 for this purpose is
expressed with the magnitudes of the phase currents in per unit values. However, the
exact equations utilized by different relay manufacturers are different from each other,
and they are specified in the instruction manuals of the relays.
𝑖 , =
(8)
To make the tripping decision, the function compares the differential and bias currents
according to a piecewise characteristic. These characteristics are analysed via examples
in chapter 4.2.2. Moreover, if an unusually large differential current specified by a setting
27
for immediate trip is measured, the relay can be tripped independently from the bias
current.
The effect of the vector group and connections of the windings of the power transformer
are also included in the calculations of differential protection. Connecting the current
transformers in delta if the power transformer winding is connected in wye and vice versa
removes the effect of zero-sequence current present in wye connections on the relay
operation. [1] [29] [30] In addition, these connections provide the compensation for the
30° phase shift between wye and delta connections. This principle is extended to the
vector group matching by selecting the order of the phases in the connections correctly.
[33] In current transformers, the amplitude difference between windings affects the di-
mensioning of the turns ratios with a factor of √3. [30] [33]
The nonlinear nature of transformers sets special considerations for their differential pro-
tection. During the energization of a transformer, the magnetizing inrush current flowing
to the primary side of it causes a large differential current, as this current is not present
in the secondary side. [1] [29] [30] [33] Other reasons for these currents include voltage
dips and sags and the energization of another transformer for example in parallel with
the one already in operation [29, p. 294] This phenomenon can be prevented from caus-
ing a trip by blocking the relay during the magnetization with a suitable time delay or a
supervisory unit [30, p. 151]. Another problem with designing differential protection for
transformers is related to overvoltage and underfrequency situations, which may lead to
overexcitation. The overexcitation protection is implemented separately, as the mathe-
matical characteristics of the differential relays are not suitable for this application. There-
fore, the differential protection must be blocked if the transformer is overexcited. [29, p.
195]
A common solution for these nonlinearity problems is a supervisory unit taking ad-
vantage of filtering the current. The dominating component in the magnetization inrush
current is the second harmonic, which is used to identify the inrush phenomena. In mod-
ern transformers with advanced core materials, the relative amount of inrush current is
often as low as 7 %. The excitation current contains only odd harmonics, and therefore
the detection of overexcitation is based on the amount of for example fifth harmonic in
the differential current. [29] [33]
For rotating machines, differential protection relays are used particularly for large ma-
chines with apparent powers of over 1 MVA, while flux summation transformers with
overcurrent relays are a preferred solution for smaller machines [29, p. 392]. Turn-to-
28
turn faults in reactors or transformers cannot be detected by a traditional differential re-
lay. However, the algorithm by Das et al [36] solves this issue by calculating the differ-
ential quantity from normalized negative-sequence voltages and currents. If a turn-to-
turn fault occurs, this quantity will be nonzero, unlike during normal operation.
Busbar faults are critical for the power system due to the connecting role of the busbar.
Gers and Holmes [30] introduce the possibility of connecting current transformers in par-
allel to take advantage of multiple restraints. Horowitz and Phadke [33, p. 237] examine
the issue of unequal core saturation in current transformers. For this reason, the busbar
differential protection is often implemented with a high-impedance voltage relay. This
relay type includes an overvoltage relay for selective operation between internal and
external faults, as well as an overcurrent relay for fast tripping during faults with high
current levels. The current transformers for this solution have equal turns ratios and are
usually operated without the use of taps [29, p. 378].
In STATCOM and SVC applications, the functions of the busbar differential protection
are typically performed by overcurrent and residual overvoltage protection instead.
These functions can reliably detect faults in a busbar isolated from earth. A trip leads to
the de-energization the entire busbar, clearing the fault. The busbar differential protec-
tion is thus only present in situations where automatic fault location is required.
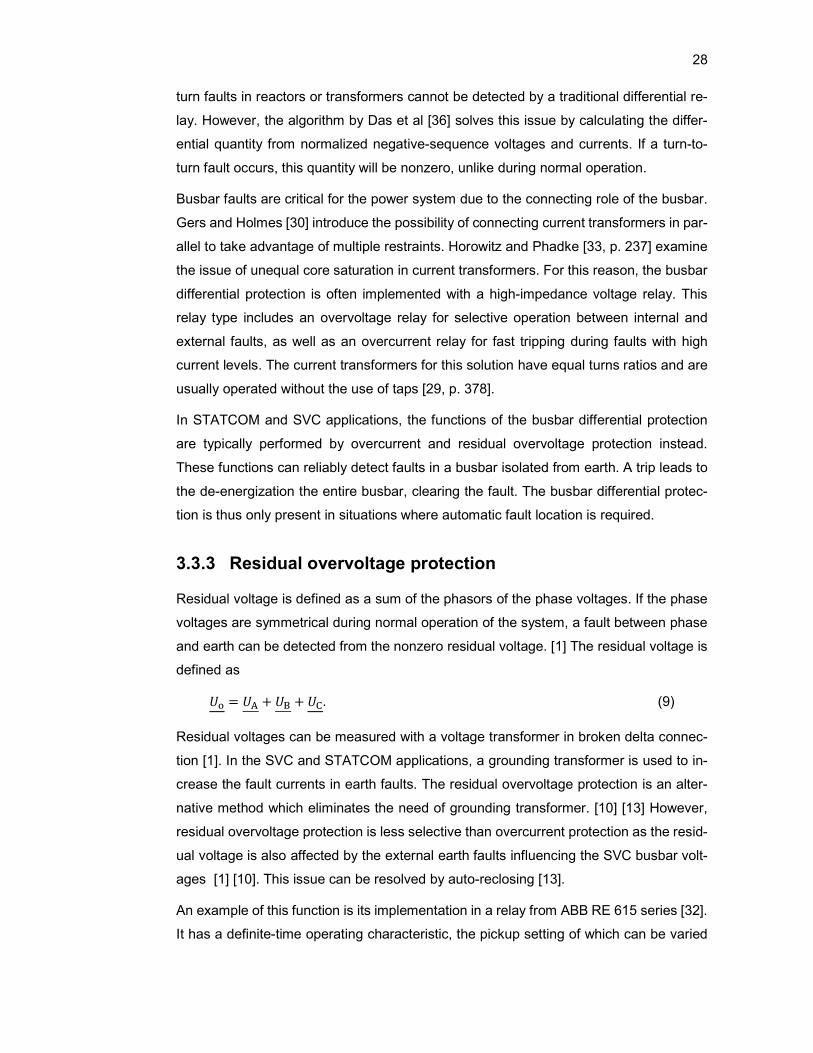
3.3.3 Residual overvoltage protection
Residual voltage is defined as a sum of the phasors of the phase voltages. If the phase
voltages are symmetrical during normal operation of the system, a fault between phase
and earth can be detected from the nonzero residual voltage. [1] The residual voltage is
defined as
𝑈 = 𝑈 + 𝑈 + 𝑈 . (9)
Residual voltages can be measured with a voltage transformer in broken delta connec-
tion [1]. In the SVC and STATCOM applications, a grounding transformer is used to in-
crease the fault currents in earth faults. The residual overvoltage protection is an alter-
native method which eliminates the need of grounding transformer. [10] [13] However,
residual overvoltage protection is less selective than overcurrent protection as the resid-
ual voltage is also affected by the external earth faults influencing the SVC busbar volt-
ages [1] [10]. This issue can be resolved by auto-reclosing [13].
An example of this function is its implementation in a relay from ABB RE 615 series [32].
It has a definite-time operating characteristic, the pickup setting of which can be varied

29
between 0.010...1.000 times the nominal residual voltage of the system. Either voltages
measured with voltage transformers or calculated from the phase voltages can be used.
In the latter case, the nominal residual voltage is a line-to-line quantity, which limits the
pickup setting to be less than √
times this voltage. The operation of a definite-time relay
has been considered in chapter 3.3.1.
3.3.4 Protection of capacitor banks
This thesis considers two common protection functions required for shunt capacitor bank
protection in FACTS applications: overvoltage and unbalance protection. In STATCOMs
and SVCs, capacitor banks are utilized in TSCs and harmonic filters. The banks are
constructed from units, which in turn include connections of individual capacitor ele-
ments. The protection relays monitor the currents of the entire bank, while the capacitor
elements are typically protected with fuses [37].
The capacitor banks are sensitive to damage from overvoltages, which cause partial
discharges detrimental to the dielectric properties of the capacitors. These overvoltages
occur in both normal capacitor operation and during exceptional conditions. For example,
switching transients cause current spikes that might lead to overvoltages. [37] To elimi-
nate the voltage transformers, capacitor overvoltage protection is typically based on in-
tegration of the capacitor voltage from its current as shown by equation 10. The quanti-
ties are expressed as functions of time.
𝑢(𝑡) = ∫ 𝑖(𝑡)d𝑡 (10)
The calculated voltage is compared to an inverse-time characteristic defined by stand-
ards and individual relay manufacturers. An example of such characteristic is found in
Figure 15, which is originally presented in the IEEE Std 1036-2010 standard [38]. The
voltage axis uses per unit values relative to the rated RMS voltage of a capacitor unit.
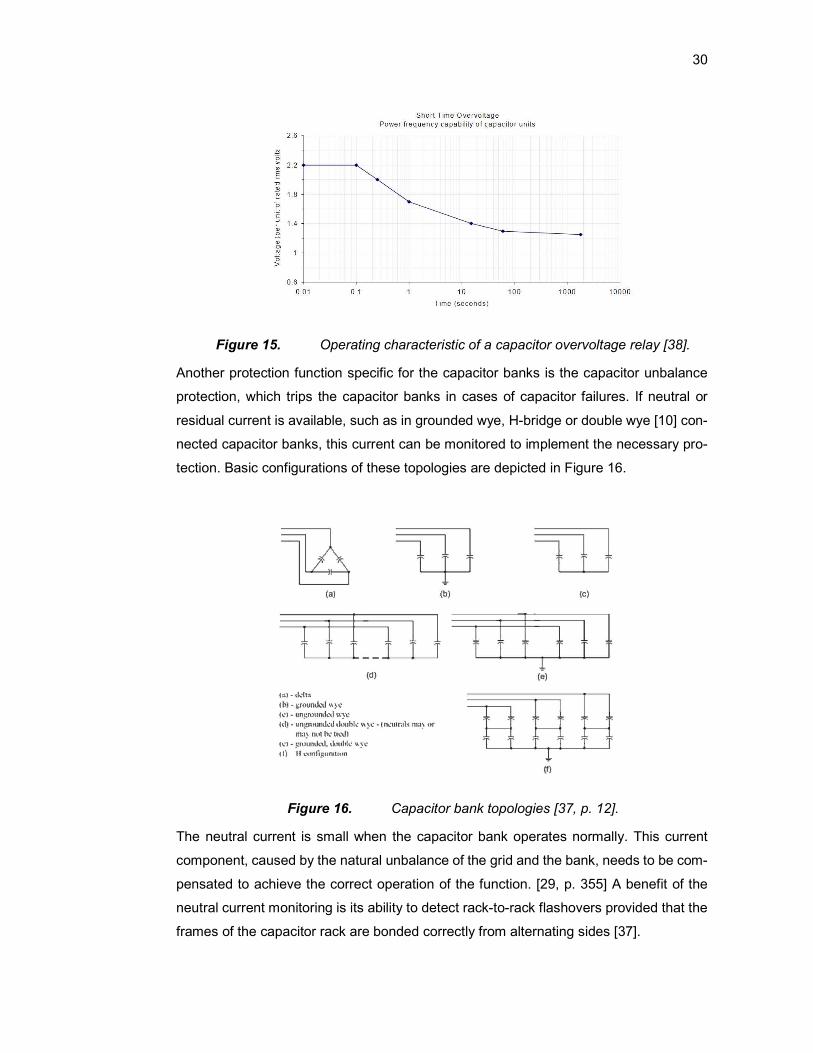
30
Figure 15. Operating characteristic of a capacitor overvoltage relay [38].
Another protection function specific for the capacitor banks is the capacitor unbalance
protection, which trips the capacitor banks in cases of capacitor failures. If neutral or
residual current is available, such as in grounded wye, H-bridge or double wye [10] con-
nected capacitor banks, this current can be monitored to implement the necessary pro-
tection. Basic configurations of these topologies are depicted in Figure 16.
Figure 16. Capacitor bank topologies [37, p. 12].
The neutral current is small when the capacitor bank operates normally. This current
component, caused by the natural unbalance of the grid and the bank, needs to be com-
pensated to achieve the correct operation of the function. [29, p. 355] A benefit of the
neutral current monitoring is its ability to detect rack-to-rack flashovers provided that the
frames of the capacitor rack are bonded correctly from alternating sides [37].

31
Standard IEEE C37.99-2012 [37] defines four different configurations for capacitor bank
fusing and structure. Fuses are placed either externally or internally. The external solu-
tion protects multiple elements simultaneously by protecting the entire unit. Internal fuses
are common in the capacitor banks of TSCs and harmonic filters [10]. They are con-
nected in series with individual capacitor elements. If the element fails, the increasing
current causes the operation of the fuse, removing the failed element from the circuit.
This, in turn, increases the unbalance current. Fuseless banks are based on the placing
of capacitor units in series strings, while unfused banks include both series and parallel
connections of units.
Brandi et al [39] introduce an example of an unbalance protection scheme in an H-bridge
capacitor bank shown in Figure 17. The current 𝐼 is the unbalance current in the neu-
tral wire. The arms of the connection, which consist of multiple individual capacitor ele-
ments, are dimensioned to meet the following criterion for their total impedances:
= (11)
This leads to a balanced capacitor bank, for which the neutral current is close to zero.
The bank is designed to continue its operation normally if only one capacitor element
fails. In this scheme, an alarm is given after two failures and the bank is tripped if at least
five failures occur. Protection against flashovers is provided with a fast tripping stage.
[39] Moreover, in case of a cascading fault, the bank should be tripped immediately [37].
Figure 17. H-bridge capacitor bank, symbols simplified from [39].
A significant unbalance can cause damage to the system via overvoltages affecting the
healthy elements, false operation of the capacitor bank fuses or changing the operating
point of a filter application from the desired tuning frequency. In addition to the cascading
faults, a fault leading to the immediate tripping of a capacitor bank is an insulator failure
external to the capacitor unit. This kind of failure involves arcing. Although the insulators

32
are outside the capacitor unit, they are inside the protection zone of the unbalance pro-
tection. [37]
The design of a capacitor unbalance protection should consider the possibility of ambig-
uous indication. For instance, several simultaneous failures lead to a risk of their effects
being cancelled out by each other. Thus, an operating fuse or a short circuit fault in an
element in the double wye or the H-bridge capacitor bank might prevent the correct op-
eration of the unbalance protection by cancelling the unbalance signal caused elsewhere
in the bank. [37]
Special requirements apply for the design of capacitor banks and their protection sys-
tems in power quality applications. In filters, harmonic contents are high and therefore
larger voltage ratings of the capacitors and current ratings of the fuses than in typical
applications are necessary. Moreover, due to the harmonics, the overvoltage protection
of capacitors in SVC monitors the peak values of voltage. [37]
3.3.5 Thermal overload protection
In a STATCOM or an SVC, reactors are the main applications for the thermal overload
protection. Thus, thermal overload protection functions are found in connection with
TCRs, the damping reactors of TSCs and the harmonic filters. In other components a
power system, thermal overload protection functions are also utilized with motors and
transformers.
The protection against thermal overloads with relays is based on both current and tem-
perature measurements. Thermal models are included in the function to calculate tem-
peratures and their predicted changes from the currents. When the thermal load is in-
creased, the function activates the alarm signal before the nominal thermal limit of a
component is reached. Exceeding these limits leads to a trip. The thermal model of the
relay operates according to an inverse-time characteristic derived from a first-order ther-
mal system. [40]
Resistive losses in the windings of a transformer as well as the hysteresis and eddy
current losses of its core form a significant part of its thermal load. Therefore, the thermal
loads of the transformer can be reduced by an appropriate design. From the windings
and the core, the heat is transferred to the insulations, oil, and finally to the walls of the
transformer. The overload of a transformer leads to fast aging of the insulations and thus
the entire transformer. [41] As reactive components, the goals in the design of transform-
ers are applicable to reactors as well.
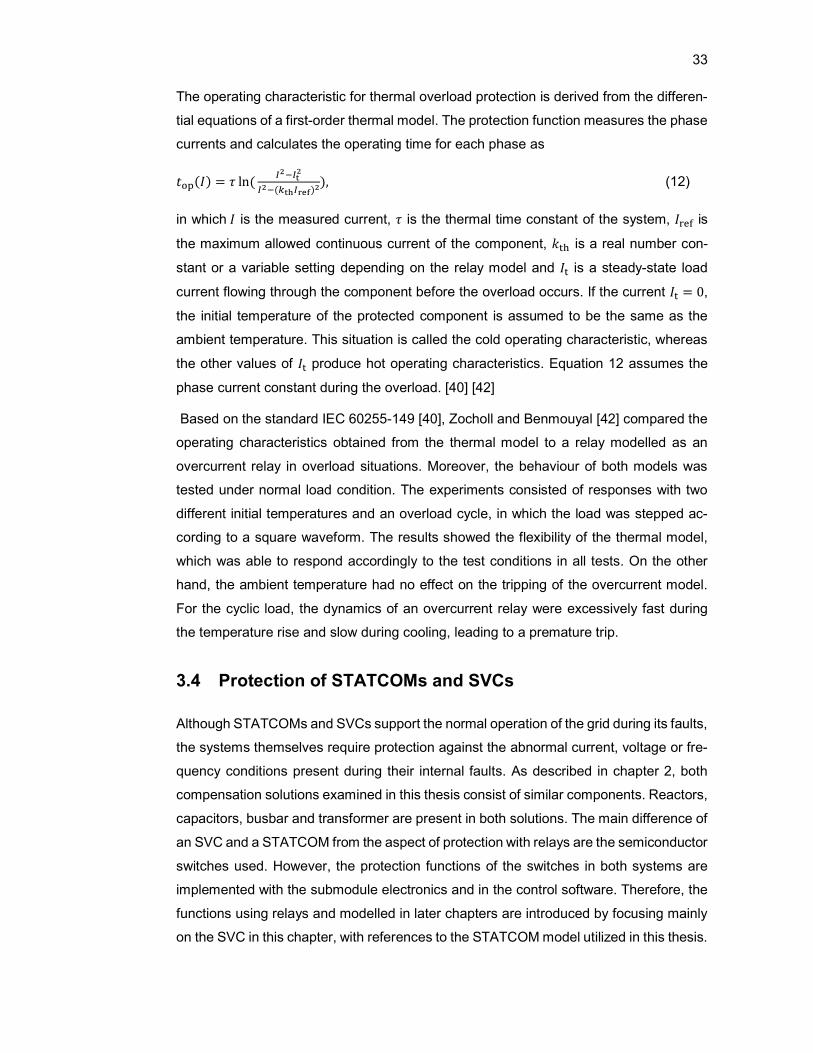
33
The operating characteristic for thermal overload protection is derived from the differen-
tial equations of a first-order thermal model. The protection function measures the phase
currents and calculates the operating time for each phase as
𝑡 (𝐼) = 𝜏 ln(( )
), (12)
in which 𝐼 is the measured current, 𝜏 is the thermal time constant of the system, 𝐼 is
the maximum allowed continuous current of the component, 𝑘 is a real number con-
stant or a variable setting depending on the relay model and 𝐼 is a steady-state load
current flowing through the component before the overload occurs. If the current 𝐼 = 0,
the initial temperature of the protected component is assumed to be the same as the
ambient temperature. This situation is called the cold operating characteristic, whereas
the other values of 𝐼 produce hot operating characteristics. Equation 12 assumes the
phase current constant during the overload. [40] [42]
Based on the standard IEC 60255-149 [40], Zocholl and Benmouyal [42] compared the
operating characteristics obtained from the thermal model to a relay modelled as an
overcurrent relay in overload situations. Moreover, the behaviour of both models was
tested under normal load condition. The experiments consisted of responses with two
different initial temperatures and an overload cycle, in which the load was stepped ac-
cording to a square waveform. The results showed the flexibility of the thermal model,
which was able to respond accordingly to the test conditions in all tests. On the other
hand, the ambient temperature had no effect on the tripping of the overcurrent model.
For the cyclic load, the dynamics of an overcurrent relay were excessively fast during
the temperature rise and slow during cooling, leading to a premature trip.
3.4 Protection of STATCOMs and SVCs
Although STATCOMs and SVCs support the normal operation of the grid during its faults,
the systems themselves require protection against the abnormal current, voltage or fre-
quency conditions present during their internal faults. As described in chapter 2, both
compensation solutions examined in this thesis consist of similar components. Reactors,
capacitors, busbar and transformer are present in both solutions. The main difference of
an SVC and a STATCOM from the aspect of protection with relays are the semiconductor
switches used. However, the protection functions of the switches in both systems are
implemented with the submodule electronics and in the control software. Therefore, the
functions using relays and modelled in later chapters are introduced by focusing mainly
on the SVC in this chapter, with references to the STATCOM model utilized in this thesis.

34
Contrary to the semiconductor components, the harmonic filters are protected purely by
protection relays.
The protection system of a static VAr compensator is implemented redundantly, with one
of the two systems present operating when the other fails. Figure 18 illustrates the re-
dundancy in an example protection scheme. For the simplicity of the protection, the faults
in the SVC system itself trip a single breaker. If the breaker fails to operate, the relays
send the trip command to the neighbouring breakers to isolate the compensator from the
grid. [13]
Figure 18. The protection functions implemented with relays in a protection scheme of SVC [13].
The transformer of the SVC is protected with differential and overcurrent relays. In addi-
tion to the electrical protection functions, the transformer is protected against oil leaks
and high gas pressures. [33] Both load and short circuit currents of the SVC transformers
are considerably large, typically over 10 kA on the SVC side for normal conditions and
over 50 kA in short circuits. These currents set special requirements for the current trans-
former used and lead to the requirement of two parallel current transformers. For the
same reason, the transformer of the SVC is recommended to be placed in a common
protection zone with the busbar. Protection against thermal overloads is often imple-
mented in the control system, which limits the TCR current when required. [10] Alterna-
tively, protection relays can be used for thermal overload protection.
35
Earth fault protection is implemented with the residual overvoltage protection introduced
in chapter 3.3.3 [10]. Another solution is to take advantage of a grounding transformer to
set the fault current to a suitable level, on which the current can trip the relays selectively.
This solution is utilized in the STATCOM analysed in chapter 5. However, the risk caused
by a large fault current over 1.5 kA to the thyristor valves must be minimized with a
correct grounding transformer dimensioning [33, p. 251].
In the STATCOM introduced in chapter 5, examples of typical functions implemented in
the control system instead of protection relays are overvoltage protection and the pro-
tection against abnormal frequencies. The modelling and setting calculations of these
functions is performed by the control engineers simultaneously to the control design it-
self.
Another exception to the basic design process for a protection function in these FACTS
projects involves the capacitor banks. From the aspect of system engineering, they con-
sist of multiple levels of subsystems and thus their protection design requires particularly
detailed analysis. Although the protection of the banks utilizes protection relays, it is often
analysed and its settings are calculated by the manufacturer of the capacitor bank. All
capacitor banks of the SVC are protected against unbalance. Halonen et al [10] have
used a capacitor bank connected in double wye for the filters. Like in the H-bridge con-
nection in the TSC, the unbalance protection of this capacitor bank is based on the un-
balance current.
In addition to the transformer, the differential protection is used in the TCR and TSC
branches for short circuit protection. The SVC energization must be considered in the
design of this function, as the DC components present in the waveforms during energiz-
ation lead to a risk of false tripping. [10] If a grounding transformer is included in the
system, the differential protection also protects against earth faults.
The following chapters form a beginning to modelling the different functions of the pro-
tection system for a STATCOM and the IED models used for them. In this thesis, the
process was started from the overcurrent protection of the reactor in front of the VSC
itself and the differential protection of the main transformer. In the physical reactor of the
VSC, the overcurrent protection provides the backup solution for the primary method of
differential protection. The structure of the Simulink models was designed to enable their
straightforward integration into the complicated and advanced automation system model
of the STATCOM.
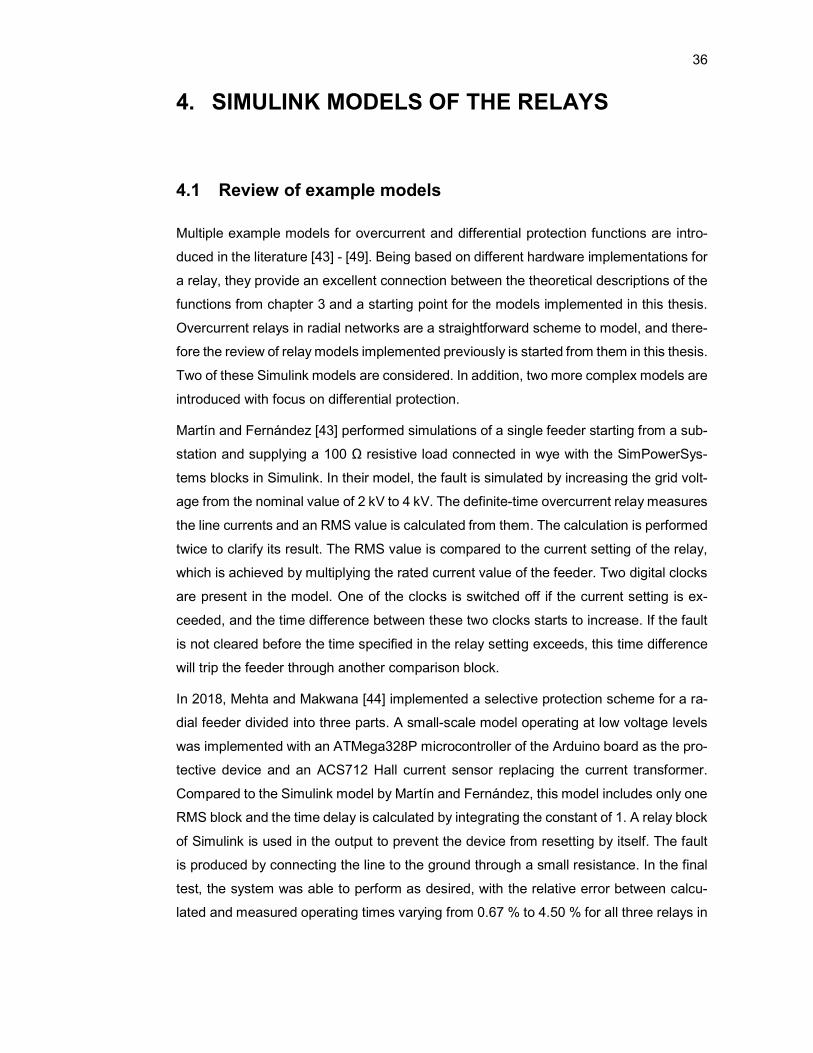
36
4. SIMULINK MODELS OF THE RELAYS
4.1 Review of example models
Multiple example models for overcurrent and differential protection functions are intro-
duced in the literature [43] - [49]. Being based on different hardware implementations for
a relay, they provide an excellent connection between the theoretical descriptions of the
functions from chapter 3 and a starting point for the models implemented in this thesis.
Overcurrent relays in radial networks are a straightforward scheme to model, and there-
fore the review of relay models implemented previously is started from them in this thesis.
Two of these Simulink models are considered. In addition, two more complex models are
introduced with focus on differential protection.
Martín and Fernández [43] performed simulations of a single feeder starting from a sub-
station and supplying a 100 Ω resistive load connected in wye with the SimPowerSys-
tems blocks in Simulink. In their model, the fault is simulated by increasing the grid volt-
age from the nominal value of 2 kV to 4 kV. The definite-time overcurrent relay measures
the line currents and an RMS value is calculated from them. The calculation is performed
twice to clarify its result. The RMS value is compared to the current setting of the relay,
which is achieved by multiplying the rated current value of the feeder. Two digital clocks
are present in the model. One of the clocks is switched off if the current setting is ex-
ceeded, and the time difference between these two clocks starts to increase. If the fault
is not cleared before the time specified in the relay setting exceeds, this time difference
will trip the feeder through another comparison block.
In 2018, Mehta and Makwana [44] implemented a selective protection scheme for a ra-
dial feeder divided into three parts. A small-scale model operating at low voltage levels
was implemented with an ATMega328P microcontroller of the Arduino board as the pro-
tective device and an ACS712 Hall current sensor replacing the current transformer.
Compared to the Simulink model by Martín and Fernández, this model includes only one
RMS block and the time delay is calculated by integrating the constant of 1. A relay block
of Simulink is used in the output to prevent the device from resetting by itself. The fault
is produced by connecting the line to the ground through a small resistance. In the final
test, the system was able to perform as desired, with the relative error between calcu-
lated and measured operating times varying from 0.67 % to 4.50 % for all three relays in
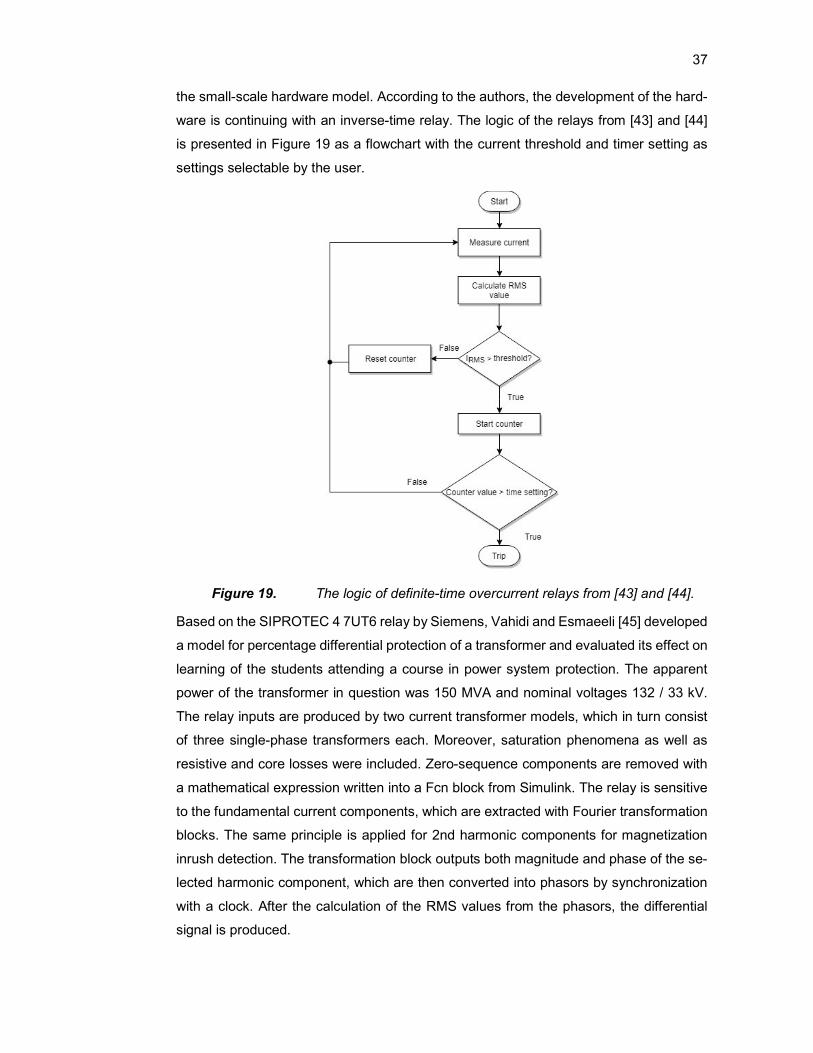
37
the small-scale hardware model. According to the authors, the development of the hard-
ware is continuing with an inverse-time relay. The logic of the relays from [43] and [44]
is presented in Figure 19 as a flowchart with the current threshold and timer setting as
settings selectable by the user.
Figure 19. The logic of definite-time overcurrent relays from [43] and [44].
Based on the SIPROTEC 4 7UT6 relay by Siemens, Vahidi and Esmaeeli [45] developed
a model for percentage differential protection of a transformer and evaluated its effect on
learning of the students attending a course in power system protection. The apparent
power of the transformer in question was 150 MVA and nominal voltages 132 / 33 kV.
The relay inputs are produced by two current transformer models, which in turn consist
of three single-phase transformers each. Moreover, saturation phenomena as well as
resistive and core losses were included. Zero-sequence components are removed with
a mathematical expression written into a Fcn block from Simulink. The relay is sensitive
to the fundamental current components, which are extracted with Fourier transformation
blocks. The same principle is applied for 2nd harmonic components for magnetization
inrush detection. The transformation block outputs both magnitude and phase of the se-
lected harmonic component, which are then converted into phasors by synchronization
with a clock. After the calculation of the RMS values from the phasors, the differential
signal is produced.

38
The protection function itself is implemented with a Matlab script. The settings of the
relay model include the current and bias settings, as well as the inrush current detection
setting for blocking the relay and a command feedback signal. The bias setting is used
to define the restraining current, which is also known as bias current. If the result of the
calculations or the command feedback signal indicates a fault, the system is tripped. The
time delay is calculated by integration. In the tests, the correct operation of the model
was verified in three-phase faults, two-phase faults with ground contact and single-phase
earth faults alike. [45]
Kezunovic et al have developed a Simulink extension named MERIT 2000 for educa-
tional purposes [46]. This library originates from the 1990s [47] but was upgraded to
MERIT 2016 in 2016 and is available for non-commercial use online [48]. The MERIT
2016 library consists of a series of complex blocks, which represent the subsystems of
electrical networks and protective relays. These blocks were designed to have extensive
setting opportunities to maximize the flexibility of them, thus eliminating as many exces-
sive blocks as possible. They are programmed with the s-functions of Matlab. In addition,
the library includes blocks for the generation of system inputs and visual presentation of
the results. [47]
The protection functions introduced by Kezunovic et al and applicable to the scope of
this thesis include overcurrent protection and differential protection, which is modelled
for both transformers and busbars. However, the library also covers the blocks of imped-
ance and directional relays as well as pilot protection. First, a transducer transforms the
current measurement result to a voltage signal. All measurement signals are filtered with
a low-pass filter to prevent aliasing and converted to digital form with a suitable voltage
level. The A/D converter of this data acquisition block is implemented with a sample and
hold circuit. Typically, the next block of the relay model is a block of orthogonal compo-
nents. It processes the signals to two orthogonal components with FIR (Finite Impulse
Response) filters. The FFT (Fast Fourier Transform) extracts the fundamental compo-
nents or the desired harmonic component by calculations over either the full fundamental
period of the signal or one half of it. The full cycle algorithm is slower and detects only
the fundamental component. Finally, the component is converted into a phasor with trig-
onometry. An alternative approach to the FFT uses a Walsh filter. [46]
The protection system of a transmission line consists of a directional relay and a residual
time overcurrent relay forming the primary protection. The redundancy required is pro-
vided by a time overcurrent relay. The faults are simulated by connecting phases to the
ground or each other through fault resistances. For time overcurrent relays, a Universal
Comparator block is applied for initiating the trip. This block is applicable for comparing
39
signals to a constant threshold or each other. However, usually its purpose is to calculate
the operating time for the relay according to the characteristics presented in chapter
3.3.1. As usually, instantaneous current values can be used for this calculation. However,
the block also has an option to monitor the average value of the current by integrating
the signal over the time during which it is greater than the pick-up current. Regardless of
the calculation method of the operating time, the trip logic itself is typical. If the instanta-
neous current stays above the pick-up value longer than the calculated operating time,
the relay is tripped. If it drops below the pick-up level, the relay is reset immediately. The
directional relays of the model are based on a comparison of the line voltages and cur-
rents. [46]
The differential protection scheme shown in Figure 20 starts from the calculation of the
differential and restraining currents of a percentage differential relay. In transformers, the
block compensates the effect of different connection groups before the data acquisition
block and FFT. Magnetization inrush currents are detected based on the second and
overexcitation based on the fifth harmonic. The relay is tripped according to the charac-
teristic from chapter 3.3.2 or immediately if a pre-set differential current value is ex-
ceeded. For busbars, the saturation risk of current transformers sets an additional chal-
lenge. During saturation, 2nd and 5th harmonics are produced to the input of the relay.
Therefore, a special harmonic restraint calculating the THD (Total Harmonic Distortion)
from the harmonic components up to the 5th harmonic is available for blocking the relay.
The trip occurs only if the pick-up current is exceeded, the characteristic indicates a fault
internal to the protection zone and the THD is sufficiently small compared to the funda-
mental differential current. [46]

40
Figure 20. Logic of a differential relay, based on [46].
Although the modelling of the characteristics associated with these two protection func-
tions is a well-known topic, the IEDs typically include reset characteristics and blocking
signals, which are modelled in this thesis. The timers of the relays can hold their values
or continue counting despite a fault current dropping temporarily to the normal level of
the system during the fault. If the fault is cleared, the timers will reset.
Previous research from Tampere University of Technology includes a master thesis by
Virta [49]. The thesis considered a power plant application with VAMP 140 and 210 IED
models from the Finnish company Vamp Oy, which is nowadays a part of Schneider
Electric. One of the functions modelled was overcurrent protection with DT and IDMT
stages included. The model used a Relay block from Simulink to produce the pickup
signal and a sample and hold circuit to measure the operating time for the IDMT stage.
The DT stage operating time is measured by an On / Off delay block from SimPowerSys-
tems.
Kezunovic et al developed their relay models with a Simulink library specifically created
for this purpose. In this thesis, models based entirely on the conventional and SimPow-
erSystems Simulink blocks available in the full version of Matlab are proposed. In addi-
tion, the models are designed for being utilized as a part of the automation system design
of STATCOMs and SVCs, as well as comparing different commercial IED models to each
other.
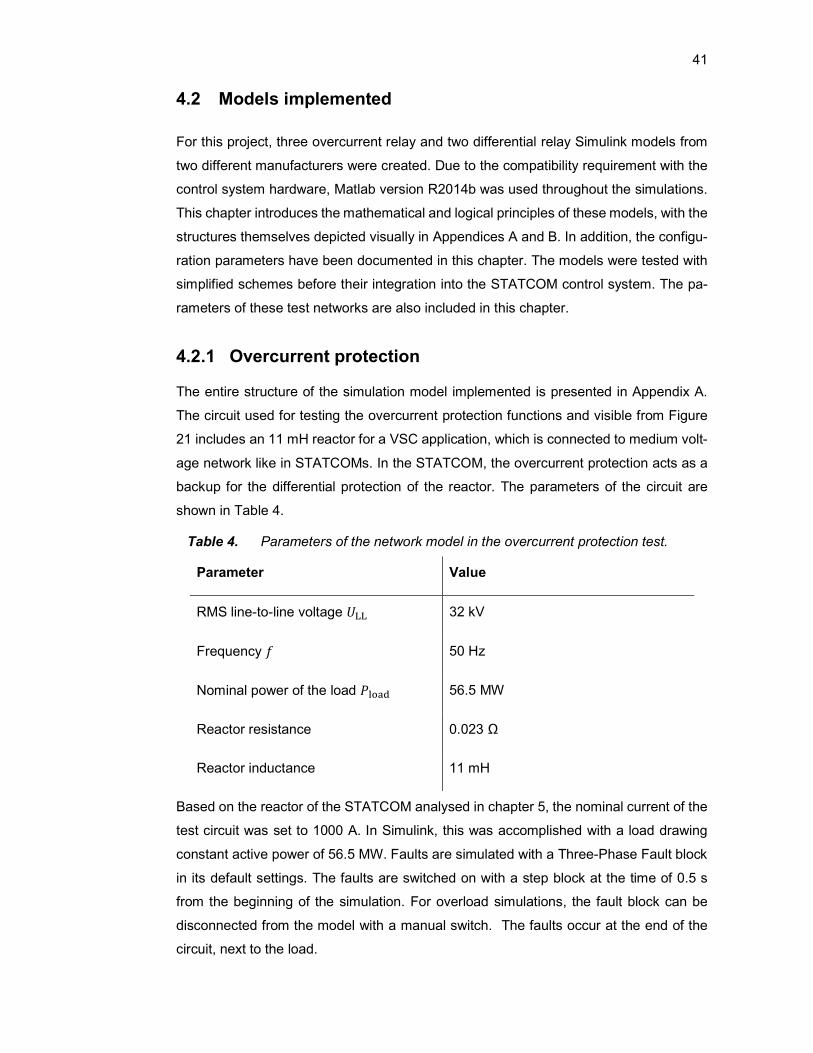
41
4.2 Models implemented
For this project, three overcurrent relay and two differential relay Simulink models from
two different manufacturers were created. Due to the compatibility requirement with the
control system hardware, Matlab version R2014b was used throughout the simulations.
This chapter introduces the mathematical and logical principles of these models, with the
structures themselves depicted visually in Appendices A and B. In addition, the configu-
ration parameters have been documented in this chapter. The models were tested with
simplified schemes before their integration into the STATCOM control system. The pa-
rameters of these test networks are also included in this chapter.
4.2.1 Overcurrent protection
The entire structure of the simulation model implemented is presented in Appendix A.
The circuit used for testing the overcurrent protection functions and visible from Figure
21 includes an 11 mH reactor for a VSC application, which is connected to medium volt-
age network like in STATCOMs. In the STATCOM, the overcurrent protection acts as a
backup for the differential protection of the reactor. The parameters of the circuit are
shown in Table 4.
Table 4. Parameters of the network model in the overcurrent protection test.
Parameter Value
RMS line-to-line voltage 𝑈 32 kV
Frequency 𝑓 50 Hz
Nominal power of the load 𝑃 56.5 MW
Reactor resistance 0.023 Ω
Reactor inductance 11 mH
Based on the reactor of the STATCOM analysed in chapter 5, the nominal current of the
test circuit was set to 1000 A. In Simulink, this was accomplished with a load drawing
constant active power of 56.5 MW. Faults are simulated with a Three-Phase Fault block
in its default settings. The faults are switched on with a step block at the time of 0.5 s
from the beginning of the simulation. For overload simulations, the fault block can be
disconnected from the model with a manual switch. The faults occur at the end of the
circuit, next to the load.
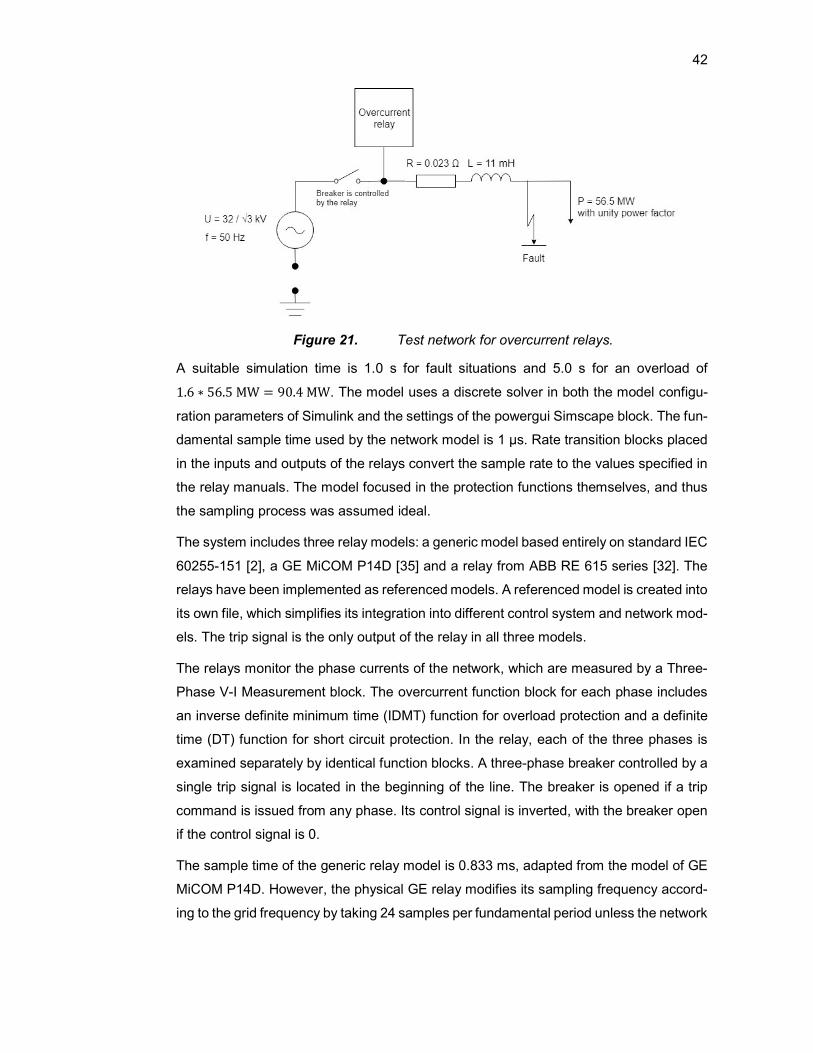
42
Figure 21. Test network for overcurrent relays.
A suitable simulation time is 1.0 s for fault situations and 5.0 s for an overload of
1.6 ∗ 56.5 MW = 90.4 MW. The model uses a discrete solver in both the model configu-
ration parameters of Simulink and the settings of the powergui Simscape block. The fun-
damental sample time used by the network model is 1 µs. Rate transition blocks placed
in the inputs and outputs of the relays convert the sample rate to the values specified in
the relay manuals. The model focused in the protection functions themselves, and thus
the sampling process was assumed ideal.
The system includes three relay models: a generic model based entirely on standard IEC
60255-151 [2], a GE MiCOM P14D [35] and a relay from ABB RE 615 series [32]. The
relays have been implemented as referenced models. A referenced model is created into
its own file, which simplifies its integration into different control system and network mod-
els. The trip signal is the only output of the relay in all three models.
The relays monitor the phase currents of the network, which are measured by a Three-
Phase V-I Measurement block. The overcurrent function block for each phase includes
an inverse definite minimum time (IDMT) function for overload protection and a definite
time (DT) function for short circuit protection. In the relay, each of the three phases is
examined separately by identical function blocks. A three-phase breaker controlled by a
single trip signal is located in the beginning of the line. The breaker is opened if a trip
command is issued from any phase. Its control signal is inverted, with the breaker open
if the control signal is 0.
The sample time of the generic relay model is 0.833 ms, adapted from the model of GE
MiCOM P14D. However, the physical GE relay modifies its sampling frequency accord-
ing to the grid frequency by taking 24 samples per fundamental period unless the network
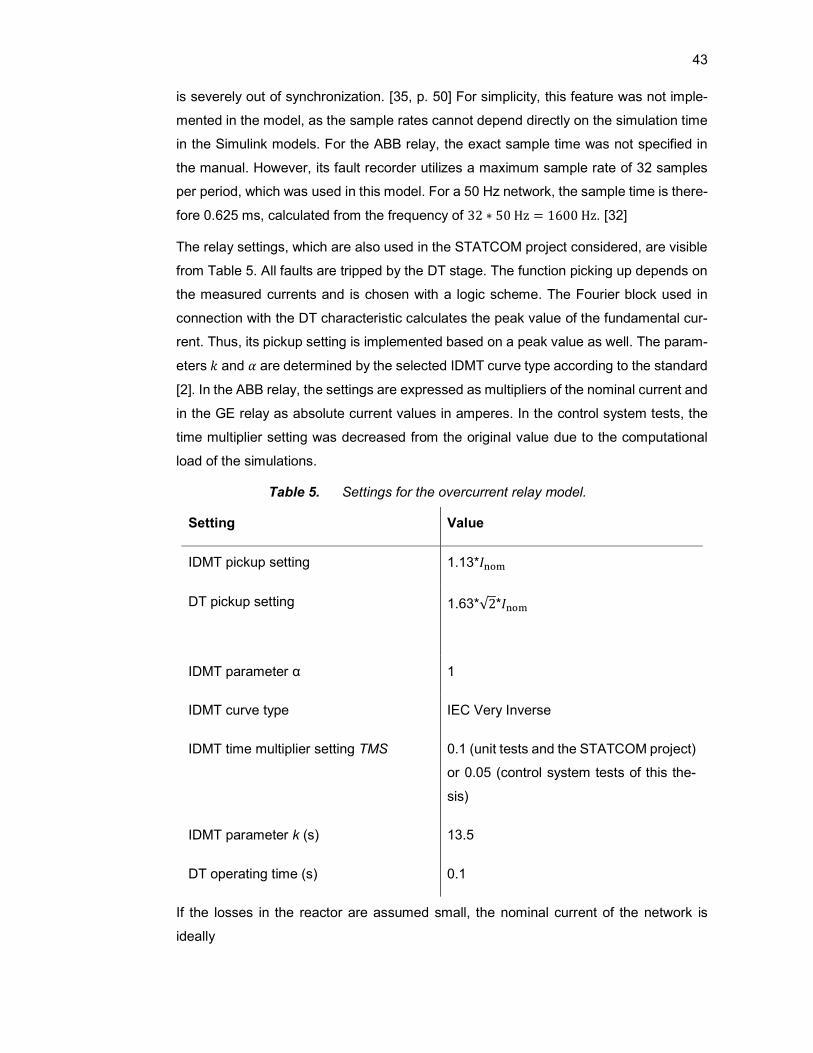
43
is severely out of synchronization. [35, p. 50] For simplicity, this feature was not imple-
mented in the model, as the sample rates cannot depend directly on the simulation time
in the Simulink models. For the ABB relay, the exact sample time was not specified in
the manual. However, its fault recorder utilizes a maximum sample rate of 32 samples
per period, which was used in this model. For a 50 Hz network, the sample time is there-
fore 0.625 ms, calculated from the frequency of 32 ∗ 50 Hz = 1600 Hz. [32]
The relay settings, which are also used in the STATCOM project considered, are visible
from Table 5. All faults are tripped by the DT stage. The function picking up depends on
the measured currents and is chosen with a logic scheme. The Fourier block used in
connection with the DT characteristic calculates the peak value of the fundamental cur-
rent. Thus, its pickup setting is implemented based on a peak value as well. The param-
eters 𝑘 and 𝛼 are determined by the selected IDMT curve type according to the standard
[2]. In the ABB relay, the settings are expressed as multipliers of the nominal current and
in the GE relay as absolute current values in amperes. In the control system tests, the
time multiplier setting was decreased from the original value due to the computational
load of the simulations.
Table 5. Settings for the overcurrent relay model.
Setting Value
IDMT pickup setting 1.13*𝐼
DT pickup setting
1.63*√2*𝐼
IDMT parameter α 1
IDMT curve type IEC Very Inverse
IDMT time multiplier setting TMS 0.1 (unit tests and the STATCOM project)
or 0.05 (control system tests of this the-
sis)
IDMT parameter k (s) 13.5
DT operating time (s) 0.1
If the losses in the reactor are assumed small, the nominal current of the network is
ideally

44
𝐼 =√ ∗
=.
√ ∗ = 1019 A. (13)
The characteristics for the IDMT overcurrent relay were presented in chapter 3.3.1. The
IDMT characteristic is sensitive to the true RMS value of the current, which is produced
by the RMS block from the SimPowerSystems library. However, depending on its appli-
cation, it can be easily converted to be sensitive to the fundamental component instead.
A power level of 90.4 MW produces an RMS current of
𝐼 =√ ∗
=.
√ ∗ = 1631 A (14)
in the network of Figure 21. Although the peak value produced by this current is larger
than the pickup level for the DT stage, the simulated current was found to be sufficiently
small to prevent the DT stage from tripping. According to Table 5 and the theoretical
nominal current of 1000 A, the IDMT stage of the relay picks up with measured currents
larger than 1130 A. For the overload, the IDMT characteristic presented in equation 5
therefore gives an operating time of
𝑡 = 𝑇𝑀𝑆 ∗( )
= 0.1 ∗.
= 3.04 s. (15)
As the operating time is a physical quantity, the IDMT stage does not give an operate
command if the calculated operating time given by equation 5 is negative. This is typical
of normal operating conditions due to the small measured current. In Simulink, the IDMT
operating time is calculated similarly to the thesis by Virta with a division by zero preven-
tion logic included [49, p. 31].
In all the relays of this project, the trip signal is issued if the pickup signal is active and
the operating delays associated with the function and the relay have expired. Due to the
slow dynamics of the IDMT function in overload protection, the overcurrent relays were
modelled as ideal with only the operating characteristic itself affecting the relay operation.
In physical systems, all IEDs as well as the control system send a trip pulse to a lockout
relay, which in turn transmits the signal to the circuit breaker. In Simulink models, the
purpose of the lockout relay is to keep the breaker model open after the trip. Thus, it has
been implemented with an SR (Set Reset) flip flop. The SR flip flop found in the Simscape
library of Simulink with the name “Bistable” can be set to prioritize the reset signal to
avoid any invalid states, providing exactly the desired truth table for its applications in
the relay models. The SR flip flops are common in the implemented models. Their other
applications include the reset logic of timers and setting the pickup signal.
The main difference between the relays compared is related to the reset process of the

45
timers. All timers related to the operating characteristics are implemented as backward
Euler discrete integrators integrating the constant of 1. The discrete integrator includes
an option for reset with an external signal. This is a particularly useful feature for delayed
reset logic found in the commercial relays, as well as resetting the relays in more com-
plicated tests consisting of longer periods of operation with several faults. In the unit tests
of this chapter, the faults were assumed to persist until the breaker is opened due to a
trip. Therefore, the generic relay model does not reset its timers if the fault is cleared
before tripping. However, the model can be easily complemented with this feature based
on the solutions implemented for the commercial relays.
If the problem present in the network is cleared before the function issues the trip, the
pickup signal returns to 0. This occurs if the instantaneous measured current is less than
95 (GE) or 96 % (ABB) of the pickup setting. Both commercial relays considered include
a delayed reset function. If the pickup signal stays low for a time specified by the user,
the timer of the function is reset to 0 as well. This time setting was set to 0.5 s during the
development of the functions. In the ABB relay [32, p. 229], its default value is 20 ms,
which was used for both commercial relays in the unit tests.
In addition to the delayed reset, the timer value is stored in GE and ABB relays alike if
the timer is blocked. When the blocking is removed, the integration continues from this
value. Moreover, the GE MiCOM P14D behaves similarly if the pickup signal of the relay
drops down temporarily without resetting the timer. The ABB RE 615 series relay differs
from the GE relay by keeping the timer counting during dropdown periods until the timer
is reset or a trip command is given. To eliminate any complicated test scenarios, the
delayed reset logic of both commercial relays was developed as separate models with
test pickup signals fed to it as inputs.
The available blocking signals include the timer blocking and a pickup blocking signal for
the GE MiCOM P14D. In addition to the timer blocking, the ABB relay has blocking sig-
nals for the trip output of the relay as well as for blocking the entire protection function.
If the trip output is blocked, the function continues to perform the calculations and com-
parisons normally, but the trip signal is not activated. The blocking of the entire function
has been modelled by setting all measurement inputs to zero and resetting the timers if
the blocking signal in question is active. Besides the blocking signals, the ABB relay
includes a master trip handling function, from which a signal for resetting the latched trip
signal is included in the model. This signal is connected to the Reset port of the lockout
relay flip flop.
Test cases of the models included considered particularly two-phase short circuits, which
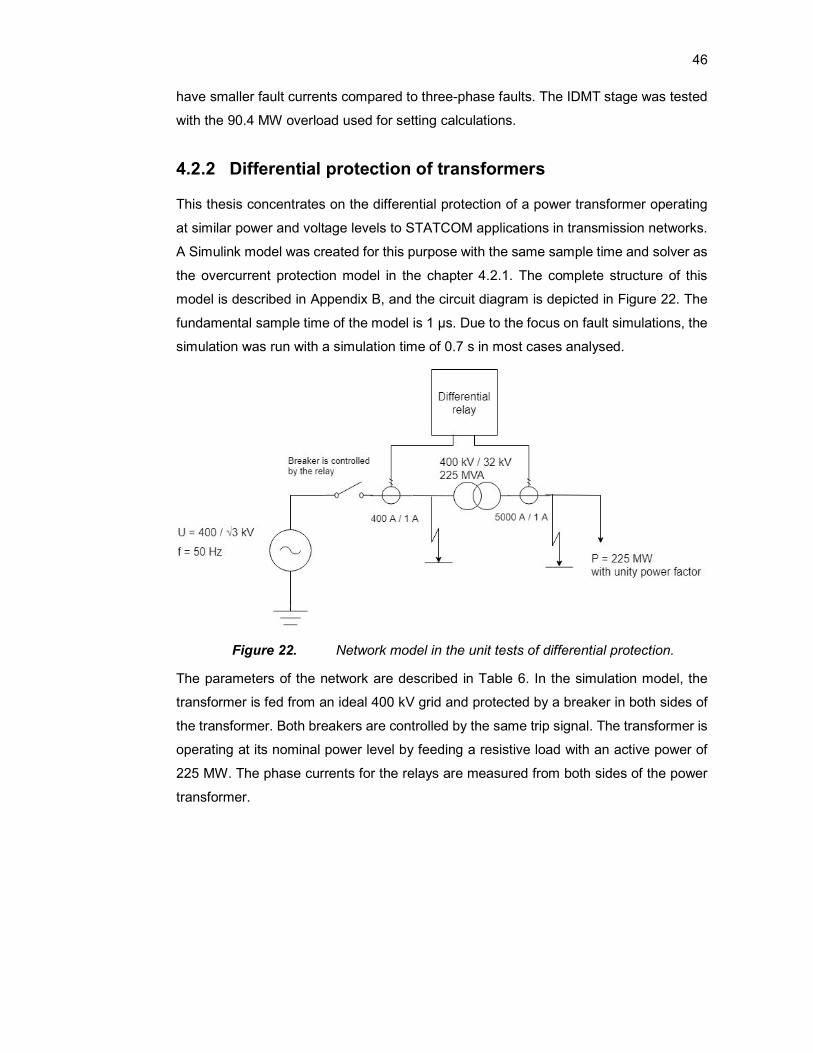
46
have smaller fault currents compared to three-phase faults. The IDMT stage was tested
with the 90.4 MW overload used for setting calculations.
4.2.2 Differential protection of transformers
This thesis concentrates on the differential protection of a power transformer operating
at similar power and voltage levels to STATCOM applications in transmission networks.
A Simulink model was created for this purpose with the same sample time and solver as
the overcurrent protection model in the chapter 4.2.1. The complete structure of this
model is described in Appendix B, and the circuit diagram is depicted in Figure 22. The
fundamental sample time of the model is 1 µs. Due to the focus on fault simulations, the
simulation was run with a simulation time of 0.7 s in most cases analysed.
Figure 22. Network model in the unit tests of differential protection.
The parameters of the network are described in Table 6. In the simulation model, the
transformer is fed from an ideal 400 kV grid and protected by a breaker in both sides of
the transformer. Both breakers are controlled by the same trip signal. The transformer is
operating at its nominal power level by feeding a resistive load with an active power of
225 MW. The phase currents for the relays are measured from both sides of the power
transformer.

47
Table 6. Parameters of the test network for differential protection.
Parameter Value
HV side RMS line-to-line voltage 𝑈 400 kV
MV side RMS line-to-line voltage 𝑈 32 kV
Transformation ratio of the power trans-
former
400 kV / 32 kV
Connection group of the power transformer YNd11
Frequency 𝑓 50 Hz
Nominal power of the load and the trans-
former 𝑆
225 MVA
Nominal burden of the current transformers
𝑆
30 VA
Transformation ratio, HV current transformer
𝐼 ,𝐼 ,
400 A / 1 A
Transformation ratio, MV current transformer
𝐼 ,𝐼 ,
5000 A / 1 A
The core of the power transformer was assumed linear based on the control system
simulation model used in this thesis. As this leads to the absence of magnetizing inrush
currents [33, p. 213], the harmonic blocking logic of the relays requires further, more
detailed development work with contribution from magnetics experts in the future pro-
jects. The model parameters chosen for the power transformer have been collected to
Table 7.

48
Table 7. Power transformer parameters.
Parameter Value
Block used Three-Phase Power Transformer (Two
Windings)
Resistance of both windings (pu) 2.5 ∗ 10
Inductance of both windings (pu) 0.04625
Magnetization resistance and reactance (pu) 500 (Simulink default value)
Saturation characteristic Off
The model includes two alternative methods for current measurements: ideal Three-
Phase Voltage Measurement blocks and saturable current transformers (CT). The cur-
rent transformers are modelled as power transformers with the parameters from Table 8
used for the 400 kV side. In total, there are six current transformers in the model, one for
each phase in both voltage levels.
Table 8. Current transformer parameters, 400 kV side.
Parameter Value
Block used Saturable Transformer
Transformation ratio (V / V) (1/400) : 1
Resistance of both windings (pu) 0.002
Inductance of both windings (pu) 0.08
Magnetization resistance and reactance (pu) 500 (Simulink default value)
Saturation characteristic Off
The saturation characteristic expresses the magnetic flux of the transformer as a function
of current. Algebraic loops occurring in the current transformers were broken from the
tab “Advanced” of the parameters. As actual information on the current transformers was

49
not available, the winding parameters and the saturation characteristic of them were
modified iteratively. For the same reason, the hysteresis was not modelled in this project.
With the parameters used, the cores of the CTs were able to withstand the three-phase
short circuit current levels present in the model without saturating. Table 9 shows the
parameters for the CTs in the 32 kV side.
Table 9. Current transformer parameters, 32 kV side.
Parameter Value
Block used Saturable Transformer
Transformation ratio (V / V) (1/5000) : 1
Resistance of both windings (pu) 0.002
Inductance of both windings (pu) 0.08
Magnetization resistance and reactance (pu) 500 (Simulink default value)
Saturation characteristic Off
The burden of the CTs was modelled as resistive. As the transformer block sets the
voltage of the secondary windings of the CTs as 1 V, the required burden resistance is
𝑅 =( )
=( )
= 0.0333 Ω. (16)
The measured currents are converted to conventional Simulink signals with current
measurement blocks and further to per unit (pu) values by multiplying them with a gain
𝐾 = ,
√
= , , (17)
in which the primary current of the CT 𝐼 , and the nominal line-to-line voltage 𝑈 are
chosen according to the voltage level in question. Although equation 17 is based on the
GE notation [50], the same calculation principle is used in the ABB relay [32]. If the ideal
measurement blocks are used instead of the CTs, the conversion to per unit values is
accomplished by dividing the current signal by the factor 𝐼 .
The model includes two relays: a GE MiCOM P64x series relay [50] and an ABB RE 615
series relay [32]. The operation principles of both relays are described in this chapter.
The GE MiCOM P64x relay utilizes the same sample time of 0.833 ms as the P14D. The

50
connection group of the power transformer is compensated similarly by both manufac-
turers. As the ABB manual [32] describes the process in more detail, its approach was
chosen for this project for both relays. For a YNd11 transformer, any zero-sequence
currents are trapped in the delta connection of the secondary winding and thus a sepa-
rate zero-sequence current elimination is absent. According to the ABB manual [32], the
compensation is implemented on the HV side when the star point is grounded. For ex-
ample, the compensated phase A current is calculated in the following way:
𝑖 , =√
(18)
The algorithm of the differential protection starts from the calculation of the differential
and bias currents required to determine the need for tripping. In Simulink, the differential
currents are simple to calculate by using vectors to group the current signals. A current
flowing into the transformer from the grid is defined as positive. Therefore, the current
on the 32 kV side of the transformer is negative under normal operating conditions.
Based on the GE manual [50, p. 112], the differential currents are defined as
𝑖 , = 𝑖 , − 𝑖 . (19)
The sign is a minus, as the current on the secondary side flows to the negative direction
when the network operates normally.
The bias or restraining currents are
𝑖 , = , | |
. (20)
The GE MiCOM P64x chooses the maximum value of the phase bias currents and com-
pares it to the largest bias current from the previous sampling period. The maximum of
these two currents is used to determine the tripping decision. Contrary to the model, the
differential and bias currents are calculated eight times per fundamental period in the
actual relay. This modification was made to simplify the signal processing required. In
addition to the modelled features, a numerically defined transient bias component is
added to the bias current in the actual relay [50, p. 115].
To prevent the relay from tripping during magnetization inrush or overexcitation of the
power transformer, the second and fifth harmonic components are calculated from the
differential current. Moreover, the protection function itself is sensitive to the fundamental
current component of the differential current. These harmonic calculations are imple-
mented with Fourier blocks, after which the absolute values of the resulting complex
numbers are calculated.
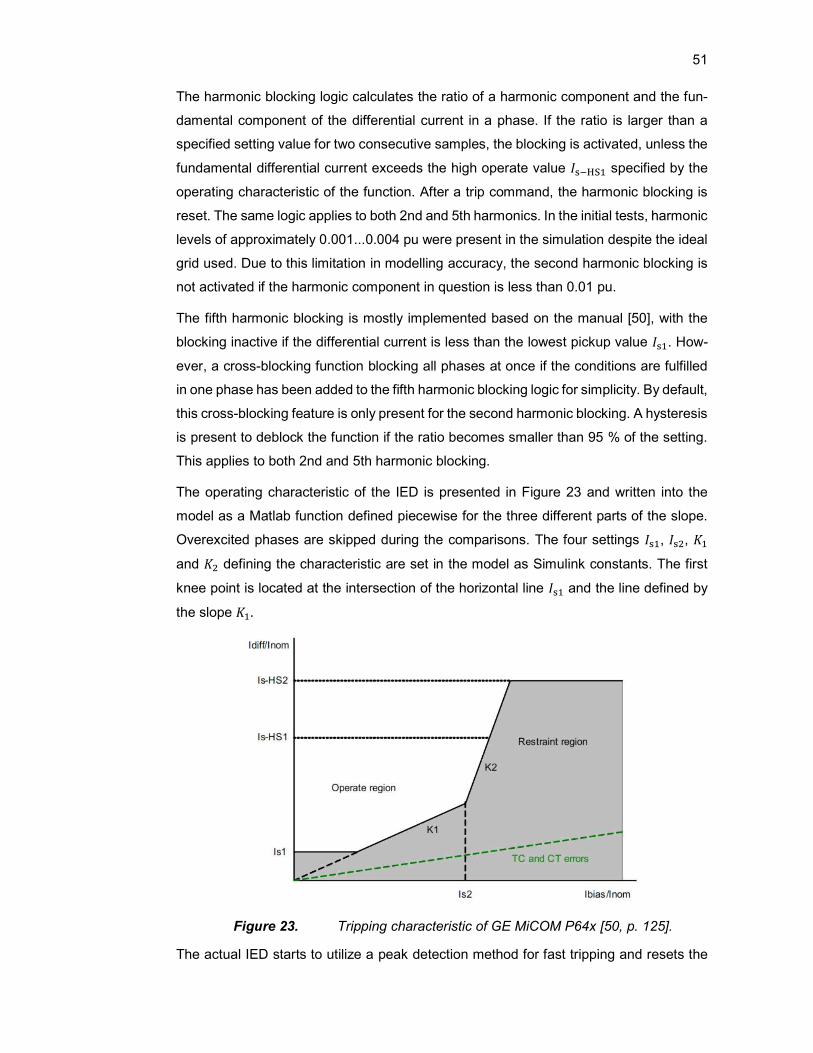
51
The harmonic blocking logic calculates the ratio of a harmonic component and the fun-
damental component of the differential current in a phase. If the ratio is larger than a
specified setting value for two consecutive samples, the blocking is activated, unless the
fundamental differential current exceeds the high operate value 𝐼 specified by the
operating characteristic of the function. After a trip command, the harmonic blocking is
reset. The same logic applies to both 2nd and 5th harmonics. In the initial tests, harmonic
levels of approximately 0.001...0.004 pu were present in the simulation despite the ideal
grid used. Due to this limitation in modelling accuracy, the second harmonic blocking is
not activated if the harmonic component in question is less than 0.01 pu.
The fifth harmonic blocking is mostly implemented based on the manual [50], with the
blocking inactive if the differential current is less than the lowest pickup value 𝐼 . How-
ever, a cross-blocking function blocking all phases at once if the conditions are fulfilled
in one phase has been added to the fifth harmonic blocking logic for simplicity. By default,
this cross-blocking feature is only present for the second harmonic blocking. A hysteresis
is present to deblock the function if the ratio becomes smaller than 95 % of the setting.
This applies to both 2nd and 5th harmonic blocking.
The operating characteristic of the IED is presented in Figure 23 and written into the
model as a Matlab function defined piecewise for the three different parts of the slope.
Overexcited phases are skipped during the comparisons. The four settings 𝐼 , 𝐼 , 𝐾
and 𝐾 defining the characteristic are set in the model as Simulink constants. The first
knee point is located at the intersection of the horizontal line 𝐼 and the line defined by
the slope 𝐾 .
Figure 23. Tripping characteristic of GE MiCOM P64x [50, p. 125].
The actual IED starts to utilize a peak detection method for fast tripping and resets the

52
harmonic blocking signals if the high operate value 𝐼 is exceeded. Moreover, a dif-
ferential current larger than the value 𝐼 trips the relay immediately. [50, p. 113] As
the biased characteristic itself provided sufficiently fast tripping, this setting was not im-
plemented in this model. The two setting combinations used in the unit tests were as
specified by Table 10, with one of them based on the STATCOM project analysed. As
described above, the harmonic blocking settings are defined as ratios of the harmonic in
question and the fundamental component of the differential current.
Table 10. Settings for the differential protection unit tests, GE MiCOM P64x series.
Parameter STATCOM setting value
(pu)
Values modified from
default settings (pu)
Low operate value 𝐼 0.2 0.2
Second knee point 𝐼 1.1 1.0
Slope 𝐾 0.22 0.3
Slope 𝐾 0.22 0.8
High operate value 𝐼 10 10
2nd harmonic blocking setting 0.2 0.2
5th harmonic blocking setting 0.35 0.35
In addition to the settings of Table 10, the model includes the operating delays associ-
ated with the relay. The delay is modelled with a discrete-time integrator and set to 35
ms according to the manual [50, p. 485]. The trip signal is sent to the breaker after this
delay.
The ABB RE 615 relay calculates the differential currents and extracts the harmonics
from them similarly to the GE device in equation 19. The bias currents, calculated from
the following equation 21, are separate for each phase. Moreover, the delayed bias fea-
ture included in the GE relay is not present. Therefore, the comparisons between the
differential and bias currents are separate for each phase as well. The bias currents in
this relay are
𝑖 , = ,
. (21)
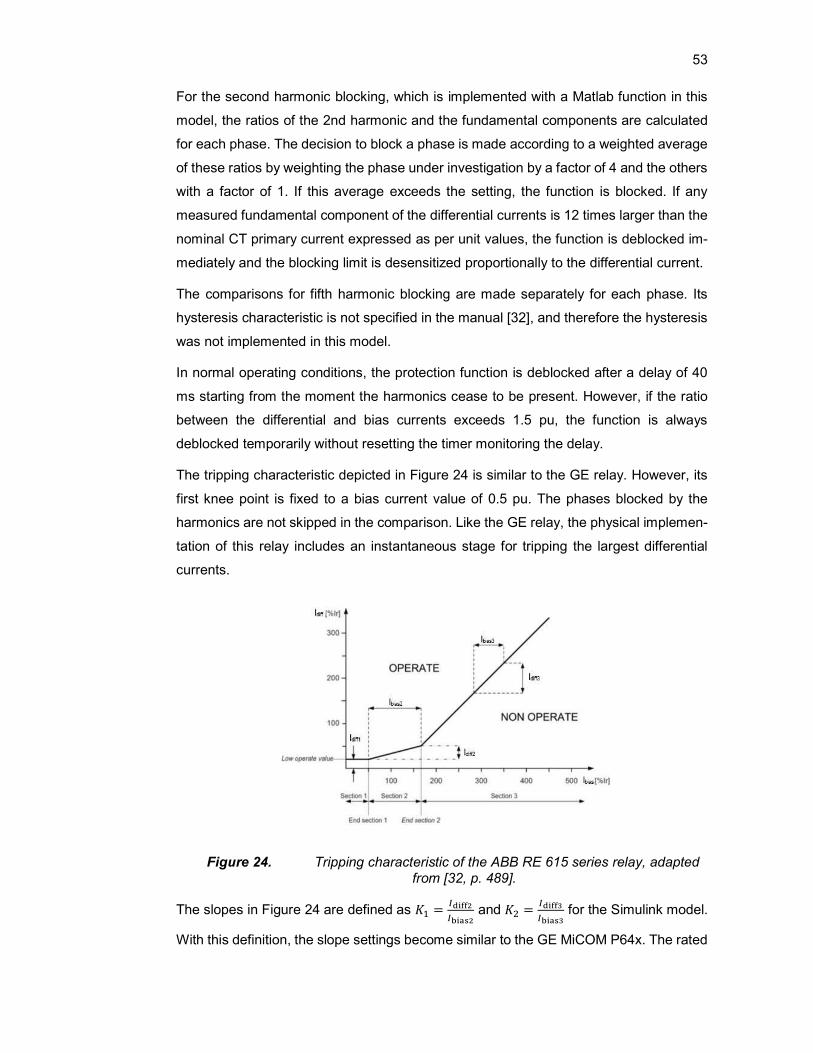
53
For the second harmonic blocking, which is implemented with a Matlab function in this
model, the ratios of the 2nd harmonic and the fundamental components are calculated
for each phase. The decision to block a phase is made according to a weighted average
of these ratios by weighting the phase under investigation by a factor of 4 and the others
with a factor of 1. If this average exceeds the setting, the function is blocked. If any
measured fundamental component of the differential currents is 12 times larger than the
nominal CT primary current expressed as per unit values, the function is deblocked im-
mediately and the blocking limit is desensitized proportionally to the differential current.
The comparisons for fifth harmonic blocking are made separately for each phase. Its
hysteresis characteristic is not specified in the manual [32], and therefore the hysteresis
was not implemented in this model.
In normal operating conditions, the protection function is deblocked after a delay of 40
ms starting from the moment the harmonics cease to be present. However, if the ratio
between the differential and bias currents exceeds 1.5 pu, the function is always
deblocked temporarily without resetting the timer monitoring the delay.
The tripping characteristic depicted in Figure 24 is similar to the GE relay. However, its
first knee point is fixed to a bias current value of 0.5 pu. The phases blocked by the
harmonics are not skipped in the comparison. Like the GE relay, the physical implemen-
tation of this relay includes an instantaneous stage for tripping the largest differential
currents.
Figure 24. Tripping characteristic of the ABB RE 615 series relay, adapted from [32, p. 489].
The slopes in Figure 24 are defined as 𝐾 = and 𝐾 = for the Simulink model.
With this definition, the slope settings become similar to the GE MiCOM P64x. The rated

54
current 𝐼 in the figure corresponds to the nominal current base values calculated from
the nominal apparent power and voltage values. The used settings are collected to Table
11. The first set is based on the STATCOM project under analysis, while the second set
is based on the default settings.
Table 11. Settings for the unit tests of the differential protection, ABB RE 615 series relay.
Parameter STATCOM setting
values (pu)
Values modified from
default settings (pu)
Low operate value 𝐼 0.2 0.2
Second knee point 𝐼 1.1 1.5
Slope 𝐾 0.22 0.2
Slope 𝐾 0.22 0.3
Differential and bias current ra-
tio to deblock the harmonic
blocking
1.5 1.5
2nd harmonic blocking setting 0.15 0.15
5th harmonic blocking setting 0.35 0.35
The ABB relay trips after it has stayed picked up for a time of 1.1 times the fundamental
period. Its operating delay caused by its dynamics is 41 ms. Therefore, its total delays in
a 50 Hz grid are
.
+ 41 ms = 22 ms + 41 ms = 63 ms. (22)
The blocking signals available in the relay include blocking of the entire function or only
its trip signal.
After testing the correct operation of the models, they were connected to the model of a
control system from an actual STATCOM project by GE. As an output, the relays send
their trip signal to the control system to assist in decisions and diagnostics, as well as to
enable a safe and controlled shutdown of the high power STATCOM in all circumstances.

55
5. INTEGRATION OF THE RELAY MODELS INTO
THE CONTROL SYSTEM MODEL
To perform testing of the relay settings calculated from the fault and overload currents,
as well as the current ratings of the components, the protection function models were
added to a control system Simulink model. The simulation environment used in this the-
sis was based on a STATCOM project, which had progressed close to the energization
of the constructed plants in the beginning of the writing process of this thesis. This chap-
ter describes the main structure of this environment.
In future customer projects, the relay simulations will be used to replace parts of the
stability tests performed in the laboratory with physical IEDs and an RTDS. This will re-
duce the workload required by the tests, which take several days to complete and make
the employees involved unavailable for other tasks. Moreover, the models will create
opportunities to further integrate the protection functions to the control system. An ap-
proach to implement the protection in the control system is already in use in the fixed
series capacitors by GE. However, for the active FACTS controllers, the amount of this
integration is currently limited by the required type approval processes. Unlike the control
system, the IEDs have the necessary certificates.
The analysed control system Simulink model of the STATCOM consists of three main
parts, which are defined by the block diagram in Figure 25: the plant, the control system
and the HMI connecting the system and its operator. The plant includes the process to
be controlled in the form of network and STATCOM models. Most control parameters
are inside the operator block, from which they are transferred to the control system in
Simulink buses. The block also includes signal routes and placeholder blocks for com-
mands, which can be given by the operator in the physical automation system.
The basis of the control system is a cascaded control scheme in synchronous reference
frame, which is typical of grid-connected converters. In this type of control, the slower
outer loop is a voltage or reactive power control and the faster inner loop a current con-
trol. The system also includes control functions for the voltages of the DC capacitors in
the VSC modules. Finally, after the submodule controller of the VSC and the PWM mod-
ulator, the individual control pulses for the IGBTs are transmitted to the converter opti-
cally. Moreover, the control system supervises the start-up and shutdown of the STAT-
COM with programmed sequences. For protection purposes, it can issue trips and

56
alarms for example during system failures, or abnormal frequency or voltage conditions.
Figure 25. Block diagram of the main level structure of the STATCOM simula-tion model.
The subsystem for the protection relays was added to the model in this project. The IEDs
receive their current measurements in buses from the plant. Differently from the previous
chapter, the lockout relay was modelled as an SR flip flop separate from the IEDs. This
approach creates a connection point for the trip signals from the control system. If the
operate command of a protection relay activates, the relay sends a pulse with a settable
length to the lockout relay. In the ABB RE 615 series, this length is 20 ms...60 s with a
default of 250 ms [32, p. 811]. The GE MiCOM relays define this setting in their program-
mable scheme logic. The logic can be configured with the S1 Agile configuration soft-
ware, which specifies the default pulse length as 100 ms for both P14D and P64x series.
After this time, the trip signal stays active until the operate command drops back to zero.
Unlike in the unit tests, both overcurrent protection functions are sensitive to the funda-
mental component in the STATCOM project.
The lockout relay is usually reset from the control system panel with the trip reset com-
mand. The same command resets the active trip signals from the control system as well,
indicating a STATCOM ready to be restarted. Moreover, in these simulation models, the
integrator blocks measuring time in the relays were modified to be always reset by the
control system trip reset command. In the actual devices, this operation is performed by
the reset logic presented in chapter 4.2.1 when the current stops flowing after the trip.
In addition to these functional modifications, the model configuration parameters and
57
signal names were modified to be compatible with the protection system. The solvers
and sample times were not changed from the unit tests. In the final model, the number
of Constant blocks has been minimized in the relays. Instead, the protection settings and
features expressed with variables are stored in Matlab data structures like the other pa-
rameters of the model. These structures are defined and initialized with automatically
executed scripts when the simulation model is opened. The Constant blocks are still
present outside the relays, but they now refer to the structures. Buses are capable of
transferring these structures to the relay models after new bus objects have been defined
for them. This is implemented in the initialization scripts, which are run when the Simulink
project of the control system is opened in Matlab or when requested by user. To define
the datatypes for the bus objects properly in the compiling process and avoid compati-
bility errors, the Constant block of the structure is in a separate referenced model.
To improve the visualization of the simulation results, the scopes used in the develop-
ment of the relay models were changed to signal logging utilized elsewhere in the model.
The logging can be switched on from the properties of a Simulink signal. The data pro-
duced was investigated and saved to figures with the Simulation Data Inspector found in
Simulink. In addition, this approach allowed quick comparisons of different simulation
cases, with several windows for the plots available in the inspector.
A circuit diagram of the plant and the protection scheme used is shown in Figure 26.
Simplified from an actual STATCOM project, the plant of the model is connected to the
400 kV transmission grid via the 225 MVA main transformer. The plant itself operates
with a 32 kV voltage to reduce the voltages over the IGBTs in the converter. Unlike in
the physical system utilizing measurement transformers, the input signals for all protec-
tion relays are acquired as absolute values with measurement blocks. Moreover, this
measurement data is used as the feedback signals for the control system.
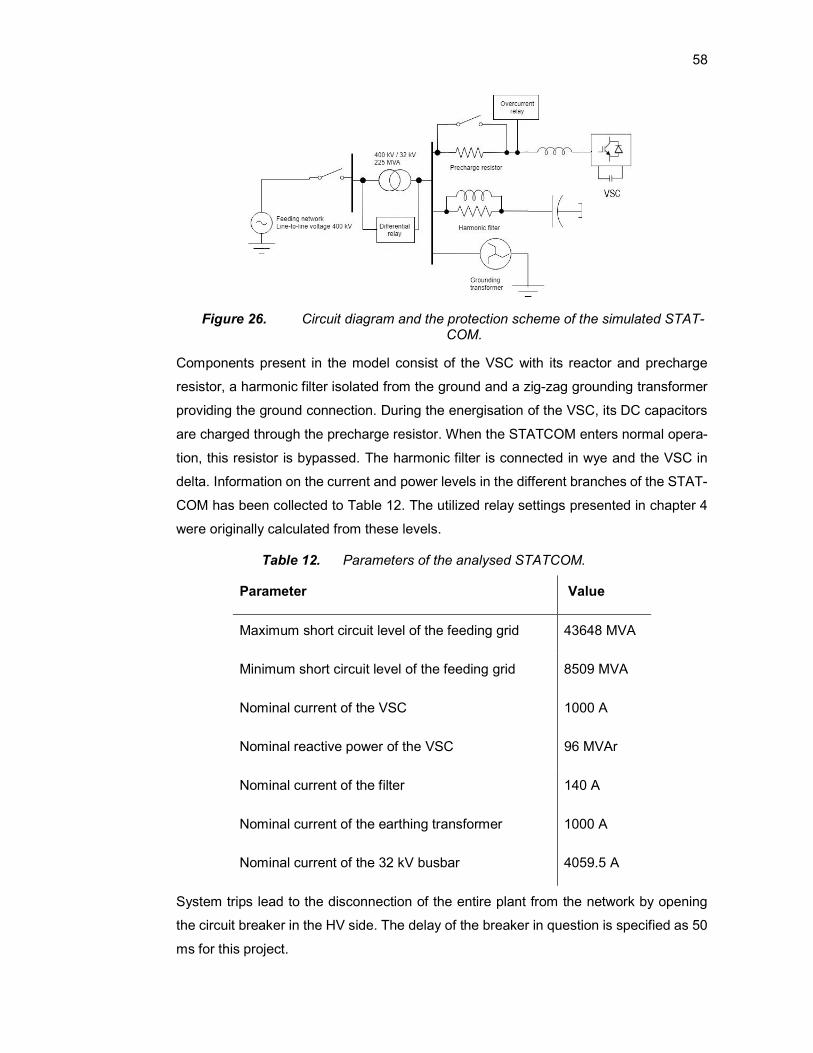
58
Figure 26. Circuit diagram and the protection scheme of the simulated STAT-COM.
Components present in the model consist of the VSC with its reactor and precharge
resistor, a harmonic filter isolated from the ground and a zig-zag grounding transformer
providing the ground connection. During the energisation of the VSC, its DC capacitors
are charged through the precharge resistor. When the STATCOM enters normal opera-
tion, this resistor is bypassed. The harmonic filter is connected in wye and the VSC in
delta. Information on the current and power levels in the different branches of the STAT-
COM has been collected to Table 12. The utilized relay settings presented in chapter 4
were originally calculated from these levels.
Table 12. Parameters of the analysed STATCOM.
Parameter Value
Maximum short circuit level of the feeding grid 43648 MVA
Minimum short circuit level of the feeding grid 8509 MVA
Nominal current of the VSC 1000 A
Nominal reactive power of the VSC 96 MVAr
Nominal current of the filter 140 A
Nominal current of the earthing transformer 1000 A
Nominal current of the 32 kV busbar 4059.5 A
System trips lead to the disconnection of the entire plant from the network by opening
the circuit breaker in the HV side. The delay of the breaker in question is specified as 50
ms for this project.
59
If a trip occurs, the control system blocks the VSC valves by setting the control parame-
ters and reference values to zero. Moreover, trip signals from elsewhere reset the over-
voltage protection function of the 400 kV side in the control system for selectivity. A trip
during start-up or shutdown sequences requires a controlled approach for disconnecting
the STATCOM. If the trip signal is active in a system which has been shut down, it pre-
vents the system from being restarted. After the cause of the trip is removed and the trip
signal is reset, the system is again ready for operation. The system status is also updated
to the subsystems detecting communication problems in the optical network, which is
used to control the IGBTs. Of these features introduced above, the VSC blocking is the
only one which has been implemented in the simplified control system model used in this
thesis.
For these purposes mentioned above, the control system receives information on the
trips from the protection relays, the lockout relay, as well as the circuit breaker. Besides
the relays, the trip command is transmitted to the lockout relay from the control system.
This provides redundancy for the direct signal route from the protection relays.

60
6. ANALYSIS OF THE RESULTS
6.1 Unit tests
The purpose of the unit tests was to ensure the correct operation of the relay models, as
well as to compare the results from them to the predicted operating times calculated in
chapter 4. Particularly, the speed of the relays was analysed, with the pickup and trip
times collected to the tables presented in this chapter.
The simulations were run with the relay settings and configuration parameters presented
in chapter 4. The different signals from the models were logged to the Matlab workspace,
in which the data is stored in structures. This method allows saving the results straight-
forwardly in mat -files. In turn, these files can be opened in any version of Matlab. Inside
the relay models, the logging of the data was implemented by switching it on from the
properties of the signals. In the network level, scopes were also utilized for logging.
For the results presented below, the data was analysed as graphical plots in the Simu-
lation Data Inspector included in Simulink. The plots depict the quantities in question as
functions of the simulation time. The numerical values of the quantities were defined by
zooming the plots and reading the values from them with data cursors. From the Simu-
lation Data Inspector, the data was also saved to figures, which are included in appen-
dices C and D.
6.1.1 Overcurrent protection
If the grid is not grounded, the most critical fault situations detectable by overcurrent
relays are two-phase short circuits and overloads. As the two-phase fault current is in-
versely proportional to the sum of positive- and negative-sequence impedances of the
network, it is always smaller than the corresponding three-phase fault current [30]. The
results for the first test case of a two-phase short circuit between phases A and B were
as visible from Table 13. In all tables of this chapter, the pickup and tripping times are
calculated starting from the fault insertion moment. Throughout the simulations, a simu-
lation time of 1.0 s was used, with the faults occurring at the time of 0.5 s into simulation.
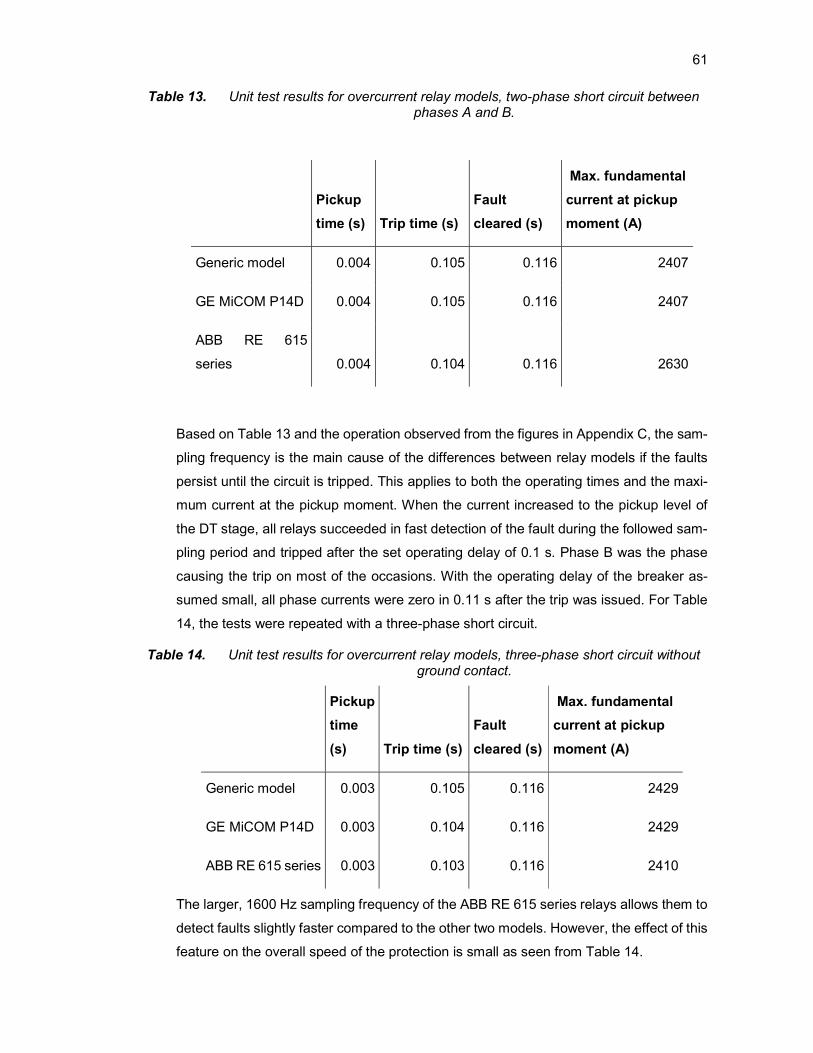
61
Table 13. Unit test results for overcurrent relay models, two-phase short circuit between phases A and B.
Pickup
time (s) Trip time (s)
Fault
cleared (s)
Max. fundamental
current at pickup
moment (A)
Generic model 0.004 0.105 0.116 2407
GE MiCOM P14D 0.004 0.105 0.116 2407
ABB RE 615
series 0.004 0.104 0.116 2630
Based on Table 13 and the operation observed from the figures in Appendix C, the sam-
pling frequency is the main cause of the differences between relay models if the faults
persist until the circuit is tripped. This applies to both the operating times and the maxi-
mum current at the pickup moment. When the current increased to the pickup level of
the DT stage, all relays succeeded in fast detection of the fault during the followed sam-
pling period and tripped after the set operating delay of 0.1 s. Phase B was the phase
causing the trip on most of the occasions. With the operating delay of the breaker as-
sumed small, all phase currents were zero in 0.11 s after the trip was issued. For Table
14, the tests were repeated with a three-phase short circuit.
Table 14. Unit test results for overcurrent relay models, three-phase short circuit without ground contact.
Pickup
time
(s) Trip time (s)
Fault
cleared (s)
Max. fundamental
current at pickup
moment (A)
Generic model 0.003 0.105 0.116 2429
GE MiCOM P14D 0.003 0.104 0.116 2429
ABB RE 615 series 0.003 0.103 0.116 2410
The larger, 1600 Hz sampling frequency of the ABB RE 615 series relays allows them to
detect faults slightly faster compared to the other two models. However, the effect of this
feature on the overall speed of the protection is small as seen from Table 14.

62
Earth faults cannot be detected with a conventional overcurrent relay in ungrounded
grids due to the absence of a small-impedance return route for the fault currents [1].
Thus, the detection of the earth faults with overcurrent protection was tested with the star
points of the voltage source and the load connected to the ground. The results from an
earth fault in phase C were collected to Table 15.
Table 15. Unit test results for overcurrent relay models, earth fault in grounded grid.
Pickup
time (s) Trip time (s)
Fault
cleared (s)
Max. fundamental
current at pickup
moment (A)
Generic model 0.005 0.106 0.112 2400
GE MiCOM
P14D
0.005 0.106 0.111 2400
ABB RE 615
series
0.004 0.104 0.111 2311
As shown by tables 13-15, the relays manage to trip any basic fault occurring in any
phase of the circuit according to the time setting of the DT stage. Similarly to the previous
cases, the ABB relay is the fastest of the models analysed.
Overloads are tripped by the IDMT stage, the test results of which were collected to
Table 16. Contrary to the approximated current level from equation 14, the simulated
current of 1556 A was found to be sufficiently small compared to the pickup level of the
DT stage. This made it suitable for the simulation and reduced the required simulation
time compared to smaller overloads. The overload is specified in the settings of the load
block and therefore present directly from the beginning of the simulation.

63
Table 16. Unit test results for overcurrent relay models, overload protection.
Pickup
time (s)
Trip time
(s)
Over-
load
cleared
(s)
Max. RMS
current at
pickup mo-
ment (A)
Max. funda-
mental current
at pickup mo-
ment (A)
Generic
model
0.02 3.60 3.61 1556 2200
GE MiCOM
P14D
0.02 3.60 3.61 1556 2200
ABB RE
615 series
0.02 3.60 3.61 1556 2200
According to equation 5 and Table 5, the calculated operating time for the current from
Table 16 is
𝑡 = 𝑇𝑀𝑆 ∗( )
= 0.1 ∗.
= 3.58 s. (23)
Table 16 and this calculated value show that the IDMT stage is functioning properly as
required by the standards in all simulation models. The 20 ms delay in the beginning of
the simulation is caused by the running average windows utilized by the Fourier and
RMS SimPowerSystems blocks. The Simulink models pick up after these blocks have
received enough samples from the network to calculate the correct current level.
The initial testing for the timer hold and delayed reset functions was performed by input-
ting them a waveform consisting of pickup and dropdown periods. As described in chap-
ter 4.2.1, the time between a falling edge of the pickup signal and resetting the timer was
set to 0.5 s for the tests. Both inputs and results of these tests are included in Appendix
C as figures 11-18. Figures 13 and 17 of this appendix depict the test waveforms created
for the blocking bit. Due to the properties of enabled subsystems in Simulink, the blocking
is active when this bit is 0.
The GE MiCOM P14D was reset by a dropdown period of 2.0 s but held the timer value
for a 0.25 s dropdown as desired. The timer was also observed to hold its value if the
timer was blocked. Correspondingly, the relay from ABB RE 615 series continued count-
ing during a 0.25 s dropdown period but was reset by a 2.0 s period. If the timer was
blocked, the relay succeeded in holding the timer value in zero or nonzero values alike.

64
Based on the results, the implemented Simulink models succeeded in their purpose to
identify differences between commercial IED models in simple test cases. Although the
basic characteristics of an overcurrent relay is a topic with previous research widely
available, advanced features such as the reset logic of the timers were implemented
successfully in the Simulink models. The main differences between the commercial relay
models analysed were found to be related to the sampling process of the measured
currents, as well as the reset features and logic available.
6.1.2 Differential protection
The unit tests for differential protection concentrated particularly on earth fault protection.
The scheme described in chapter 4.2.2 is based on a physical STATCOM transformer
and thus connected to transmission network, which is grounded. The first part of the
modelling considered the current transformers. After the CT output had been corrected
with the ratio correction factors 𝐾 for the HV side and 𝐾 for the MV side, the
current values from both voltage levels could be analysed and compared to each other
as per unit values. The ratio correction factors were calculated based on equation 17.
Table 17 shows the differences between the modelled CTs and ideal current measure-
ment blocks. The saturation of the CTs due to the fault currents was prevented by mod-
ifying the saturation characteristics iteratively as described in chapter 4.2.2. To verify
this, the CTs were tested with a three-phase short circuit in the 32 kV side.
Table 17. Comparison of current measurement methods for differential protection.
Peak current meas-
ured by CT (pu)
Ideal current
measurement
(pu)
Normal operation 1.406 1.409
3-phase short circuit in MV side 28.94 29.00
Although the CT was modelled as a power transformer due to the lack of suitable blocks,
it succeeds in the measurement based on Table 17. In addition, its core losses and the
resistances of the windings affect the result. However, its hysteresis was not simulated
due to suitable data being not available.
After the operation of the CTs was verified, they were connected to the differential relay

65
models. As described in chapter 4.2.2, two different setting combinations were tested.
The first test case involved a three-phase short circuit occurring in the protected zone.
The results from it are visible from Table 18. According to equation 22, the physical ABB
RE 615 trips only if it stays picked up for 22 ms. In the unit test phase, this was verified
from the plots in Simulation Data Inspector. However, for the control system tests, a
suitable timer model used in the control system was available, eliminating the need for
this verification.
Table 18. Unit test results for differential relay models, three-phase short circuit inside the protected zone.
Pickup time (s) Trip time (s)
GE MiCOM P64x, default settings 0.006 0.041
ABB RE 615 series, default settings 0.001 0.064
GE MiCOM P64x, settings for a
transformer from STATCOM
0.001 0.036
ABB RE 615 series, settings for a
transformer from STATCOM
0.001 0.064
The GE MiCOM P64x always trips immediately, and therefore only its operating delays
affect its operation. The pickup signal of the ABB relay stayed active for 24 ms with the
default settings and 31 ms with project settings. Therefore, it issued the trip as well. The
durations of the delays were as specified in chapter 4.2.2.
In the test presented in Table 19, an earth fault occurred in the 400 kV side inside the
protected zone in phase A. The rapid increase in the differential current leads to the
relays picking up in a few milliseconds.

66
Table 19. Unit test results for differential relay models, earth fault in phase A inside the protected zone.
Pickup time (s) Trip time (s)
GE MiCOM P64x, default settings 0.007 0.042
ABB RE 615 series, default settings 0.003 0.066
GE MiCOM P64x, settings for a
transformer from STATCOM
0.003 0.038
ABB RE 615 series, settings for a
transformer from STATCOM
0.002 0.065
As the values of the differential and bias currents change during the fault, the operating
point in the characteristic of the differential protection varies as a function of time. There-
fore, the pickup bit starts to fluctuate between 0 and 1. This is delayed by setting the
function correctly, which is particularly important when using the ABB RE 615. In this
case, the ABB relay stayed picked up for 22 ms with the STATCOM project settings and
24 ms with the other combination.
The final unit test case included a fault external to the protected zone. This fault was set
to occur in the 32 kV side at 0.1 s into simulation. This allowed its fault currents to flow
through the transformer. After another 0.1 s, a second fault was inserted into the 400 kV
side inside the protected zone. To identify the most critical fault combination to be tested,
multiple simulations with the GE MiCOM P64x in its default settings were run. The com-
parison was done in Table 20. In physical systems, assuming that the protection system
operates properly, these situations are tripped by the other protection relays and func-
tions of the STATCOM directly after the first fault.

67
Table 20. Comparison of different fault type combinations, trip times from GE MiCOM P64x with default settings.
External fault Internal fault Trip time (s)
Earth fault, phase A Earth fault, phase A 0.042
Earth fault, phase A Earth fault, phase B 0.039
Earth fault, phase A Short circuit, phases A & B 0.040
Short circuit, phases A & B Short circuit, phases A & B 0.040
Short circuit, phases A & B Short circuit, phases B & C 0.038
3-phase short circuit Earth fault, phase A 0.042
Short circuit, phases A & B Earth fault, phase A 0.042
Based on the comparison and the plots from the simulations, the earth faults occurring
in the same phase were chosen as the test case due to their slow tripping time and small
fault currents. The results are included as figures in Appendix D and in numerical form
in Table 21.
Table 21. Unit test results for differential relay models, VSC and internal earth faults in phase A.
Pickup time (s) Trip time (s)
GE MiCOM P64x, default settings 0.007 0.0415
ABB RE 615 series, default settings 0.003 no trip
ABB RE 615 series, K1 = K2 = 0.2 0.002 0.064
GE MiCOM P64x, settings for a
transformer from STATCOM
0.003 0.038
ABB RE 615 series, settings for a
transformer from STATCOM
0.002 0.065
Both relay models operated as desired by not reacting to the external fault and tripping
the circuit after the internal fault. Compared to the case in which only the internal fault
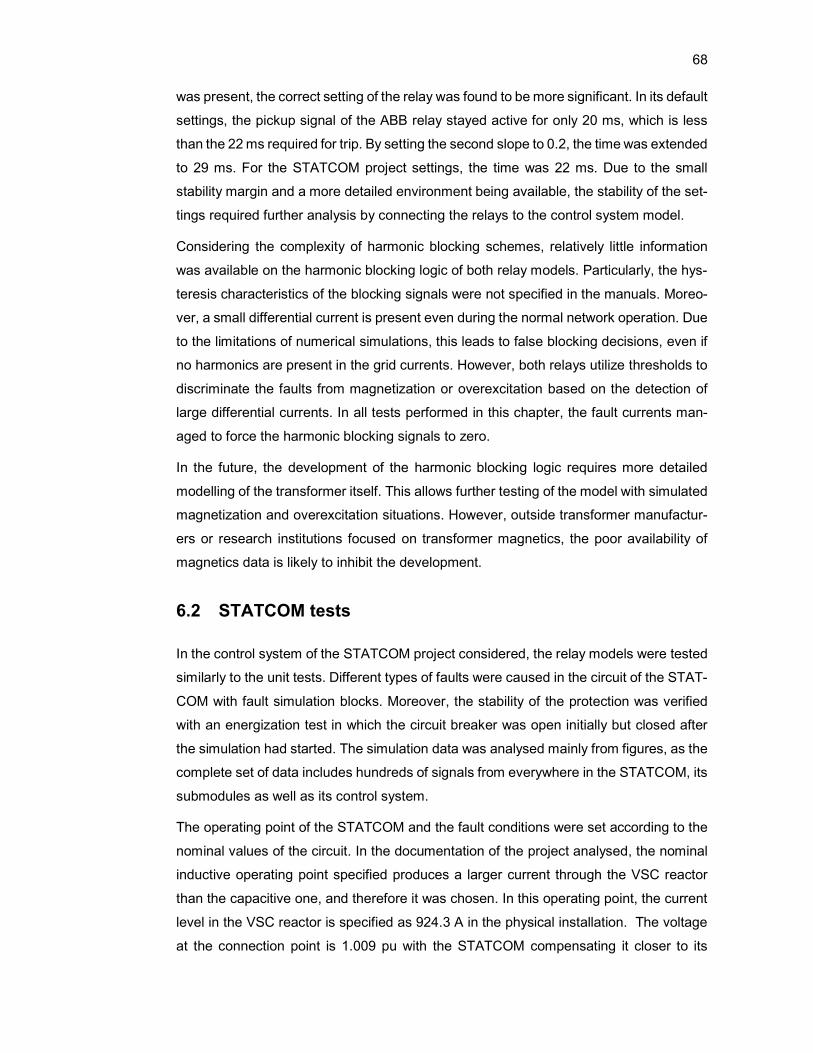
68
was present, the correct setting of the relay was found to be more significant. In its default
settings, the pickup signal of the ABB relay stayed active for only 20 ms, which is less
than the 22 ms required for trip. By setting the second slope to 0.2, the time was extended
to 29 ms. For the STATCOM project settings, the time was 22 ms. Due to the small
stability margin and a more detailed environment being available, the stability of the set-
tings required further analysis by connecting the relays to the control system model.
Considering the complexity of harmonic blocking schemes, relatively little information
was available on the harmonic blocking logic of both relay models. Particularly, the hys-
teresis characteristics of the blocking signals were not specified in the manuals. Moreo-
ver, a small differential current is present even during the normal network operation. Due
to the limitations of numerical simulations, this leads to false blocking decisions, even if
no harmonics are present in the grid currents. However, both relays utilize thresholds to
discriminate the faults from magnetization or overexcitation based on the detection of
large differential currents. In all tests performed in this chapter, the fault currents man-
aged to force the harmonic blocking signals to zero.
In the future, the development of the harmonic blocking logic requires more detailed
modelling of the transformer itself. This allows further testing of the model with simulated
magnetization and overexcitation situations. However, outside transformer manufactur-
ers or research institutions focused on transformer magnetics, the poor availability of
magnetics data is likely to inhibit the development.
6.2 STATCOM tests
In the control system of the STATCOM project considered, the relay models were tested
similarly to the unit tests. Different types of faults were caused in the circuit of the STAT-
COM with fault simulation blocks. Moreover, the stability of the protection was verified
with an energization test in which the circuit breaker was open initially but closed after
the simulation had started. The simulation data was analysed mainly from figures, as the
complete set of data includes hundreds of signals from everywhere in the STATCOM, its
submodules as well as its control system.
The operating point of the STATCOM and the fault conditions were set according to the
nominal values of the circuit. In the documentation of the project analysed, the nominal
inductive operating point specified produces a larger current through the VSC reactor
than the capacitive one, and therefore it was chosen. In this operating point, the current
level in the VSC reactor is specified as 924.3 A in the physical installation. The voltage
at the connection point is 1.009 pu with the STATCOM compensating it closer to its

69
nominal value of 1.000 pu. The corresponding values expressed in the HV side of the
main transformer are 403.2 kV and 400 kV respectively.
To produce results comparable to the unit tests, the fault impedance in the tests was 0.1
Ω. In the fault simulations, the simulation time was 1.5 s with the faults inserted at 1.0 s
into simulation. After the first second, the fastest and most significant parts of the begin-
ning transients were observed to be over when the circuit breaker was in closed position
throughout the entire simulation.
6.2.1 Overcurrent protection
A two-phase short circuit, which occurred between the VSC itself and its reactor, was
chosen as the main test for the overcurrent protection based on the unit tests. Although
the currents in the VSC branch were smaller than in the unit tests, all relay models suc-
ceeded in tripping the circuit as shown by Table 22. The lower current level is caused by
the simplified model, in which additional components from the original topology have
been removed. The topology used in the simplified model was introduced in Figure 26.
Table 22. Tests with the STATCOM model, two-phase short circuit in the VSC branch.
Pickup
time (s) Trip time (s)
Fault
cleared (s)
Max. fundamental
current at pickup
moment (A)
Generic model 0.006 0.106 0.25 2357
GE MiCOM
P14D
0.006 0.106 0.25 2357
ABB RE 615
series
0.005 0.105 0.25 2632
Based on the results, the models operated correctly like in the unit tests. Compared to
the unit test networks used for Table 13, the dynamics of the STATCOM circuit are
slower. This delays the complete removal of the fault by approximately 140 ms, of which
50 ms form the operating delay of the breaker added to the STATCOM model. As spec-
ified, the VSC blocking was activated in the control system simultaneously to the trip
signal from the lockout relay. This feature functioned correctly in all tests performed for
this chapter.
Figure 27 depicts the fundamental peak current as seen by the generic simulation model
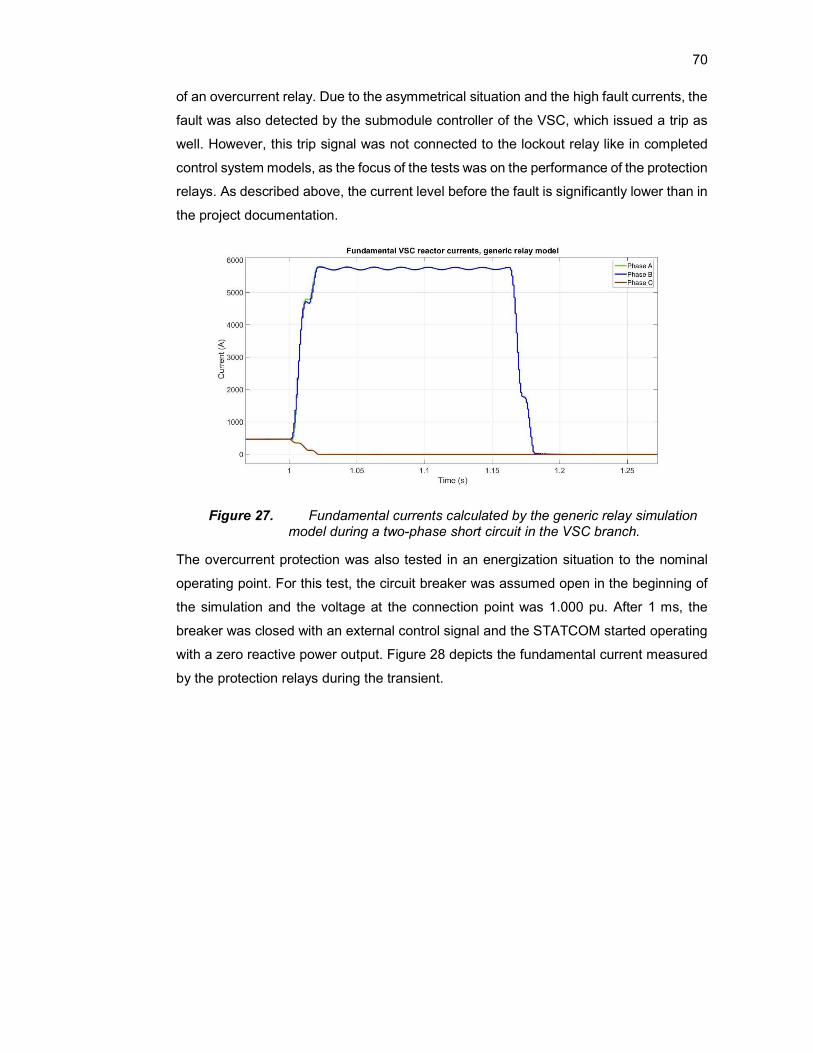
70
of an overcurrent relay. Due to the asymmetrical situation and the high fault currents, the
fault was also detected by the submodule controller of the VSC, which issued a trip as
well. However, this trip signal was not connected to the lockout relay like in completed
control system models, as the focus of the tests was on the performance of the protection
relays. As described above, the current level before the fault is significantly lower than in
the project documentation.
Figure 27. Fundamental currents calculated by the generic relay simulation model during a two-phase short circuit in the VSC branch.
The overcurrent protection was also tested in an energization situation to the nominal
operating point. For this test, the circuit breaker was assumed open in the beginning of
the simulation and the voltage at the connection point was 1.000 pu. After 1 ms, the
breaker was closed with an external control signal and the STATCOM started operating
with a zero reactive power output. Figure 28 depicts the fundamental current measured
by the protection relays during the transient.
71
Figure 28. Fundamental reactor currents during energization of the STAT-COM.
Although a temporary current spike of over 2 kA was observed during the transient, its
duration stayed small enough to prevent the measured current from causing a false trip.
The fundamental current calculated by the relays was therefore always smaller than the
1598 A pickup level of the function, with its maximum at 1362 A. Thus, the STATCOM
continued its operation normally.
When operating correctly, the control system of the VSC acts as the first, preventive
protection measure against the overloads of its reactor. The current in the VSC branch
is limited to 1000 A in normal operating conditions by multiple settings and mechanisms,
with only faults increasing it above this level. Therefore, overloading the VSC reactor
was simulated by multiplying the input signal of the protection relays by 1.5 and driving
the VSC reactor current to 1000 A. This was accomplished with a grid voltage of 0.7 pu
at the connection point. Substitution of the original settings from Table 5 and the current
seen by the relays to equation 5 yields
𝑡 = 𝑇𝑀𝑆 ∗( )
= 0.1 ∗.
= 4.12 s. (24)
The simulation time was therefore set initially to 4.5 s. However, the large amount of data
gathered from the model caused Matlab to stop working during the import process of the
data to Simulation Data Inspector. This happened due to the inclusion of the individual
control pulses for all IGBTs of the VSC in the data. In the actual stability tests, the test
schemes are more complex than in this thesis. Therefore, reducing the amount of the
data will be critical for the success of the stability tests. Besides switching the logging of
the irrelevant signals off, a smaller time multiplier setting or choosing a different charac-
teristic from Table 3 can be used for this purpose.

72
To reduce the amount of data, the simulation time was shortened to 2.5 s. The operating
times of the relays were reduced by decreasing the time multiplier setting to the largest
of the minimum values found for the setting. The value was determined by the ABB RE
615 series, for which the minimum of the TMS is 0.05 [32, p. 227]. The new value for the
operating time is
𝑡 = 𝑇𝑀𝑆 ∗( )
= 0.05 ∗.
= 2.06 s. (25)
Thus, the simulation time could be shortened to 2.5 s. The results are visible from Table
23.
Table 23. Tests with the STATCOM model, VSC reactor overload.
Pickup
time
(s)
Trip time
(s)
Tripped
phase
Average value of
fundamental cur-
rent (A)
Operating
time (s)
Generic
model
0.077 2.146 B 2119 2.069
GE MiCOM
P14D
0.077 2.146 B 2119 2.069
ABB RE 615
series
0.065 2.125 A 2116 2.060
Phase A was observed to drop down temporarily during the beginning transients. For the
ABB RE 615, this occurred between 0.076...0.089 s into simulation. As this period is
shorter than 0.02 s, the timers of the relay were not reset. Moreover, the ripple in the
fundamental current was slightly larger in phase A than in phase B. While the current in
phase B varied between 2115 A and 2122 A, the corresponding values for phase A were
2111 A and 2121 A. The ripple is also visible in the operating time calculated by the
simulation model in steady state, as seen from Figure 29. The differences in the behav-
iour between phases are explained by the complexity of the simulation model and the
STATCOM topology.

73
Figure 29. Calculated operating time in phase B of the generic relay model, STATCOM control system tests.
The beginning transient, as well as the time after the trip, has been cut out from the
figure. For phase A, the dynamics of the current were slower than for phase B. This
prolonged the transient periods and lead to the increased fluctuation in both operating
time and measured current in the test of the ABB relay. Before the transient ended at 1.6
s into simulation, the simulated operating time increased from 2.08 s to 2.10 s before
decreasing to the calculated value of 2.06 s.
6.2.2 Differential protection
The unit test scheme, in which a single-phase earth fault was inserted to phase A in the
HV side of the main transformer, was repeated in the STATCOM simulation model. The
settings were presented in the middle column of Table 11. Similarly to the fault tests with
overcurrent relays, the STATCOM operated in its nominal inductive operating point. Due
to the realistic short circuit levels calculated from the transmission network of the cus-
tomer and integrated to the HV grid model, the STATCOM model provided a more stable
test environment than the unit test network with ideal voltage sources. This is shown by
the maximum differential current level of 34 pu in Figure 30. Moreover, the oscillation in
the pickup signals observed in the unit tests was not present in the tests with the STAT-
COM.

74
Figure 30. Fundamental components for the differential currents, measured by GE MiCOM P64x model.
The harmonic blocking of GE MiCOM P64x activated after the insertion of the fault, de-
laying the pickup of the function by 2 ms until the differential current exceeded 10 pu.
This reset the blocking signal, which in turn lead to trip as desired. This behaviour was
not observed with the more complicated logic of the relay from ABB RE 615 series. The
test results have been collected to Table 24.
Table 24. Test results for the differential protection, earth fault in phase A, STATCOM model.
Pickup time (s) Trip time (s) Fault cleared (s)
GE MiCOM P64x 0.008 0.043 0.10
ABB RE 615 se-
ries
0.003 0.066 0.13
The lengths of the operating delays in the protection relays were as specified in the man-
ual [50, p. 485] and equation 22. Like in the overcurrent relay tests, the 50 ms operating
delay of the breaker is included in the time before the fault is cleared. Both relays suc-
ceeded in fast tripping of the fault.
Based on the experiences from the testing process, the characteristics of the relay are
possible to be modelled sufficiently accurately to discriminate between the network faults
occurring in the protected zone and those occurring outside of it. However, implementing
the complicated harmonic blocking logic schemes properly requires detailed electrical
and electromagnetic modelling of the network and its components in the future. Simulta-
75
neously, the model could be extended to the detection of faults internal to the trans-
former, such as turn-to-turn faults.
When controlled to simple operating points, the STATCOM model provides an excellent
test environment for the basic operating characteristics of the protection relays. Simulta-
neously, it can be used to create complicated schemes, with which the accuracy of the
modelling can be analysed further in the future projects. In addition, by changing the
inputs of the protection relays to test data saved in suitable file formats, the relay simu-
lation models can be modified for simulations with the stability test cases currently im-
plemented with the RTDS.
76
7. CONCLUSIONS
This thesis started the Simulink modelling process of the protection functions which are
implemented with protection relays in flexible AC transmission system applications. The
models of these functions were tested by connecting them to a STATCOM model and
creating simulated faults or overloads to the grid. The functions modelled for the stability
simulation purposes and considered in this thesis were the overcurrent protection of the
VSC reactor and the differential protection of the main transformer connecting the STAT-
COM to the grid. The focus of the modelling was to identify differences between relay
models by different manufacturers.
In both the unit tests and the advanced system model, the implemented models man-
aged to detect all basic fault types and issue a trip according to the characteristics spec-
ified in the standards of the protection functions and the instruction manuals. Moreover,
the flexible models are simple to modify for the comparison of different commercial relay
models. For the implemented models, the utilized simulation environment of the STAT-
COM provided a stable test scheme, with which the correct operation of the relays could
be verified straightforwardly. However, if the detailed operation of the control system is
analysed simultaneously, the computational load required by the simulations sets limits
for the stability testing without scaling the simulation time down.
The main differences between the relay models analysed were found to be the sampling
process of the measured currents, the reset logic of the timers counting the time to trip
and the blocking possibilities of the functions. Due to the limited availability of the infor-
mation on the details of sampling, as well as the harmonic blocking logic of differential
relays, these two features require evaluation of the assumptions made in this thesis by
performing the stability tests with actual IEDs. For the development of the harmonic
blocking logic, a transformer model with complete saturation and hysteresis characteris-
tics is required to discriminate accurately between faults and the electromagnetic phe-
nomena leading to the blocking. In addition, the effect of the harmonics present in reac-
tive power compensation systems on the differential protection should be tested.
For the future projects, new simulation models will be created for thermal overload pro-
tection and residual overvoltage protection. Moreover, the operation of the simulation
models with the actual stability test schemes will be tested. The setting calculations will
be implemented in Matlab to allow the modelling to cover the entire design process of
the protection system.

77
REFERENCES
[1] Network Protection & Automation Guide, 2nd ed. Alstom Grid, UK, 2011, 508 p.
[2] IEC 60255-151, Measuring relays and protection equipment - Part 151: Func-
tional requirements for over/under current protection, International Electrotech-
nical Commission, Geneva, Switzerland, 2009, 63 p.
[3] K.R. Padiyar, Facts Controllers in Power Transmission and Distribution, New Age
International, Daryaganj, New Delhi, India, 2007, 532 p.
[4] Commission Regulation (EU) 2017/1485 of 2 August 2017 establishing a guide-
line on electricity transmission system operation (Text with EEA relevance.),
C/2017/5310, 2017. Available: https://eur-lex.europa.eu/eli/reg/2017/1485/oj.
[5] Fingrid OYJ's General Connection Terms YLE2017, 2017, 12 p. Available (ac-
cessed 09.01.2019): https://www.fingrid.fi/globalassets/dokumentit/en/custom-
ers/power-transmission/general-connection-terms_2017_en.pdf.
[6] H. Akagi, E.H. Watanabe, M. Aredes, Instantaneous Power Theory and Applica-
tions to Power Conditioning, John Wiley & Sons, Inc., Hoboken, NJ, USA, 2007,
400 p.
[7] B. Singh, A. Chandra, K. Al-Haddad, Power Quality: Problems and Mitigation
Techniques, John Wiley & Sons, Incorporated, New York, USA, 2014, 599 p.
[8] K. El-Arroudi, G. Joos, D. McGillis, Operation of impedance protection relays with
the STATCOM, IEEE Transactions on Power Delivery, Vol. 17, Iss. 2, 2002, pp.
381-387.
[9] J. Aho, N. Thomson, A. Kähkönen, K. Kaasalainen, Main Reactor concept - a
cost and performance efficient SVC configuration, 2014 16th European Confer-
ence on Power Electronics and Applications, Lappeenranta, Finland, August 26-
28, 2014, IEEE, pp. 1-9.
[10] M. Halonen, B. Thorvaldsson, K. Wikström, Protection of Static VAR Compensa-
tor, Study Committee B5 Colloquium, Jeju Island, South Korea, October 19-24,
2009, Cigre, pp. 204-1 – 204-6.
78
[11] M.H. Rashid, Power Electronics Handbook, 4th ed. Elsevier, Oxford, UK, 2018,
1496 p.
[12] R.M. Arias Velásquez, J.V. Mejia Lara, Snubber resistor influence in the thyristor
valves failure on the static VAR compensator, Engineering Failure Analysis, Vol.
89, 2018, pp. 150-176.
[13] K. Wikström, Z. Gajic, B. Poulsen, The design of a modern protection system for
a Static Var Compensator, Study Committee B5 Colloquium, Jeju Island, South
Korea, October 19-24, 2009, Cigré, pp. 205-1 – 205-6.
[14] P. Lauttamus, H. Tuusa, Comparison of Five-Level Voltage-Source Inverter
Based STATCOMs, 2007 Power Conversion Conference - Nagoya, Nagoya, Ja-
pan, April 2-5, 2007, IEEE, pp. 659-666.
[15] O. Törhönen, Benefits of Main Reactor based SVC in utility applications, Master
thesis, Tampere University of Technology, 2016, 55 p. Available:
http://urn.fi/URN:NBN:fi:tty-201604203824.
[16] The Main Reactor concept breathes new life into SVCs, General Electric, web
page. Available (accessed 30.01.2019): http://www.think-grid.org/main-reactor-
concept-breathes-new-life-svcs.
[17] E. Behrouzian, Operation and control of cascaded H-bridge converter for STAT-
COM application, Chalmers University of Technology, Department of Energy and
Engineering, Gothenburg, Sweden, 2016, 144 p.
[18] STATCOM: future-proofing reactive power compensation, GE Grid Solutions,
web page. Available (accessed 20.05.2019): https://www.gegridsolu-
tions.com/press/gepress/STATCOM.htm.
[19] J. C. Das, Application of STATCOM to an Industrial Distribution System Con-
nected to a Weak Utility System, IEEE Transactions on Industry Applications,
Vol. 52, Iss. 6, 2016, pp. 5345-5354.
[20] Q. Yu, P. Li, W. Liu, X. Xie, Overview of STATCOM technologies, 2004 IEEE In-
ternational Conference on Electric Utility Deregulation, Restructuring and Power
Technologies. Proceedings, Hong Kong, China, April 5-8, 2004, IEEE, pp. 647-
652.
79
[21] M. Pereira, D. Retzmann, J. Lottes, M. Wiesinger, G. Wong, SVC PLUS: An
MMC STATCOM for network and grid access applications, 2011 IEEE Trondheim
PowerTech, Trondheim, Norway, June 19-23, 2011, IEEE, pp. 1-5.
[22] J. Rodriguez, J. Lai, F.Z. Peng, Multilevel inverters: a survey of topologies, con-
trols, and applications, IEEE Transactions on Industrial Electronics, Vol. 49, Iss.
4, 2002, pp. 724-738.
[23] X. Wang, Q. Li, S. Wang, X. Wang, Y. Fu, Design of Driving and protection circuit
for Submodule based on cascaded H-bridge STATCOM, IOP Conference Series:
Materials Science and Engineering, Vol. 366, Iss. 1, 2018, pp. 1-7. Available (ac-
cessed 28.01.2019): https://dx.doi.org/10.1088/1757-899X/366/1/012074.
[24] W. Song, A.Q. Huang, Fault-Tolerant Design and Control Strategy for Cascaded
H-Bridge Multilevel Converter-Based STATCOM, IEEE Transactions on Industrial
Electronics, Vol. 57, Iss. 8, 2010, pp. 2700-2708.
[25] Y. Neyshabouri, H. Iman-Eini, A New Fault-Tolerant Strategy for a Cascaded H-
Bridge Based STATCOM, IEEE Transactions on Industrial Electronics, Vol. 65,
Iss. 8, 2018, pp. 6436-6445.
[26] P. Barbeiro, C. Moreira, H. Keko, H. Teixeira, N. Rosado, J. Moreira, R. Ro-
drigues, Sizing and siting static synchronous compensator devices in the Portu-
guese transmission system for improving system security, IET Generation, Trans-
mission & Distribution, Vol. 9, Iss. 10, 2015, pp. 957-965.
[27] M. Mahfouz, M. El-Sayed, Static synchronous compensator sizing for enhance-
ment of fault ride-through capability and voltage stabilisation of fixed speed wind
farms, IET Renewable Power Generation, Vol. 8, Iss. 1, 2014, pp. 1-9.
[28] D. Ramirez, S. Martinez, F. Blazquez, C. Carrero, Use of STATCOM in wind
farms with fixed-speed generators for grid code compliance, Renewable Energy,
Vol. 37, Iss. 1, 2012, pp. 202-212.
[29] J.L. Blackburn, T.J. Domin, Protective Relaying: Principles and Applications,
Third Edition, CRC Press, Baton Rouge, LA, USA, 2006, 666 p.
[30] J. Gers, E. Holmes, Protection of Electricity Distribution Networks, 3rd ed. Institu-
tion of Engineering and Technology, Herts, UK, 2011, 342 p.
80
[31] R. Leelaruji, L. Vanfretti, State-of-the-art in the industrial implementation of pro-
tective relay functions, communication mechanism and synchronized phasor ca-
pabilities for electric power systems protection, Renewable and Sustainable En-
ergy Reviews, Vol. 16, Iss. 7, 2012, pp. 4385-4395.
[32] 615 Series Technical Manual, Revision M, ABB, Vaasa, Finland, 2016, 1218 p.
[33] S. Horowitz, A. Phadke, J.K. Niemira, Power System Relaying, John Wiley &
Sons, Incorporated, New York, NY, USA, 2013, 399 p.
[34] W. Rebizant, J. Szafran, A. Wiszniewski, Digital Signal Processing in Power Sys-
tem Protection and Control, Springer Verlag London Limited, London, UK, 2011,
316 p.
[35] MiCOM P14D Technical Manual, Feeder Management IED, Publication Refer-
ence: P14D-TM-EN-10.1, GE Grid Solutions, Stafford, UK, 2019, 620 p.
[36] S. Das, T. Sidhu, M. Dadash Zadeh, Z. Zhang, A Novel Method for Turn to Turn
Fault Detection in Shunt Reactors, 2017 70th Annual Conference for Protective
Relay Engineers, College Station, TX, USA, April 3-6, 2017, IEEE, pp. 1-9.
[37] IEEE Std C37.99-2012, IEEE Guide for the Protection of Shunt Capacitor Banks,
IEEE, New York, NY, USA, 2013, 139 p.
[38] IEEE Std 1036-2010, Shunt capacitors for a.c. power systems having a rated
voltage above 1 000 V - Part 1: General, IEEE, New York, NY, USA, 2011, 85 p.
[39] E. Brandi, R. Abboud, F. Calero, Protecting Harmonic Filters in a ±600 kV HVDC
Installation, 42nd Annual Western Protective Relay Conference, Spokane, WA,
USA, October 20-22, 2015, Furnas and Schweitzer Engineering Laboratories, pp.
1-13.
[40] IEC 60255-149, Measuring relays and protection equipment –Part 149: Func-
tional requirements for thermal electrical relays, International Electrotechnical
Commission, Geneva, Switzerland, 2013, 93 p.
[41] J. Perez, Fundamental principles of transformer thermal loading and protection,
11th IET International Conference on Developments in Power Systems Protec-
tion (DPSP 2012), Birmingham, UK, April 23-26, 2012, pp. 1-6.

81
[42] S.E. Zocholl, G. Benmouyal, On the protection of thermal processes, IEEE Trans-
actions on Power Delivery, Vol. 20, Iss. 2, 2005, pp. 1240-1246.
[43] S.S. Martín, M.B. Fernández, Model and performance simulation for overcurrent
relay and fault-circuit-breaker using Simulink, International Journal of Electrical
Engineering Education, Vol. 43, Iss. 1, 2006, pp. 80-91.
[44] P. Mehta, V.H. Makwana, Radial Feeder Protection by Definite Time Overcurrent
Relay, Proceedings of the International Conference on Intelligent Systems and
Signal Processing, Anand, Gujarat, India, March 24-25, 2017, Springer Singa-
pore, Singapore, pp. 185-198.
[45] B. Vahidi, E. Esmaeeli, MATLAB-SIMULINK-based simulation for digital differen-
tial relay protection of power transformer for educational purpose, Computer Ap-
plications in Engineering Education, Vol. 21, Iss. 3, 2013, pp. 475-483.
[46] M. Kezunovic, J. Ren, S. Lotfifard, Design, Modeling and Evaluation of Protective
Relays for Power Systems, Springer International Publishing, Cham, Switzerland,
2016, 297 p.
[47] M. Kezunovic, B. Kasztenny, New SIMULINK Libraries for Modeling Digital Pro-
tective Relays and Evaluating Their Performance Under Fault Transients, Inter-
national Conference on Power Systems Transients, Budapest, Hungary, June 20-
24, 1999, pp. 191-196.
[48] M. Kezunovic, J. Ren & S. Lotfifard, Design, Modeling and Evaluation of Protec-
tive Relays for Power Systems, Texas A&M University, web page. Available (ac-
cessed 28.01.2019): http://smartgridcenter.tamu.edu/Book/wordpress/.
[49] J. Virta, Dynamic Matlab Simulink simulation model for power plant protection re-
lays: Master of Science Thesis, Tampere University of Technology, 2005, 108 p.
[50] MiCOM P40 Agile P642, P643, P645 Technical Manual, Transformer Protection
IED, Publication Reference: P64x-TM-EN-3, GE Grid Solutions, Stafford, UK,
2018, 630 p.
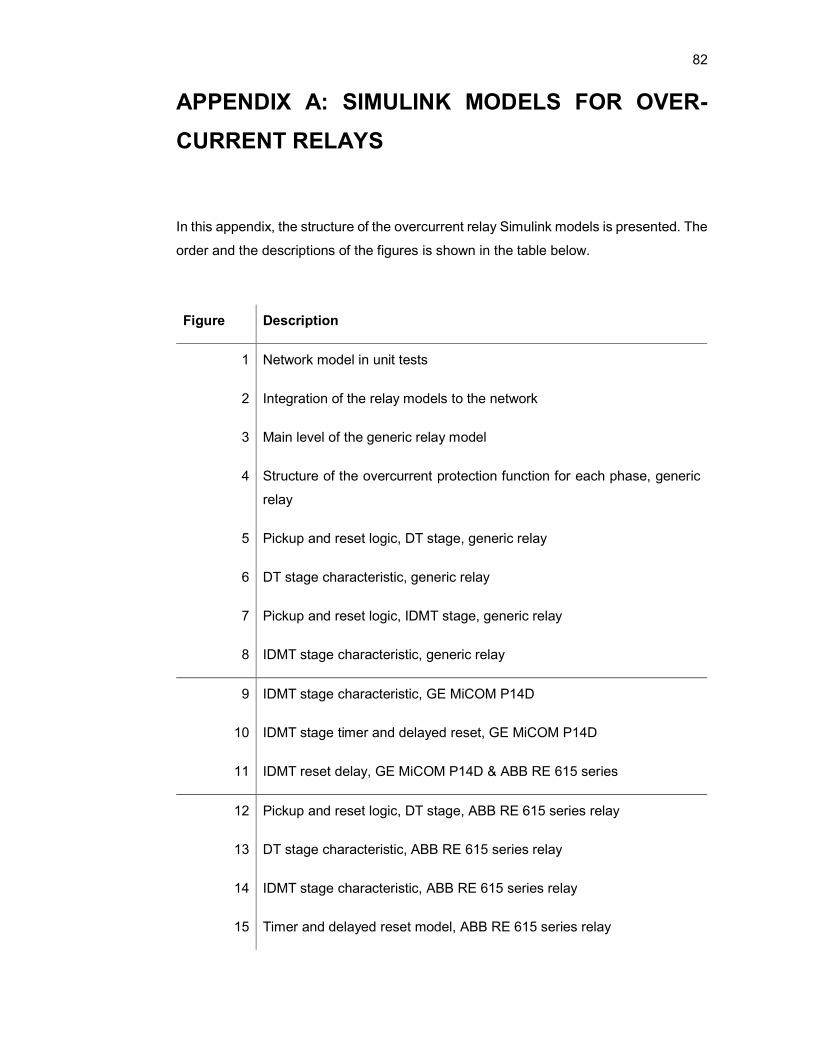
82
APPENDIX A: SIMULINK MODELS FOR OVER-
CURRENT RELAYS
In this appendix, the structure of the overcurrent relay Simulink models is presented. The
order and the descriptions of the figures is shown in the table below.
Figure Description
1 Network model in unit tests
2 Integration of the relay models to the network
3 Main level of the generic relay model
4 Structure of the overcurrent protection function for each phase, generic
relay
5 Pickup and reset logic, DT stage, generic relay
6 DT stage characteristic, generic relay
7 Pickup and reset logic, IDMT stage, generic relay
8 IDMT stage characteristic, generic relay
9 IDMT stage characteristic, GE MiCOM P14D
10 IDMT stage timer and delayed reset, GE MiCOM P14D
11 IDMT reset delay, GE MiCOM P14D & ABB RE 615 series
12 Pickup and reset logic, DT stage, ABB RE 615 series relay
13 DT stage characteristic, ABB RE 615 series relay
14 IDMT stage characteristic, ABB RE 615 series relay
15 Timer and delayed reset model, ABB RE 615 series relay

83
16 Timer for the reset request, ABB RE 615 series relay
17 Integrand selection logic for the timer, ABB RE 615 series relay
18 Reset logic of the timer, ABB RE 615 series relay
Figure 1
Figure 2
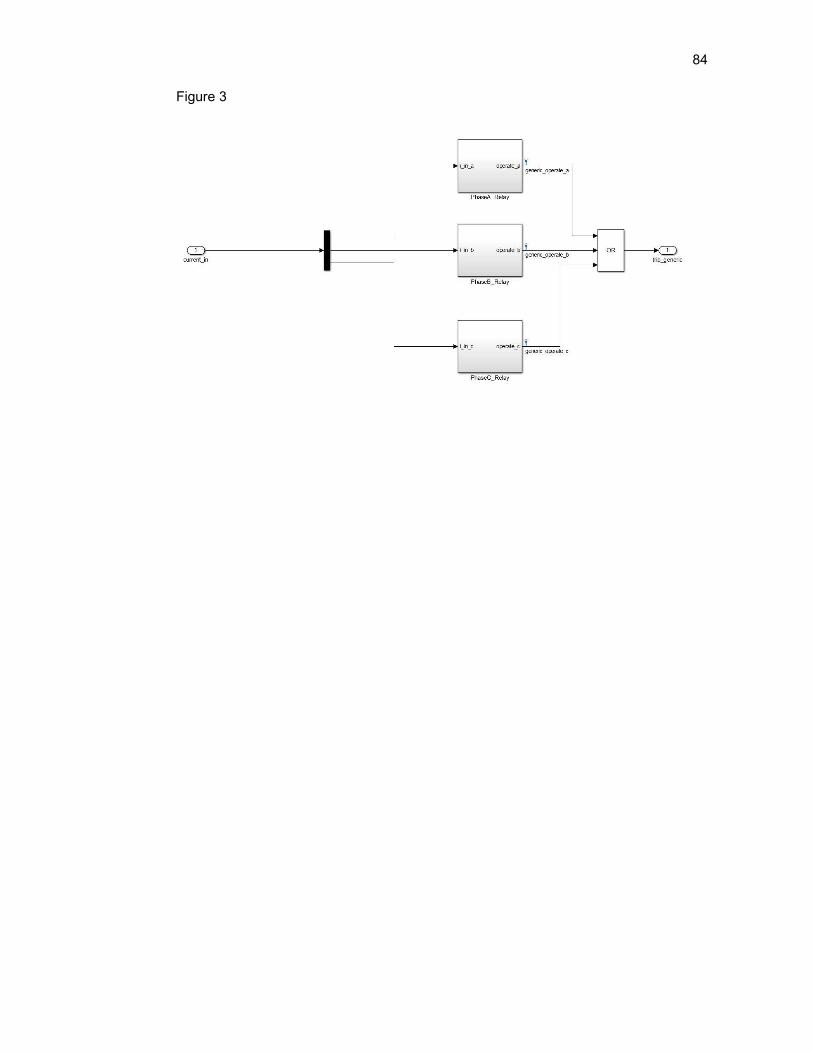
84
Figure 3

85
Figure 4

86
Figure 5
Figure 6
Figure 7
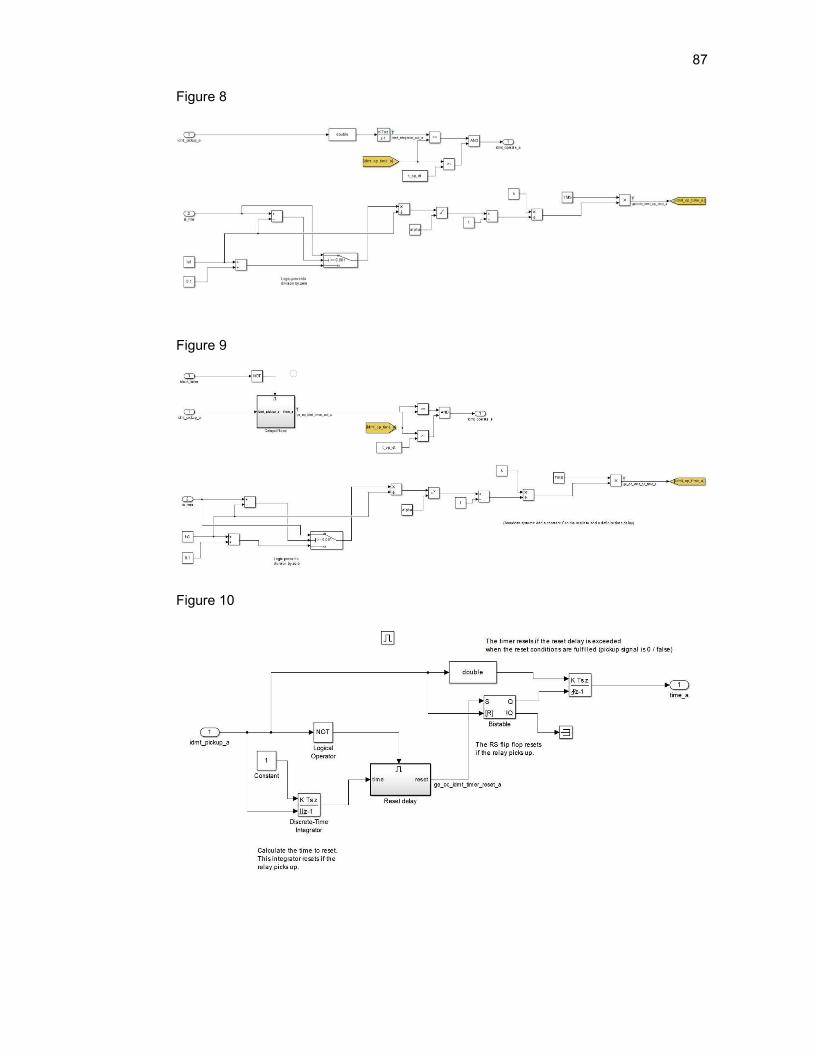
87
Figure 8
Figure 9
Figure 10
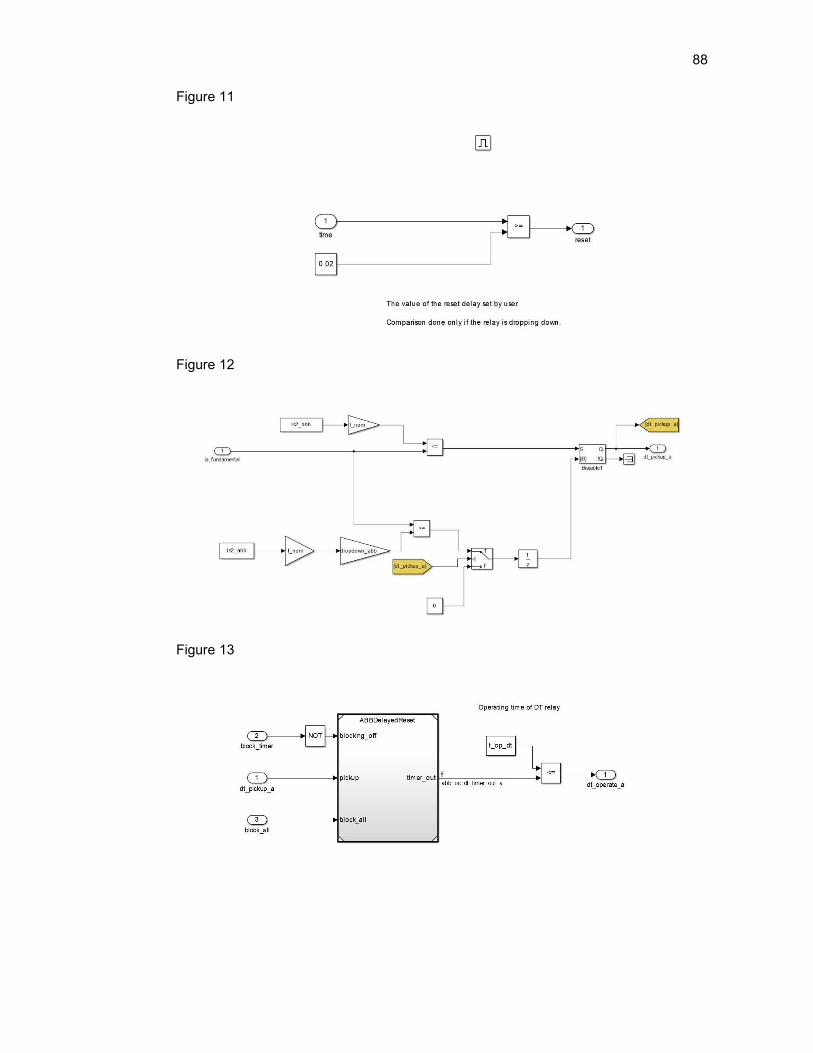
88
Figure 11
Figure 12
Figure 13

89
Figure 14
Figure 15
Figure 16

90
Figure 17
Figure 18

91
APPENDIX B: SIMULINK MODELS FOR DIF-
FERENTIAL RELAYS
The structure of the models for the differential protection, as well as the scripts required,
are presented in this appendix. The table below describes the contents of the figures in
order.
Figure Description
1 Network model in unit tests
2 Current transformer model
3 Integration of the relay models to the network
4 Transformer connection group compensation
5 Differential current calculation
6 Maximum bias current calculation, GE MiCOM P64x series relay
7 Harmonic blocking logic, GE MiCOM P64x series relay
8 2nd harmonic blocking logic, GE MiCOM P64x series relay
9 5th harmonic blocking logic, GE MiCOM P64x series relay
10 Operating delays, GE MiCOM P64x series relay
11 Tripping logic and lockout relay, GE MiCOM P64x series relay
12 Input blocking logic, ABB RE 615 series relay
13 Bias current calculation, ABB RE 615 series relay
14 Harmonic blocking logic, ABB RE 615 series relay
15 2nd harmonic blocking logic, ABB RE 615 series relay
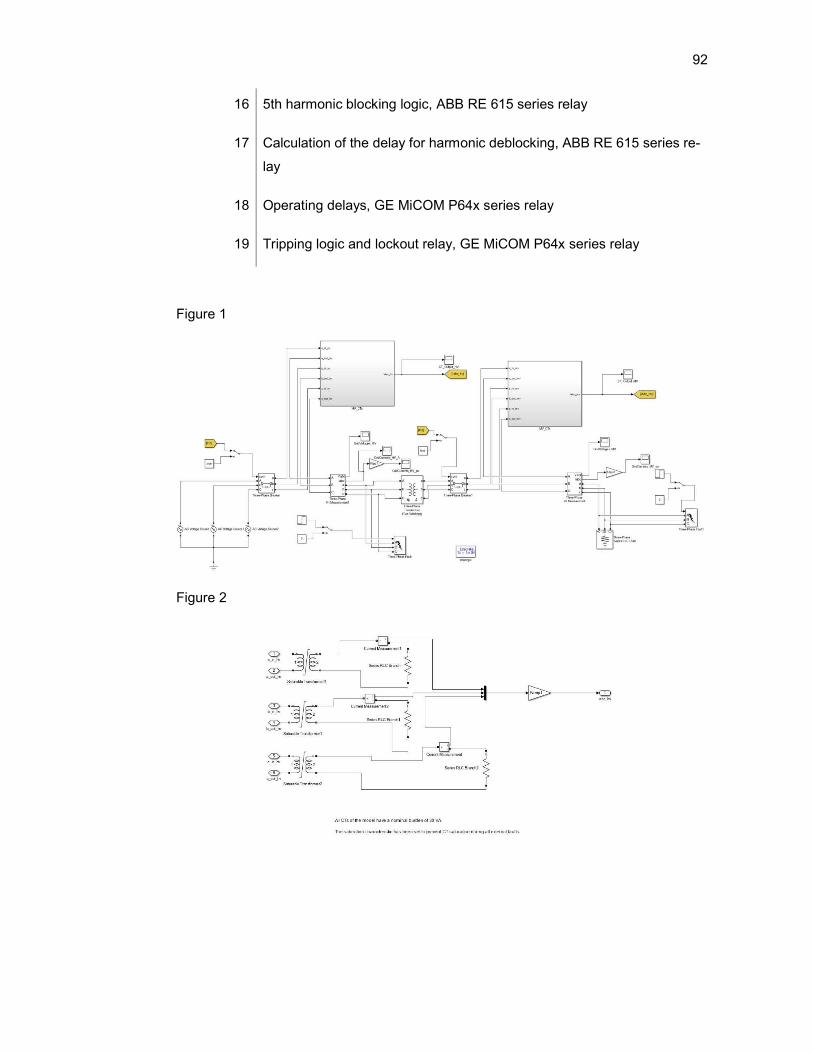
92
16 5th harmonic blocking logic, ABB RE 615 series relay
17 Calculation of the delay for harmonic deblocking, ABB RE 615 series re-
lay
18 Operating delays, GE MiCOM P64x series relay
19 Tripping logic and lockout relay, GE MiCOM P64x series relay
Figure 1
Figure 2

93
Figure 3
Figure 4
Figure 5
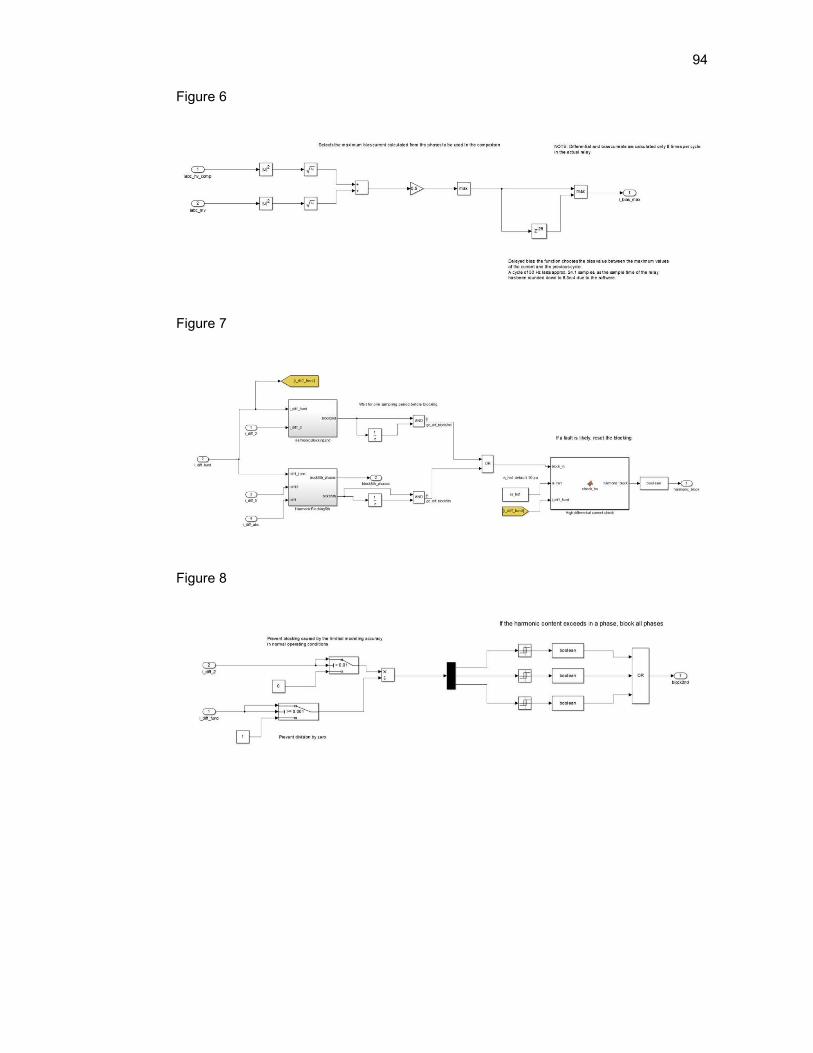
94
Figure 6
Figure 7
Figure 8
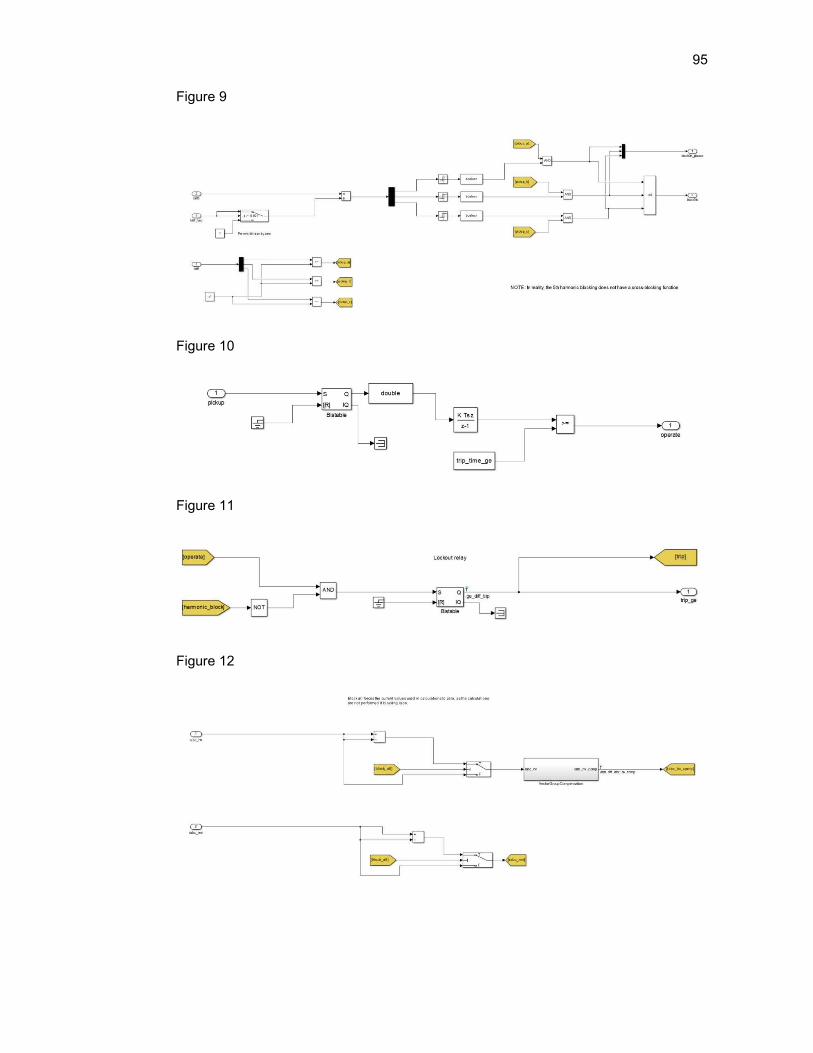
95
Figure 9
Figure 10
Figure 11
Figure 12
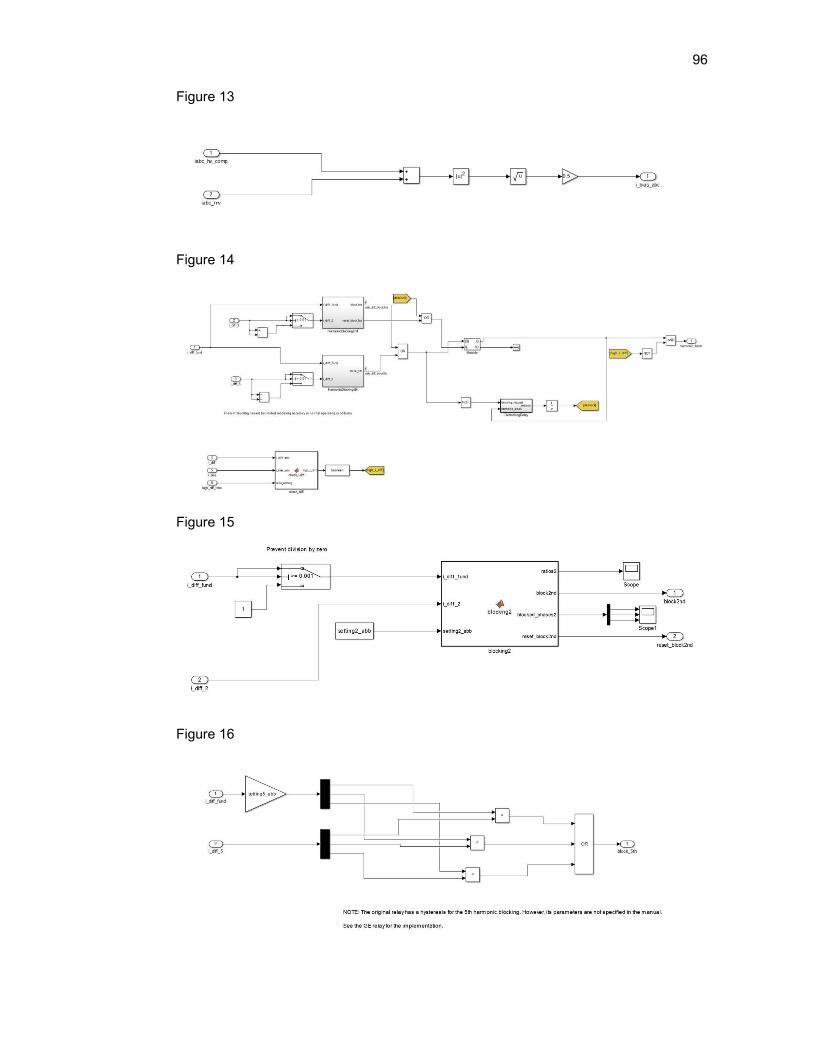
96
Figure 13
Figure 14
Figure 15
Figure 16

97
Figure 17
Figure 18
Figure 19

98
The scripts of the Matlab functions required for the models and their descriptions are
collected to the table below.
Function name Description
characteristic_ge Operating characteristic, GE MiCOM P64x series relay
check_hs High differential current check, GE MiCOM P64x series relay
characteristic_abb Operating characteristic, ABB RE 615 series relay
check_idiff High differential current check, ABB RE 615 series relay
blocking2 2nd harmonic blocking logic, ABB RE 615 series relay
%% Function for the operating characteristic of a GE P64x series relay
% Markus Nuuttila, GE Grid Solutions
% Created 28.03.2019
% Parameters: i_diff_fund, fundamental differential currents calculated
% from peak values
% bias: maximum value of the bias current during the current
% and the last periods (pu). Calculated from peak values.
% is1: diff. current setting of the flat slope range (pu)
% k1: slope 1 setting
% k2: slope 2 setting
% is2: diff. current setting in the knee point of K1 and K(pu)
% block5th_phases: logical information, indicates the phases blocked due to
% 5th harmonic
% harmonic_block: harmonic blocking bit
% Returns the pickup signal of the relay as double. The pickup is on if its
% value is 1.

99
function ge_diff_pickup = characteristic_ge(i_diff_fund, bias, is1, k1, k2, is2, block5th_phases, harmonic_block)
%#codegen
ge_diff_pickup = 0;
% Examine each phase separately
for i=1:3
test_current = i_diff_fund(i);
if (harmonic_block == true && block5th_phases(i) == true)
% Skip an overexcited phase blocked by 5th harmonic
continue
end
if ((bias > 0) && (bias <= (is1/k1)))
% Flat part of the characteristic
% Transient bias to be added
if (test_current >= is1)
% Break if the trip is issued
ge_diff_pickup = 1;
break
end
elseif ((bias > 0) && (bias <= is2))
% Middle part of the characteristic
if (test_current >= k1*is1)
ge_diff_pickup = 1;
break
end
elseif ((bias > 0) && (bias >= is2))
% Final part of the characteristic
if (test_current >= (k1*is2 + k2*(bias - is2)))
ge_diff_pickup = 1;
break
end
end
end
return

100
function harmonic_block = check_hs(block_in, is_hs1, i_diff_fund)
%#codegen
% Checks if the differential current is greater than the high stage setting
% to prevent the harmonic blocking in fault situations
% Returns the blocking signal
% Parameters: block_in, blocking signal from the harmonic blocking logic
% is_hs1, high stage 1 current setting (pu, default 10 pu)
% i_diff_fund, differential current fundamentals (pu)
if any (i_diff_fund >= is_hs1)
harmonic_block = false;
else
harmonic_block = block_in;
end
return
%% Function for the operating characteristic of an ABB RE 615 series relay
% Markus Nuuttila, GE Grid Solutions
% Created 28.03.2019
% Parameters: i_diff_fund, fundamental differential currents calculated
% from peak values
% i_bias_abc: bias currents calculated from peak values (pu).
% is1: diff. current setting of the flat slope range (pu)
% k1: slope 1 setting
% k2: slope 2 setting
% is2: diff. current setting in the knee point of K1 and K(pu)

101
% Returns the pickup signal of the relay as double. The pickup is on if its
% value is 1.
function start = characteristic_abb(i_diff_fund, i_bias_abc, is1, k1, k2, is2)
%#codegen
start = 0;
% Examine each phase separately
for i=1:3
test_current = i_diff_fund(i);
bias_current = i_bias_abc(i);
if ((bias_current > 0) && (bias_current <= 0.5))
% Flat part of the characteristic
if (test_current >= is1)
start = 1;
% If the trip is issued, the loop is terminated
break
end
elseif ((bias_current > 0) && (bias_current <= is2))
% Middle part of the characteristic
if (test_current >= k1*is1)
start = 1;
break
end
elseif ((bias_current > 0) && (bias_current >= is2))
% Final part of the characteristic
if (test_current >= (k1*is2 + k2*(bias_current - is2)))
start = 1;
break
end
end
end
return
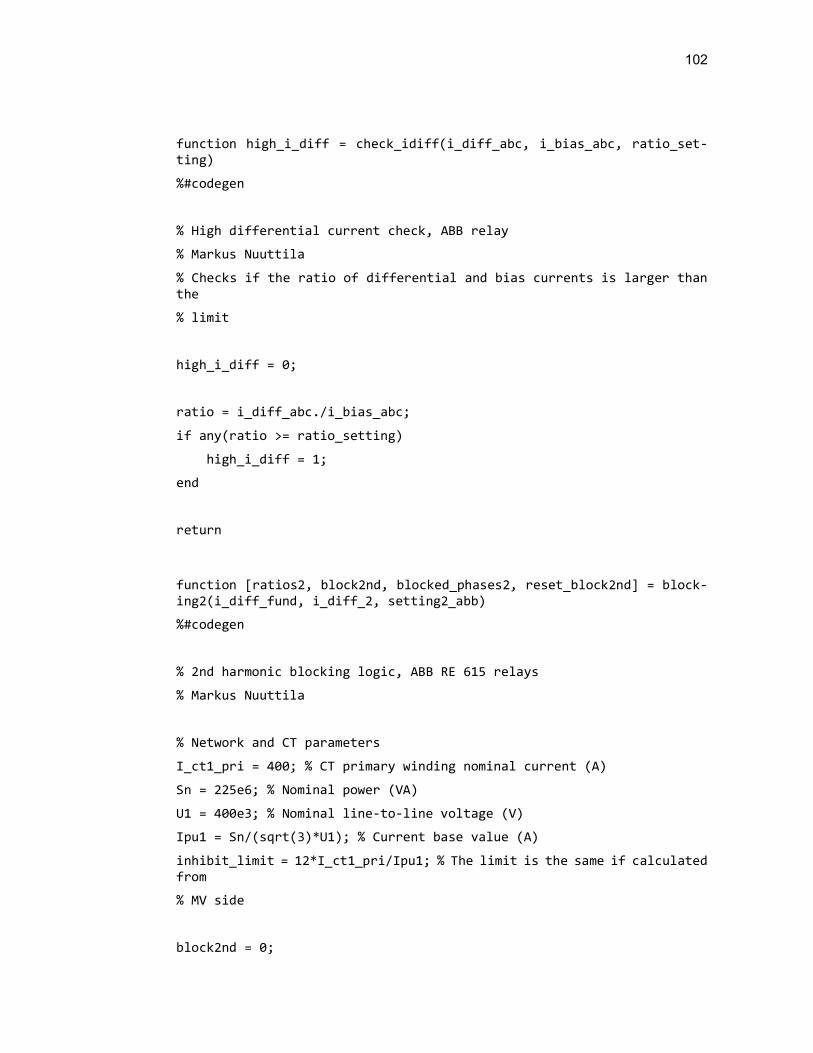
102
function high_i_diff = check_idiff(i_diff_abc, i_bias_abc, ratio_set-ting)
%#codegen
% High differential current check, ABB relay
% Markus Nuuttila
% Checks if the ratio of differential and bias currents is larger than the
% limit
high_i_diff = 0;
ratio = i_diff_abc./i_bias_abc;
if any(ratio >= ratio_setting)
high_i_diff = 1;
end
return
function [ratios2, block2nd, blocked_phases2, reset_block2nd] = block-ing2(i_diff_fund, i_diff_2, setting2_abb)
%#codegen
% 2nd harmonic blocking logic, ABB RE 615 relays
% Markus Nuuttila
% Network and CT parameters
I_ct1_pri = 400; % CT primary winding nominal current (A)
Sn = 225e6; % Nominal power (VA)
U1 = 400e3; % Nominal line-to-line voltage (V)
Ipu1 = Sn/(sqrt(3)*U1); % Current base value (A)
inhibit_limit = 12*I_ct1_pri/Ipu1; % The limit is the same if calculated from
% MV side
block2nd = 0;
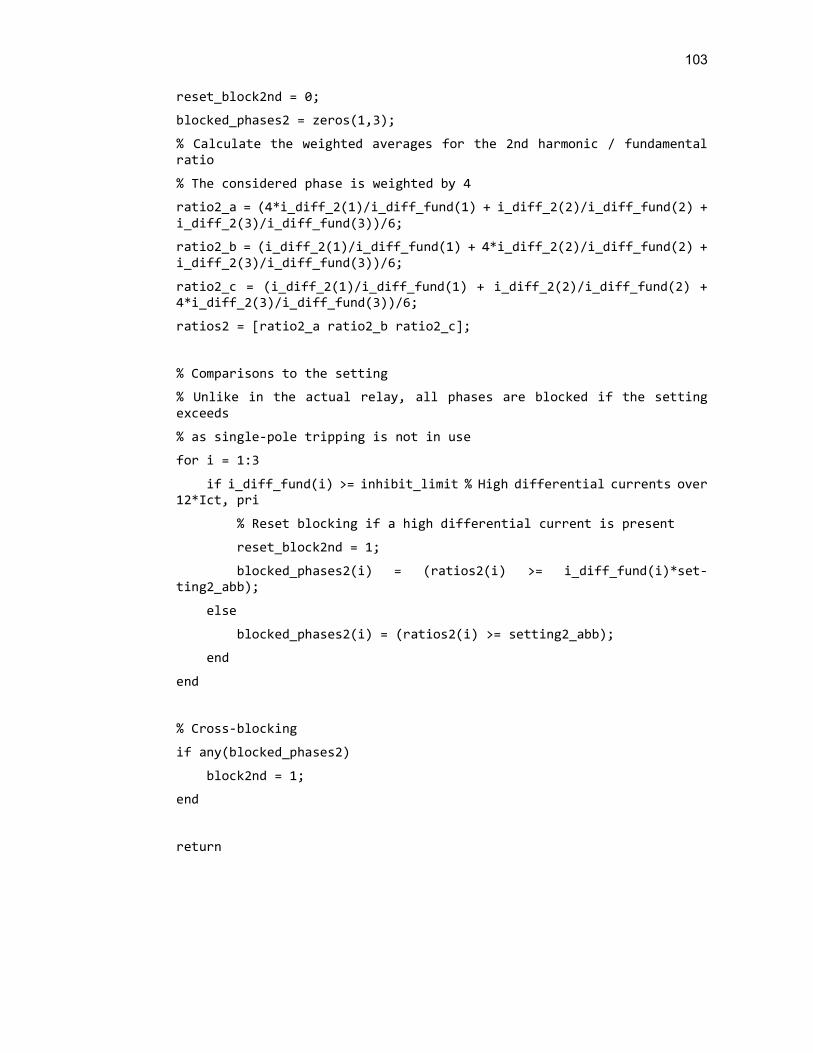
103
reset_block2nd = 0;
blocked_phases2 = zeros(1,3);
% Calculate the weighted averages for the 2nd harmonic / fundamental ratio
% The considered phase is weighted by 4
ratio2_a = (4*i_diff_2(1)/i_diff_fund(1) + i_diff_2(2)/i_diff_fund(2) + i_diff_2(3)/i_diff_fund(3))/6;
ratio2_b = (i_diff_2(1)/i_diff_fund(1) + 4*i_diff_2(2)/i_diff_fund(2) + i_diff_2(3)/i_diff_fund(3))/6;
ratio2_c = (i_diff_2(1)/i_diff_fund(1) + i_diff_2(2)/i_diff_fund(2) + 4*i_diff_2(3)/i_diff_fund(3))/6;
ratios2 = [ratio2_a ratio2_b ratio2_c];
% Comparisons to the setting
% Unlike in the actual relay, all phases are blocked if the setting exceeds
% as single-pole tripping is not in use
for i = 1:3
if i_diff_fund(i) >= inhibit_limit % High differential currents over 12*Ict, pri
% Reset blocking if a high differential current is present
reset_block2nd = 1;
blocked_phases2(i) = (ratios2(i) >= i_diff_fund(i)*set-ting2_abb);
else
blocked_phases2(i) = (ratios2(i) >= setting2_abb);
end
end
% Cross-blocking
if any(blocked_phases2)
block2nd = 1;
end
return
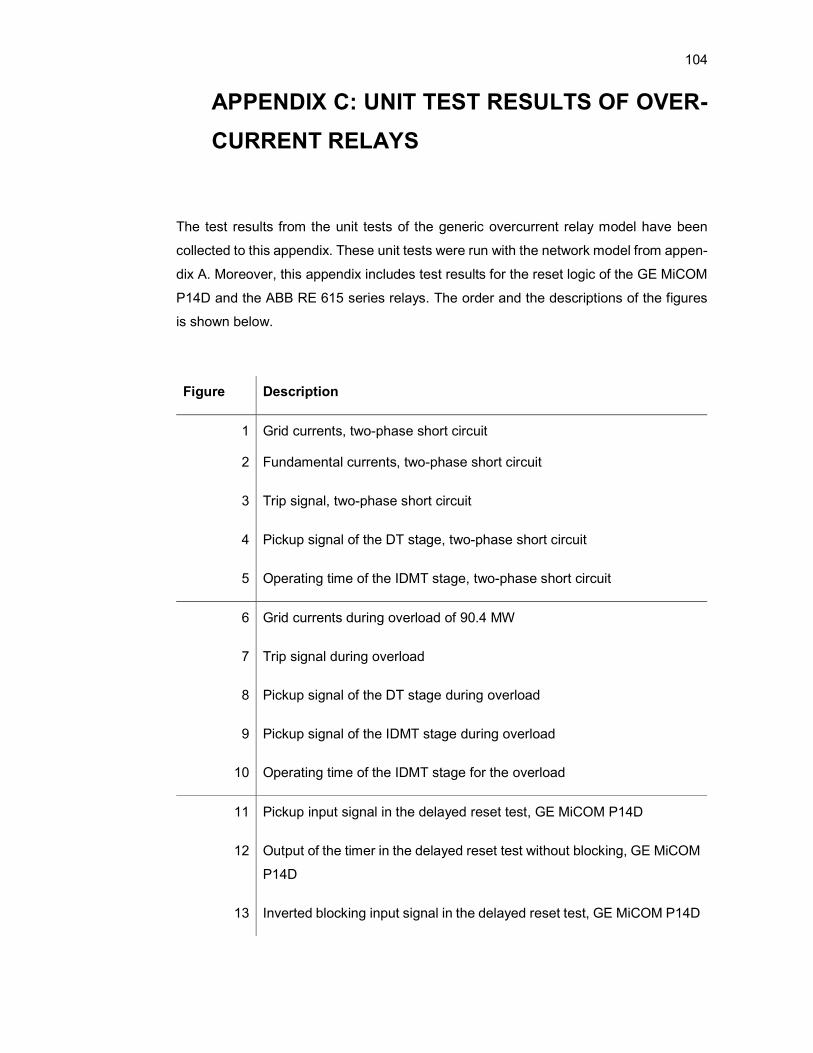
104
APPENDIX C: UNIT TEST RESULTS OF OVER-
CURRENT RELAYS
The test results from the unit tests of the generic overcurrent relay model have been
collected to this appendix. These unit tests were run with the network model from appen-
dix A. Moreover, this appendix includes test results for the reset logic of the GE MiCOM
P14D and the ABB RE 615 series relays. The order and the descriptions of the figures
is shown below.
Figure Description
1
2
Grid currents, two-phase short circuit
Fundamental currents, two-phase short circuit
3 Trip signal, two-phase short circuit
4 Pickup signal of the DT stage, two-phase short circuit
5 Operating time of the IDMT stage, two-phase short circuit
6 Grid currents during overload of 90.4 MW
7 Trip signal during overload
8 Pickup signal of the DT stage during overload
9 Pickup signal of the IDMT stage during overload
10 Operating time of the IDMT stage for the overload
11 Pickup input signal in the delayed reset test, GE MiCOM P14D
12 Output of the timer in the delayed reset test without blocking, GE MiCOM
P14D
13 Inverted blocking input signal in the delayed reset test, GE MiCOM P14D

105
14 Output of the timer in the delayed reset test with the blocking input, GE
MiCOM P14D
15 Pickup input signal in the delayed reset test, ABB RE 615 series relay
16 Output of the timer in the delayed reset test without blocking, ABB RE
615 series relay
17 Inverted blocking input signal in the delayed reset test, ABB RE 615 se-
ries relay
18 Output of the timer in the delayed reset test with the blocking input, ABB
RE 615 series relay
Figure 1

106
Figure 2
Figure 3
Figure 4

107
Figure 5
Figure 6
Figure 7

108
Figure 8
Figure 9
Figure 10

109
Figure 11
Figure 12

110
Figure 13
Figure 14
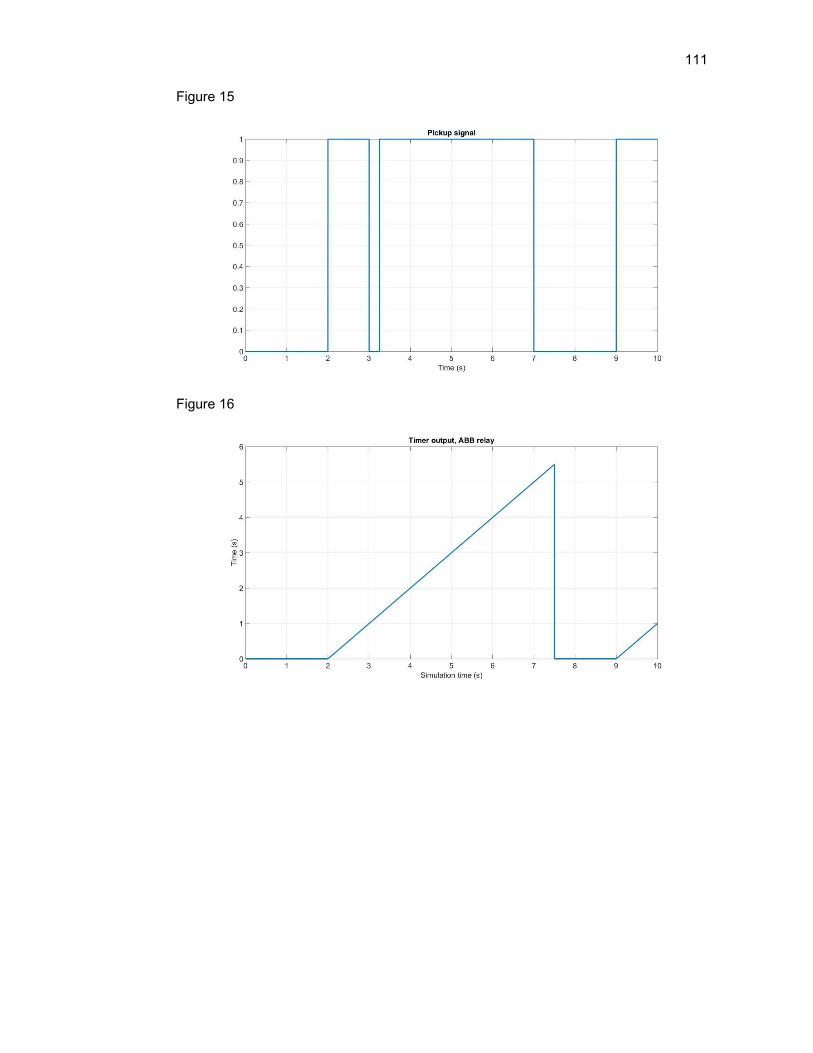
111
Figure 15
Figure 16

112
Figure 17
Figure 18
113
APPENDIX D: UNIT TEST RESULTS OF DIF-
FERENTIAL RELAYS
In this appendix, the unit test results for the differential protection function of a trans-
former are presented. The test network is depicted in appendix B. In the test, an earth
fault occurred in phase A next to the load in the 32 kV side of the network at the time of
0.1 s into simulation. Another earth fault occurred in the same phase inside the protected
zone at the time of 0.2 s. The table below shows the order and the description of the
figures.
Figure Description
1 Output of the current transformer at the 400 kV side after the internal
fault, GE MiCOM P64x series relay
2 Output of the current transformer at the 32 kV side during the faults,
GE MiCOM P64x series relay
3 Maximum bias current after the internal fault, GE MiCOM P64x series
relay
4 Fundamental components of the differential currents after the internal
fault, GE MiCOM P64x series relay
5 Pickup signal, GE MiCOM P64x series relay
6 Trip signal, GE MiCOM P64x series relay
7 Output of the current transformer at the 400 kV side after the internal
fault, ABB RE 615 series relay
8 Output of the current transformer at the 32 kV side during the faults,
ABB RE 615 series relay
9 Bias currents after the internal fault, ABB RE 615 series relay

114
10 Fundamental components of the differential currents after the internal
fault, ABB RE 615 series relay
11 Pickup signal, ABB RE 615 series relay
12 Trip signal, ABB RE 615 series relay
Figure 1
Figure 2

115
Figure 3
Figure 4
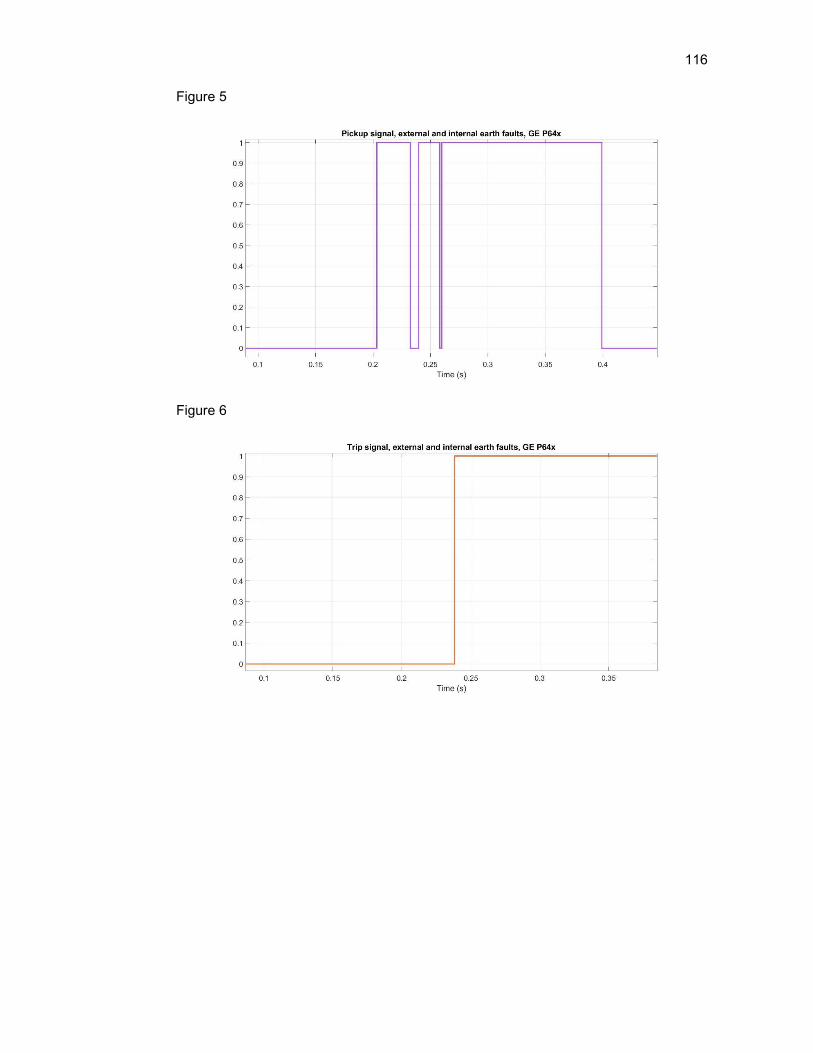
116
Figure 5
Figure 6
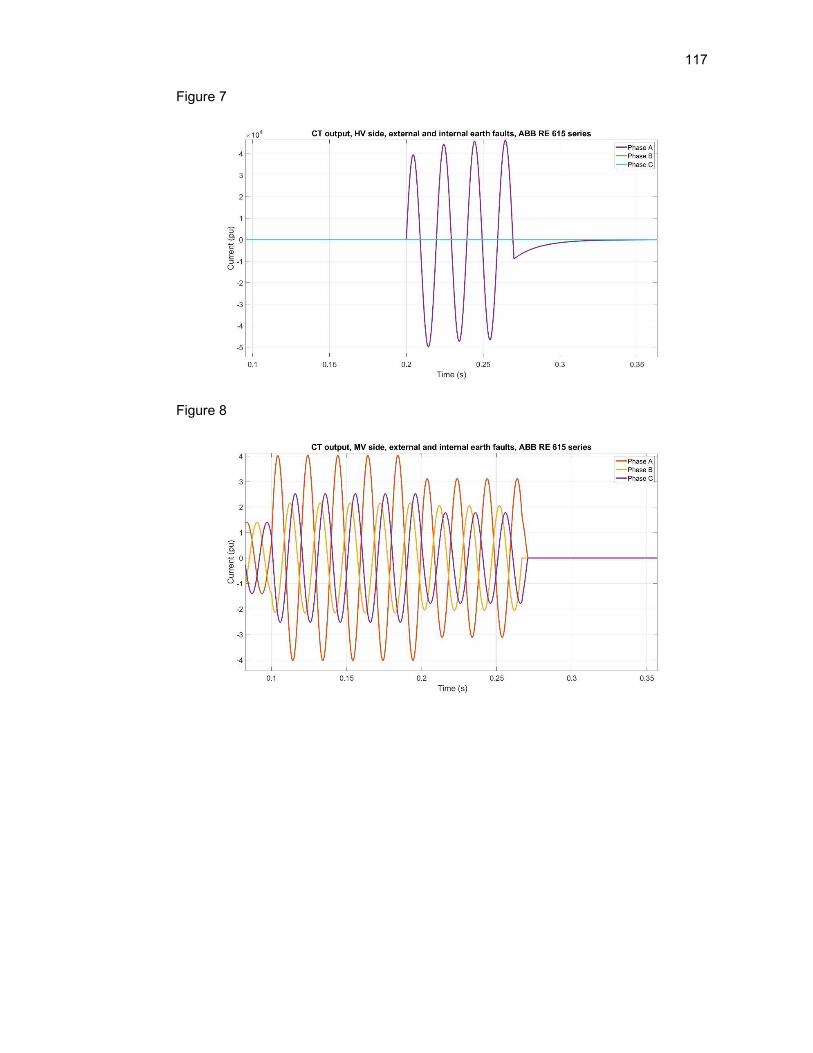
117
Figure 7
Figure 8
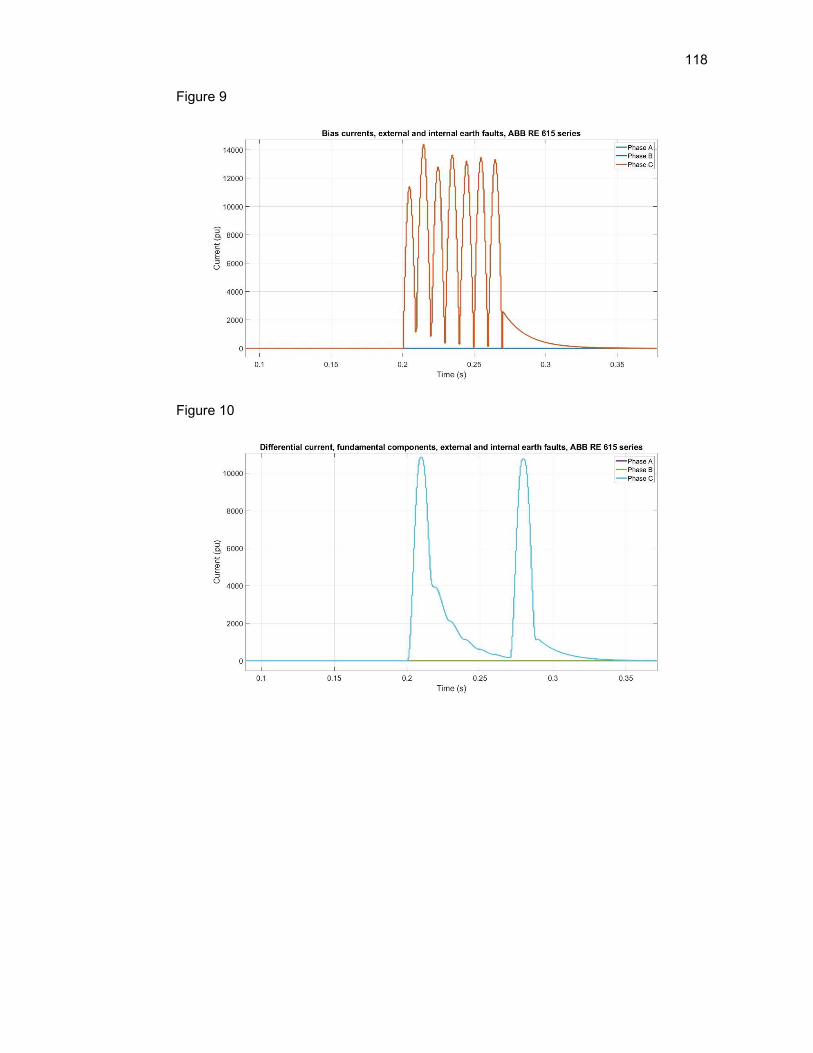
118
Figure 9
Figure 10

119
Figure 11
Figure 12