Embed Size (px)
Citation preview

www.pwc.com.au
Modellingof potentialpolicyreforms
Infrastructure
Australia
Final Report
Confidential
February 2016


Infrastructure AustraliaPwC i
Disclaimer
This Report has been prepared by PricewaterhouseCoopers Australia (PwC) in our capacity as advisors toInfrastructure Australia in accordance with our engagement letter dated 12 November 2015 (‘Agreement’).
The information, statements, statistics and commentary (together the ‘Information’) contained in this Reporthave been prepared by PwC from publicly available material, discussions with industry experts and frommaterial provided by Infrastructure Australia (IA). PwC has relied upon the accuracy, currency andcompleteness of the Information sourced in the public domain and that provided to it by InfrastructureAustralia and takes no responsibility for the accuracy, currency, reliability or correctness of the Information andacknowledges that changes in circumstances after the time of publication may impact on the accuracy of theInformation. The Information may change without notice and PwC is not in any way liable for the accuracy ofany information used or relied upon by a third party.
Our report has been limited to estimating the economic impacts of several policy reforms proposed by IA. Thedirect impacts applied in the modelling for each of the reforms have been collaboratively developed by PwC andIA and are based on findings of literature reviews, publicly available material and discussions with industryexperts. The broad nature of the modelling is such that the results are intended to be indicative only.
Furthermore PwC has not independently validated or verified the Information sourced or provided to it for thepurpose of the Report and the content of this Report does not in any way constitute an audit or assurance of anyof the Information contained herein.
Accordingly, whilst the statements made in this report are given in good faith, PwC accept no responsibility forany errors in the information sourced or provided by Infrastructure Australia or other parties nor the effect ofany such errors on our analysis, suggestions or report.
PwC has provided this advice solely for the benefit of Infrastructure Australia and disclaims all liability andresponsibility (including arising from its negligence) to any other parties for any loss, damage, cost or expenseincurred or arising out of any person using or relying upon the Information.
Liability limited by a scheme approved under Professional Standards legislation.

Infrastructure AustraliaPwC ii
Executive summary
Infrastructure Australia (IA) is recommending reforms to the energy, telecommunications, transport and watersectors that will enhance Australia’s productivity over the next 15 years and beyond. A group of significantmarket reform recommendations, which form part of the 2016 Australian Infrastructure Plan prepared by IA,has been modelled by PwC in order to estimate the increase in economic activity associated with the reforms.
The reforms considered in this analysis were:
In the energy sector:
Recommendation 6.4: All governments should transfer their remaining publicly-ownedelectricity generation, network and retail businesses to private ownership. Public ownership ofcommercial businesses, including monopolies in well-regulated markets, distorts outcomes, stifles competitionand harms consumers. Priorities include:
All remaining retail and generation businesses in public ownership should be prepared for sale, includingSnowy Hydro
Queensland, Western Australia, Tasmania and Northern Territory should begin the process of explaining theneed for reform to the community, with a view to divesting all electricity network assets. New South Walesshould articulate a pathway to a full sale as soon as practically achievable following the partial lease processcurrently underway.
Recommendation 6.5: Governments, through the COAG Energy Council and the AustralianEnergy Market Commission, should introduce more flexible network tariffs in the near term.Governments should publicly renew their commitment to this reform and work with relevant bodies tocommunicate the consumer benefits of a more flexible tariff arrangement.
Recommendation 6.7: Australia’s electricity and gas market should move to full retail pricederegulation as soon as practically possible. To support this:
Where price deregulation has not occurred in the retail electricity market, the Australian Energy MarketCommission should provide advice and a pathway for removing price regulation
The Australian Government should undertake a review to identify ways to increase competition in the retailgas market (consistent with the Harper Review).
In the telecommunications sector:
Recommendation 6.9: NBN Co should be privatised into an appropriately regulated market inthe medium term. In the near term, the Australian Government should commission a scoping study toassess the most appropriate approach, structure and timing to deliver a privatised NBN model. The scopingstudy to assess the most appropriate approach and structure for a privatised NBN should include options toefficiently support delivery of NBN services in regional and remote areas that are non-commercial.
In the water sector:
Recommendation 6.10: Governments should define a pathway to transfer state-ownedmetropolitan water utility businesses to private ownership to deliver more cost-effective,customer-responsive services. That pathway will:
Implement policy and institutional reforms to promote competitive neutrality in advance of privatisation,including full cost recovery pricing and commercial rates of return on capital
Introduce independent economic regulation, with the potential for the regulatory framework to be setnationally to avoid perceived conflicts of interest
Apply uniform drinking water quality and environmental regulation.
These reforms should be delivered within five years.

Executive summary CONFIDENTIAL
Infrastructure AustraliaPwC iii
In the transport sector:
After reviewing local and overseas experience to understand the potential direct impacts on the sectors subjectto these reforms PwC and IA agreed the following ‘shocks’ would be applied in an economy-wide modelling ofthe impacts. The shocks applied are an indicative estimate of the possible impacts that might be achieved undersuch reforms. In some cases, the details of the reforms are yet to be specified (e.g. congestion pricing) and sothe assumptions applied are necessarily broad. For this reason, the cost of reform has not been explicitlyincluded in the modelling; however the benefits of reform that have been modelled are intentionallyconservative.
In regard to IA’s recommendations on privatisation, it is not the change in ownership per se that results inbenefits but the change in incentives and practices that markets apply to businesses that enable more efficientallocation of resources. Assumptions were also made about the timing of the impacts; more difficult reformswere generally assumed to occur later. Where relevant, assumptions have been aligned with previouslypublished IA analyses.
Recommendation 6.13: Australia should seek to transition the revenue and funding frameworkfor roads to be consistent with other utility networks by establishing a corporatised deliverymodel. A regulated asset base approach provides a strong framework to achieve this outcome. As part of thebroader public inquiry into road funding reform (see Recommendation 5.3 below), the Australian Governmentshould direct a body like Infrastructure Australia or the Productivity Commission to:
Research the merits of a corporatised model for Australia’s road network(s) to establish a reform pathwayover the medium term
Evaluate and define the pathway to establish the corporatised road fund model in jurisdictions, includingprovisions for hypothecation of existing taxes and charges to support the delivery of transport infrastructurein advance of the introduction of user charging.
This work should be delivered in tandem with heavy vehicle charging and investment reform.
Recommendation 5.3: The Australian Government should initiate a public inquiry, to be led by abody like the Productivity Commission or Infrastructure Australia, into the existing fundingframework for roads and development of a road user charging reform pathway. The public inquiryshould consider:
Flaws in the existing charging framework – including fairness, financial sustainability andeconomic efficiency
The optimal approach for road user charging and transport infrastructure funding in Australia
The social implications of charging reform, including transitional and distributional impacts of replacingcurrent taxation with direct user charges
A detailed reform pathway for transition to a full user pays model for roads covering the whole networkand all users.
A public inquiry into road user charging reform should be supported by large-scale voluntary trials of road usercharging options, funded by the Australian Government.
Recommendation 5.4: Federal, state and territory governments should commit to the fullimplementation of a heavy vehicle road charging structure in the next five years. This reformshould include the removal of all existing registration and usage charges under the PayGo model and theintroduction of supporting regulatory and investment frameworks.
Recommendation 5.5: Federal, state and territory governments should also commit to the fullimplementation of a light vehicle road charging structure in the next 10 years. This reform mustinclude the removal of all existing inefficient taxes – including fuel excise and registration charges – and thedevelopment of supporting regulatory and investment frameworks.
Recommendation 6.14: Governments should adopt a default option of exposing public transportservices to contestable supply through franchising. The focus of reform should be to improvecustomers’ experience by exposing delivery to contestable supply and selecting the best operator to provideservices. Private operation of public transport through time limited, exclusive franchises – where providerscompete to deliver services – is a proven model both in Australia and overseas in raising service quality andvalue for money for customers. It should be the default option for public transport provision, with capital citybus and rail services as immediate candidates for franchising.
Executive summary CONFIDENTIAL
Infrastructure AustraliaPwC iv
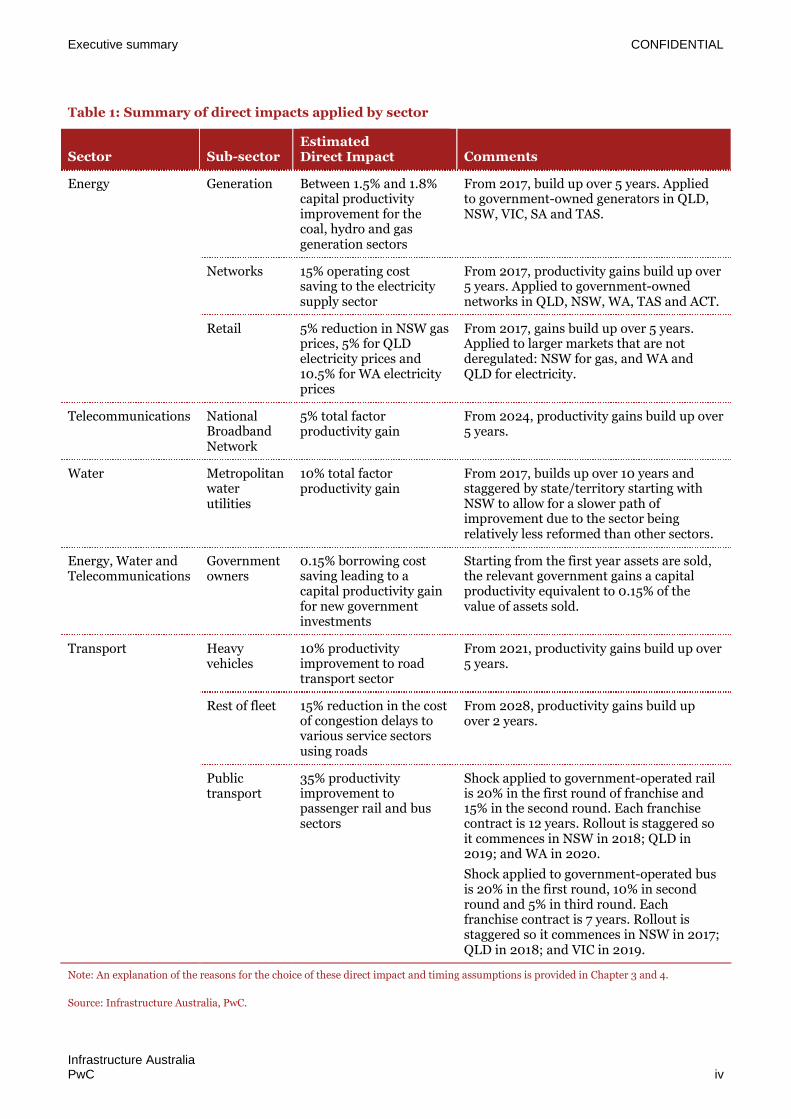
Table 1: Summary of direct impacts applied by sector
Sector Sub-sectorEstimatedDirect Impact Comments
Energy Generation Between 1.5% and 1.8%capital productivityimprovement for thecoal, hydro and gasgeneration sectors
From 2017, build up over 5 years. Appliedto government-owned generators in QLD,NSW, VIC, SA and TAS.
Networks 15% operating costsaving to the electricitysupply sector
From 2017, productivity gains build up over5 years. Applied to government-ownednetworks in QLD, NSW, WA, TAS and ACT.
Retail 5% reduction in NSW gasprices, 5% for QLDelectricity prices and10.5% for WA electricityprices
From 2017, gains build up over 5 years.Applied to larger markets that are notderegulated: NSW for gas, and WA andQLD for electricity.
Telecommunications NationalBroadbandNetwork
5% total factorproductivity gain
From 2024, productivity gains build up over5 years.
Water Metropolitanwaterutilities
10% total factorproductivity gain
From 2017, builds up over 10 years andstaggered by state/territory starting withNSW to allow for a slower path ofimprovement due to the sector beingrelatively less reformed than other sectors.
Energy, Water andTelecommunications
Governmentowners
0.15% borrowing costsaving leading to acapital productivity gainfor new governmentinvestments
Starting from the first year assets are sold,the relevant government gains a capitalproductivity equivalent to 0.15% of thevalue of assets sold.
Transport Heavyvehicles
10% productivityimprovement to roadtransport sector
From 2021, productivity gains build up over5 years.
Rest of fleet 15% reduction in the costof congestion delays tovarious service sectorsusing roads
From 2028, productivity gains build upover 2 years.
Publictransport
35% productivityimprovement topassenger rail and bussectors
Shock applied to government-operated railis 20% in the first round of franchise and15% in the second round. Each franchisecontract is 12 years. Rollout is staggered soit commences in NSW in 2018; QLD in2019; and WA in 2020.
Shock applied to government-operated busis 20% in the first round, 10% in secondround and 5% in third round. Eachfranchise contract is 7 years. Rollout isstaggered so it commences in NSW in 2017;QLD in 2018; and VIC in 2019.
Note: An explanation of the reasons for the choice of these direct impact and timing assumptions is provided in Chapter 3 and 4.
Source: Infrastructure Australia, PwC.

Executive summary CONFIDENTIAL
Infrastructure AustraliaPwC v
Applying these assumptions results in a gross domestic product (GDP) increase above baseline of $27.2 billionin 2031, and $39.0 billion in 2040 (see Table 2). On average, the package of reforms equates to increased GDPper capita of $1,151 or increased GDP per household of $2,936 in 2040. These are one-off impacts. GDP ishigher every year as a result of the reforms.
Table 2: Impact of reforms on GDP in 2031 and 2040
Indicator 2031 2040
GDP in baseline $2,766,837m $3,485,144m
Increase in GDP above baseline $27,169m $38,956m
Projected population 30.438m 33.854m
Increase in GDP per capita above baseline $893 $1,151
Projected number of households 11.752m 13.267m
Increase in GDP per household above baseline $2,312 $2,936
Note: Values are in 2015-16 dollars.
Source: Australian Bureau of Statistics, 3236.0 - Household and Family Projections, Australia, 2011 to 2036, Released 19 March 2015,Series III; Australian Bureau of Statistics, 3222.0 - Population projections, Australia, 2012 to 2101, Released November 2013; PwC IFEM,November 2015; PwC analysis.
The results presented in Table 2 are preliminary estimates of the gross benefits of the broad reforms identifiedby IA and will need to be refined as more precise plans for reform are developed over time. Any actual changeswould need to go through a formal assessment process that should involve a cost-benefit analysis expanding onthis report’s analysis by considering net economic benefits of specific reform proposals in detail.
Abbreviations CONFIDENTIAL
Infrastructure AustraliaPwC vi
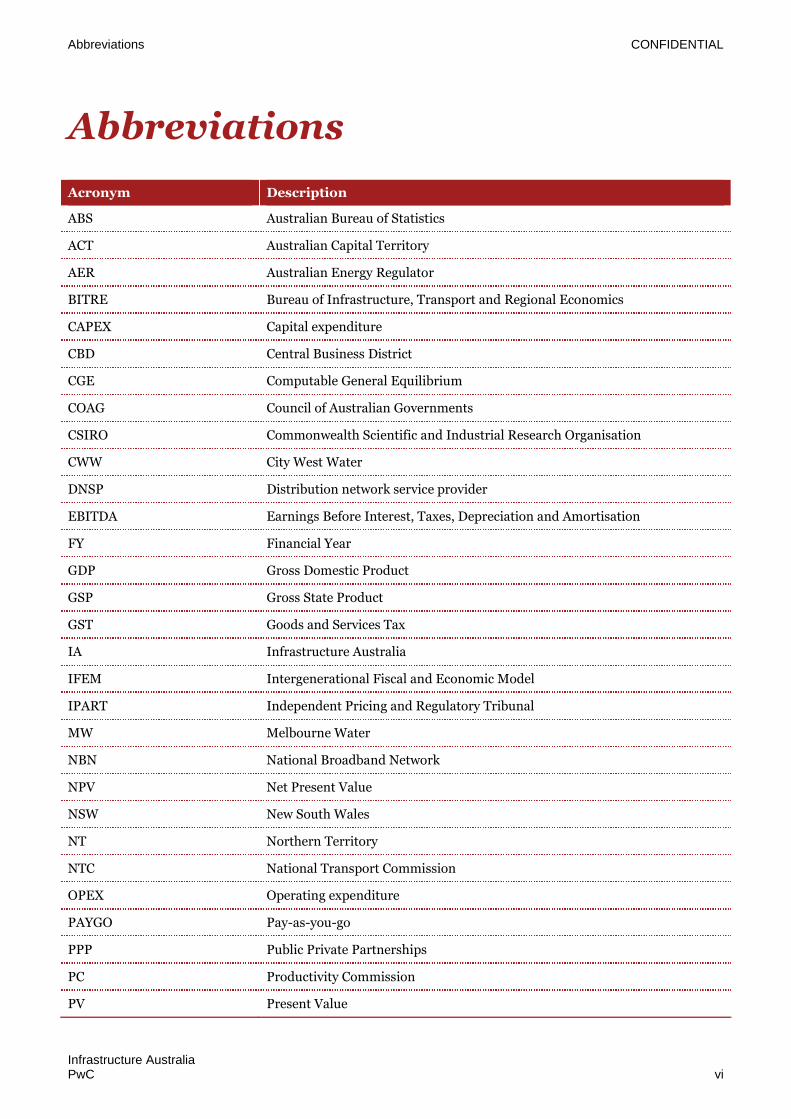
Abbreviations
Acronym Description
ABS Australian Bureau of Statistics
ACT Australian Capital Territory
AER Australian Energy Regulator
BITRE Bureau of Infrastructure, Transport and Regional Economics
CAPEX Capital expenditure
CBD Central Business District
CGE Computable General Equilibrium
COAG Council of Australian Governments
CSIRO Commonwealth Scientific and Industrial Research Organisation
CWW City West Water
DNSP Distribution network service provider
EBITDA Earnings Before Interest, Taxes, Depreciation and Amortisation
FY Financial Year
GDP Gross Domestic Product
GSP Gross State Product
GST Goods and Services Tax
IA Infrastructure Australia
IFEM Intergenerational Fiscal and Economic Model
IPART Independent Pricing and Regulatory Tribunal
MW Melbourne Water
NBN National Broadband Network
NPV Net Present Value
NSW New South Wales
NT Northern Territory
NTC National Transport Commission
OPEX Operating expenditure
PAYGO Pay-as-you-go
PPP Public Private Partnerships
PC Productivity Commission
PV Present Value
Abbreviations CONFIDENTIAL
Infrastructure AustraliaPwC vii
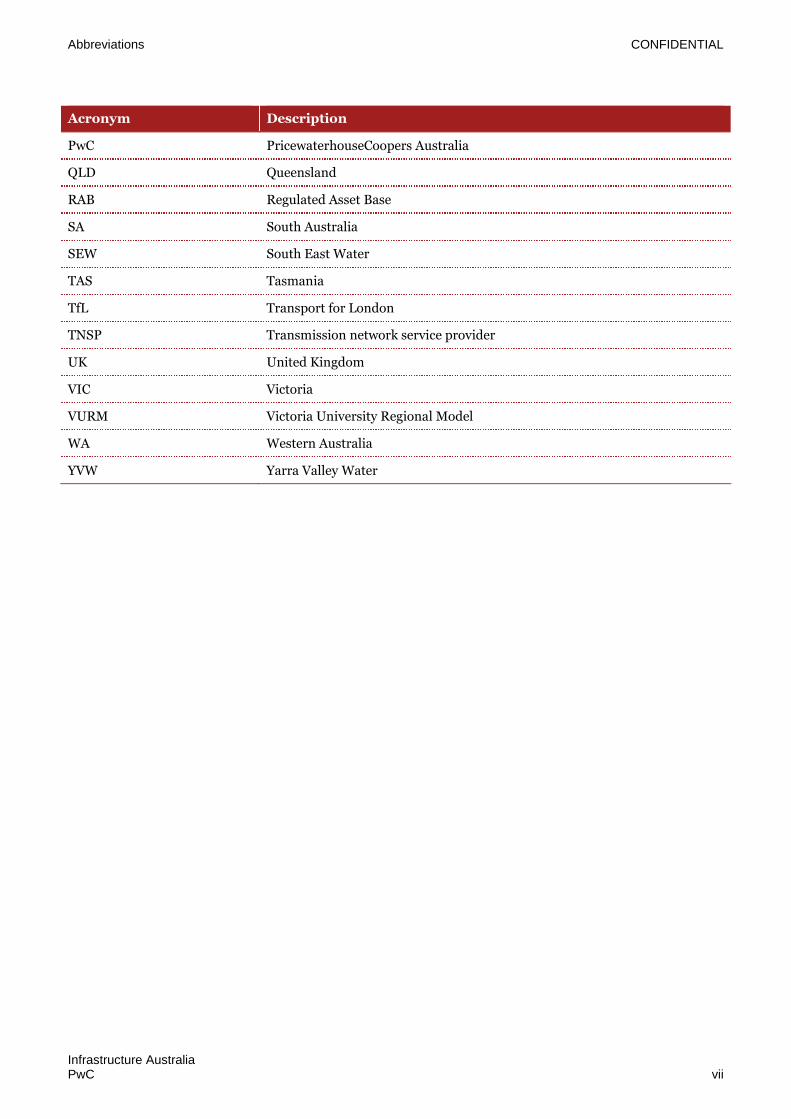
Acronym Description
PwC PricewaterhouseCoopers Australia
QLD Queensland
RAB Regulated Asset Base
SA South Australia
SEW South East Water
TAS Tasmania
TfL Transport for London
TNSP Transmission network service provider
UK United Kingdom
VIC Victoria
VURM Victoria University Regional Model
WA Western Australia
YVW Yarra Valley Water

Infrastructure AustraliaPwC ix
Contents
1 Introduction 1
2 Proposed reforms 2
3 Impact assumptions 9
4 Model assumptions 35
5 Results 44
Appendices 49
Appendix A Overview of energy, telecommunication, water and publictransport sector entities 50
Appendix B Experience in the UK water sector 58
Appendix C VURM Framework 60
Appendix D IFEM framework 61


CONFIDENTIAL
Infrastructure AustraliaPwC 1
1 Introduction
Infrastructure Australia (IA) is preparing to present an Australian Infrastructure Plan (the Plan) to theAustralian Government in early 2016. The Plan covers four economic infrastructure sectors – energy,telecommunications, water and transport. Although the Plan has a 15 year outlook, it is necessarily beingframed with regard to potential developments over the longer term.
The Plan builds upon and responds to the Australian Infrastructure Audit (the Audit), published in May 2015.The Audit identified a number of areas where policy reform will be required, if Australia’s infrastructure is tomeet the challenges facing the nation. In this regard, raising productivity is a key focus of the Plan.
Accordingly, the Plan includes a series of ‘policy reform recommendations’. If implemented, the reforms areexpected to raise productivity and increase national economic output.
Hence IA is interested in understanding the:
economic impact of prospective policy reforms (i.e. the impact on gross domestic product at a national leveland on gross state product at a state and territory level)
economic impacts on Australian households.
PricewaterhouseCoopers Australia (PwC) was engaged to undertake this analysis using economy-wideeconomic modelling. This analysis has been undertaken by employing assumptions that are necessarily high-level and so the results of the analysis should be viewed as indicative of the possible scale of impact on theAustralian economy. The assumptions are therefore conservative. This is an initial assessment of the grosseconomic benefits of reform intended to identify the broad scale of impacts; it is not a cost-benefit analysis.Further modelling following the development of more specific policy proposals (notably in the transport sector)will be useful to refine the estimates presented here.
PwC’s modelling relies on assumptions PwC and IA have made about the direct impacts of the reforms; forexample, by how much the costs of congestion can be reduced by the suggested transport sector reform. Wehave assisted IA by researching possible direct impacts of the reforms and then agreed with IA as to the scaleof impacts.
Our modelling approach uses a Computable General Equilibrium (CGE) model, specifically the VictoriaUniversity’s Centre of Policy Studies dynamic CGE model – the Victoria University Regional Model (VURM).The CGE model is based on Australian Bureau of Statistics input-output data which details the various incomeand expenditure components that comprise Australia’s gross domestic product (GDP). Using this model andPwC’s forecast of economic growth out to 2040, we can estimate the deviation in economic output from abaseline as a result of the proposed policy reforms.
This report sets out the findings of this analysis.
The remainder of this report is structured as follows:
Chapter 2 – describes the proposed reforms that are the subject of the analysis undertaken in this report
Chapter 3 – summarises the research undertaken into the direct economic impacts that are likely to beexperienced in the sectors affected by the reforms
Chapter 4 – sets out the assumptions applied in the baseline of the model to which the reform scenariosare compared and the assumptions applied in the policy scenarios
Chapter 5 – documents and discusses the results of the analysis for each of the sectors and in total
Appendices are included which set out some supporting information relevant to the analysis.

CONFIDENTIAL
Infrastructure AustraliaPwC 2
2 Proposed reforms
In order to meet Australia’s infrastructure needs, infrastructure policy and governance needs to bereformed. Investment in new projects, while important and necessary, will not be sufficient to support thenation’s development. The Australian Infrastructure Plan therefore sets out a number of recommendationsaimed at reforming the infrastructure sector. These recommendations are aimed at improving productivity inthe Australian economy.
This chapter provides some context to the reforms proposed by IA in order to understand the potential scale ofdirect economic impacts the reforms may have on each sector.
2.1 EnergyThere are two main elements relevant to the energy sector that IA is considering in its proposed reforms:privatisation and deregulation. Each of these are described below.
2.1.1 Privatisation of electricity assetsSome of the electricity generators, transmission, distribution and retail operators in Australia havebeen privatised:
Victoria, South Australia and New South Wales have privatised some or all of their electricity generationassets. 1 The remaining generators that are partially or fully government-owned include StanwellCorporation, CS Energy, Delta Electricity,2 Snowy Hydro, Hydro Tasmania and Synergy.
Victoria and South Australia have sold their networks. These are now run as: Ausnet Services, Powercor,CitiPower, United Energy and Jemena in Victoria, and as ElectraNet and SA Power Networks in SouthAustralia. New South Wales is currently in the process of leasing out 50.4 per cent of AusGrid and 50.4 percent of Endeavour Energy, while a private consortium that successfully bid for 100 per cent of TransGrid willoperate that business under a lease.3 Apart from these examples, many of the electricity networks businessesare government-owned.
IA proposes that those electricity assets remaining in public ownership be sold:
Recommendation 6.4: All governments should transfer their remaining publicly-ownedelectricity generation, network and retail businesses to private ownership. Public ownership ofcommercial businesses, including monopolies in well-regulated markets, distorts outcomes, stifles competitionand harms consumers. Priorities include:
All remaining retail and generation businesses in public ownership should be prepared for sale, includingSnowy Hydro
Queensland, Western Australia, Tasmania and Northern Territory should begin the process of explaining theneed for reform to the community, with a view to divesting all electricity network assets. New South Walesshould articulate a pathway to a full sale as soon as practically achievable following the partial lease processcurrently underway.
1 Australian Energy Regulator, Industry information, available at www.aer.gov.au/industry-information. Accessed 20 December 2015.
2 We note that since undertaking the analysis, Delta Electricity has subsequently been sold by the NSW Government to Sunset Power International.
3 http://www.treasury.nsw.gov.au/electricity_network_transactions Accessed 20 December 2015.

Proposed reforms CONFIDENTIAL
Infrastructure AustraliaPwC 3
2.1.2 Deregulation of energy retail marketsMost Australian households are able to choose the company supplying their gas or electricity – households thatchoose their electricity supplier have prices set by a ‘market contract’ whereas, those that choose to remain on a‘standard contract’ have their electricity prices set by the relevant State or Territory regulator or by theelectricity supplier. Markets where regulated electricity prices have been phased out for households includeVictoria since January 2009, South Australia since February 2013 and New South Wales since July 2014. 4
IA’s recommendations are:
Recommendation 6.5: Governments, through the COAG Energy Council and the AustralianEnergy Market Commission, should introduce more flexible network tariffs in the near term.Governments should publicly renew their commitment to this reform and work with relevant bodies tocommunicate the consumer benefits of a more flexible tariff arrangement.
Recommendation 6.7: Australia’s electricity and gas market should move to full retail pricederegulation as soon as practically possible. To support this:
Where price deregulation has not occurred in the retail electricity market, the Australian Energy MarketCommission should provide advice and a pathway for removing price regulation
The Australian Government should undertake a review to identify ways to increase competition in the retailgas market (consistent with the Harper Review).
2.2 TelecommunicationsNBN Co is a government-owned company with an aim to provide high quality broadband to homes andbusinesses throughout the country (although different technologies will be used, so some regional areas willhave access by satellite rather than fibre optic cable for example). Since its inception in 2009 it was envisagedthat government would fund the roll out (through borrowing) and then once NBN Co was operational it wouldbe privatised at some point.5
The Vertigan review of the NBN in 2014 recommended promoting competition in the market fortelecommunications by:
‘breaking up parts of NBN Co to foster long-term competition
relaxing the rules around how new broadband networks compete with NBN Co and promoting competitionin new developments by requiring developers and consumers to meet infrastructure costs
creating a new regulator for managing access to telecommunications networks across Australia.’6
4 Australian Energy Regulator, ‘State of the Energy Market 2015’, 2015, p. 131.
5 For example, the 2010 Implementation Study recommended that privatisation be done after roll out is complete with flexibility over the timing of theprivatisation. Source: The Treasury, NBN – Privatisation, 12 November 2010. Available at:http://www.treasury.gov.au/~/media/Treasury/Access%20to%20Information/Disclosure%20Log/2011/Competition%20policy%20and%20market%20structure%20aspects%20of%20the%20NBN/Downloads/R_48_101112_QTB_NBN_Privatisation.ashx Accessed 19 January 2016.
6 Department of Communication and the Arts, NBN Market and Regulation Report, October 2014, available at
https://www.communications.gov.au/departmental-news/nbn-market-and-regulation-report Accessed 20 January 2016.

Proposed reforms CONFIDENTIAL
Infrastructure AustraliaPwC 4
IA’s proposed policy reform responds to the review and is:
Recommendation 6.9: NBN Co should be privatised into an appropriately regulated market inthe medium term. In the near term, the Australian Government should commission a scoping study toassess the most appropriate approach, structure and timing to deliver a privatised NBN model. The scopingstudy to assess the most appropriate approach and structure for a privatised NBN should include options toefficiently support delivery of NBN services in regional and remote areas that are non-commercial.
2.3 WaterOverseas experience suggests that private operation of water utilities can provide a range of cost-saving capitaland operational efficiencies, while maintaining or improving service quality. The Plan’s recommendation isaimed at securing such efficiencies in the Australian metropolitan water environment.
IA’s proposed policy reform is:
Recommendation 6.10: Governments should define a pathway to transfer state-ownedmetropolitan water utility businesses to private ownership to deliver more cost-effective,customer-responsive services. That pathway will:
Implement policy and institutional reforms to promote competitive neutrality in advance of privatisation,including full cost recovery pricing and commercial rates of return on capital
Introduce independent economic regulation, with the potential for the regulatory framework to be setnationally to avoid perceived conflicts of interest
Apply uniform drinking water quality and environmental regulation.
These reforms should be delivered within five years.
2.4 TransportIA has developed five reform proposals for road transport, and for public transport. These include two generaland two sector specific recommendations for road transport. The fifth recommendation is for public transportand is designed to improve service quality and value for money.
In the road transport sector, IA’s principal reforms are aimed at:
facilitating the development of a transport market through greater application of user charging in theroad sector
providing a more durable funding stream for maintaining and developing the road network
reducing the cost of congestion, by sending a pricing signal to manage demand on the road network.
In combination, these road transport reforms provide a direct link between usage and supply. This could allowfor infrastructure investment that is efficient, responsive to consumer demands and financially sustainable.These market structures provide price signals to users that reflect the cost of supply, and communicate thedemand profile back to infrastructure providers.
To support the effectiveness of these reforms, IA recommends changes to the framework for road funding:
Proposed reforms CONFIDENTIAL
Infrastructure AustraliaPwC 5
Recommendation 6.13: Australia should seek to transition the revenue and funding frameworkfor roads to be consistent with other utility networks by establishing a corporatised deliverymodel. A regulated asset base approach provides a strong framework to achieve this outcome. As part of thebroader public inquiry into road funding reform (see Recommendation 5.3 below), the Australian Governmentshould direct a body like Infrastructure Australia or the Productivity Commission to:
Research the merits of a corporatised model for Australia’s road network(s) to establish a reform pathwayover the medium term
Evaluate and define the pathway to establish the corporatised road fund model in jurisdictions, includingprovisions for hypothecation of existing taxes and charges to support the delivery of transport infrastructurein advance of the introduction of user charging.
This work should be delivered in tandem with heavy vehicle charging and investment reform.
To deliver these reforms, IA has identified a need to further develop the policy context for road use chargingand funding. This is in line with recommendations made by the Productivity Commission (PC) and otherbodies. IA recommends that:
Recommendation 5.3: The Australian Government should initiate a public inquiry, to be led by abody like the Productivity Commission or Infrastructure Australia, into the existing fundingframework for roads and development of a road user charging reform pathway. The public inquiryshould consider:
Flaws in the existing charging framework – including fairness, financial sustainability andeconomic efficiency
The optimal approach for road user charging and transport infrastructure funding in Australia
The social implications of charging reform, including transitional and distributional impacts of replacingcurrent taxation with direct user charges
A detailed reform pathway for transition to a full user pays model for roads covering the whole networkand all users.
A public inquiry into road user charging reform should be supported by large-scale voluntary trials of road usercharging options, funded by the Australian Government.
2.4.1 Heavy vehiclesHeavy vehicles are charged in two ways through what is known as a pay-as-you-go (PAYGO) model, a systemthat has been in place since 1995:
The first is through registration charges, administered and collected by state and territory governments.These account for approximately 40 per cent of charges7
The second is through fuel-based road user charges, administered and collected by the AustralianGovernment, accounting for the remaining 60 per cent. These are calculated by the National TransportCommission (NTC), using the average of the preceding seven years’ road expenditure and vehicle numbers.
This PAYGO system has been criticised as inefficient in a number of reports and studies, including by the PC in2006 and 2014.8 The PC in 2006 summarised the main drawbacks of the existing system:
‘Under current institutional arrangements, heavy vehicle road-user charges are set to recover current roadspending allocated to heavy vehicles, rather than to fund efficient future levels of road expenditure.’
7 National Transport Commission, Heavy vehicles/Charges, available at: http://ntc.gov.au/heavy-vehicles/charges/. Accessed 20 December 2015
8 Productivity Commission, Road and Rail Freight Infrastructure Pricing, Productivity Commission Inquiry Report No. 41, 22 December 2006; Productivity
Commission, Public Infrastructure, Productivity Commission Inquiry Report No. 71, 27 May 2014

Proposed reforms CONFIDENTIAL
Infrastructure AustraliaPwC 6
‘There is no systematic linkage between how charges are set and the revenues they generate, on the onehand, and decisions about desirable future levels of road funding on the other.’9
Governments combine revenue from direct road use charges, such as licensing or fuel excise, in consolidatedrevenue. This weakens the link between demand for roads by heavy vehicles and funding of roads.
Additional concerns with these funding arrangements raised by the PC10 and IA are:
Governments may show bias towards projects for passenger rather than freight vehicles, or make non-commercial allocations of funding for political reasons
Funding for roads is variable year-to-year. Road providers are currently funded through yearly or annualbudget processes from state and federal governments. Road providers compete with other governmentspending priorities, limiting the ability of agencies to consistently plan and respond to changes in demandand technology
Local governments do not directly receive funding from heavy vehicle registration or fuel excise, but bear themaintenance costs from heavy vehicle use of local roads. Local councils may restrict access to heavy vehiclesas a consequence (e.g. in order to protect the condition of individual road assets).
Following on from the PC’s 2006 recommendations, COAG committed to reforming heavy vehicle pricing.Progress with these reforms has been relatively slow, although there has been some movement in the area suchas performance-based regulations and the creation of a National Heavy Vehicle Regulator. The IntelligentAccess Program has been operational for several years, although take-up by truck operators of the opportunitiesavailable under the Program remains modest.
Investment decision-making is probably still not as transparent and consultative as expected by the PC in 2006.In 2014, the PC identified further areas for reform11 and regulators, governments and their stakeholderscontinue to engage with these issues; the ministerial Transport and Infrastructure Council (TIC) agreed inNovember 2015 to publish the first editions of heavy vehicle asset registers and the expenditure plans for keyroad freight routes.12 The National Transport Commission is also undertaking work in relation to a ‘forward costbase’ that could be used in a future iteration of the PAYGO system (as opposed to the current focus onrecovering past expenditures).
Progress on the charging front has been slow, as reflected in the winding up of the Heavy Vehicle ChargingInitiative in June 201413 and in the November 2015 decision of transport ministers at the Transport andInfrastructure Council to freeze heavy vehicle charges revenue at 2015-16 levels for an initial period oftwo years14. In its response to the Competition Policy Review (the Harper Review), the Australian Governmentargues that governments are expected to work through the TIC and report to COAG, including on steps totransition to independent heavy vehicle price regulation by 2017-18.15
In light of these issues, IA’s proposed recommendation is that the system is reformed so that the principle ofuser pays is more embedded within the road transport sector.
9 Productivity Commission, Road and Rail Freight Infrastructure Pricing, Productivity Commission Inquiry Report No. 41, 22 December 2006
10 Productivity Commission, Public Infrastructure, Productivity Commission Inquiry Report No. 71, 27 May 2014.
11 Productivity Commission, Public Infrastructure, Productivity Commission Inquiry Report No. 71, 27 May 2014
12 Most of the asset registers and expenditure plans were published in late January 2016.
13 Queensland Department of Transport and Main Roads (2015) National heavy vehicle charges, Available at http://www.tmr.qld.gov.au/business-
industry/Heavy-vehicles/National-heavy-vehicle-charges.aspx, Accessed 19 January 2016
14 Transport and Infrastructure Council (2015) Communique, Adelaide, 6 November 2015, Available at
http://transportinfrastructurecouncil.gov.au/communique/index.aspx, Accessed 19 January 2016
15 Australian Government, Australian Government Response to the Competition Policy Review, November 2015, available at
http://treasury.gov.au/harperreview. Accessed 11 February 2016

Proposed reforms CONFIDENTIAL
Infrastructure AustraliaPwC 7
Recommendation 5.4: Federal, state and territory governments should commit to the fullimplementation of a heavy vehicle road charging structure in the next five years. This reformshould include the removal of all existing registration and usage charges under the PayGo model and theintroduction of supporting regulatory and investment frameworks.
IA’s view of heavy vehicle pricing reform also extends to productivity-enhancing reforms to heavy vehicleinstitutions and regulation. These reforms support and align with the ‘more fundamental reforms’16 discussedin the PC’s 2006 report, including the potential for mass–distance location-based charges for nationalhighways, amongst other options. This reform would apply to heavy vehicles over 4.5 mass tonnes.
2.4.2 Rest of fleetCurrently, owners and users of cars and light vehicles pay fuel excise taxes and road registration fees. Therevenue gathered through these sources is not directly linked to the cost of road use. As such, investment inroads is funded through general government taxes, which is the same in the case of heavy vehicles. In addition,congestion is a significant and growing problem in metropolitan areas. IA is recommending that these issues beaddressed by the following reform:
Recommendation 5.5: Federal, state and territory governments should also commit to the fullimplementation of a light vehicle road charging structure in the next 10 years. This reform must -include the removal of all existing inefficient taxes – including fuel excise and registration charges – and thedevelopment of supporting regulatory and investment frameworks.
There are two components to this impact and that of recommendation 5.3:
Firstly, a user charge would be introduced. This would enable better allocation of revenues from road usersto expenditure on roads. This will allow road expenditure that is currently funded from consolidatedrevenues to be allocated for other general purposes. In effect, this is a change in the tax collection mix.
Secondly, some form of congestion charge would be introduced. This would be a comprehensive nationalplan, addressing congestion in capital cities across Australia. This is expected to reduce congestion, enablingbusiness users to reduce their travel time and hence increase productivity.
The Australian Infrastructure Plan does not specify a particular type of congestion charging, insteadrecommending that a public inquiry process be used to develop ‘… a detailed reform pathway for transition to afull user pays model for roads covering the whole network and all users’ (see recommendation 5.3). Acongestion charge could take the form of an area charge (such as that applied in London) or in another manner,for example by introducing a time of day and location element to a broader network-wide charging regime.
For the purpose of this analysis, it has been assumed that a change in light vehicle charging would commence in2025. In the case of larger cities, this would evolve to a form of time of day and location charging. For thepurposes of the modelling, it has been assumed such charging would commence in 2028.
2.4.3 Public transportCurrently a mixture of private sector and public sector operators run bus, train, tram and ferry services acrossAustralia. Where the private sector has been involved in franchise contracts to operate public transport, therehave been efficiency gains and improved customer services, alongside some incidences of failure in first roundfranchising.17 IA’s proposed policy reform is to continue the historical trend towards franchising (i.e. toencourage governments to franchise all remaining public transport services that are publicly operated).
16 Productivity Commission, Road and Rail Freight Infrastructure Pricing, Productivity Commission Inquiry Report No. 41, 22 December 2006
17 For example, British rail company National Express participated in the first round of rail and tram franchising in Victoria in 1999, successfully bidding to
operate three of the five passenger rail franchises offered. The franchises were structured with progressively decreasing subsidies to account for forecast farerevenue growth, with forecasts of increasing patronage due to service quality improvements. The franchise operators were able to achieve initial servicequality and cost reduction targets, but were unable to meet their patronage growth forecasts. In 2002 franchise operators began re-negotiating contracts

Proposed reforms CONFIDENTIAL
Infrastructure AustraliaPwC 8
Recommendation 6.14: Governments should adopt a default option of exposing public transportservices to contestable supply through franchising. The focus of reform should be to improvecustomers’ experience by exposing delivery to contestable supply and selecting the best operator to provideservices. Private operation of public transport through time limited, exclusive franchises – where providerscompete to deliver services – is a proven model both in Australia and overseas in raising service quality andvalue for money for customers. It should be the default option for public transport provision, with capital citybus and rail services as immediate candidates for franchising.
with the Victorian State Government. During this process, National Express exited the Victorian market, returning control of the franchises it had operatedto the Victorian State Government, ahead of the notional franchise end date of 2014. See LEK Consulting, Public transport, private operators: Deliveringbetter services through franchising, Tourism & Transport Forum, July 2012; Railway Gazette, National Express takes root in Melbourne, October 2000,available at http://www.railwaygazette.com/news/single-view/view/national-express-takes-root-in-melbourne.html Accessed 19 January 2016.

CONFIDENTIAL
Infrastructure AustraliaPwC 9
3 Impact assumptions
This chapter summarises findings from the available literature on the potential direct economic impacts thatmay result from the proposed reforms. The assumptions applied in the modelling for each of the reforms havebeen agreed to by IA and PwC after giving consideration to findings of the literature review and discussionswith industry experts as to what a reasonable and conservative estimate of possible direct impacts might be.This section presents these findings and the corresponding assumptions applied in the economy-widemodelling.
3.1 Energy3.1.1 Privatisation of electricity assetsWe have focussed on the impact on government-owned generation and network businesses and these areanalysed in turn below. We note that some of the generation businesses are also retailers (e.g. Hydro Tasmania,Synergy and Snowy Hydro).
Government-owned electricity generation businessesVictoria, South Australia and New South Wales have privatised some or all of their electricity generationassets.18 The remaining generators that are partially or fully government-owned include:
Stanwell Corporation and CS Energy in Queensland
Delta Electricity in New South Wales19
Snowy Hydro in New South Wales, Victoria and South Australia
Hydro Tasmania in Tasmania
Synergy in Western Australia.
For details of the ownership structure, capacity and fuel type, see Table 36 in Appendix A.
In order to estimate the possible direct impacts from the privatisation of these electricity assets as per the Plan’srecommendation 6.4 in section 2.1.1, we undertook a high level literature review.
The review indicated that the privatisation of generators may change businesses’ incentives and should lead toproductivity benefits resulting in cost savings for consumers. The PC’s 2006 analysis of national economicreforms investigated issues in the electricity generation sector.20 This included a perceived lack ofcompetitiveness in the National Electricity Market due to a range of factors, some of which included thatgovernment ownership lead to governance issues and a low number of market players. The report cites a 2002study by ACIL Tasman which found that in a perfectly competitive environment there would be price reductionsand improvements in capital productivity as a result of the structural reform of generation.21 Specifically, theycite a 1.5 per cent improvement in capital productivity in New South Wales, and 1.8 per cent in Victoria.22
18 Australian Energy Regulator, Industry Information, available at www.aer.gov.au/industry-information. Accessed 20 December 2015.
19 We note that since undertaking the analysis, Delta Electricity has subsequently been sold by the NSW Government to Sunset Power International. As DeltaEnergy’s expenditure was less than five per cent of total generator expenditure, the consequence of the sale for the estimate of the overall productivityimpact of selling publicly owned generators is quite small. When set against the impact of the overall package of reforms, the affect is even smaller.
20 Productivity Commission, Potential Benefits of the National Reform Agenda, Report to the Council of Australian Governments, Canberra, 2006.
21 ACIL Tasman, COAG Energy Market Reforms, Report commissioned by COAG Energy Market Review Panel, December, as referenced in ProductivityCommission, Potential Benefits of the National Reform Agenda, Report to the Council of Australian Governments, Canberra, 2006.
22 Productivity Commission, Potential Benefits of the National Reform Agenda, Report to the Council of Australian Governments, Canberra, 2006.

Impact assumptions CONFIDENTIAL
Infrastructure AustraliaPwC 10
The ACIL Tasman report noted inter-connector transmission constraints between states as a reason for modestproductivity improvements. With the addition of Tasmania to the National Electricity Market since the reportwas released and other reforms in the sector since then, these constraints may be less prominent. The wholesalemarket is also facing some headwinds with demand falling in recent years while capacity has increased, causingwholesale prices to decline.23 This might indicate there is less scope for privatisation to result in greaterefficiency and cost savings to customers. However the Australian Energy Regulator (AER) has noted that inrecent years the competitiveness of the Queensland market has deteriorated with increased concentration ofgovernment generation assets.24 For these reasons and due to the lack of information specific to the potentialimpacts of generation privatisation, we have conservatively applied the same impacts as reported by the PC asan indicative assumption of the possible level of capital productivity gains were government-owned generationassets to be privatised.
Table 3: Possible direct impact assumptions for electricity generation privatisation
Indicator Value Description Reference
Capitalproductivity
1.5%-1.8% PC report references ACIL Tasman (2002)simulations which indicated that in a perfectlycompetitive market of generation, electricityprices would fall in the eastern States range from1.5% in New South Wales, to 1.8% in Victoria.Government ownership of assets was one factorattributed to the lack of competition
ProductivityCommission, PotentialBenefits of the NationalReform Agenda, Reportto the Council ofAustralian Governments,Canberra, 2006.
In assessing the direct impacts of privatisation of the remaining government-owned generators, we have brokenup the government-owned generators by state and by type of electricity generation. This allows for a detailedanalysis of the potential benefits that will be generated in each area and in each subsector. For an indication ofthe size of each business and therefore the potential scale of productivity benefits see Table 37 in Appendix A.
Government-owned electricity network businessesMany of the electricity network businesses are government-owned. Victoria and South Australia have sold theirnetworks. The remaining partially or fully government-owned networks considered particularly relevant to thisanalysis include:
Powerlink, Energex and Ergon Energy in Queensland
Essential Energy in New South Wales 25
TasNetworks in Tasmania
ActewAGL in the ACT
Western Power in Western Australia.
For details of the ownership structure of these networks, Table 38 in Appendix A. Table 39 provides anoverview of the operating expenditure of these networks.
In order to estimate the possible direct economic impacts from the privatisation of the government-ownedelectricity network businesses, a high level literature review was undertaken. Based on this literature review, wehave concluded that the privatisation of networks is likely to result in productivity gains through operating costsavings. The findings included:
23 Australian Energy Regulator, State of the Energy Market 2015, 18 December 2015, page 45.
24 Australian Energy Regulator, State of the Energy Market 2015, 18 December 2015, page 59.
25 AusGrid and Endeavour Energy have been excluded from the analysis as they will be both majority privately leased.

Impact assumptions CONFIDENTIAL
Infrastructure AustraliaPwC 11
The PC in 2013 found that ‘state-owned network businesses appear to be less efficient than their privatesector peers’.26
The AER recently noted in its annual benchmarking report that Ergon Energy and Essential Energy have thehighest cost per customer and that they spent approximately double the cost per customer than manyDistribution Network Service Providers (DNSPs), including SA Power Networks and Powercor, who alsoprovide rural networks.27 We note, however, that the findings of AER’s benchmarking have not beenaccepted by all parties.28
A 2012 study suggested that government-owned companies have a larger regulated asset base per customer,and spend more on capital and operations relative to privately owned companies.29 The study estimatedsavings of up to $640 million per year in capital expenditure, and $500 million per year for operatingexpenditure. It is important to note that the study was based on 2010 data, and as such capital andownership structures have since changed.
A more recent study compared price trends in South Australia and Victoria (privatised networks) with allother states.30 It found that network prices for typical residential customers in Victoria and South Australiafell following privatisation. By comparison, government-owned network providers, specifically those in NSWand Queensland, have exhibited a network price increase of over 100 per cent in the same period. Moreover,another recent study suggests that privatisation of networks could result in a reduction of capital andoperating expenditure by 25 per cent for each business.31
26 Productivity Commission, Electricity network regulator frameworks, Inquiry Report no. 64, vol. 1, 26 June 2013, p. 287.
27 Australian Energy Regulator, Annual Benchmarking Report - Distribution and Transmission 2015, 30 November 2015, p. 14.
28 For example, see: PwC, Independent Expert Advice on appropriateness of RIN data for benchmarking comparisons, Ausgrid, January 2015. Available at:http://www.aer.gov.au/networks-pipelines/determinations-access-arrangements/ausgrid-determination-2014-19/revised-proposal Accessed 19 January2016
29 Tony Wood, Putting the customer back in front: How to make electricity prices cheaper, Grattan Institute, 2012, p.30
30 Ernst & Young, Electricity network services, NSW Treasury, 2014
31 Deloitte Access Economics, Economic Impact of State Infrastructure Strategy – Rebuilding NSW, November 2014, p.13
Impact assumptions CONFIDENTIAL
Infrastructure AustraliaPwC 12
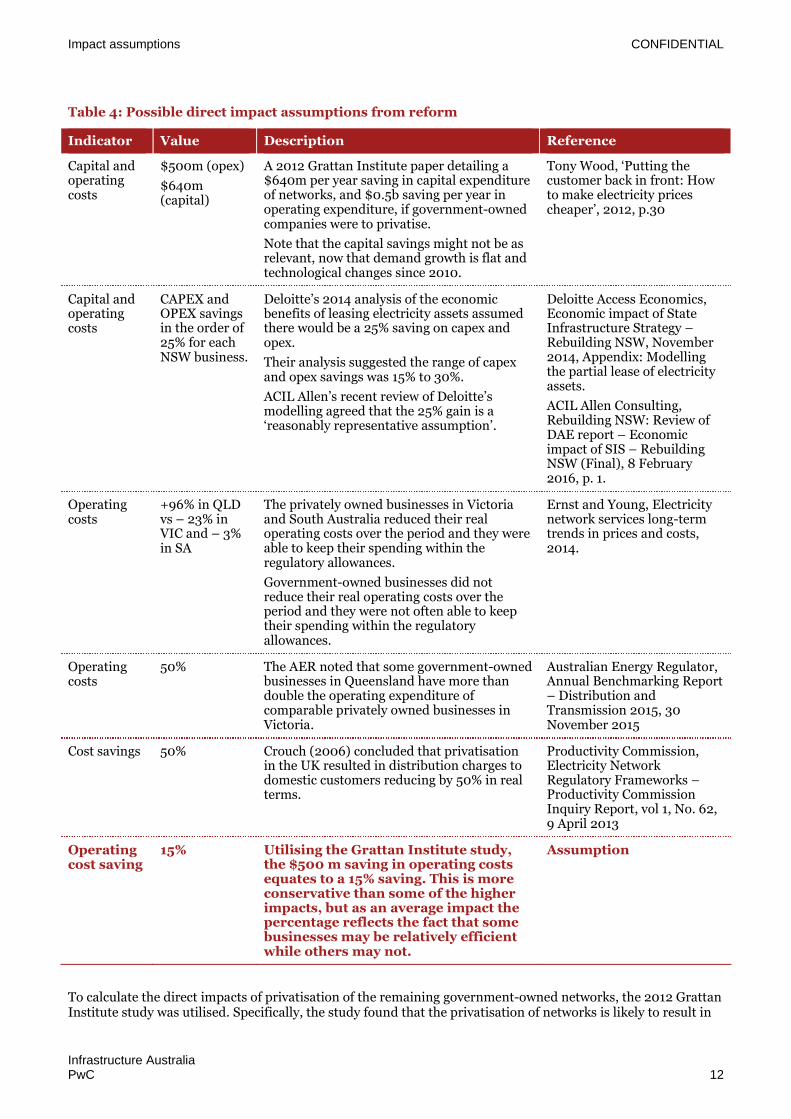
Table 4: Possible direct impact assumptions from reform
Indicator Value Description Reference
Capital andoperatingcosts
$500m (opex)
$640m(capital)
A 2012 Grattan Institute paper detailing a$640m per year saving in capital expenditureof networks, and $0.5b saving per year inoperating expenditure, if government-ownedcompanies were to privatise.
Note that the capital savings might not be asrelevant, now that demand growth is flat andtechnological changes since 2010.
Tony Wood, ‘Putting thecustomer back in front: Howto make electricity pricescheaper’, 2012, p.30
Capital andoperatingcosts
CAPEX andOPEX savingsin the order of25% for eachNSW business.
Deloitte’s 2014 analysis of the economicbenefits of leasing electricity assets assumedthere would be a 25% saving on capex andopex.
Their analysis suggested the range of capexand opex savings was 15% to 30%.
ACIL Allen’s recent review of Deloitte’smodelling agreed that the 25% gain is a‘reasonably representative assumption’.
Deloitte Access Economics,Economic impact of StateInfrastructure Strategy –Rebuilding NSW, November2014, Appendix: Modellingthe partial lease of electricityassets.
ACIL Allen Consulting,Rebuilding NSW: Review ofDAE report – Economicimpact of SIS – RebuildingNSW (Final), 8 February2016, p. 1.
Operatingcosts
+96% in QLDvs – 23% inVIC and – 3%in SA
The privately owned businesses in Victoriaand South Australia reduced their realoperating costs over the period and they wereable to keep their spending within theregulatory allowances.
Government-owned businesses did notreduce their real operating costs over theperiod and they were not often able to keeptheir spending within the regulatoryallowances.
Ernst and Young, Electricitynetwork services long-termtrends in prices and costs,2014.
Operatingcosts
50% The AER noted that some government-ownedbusinesses in Queensland have more thandouble the operating expenditure ofcomparable privately owned businesses inVictoria.
Australian Energy Regulator,Annual Benchmarking Report– Distribution andTransmission 2015, 30November 2015
Cost savings 50% Crouch (2006) concluded that privatisationin the UK resulted in distribution charges todomestic customers reducing by 50% in realterms.
Productivity Commission,Electricity NetworkRegulatory Frameworks –Productivity CommissionInquiry Report, vol 1, No. 62,9 April 2013
Operatingcost saving
15% Utilising the Grattan Institute study,the $500 m saving in operating costsequates to a 15% saving. This is moreconservative than some of the higherimpacts, but as an average impact thepercentage reflects the fact that somebusinesses may be relatively efficientwhile others may not.
Assumption
To calculate the direct impacts of privatisation of the remaining government-owned networks, the 2012 GrattanInstitute study was utilised. Specifically, the study found that the privatisation of networks is likely to result in
Impact assumptions CONFIDENTIAL
Infrastructure AustraliaPwC 13
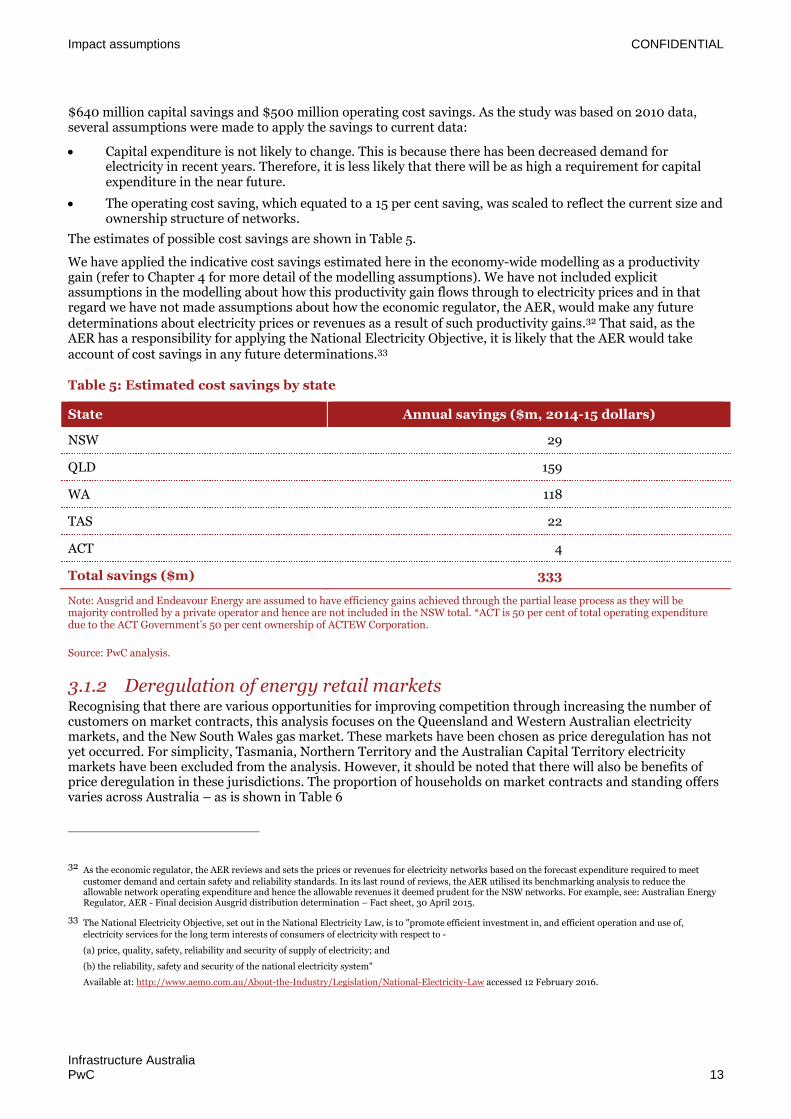
$640 million capital savings and $500 million operating cost savings. As the study was based on 2010 data,several assumptions were made to apply the savings to current data:
Capital expenditure is not likely to change. This is because there has been decreased demand forelectricity in recent years. Therefore, it is less likely that there will be as high a requirement for capitalexpenditure in the near future.
The operating cost saving, which equated to a 15 per cent saving, was scaled to reflect the current size andownership structure of networks.
The estimates of possible cost savings are shown in Table 5.
We have applied the indicative cost savings estimated here in the economy-wide modelling as a productivitygain (refer to Chapter 4 for more detail of the modelling assumptions). We have not included explicitassumptions in the modelling about how this productivity gain flows through to electricity prices and in thatregard we have not made assumptions about how the economic regulator, the AER, would make any futuredeterminations about electricity prices or revenues as a result of such productivity gains.32 That said, as theAER has a responsibility for applying the National Electricity Objective, it is likely that the AER would takeaccount of cost savings in any future determinations.33
Table 5: Estimated cost savings by state
State Annual savings ($m, 2014-15 dollars)
NSW 29
QLD 159
WA 118
TAS 22
ACT 4
Total savings ($m) 333
Note: Ausgrid and Endeavour Energy are assumed to have efficiency gains achieved through the partial lease process as they will bemajority controlled by a private operator and hence are not included in the NSW total. *ACT is 50 per cent of total operating expendituredue to the ACT Government’s 50 per cent ownership of ACTEW Corporation.
Source: PwC analysis.
3.1.2 Deregulation of energy retail marketsRecognising that there are various opportunities for improving competition through increasing the number ofcustomers on market contracts, this analysis focuses on the Queensland and Western Australian electricitymarkets, and the New South Wales gas market. These markets have been chosen as price deregulation has notyet occurred. For simplicity, Tasmania, Northern Territory and the Australian Capital Territory electricitymarkets have been excluded from the analysis. However, it should be noted that there will also be benefits ofprice deregulation in these jurisdictions. The proportion of households on market contracts and standing offersvaries across Australia – as is shown in Table 6
32 As the economic regulator, the AER reviews and sets the prices or revenues for electricity networks based on the forecast expenditure required to meet
customer demand and certain safety and reliability standards. In its last round of reviews, the AER utilised its benchmarking analysis to reduce theallowable network operating expenditure and hence the allowable revenues it deemed prudent for the NSW networks. For example, see: Australian EnergyRegulator, AER - Final decision Ausgrid distribution determination – Fact sheet, 30 April 2015.
33 The National Electricity Objective, set out in the National Electricity Law, is to "promote efficient investment in, and efficient operation and use of,electricity services for the long term interests of consumers of electricity with respect to -
(a) price, quality, safety, reliability and security of supply of electricity; and
(b) the reliability, safety and security of the national electricity system"
Available at: http://www.aemo.com.au/About-the-Industry/Legislation/National-Electricity-Law accessed 12 February 2016.

Impact assumptions CONFIDENTIAL
Infrastructure AustraliaPwC 14
Table 6: State of electricity and gas retail price deregulation
NSW QLD VIC WA SA TAS NT ACT*
Electricityretail pricederegulation
Householdswithelectricitymarketcontracts
60%
70% SEQ0%
regionalQLD
75% 0% 83% Limited N/A 19%
Gas retailpricederegulation
Householdswith gasmarketcontracts
70% 75% 75% N/A 81% Limited N/A 20%
Note: Deregulated Regulated. *Data for Western Australian households were not available in the Australian Energy MarketCommission source but as residential customers are on regulated tariffs it is represented as 0 per cent on market contracts for the purposeof this analysis (see Public Utilities Office, Electricity market review: Options paper, Department of Finance, Government of WesternAustralia, December 2014, page 22).
Source: Infrastructure Australia, Australian Infrastructure Plan, 2016, page 107; Australian Energy Market Commission, Final Report: 2014Retail Competition Review, 22 August 2014
Table 7: Possible direct impact assumptions from reform
Indicator Value Description Reference
Costsavings
Electricity:5%; 16%-19%
Gas: 5%
The AER State of the Energy Market finds that onaverage electricity market contracts were lower thanstanding contracts (regulated prices, retailers maycharge less but not more than the standing contractprice to consumers), by between 5% in QLD and 16-19% in Victoria. Gas discounts are at 5% in mostjurisdictions.
Australian EnergyRegulator, State of theEnergy Market 2014,Australian Competitionand ConsumerCommission, 2014, p. 135
Our analysis focused on three main areas: Queensland (electricity), Western Australia (electricity) and NewSouth Wales (gas). The cost savings generated through price deregulation were calculated based on theassumption that all remaining standing offer contracts will move to market offer contracts. Applying the costsavings shown in Table 7, the estimated cost savings will be five per cent for Queensland contracts, five per centfor New South Wales gas contracts and 10.5 per cent for Western Australian contracts.34 Using this inconjunction with average annual electricity and gas prices of market contracts,35 the number of householdsaccording to the ABS as a proxy for the number of residential electricity and gas customers36 and the proportionof customers on market offer contracts37 provided the estimated cost savings shown in Table 8.
34 This is based on the midpoint of the Queensland estimate and the lower bound of the Victorian estimate.
35 As reported in Australian Energy Market Commission, ‘2014 Residential Electricity Price Trends report’, 5 December 2014 and the Independent Pricing and
Regulatory Tribunal, ‘Fact sheet – Change in regulated retail gas prices from 1 July 2015’, June 2015, p. 8.
36 Australian Bureau of Statistics, ‘3236.0 – Household and Family Projections, Australia, 2011 to 2036’, 2015.
37 Australian Energy Market Commission, ‘Final Report: 2014 Retail Competition Review’, 22 August 2014.

Impact assumptions CONFIDENTIAL
Infrastructure AustraliaPwC 15
Table 8: Cost savings of price deregulation by state
MarketQLD
(electricity)WA
(electricity)NSW(gas)
Total number of residential customers#(A)
1,789,912 964,140 2,805,579
Percentage of standing contracts (B) 65%^ 100% 30%
Number of users who will gain frommarket contract (A*B)
1,163,443 964,140 841,674
Savings per customer ($)~ 65.10 166.48 50.45
Savings ($m) 75.74 160.51 42.46
Note: The figures above are based on 2013-14 data, with the exception of Western Australia’s average cost of market offer contracts, whichutilises 2014-15 figures. #Residential customers are estimated based upon number of households. ^ An average of the number of marketcontracts in South-east Queensland and Regional Queensland has been used. This is consistent with the total number of residentialcustomers used in the analysis. ~ We note that there are likely to be differences in the number of market offer contracts among retailers.This may affect the value of market contracts used to calculate the level of savings per customer.
Source: Australian Bureau of Statistics, 3236.0 – Household and Family Projections, Australia, 2011 to 2036, 2015; Australian EnergyMarket Commission, ‘2014 Residential Electricity Price Trends report’, 5 December 2014; Independent Pricing and Regulatory Tribunal,‘Fact sheet – Change in regulated retail gas prices from 1 July 2015’, June 2015, p. 8; PwC analysis.
3.2 TelecommunicationsThis section sets out our analysis to estimate the potential economy-wide impact of privatising the NBN. Toestimate the possible direct impacts, we have undertaken a high level review of academic literature ontelecommunications privatisations.
The findings of this high level literature review included:
A World Bank analysis of country-level panel data from 1981-1998 that found privatisation resulted insignificant labour savings, output growth, network expansion and both labour and total factor productivityimprovements.38
An examination of the records of 31 national telecommunications carriers from 14 industrialised and 11 non-industrialised economies that have been fully or partially divested by IPOs between October 1981 andNovember 1998 found that employment fell but not dramatically, from 67,000 to 63,000.39
The World Bank study in particular showed that there was a statistically significant effect through privatisationof telecommunications companies of 10 per cent improvement in total factor productivity (even whenexclusivity is allowed40). To allow for possible differences in technologies used in the telecommunication sectorin the 1990s and that used today, we assume a 5 per cent improvement in total factor productivity could beachieved.
38 Xu (2002) cited in John Ure, Telecommunications privatization: Evidence and some lessons, October 2003, p.8
39 Bortolotti et al. (2002) cited in John Ure, Telecommunications privatization: Evidence and some lessons, October 2003, p.8
40 In Xu (2002), ‘exclusivity’ refers to where a country grants private operator(s) a period of exclusive access to certain market segments.
Impact assumptions CONFIDENTIAL
Infrastructure AustraliaPwC 16
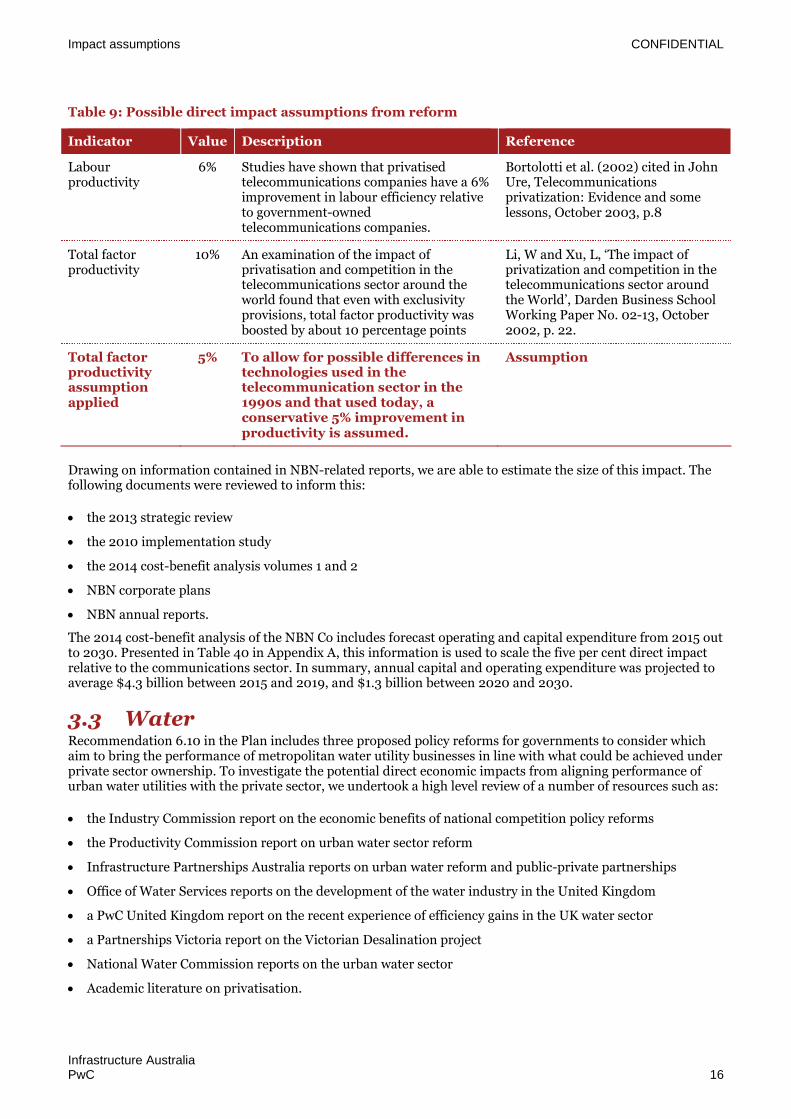
Table 9: Possible direct impact assumptions from reform
Indicator Value Description Reference
Labourproductivity
6% Studies have shown that privatisedtelecommunications companies have a 6%improvement in labour efficiency relativeto government-ownedtelecommunications companies.
Bortolotti et al. (2002) cited in JohnUre, Telecommunicationsprivatization: Evidence and somelessons, October 2003, p.8
Total factorproductivity
10% An examination of the impact ofprivatisation and competition in thetelecommunications sector around theworld found that even with exclusivityprovisions, total factor productivity wasboosted by about 10 percentage points
Li, W and Xu, L, ‘The impact ofprivatization and competition in thetelecommunications sector aroundthe World’, Darden Business SchoolWorking Paper No. 02-13, October2002, p. 22.
Total factorproductivityassumptionapplied
5% To allow for possible differences intechnologies used in thetelecommunication sector in the1990s and that used today, aconservative 5% improvement inproductivity is assumed.
Assumption
Drawing on information contained in NBN-related reports, we are able to estimate the size of this impact. Thefollowing documents were reviewed to inform this:
the 2013 strategic review
the 2010 implementation study
the 2014 cost-benefit analysis volumes 1 and 2
NBN corporate plans
NBN annual reports.
The 2014 cost-benefit analysis of the NBN Co includes forecast operating and capital expenditure from 2015 outto 2030. Presented in Table 40 in Appendix A, this information is used to scale the five per cent direct impactrelative to the communications sector. In summary, annual capital and operating expenditure was projected toaverage $4.3 billion between 2015 and 2019, and $1.3 billion between 2020 and 2030.
3.3 WaterRecommendation 6.10 in the Plan includes three proposed policy reforms for governments to consider whichaim to bring the performance of metropolitan water utility businesses in line with what could be achieved underprivate sector ownership. To investigate the potential direct economic impacts from aligning performance ofurban water utilities with the private sector, we undertook a high level review of a number of resources such as:
the Industry Commission report on the economic benefits of national competition policy reforms
the Productivity Commission report on urban water sector reform
Infrastructure Partnerships Australia reports on urban water reform and public-private partnerships
Office of Water Services reports on the development of the water industry in the United Kingdom
a PwC United Kingdom report on the recent experience of efficiency gains in the UK water sector
a Partnerships Victoria report on the Victorian Desalination project
National Water Commission reports on the urban water sector
Academic literature on privatisation.
Impact assumptions CONFIDENTIAL
Infrastructure AustraliaPwC 17
The findings of this review are described below. In the literature review undertaken, some attention wasfocussed on the UK experience, where the water sector has been privatised since 1989. Appendix B describesthe UK experience and achievements, which included that water bills were an estimated 30 per cent lower thanwould have occurred otherwise.41 Appendix B also notes that, because privatisation, competition and regulatoryoversight were introduced around the same time in the UK, it is unlikely that gains similar to those experiencedin the UK could be expected in Australia.
Other research has noted the following:
Although there is minimal private ownership of urban water utilities in Australia, there is some experiencein outsourcing parts of operations or whole assets to the private sector. Efficiencies can be achieved underthe following types of measures:
– Outsourcing – Studies suggest outsourcing delivers, on average, five to ten per cent savings. 42 Forexample, Hunter Water expected a 7.6 per cent efficiency gain from outsourcing some water andwastewater treatment plant operations.43
– Public-private partnerships (PPPs) –PPPs can deliver, typically, 10-15 per cent whole of life savings whencompared to traditional delivery. Infrastructure Partnerships Australia’s report noted PPPs demonstratesuperior cost efficiency over traditional procurement, which can range from 11.4 per cent when measuredfrom contractual commitment to the final outcome to 30.8 per cent when measured from projectinception.44
In other sectors (i.e. non-water areas), savings of 20 per cent and more are being readily identified anddelivered as organisations (utilities in particular) seek to optimise physical infrastructure investments andmigrate customers into more cost-effective digital solutions for billing and customer care.45
In 1995, the Industry Commission modelled the indicative economic gains for the urban water sector thatcould be expected from national competition policy reforms. This analysis identified improvements inlabour productivity and capital productivity in the order of 25 per cent and 10 per cent respectively as well asa need to raise the return on capital by 1.07 per cent.46 The reforms, some of which are still relevant, relatedto:
– eliminating cross-subsidies and restructuring pricing on a pay for use basis
– achieving positive economic rates of return on investment
– improving service delivery by separating service provision and regulatory functions, identifying andpaying for community service obligations and adopting international best practice.
These factors are summarised in Table 10. This table indicates there is a range of possible assumptions thatcould be applied. None of these are bottom-up estimates of the actual efficiency gains that could be expected atan Australian water utility. For such an estimate to be prepared, detailed analysis of a water company’s existingoperations would be required. As this is not possible given the nature of this report, a top-down assumptionneeds to be made. This assumption needs to be reflective of the extent of reform undertaken already inAustralian water utilities and be prudent, given the lack of experience of privatisation in the Australian urban
41 Ofwat’s response to the Independent Review of Charging Household Water and Sewerage Services, 2011. Cited in Peter Martin, 24 Years Later: A Look at
Water Privatisation in England and Wales, 2013.
42 PwC industry experts.
43 Hunter Water estimated savings of $23 million from awarding a $279 million contract to Veolia. Sources: Veolia, Hunter Water awards Veolia with majorcontract, June 26 2014. ABC, Private operator to take control of Hunter Water treatment plants, June 27 2014.
44 Infrastructure Partnerships Australia, Performance of PPPs and Traditional Procurement in Australia, January 2007, p.1
45 PwC industry experts.
46 Industry Commission, The growth and revenue implications of Hilmer and related reforms: Final report, Commonwealth of Australia, Canberra, March
1995, p.337

Impact assumptions CONFIDENTIAL
Infrastructure AustraliaPwC 18
water sector. We assume that an average direct impact will account for the differences across the sector wheresome utilities will be more efficient than others. Considering the range of quantified impacts summarised inTable 10, a total productivity saving of 10 per cent seems a prudent representation of the minimum level ofsavings that could be expected.
Table 10: Summary of possible direct impact assumptions from water reform
Indicator Value Description Reference
Totalproductivity
30% Assuming that the reduction in customer water billsexperienced in the UK between 1989 and 2010 iscomparable to a productivity saving of the samemagnitude (i.e. productivity gains are passed on infull) then the UK experience could be summarised asresulting in a productivity gain of 30%.
However it should be noted that this impact includesthe effects of a range of reforms in addition toprivatisation. Also, as noted in Appendix B, it seemsunlikely that the magnitude of gains achieved in theUK would be repeated in Australia followingprivatisation.
Martin, P, 24 Years Later:A Look at WaterPrivatisation in Englandand Wales, 2013.
Totalproductivity
10%-30%
Depending on how it is measured, PPPs can achievesavings of between 10% and 30%.
Industry experts/
InfrastructurePartnerships Australia,Performance of PPPs andTraditional Procurementin Australia, January2007.
Labourproductivity
15% –25%
A 1995 Industry Commission report on the growthand revenue implications of Hilmer suggested thateliminating cross subsidies, achieving positive ratesof return and adopting best practice in urban wateras well as recouping operating and maintenancecosts in rural water could increase labourproductivity by 15% across the entire water industryor 25% for urban water providers.
Industry Commission, Thegrowth and revenueimplications of Hilmerand related reforms:Final report,Commonwealth ofAustralia, Canberra,March 1995.
Capitalproductivity
7%-10%
The same report said this would also increase capitalproductivity by 7% across the entire water industryor 10% for urban water providers.
Ibid.
Rate of returnon assets
1.07% The same report also expected that by earning apositive rate of return, the real economic rate ofreturn would increase from 2.01% to 3.08%.
Ibid.
Operationalexpenditure
5-10% Outsourcing can achieve savings of 5-10%. Industry experts/
Veolia, Hunter Waterawards Veolia with majorcontract, June 26 2014.
Operationalexpenditure
20%+ Implementing innovative and cost-effective solutionsfor infrastructure, billing and customer service canachieve savings of 20%.
Industry experts
Assumed totalproductivitysaving
10% Based on the above savings, 10% is aconservative representation of the level ofsavings that could be expected.
Assumption

Impact assumptions CONFIDENTIAL
Infrastructure AustraliaPwC 19
If we apply the assumed 10 per cent productivity gain to the annual expenditure by provider, we can estimatethe impact to the water supply sector. The capital and operating expenditure allowed by the regulator for eachof the metropolitan urban water operators in Australia’s capital cities (except for Darwin where information wasnot available) is set out in Table 42 in Appendix A.
Applying the indicative productivity saving to the metropolitan urban water utilities results in savings assummarised in the following table. The total estimated saving across Australia each year would be over onebillion dollars.
Table 11: Indicative annual productivity savings
State/Territory Annual saving ($m 2014-15)
VIC 400
NSW 224
QLD 244
WA 172
SA 78
TAS 25
ACT 26
Total 1,169
Note: See Appendix A for capital and operating expenditure by utility.
Source: PwC analysis.
3.4 Impact of privatisation – energy,telecommunications, water
In addition to the direct impacts set out above for energy, telecommunications and water, there will also beanother first round impact of privatisation driven by government borrowing costs. A common approach hasbeen undertaken to estimate this impact across the reforms, as described in the following.
We take an approach where we are considering the net economic impacts from an asset sale. This means thatthe proceeds of the sale are not considered as this represents a transfer from one party to another. However, inan environment where governments are constrained by borrowing capacity yet there is a need for investment,the sale of assets may provide a net economic impact relative to the second best alternative; that is, if asset saleswere not to occur and governments needed to borrow additional funds to fund investments, the cost ofborrowing would be higher than if they had sold assets and were subsequently in a better net debt position. Thisargument is supported in analysis of the NSW Government’s ability to either fund its $20 billion Restart NSWinvestments through asset leases or through borrowing. A 2015 UBS report47 estimated that, while the NSWGovernment could borrow to fund its $20 billion infrastructure spend without leasing the electricity assets, thiswould likely result in the downgrading of its AAA credit rating for debt and so NSW would pay more interest onany new debt raised.
Following this argument, by selling the remaining energy, telecommunication and water assets, governmentswill be able to undertake new investments without incurring additional interest costs.
47 UBS, Bad for the budget, good for the State, 17 March 2015.
Impact assumptions CONFIDENTIAL
Infrastructure AustraliaPwC 20
We model this as a lower cost to government of investing. The parameter we have used in the model isincreased productivity of government investment (i.e. governments can get more investment for the same cost).
To develop the direct impact for this, we first estimate the asset values of the relevant energy,telecommunication and water assets. We then make some broad assumptions about the difference in interestcosts for each state (e.g. UBS stated NSW’s interest costs would rise by 0.1 per cent if it borrowed to fund itscapital investment plan of $20 billion rather than funding that through leasing its electricity assets). We thenconvert this into an estimated impact on governments’ investment productivity.
Table 12 sets out the estimated values of assets, whereby a multiple that the market would typically use to valuethe asset is applied to the EBITDA or RAB of the relevant entity. We considered a number of differentmultipliers in order to estimate the values set out in Table 12. These were as follows:
In the case of electricity generation businesses, Infrastructure Australia applied a range of 12 to 14 timesEBITDA. 48 Taking the midpoint of this range is 13.
In the case of the network electricity businesses, a range of multipliers was considered. Although at thelower end of the range considered, the market currently prices listed network businesses at about 1.3 timesRAB. This is the chosen multiplier for DNSPs. A higher rate of 1.4 was applied to transmission networkservice providers (TNSPs) given the recent valuation placed on Transgrid being higher than 1.3. The range ofmultipliers considered were:
– 1.3, which represents the value at which listed regulated businesses (such as Spark Infrastructure, AusNetServices and DUET Group) are trading49
– 1.35, which was the value that Infrastructure Partnerships Australia thought would be placed onTransGrid by bidders 50
– 1.30 to 1.45 which was the range that RBC Capital Markets expected would be placed on TransGrid bybidders prior to the winning bid being announced51
– 1.6 which represents the actual valuation at which TransGrid was leased in 2015.52
In the case of the NBN Co, the NBN 2013 Strategic Review uses an EBITDA multiple of 6.0.53 This results ina valuation of $27 billion. Recent articles have suggested the NBN could be privatised at a valuation ‘as lowas $20 billion’, indicating the value may be higher than that and hence $27 billion seems plausible in thiscontext.54
In the case of water, Infrastructure Australia has previously applied a range of 1.10 to 1.20.55 We haveapplied the upper end of this range (1.2), as the current lower borrowing cost environment is leading tohigher valuations as has been seen in the energy sector for example.
48 Ibid.
49 Australian Financial Review, ‘Ausgrid, Endeavour Energy to put asset valuation theories to the test’, 26 November 2015.
50 Infrastructure Partnerships Australia, ‘NSW poles & wires to deliver $3.5b more than estimated, says new analysis’, 18 May 2015.
51 Australian Financial Review, ‘Ausgrid, Endeavour Energy to put asset valuation theories to the test’, 26 November 2015.
52 Ibid.
53 NBN Co, Strategic review, December 2013, p.107.
54 Australian Financial Review, ‘Malcolm Turnbull in talks to sell NBN to large telcos’, 4 December 2015.
55 Infrastructure Australia, Australia’s public infrastructure: Part of the answer to removing the infrastructure deficit, October 2012, p. 34

Impact assumptions CONFIDENTIAL
Infrastructure AustraliaPwC 21
Table 12: Estimated valuation of selected publicly owned assets
Owner EntityRAB/EBITDA($m) Multiple
Estimatedvalue ($m) Notes
Electricity generation^
QLD StanwellCorporation
419 EBITDA * 13 5,451
QLD CS Energy 155 EBITDA * 13 2,011
NSW/VIC/Cwth
Snowy Hydro 368# EBITDA * 13 4,788 29% VIC, 58%NSW, 13% Cwth
NSW Delta Electricity -380 EBITDA * 13 n/a
TAS Hydro Tasmania 62# EBITDA * 13 810
WA Synergy 361# EBITDA * 13 4,693
Electricity networks
QLD Energex, Ergon 19,034 RAB *1.30 24,744
QLD Powerlink 6,035 RAB *1.40 8,449
NSW AusGrid 13,613 RAB *1.30 8,778 49.6% ownership inbaseline
NSW EndeavourEnergy
5,344 RAB *1.30 3,446 49.6% ownership inbaseline
NSW Essential Energy 6,518 RAB *1.30 8,473
ACT ActewAGL 790 RAB *1.30 514 50% ownership
TAS TasNetworks 2,691 DNSP RAB *1.30TNSP RAB *1.40
3,622
WA Western Power 8,800 RAB *1.35 ~ 11,880
Telecommunications
Cwth NBN Co 4,500 EBITDA * 6 27,000 This is for 2024-25
Water*
VIC MW, CWW,YVW, SEW
18,458 RAB *1.2 22,150
NSW Sydney Water,Hunter Water
17,879 RAB *1.2 21,455
QLD SEQwater 8,230 RAB *1.2 9,876
WA WaterCorporation
9,600 RAB *1.2 11,520
SA SA Water 11,862 RAB *1.2 14,234
ACT Icon Water 2,205 RAB*1.2 2,646
Total 196,540
Sources: AER, State of the Energy Market 2014 Report; Stanwell Corporation, 2015 Annual Report; CS Energy, 2015 Annual Report; SnowyHydro, 2015 Annual Report; Delta Electricity, 2015 Annual Report; Hydro Tasmania 2015 annual report; Synergy 2015 annual report;

Impact assumptions CONFIDENTIAL
Infrastructure AustraliaPwC 22
Essential Services Commission, Independent Pricing and Regulatory Tribunal, Queensland Competition Authority, Economic RegulationAuthority Western Australia, Essential Services Commission of South Australia, Office of the Tasmanian Economic Regulator, ACTTreasury, and Australian Bureau of Statistics; NBN Co, Strategic Review, December 2013.
Notes: *Five water distribution businesses in QLD and TasWater are owned by local government and so are not included here. ^ErgonEnergy in QLD and Essential Energy in NSW have some generation assets but are not included here due to their small size. ~ The sourceused for Western Power’s RAB did not provide a separation of the TNSP RAB from the DNSP RAB so we have used an average of 1.30 and1.40. #Values are for the consolidated group and so will include retail activities for example.
The total estimated value of the assets listed in the above table is $197 billion. While this analysis is not able toundertake a detailed examination of each government’s fiscal position and the implications of the sales of eachof the individual assets, we can make some assumptions about the potential impact on higher borrowing costs.
Table 13 shows the impacts if the interest costs on borrowings equivalent to the estimated value of the assetswere to rise by 0.10 per cent, 0.15 per cent and 0.20 per cent. UBS analysis suggested that if the NSWGovernment had to borrow $20 billion, its borrowing costs on new debt might rise by approximately0.10 per cent. As Figure 1 shows, NSW as one of three state/territory governments on an AAA credit rating isone of the better-positioned states. This figure shows that Queensland has the least borrowing capacity, withrelatively higher debt levels. Western Australia and the ACT are also tracking upwards in their debt positions.So it would seem not unreasonable that these governments may face a borrowing cost higher than 0.10 per cent.South Australia and Tasmania have a lower credit rating than NSW, so it is possible that they may faceborrowing costs that would be 0.20 per cent higher.
Considering these points, analysis of an interest cost saving on new debt of 0.15 per cent – a midpoint between0.10 per cent and 0.20 per cent – is a reasonable assumption.
Table 13: Possible annual savings from privatisation versus government borrowing
Governmentowning assets
Estimated value($m)
Annual saving if interest costs would rise by
0.10% 0.15% 0.20%
VIC 23,539 24 35 47
NSW 44,928 45 67 90
QLD 50,531 51 76 101
WA 28,093 28 42 56
SA 14,234 14 21 28
ACT 3,159 3 5 6
TAS 4,432 4 7 9
Cwth 27,622 28 41 55
Total 196,540 197 295 393
Source: PwC analysis

Impact assumptions CONFIDENTIAL
Infrastructure AustraliaPwC 23
Figure 1: Projected fiscal position by State/Territory
Note: The Northern Territory has not been included here due to information on the Northern Territory Power and Water Corporation’sRAB not being available. As noted in the UBS report, the dashed line represents an indicator of rating stress.
Source: Standards & Poor’s, Supplementary analysis: New South Wales (State of), October 13 2015; Standards & Poor’s, Supplementaryanalysis: Victoria (State of), September 1 2015; Standards & Poor’s, Queensland (State of), November 17 2015; Standards & Poor’s,Supplementary analysis: Western Australia (State of), November 3 2015; Standards & Poor’s, Supplementary analysis: South Australia(State of), September 28 2015; Standards & Poor’s, Tasmania (State of), November 30 2015; Standards & Poor’s, Supplementary analysis:Australian Capital Territory (Government of), September 30 2015; UBS, Bad for the budget, good for the State, 17 March 2015. PwCanalysis.
3.5 Transport3.5.1 Heavy vehiclesThis section discusses the productivity implications of the Plan’s recommendation 5.4 concerning heavy vehiclepricing and recommendation 6.13 concerning changes to the road funding framework. It considers potentialreform benefits and costs, and details assumptions used in modelling these reforms.
There are two components to this impact.
First, there are capital spending efficiencies:
Institutional and regulatory reform allowing greater involvement of users in influencing where capitalspending occurs. This is expected to lead to greater allocative efficiency, with a greater likelihood thatinvestments will enable journey time savings and reliability improvements of value to truck operators andtheir customers, less wear and tear on vehicles, and, more generally, spending on the ‘right’ roads.
Potentially, an increase in overall productivity enhancing investment on the road network. This would occurif road user charge revenue was directed towards investment in roads instead of to consolidated revenue,through a road fund mechanism or similar structure. In other words trucking operators could be morewilling to pay for additional targeted infrastructure if they are confident that the user charges are directed tospecific upgrades offering clear benefits for their operations.
Secondly, there are also capital and labour efficiencies from greater road network access:
0%
20%
40%
60%
80%
100%
120%
140%
160%
2014 2015 2016 2017 2018
Deb
tv
so
pera
tin
gre
ven
ue
QLD WA ACT NSW SA VIC TAS

Impact assumptions CONFIDENTIAL
Infrastructure AustraliaPwC 24
Enabling greater use of high productivity vehicles (e.g. greater overall mass) on the key freight routes agreedby COAG’s Transport and Infrastructure Council in 2014 to increase labour productivity
Enabling greater use of high productivity vehicles on a wider network of local roads, allowing for:
– Travel time savings: road freight operators would have access to a greater proportion of the total roadnetwork and would be able to choose more efficient routes. This implies reduced labour costs, reducedoperating costs, and, potentially, greater utilisation of the existing fleet.
– Increased trip reliability: operators could take alternate routes in the event of accidents or otherdisruptions on the principal freight routes.
Providing larger trucks with access to a wider network of ‘first mile’ and ‘last mile’ roads would reducedouble handling of freight (e.g. the assembly and disassembly of truckloads).
From the literature review (summarised below), it appears that the productivity gains relate to better use oflabour and capital employed in the road freight industry, as well as enabling better targeted investment inroads.
A number of studies have addressed heavy vehicle reform, notably those from the Heavy Vehicle InfrastructureReform process, and the PC.
In 2006, the PC conducted an inquiry into road and rail infrastructure pricing, including modelling of potentialreforms.56 The PC’s 2006 modelling quantified the effect of institutional reform and more efficient investmentin road infrastructure. The PC modelled two scenarios:
a five per cent improvement in road freight sector productivity associated with (primarily) regulatory reformand improved funding and investment decision-making
a 10 per cent improvement in road freight sector productivity associated with commercialisation of roadprovision and pricing, including mass distance location-based charges on the national highways.
The reform contemplated in the Plan is for a general system of mass-distance-location charging across all roads(i.e. beyond a scheme potentially applying to national highways referred to in the Commission’s 2006 report).
Another estimate of the impact of reforms is provided in a Heavy Vehicle Charging and Investment Reformsubmission to the 2014 PC Inquiry into Public Infrastructure where it was estimated that the net benefits fromheavy vehicle pricing (as a result of stronger financial incentives leading to lower costs of road provision andbetter access for the heavy vehicle fleet) could be $22 billion.57 It is unclear how the assumptions of thisestimate compares to those of the PC.58
Meanwhile the PC recommended (in 2014) an enquiry be undertaken on road pricing and project selection, ashas IA in the Plan’s recommendation 5.3.
In considering the benefits of the reform, it is also important to consider the costs. There will be system costs togovernment and the private sector from implementation. The cost of ‘in vehicle units’ used for assessing vehicledistance, time and location presently varies between $300 and $1,000 per unit. It appears that road freightoperators are installing such units for other compliance management and business improvement reasons.59 In
56 Productivity Commission, Road and Rail Freight Infrastructure Pricing, Productivity Commission Inquiry Report No. 41, 22 December 2006.
57 Heavy Vehicle Charging and Investment Reform submission to the Productivity Commission Inquiry into Public Infrastructure Source:
www.pc.gov.au/__data/assets/pdf_file/0020/131744/sub077-infrastructure.pdf, Accessed 20 December 2015.
58 It is thought that this estimate relates to a 2013 regulatory impact statement that the Heavy Vehicle Charging and Investment Reform commissioned, which
is not public. The final report from the process, issued for consultation, is public and includes three options. Of these, the preferred option involves a vehiclemass, distance and location (MDL)-based charging system, based on forward-looking cost estimates. This would allow for jurisdiction-specific charges, andprovide better information to road network planners. See: Frontier Economics, Heavy vehicle infrastructure funding and investment reforms: Draft forconsultation, 2013.
59 For example, advice to IA from staff of Transport Certification Australia indicates that approximately 25,000-30,000 prime movers (around a third of the
total number of prime movers in Australia) have already installed in vehicle units that could be used for monitoring the location, time and distance travelledby such vehicles.

Impact assumptions CONFIDENTIAL
Infrastructure AustraliaPwC 25
short, the capital cost of these units is modest and is unlikely to be a ‘standalone’ cost associated with theestablishment of a MDL charging system.60 The ongoing costs are also likely to be offset somewhat by replacingmany of the costs associated with the current PAYGO system.
Summary and reform assumptionsAs IA’s proposed heavy vehicle pricing reforms align with the ‘more fundamental reforms’61 discussed in thePC’s 2006 report, including the potential step-based charges for national highways, amongst other options, wemodelled the same impact as modelled by the PC. That is a 10 per cent productivity gain in 2006 for the roadtransport sector. With only modest progress to enacting the reforms contemplated in the Commission’s 2006report, and the more extensive application of mass-distance location charging contemplated in the Plan, this10 per cent productivity gain is assumed to be a reasonable estimate.
Table 14: Possible direct impact assumptions from reform
Indicator Value Description Reference
Labour,capital andmaterialsproductivity
2.9% Efficiency gain due to improved labour, capitaland materials productivity associated with theNational Competition Policy reforms related toheavy vehicles. These related to adoption ofproposals dealing with heavy vehicle charges,transportation of dangerous goods by road, masslimits, and other measures that could be expectedto lead to improved labour, capital and materialsproductivity. The PC in 2006 observed that the1999 forecasts had proved too conservative forother transport industries (rail).
Productivity Commission,Modelling the Regional Impacts ofNational Competition PolicyReforms, Supplement to Impact ofCompetition Policy on Rural andRegional Australia, 1999, p.43
Productivity Commission, Road andRail Freight Infrastructure Pricing,Productivity Commission InquiryReport, 2006, Appendix F.
Labour,capitalproductivity
2%-16%
The PC in 2006 discussed a number of Australianand International studies that have modelledproductivity gains to labour and capital intransport. The PC found the range of productivitygains applied to be within 2%-16%. The PCfurther observed that experience or expertjudgement was the main source of the estimates,rather than empirical approaches.
Productivity Commission, Road andRail Freight Infrastructure Pricing,Productivity Commission InquiryReport, 2006, Appendix F.
Materials,capital andlabourproductivity
5% In order to capture all aspects of potentialefficiency gains for both road and rail, theCommission applied a 5% productivity increaseon all inputs to the production of the freight task:that is, a 5%increase in the productivity ofmaterials, capital and labour inputs, for both roadand rail.
Productivity Commission, Road andRail Freight Infrastructure Pricing,Productivity Commission InquiryReport, 2006, Appendix G, G.27.
This was the base case (essentiallylow reform) scenario.
Materials,capital andlabourproductivity
10% + The PC also considers that under a high reformscenario,+10% productivity gain to road ispossible
Productivity Commission, Road andRail Freight Infrastructure Pricing,Productivity Commission InquiryReport, 2006, Appendix G, p.27.
60 Advice to IA from staff at Transport Certification Australia is that the cost of on-board mass measurement is also falling, as advances in vehicle technology
are introduced. The air suspension systems used on many larger vehicles (eg B-doubles and above) already provide a mass detection capability. Industryestimates suggest 30-40 per cent of the fleet has air suspension. The cost of other mass measurement technologies, such as ‘load cells’, is also falling. Therewould be some modest operational costs associated with periodic calibration of the on-board mass measuring system again a certified weighbridge.
61 Productivity Commission, Road and Rail Freight Infrastructure Pricing, Productivity Commission Inquiry Report No. 41, 22 December 2006.
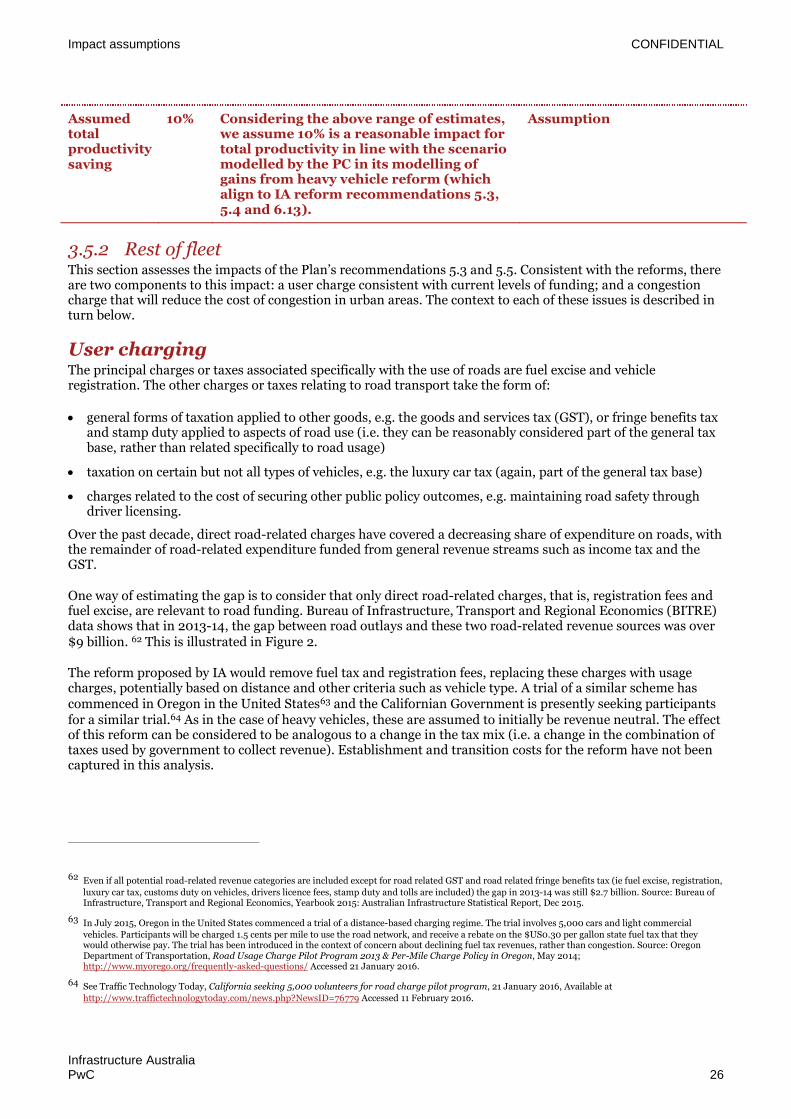
Impact assumptions CONFIDENTIAL
Infrastructure AustraliaPwC 26
Assumedtotalproductivitysaving
10% Considering the above range of estimates,we assume 10% is a reasonable impact fortotal productivity in line with the scenariomodelled by the PC in its modelling ofgains from heavy vehicle reform (whichalign to IA reform recommendations 5.3,5.4 and 6.13).
Assumption
3.5.2 Rest of fleetThis section assesses the impacts of the Plan’s recommendations 5.3 and 5.5. Consistent with the reforms, thereare two components to this impact: a user charge consistent with current levels of funding; and a congestioncharge that will reduce the cost of congestion in urban areas. The context to each of these issues is described inturn below.
User chargingThe principal charges or taxes associated specifically with the use of roads are fuel excise and vehicleregistration. The other charges or taxes relating to road transport take the form of:
general forms of taxation applied to other goods, e.g. the goods and services tax (GST), or fringe benefits taxand stamp duty applied to aspects of road use (i.e. they can be reasonably considered part of the general taxbase, rather than related specifically to road usage)
taxation on certain but not all types of vehicles, e.g. the luxury car tax (again, part of the general tax base)
charges related to the cost of securing other public policy outcomes, e.g. maintaining road safety throughdriver licensing.
Over the past decade, direct road-related charges have covered a decreasing share of expenditure on roads, withthe remainder of road-related expenditure funded from general revenue streams such as income tax and theGST.
One way of estimating the gap is to consider that only direct road-related charges, that is, registration fees andfuel excise, are relevant to road funding. Bureau of Infrastructure, Transport and Regional Economics (BITRE)data shows that in 2013-14, the gap between road outlays and these two road-related revenue sources was over$9 billion. 62 This is illustrated in Figure 2.
The reform proposed by IA would remove fuel tax and registration fees, replacing these charges with usagecharges, potentially based on distance and other criteria such as vehicle type. A trial of a similar scheme hascommenced in Oregon in the United States63 and the Californian Government is presently seeking participantsfor a similar trial.64 As in the case of heavy vehicles, these are assumed to initially be revenue neutral. The effectof this reform can be considered to be analogous to a change in the tax mix (i.e. a change in the combination oftaxes used by government to collect revenue). Establishment and transition costs for the reform have not beencaptured in this analysis.
62 Even if all potential road-related revenue categories are included except for road related GST and road related fringe benefits tax (ie fuel excise, registration,
luxury car tax, customs duty on vehicles, drivers licence fees, stamp duty and tolls are included) the gap in 2013-14 was still $2.7 billion. Source: Bureau ofInfrastructure, Transport and Regional Economics, Yearbook 2015: Australian Infrastructure Statistical Report, Dec 2015.
63 In July 2015, Oregon in the United States commenced a trial of a distance-based charging regime. The trial involves 5,000 cars and light commercialvehicles. Participants will be charged 1.5 cents per mile to use the road network, and receive a rebate on the $US0.30 per gallon state fuel tax that theywould otherwise pay. The trial has been introduced in the context of concern about declining fuel tax revenues, rather than congestion. Source: OregonDepartment of Transportation, Road Usage Charge Pilot Program 2013 & Per-Mile Charge Policy in Oregon, May 2014;http://www.myorego.org/frequently-asked-questions/ Accessed 21 January 2016.
64 See Traffic Technology Today, California seeking 5,000 volunteers for road charge pilot program, 21 January 2016, Available at
http://www.traffictechnologytoday.com/news.php?NewsID=76779 Accessed 11 February 2016.
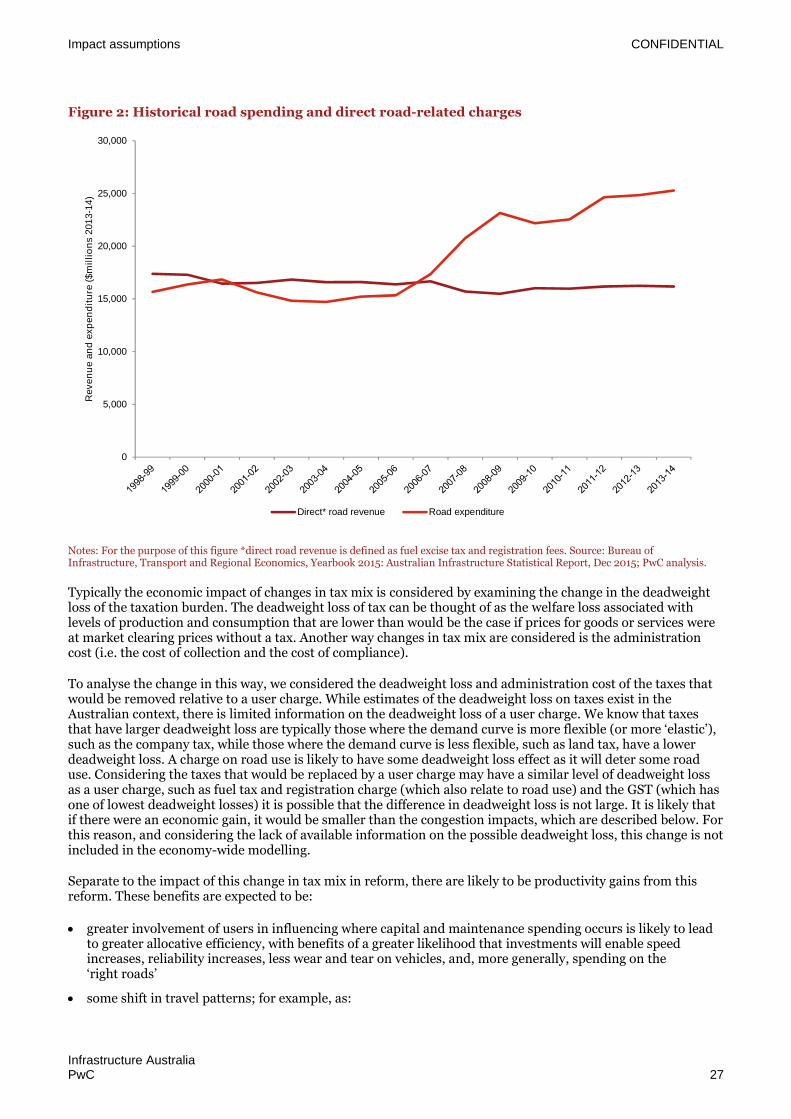
Impact assumptions CONFIDENTIAL
Infrastructure AustraliaPwC 27
Figure 2: Historical road spending and direct road-related charges
Notes: For the purpose of this figure *direct road revenue is defined as fuel excise tax and registration fees. Source: Bureau ofInfrastructure, Transport and Regional Economics, Yearbook 2015: Australian Infrastructure Statistical Report, Dec 2015; PwC analysis.
Typically the economic impact of changes in tax mix is considered by examining the change in the deadweightloss of the taxation burden. The deadweight loss of tax can be thought of as the welfare loss associated withlevels of production and consumption that are lower than would be the case if prices for goods or services wereat market clearing prices without a tax. Another way changes in tax mix are considered is the administrationcost (i.e. the cost of collection and the cost of compliance).
To analyse the change in this way, we considered the deadweight loss and administration cost of the taxes thatwould be removed relative to a user charge. While estimates of the deadweight loss on taxes exist in theAustralian context, there is limited information on the deadweight loss of a user charge. We know that taxesthat have larger deadweight loss are typically those where the demand curve is more flexible (or more ‘elastic’),such as the company tax, while those where the demand curve is less flexible, such as land tax, have a lowerdeadweight loss. A charge on road use is likely to have some deadweight loss effect as it will deter some roaduse. Considering the taxes that would be replaced by a user charge may have a similar level of deadweight lossas a user charge, such as fuel tax and registration charge (which also relate to road use) and the GST (which hasone of lowest deadweight losses) it is possible that the difference in deadweight loss is not large. It is likely thatif there were an economic gain, it would be smaller than the congestion impacts, which are described below. Forthis reason, and considering the lack of available information on the possible deadweight loss, this change is notincluded in the economy-wide modelling.
Separate to the impact of this change in tax mix in reform, there are likely to be productivity gains from thisreform. These benefits are expected to be:
greater involvement of users in influencing where capital and maintenance spending occurs is likely to leadto greater allocative efficiency, with benefits of a greater likelihood that investments will enable speedincreases, reliability increases, less wear and tear on vehicles, and, more generally, spending on the‘right roads’
some shift in travel patterns; for example, as:
0
5,000
10,000
15,000
20,000
25,000
30,000
Reve
nu
ea
nd
exp
en
dit
ure
($m
illi
on
s201
3-1
4)
Direct* road revenue Road expenditure

Impact assumptions CONFIDENTIAL
Infrastructure AustraliaPwC 28
– some users elect to use telecommunications as a means of meeting their needs that would otherwise bemet by using the transport network
– other users take up opportunities to shift transport modes or combine/share trips in a way thatminimises transport costs.
Data and evidence which could be used to quantify the value of these benefits is not presently available.Accordingly, the productivity benefits of a shift from current direct road-related charges (i.e. fuel excise andregistration fees) to a light vehicle road charging structure has not been modelled as part of this study. Again,this represents a conservative approach to the modelling.65
CongestionCongestion has been identified as a growing cost associated with the use of Australian road networks in anumber of studies, including those commissioned by IA66 and by the BITRE.67 As mentioned in section 2.4.2, atime-of-day and location road user charge could be introduced in Australian cities, as part of a broader packageof user charging reforms, to address the economic burden of congestion.
This section considers the potential impact of congestion charging in two stages.
The first stage considers the economic cost of congestion in Australia using modelling work undertaken byACIL Allen Consulting for IA’s Australian Infrastructure Audit. Based on this analysis, an estimate of thecurrent (and projected) costs of congestion to the Australian economy is established.
The second stage reviews the impacts on congestion in other jurisdictions where direct road user charginghas been introduced. It explores the potential benefits from congestion charging, acknowledging that aspecific charging proposal has not been developed at this time. Based on this analysis, some high levelassumptions for the value of achievable congestion reduction used in modelling the proposal are developed.
Congestion costs in AustraliaFour main elements contribute to the cost of congestion:
travel time delays
reduced travel time reliability
increased vehicle operating costs
increased environmental costs.
Most of the costs of congestion are experienced as travel time delays; for instance, 80 per cent of the costsavoided in London through the introduction of congestion charging were travel time delay costs.68 As a result,the estimates of congestion costs presented here focus on travel time delays. In 2014, IA commissioned ACILAllen Consulting to model the direct economic contribution of urban transport infrastructure, using a networkbased approach informed by transport modelling undertaken by Veitch Lister Consulting.69 As part of thiswork, ACIL Allen Consulting used the outputs of the network analysis to estimate the cost of congestion
65 Originally, it was thought that the modelling would proceed on the assumption that such a shift would occur in 2025.
66 ACIL Allen Consulting, Urban transport infrastructure: National economic analysis for Infrastructure Australia, December 2014.
67 Bureau of Infrastructure, Transport and Regional Economics, Estimating urban traffic and congestion cost trends for Australian cities, Working Paper 71,2007 and Bureau of Infrastructure, Transport and Regional Economics, Traffic and congestion cost trends for Australian capital cities, Information sheet74, November 2015.
68 An ex post economic appraisal of the London scheme in 2007 found that most benefits from the scheme were from travel time savings: £163 million ofbusiness travellers’ benefits relate to travel time savings out of a total £208 million in benefits to business travellers. Non-business travellers’ travel timedelay costs were of a similar proportion. Transport for London, Central London congestion charging: Impacts monitoring fifth annual report, July 2007, p.136.
69 ACIL Allen Consulting, Urban transport infrastructure: National economic analysis for Infrastructure Australia, December 2014.

Impact assumptions CONFIDENTIAL
Infrastructure AustraliaPwC 29
(measured as the travel time delays for car users).70 These estimates were $13.7 billion in 2011 and $53.3 billionin 2031 (measured in 2010-11 dollars). Interpolated estimates for additional years are presented in Table 15.
Table 15: Congestion delay cost estimates
Year 2011 2015 2028 2031
Cost of congestion ($m 2010-11) 13,740 17,724 42,881 53,318
Note: Figures for 2015 and 2028 are interpolated from the 2011 and 2031 estimates by ACIL Allen Consulting.
Source: ACIL Allen Consulting, Urban transport infrastructure: National economic analysis for Infrastructure Australia, December 2014,page xiv and xviii; PwC analysis.
For consistency with IA’s Australian Infrastructure Audit we have used the ACIL Allen Consulting estimate asthe basis of the cost of congestion in Australia. While there are limitations with this approach,71 it has beenapplied in the context of an indicative analysis where the specification of precise policies to target congestion isnot yet established.
Congestion reduction measures: international experiencesTo understand the potential economic impacts of a reform that might reduce the cost of congestion, a survey ofthe literature was undertaken on the following international schemes:
London (charge introduced in February 2003)
Stockholm, Sweden (charge introduced in January 2006)
Gothenburg, Sweden (charge introduced in January 2013).
A few other cities have also introduced a charge (e.g. Milan). However, for the moment, it appears the mostextensive evaluations of experience have been conducted on the three cities above.
The three cities all introduced area or cordon charges, one of the four main forms of congestion charging.72 Acordon charge is a levy applied for driving into a certain area, typically the CBD of a major city during certainhours of the day. The experience in London, Stockholm and Gothenburg, shows that:
there are both material travel time and reliability benefits from cordon charging (other benefits includedreductions in air pollution and improvements in safety and amenity)
70 ACIL Allen Consulting’s approach drew upon transport modelling by Veitch Lister Consulting, which estimated traffic flows at different times of the day, bypassenger, light commercial and heavy vehicles. In the case of the larger cities, ACIL Allen Consulting’s modelling is of an urban conurbation. These areextended urban areas, which might consist of several centres within a larger urban area. For example, the conurbation for New South Wales includesSydney and the Illawarra and Hunter regions.
To forecast traffic flows out to 2031 the modelling made assumptions about future infrastructure projects. As experience shows that planned infrastructureprojects do not always proceed (and to avoid pre-judging the outputs of the Australian Infrastructure Plan and the associated Infrastructure Priority List),the only road and public transport projects included in the modelling for 2031 were projects under construction at the time of the modelling and projectswhere a budget commitment had been made by the respective government(s).
From this data, ACIL Allen Consulting isolated delay costs to passenger vehicles (both passenger and business journeys) due to congestion, measured asexcess journey time. To quantify these delay costs they were evaluated by the value of travel time. The estimates, detailed in Table 15, exclude other costsassociated with congestion, specifically, reduced travel time reliability, increased vehicle operating costs and all congestion costs to commercial vehiclessuch as delivery vans and trucks.
71 These include that some elements of congestion are not included in the base estimate (which would raise the cost of congestion) and that assumptions have
been made about which planned infrastructure projects will proceed. Further analysis could consider these in more detail.
72 There are four broad forms of user pricing for roads:
• Area/cordon charging: charging for access to specific areas.
• Distance based schemes: charge users based on the distance they travel on a defined network, which could be a section of a city, a city or anationwide network. This approach can be expanded to include different prices according to vehicle characteristics, eg mass.
• Link tolling: Charging for access to specific parts of the network, for example, freeways, bridges or tunnels.
• Lane based pricing: differential pricing for different lanes on a road network, for example, express lanes, or lanes reserved for carpooling.
Source: Austroads, Research Report: Understanding the Impacts of Road Pricing Factors on Future Road Use and Network Wide Effects, 2011.
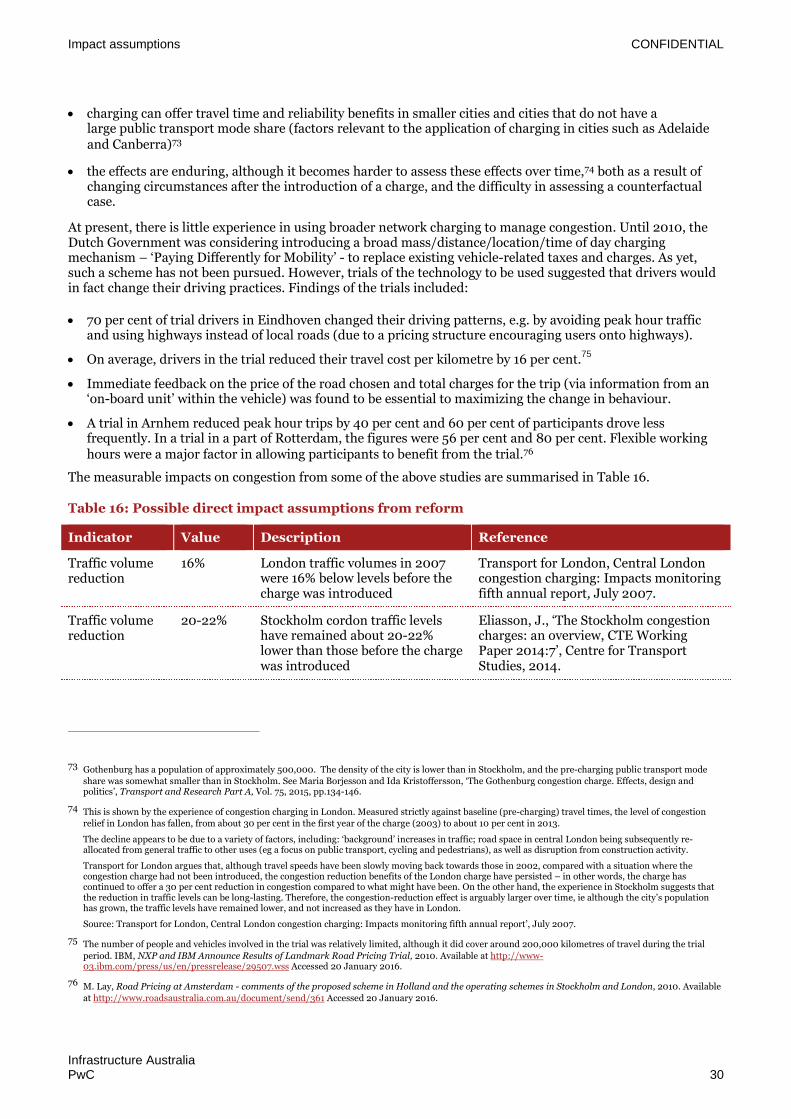
Impact assumptions CONFIDENTIAL
Infrastructure AustraliaPwC 30
charging can offer travel time and reliability benefits in smaller cities and cities that do not have alarge public transport mode share (factors relevant to the application of charging in cities such as Adelaideand Canberra)73
the effects are enduring, although it becomes harder to assess these effects over time,74 both as a result ofchanging circumstances after the introduction of a charge, and the difficulty in assessing a counterfactualcase.
At present, there is little experience in using broader network charging to manage congestion. Until 2010, theDutch Government was considering introducing a broad mass/distance/location/time of day chargingmechanism – ‘Paying Differently for Mobility’ - to replace existing vehicle-related taxes and charges. As yet,such a scheme has not been pursued. However, trials of the technology to be used suggested that drivers wouldin fact change their driving practices. Findings of the trials included:
70 per cent of trial drivers in Eindhoven changed their driving patterns, e.g. by avoiding peak hour trafficand using highways instead of local roads (due to a pricing structure encouraging users onto highways).
On average, drivers in the trial reduced their travel cost per kilometre by 16 per cent.75
Immediate feedback on the price of the road chosen and total charges for the trip (via information from an‘on-board unit’ within the vehicle) was found to be essential to maximizing the change in behaviour.
A trial in Arnhem reduced peak hour trips by 40 per cent and 60 per cent of participants drove lessfrequently. In a trial in a part of Rotterdam, the figures were 56 per cent and 80 per cent. Flexible workinghours were a major factor in allowing participants to benefit from the trial.76
The measurable impacts on congestion from some of the above studies are summarised in Table 16.
Table 16: Possible direct impact assumptions from reform
Indicator Value Description Reference
Traffic volumereduction
16% London traffic volumes in 2007were 16% below levels before thecharge was introduced
Transport for London, Central Londoncongestion charging: Impacts monitoringfifth annual report, July 2007.
Traffic volumereduction
20-22% Stockholm cordon traffic levelshave remained about 20-22%lower than those before the chargewas introduced
Eliasson, J., ‘The Stockholm congestioncharges: an overview, CTE WorkingPaper 2014:7’, Centre for TransportStudies, 2014.
73 Gothenburg has a population of approximately 500,000. The density of the city is lower than in Stockholm, and the pre-charging public transport modeshare was somewhat smaller than in Stockholm. See Maria Borjesson and Ida Kristoffersson, ‘The Gothenburg congestion charge. Effects, design andpolitics’, Transport and Research Part A, Vol. 75, 2015, pp.134-146.
74 This is shown by the experience of congestion charging in London. Measured strictly against baseline (pre-charging) travel times, the level of congestionrelief in London has fallen, from about 30 per cent in the first year of the charge (2003) to about 10 per cent in 2013.
The decline appears to be due to a variety of factors, including: ‘background’ increases in traffic; road space in central London being subsequently re-allocated from general traffic to other uses (eg a focus on public transport, cycling and pedestrians), as well as disruption from construction activity.
Transport for London argues that, although travel speeds have been slowly moving back towards those in 2002, compared with a situation where thecongestion charge had not been introduced, the congestion reduction benefits of the London charge have persisted – in other words, the charge hascontinued to offer a 30 per cent reduction in congestion compared to what might have been. On the other hand, the experience in Stockholm suggests thatthe reduction in traffic levels can be long-lasting. Therefore, the congestion-reduction effect is arguably larger over time, ie although the city’s populationhas grown, the traffic levels have remained lower, and not increased as they have in London.
Source: Transport for London, Central London congestion charging: Impacts monitoring fifth annual report’, July 2007.
75 The number of people and vehicles involved in the trial was relatively limited, although it did cover around 200,000 kilometres of travel during the trial
period. IBM, NXP and IBM Announce Results of Landmark Road Pricing Trial, 2010. Available at http://www-03.ibm.com/press/us/en/pressrelease/29507.wss Accessed 20 January 2016.
76 M. Lay, Road Pricing at Amsterdam - comments of the proposed scheme in Holland and the operating schemes in Stockholm and London, 2010. Available
at http://www.roadsaustralia.com.au/document/send/361 Accessed 20 January 2016.

Impact assumptions CONFIDENTIAL
Infrastructure AustraliaPwC 31
Indicator Value Description Reference
Traffic volumereduction
12-13% Traffic levels in the Gothenburgcordon area are about 12-13%lower during peak periods
Borjesson, M. and Kristoffersson, I., ‘TheGothenburg congestion charge. Effects,design and politics’, Transport andResearch Part A, Vol. 75, 2015, pp.134-146.
Reduction inpeak delays
10-50% Depending on the locationmeasured, morning peak delays inGothenberg reduced by between10-50%
Borjesson, M. and Kristoffersson, I., ‘TheGothenburg congestion charge. Effects,design and politics’, Transport andResearch Part A, Vol. 75, 2015, pp.134-146.
Congestionreduction
10-15% Congestion reduction in Singaporedue to a cordon scheme rangedfrom 10-15%
IPA, Urban transport challenge: Adiscussion paper on a role for roadpricing in the Australian context, 2010,pp.36 – 39.
Assumedcongestionreductionbenefit
15% Congestion reductionbenefits equivalent to 15% ofthe burden of congestion
Assumption
Clearly, some caution should be used in extrapolating from the examples above to testing the possible economicimpacts of a potentially different form of congestion charging in Australian cities. Nevertheless, the experiencenoted above shows that road users do respond to the application of a financial incentive to modify travelbehaviour. It therefore suggests that a well-designed road charging scheme in the Australian context would alsoreduce congestion and provide worthwhile travel time and reliability benefits.
The form of any congestion-related light vehicle charge that might be introduced in Australia will need to bedetermined by future governments. It may ultimately take the form of a mass/distance/location/time of daypricing, or some other form of charge. Following future consideration of the specifics of any charging system,further thought can be given to carefully assessing the potential net benefits in the Australian context drawingon overseas experiences. This analysis could consider other costs and benefits that have not been includedhere.77
For the purpose of this report, which is to give an indication of the possible gross economic impacts, it has beenassumed that a congestion charge is introduced such that it has an effect equivalent to a 15 per cent reduction inthe burden of congestion estimated by ACIL Allen Consulting (detailed in Table 15). Bearing in mind theexperience mentioned above and that a 15 per cent reduction in the cost of congestion could be achieved by asmaller change in the level of congestion,78 a 15 per cent reduction in the cost of congestion is not unreasonable.Applying this assumption to ACIL Allen Consulting’s forecast cost of congestion in 2028 and 2031 (asexamples) results in the impacts described in Table 17.
77 In regards to costs: There are some categories of cost appropriate for consideration in a cost-benefit analysis that have not been considered here; the
London scheme evaluation included the cost of deterred trips – mostly to leisure travellers – for example (source: Transport for London, Central Londoncongestion charging: Impacts monitoring fifth annual report, July 2007, p 138.). Costs to leisure travellers are not included in this analysis because they arenot captured in the economic measure of GDP however they are costs that are legitimately included in a cost-benefit analysis. Establishment and transitionare other costs that would need to be considered in an evaluation of a detailed reform proposal.
In regards to benefits: It is plausible that reducing congestion could increase capital productivity in the road freight industry. Reducing the incidence ofcongestion is considered likely to improve travel time reliability. This could reduce the travel time variance that road freight operators need to account forwhen scheduling services. This could result in a productivity gain, as operators would be able to schedule more services in the same time period, using thesame vehicle. While this benefit is plausible, parameters with which to value this benefit have yet to be established in the literature on congestion.
78 A 15 per cent reduction in the cost of congestion might be achieved by a less than equal magnitude change in traffic volumes as there appears to be a non-linear relationship between the two. That is, it seems likely that as traffic volumes increase, the cost of congestion increases by a greater factor. Congestionoccurs due to network wide effects of increased vehicle usage. Components of congestion costs, such as reduced trip reliability, are likely to have a non-linear relationship to commonly used congestion metrics, such as vehicle speeds. This implies that the benefits of congestion reduction may be initially highand then exhibit diminishing returns to scale.

Impact assumptions CONFIDENTIAL
Infrastructure AustraliaPwC 32
Table 17: Indicative direct impact on cost of congestion from reform
Year 2028 2031
Saving if the cost of car congestion is reduced by 15% ($m 2010-11) 6,432 7,998
Source: ACIL Allen Consulting, Urban transport infrastructure: National economic analysis for Infrastructure Australia, December 2014,page xiv and xviii; PwC analysis.
3.5.3 Public transportTo estimate the potential direct economic impacts of the Plan’s recommendation 6.14, we undertook a briefliterature review and consulted with industry experts. The findings of this review are summarised below.
A review of franchising experiences in Australia and around the world, as part of a 2012 report by LEKConsulting for the Tourism and Transport Forum,79 showed:
Internationally:
– in Britain, when bus services were tendered in 1995, unit costs declined by 50 to 55 per cent
– in Sweden, buses and trains costs reduced by up to 33 per cent
– in the Netherlands, efficiencies increased by 20 to 50 per cent
– the United States of America’s bus industry achieved cost savings of 30 to 46 per cent.80
In Sydney, the privately run Manly Fast Ferry had a fare of $8.50 (in August 2011) with a journey time of 17minutes between Circular Quay and Manly relative to a fare of $9.00 for the publicly operated Sydney FastFerries with a journey time of 18 minutes. Meanwhile for the same journey, Sydney Ferries cost an estimated$13.97 for a 30 minute trip once the subsidy was added to the fare.81 Also in Sydney, a 2008 IPART review ofSydney’s CityRail found cost savings of 17 per cent could be achieved.82
In Melbourne, by linking financial incentives to punctuality and reliability, the train and tram franchiseesreduced delays and cancellations by 35 per cent.83
In Perth, the franchising of buses in 1996 and 1998 resulted in unit costs falling 29 per cent from $3.58 perservice kilometre in 1992-93 to $2.55 per service kilometre in 1998-99.84
While the report noted the above step changes that are possible in reducing operating costs, these are a stepchange and are not repeated in subsequent rounds of franchising. As a result, when a sector is initially openedup to tendering, a large, one-off reduction can be expected. Industry experts 85 spoken to confirmed this andnoted that the Australian experience shows some efficiency gains, albeit smaller, can also occur in the secondand third rounds of franchising.
79 LEK Consulting, Public transport, private operators: Delivering better services through franchising, Tourism & Transport Forum, July 2012.
80 David Hensher and Ian Wallis, ‘Competitive tendering as a contracting mechanism for subsidising transport: The bus experience’, Journal of Transport
Economics and Policy, 2005, cited in LEK Consulting, Public transport, private operators: Delivering better services through franchising, Tourism &Transport Forum, July 2012.
81 Ibid. p.18.
82 Ibid. p.30.
83 Ibid. p. 21.
84 Ibid. p.27.
85 The project team spoke to an experienced former executive of a public transport franchise operator and a government employee familiar with tendering of
public transport services.
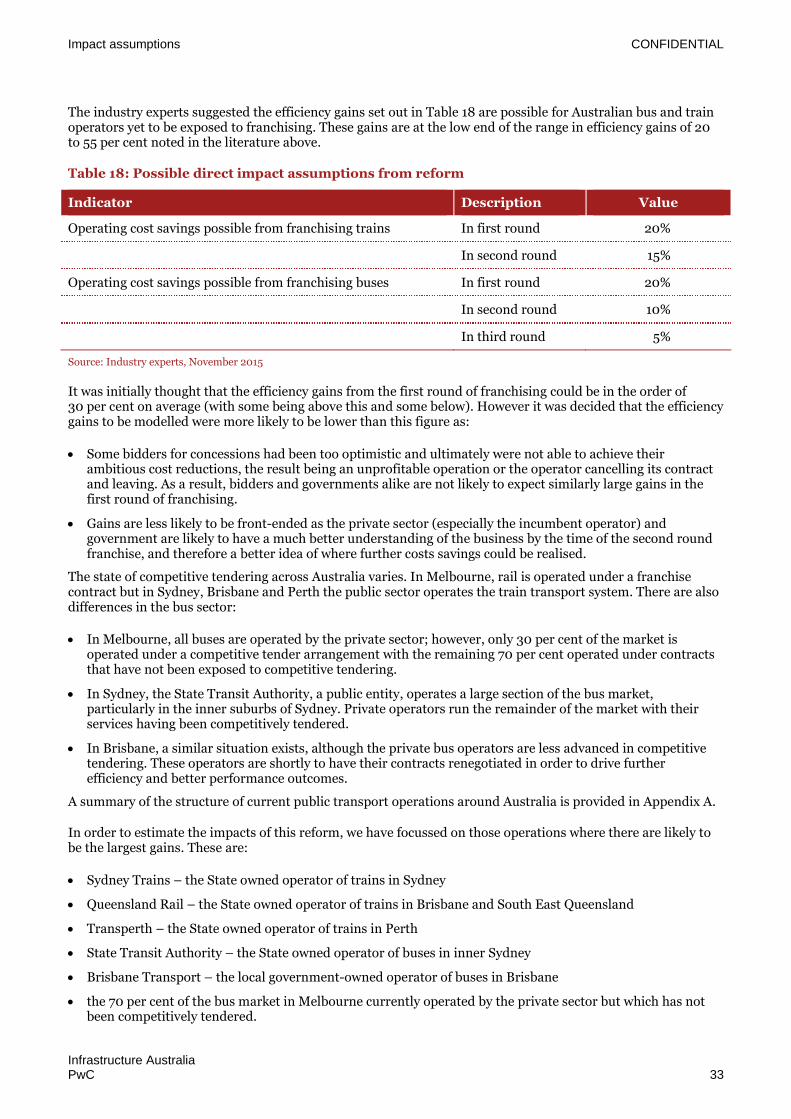
Impact assumptions CONFIDENTIAL
Infrastructure AustraliaPwC 33
The industry experts suggested the efficiency gains set out in Table 18 are possible for Australian bus and trainoperators yet to be exposed to franchising. These gains are at the low end of the range in efficiency gains of 20to 55 per cent noted in the literature above.
Table 18: Possible direct impact assumptions from reform
Indicator Description Value
Operating cost savings possible from franchising trains In first round 20%
In second round 15%
Operating cost savings possible from franchising buses In first round 20%
In second round 10%
In third round 5%
Source: Industry experts, November 2015
It was initially thought that the efficiency gains from the first round of franchising could be in the order of30 per cent on average (with some being above this and some below). However it was decided that the efficiencygains to be modelled were more likely to be lower than this figure as:
Some bidders for concessions had been too optimistic and ultimately were not able to achieve theirambitious cost reductions, the result being an unprofitable operation or the operator cancelling its contractand leaving. As a result, bidders and governments alike are not likely to expect similarly large gains in thefirst round of franchising.
Gains are less likely to be front-ended as the private sector (especially the incumbent operator) andgovernment are likely to have a much better understanding of the business by the time of the second roundfranchise, and therefore a better idea of where further costs savings could be realised.
The state of competitive tendering across Australia varies. In Melbourne, rail is operated under a franchisecontract but in Sydney, Brisbane and Perth the public sector operates the train transport system. There are alsodifferences in the bus sector:
In Melbourne, all buses are operated by the private sector; however, only 30 per cent of the market isoperated under a competitive tender arrangement with the remaining 70 per cent operated under contractsthat have not been exposed to competitive tendering.
In Sydney, the State Transit Authority, a public entity, operates a large section of the bus market,particularly in the inner suburbs of Sydney. Private operators run the remainder of the market with theirservices having been competitively tendered.
In Brisbane, a similar situation exists, although the private bus operators are less advanced in competitivetendering. These operators are shortly to have their contracts renegotiated in order to drive furtherefficiency and better performance outcomes.
A summary of the structure of current public transport operations around Australia is provided in Appendix A.
In order to estimate the impacts of this reform, we have focussed on those operations where there are likely tobe the largest gains. These are:
Sydney Trains – the State owned operator of trains in Sydney
Queensland Rail – the State owned operator of trains in Brisbane and South East Queensland
Transperth – the State owned operator of trains in Perth
State Transit Authority – the State owned operator of buses in inner Sydney
Brisbane Transport – the local government-owned operator of buses in Brisbane
the 70 per cent of the bus market in Melbourne currently operated by the private sector but which has notbeen competitively tendered.

Impact assumptions CONFIDENTIAL
Infrastructure AustraliaPwC 34
As noted in Appendix A, there are other operators that are also currently operated without private sectorfranchising. These are also subject to the IA recommendation; however due to data availability and materiality,we have focussed on the operations above. To give an indication of the scale of these entities, the operatingexpenditure associated with these selected public transport operations is provided in Table 44 in Appendix A.
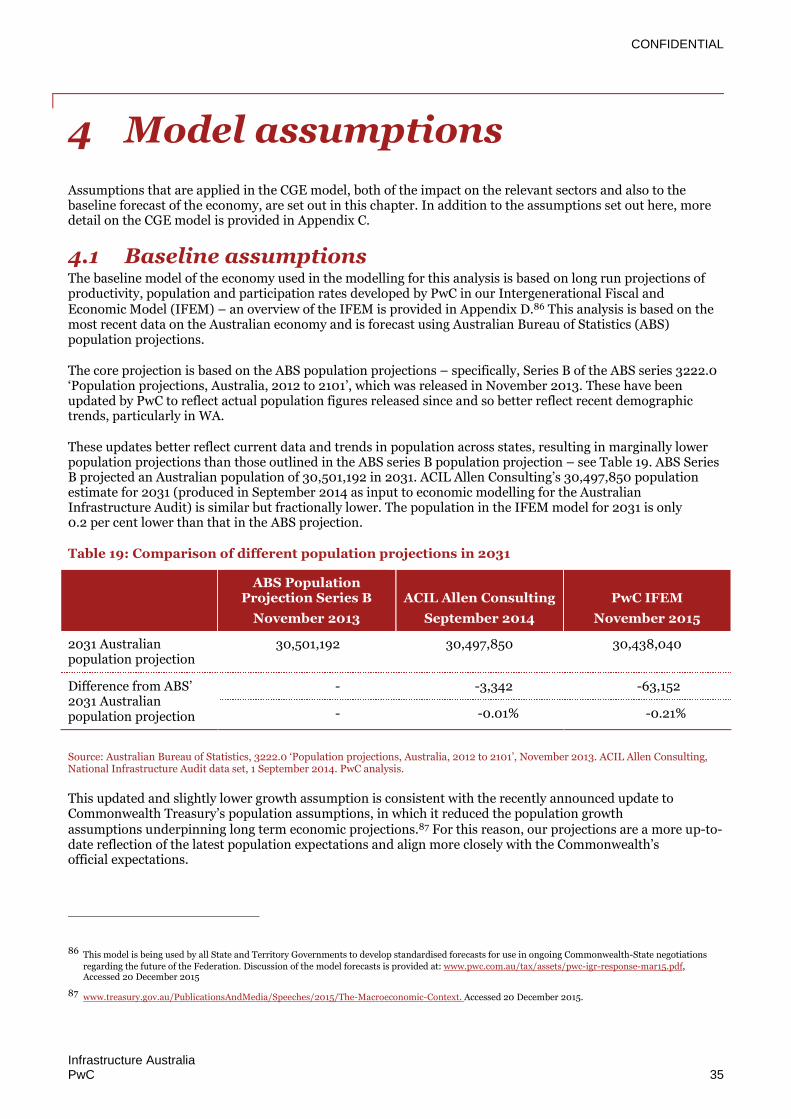
CONFIDENTIAL
Infrastructure AustraliaPwC 35
4 Model assumptions
Assumptions that are applied in the CGE model, both of the impact on the relevant sectors and also to thebaseline forecast of the economy, are set out in this chapter. In addition to the assumptions set out here, moredetail on the CGE model is provided in Appendix C.
4.1 Baseline assumptionsThe baseline model of the economy used in the modelling for this analysis is based on long run projections ofproductivity, population and participation rates developed by PwC in our Intergenerational Fiscal andEconomic Model (IFEM) – an overview of the IFEM is provided in Appendix D.86 This analysis is based on themost recent data on the Australian economy and is forecast using Australian Bureau of Statistics (ABS)population projections.
The core projection is based on the ABS population projections – specifically, Series B of the ABS series 3222.0‘Population projections, Australia, 2012 to 2101’, which was released in November 2013. These have beenupdated by PwC to reflect actual population figures released since and so better reflect recent demographictrends, particularly in WA.
These updates better reflect current data and trends in population across states, resulting in marginally lowerpopulation projections than those outlined in the ABS series B population projection – see Table 19. ABS SeriesB projected an Australian population of 30,501,192 in 2031. ACIL Allen Consulting’s 30,497,850 populationestimate for 2031 (produced in September 2014 as input to economic modelling for the AustralianInfrastructure Audit) is similar but fractionally lower. The population in the IFEM model for 2031 is only0.2 per cent lower than that in the ABS projection.
Table 19: Comparison of different population projections in 2031
ABS PopulationProjection Series B
November 2013
ACIL Allen Consulting
September 2014
PwC IFEM
November 2015
2031 Australianpopulation projection
30,501,192 30,497,850 30,438,040
Difference from ABS’2031 Australianpopulation projection
- -3,342 -63,152
- -0.01% -0.21%
Source: Australian Bureau of Statistics, 3222.0 ‘Population projections, Australia, 2012 to 2101’, November 2013. ACIL Allen Consulting,National Infrastructure Audit data set, 1 September 2014. PwC analysis.
This updated and slightly lower growth assumption is consistent with the recently announced update toCommonwealth Treasury’s population assumptions, in which it reduced the population growthassumptions underpinning long term economic projections.87 For this reason, our projections are a more up-to-date reflection of the latest population expectations and align more closely with the Commonwealth’sofficial expectations.
86 This model is being used by all State and Territory Governments to develop standardised forecasts for use in ongoing Commonwealth-State negotiations
regarding the future of the Federation. Discussion of the model forecasts is provided at: www.pwc.com.au/tax/assets/pwc-igr-response-mar15.pdf,Accessed 20 December 2015
87 www.treasury.gov.au/PublicationsAndMedia/Speeches/2015/The-Macroeconomic-Context. Accessed 20 December 2015.
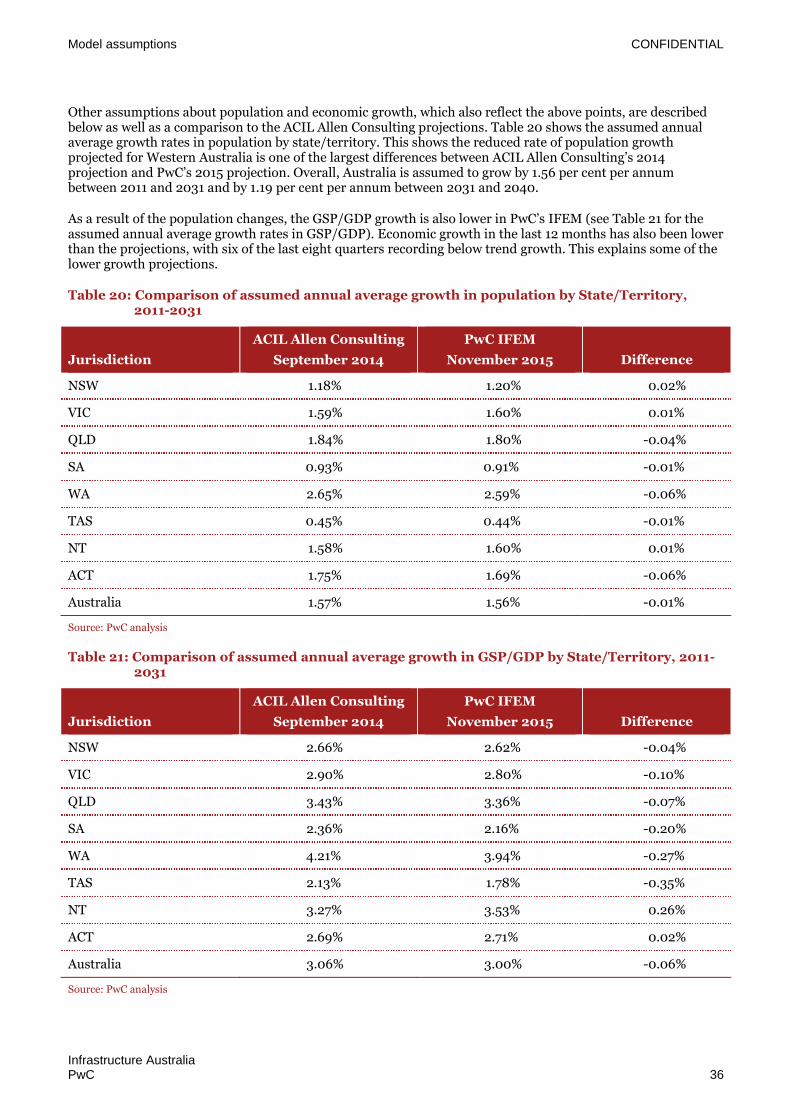
Model assumptions CONFIDENTIAL
Infrastructure AustraliaPwC 36
Other assumptions about population and economic growth, which also reflect the above points, are describedbelow as well as a comparison to the ACIL Allen Consulting projections. Table 20 shows the assumed annualaverage growth rates in population by state/territory. This shows the reduced rate of population growthprojected for Western Australia is one of the largest differences between ACIL Allen Consulting’s 2014projection and PwC’s 2015 projection. Overall, Australia is assumed to grow by 1.56 per cent per annumbetween 2011 and 2031 and by 1.19 per cent per annum between 2031 and 2040.
As a result of the population changes, the GSP/GDP growth is also lower in PwC’s IFEM (see Table 21 for theassumed annual average growth rates in GSP/GDP). Economic growth in the last 12 months has also been lowerthan the projections, with six of the last eight quarters recording below trend growth. This explains some of thelower growth projections.
Table 20: Comparison of assumed annual average growth in population by State/Territory,2011-2031
Jurisdiction
ACIL Allen Consulting
September 2014
PwC IFEM
November 2015 Difference
NSW 1.18% 1.20% 0.02%
VIC 1.59% 1.60% 0.01%
QLD 1.84% 1.80% -0.04%
SA 0.93% 0.91% -0.01%
WA 2.65% 2.59% -0.06%
TAS 0.45% 0.44% -0.01%
NT 1.58% 1.60% 0.01%
ACT 1.75% 1.69% -0.06%
Australia 1.57% 1.56% -0.01%
Source: PwC analysis
Table 21: Comparison of assumed annual average growth in GSP/GDP by State/Territory, 2011-2031
Jurisdiction
ACIL Allen Consulting
September 2014
PwC IFEM
November 2015 Difference
NSW 2.66% 2.62% -0.04%
VIC 2.90% 2.80% -0.10%
QLD 3.43% 3.36% -0.07%
SA 2.36% 2.16% -0.20%
WA 4.21% 3.94% -0.27%
TAS 2.13% 1.78% -0.35%
NT 3.27% 3.53% 0.26%
ACT 2.69% 2.71% 0.02%
Australia 3.06% 3.00% -0.06%
Source: PwC analysis

Model assumptions CONFIDENTIAL
Infrastructure AustraliaPwC 37
To provide some indication of how the forecast growth rates summarised above impact on GSP and GDP Table22 shows the forecast GSP and GDP in 2031 and 2040 in comparison to 2011.
Table 22: Historical and forecast real GSP/GDP ($m)
Jurisdiction 2011 2031 2040
NSW 490,403 823,090 1,003,941
VIC 345,321 599,744 753,453
QLD 286,230 554,380 707,679
SA 98,358 150,768 179,858
WA 231,064 500,876 669,934
TAS 26,273 37,406 42,755
NT 19,621 39,262 49,628
ACT 35,914 61,309 77,896
Australia 1,532,232 2,766,837 3,485,144
Note: Values are in 2015-16 dollars. Medium term projections used in this analysis are based on economic outlook as per CommonwealthTreasury Budget 15-16. Since this analysis was conducted, Commonwealth Treasury has revised down the medium term economic outlookin MYEFO 15-16 for real GDP.
Source: PwC’s IFEM, November 2015.
Table 23 compares the ACIL Allen Consulting’s projections for industry growth with those from the PwC VURMCGE model baseline. Since the type of models used and the dates of the forecasts differ, comparisons are notstraightforward. A number of observations about the reasons for and significance of the differences cannonetheless be made:
some of the differences are due to a difference in the industry categories used in the models
since the industry baseline is partly determined by macro-economic conditions, forecasts for industries (e.g.construction) that rely heavily on volatile overall investment spending can be affected by recent history andthe general downgrading of macro-economic prospects in the last year (see discussion above)
the considerably higher forecast for mining industry activity in the PwC VURM baseline reflects our viewthat, despite the end of the construction phase of the mining boom, production and exports from recentlyinstalled capital will continue to grow over a wide range of commodity prices since the capacity, onceinstalled, will tend to be used
provision by government services, and demand for services, will remain subdued relative to earlier forecasts,consistent with macro-economic forecasts for slower growth overall.
Whilst differences in industry composition in the baseline matter, the effects of policy should be interpreted asdeviations from the base case. Understanding and interpreting the deviations as being from an economy that isgrowing overall is more important than the industry structure of the base case.
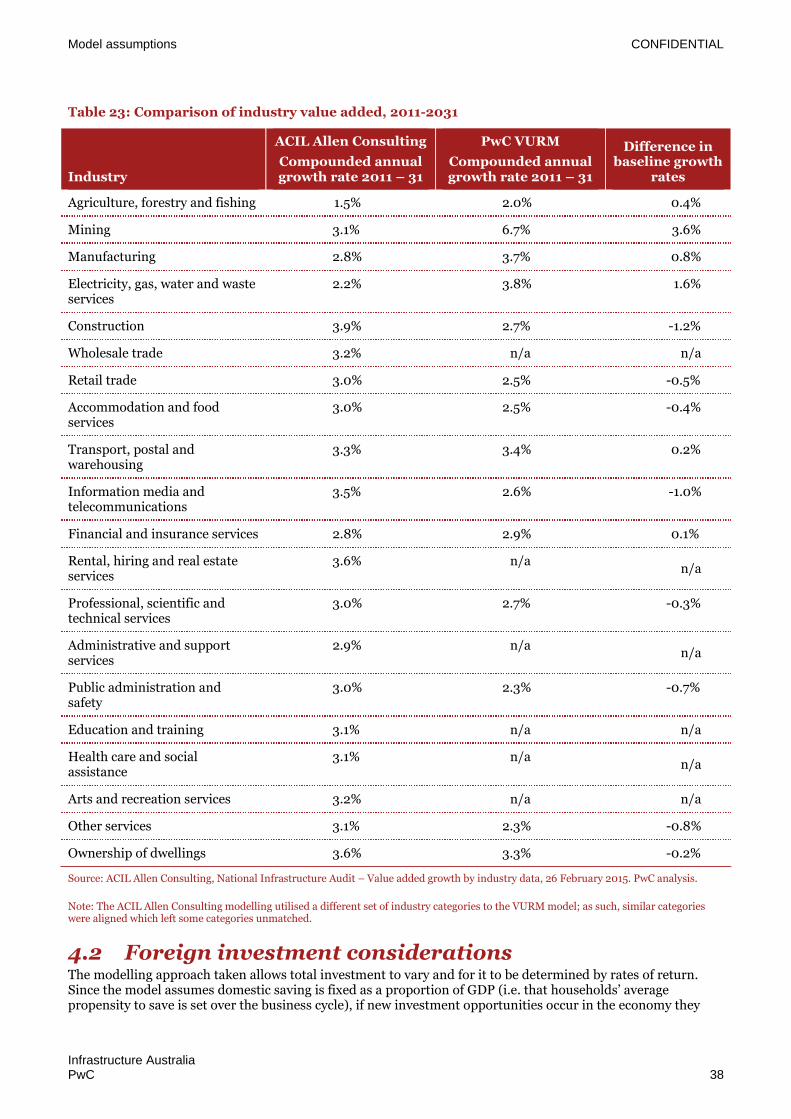
Model assumptions CONFIDENTIAL
Infrastructure AustraliaPwC 38
Table 23: Comparison of industry value added, 2011-2031
Industry
ACIL Allen Consulting
Compounded annualgrowth rate 2011 – 31
PwC VURM
Compounded annualgrowth rate 2011 – 31
Difference inbaseline growth
rates
Agriculture, forestry and fishing 1.5% 2.0% 0.4%
Mining 3.1% 6.7% 3.6%
Manufacturing 2.8% 3.7% 0.8%
Electricity, gas, water and wasteservices
2.2% 3.8% 1.6%
Construction 3.9% 2.7% -1.2%
Wholesale trade 3.2% n/a n/a
Retail trade 3.0% 2.5% -0.5%
Accommodation and foodservices
3.0% 2.5% -0.4%
Transport, postal andwarehousing
3.3% 3.4% 0.2%
Information media andtelecommunications
3.5% 2.6% -1.0%
Financial and insurance services 2.8% 2.9% 0.1%
Rental, hiring and real estateservices
3.6% n/an/a
Professional, scientific andtechnical services
3.0% 2.7% -0.3%
Administrative and supportservices
2.9% n/an/a
Public administration andsafety
3.0% 2.3% -0.7%
Education and training 3.1% n/a n/a
Health care and socialassistance
3.1% n/an/a
Arts and recreation services 3.2% n/a n/a
Other services 3.1% 2.3% -0.8%
Ownership of dwellings 3.6% 3.3% -0.2%
Source: ACIL Allen Consulting, National Infrastructure Audit – Value added growth by industry data, 26 February 2015. PwC analysis.
Note: The ACIL Allen Consulting modelling utilised a different set of industry categories to the VURM model; as such, similar categorieswere aligned which left some categories unmatched.
4.2 Foreign investment considerationsThe modelling approach taken allows total investment to vary and for it to be determined by rates of return.Since the model assumes domestic saving is fixed as a proportion of GDP (i.e. that households’ averagepropensity to save is set over the business cycle), if new investment opportunities occur in the economy they
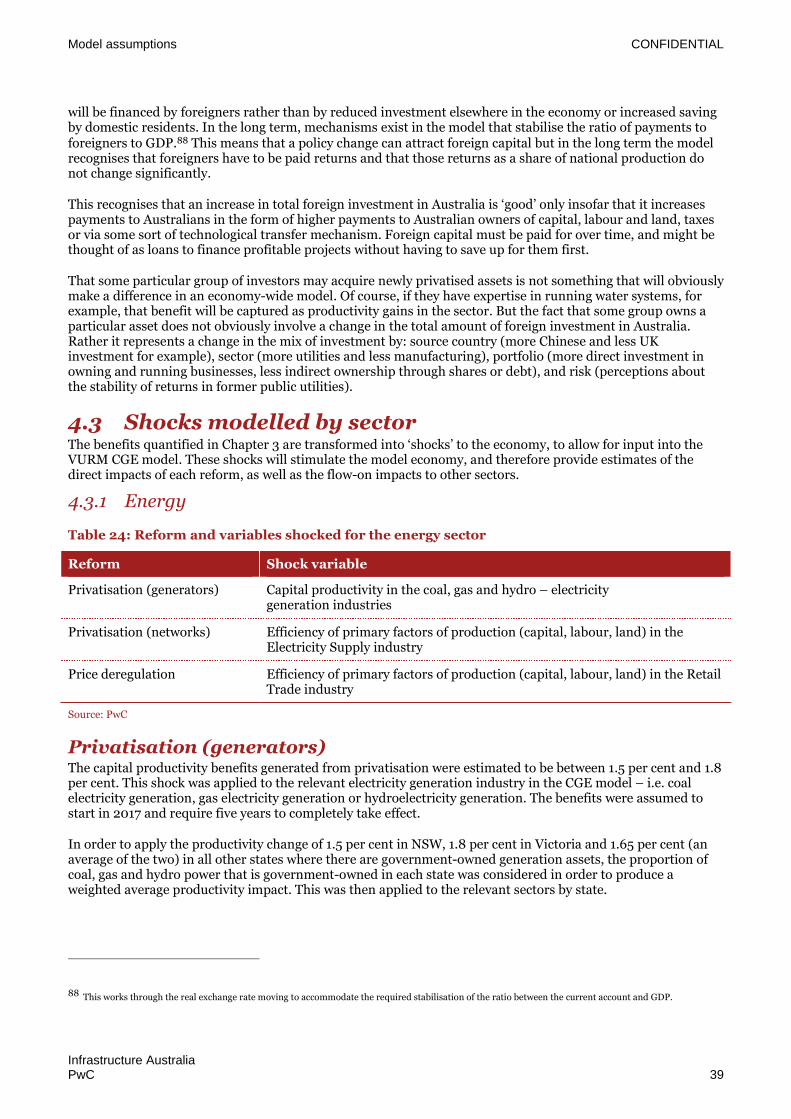
Model assumptions CONFIDENTIAL
Infrastructure AustraliaPwC 39
will be financed by foreigners rather than by reduced investment elsewhere in the economy or increased savingby domestic residents. In the long term, mechanisms exist in the model that stabilise the ratio of payments toforeigners to GDP.88 This means that a policy change can attract foreign capital but in the long term the modelrecognises that foreigners have to be paid returns and that those returns as a share of national production donot change significantly.
This recognises that an increase in total foreign investment in Australia is ‘good’ only insofar that it increasespayments to Australians in the form of higher payments to Australian owners of capital, labour and land, taxesor via some sort of technological transfer mechanism. Foreign capital must be paid for over time, and might bethought of as loans to finance profitable projects without having to save up for them first.
That some particular group of investors may acquire newly privatised assets is not something that will obviouslymake a difference in an economy-wide model. Of course, if they have expertise in running water systems, forexample, that benefit will be captured as productivity gains in the sector. But the fact that some group owns aparticular asset does not obviously involve a change in the total amount of foreign investment in Australia.Rather it represents a change in the mix of investment by: source country (more Chinese and less UKinvestment for example), sector (more utilities and less manufacturing), portfolio (more direct investment inowning and running businesses, less indirect ownership through shares or debt), and risk (perceptions aboutthe stability of returns in former public utilities).
4.3 Shocks modelled by sectorThe benefits quantified in Chapter 3 are transformed into ‘shocks’ to the economy, to allow for input into theVURM CGE model. These shocks will stimulate the model economy, and therefore provide estimates of thedirect impacts of each reform, as well as the flow-on impacts to other sectors.
4.3.1 Energy
Table 24: Reform and variables shocked for the energy sector
Reform Shock variable
Privatisation (generators) Capital productivity in the coal, gas and hydro – electricitygeneration industries
Privatisation (networks) Efficiency of primary factors of production (capital, labour, land) in theElectricity Supply industry
Price deregulation Efficiency of primary factors of production (capital, labour, land) in the RetailTrade industry
Source: PwC
Privatisation (generators)The capital productivity benefits generated from privatisation were estimated to be between 1.5 per cent and 1.8per cent. This shock was applied to the relevant electricity generation industry in the CGE model – i.e. coalelectricity generation, gas electricity generation or hydroelectricity generation. The benefits were assumed tostart in 2017 and require five years to completely take effect.
In order to apply the productivity change of 1.5 per cent in NSW, 1.8 per cent in Victoria and 1.65 per cent (anaverage of the two) in all other states where there are government-owned generation assets, the proportion ofcoal, gas and hydro power that is government-owned in each state was considered in order to produce aweighted average productivity impact. This was then applied to the relevant sectors by state.
88 This works through the real exchange rate moving to accommodate the required stabilisation of the ratio between the current account and GDP.
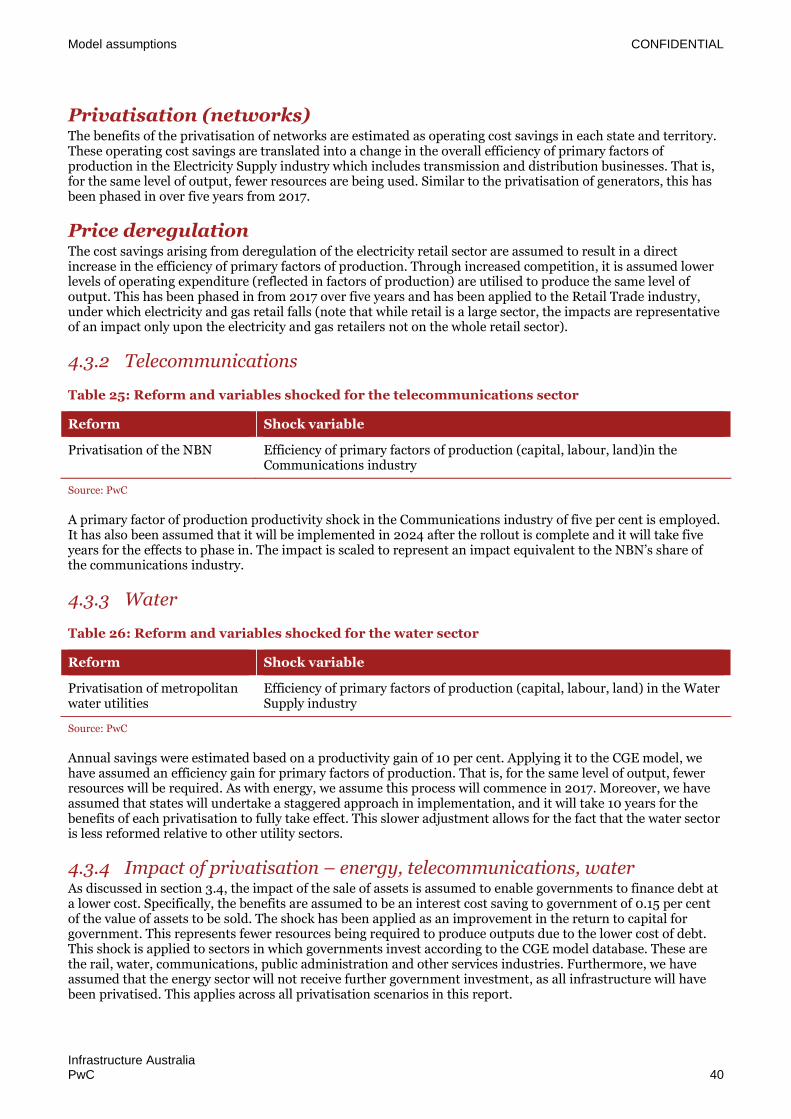
Model assumptions CONFIDENTIAL
Infrastructure AustraliaPwC 40
Privatisation (networks)The benefits of the privatisation of networks are estimated as operating cost savings in each state and territory.These operating cost savings are translated into a change in the overall efficiency of primary factors ofproduction in the Electricity Supply industry which includes transmission and distribution businesses. That is,for the same level of output, fewer resources are being used. Similar to the privatisation of generators, this hasbeen phased in over five years from 2017.
Price deregulationThe cost savings arising from deregulation of the electricity retail sector are assumed to result in a directincrease in the efficiency of primary factors of production. Through increased competition, it is assumed lowerlevels of operating expenditure (reflected in factors of production) are utilised to produce the same level ofoutput. This has been phased in from 2017 over five years and has been applied to the Retail Trade industry,under which electricity and gas retail falls (note that while retail is a large sector, the impacts are representativeof an impact only upon the electricity and gas retailers not on the whole retail sector).
4.3.2 Telecommunications
Table 25: Reform and variables shocked for the telecommunications sector
Reform Shock variable
Privatisation of the NBN Efficiency of primary factors of production (capital, labour, land)in theCommunications industry
Source: PwC
A primary factor of production productivity shock in the Communications industry of five per cent is employed.It has also been assumed that it will be implemented in 2024 after the rollout is complete and it will take fiveyears for the effects to phase in. The impact is scaled to represent an impact equivalent to the NBN’s share ofthe communications industry.
4.3.3 Water
Table 26: Reform and variables shocked for the water sector
Reform Shock variable
Privatisation of metropolitanwater utilities
Efficiency of primary factors of production (capital, labour, land) in the WaterSupply industry
Source: PwC
Annual savings were estimated based on a productivity gain of 10 per cent. Applying it to the CGE model, wehave assumed an efficiency gain for primary factors of production. That is, for the same level of output, fewerresources will be required. As with energy, we assume this process will commence in 2017. Moreover, we haveassumed that states will undertake a staggered approach in implementation, and it will take 10 years for thebenefits of each privatisation to fully take effect. This slower adjustment allows for the fact that the water sectoris less reformed relative to other utility sectors.
4.3.4 Impact of privatisation – energy, telecommunications, waterAs discussed in section 3.4, the impact of the sale of assets is assumed to enable governments to finance debt ata lower cost. Specifically, the benefits are assumed to be an interest cost saving to government of 0.15 per centof the value of assets to be sold. The shock has been applied as an improvement in the return to capital forgovernment. This represents fewer resources being required to produce outputs due to the lower cost of debt.This shock is applied to sectors in which governments invest according to the CGE model database. These arethe rail, water, communications, public administration and other services industries. Furthermore, we haveassumed that the energy sector will not receive further government investment, as all infrastructure will havebeen privatised. This applies across all privatisation scenarios in this report.

Model assumptions CONFIDENTIAL
Infrastructure AustraliaPwC 41
As discussed earlier, the benefits are estimated to be an interest cost saving of 0.15 per cent. Using the costsavings estimated, the ‘shock’ was implemented and phased in over the time periods specified in the tablebelow.
Table 27: Asset sales timing of benefits
Sector First year of benefits
Energy – networks and generators 2017
Water 2017-2024 (staggered start year among states)
Communications 2024
Source: PwC
4.3.5 Transport
Table 28: Reform and variables shocked for the transport sector
Reform Shock variable
Heavy vehicle pricing Total productivity in the Road Freight industry
Congestion pricing Labour productivity in the Trade, Road Passenger, Communications,Financial Services, Business Services, Public Service and Other Servicesindustries
Public transport franchising Efficiency of primary factors of production (labour, capital, land) in RoadPassenger and Rail Passenger industries
Source: PwC
Heavy vehicle pricingAs discussed in earlier sections of the report, the direct impact assumption used for heavy vehicle pricing is a 10per cent productivity gain, as per the ‘more fundamental road reform’ scenario in the PC’s 2006 report. This hasbeen applied to the Road Freight industry as an overall productivity shock, smoothed over a five year period toaccount for time taken for effects to phase in. This starts in 2021.
Congestion pricingAs discussed in section 3.5.2, the increased travel time costs due to congestion, as estimated by ACIL AllenConsulting,89 are used as an estimate of the burden of congestion. After consideration of congestion reductionbenefits achieved in three cities – London, Stockholm and Gothenburg – it has been assumed that congestioncharging in Australian capital cities could achieve a 15 per cent reduction in the burden of congestion.
The estimates were applied as a labour productivity gain to the Trade, Road Passenger, Communications,Financial Services, Business Services, Public Service and Other Services industries. These are sectors that haveroad use as a significant input in their production function. This implies that as a result of reduced congestion,workers are more efficient because they are able to get from A to B in a shorter period of time.
For the purposes of this modelling, it was assumed that the start date of the congestion component of a broaderroad user charging measure would be 2028. This date recognises the need to build upon lessons learned fromany changes in heavy vehicle charging and the need for extensive preparatory work ahead of any start date forcharging-based demand management. The estimated savings were phased in across two years from 2028. Twoyears was chosen so as to allow some time for drivers to change their patterns of road use.
89 ACIL Allen Consulting, Urban transport infrastructure: National economic analysis for Infrastructure Australia, December 2014.

Model assumptions CONFIDENTIAL
Infrastructure AustraliaPwC 42
The gain which builds up over two years from 2028 is a step-change in the labour productivity of the abovesectors. Our analysis period extends to 2040 but the ACIL Allen Consulting estimate of congestion is availableto 2031. To be conservative, we have not extrapolated ACIL Allen Consulting’s estimates to 2040 as this wouldrequire extending the assumptions that no new infrastructure projects emerge or that road users change theirbehaviours. The result is that the productivity savings continue but do not increase beyond 2029. To the extentthat congestion does worsen and if congestion pricing continues to address the problem beyond 2029 then theeconomic gains may be greater than is modelled here. 90
As noted in section 3.5.2, there are other costs not included in the base estimate of congestion that could bemitigated by congestion pricing. Overseas experience suggests congestion pricing not only reduces the cost ofdelay, it also improves travel time reliability. The reduction in delay and the improvement in reliability shouldalso offer some improvement in capital productivity (e.g. through fleet owners more confidently improvingdelivery schedules and therefore increasing the number of ‘runs’ from a particular vehicle). Given datalimitations, we have not sought to model this potential improvement. Again, this reflects a conservativeapproach to the modelling.
Public transport franchisingThe operating cost savings from franchising publicly operated passenger rail services were estimated to be20 per cent in the first round and 15 per cent in the second round. For the franchising of bus services, this wasestimated at 20 per cent in the first round, 10 per cent in the second round and 5 per cent in the third round.
Table 29 shows these assumed savings by year. Train franchises are assumed to have a 12 year long contractand bus franchises are assumed to have a 7 year long contract. It is assumed there is a staggered pattern to theimplementation of the reform, with the first train franchise in NSW assumed to start in 2018 and the first busfranchise in NSW assumed to start in 2017.91 Other states are then assumed to follow NSW.
These estimates were applied to the operating expenditure of the services to be franchised to provide operatingsavings.
The operating savings of franchising trains and bus services were used to shock the economy through increasedefficiency of primary factors of production in the Rail Passenger and Road Passenger industries respectively.
90 Intuitively, it is expected that, as cities grow, levels of congestion tend to increase.
91 Although we have not been able to confirm the fact, a research paper indicates the previous State Transit Authority franchising contract ran for seven yearsfrom 2005 to 2011. Assuming the current contract also runs for seven years, this would indicate it would end in 2017. See Rhonda Daniels, CameronGordon, Corinne Mulley and Nick Stevens, ‘Optimal contracting and incentives for public transport in Sydney: what has been learned from the SydneyMetro experience?’, Australasian Transport Research Forum 2011, page 13.
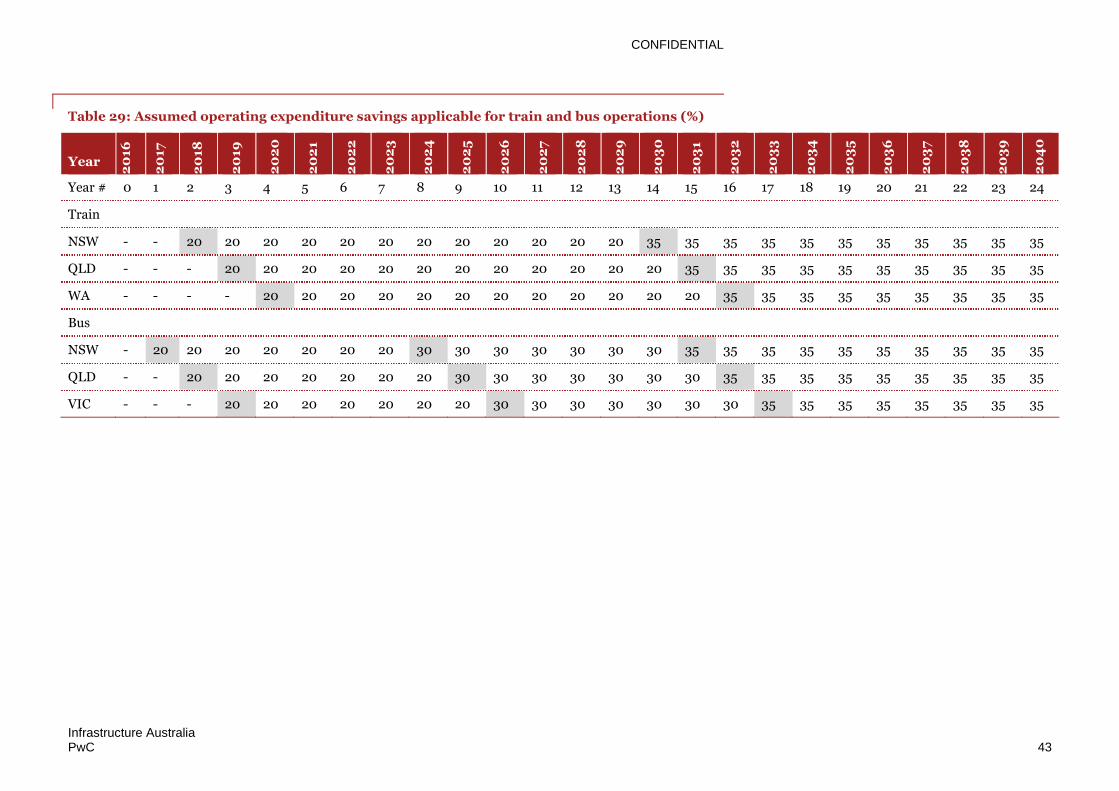
CONFIDENTIAL
Infrastructure AustraliaPwC 43
Table 29: Assumed operating expenditure savings applicable for train and bus operations (%)
Year
20
16
20
17
20
18
20
19
20
20
20
21
20
22
20
23
20
24
20
25
20
26
20
27
20
28
20
29
20
30
20
31
20
32
20
33
20
34
20
35
20
36
20
37
20
38
20
39
20
40
Year # 0 1 2 3 4 5 6 7 8 9 10 11 12 13 14 15 16 17 18 19 20 21 22 23 24
Train
NSW - - 20 20 20 20 20 20 20 20 20 20 20 20 35 35 35 35 35 35 35 35 35 35 35
QLD - - - 20 20 20 20 20 20 20 20 20 20 20 20 35 35 35 35 35 35 35 35 35 35
WA - - - - 20 20 20 20 20 20 20 20 20 20 20 20 35 35 35 35 35 35 35 35 35
Bus
NSW - 20 20 20 20 20 20 20 30 30 30 30 30 30 30 35 35 35 35 35 35 35 35 35 35
QLD - - 20 20 20 20 20 20 20 30 30 30 30 30 30 30 35 35 35 35 35 35 35 35 35
VIC - - - 20 20 20 20 20 20 20 30 30 30 30 30 30 30 35 35 35 35 35 35 35 35

CONFIDENTIAL
Infrastructure AustraliaPwC 44
5 Results
This chapter sets out the estimated economy-wide impacts of the proposed reforms. Results are estimated byapplying the direct impact assumptions (in Chapter 3) to a baseline CGE model (see assumptions in Chapter 4).These are presented as a deviation from baseline GDP and GSP levels. Results are presented as annual changesin 2031 and 2040.
5.1 Overall resultsThe package of reforms results in a GDP increase above baseline of $27.2 billion in 2031 and $39.0 billion in2040. On average, the package of reforms equates to increased GDP per capita of $893 or increased GDP perhousehold of $2,312 in 2031. These gains grow larger by 2040; GDP per capita is $1,151 higher while GDP perhousehold increases by $2,936.
Table 30: Impact of reforms on real GDP in 2031 and 2040
Indicator 2031 2040
GDP in baseline $2,766,837m $3,485,144m
Increase in GDP above baseline $27,169m $38,956m
Projected population 30.438m 33.854 m
Increase in GDP per capita above baseline $893 $1,151
Projected number of households 11.752m 13.267m
Increase in GDP per household above baseline $2,312 $2,936
Note:* Based on Australian Bureau of Statistics projections of population and numbers of households. Values are in 2015-16 dollars.
Source: Australian Bureau of Statistics, 3236.0 - Household and Family Projections, Australia, 2011 to 2036, Released 19 March 2015,Series III; Australian Bureau of Statistics, 3222.0 - Population projections, Australia, 2012 to 2101, Released November 2013; PwC IFEM,November 2015; PwC analysis.
Figure 3 shows the annual change in GDP relative to the baseline due to the reforms. This is in real 2015-16dollars (but undiscounted). The area under the line shows the cumulative GDP.
This shows there is a steady growth in GDP and household consumption until 2028. In 2028, there is asignificant increase primarily attributed to the transport sector reform of congestion pricing. This subsequentlyleads to an annual change of $39 billion by 2040.

Results CONFIDENTIAL
Infrastructure AustraliaPwC 45
Figure 3: Incremental change in real GDP
Note: Values are in 2015-16 dollars.
Source: PwC analysis.
5.2 State and territory resultsAs a results of the reforms modelled here, all jurisdictions are expected to experience growth in GSP above thebaseline.
On a state by state basis, Western Australia receives the greatest increase in GSP of $13.9 billion in 2040. NewSouth Wales and Queensland are the next highest beneficiaries with GSP growing in 2040 by $8.9 and $8.8billion respectively.
Table 31: Impacts on GSP/GDP in 2031 and 2040
GSP/GDP ($m, p.a.)
Year 2031 2040
NSW 7,240 8,860
VIC 4,445 4,565
QLD 6,048 8,750
SA 1,379 1,789
WA 7,182 13,914
TAS 327 404
NT 281 435
ACT 266 241
Australia 27,169 38,956
Note: Values are in 2015-16 dollars.
Source: PwC analysis.
0
9
18
27
36
4520
16
20
17
20
18
20
19
20
20
20
21
20
22
20
23
20
24
20
25
20
26
20
27
20
28
20
29
20
30
20
31
20
32
20
33
20
34
20
35
20
36
20
37
20
38
20
39
20
40
Imp
act
($b
)

Results CONFIDENTIAL
Infrastructure AustraliaPwC 46
5.3 Sectoral resultsAcross the individual sectors, the reforms made in the transport sector have the most significant impact on GDPand household consumption.
5.3.1 EnergyThe privatisation and price deregulation reforms in the energy sector are estimated to generate additional GDPper annum of $1.7 billion in 2031, and $2.3 billion in 2040 – this is shown in Table 32. As the energy sectoroperates more at a national level than either the transport or water sector (e.g. through the National ElectricityMarket) jurisdiction-specific impacts have not been presented here.
Table 32: Impacts on GDP from energy reforms in 2031 and 2040
GDP ($m, p.a.)
Year 2031 2040
Australia 1,734 2,279
Note: Values are in 2015-16 dollars.
Source: PwC analysis
5.3.2 TelecommunicationsOf all the reforms estimated, the privatisation of the NBN has the smallest impact. This can be explained by theassumption applied which is that there is a five per cent efficiency gain applied to all primary factor input costs.The privatisation of the NBN is estimated to generate GDP per annum of $119 million in 2031, and $126 millionin 2040.
As the telecommunications sector operates more at a national level than either the transport or water sector,jurisdiction-specific impacts have not been presented.
Table 33: Impacts on GDP from NBN reforms in 2031 and 2040
GDP ($m, p.a.)
Year 2031 2040
Australia 119 126
Note: Values are in 2015-16 dollars.
Source: PwC analysis.
5.3.3 WaterThe privatisation of the water sector results in an estimated overall increase in GDP per annum of $1.5 billionby 2031, and $1.7 billion by 2040.
Broken down into individual states, Victoria has the largest increase in GSP per annum in 2031 of $529 million,rising to $593 million in 2040. This is partially due to the metropolitan water companies that are subject to thereform being a larger share of the Victorian economy relative to other states. Queensland and New South Walesare other large beneficiaries of the reform.
From Table 34, it is evident that ACT GSP declines relative to the baseline by $24 million per annum in 2031,and $57 million per annum in 2040. The ACT is subject to this reform and its water supply sector receiveddirect benefit from the efficiency gains assumed. However these are outweighed by resource allocations intoother jurisdictions that receive larger gains. If the ACT impact were modelled on its own, it is likely there wouldbe gains to the ACT economy in net terms; it is only due to the combined nature of the analysis that nation-widereforms to the water sector appear to show a net negative result for the ACT.

Results CONFIDENTIAL
Infrastructure AustraliaPwC 47
Table 34: Impacts on GSP/GDP from water reforms in 2031 and 2040
GSP/GDP ($m, p.a.)
Year 2031 2040
NSW 371 343
VIC 529 593
QLD 483 634
SA 18 3
WA 109 122
TAS 10 11
NT 7 6
ACT -24 -57
Australia 1,504 1,654
Note: Values are in 2015-16 dollars.
Source: PwC analysis
5.3.4 TransportOverall, the suite of transport reforms increases GDP per annum by $23.8 billion in 2031 and $34.8 billionin 2040.
Through the various transport reforms, Western Australia generates the highest additional GSP per annum in2040, at $12.2 billion. This is due to Western Australia benefitting from all of the reforms, i.e. the franchising ofrail, the heavy vehicle pricing reforms and the impact from congestion pricing. The congestion costs are a largeelement of this impact, which is driven by ACIL Allen Consulting’s estimates of congestion costs. This showedthat in 2031, congestion in Western Australia is projected to be more costly than any other state or territory inAustralia. As a consequence, under those assumptions, Western Australia can be seen to be a large beneficiaryof congestion pricing.
Conversely, Tasmania has the lowest estimated increase in GSP from the transport reforms ($229 million in2031 and $278 million in 2040 per annum). Tasmania receives direct benefits from the heavy vehicle pricingreform.

Results CONFIDENTIAL
Infrastructure AustraliaPwC 48
Table 35: Impacts on GSP/GDP from transport reforms in 2031 and 2040
GSP/GDP ($m, p.a.)
Year 2031 2040
NSW 6,843 8,608
VIC 4,272 4,602
QLD 4,439 6,530
SA 1,437 1,909
WA 5,989 12,187
TAS 229 278
NT 287 448
ACT 269 271
Australia 23,764 34,834
Note: Values are in 2015-16 dollars.
Source: PwC analysis.

Infrastructure AustraliaPwC 49
Appendices
Appendix A Overview of energy, telecommunication, water and publictransport sector entities 50
Appendix B Experience in the UK water sector 58
Appendix C VURM Framework 60
Appendix D IFEM framework 61

Infrastructure AustraliaPwC 50
Appendix A Overview of energy,telecommunication, water andpublic transport sector entities
EnergyThe following tables summarise the generation and network businesses in Australia. In the case of generationbusinesses, there are many private operators, so these have not been specified here. As there are fewer networkbusinesses, all have been listed in Table 38.
Table 36: Government-owned generators
Entity Power stations LocationGovernmentownership
Capacity(MW) Fuel type
StanwellCorporation
Stanwell; Tarong; Tarong North;Barron Gorge; Kareeya; Mackay
QLD 100% 3,139 Coal,hydro,multi-fuel
CS Energy Callide; Kogan Creek; Wivenhoe QLD 100% 2,000 Coal,hydro
CS Energy/InterGen
Callide C QLD 50% 900 Coal
DeltaElectricity
Vales Point NSW 100% 1,320 Coal
SnowyHydro
Tumut; Upper Tumut; Colongra;Blowering; Guthega
NSW
100%*
3,288 Hydro, gas
Murray; Laverton North; ValleyPower
VIC 2,082 Hydro, gas
Pt Stanvac; Angaston SA 114 Diesel
HydroTasmania
Gordon; Poatina; Reece; JohnButters; Tamar Valley; Bell Bay;others
TAS 100% 2,283 Hydro, gas
Woolnorth; Musselroe TAS 25% 308 Wind
Synergy Collie Power Station, Muja C & D,Kwinana C, Cockburn Power Station,Kwinana Gas Turbine, Mungurra GasTurbine Power Station, Pinjar C&D,Worsley Alumina Power Plant,Geraldton Power Station (Mungarra),Kwinana HEGT, Pinjar A&B, WestKalgoorlie Power Plant
WA 100% 2,2,815 Coal, gas,wind,solar
Note: Ergon Energy (a Queensland Government distribution business) and Essential Energy (a New South Wales distribution business) alsohave some smaller electricity generation assets, totalling 84 MW in capacity, and have not been included here. * Snowy Hydro isgovernment-owned but shared between the Victorian (29%), New South Wales (58%) and Commonwealth (13%) governments. Althoughbeing included here, Delta Energy has since been sold by the NSW Government to Sunset Power International.
Source: Australian Energy Regulator, ‘State of the Energy Market 2015’, 2015; www.synergy.net.au/our-energy/electricity/electricity-generation/power-stations, Accessed 19 January 2016; PwC analysis.
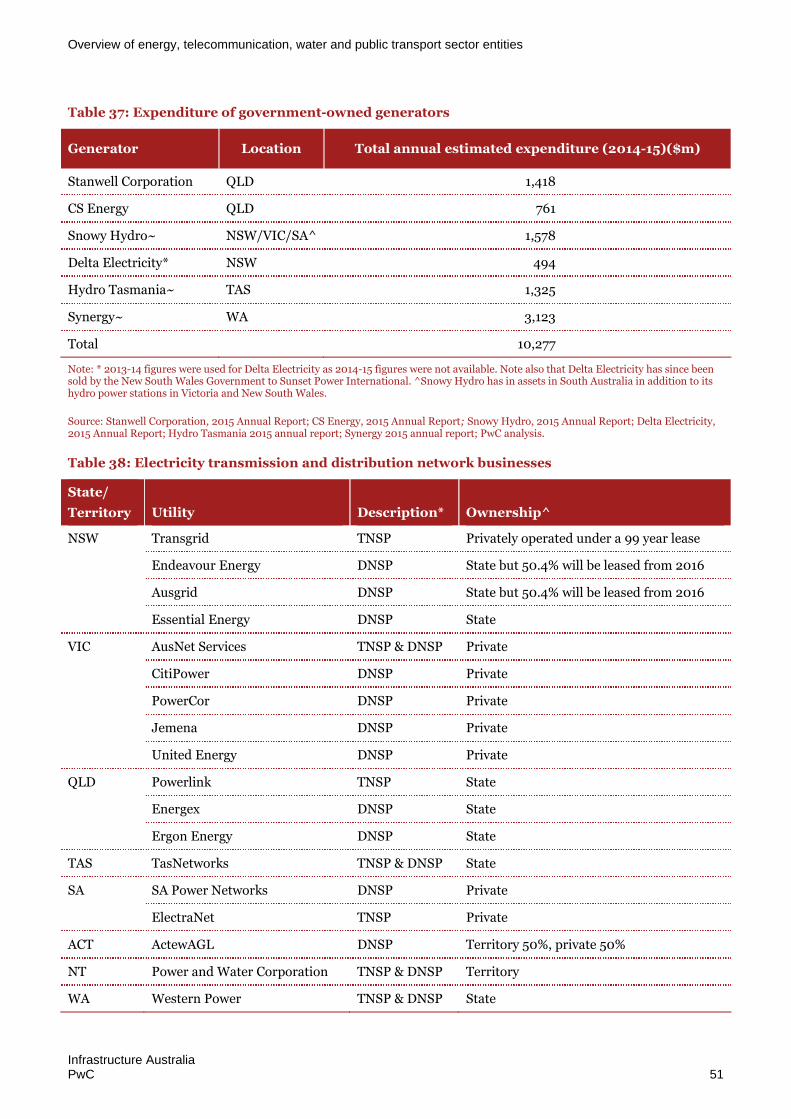
Overview of energy, telecommunication, water and public transport sector entities
Infrastructure AustraliaPwC 51
Table 37: Expenditure of government-owned generators
Generator Location Total annual estimated expenditure (2014-15)($m)
Stanwell Corporation QLD 1,418
CS Energy QLD 761
Snowy Hydro~ NSW/VIC/SA^ 1,578
Delta Electricity* NSW 494
Hydro Tasmania~ TAS 1,325
Synergy~ WA 3,123
Total 10,277
Note: * 2013-14 figures were used for Delta Electricity as 2014-15 figures were not available. Note also that Delta Electricity has since beensold by the New South Wales Government to Sunset Power International. ^Snowy Hydro has in assets in South Australia in addition to itshydro power stations in Victoria and New South Wales.
Source: Stanwell Corporation, 2015 Annual Report; CS Energy, 2015 Annual Report; Snowy Hydro, 2015 Annual Report; Delta Electricity,2015 Annual Report; Hydro Tasmania 2015 annual report; Synergy 2015 annual report; PwC analysis.
Table 38: Electricity transmission and distribution network businesses
State/
Territory Utility Description* Ownership^
NSW Transgrid TNSP Privately operated under a 99 year lease
Endeavour Energy DNSP State but 50.4% will be leased from 2016
Ausgrid DNSP State but 50.4% will be leased from 2016
Essential Energy DNSP State
VIC AusNet Services TNSP & DNSP Private
CitiPower DNSP Private
PowerCor DNSP Private
Jemena DNSP Private
United Energy DNSP Private
QLD Powerlink TNSP State
Energex DNSP State
Ergon Energy DNSP State
TAS TasNetworks TNSP & DNSP State
SA SA Power Networks DNSP Private
ElectraNet TNSP Private
ACT ActewAGL DNSP Territory 50%, private 50%
NT Power and Water Corporation TNSP & DNSP Territory
WA Western Power TNSP & DNSP State
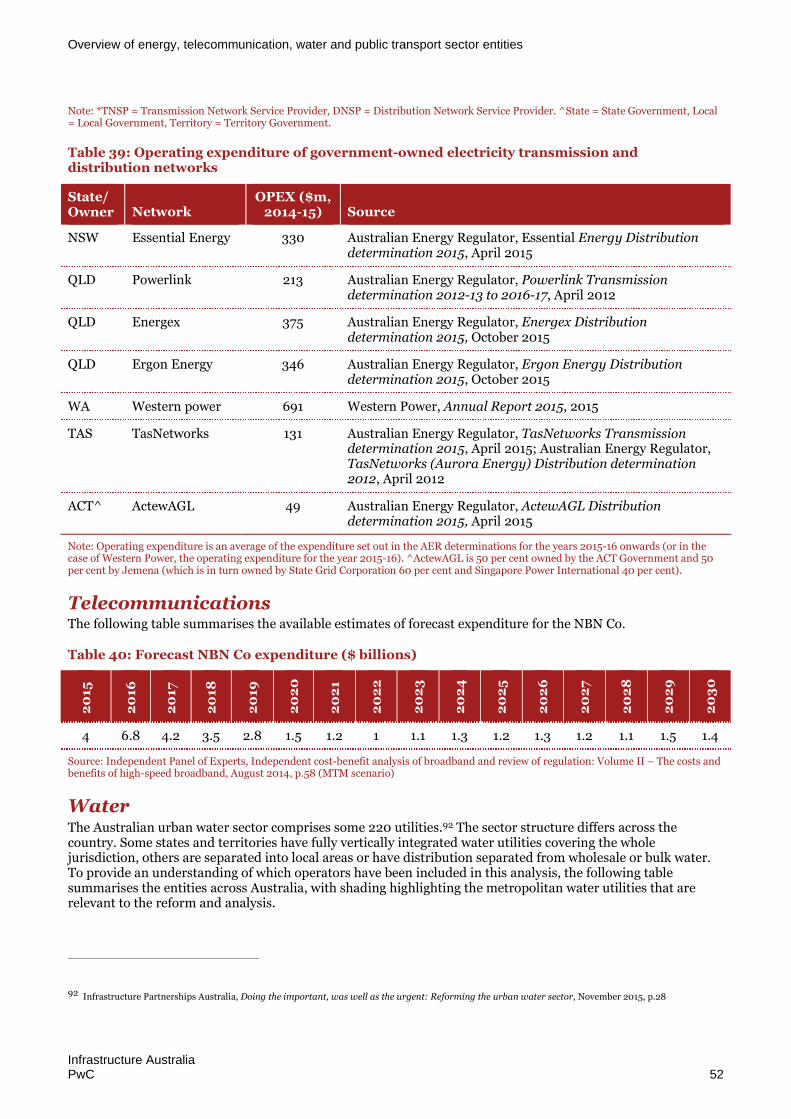
Overview of energy, telecommunication, water and public transport sector entities
Infrastructure AustraliaPwC 52
Note: *TNSP = Transmission Network Service Provider, DNSP = Distribution Network Service Provider. ^State = State Government, Local= Local Government, Territory = Territory Government.
Table 39: Operating expenditure of government-owned electricity transmission anddistribution networks
State/Owner Network
OPEX ($m,2014-15) Source
NSW Essential Energy 330 Australian Energy Regulator, Essential Energy Distributiondetermination 2015, April 2015
QLD Powerlink 213 Australian Energy Regulator, Powerlink Transmissiondetermination 2012-13 to 2016-17, April 2012
QLD Energex 375 Australian Energy Regulator, Energex Distributiondetermination 2015, October 2015
QLD Ergon Energy 346 Australian Energy Regulator, Ergon Energy Distributiondetermination 2015, October 2015
WA Western power 691 Western Power, Annual Report 2015, 2015
TAS TasNetworks 131 Australian Energy Regulator, TasNetworks Transmissiondetermination 2015, April 2015; Australian Energy Regulator,TasNetworks (Aurora Energy) Distribution determination2012, April 2012
ACT^ ActewAGL 49 Australian Energy Regulator, ActewAGL Distributiondetermination 2015, April 2015
Note: Operating expenditure is an average of the expenditure set out in the AER determinations for the years 2015-16 onwards (or in thecase of Western Power, the operating expenditure for the year 2015-16). ^ActewAGL is 50 per cent owned by the ACT Government and 50per cent by Jemena (which is in turn owned by State Grid Corporation 60 per cent and Singapore Power International 40 per cent).
TelecommunicationsThe following table summarises the available estimates of forecast expenditure for the NBN Co.
Table 40: Forecast NBN Co expenditure ($ billions)
20
15
20
16
20
17
20
18
20
19
20
20
20
21
20
22
20
23
20
24
20
25
20
26
20
27
20
28
20
29
20
30
4 6.8 4.2 3.5 2.8 1.5 1.2 1 1.1 1.3 1.2 1.3 1.2 1.1 1.5 1.4
Source: Independent Panel of Experts, Independent cost-benefit analysis of broadband and review of regulation: Volume II – The costs andbenefits of high-speed broadband, August 2014, p.58 (MTM scenario)
WaterThe Australian urban water sector comprises some 220 utilities.92 The sector structure differs across thecountry. Some states and territories have fully vertically integrated water utilities covering the wholejurisdiction, others are separated into local areas or have distribution separated from wholesale or bulk water.To provide an understanding of which operators have been included in this analysis, the following tablesummarises the entities across Australia, with shading highlighting the metropolitan water utilities that arerelevant to the reform and analysis.
92 Infrastructure Partnerships Australia, Doing the important, was well as the urgent: Reforming the urban water sector, November 2015, p.28
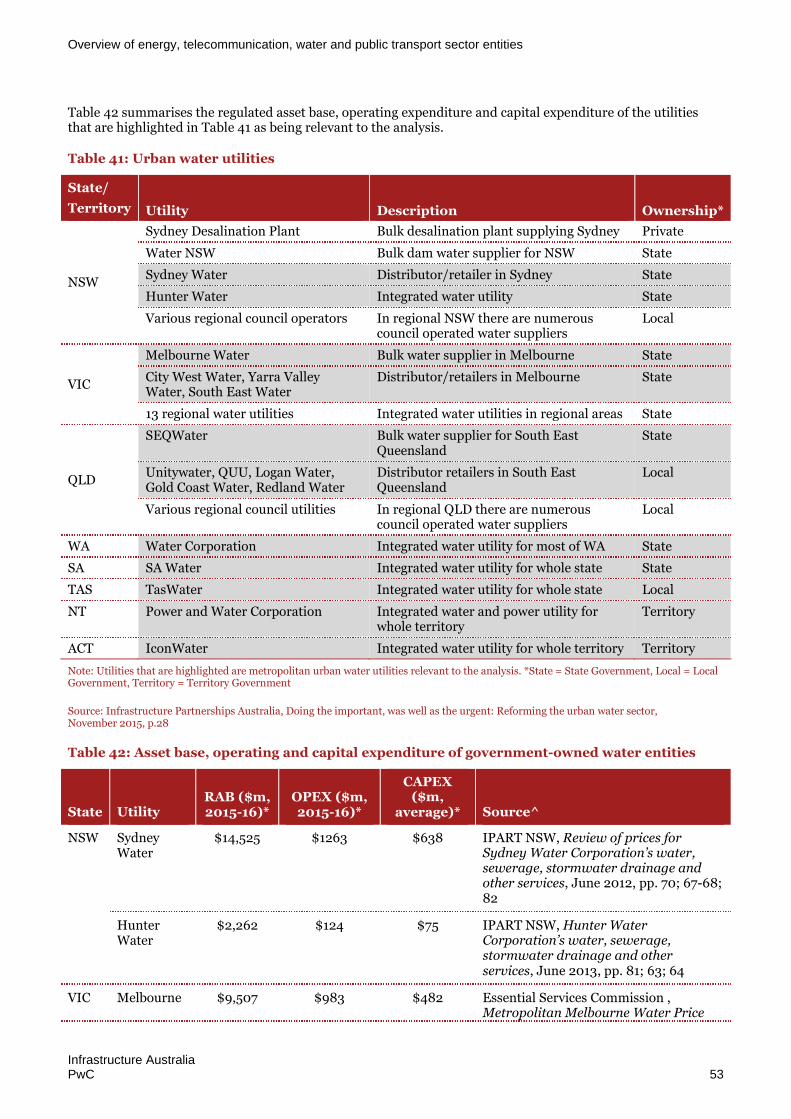
Overview of energy, telecommunication, water and public transport sector entities
Infrastructure AustraliaPwC 53
Table 42 summarises the regulated asset base, operating expenditure and capital expenditure of the utilitiesthat are highlighted in Table 41 as being relevant to the analysis.
Table 41: Urban water utilities
State/
Territory Utility Description Ownership*
NSW
Sydney Desalination Plant Bulk desalination plant supplying Sydney Private
Water NSW Bulk dam water supplier for NSW State
Sydney Water Distributor/retailer in Sydney State
Hunter Water Integrated water utility State
Various regional council operators In regional NSW there are numerouscouncil operated water suppliers
Local
VIC
Melbourne Water Bulk water supplier in Melbourne State
City West Water, Yarra ValleyWater, South East Water
Distributor/retailers in Melbourne State
13 regional water utilities Integrated water utilities in regional areas State
QLD
SEQWater Bulk water supplier for South EastQueensland
State
Unitywater, QUU, Logan Water,Gold Coast Water, Redland Water
Distributor retailers in South EastQueensland
Local
Various regional council utilities In regional QLD there are numerouscouncil operated water suppliers
Local
WA Water Corporation Integrated water utility for most of WA State
SA SA Water Integrated water utility for whole state State
TAS TasWater Integrated water utility for whole state Local
NT Power and Water Corporation Integrated water and power utility forwhole territory
Territory
ACT IconWater Integrated water utility for whole territory Territory
Note: Utilities that are highlighted are metropolitan urban water utilities relevant to the analysis. *State = State Government, Local = LocalGovernment, Territory = Territory Government
Source: Infrastructure Partnerships Australia, Doing the important, was well as the urgent: Reforming the urban water sector,November 2015, p.28
Table 42: Asset base, operating and capital expenditure of government-owned water entities
State UtilityRAB ($m,2015-16)*
OPEX ($m,2015-16)*
CAPEX($m,
average)* Source^
NSW SydneyWater
$14,525 $1263 $638 IPART NSW, Review of prices forSydney Water Corporation’s water,sewerage, stormwater drainage andother services, June 2012, pp. 70; 67-68;82
HunterWater
$2,262 $124 $75 IPART NSW, Hunter WaterCorporation’s water, sewerage,stormwater drainage and otherservices, June 2013, pp. 81; 63; 64
VIC Melbourne $9,507 $983 $482 Essential Services Commission ,Metropolitan Melbourne Water Price
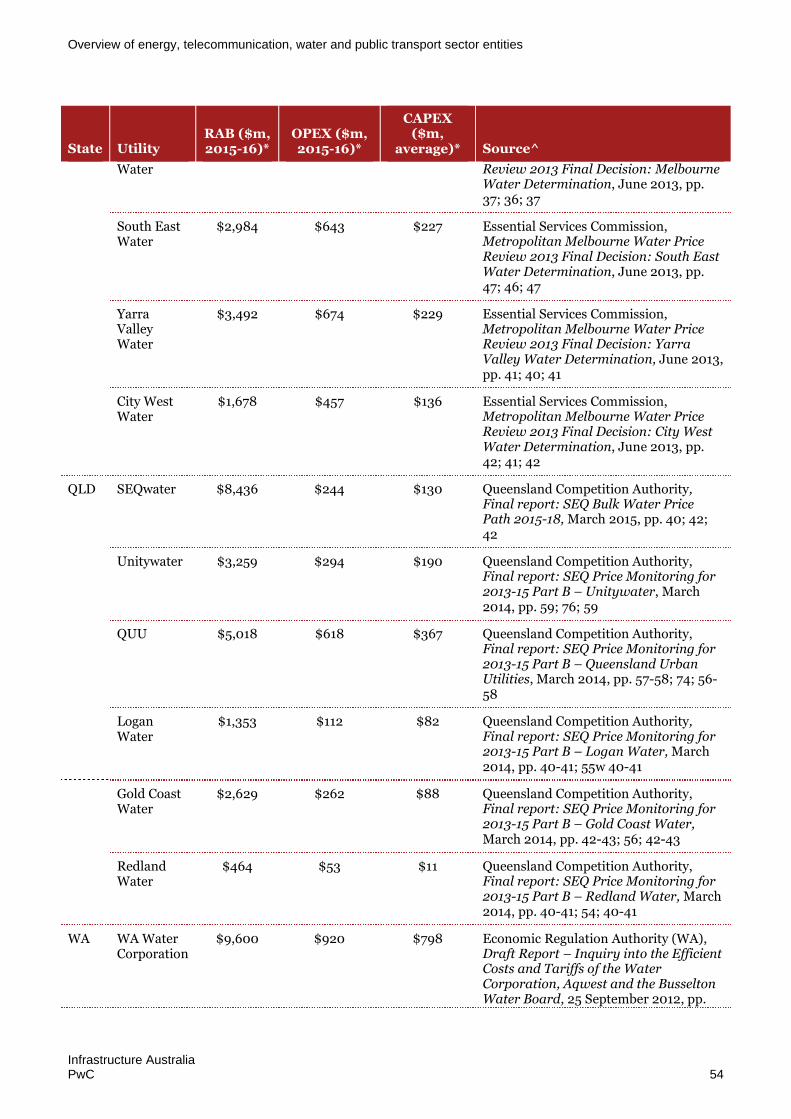
Overview of energy, telecommunication, water and public transport sector entities
Infrastructure AustraliaPwC 54
State UtilityRAB ($m,2015-16)*
OPEX ($m,2015-16)*
CAPEX($m,
average)* Source^
Water Review 2013 Final Decision: MelbourneWater Determination, June 2013, pp.37; 36; 37
South EastWater
$2,984 $643 $227 Essential Services Commission,Metropolitan Melbourne Water PriceReview 2013 Final Decision: South EastWater Determination, June 2013, pp.47; 46; 47
YarraValleyWater
$3,492 $674 $229 Essential Services Commission,Metropolitan Melbourne Water PriceReview 2013 Final Decision: YarraValley Water Determination, June 2013,pp. 41; 40; 41
City WestWater
$1,678 $457 $136 Essential Services Commission,Metropolitan Melbourne Water PriceReview 2013 Final Decision: City WestWater Determination, June 2013, pp.42; 41; 42
QLD SEQwater $8,436 $244 $130 Queensland Competition Authority,Final report: SEQ Bulk Water PricePath 2015-18, March 2015, pp. 40; 42;42
Unitywater $3,259 $294 $190 Queensland Competition Authority,Final report: SEQ Price Monitoring for2013-15 Part B – Unitywater, March2014, pp. 59; 76; 59
QUU $5,018 $618 $367 Queensland Competition Authority,Final report: SEQ Price Monitoring for2013-15 Part B – Queensland UrbanUtilities, March 2014, pp. 57-58; 74; 56-58
LoganWater
$1,353 $112 $82 Queensland Competition Authority,Final report: SEQ Price Monitoring for2013-15 Part B – Logan Water, March2014, pp. 40-41; 55w 40-41
Gold CoastWater
$2,629 $262 $88 Queensland Competition Authority,Final report: SEQ Price Monitoring for2013-15 Part B – Gold Coast Water,March 2014, pp. 42-43; 56; 42-43
RedlandWater
$464 $53 $11 Queensland Competition Authority,Final report: SEQ Price Monitoring for2013-15 Part B – Redland Water, March2014, pp. 40-41; 54; 40-41
WA WA WaterCorporation
$9,600 $920 $798 Economic Regulation Authority (WA),Draft Report – Inquiry into the EfficientCosts and Tariffs of the WaterCorporation, Aqwest and the BusseltonWater Board, 25 September 2012, pp.

Overview of energy, telecommunication, water and public transport sector entities
Infrastructure AustraliaPwC 55
State UtilityRAB ($m,2015-16)*
OPEX ($m,2015-16)*
CAPEX($m,
average)* Source^
30; 38; 35
SA SA Water $11,350 $416 $335 Essential Services Commission of SouthAustralia, SA Water’s Water andSewerage Revenues 2013/14 – 2015/16;Final Determination, May 2013, pp. 155;133; 158
TAS TasWater $3,021 $150 $99 Office of the Tasmanian EconomicRegulator, 2015 Price DeterminationInvestigation – Regulated Water andSewerage Services in Tasmania; FinalReport, April 2015, pp. A-1; 48; A-1
NT Power andWaterCorporation
Not public Not public Not public Pricing process conducted internally byMinister. RAB and OPEX are not publicaccording to the Utilities Commission.
ACT Icon Water $2,260 $174 $89 Industry Panel, Review of theIndependent Competition andRegulatory Commission’s 2013 PriceDirection for Regulated Water andSewerage Services in the ACT; FinalReport, April 2015, pp. 45; 83
Note: *Dollars may not completely align to analysis in previous sections of the report as some figures have required adjustment to 2015-16dollars. ^Semicolon is used to separate page references for RAB, OPEX and CAPEX respectively.

Overview of energy, telecommunication, water and public transport sector entities
Infrastructure AustraliaPwC 56
Public transportTo provide an understanding of where the potential benefits from franchising public transport operations maylie, an overview of the public transport sector operations is described below in Table 43.
Table 44 provides a summary of the estimated operating expenditure of the public transport operationsincluded in the analysis.
Table 43: Status of public transport operations across metropolitan centres
State Rail Bus Light Rail Ferry
NSW Sydney Trains Sydney TransitAuthority
ALTRAC Light Rail Harbour City Ferries &8 other operators# +Stockton Ferry inNewcastleCountry Link 25+ bus operators*
VIC Metro Trains MelbourneMetropolitan BusFranchise (Transdev)
Yarra Trams n/a
V/Line 25+ bus operators^
QLD Queensland Rail Brisbane Transport GoldLinQ (Gold Coast
Light Rail)
Various operators~
Various operators
WA Transperth 3 bus operators n/a Captain Cook Cruises
TransWA
SA Adelaide Metro 4 bus operators Adelaide Metro n/a
TAS n/a MetroTas n/a n/a
NT n/a Various operators n/a n/a
ACT n/a ACTION n/a n/a
Legend:
Currently operated by private sector under competitive tendering
Service is assumed to benefit from competitive tendering
Notes: * such as Busways, ComfortDelgro, Cabcharge, Westbus. ^Currently run by private operators such as Dyson, Grenda, CDC, Venturabut is not competitively tendered. #Including Manly Fast Ferries and Bass & Flinders Cruises. ~ such as TransdevTSL (CityCat & City Ferry)
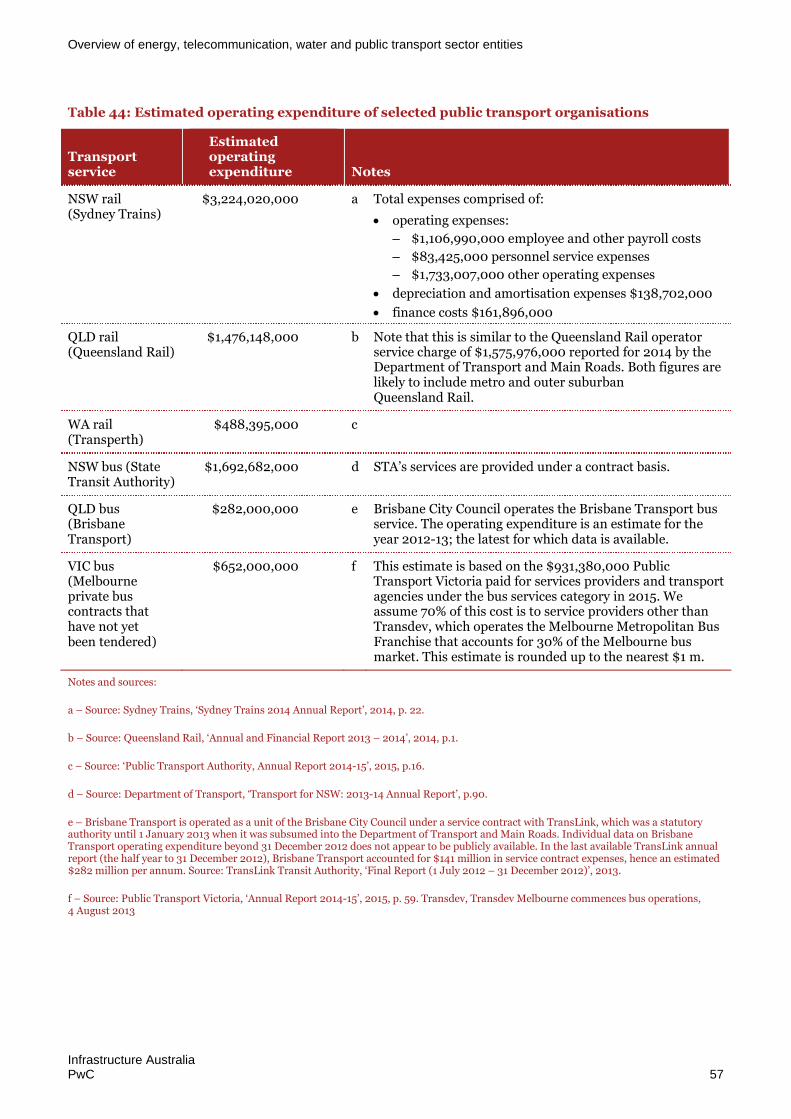
Overview of energy, telecommunication, water and public transport sector entities
Infrastructure AustraliaPwC 57
Table 44: Estimated operating expenditure of selected public transport organisations
Transportservice
Estimatedoperatingexpenditure Notes
NSW rail(Sydney Trains)
$3,224,020,000 a Total expenses comprised of:
operating expenses:
– $1,106,990,000 employee and other payroll costs
– $83,425,000 personnel service expenses
– $1,733,007,000 other operating expenses
depreciation and amortisation expenses $138,702,000
finance costs $161,896,000
QLD rail(Queensland Rail)
$1,476,148,000 b Note that this is similar to the Queensland Rail operatorservice charge of $1,575,976,000 reported for 2014 by theDepartment of Transport and Main Roads. Both figures arelikely to include metro and outer suburbanQueensland Rail.
WA rail(Transperth)
$488,395,000 c
NSW bus (StateTransit Authority)
$1,692,682,000 d STA’s services are provided under a contract basis.
QLD bus(BrisbaneTransport)
$282,000,000 e Brisbane City Council operates the Brisbane Transport busservice. The operating expenditure is an estimate for theyear 2012-13; the latest for which data is available.
VIC bus(Melbourneprivate buscontracts thathave not yetbeen tendered)
$652,000,000 f This estimate is based on the $931,380,000 PublicTransport Victoria paid for services providers and transportagencies under the bus services category in 2015. Weassume 70% of this cost is to service providers other thanTransdev, which operates the Melbourne Metropolitan BusFranchise that accounts for 30% of the Melbourne busmarket. This estimate is rounded up to the nearest $1 m.
Notes and sources:
a – Source: Sydney Trains, ‘Sydney Trains 2014 Annual Report’, 2014, p. 22.
b – Source: Queensland Rail, ‘Annual and Financial Report 2013 – 2014’, 2014, p.1.
c – Source: ‘Public Transport Authority, Annual Report 2014-15’, 2015, p.16.
d – Source: Department of Transport, ‘Transport for NSW: 2013-14 Annual Report’, p.90.
e – Brisbane Transport is operated as a unit of the Brisbane City Council under a service contract with TransLink, which was a statutoryauthority until 1 January 2013 when it was subsumed into the Department of Transport and Main Roads. Individual data on BrisbaneTransport operating expenditure beyond 31 December 2012 does not appear to be publicly available. In the last available TransLink annualreport (the half year to 31 December 2012), Brisbane Transport accounted for $141 million in service contract expenses, hence an estimated$282 million per annum. Source: TransLink Transit Authority, ‘Final Report (1 July 2012 – 31 December 2012)’, 2013.
f – Source: Public Transport Victoria, ‘Annual Report 2014-15’, 2015, p. 59. Transdev, Transdev Melbourne commences bus operations,4 August 2013
Infrastructure AustraliaPwC 58
Appendix B Experience in theUK water sector
One international experience that may be relevant to privatisation of metropolitan water utilities in Australia isthe UK where the water sector was privatised by the government in 1989 to create 10 listed water and sewerageoperators.93 In the late 1980s the water sector was under public ownership and suffering from underinvestment. Aging infrastructure was contributing to poor-quality drinking water, pollution and failing assets.94 With the government owner unwilling to borrow funds to invest in upgrading the water assets, the decisionwas made by the UK Government to sell the assets. At the same time, new economic regulations wereintroduced to oversee the monopoly service providers to ensure prudent expenditure was allowed and qualitystandards were met. Once privatised, the water companies raised funds and invested £50 billion between 1990and 2005. While customer costs increased in the first 10 years to pay for the investment, water bills have beenrelatively flat in real terms since 2000. 95
The summary achievements in the UK water sector include:
Large savings have been made in general and support expenditure, with other savings being madein materials and consumables. Increased energy efficiency has mitigated the impact of increasedpower prices. 96
Operating expenditure in 2003-04 was broadly the same as in 1998-99 while water and sewerage companieshad improved their drinking water quality, environmental performance and customer service. 97
Adjusted for exceptional items and ‘atypicals’, operating expenditure in 2003-2004 was approximately 15per cent lower than in 1993-1994 showing efficiency gains were steadily achieved over the decade followingthe privatisation and regulation reforms. 98
From 1989 to 2010 water bills were 30 percent lower than they would have been without regulation.99
It is tempting to contrast the privatised UK water with Australia’s publicly-owned water sector, where waterprices have tracked above inflation since about 2005-2006 – see Figure 4– and suggest that the gainsexperienced there may be expected in Australia. However it is likely that with the millennium drought in the2000s, the investment in drought-proofing is what has driven much of these price increases, as well as a generalmove towards more cost reflective user charging by most metropolitan water utilities.
93 PwC UK, The role and impact of specialist investors in UK infrastructure, September 2015.
94 Office of Water Services, The development of the water industry in England and Wales, 2006, pp. 22-23
95 Office of Water Services, Future water and sewerage charges 2010-15: Final determinations, p.28
96 Office of Water Services, The development of the water industry in England and Wales, 2006, p.72
97 Office of Water Services, The development of the water industry in England and Wales, 2006, p.71
98 Office of Water Services, The development of the water industry in England and Wales, 2006, p.73
99 Ofwat’s response to the Independent Review of Charging Household Water and Sewerage Services, 2011. Cited in Peter Martin, 24 Years Later: A Look atWater Privatisation in England and Wales, 2013
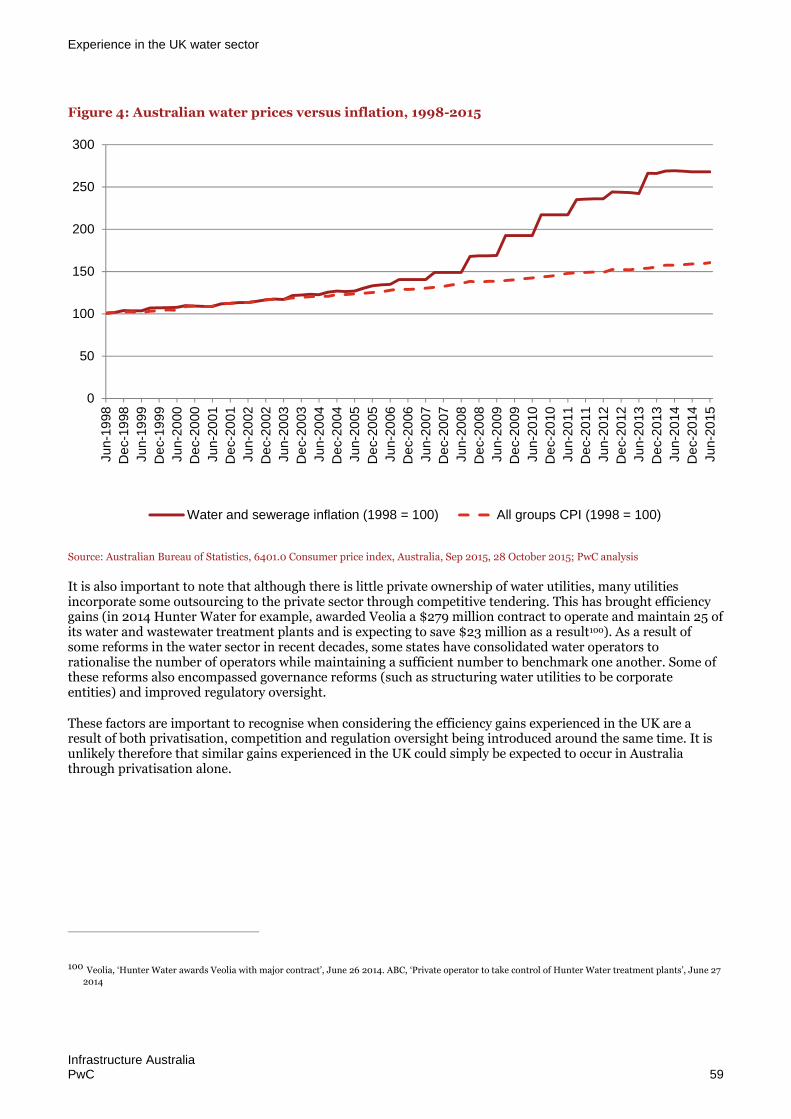
Experience in the UK water sector
Infrastructure AustraliaPwC 59
Figure 4: Australian water prices versus inflation, 1998-2015
Source: Australian Bureau of Statistics, 6401.0 Consumer price index, Australia, Sep 2015, 28 October 2015; PwC analysis
It is also important to note that although there is little private ownership of water utilities, many utilitiesincorporate some outsourcing to the private sector through competitive tendering. This has brought efficiencygains (in 2014 Hunter Water for example, awarded Veolia a $279 million contract to operate and maintain 25 ofits water and wastewater treatment plants and is expecting to save $23 million as a result100). As a result ofsome reforms in the water sector in recent decades, some states have consolidated water operators torationalise the number of operators while maintaining a sufficient number to benchmark one another. Some ofthese reforms also encompassed governance reforms (such as structuring water utilities to be corporateentities) and improved regulatory oversight.
These factors are important to recognise when considering the efficiency gains experienced in the UK are aresult of both privatisation, competition and regulation oversight being introduced around the same time. It isunlikely therefore that similar gains experienced in the UK could simply be expected to occur in Australiathrough privatisation alone.
100 Veolia, ‘Hunter Water awards Veolia with major contract’, June 26 2014. ABC, ‘Private operator to take control of Hunter Water treatment plants’, June 272014
0
50
100
150
200
250
300
Jun-1
998
De
c-19
98
Jun-1
999
De
c-19
99
Jun-2
000
De
c-20
00
Jun-2
001
De
c-20
01
Jun-2
002
De
c-20
02
Jun-2
003
De
c-20
03
Jun-2
004
De
c-20
04
Jun-2
005
De
c-20
05
Jun-2
006
De
c-20
06
Jun-2
007
De
c-20
07
Jun-2
008
De
c-20
08
Jun-2
009
De
c-20
09
Jun-2
010
De
c-20
10
Jun-2
011
De
c-20
11
Jun-2
012
De
c-20
12
Jun-2
013
De
c-20
13
Jun-2
014
De
c-20
14
Jun-2
015
Water and sewerage inflation (1998 = 100) All groups CPI (1998 = 100)

Infrastructure AustraliaPwC 60
Appendix C VURM Framework
The Victoria University Regional Model (VURM) is a multi-regional Computable General Equilibrium (CGE)model of Australia’s eight regional economies — the six States and two Territories. Each region is modelled asan economy in its own right, with region-specific prices, region-specific consumers, region-specific industries,and so on. There are four types of agent: industries, households, governments and foreigners.
Based on the model’s current database (which was recently updated, see below), in each region 79 industriesproduce 83 commodities. The database can be disaggregated to more industry/commodity pairs if required andeach industry can produce a variety of commodities. Capital is industry and region specific. In each region,there is a single household sector and a regional government. There is also a Federal government. Finally, thereare foreigners, whose behaviour is summarised by demand curves for regional international exports and supplycurves for regional international imports.
In recursive-dynamic mode, VURM produces sequences of annual solutions connected by dynamicrelationships such as physical capital accumulation. Policy analysis with VURM conducted in a dynamic settinginvolves the comparison of two alternative sequences of solutions, one generated without the policy change andthe other with the policy change or ‘shock’ in place. The first sequence, called the base case projection, serves asa control path from which deviations are measured to assess the effects of the policy shock.
VURM is a flexible model and can be easily modified to meet suit particular tasks. Its origins lie with theMonash Multi Regional Forecasting (MMRF) model.
The model comprises: a CGE core incorporating input-output production and consumption relationships,foreign accounts and the modelling of product and factor markets and a number of satellite modules providingmore detail on the model’s government finance accounts, household income accounts, population anddemography, and energy and greenhouse gas emissions.
Each of the ‘satellite’ modules is linked into other parts of the model, so that, projections from the model corecan feed through into relevant parts of a module and changes in a module can feed back into the model core.
The model also includes extensions to the core model theory dealing with links between demography andgovernment consumption, the supply and interstate mobility of labour, and export supplies.
Full electronic documentation of the VURM is available at: http://www.copsmodels.com/elecpapr/g-254.htm

Infrastructure AustraliaPwC 61
Appendix D IFEM framework
PwC’s Intergenerational Fiscal and Economic Model (IFEM) framework incorporates macroeconomicmodelling, Commonwealth and State fiscal modelling and household modelling into one integrated framework.It includes individual projections through 2050 of each State and Commonwealth expenditure and revenuehead. The above diagram summarises each of the components within IFEM.
The IFEM output provides a credible and consistent long run macroeconomic baseline in a CGE analysis andoutputs are designed to form inputs into economy-wide modelling conducted in a CGE model. The IFEM hasbeen used in this analysis providing the economic growth assumptions for the baseline to 2040.
The macroeconomic module provides aconsistent long run projection of state andnational GSP/GDP, developed using aframework consistent with CommonwealthTreasury Intergeneration Report(IGR) framework.
This sets the backbone for fiscal and economicimpact analysis.
The demographic and household moduleprovides long run population projectionsconsistent with ABS population projections.It provides a projection by age and overlaysthese with income and consumption profileswhich will allow us to incorporate theimpacts of ageing on consumption.
This module allows us to capture the impact ofdemographic trends on spending, generationof income and consumption taxes andexpenditure pressures by income quintile.
The economic impact module is calibratedto the fiscal, macroeconomic anddemographic projections and providesdetailed economy wide impacts oftax changes.
It allows us to further decompose the impactson economic outcomes such as GSP/GDP,prices and investment.
The fiscal impact module incorporatesdetailed historic state and commonwealthexpenditure and revenue data, including thelatest Budget 15-16 information.
Drawing from the demographic andmacroeconomic projections, it providesdetailed projections of state andCommonwealth expenditure and revenue,including transfers between statesand Commonwealth.
This module allows us to develop a deepunderstanding and quantification of fiscalimpacts of tax changes.
Reformoption

www.pwc.com.au
© 2016 PricewaterhouseCoopers. All rights reserved.PwC refers to the Australian member firm, and may sometimes refer to the PwC network.Each member firm is a separate legal entity. Please see www.pwc.com/structure for further details.
At PwC Australia our purpose is to build trust in society and solve important problems. We’re anetwork of firms in 157 countries with more than 208,000 people who are committed to deliveringquality in assurance, advisory and tax services. Find out more and tell us what matters to you byvisiting us at www.pwc.com.au
Liability limited by a scheme approved under Professional Standards Legislation.
127035498