Embed Size (px)
Citation preview
Journal of Chromatography, 386 (1987) 333-344 Elsevier Science Publishers B.V., Amsterdam - Printed in The Netherlands
CHROMSYMP. 1045
MODELLING OF PEAK PROFILES
APPLICATION TO THE PREPARATIVE LIQUID CHROMATOGRAPHY OF STEROIDS
MARIA JO!& GONZALEZ, ALAIN JAULMES*, PATRICK VALENTIN and CLAIRE VIDAL- MADJAR
Laboratoire de Chimie Analytique Physique, Ecole Polytechnique. 91128 Palaiseau Ceakx (France)
SUMMARY
The solution of the mass balance equations in liquid chromatography describes the propagation of signals of finite concentration through the column. The general numerical solution requires the prior determination of the partition isotherm. For low solute concentrations, when the isotherm equation can be replaced with a two- term expansion, an analytical solution for the peak profiles is obtained.
The theory is applied to predict, as a function of solute concentrations, the elution profiles of two steroids of similar structure, cis- and trans-androsterone, with organic solvents as the mobile phase and buffered silica gel as the stationary phase. At infinite dilution both steroids are well resolved, the tram isomer being eluted before the cis isomer. At high concentrations their adsorption isotherms intercept each other and, for large amounts injected, their elution order is reversed, with marked differences in the elution peak shapes of both steroids.
INTRODUCTION
The modelling of peak profiles obtained at finite concentration is of prime importance in optimizing separations in preparative liquid chromatography’. Gen- erally, separations are optimized by a trial and error method*, a procedure which may be tedious and prolonged, as it involves many experiments. Modelling leads to a better understanding of the phenomenon and may indicate the experimental param- eters that will give the best separations in preparative chromatography3*4.
In a previous study’, we established the mass balance equations in liquid chro- matography that describe the propagation of solutes of finite concentration. A gen- eral numerical solution of the system exists 5*6 that takes into account the injection profile and requires a knowledge of the sorption isotherm. An analytical expression of the peak profile is derived for moderate concentrations when the sorption isotherm can be replaced by a two-term expansion l*‘. The aim of this work was to compare the advantages and possibilities of both models and to discuss their applicability in preparative liquid chromatography of lipid-soluble compounds.
0021-9673/87/$03.50 0 1987 Elsevier Science. Publishers B.V.
334 M. J. GONZALEZ et al.
For the preparative liquid chromatography of organic lipid-soluble com- pounds normal-phase liquid chromatography is generally preferred, as the use of an organic solvent allows both increased sample solubility in the mobile phase and easy purification by evaporation of the collected fractionsa.
One of the disadvantages of untreated silicas in liquid-solid chromatography is the dramatic influence of the water content on the solute retention timesg, which leads to uncontrollable retention behaviour. In this work, in order to obtain repro- ducible results, independent of trace amounts of water, we used a buffered silica gello, which has several other advantages for preparative liquid chromatography: it reduces the tailing of the elution peaks of polar compounds and permits the adsorp- tion chromatographic separation of isomers. On an analytical column, packed with a buffered silica gel, we have studied the problem of the separation of cis- and trans- androsterones. To test the ability of the theoretical-model to fit the experimentally overloaded profiles, an analytical chromatogmphic system was used in this study but, as is well known, analytical equipment may serve to develop separations for prepar- ative liquid chromatography’ l.
THEORY
We have shown previously1 that the propagation of the concentration profile for one solute and a mobile phase is described by the mass balance differential equa- tion of liquid chromatography:
a(c + k) + a(Uc) = D PC
at a2 x where
(1)
c = concentration of the solute in the mobile phase; t = time elapsed since injection; z = abscissa along the column; U = velocity of the mobile phase; D = dispersion coefficient; k = function describing the partition equilibrium.
~A/VL = W (2)
where nA is the number of adsorbed molecules and Ve the volume of ihe liquid phase.
Moderate overload peak model An expression of the chromatographic elution peak can be derived as a solu-
tion of eqn. 1 when k is expanded to the second term:
!!!A=,,_,, +k”J/ C
an, - O O L (3)
where k’ Is the capacity factor and ‘nL the number of moles in the liquid phase.
PREPARATIVE LC OF STEROIDS 335
In quasi-pulse injection, the algebraic expression of the elution profile is
2 D’ 112
Uo exp(-c2/4 D’ t)
c=CIlt * coth(p/2) + erfI</2(D’t)“2] (4)
where
U = L/tR and 5 = L - U t (5) D’ = D/(1 + kb) (6)
I = k;; I’,/(1 + i&) (7)
p = aAU2/2D V-9
and a is the peak size parameter. Only four parameters are necessary to define the chromatographic peak: (1) the peak size parameter, a, equal to the peak area, A; (2) the slope at origin of the isotherm, kb, which is related to the retention time
at infinite dilution, tR:
tR = (1 + kO)t, (9)
where to is the hold-up time; (3) the global apparent dispersion coefficient, LY; and (4) the curvature of the isotherm at the origin, k& which is related to the peak
slant coefficient, 1 (eqn. 7). A simple relationship exists between the peak slant coefficient and the locus of
the maximum of the elution profile:
CM = (fM - tR)/hl (10)
This equation is a hyperbola that reduces to a straight line for small values of CM.
Numerical calculation of the chromatographic peak To perform an approximate integration of eqn. 1 we first neglect the value of
D, which would lead to intricate problems of numerical stability, and thus we have to solve
act + k)
at ++o (11)
where we assume u to be independent of z, as is usual in liquid chromatography. The numerical procedure is easier in the present instance than in gas chro-
matography5s6, as the mobile phase velocity is kept constant and the second differ- ential equation is not needed because volume effects can be neglected’. Therefore, the numerical procedure based on Godunov’s schemes,6 is not needed in order to solveeqn. 11. - . .
336
To solve eqn. 11, we have
M. J. GONZALEZ et al.
We start with a set of values c(t, 0) corresponding to the injection signal (z = 0). Eqn. 12 is converted to
A’C to Ak + WI to AC + Ak(c) -_= _-. A’z L 6t = --x * At
(13)
Here A is used for constant z and A’ for constant t. Finally,
c(t, z + A’z) = c(t, z) -
-; * ;; _[
c(t + At, z) - c(r, z) + k(t + At, z) - k(t, z) 1 (14)
As one uses discrete steps for integration, this will result in a smoothing of the the- oretical signal with numerical “dispersion”. The step in z, A’z, is equal to Hmin, the smallest value of the height equivalent to a theoretical plate (HETP), and At = 2tR. A’z/L is chosen so that the best stability conditions are realized according to the Friedrich, Levy and Courant criterion5*6.
In addition to the parameters of the isotherm function k(c), the peak profile is defined by two other parameters, the peak area and the global apparent diffusion coefficient, related to the HETP (H) by
A’z = H = 20’ tRIL (15)
Therefore, as with the moderate overload peak model, the numerical procedure needs four parameters to describe an elution peak in the case of a parabolic sorption iso- therm.
EXPERIMENTAL
The HPLC system consisted of a Model 110 B (Beckman, Berkeley, CA, U.S.A.) and a Model 7125 sampling valve (Rheodyne, Berkeley, CA, U.S.A.) with a 40+1 loop. The detector employed was a Model R401 differential refractometer (Waters, Assoc., Milford, MA, U.S.A.).
The analogue outputs of the detectors were connected to a Model 3497 digital voltmeter (Hewlett-Packard, Palo Alto, CA, U.S.A.), which was interfaced with a CBM 4032 microcomputer (Commodore, Santa Clara, CA, U.S.A.) that actuated the injection valve and controlled the data acquisition rate. The data, collected to a precision of four decimal places, were stored on a floppy disk. The theoretical cal- culations were carried out in Fortran with a Hewlett-Packard 21 MX computer and with the computer of the Centre Inter Regional de Calcul Electronique (Orsay, France), using a non-linear least-squares fit program.
The eluent was dichloromethane-acetonitrile (90:10, w/w; 99% purity) (Carlo Erba, Milan, Italy). The solutes used were cis- and trans-androsterones (98% purity) (Fluka, Buchs, Switzerland).
PREPARATIVE LC OF STEROIDS 337
The solid phase was a buffered silica gel. It was prepared by Schwarzenbach’s methodlo and the silica gel surface (LiChrosorb Si-100, particle size 10 pm) (Merck, Darmstadt, F.R.G.) was coated with a phosphate buffer (pH 6.8).
The adsorbent was packed into a 25 x 0.46 cm I.D. stainless-steel column by using the slurry technique. The column was placed in a water-bath at 20 f O.l”C. The dead-volume of the column ( VL = 3.55 ml) was determined from the differences between the weights of the column filled with carbon tetrachloride and methanoli2.
Good reproducibility in the retention behavior, independent of the trace water content in the liquid and stationary phases, is observed when buffered silica gel is used as an adsorbent and organic solvents in which steroids are soluble are used as the mobile phase.
The refractive index detector had a non-linear response at concentrations high- er than 3 pmol/ml for both steroids. The detector was calibrated and the output voltage, s, was related to the concentration through an equation optimized by the least-squares fit method:
c = 2.237 . lo-3 . s . e”.034 . 8
for cis-androsterone and
c = 2.341 . low3 . s . e”.0s4 ’ s
for truns-androsterone, where the output voltage, s, is in volts and the concentration in pmol/ml.
RESULTS AND DISCUSSION
Determination of the ahorption isotherm by frontal chromatography At high concentrations the displacements and distortions of the elution peak
are mainly due to the non-linearity of the adsorption isotherm. It is therefore useful to measure it by an independent method in order to select the appropriate adsorption isotherm model.
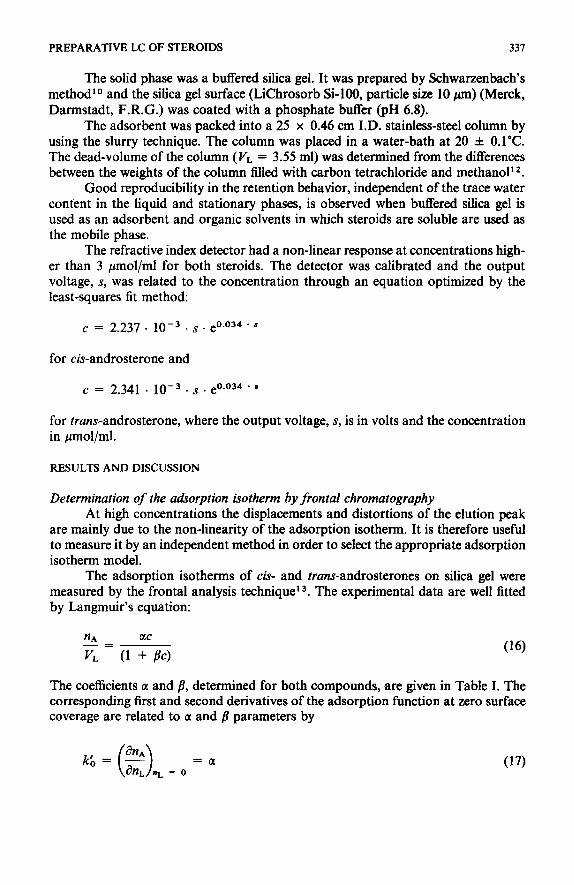
The adsorption isotherms of cis- and trans-androsterones on silica gel were measured by the frontal analysis technique 13. The experimental data are well fitted by Langmuir’s equation:
nA -=
VL (1 $c) (16)
The coefficients a and 8, determined for both compounds, are given in Table I. The corresponding first and second derivatives of the adsorption function at zero surface coverage are related to a and /I parameters by
(17)
338 M. J. GONZALEZ et al. .
TABLE I
COMPARISON OF THE CHARACTERISTICS OF ADSORF’TION ISOTHERMS OF cis- AND trans-ANDROSTERONES BY DIFFERENT METHODS
Method cis-Androsferone trans-Androsrerone
a 103 /I IO3 kg a IO’ j? lo3 k; Wlrunoll (~01) - ’ W/run4 (~4 - 1
Frontal analysis 1.53 20.3 -17.0 1.37 7.0 -5.2 Elution peak numerical model 1.52 15.7 - 13.0 1.41 7.0 -5.4 Moderate overload model:
Elution peak model 1.52 - 12.8 1.36 -5.2 Apex locus 1.53 - 14.6 1.41 -5.6
and
-2a /3 =- VL
(18)
Both isotherms intercept, with a more negative curvature and a larger slope at the origin for cis-androsterone. From Fig. 1 it is possible to predict that cis-androsterone,
Fig. 1. Liquid-solid adsorption isotherms determined by frontal analysis. 1 = c&Androsterone; 2 = trans-androsterone. Solvent, dichloromethane-acetonitrile (90: 10, w/w).
PREPARATIVE LC OF STEROIDS 339
400.0 450.0 500.0 550.0 *
600.0 t(s)
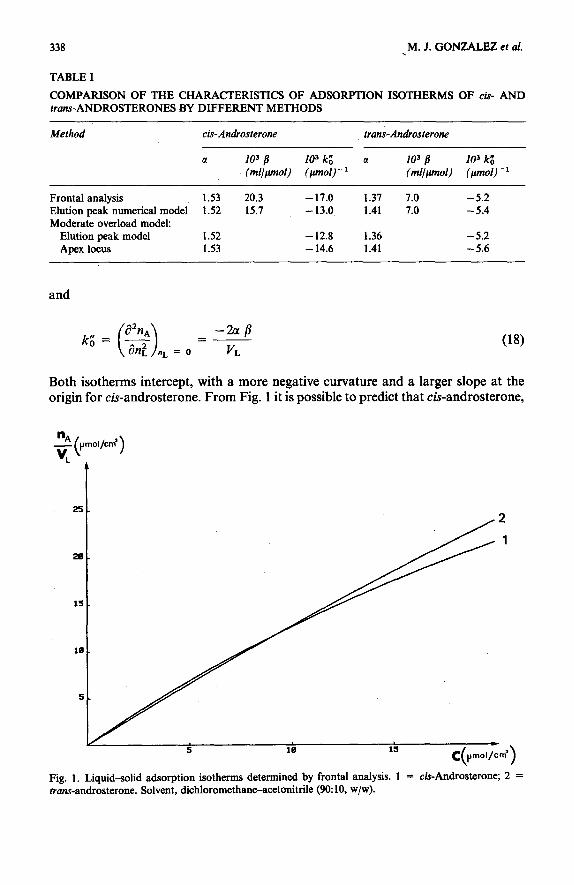
Fig. 2. Best fit of the moderate overload model. Adsorbent, buffered @a gel, !O pm; solvent, dichloromethane-acetonitrile (90~10, w/w); flow-rate, 0.98 ml/min. (a) cis-Androsterone; (b) trans-an- drosterone. Full lines, theoretical model; broken lines, computer data-acquisition experimental points.
TA
BL
E
II
EL
UT
ION
P
EA
K
PA
RA
ME
TE
RS
O
BT
AIN
ED
B
Y M
OD
EL
F
ITT
lNG
M
ET
HO
DS
Com
poun
d m
A
a
104
ti kb
IO
= k:
IO
’ /!
I M
etho
d (p
oll
(pm
01 .
s/m
l)
(pm
01 .
s/m
l)
(cm
’ : s
) (P
w
- 1
Woo
l)
cis-
An
dros
tero
ne
rran
win
dros
tero
ne
0.08
9 6.
3 5.
9 0.
182
12.9
11
.8
0.93
2 67
.7
63.0
1.
848
153.
0 14
4.0
3.24
6 21
7.5
210.
1 11
.705
84
6.4
881.
7 16
.698
11
30.1
11
75.6
11.7
05
846.
4 80
9.1
16.6
98
1130
.1
1119
.0
0.07
9 6.
8 7.
1 0.
533
16.7
32
.7
1.09
8 75
.3
73.3
2.
200
149.
2 14
7.8
4.93
1 30
5.4
302.
7 8.
893
591.
6 60
4.6
4.43
1 30
5.4
295.
1 8.
893
591.
6 56
8.1
1.00
1.
56
-23.
4 M
oder
ate
1.22
1.
55
-24.
9 ov
erlo
ad
1.22
1.
52
- 17
.4
mod
el
1.30
1.
51
-13.
1 1.
32
1.51
-1
3.0
3.40
1.
48
- 10
.4
4.20
1.
51
-11.
1
2.6
1.48
-1
1.4
14.1
N
um
eric
al
4.1
1.52
-
12.8
15
.3
mod
el
1.10
1.
42
- 6.
7 M
oder
ate
1.24
1.
43
- 8.
1 ov
erlo
ad
1.32
1.
42
- 6.
6 m
odel
1.
50
1.41
-
5.4
1.75
1.
40
- 4.
8 2.
60
1.41
-
5.0
1.70
1.
40
- 4.
9 6.
4 N
um
eric
al
3 2.
20
1.41
-
5.5
7.1
mod
el
5 1 N
a w
PREPARATIVE LC OF STEROIDS 341
which is the more retained compound at infinite dilution, will be the one less retained at high concentrations.
Fitting of the moderate overload peak model The modification of the shape of the elution peaks, as a function of the steroid
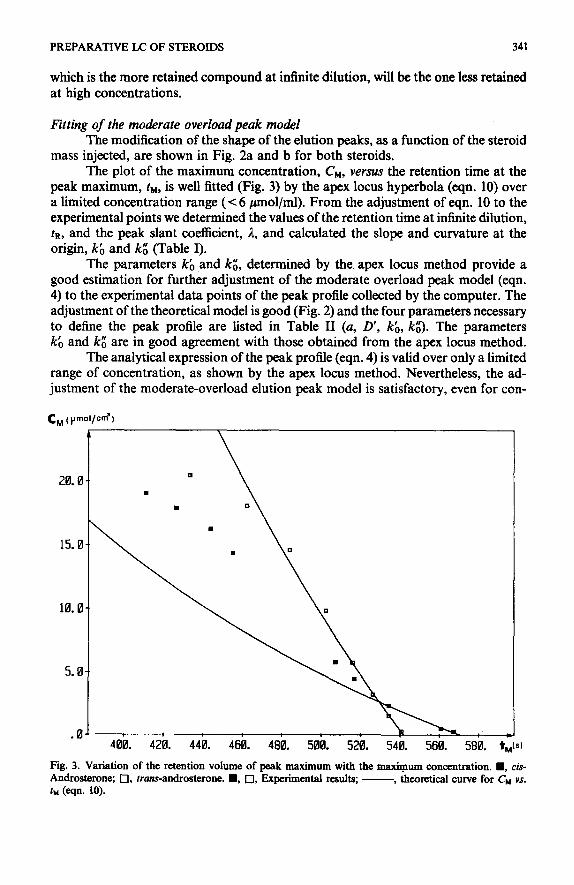
mass injected, are shown in Fig. 2a and b for both steroids. The plot of the maximum concentration, CM, versus the retention time at the
peak maximum, tM, is well fitted (Fig. 3) by the apex locus hyperbola (eqn. 10) over a limited concentration range (< 6 ~mol/ml). From the adjustment of eqn. 10 to the experimental points we determined the values of the retention time at infinite dilution, tR, and the peak slant coefficient, A, and calculated the slope and curvature at the origin, kb and ki (Table I).
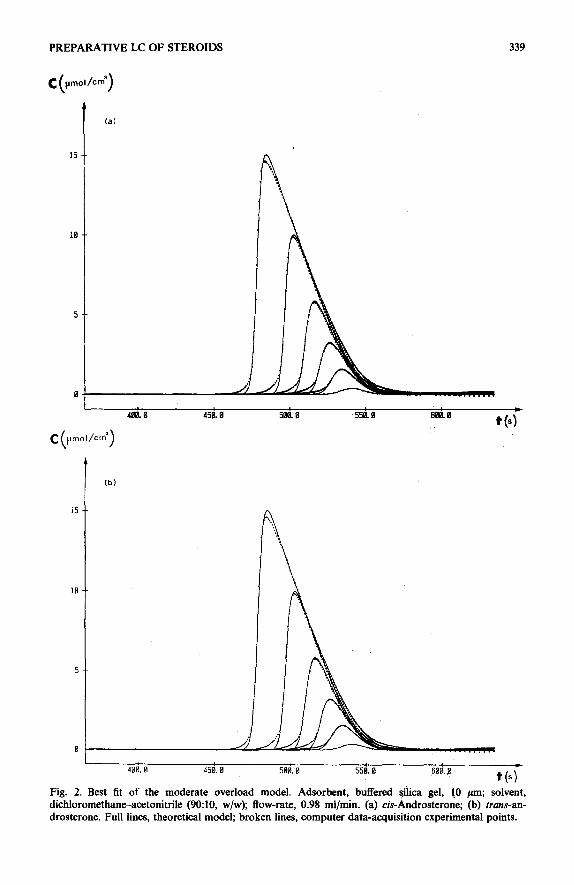
The parameters kb and k& determined by the apex locus method provide a good estimation for further adjustment of the moderate overload peak model (eqn. 4) to the experimental data points of the peak profile collected by the computer. The adjustment of the theoretical model is good (Fig. 2) and the four parameters necessary to define the peak profile are listed in Table II (a, D’, kb, kg). The parameters PO and ki are in good agreement with those obtained from the apex locus method.
The analytical expression of the peak profile (eqn. 4) is valid over only a limited range of concentration, as shown by the apex locus method. Nevertheless, the ad- justment of the moderate-overload elution peak model is satisfactory, even for con-
15.
10.
5.
J 400. 420. 440. 460. 480. 500. 520. 540. 560. 580. t;(s)
Fig. 3. Variation of the retention volume of peak maximum with the -urn concentration. W, cis- Androsterone; 0, truns-androsterone. n , 0, Experimental results; -, theoretical curve for CM vs. TV (esn. W.
342 M. J. GONZALEZ et al.
centrations higher than 6 pmol/ml (Fig. 2) and leads to the values of the four param- eters (a, D’, kb, k$) for defining the chromatographic profile as listed in Table II. In this instance, the peak size parameter, a, is lower than the experimental peak area, A. The dispersion coefficient, D’, is increased by a factor of 4 at the largest amount injected, but kb and k; remain close to the values given by the apex locus method.
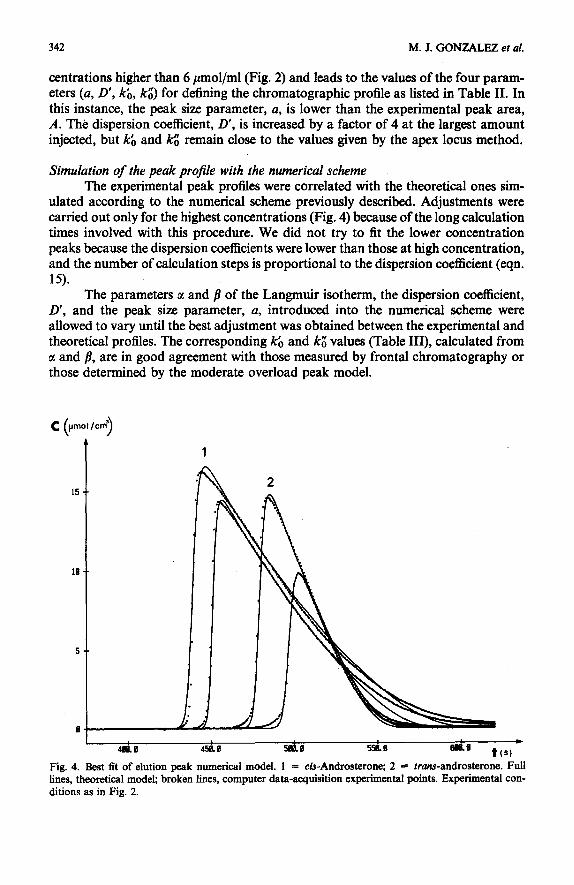
Simulation of the peak profile with the numerical scheme The experimental peak profiles were correlated with the theoretical ones sim-
ulated according to the numerical scheme previously described. Adjustments were carried out only for the highest concentrations (Fig. 4) because of the long calculation times involved with this procedure. We did not try to fit the lower concentration peaks because the dispersion coefficients were lower than those at high concentration, and the number of calculation steps is proportional to the dispersion coefficient (eqn. 15).
The parameters a and B of the Langmuir isotherm, the dispersion coefficient, D’, and the peak size parameter, a, introduced into the numerical scheme were allowed to vary until the best adjustment was obtained between the experimental and theoretical profiles. The corresponding kb and k: values (Table III), calculated from tl and /I, are in good agreement with those measured by frontal chromatography or those determined by the moderate overload peak model.
Fig. 4. Best fit of elution peak numerical model. 1 = cis-Androsterone; 2 = rronr-androsterone. Full lines, theoretical model; broken lines, computer data-acquisition experimental points. Experimental con- ditions as in Fig. 2.
PREPARATIVE LC OF STEROIDS 343
It is interesting to compare the values of the parameters obtained by numerical simulation methods with those of the moderate overload peak model (Table II) for the higher concentrations when the peak analytical expression (eqn. 4) is no longer valid, but the adjustment is still good. The peak area parameter, a, is in good agree- ment with the experimental value, A, only in the case of numerical simulation.
The dispersive coefficients estimated obtained by the two methods are fairly close (Table II), as a dispersive term was taken into account in the mass balance equation of the moderate overload model. Evidence is provided that dispersion aris- ing from the discrete steps of the numerical integration method (eqn. 15) is equivalent to dispersion through the column.
Comparison of peak-profile modeling methodr There are several advantages in the numerical simulation method: any kind of
adsorption isotherm may be assumed, there is no restriction on the concentration range and only one injection is necessary to obtain the parameters of an isotherm equation if a theoretical model can be assumed.
In this work, the numerical simulation of the peak was based on the assump- tion of a Langmuir-type adsorption isotherm, and the parameters c1 and /? of eqn. 16 were introduced into the simulation program to obtain the best fit between the model and the experimental elution profile. The validity of this hypothesis is demonstrated in Table I, as a and p determined by this method are in good agreement with those measured by frontal chromatography.
The numerical simulation method requires long calculation times on a micro- computer, as peak adjustments imply many trials. The moderate overload peak model, which approximates the isotherm as a parabola, allows a quick determination of the first and second derivatives at the origin, kb and k& which may be obtained from a plot of the retention time versus peak height at the peak maximum. In the special case of a Langmuir isotherm, both a and /3, which characterize the adsorption over the whole concentration range, can be calculated from the values of kb and kt (eqns. 17 and 18). The a and B values (Table I) obtained from the moderate over- load peak model are in good agreement with Langmuir parameters determined by numerical peak simulation or by frontal chromatography.
CONCLUSION
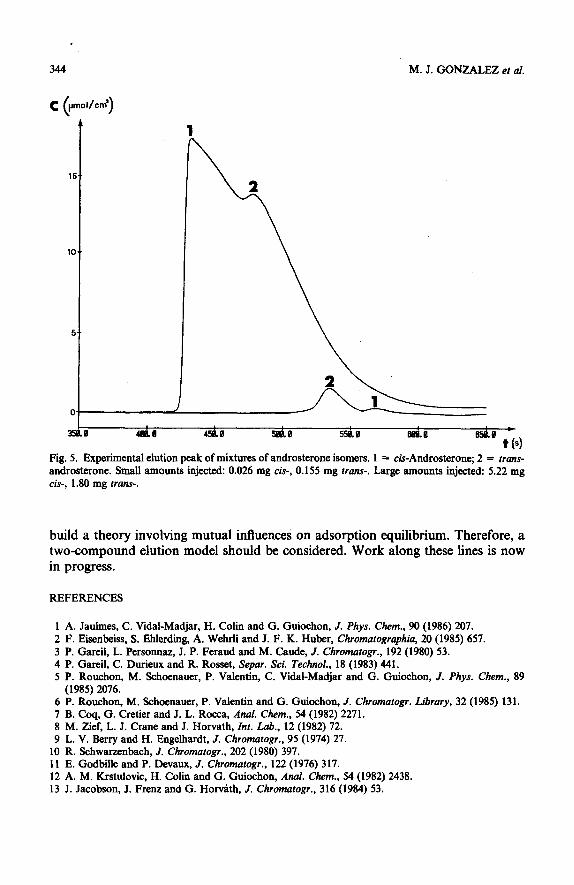
Despite the similar structures of the steroids studied, both of which exhibit an isotherm of the Langmuir type, the curvature of cis-androsterone isotherm is three times lower than that of rruns-androsterone. This causes cis-androsterone, which is the more retained compound at infinite dilution, to be the less retained when large concentrations are injected. A careful determination .of the adsorption isotherm is therefore important, as a simple look at the chromatogram in Fig. 5 might lead to mistakes if one attributes the same retention order at&ite concentration and at infinite dilution.
For optimization in preparative liquid chromatography, modelling is essential in similar instances, as only one product, that with the lowest retention time at high concentrations, could be obtained in a pure form. In order to know how the com- position of the binary solute mixture will vary at the column outlet, it is useful to
M. J. GONZALEZ et al.
( pmol I/cd >
Fig. 5. Experimental elution peak of mixtures of androsterone isomers. 1 = cis-Androsterone; 2 = tram- androsterone. Small amounts injected: 0.026 mg cti-, 0.155 mg tram. Large amounts injected: 5.22 mg cis-, 1.80 mg trum-.
build a theory involving mutual influences on adsorption equilibrium. Therefore, a two-compound elution model should be considered. Work along these lines is now in progress.
REFERENCES
1 A. Jauhnes, C. Vidal-Madjar, H. Cohn and G. Guiochon, J. Whys. Chem., 90 (1986) 207. 2 F. Eisenbeiss, S. Ehlerding, A. Wehrli and J. F. K. Huber, Chromatographiu, 20 (1985) 657. 3 P. Gareil, L. Personnax, J. P. Feraud and M. Caude, J. Chromatogr., 192 (1980) 53. 4 P. Gareil, C. Durieux and R. Rosset, Separ. Sci. TechnoZ., 18 (1983) 441. 5 P. Rouchon, M. Schoenauer, P. Valentin, C. Vidal-Madjar and G. Guiochon, J. Phys. Chem., 89
(1985) 2076. 6 P. Rouchon, M. Schoenauer, P. Valentin and G. Guiochon, J. Chromatogr. Library, 32 (1985) 131. 7 B. Coq, G. Cretier and J. L. Rocca, And. Chem., 54 (1982) 2271. 8 M. Zief, L. J. Crane and J. Horvath, ht. Lab., 12 (1982) 72. 9 L. V. Berry and H. Engelhardt, J. Chromatogr., 95 (1974) 27.
10 R. Schwarxenbach, J. Chromatogr., 202 (1980) 397. 11 E. Godbille and P. Devaux, J. Chromatogr., 122 (1976) 317. 12 A. M. Krstulovic, H. Colin and G. Guiochon, Ad. Chem., 54 (1982) 2438. 13 J. Jacobson, J. Frenz and G. Horvath, J. Chromatogr., 316 (1984) 53.


![DEVELOPMENT OF A NEW ANALYTICAL METHOD AND …separation.[1] Chromatography may be preparative or analytical. The purpose of preparative chromatography is to separate the components](https://img.pdfslide.us/doc/110x75/602a77098265293b5777f41e/development-of-a-new-analytical-method-and-separation1-chromatography-may-be.jpg)