Embed Size (px)
Citation preview

Modelling of heat transfer in a combustion chamber and
multiphase flow in a pilot-scale CFB
Agata Katarzyna [email protected]
Instituto Superior Tecnico, Universidade de Lisboa, PortugalSeptember 2019
Abstract
Fluidization process progressively gains interest. It is mainly due to high heat transfer and mixing rateof solid material. It is used for drying, cooling, mixing, and converting fuel energy into heat. The last ofmentioned application is intensively developed in the energy sector. In case of building new units or improvingthe existing one, an extensive engineering work is required. In order to overcome necessity of performing on-site or laboratory test a numerical techniques can be used. Computational methods give great opportunityto predict and understand complex physical mechanisms. Industrial boilers, where fluidization technology isused, have high efficiency, leads to reduce emissions of harmful substances such as SOx and NOx along withthe use of larger range of burnt fuel, including wastes. Nevertheless application of numerical techniques forpredicting complex particle transport in dense solid flow is not a trivial task and require special treatmentand attention. This situation is mostly caused by intensive mixing, mutual particle interaction and strongcoupling between phases. Modelling of multiphase flows can be done using Euler-Euler, Euler-Lagrange,hybrid Euler-Lagrange approaches as well as Discrete Element Method (DEM). The DEM techniques takeinto account collisions between particles applying direct collision model while remaining approaches modelthe collision using the idea of kinetic theory of granular flow. In contrary to Euler-Euler technique, DEM isnot well tested yet for fluidization processes, mainly due to the cost of simulations. In this work, the potentialof using the DEM for modelling combustion and heat transfer in fluidized bed was tested. Also, a comparisonbetween data resulting from experiments on pilot-scale Circulating Fluidized Bed unit, Euler-Lagrangeapproach and DEM will be provided.Key words: Computational Fluid Dynamics, Discrete Element Method, Fluidized Bed, Combustion, HeatTransfer
1. Introduction
1.1. FluidizationFluidization is a multiphase process, where solid material is transported by flowing gas. The process in
the last few decades has gained more and more interest. The technology finds application in many differentindustries, i.e. chemical for re-drying of chemicals after mechanical drying, pharmaceutical (e.g. medicationmixing fluidization gives higher efficiency and more uniform distribution of material in comparison to mechanicalmixing), food processing (popcorn popper) and many applications in the energy sector. The last mentionedapplication is intensively developed. Intensive heat transfer, mixing of the solid material, long residence timeof the fuel, or the uniform temperature distribution over the combustion chamber are the main factors thatcharacterize this technology. The industrial boilers that use fluidization techniques have higher efficiency, even10% higher in comparison with pulverized coal boilers. This is caused mainly by the high mixing rate whichaffect all thermo-chemical processes that occur during coal combustion, for instance this helps in reduction ofSOx emission by direct limestone injection. The combustion temperature with fluidized bed ranges between800−950°C, which accounts for lower NOx emissions, allows to burn fuel (as wastes) with lower heating value [1].Lower temperature results in no softening of an ash, that further does not create problems with slag or coatingformation on a chamber walls that will lead to decrease of heat transfer rate between the heating surfaces and theheated medium [2]. Another advantage of the usage of this type of boilers is their low sensitivity to fuel quality.
1

A large range of fuel types, including wastes can be easily burned. Looking to the proportions of the materialtransported in the combustion chamber, the coal fraction is only 3% of the total material in the combustionchamber, the rest is the inert material. The purpose of the inert material is t transfer the heat released duringcombustion process [3]. As it was mentioned the fluidization is a process where due to gas flow through thechamber, the suspension of solid particles in the fluid switches them into a fluid-like state. The process beginsputting material on the porous plate. Then gas with low flow rate starts passing through the porous plate andmaterial. The minimal fluidization velocity of a gas (umf ) is reached once the gravitational and other forcesaffecting particles are balanced and they start to move (Fig. 1a). Continuing the increase of velocity above theminimal fluidization velocity rises smaller particles to the top of the boiler and gas bubbles appear (Fig. 1b).Exceeding of so called terminal velocity (utf ) bubbles vanish, instead turbulent motion of particles occur (Fig.1c). Further increase of gas velocity transforms the turbulent bed into a circulating fluidized bed. Particles areremoved through the top part of the chamber and after passing over the solid separator return to the chamber(Fig. 1d).
Figure 1: Fluidization regimes
1.2. Circulating Fluidized BedAmong the fluidization technology, nowadays the most popular is the Circulating Fluidized Bed (CFB).
Lower temperature of combustion allows to burn fuel of low quality e.g. wastes or biomass. Due to relativelylow combustion temperature fuel with higher moisture content, lower heating value fuels can be burnt in theCFB boiler. Those properties characterize biomass or RDF (Refuse Derived Fuel). This is of a great importancewhere challenge with waste management is constantly increasing. The CFB boilers are mainly dedicated forunits of high generating power. Already installed, example units, have electrical power of 460 MWe ( Lagisza,Poland), 330 MWe (Novocherkasskaya, Russia) and 550 MWe (Samcheok, South Korea) [4]. The particleresistance time, due to the close loop is much longer in comparison to the traditional pulverized coal boilers.Instead of removal of unburnt fuel particles, they are separated from flue gases and returned to the combustionchamber through separator and loop seal. High conversion rate of fuel results in higher boiler efficiency. It hasto be taken into account that co-combustion of different types of fuels is possible and also function properly.The amount of oxidizer provided to the combustion chamber, within different zones need to be adjusted forthe type of fuel, taking into account its size, density and moisture content. One of the operating conditionsis the velocity, which needs to be maintained over the entrainment velocity ranging from 4.5 to 6.7 m/s) [5].This allows to uplift particles and redistribute them uniformly in the chamber - lighter particles are raised andheavier are occupying the bottom part of the chamber until fragment into the smaller ones during collision,particle swell, and breakage processes.
2

Figure 2: General scheme of the CFB boiler with higlighted injection ports
A typical CFB boiler scheme,
shown in Fig. 2, consists of the com-
bustion chamber, loop-seal and drain
section.
2. Mathematical model
The numerical modeling of thefluidization processes in large scaleinstallations as well as in the labora-tory devices is computationally com-plex and very expensive. As it wasmentioned earlier, different modelsare available to simplify and speedup numerical simulations. Neverthe-less, all of them suffer from some de-ficiency, mainly concerning the ac-curacy of prediction of the particle-particle collisions. In order to ac-curately resolve this problem, theDiscreet Element Model (DEM) softsphere model may be used. There-fore, approach which gives possibil-ity to reduce calculation time with-out losing accuracy is very desirable.In order to deal with the aforemen-tioned difficulties new approach forpredicting particles collision has tobe developed in future. The presented thesis investigates the possible application of a complex collision modelbased on the DEM approach for modeling laboratory scale CFB installation. Moreover, the heat and masstransfer aspects in case of use the DEM technique will be investigated. The core of the DEM approach formodeling fluidization process where strong interaction between gaseous and solid phase need to be taken intoaccount is the coupling between phases. In this model the same strategy as in application of Dense DiscreetPhase Model (DDPM), named also hybrid Euler-Lagrange (HEL) technique is used. For accurate predictionof interaction between particles and particles with fluid as well as Particle Size Distribution (PSD) DiscreteElement Method can be used. DEM approach defines collisions using two models: soft-sphere and hard-sphere.In this, based on the work of Cundall and Stack [6] implemented in ANSYS Fluent takes into considerationthe spring deformation and shape of particle resulted from collision. Additionally in this work combustionprocess was investigated. Combustion is a rapid chemical process of oxidizing, releasing great amounts of heat.Substrates of combustion are substances supplied to the domain (fuel and air) while products are substancesreleased (flue gas, gaseous and solid substances) [7]. The solid fuel combustion process consists of few steps:heating, evaporation, devolatization, oxidation. In the first stage of the combustion process the injected par-ticle is heated up to a defined evaporation temperature. Over the evaporation temperature the evaporationprocess proceeds until moisture is removed from the particle. After evaporation the particle is again heated todevolatilization temperature, above which the gaseous fraction is released from the particle to the continuousphase, where the volatile matters are combusted. After devolatilization, the char combustion process starts.When the entire char in the particle is consumed, the heating process is again activated and remaining hot ashis used as the inert material for heat transfer processes.
3

3. Numerical simulations using simplified geometrical models
Geometry and a mesh of simplified combustion chamber were made in Ansys environment. Used geometryis depicted in Fig. 4. Geometry consists of 4,718 hexahedral elements with size of 0.03 m. The dimensions of adomain are 0.2x0.3x2 m. Solid material is injected through the port located at the left side of the computationaldomain, 0.15 m above the bottom air inlet, see (Fig. 3). For modeling coal combustion the solid material injectionports have been slightly reconfigured as it can be seen in Fig. 5b. Coal injection ports have been located atthe side walls. This operation was done in order to ensure better mixing of the fuel and inert material at thebottom section of the combustion chamber.
Figure 3: Part of a domain usedfor injecting sand particles
Figure 4: Geometry used forheat transfer modelling
(a) Port of fuel on one side ofthe domain
(b) Ports of fuel on bothsides of the domain
Figure 5: Geometries used for combustion modelling
The calculations were initialized by providing 100,000 particle parcels (named sand) into the bottom partof the geometry. Using the volume injection method it is possible to prescribe defined amount of material tothe selected zones of the domain, highlighted at Fig. 3. The initial velocity of the sand was set to zero. Incase of modeling only mixing with heat transfer the initial sand temperature was set to 383 K while modellingcombustion the initial sand temperature was set to 1173 K. A mixing process was organized by injecting solidmaterial (named here as coal) through the port located at the side ports of the computational domain. Forheating purpose the hot air was provided to the domain through bottom inlet with temperature equal to 573 K.The simulation time was set to three seconds while the time step was set to 0.001s. The effect of heat transferbetween gaseous and solid phases was resolved in terms of the convection and conduction. The radiation wasnot taken into account due to high loads of solid material within the domain. For collecting information ofunburnt coal removed from the domain through outlet the user defined function (UDF) was created. The mainobjective was to collect the mass of char and ash at the outlet for calculating the energy leaving through theoutlet.
3.1. ResultsA set of numerical calculations has been carried out for two configuration. The results have been divided
between heat transfer and mixing processes and combustion. Firstly the heat transfer between gaseous andsolid phases was investigated together with mixing of the solid material. In the second stage the combustionof coal together with mixing of sand has been taken into account. Results have been illustrated using parcels
4

distribution colored by solid phase temperature. The changes of physical property of mentioned variables wereillustrated after 0.01 s, 1.5 s and 3 s from beginning of simulation.
Figure 6: Particle temperature in 0.1s, 1.5s and 3s of simulation respectively
The combustion process is discussed based on the particle distribution is shown in Fig. 7. The combustionchamber was assumed to be adiabatic, which means it does not exchange heat through the walls, so the wholeenergy is absorbed and accumulated by the inert material. Initial values of CO2, H2, O2 were set as 0.1, ofa N2 as 0.6 and the initial temperature was 1173 K. The effect of non uniform distribution of solid materialwithin the riser for both of the considered cases can be seen in Fig. 7 where small fraction of solid materialis entrained by passing gas. This is caused by the properties of the inert material which is quite heavy andparcels are relatively large. Intensive mixing helps in ensuring the uniform combustion of solid material anddistribution of combustion products as well as gaseous phase temperature.
(a) Injection ports located at one side (b) Injection ports located at both sides
Figure 7: Temperature of sand in 0.1s, 1.5sand 3s of simulation respectively
5

The composition of flue gases obtained from numerical simulations was monitored in every time step duringthe solution procedure. To obtain the final value, all gathered data was averaged in the time range where thesolution was stabilized. This procedure was done both for the case with single and two solid injection ports.Comparison of the numerical and analytical results is presented in table 1. For both investigated configurationsof the numerical model, the calculated flow parameters are similar. Some differences can be observed betweennumerical and analytical results. This can be caused by incomplete combustion of the coal in the consideredriser geometry, which means that particles leaving the domain contain a non zero fraction of unburnt char. Inthe case of total combustion of char, the composition of flue gases calculated analytically and numerically willagree.
Table 1: Mass fraction of flue gas components.
Fluegas components
Analythical results, %Computational results, %1 inlet 2 inlets
(CO2) 18.55 16.89 15.29(O2) 4.48 5.34 7.05(N2) 65.35 64.92 66.12
(SO2) 0.13 0.48 0.08(H2O) 11.49 12.38 11.47
4. Numerical simulations of the laboratory scale test-rig
4.1. Geometrical model
Figure 8: The pilot installation located at the Lappeenranta University of Technology[8] (left) and numerical mode with highlighted simplification and locations of themeasurement ports
Similarly to the heat transfermodelling, a three-dimensional com-putational domain and mesh of theexperimental rig were made in Ansysenvironment. The model was createdbased on the laboratory scale CFBtest unit, located at the Lappeen-ranta University of Technology atLaboratory of Modelling of EnergySystems [8]. The same stand hasbeen already used for modelling flu-idization of the solid material usingDDPM-HEL approach in [9]. Thegeneral scheme of the installation isdepicted in Fig (8). The completetest rig, working as a real CFB unit,consists of a riser, loop-seal and drainsection. The loop-seal itself is com-posed of the cyclone (device sepa-rating gas and solid particles) and adowncomer.
In order to simplify calculations, the geometry was modified. The following elements have been removed:loop-seal and drain section. As result the geometry used for calculations consists of the riser and two short pipesat the bottom and at the top as shown in a Fig. 9. The height of the riser is 1.8 m and its internal diameter
6

equals to 0.11 m. The mesh consists of 38,450 hexahedral and tetrahedral elements with size of 0.01 m (Fig. 11).Measurement points of pressure are situated along the riser, starting from ground level at 0 m, 0.07 m, 0.35 m,0.7 m, 1.0 m, 1.3 m, and 1.75 m.
Figure 9: Simplified meshFigure 10: Part of pilot-scale rig used forinjecting material
The experimental tests, to-gether with DDPM simula-tions, were carried out in am-bient conditions (cold). Themass of particle parcels in thedomain amounts to 1 kg andgas velocity, introduced fromthe bottom of the riser, equalsto 3.75 m
s . In the experimentsglass particles, with the densityof 2450 kg
m3 were used. On thebasis of 2d analysis particle di-ameters were determined. Par-ticle diameter was ranging from100 µm to 713 µm, the meandiameter was 513 µm, and thespread factor was determinedto be equal to 9.13 based onRossin-Rammler distribution [9]. To replace removed elements of a geometry a user defined function (UDF)was developed and implemented into the solution procedure. The general idea is to save, at the end of everytime step, information about the number of particles and their mass which is leaving through the outlet of thedomain. At the beginning of next time step, particle parcels with a total mass trapped previously are injectedback to the riser through the recirculation surface (see Fig. 11). In general terms the number of streams injectedback to the domain depends on number of faces composing a particular surface.
Figure 11: Recirculation scheme with close-up for recirculation surface
The close up of a surface is also pre-sented at Fig. 11. For this specific casethe number of faces at the recircula-tion inlet surface is 80. Procedure ofsaving informations about the numberof particle parcels and their mass leav-ing through the outlet, in order to in-ject back the same mass of solid phase,ensured the constant mass of the ma-terial in the domain. Results from thesimulation of the flow in the riser us-ing the DEM model will be validatedwith experiments, as well as with re-sults obtained using the DDPM (DenseDiscrete Phase Model) [9].
The number of injection points isdefined by the number of faces compos-ing the surface and points are locatedin the middle of each face. The loca-tion of the particle parcel injection point at the beginning of the time step cannot be changed, therefore onlyone particle parcel diameter could be simulated at one time. Otherwise, to keep diversity in particle sizes fewinjection files would have to be assigned to one surface. It would result in the same position of injection points
7
for different particles which would lead to unnatural overlapping (δ). Thus DEM simulations were conductedfor three different cases, each with different particle diameter but constant mass of material in the riser (1.0 kg).Calculations were initialized by providing particle parcels into the riser. Three particle diameters ware tested,275 µm, 325 µm, and 513 µm. For all cases the Gidaspow drag model was used to calculate interphase exchangecoefficient (K). The number of parcels injected into the computational domain were 230,000, 135,000, and75,000, respectively. To account for differences in particle diameters the different particle parcels diameterswere set: 0.0015 m, 0.0018 m, 0.0022 m for particle parcel diameter equal to 275 µm, 325 µm, and 531 µmrespectively.
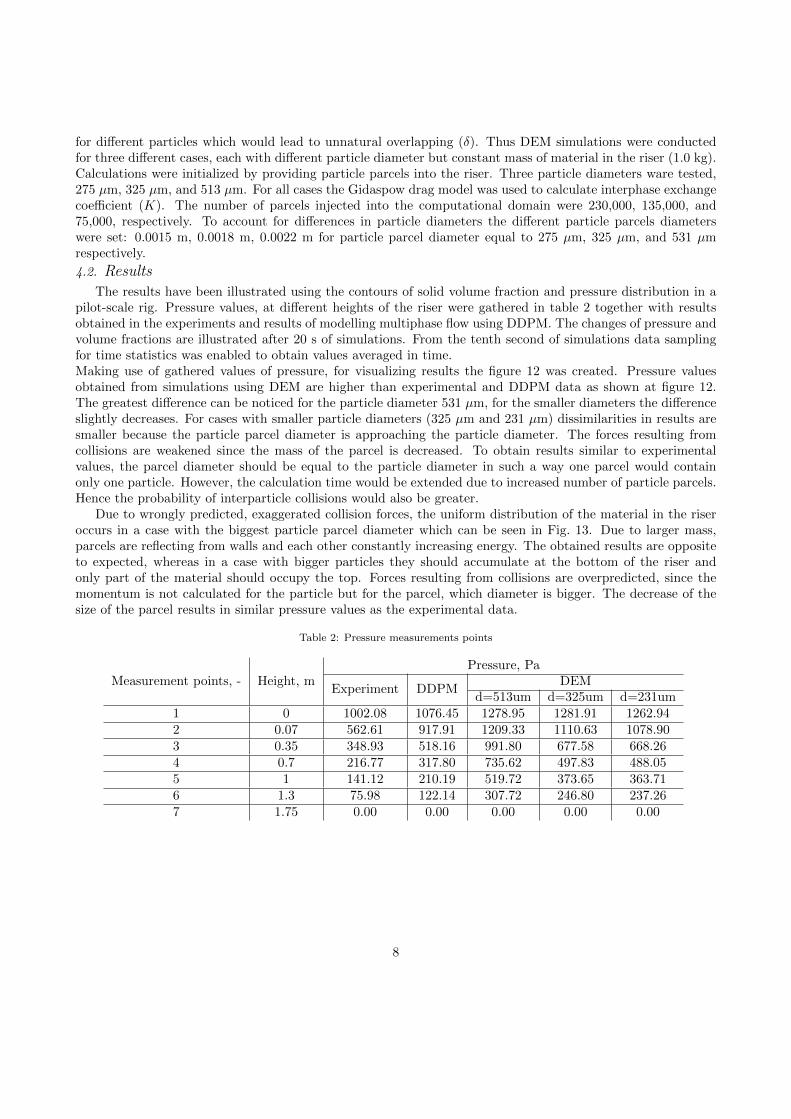
4.2. ResultsThe results have been illustrated using the contours of solid volume fraction and pressure distribution in a
pilot-scale rig. Pressure values, at different heights of the riser were gathered in table 2 together with resultsobtained in the experiments and results of modelling multiphase flow using DDPM. The changes of pressure andvolume fractions are illustrated after 20 s of simulations. From the tenth second of simulations data samplingfor time statistics was enabled to obtain values averaged in time.Making use of gathered values of pressure, for visualizing results the figure 12 was created. Pressure valuesobtained from simulations using DEM are higher than experimental and DDPM data as shown at figure 12.The greatest difference can be noticed for the particle diameter 531 µm, for the smaller diameters the differenceslightly decreases. For cases with smaller particle diameters (325 µm and 231 µm) dissimilarities in results aresmaller because the particle parcel diameter is approaching the particle diameter. The forces resulting fromcollisions are weakened since the mass of the parcel is decreased. To obtain results similar to experimentalvalues, the parcel diameter should be equal to the particle diameter in such a way one parcel would containonly one particle. However, the calculation time would be extended due to increased number of particle parcels.Hence the probability of interparticle collisions would also be greater.
Due to wrongly predicted, exaggerated collision forces, the uniform distribution of the material in the riseroccurs in a case with the biggest particle parcel diameter which can be seen in Fig. 13. Due to larger mass,parcels are reflecting from walls and each other constantly increasing energy. The obtained results are oppositeto expected, whereas in a case with bigger particles they should accumulate at the bottom of the riser andonly part of the material should occupy the top. Forces resulting from collisions are overpredicted, since themomentum is not calculated for the particle but for the parcel, which diameter is bigger. The decrease of thesize of the parcel results in similar pressure values as the experimental data.
Table 2: Pressure measurements points
Measurement points, - Height, mPressure, Pa
Experiment DDPMDEM
d=513um d=325um d=231um1 0 1002.08 1076.45 1278.95 1281.91 1262.942 0.07 562.61 917.91 1209.33 1110.63 1078.903 0.35 348.93 518.16 991.80 677.58 668.264 0.7 216.77 317.80 735.62 497.83 488.055 1 141.12 210.19 519.72 373.65 363.716 1.3 75.98 122.14 307.72 246.80 237.267 1.75 0.00 0.00 0.00 0.00 0.00
8

Figure 12: Time averaged pressures comparison for different cases
Figure 13: Averaged volume fraction distribution of phase 2in pilot-scale rig
Figure 14: Pressure averaged distribution of phase 2in pilot-scale rig
5. Conclusions
The work was divided into two parts: simulations of heat transfer together with combustion and modellingmultiphase flow in a pilot scale CFB testing rig. For this purpose the commercial code Ansys Fluent was used.For predicting interparticle collisions DEM was applied, as the main goal of the thesis was to check and inves-tigate if it is applicable to such problems. The temperature and particle distribution in a domain with changes
9

in its temperature were discussed. In the first part, by not having experimental results, analythical calculationswere made to check global mass and energy conservation from simulations. Comparing temperature of injectedsand particles, while only hot gas was flowing through domain, the values obtained both from Ansys Fluent andexternal source gave similar values (temperature rise of 10 K). Small value called into question if DEM modeldo not taint results. After further investigations and additional calculations it was found that heat transferis not calculated for single particle but for a parcel composed of particles (in order to decrease computationalcost). If the parcel had the diameter/mass of a single particle, the increase in temperature would be higherthan 410 K. Furthermore, the results obtained from simulating combustion of coal in a combustion chamberalmost covered with external calculations. At the outlet concentration of flue gas compounds was slightly lowerin domain with two side ports. Taking advantage of applying UDF, that allowed nipping mass of char and ashoff at the outlet of a domain the energy balance was calculated. For both cases similar value of energy absorbedby a sand to increase its temperature was obtained. Even though two variants can be treated as good solution,it leans towards applying two inlets of fuel to a chamber since results stabilize faster. In the second part, atrial to simulate multiphase flow through a pilot-scale test rig. Results of calculations diverged from experi-mental and DDPM values. Pressure distribution did not followed volume fraction of the solid phase in domain.Pressure rised from the bottom through the top while the volume fraction of the solid phase was biggest at thebottom and on the top, diluted in the middle of the riser. Assumed at the beginning that only for simulationsparticle parcels are created in order to simplify calculations, not influencing the results of collisions betweenparticles. Throughout additional simulations, it was found out that similarly to heat transfer between particlesalso momentum is calculated for the particle parcel. To obtain exact results of interparticle interactions theparticle parcel should contain only one particle inside, so is have the same diameter as particle itself.
References
[1] A. Szlek, R. Wilk, S. Werle, N. Schaffel, Czyste technologie pozyskiwania energii z wegla oraz prespektywybezplomieniowego spalania, Rynek spalania 25 (2009) 100–110 (2009).
[2] P. Palamarczuk, J. Konieczynski, Ekologiczne walory stosowania kotlow fluidalnych w sektorze komunalnym,Prace Naukowe GiG Gornictwo i Srodowisko 3 (2005) 99–118 (2005).
[3] Y. Zhang, L. Qinghai, Z. Hui, Theory and calculation of heat transfer in furnaces, 1st Edition, AcademicPress, 2016 (2016).
[4] K. Nuortimo, State of the art cfb technology for flexible large scale utility power production (March 2015).URL http://www.amecfw.fr/documents/downloads/technical-papers/state-of-the-art\
\-cfb-technology-utility-power-production.pdf
[5] H. Topal, Y. Altinsoy, O. Erbas, Des ign and application of automatic control system in a laboratory scalefluidized bed coal combustion system, Journal of Science 5(2) (2018) 49–63 (2018).
[6] P. Cundall, O. Strack, A discrete element model for granular assemblies, Geotechnique, 1979 (1979).
[7] J. Szargut, Termodynamika techniczna, Wydawnictwo Politechniki Slaskiej, 2003 (2003).
[8] M. Nikku, P. Jalali, T. Hyppanen, Comparison of Ansys Fluent and OpenFoam in simulation of circulatingfluidized bed riser., 12th International Conference on Fluidized Bed Technology 62 (2016) 100–111 (May2016).
[9] A. Bartoszewicz, Hybrid Euler-Lagrange approach for modelling transport phenomena in a laboratory CFBunit, Wydawnictwo Politechniki Slaskiej 2018.
10