Embed Size (px)
Citation preview

1
07/10/2015
Modelling Land Use Change in Brazil : 2000-2050
São Paulo, 07.07.2015
Gilberto CâmaraFAPESP Programme on Global Change Research
National Institute for Space Research, INPE

REDD-PAC project team(www.redd-pac.org)
Alexandre Ywata (IPEA)
Aline Soterroni (INPE)
Fernando Ramos (INPE)
Gilberto Câmara (INPE)
Pedro Andrade (INPE)
Ricardo Cartaxo (INPE)
Aline Mosnier (IIASA)
Florian Kraxner (IIASA)
Johannes Pirker (IIASA)
Michael Obersteiner (IIASA)
Rebecca Mant (WCMC)
Valerie Kapos (WCMC)

REDD+ Policy Assessment Centerwww.red-pac.org.br
Partner Institutions:
Duration: November 2011 – March 2016

What are the likely trajectories on Brazilianemissions?
0
500
1000
1500
2000
2500
20002010
20202030
1460
599
360
327
406
445
296
366505
76
95105
Residues
Industry
Energy
Agriculture
LUC?
Redução de 75% em florestas, crescimento em energia e agricultura

Brazil’s dilemma: deep-sea oil or renewables?

Brazil: Do biofuels cause indirect land change?

Brazil: Projected direct land change from biofuels (2020)
source: Lapola et al (PNAS, 2010)
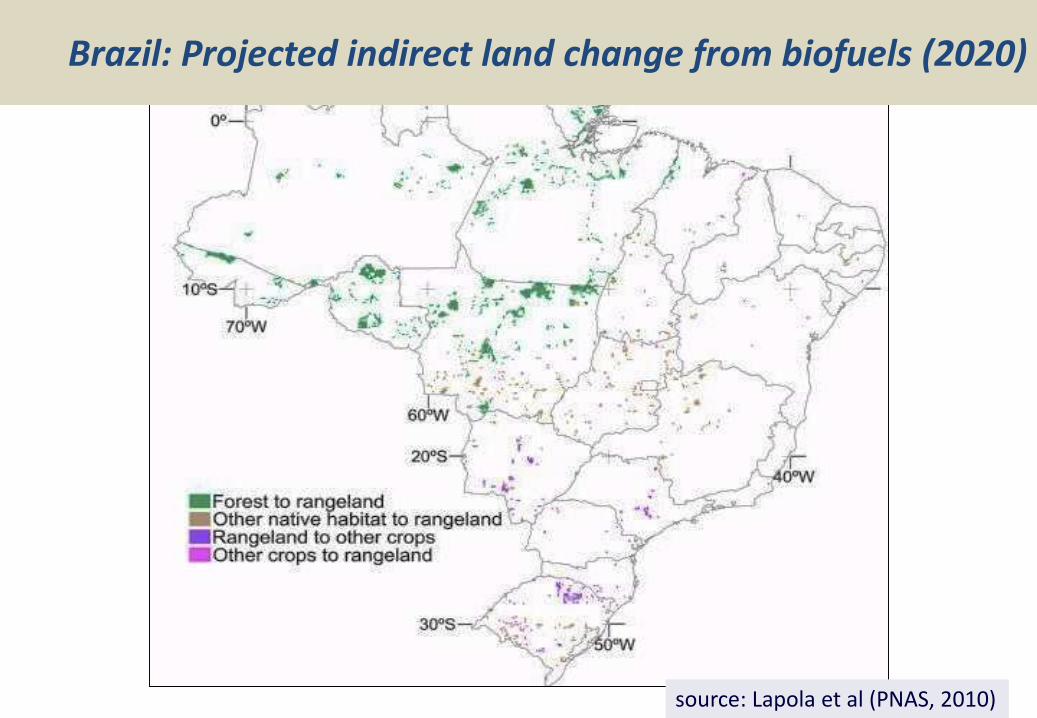
Brazil: Projected indirect land change from biofuels (2020)
source: Lapola et al (PNAS, 2010)source: Lapola et al (PNAS, 2010)

GLOBIOM: Global Biosphere Management Model
Partial equilibrium model: Agriculture, Forestry and Bioenergy sectors
MARKETS
Population & Economic Growth & Exogenous Demand Shocks
CommodityPrices and Quantities
Land Use
Environmental effects
LAND
SPA
TIA
L R
ESO
LUTI
ON
REG
ION
Wood Crops
Forest Cropland Pasture Other
Livestock
DEMAND
SUPPLY
source: IIASA

Base maps for GLOBIOM-Brazil
Forest 2000 Livestock 2000

Validation: GLOBIOM x IBGE for 2010

Validation: deforestation in Amazonia 2000-2010
PRODES (16.5 Mha) GLOBIOM (16.9 Mha)

Scenarios for land use policies

Environmental Debts and Surpluses (2010)
Debts
Surpluses

Projections for total forest in Amazonia

Projections for total forest in Cerrado

Projections for forest regrowth

Crop production grows, grassland decreases
0
20
40
60
80
100
120
2000 2010 2020 2030 2040 2050
Croplands (Mha) Cattle and pasture (heads and Mha)
Projections of GLOBIOM-Brasil model
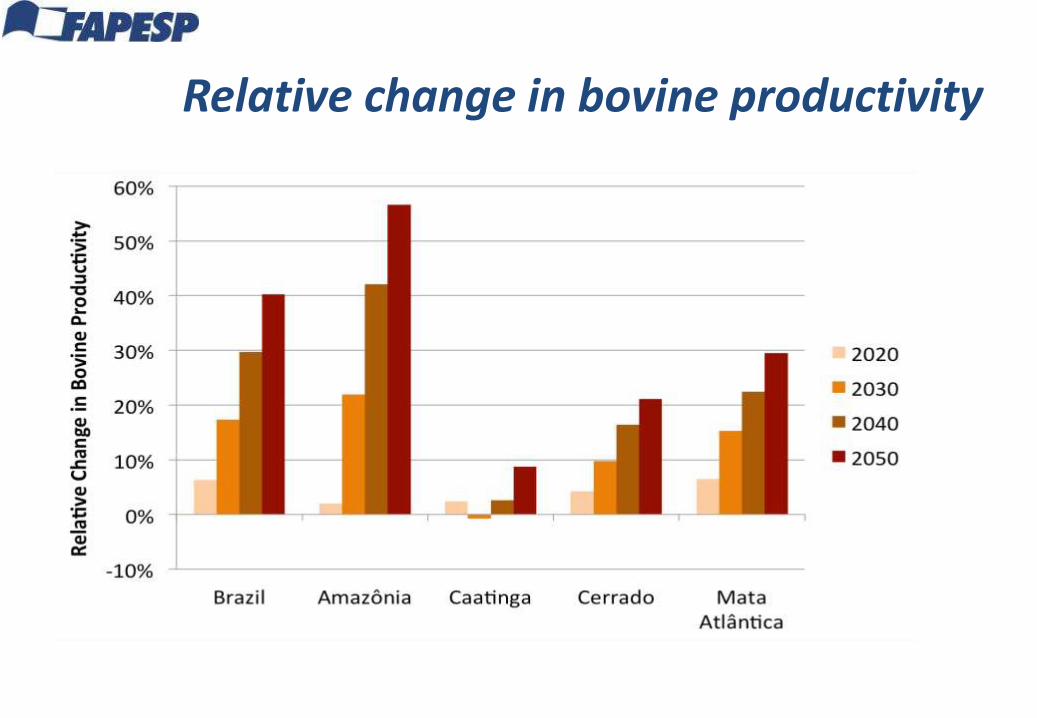
Relative change in bovine productivity

Brazil’s new Forest Code: zero net emissions from deforestation after 2030
Projections of GLOBIOM-Brasil model
(BAU = “business as usual”, FC = Forest Code)
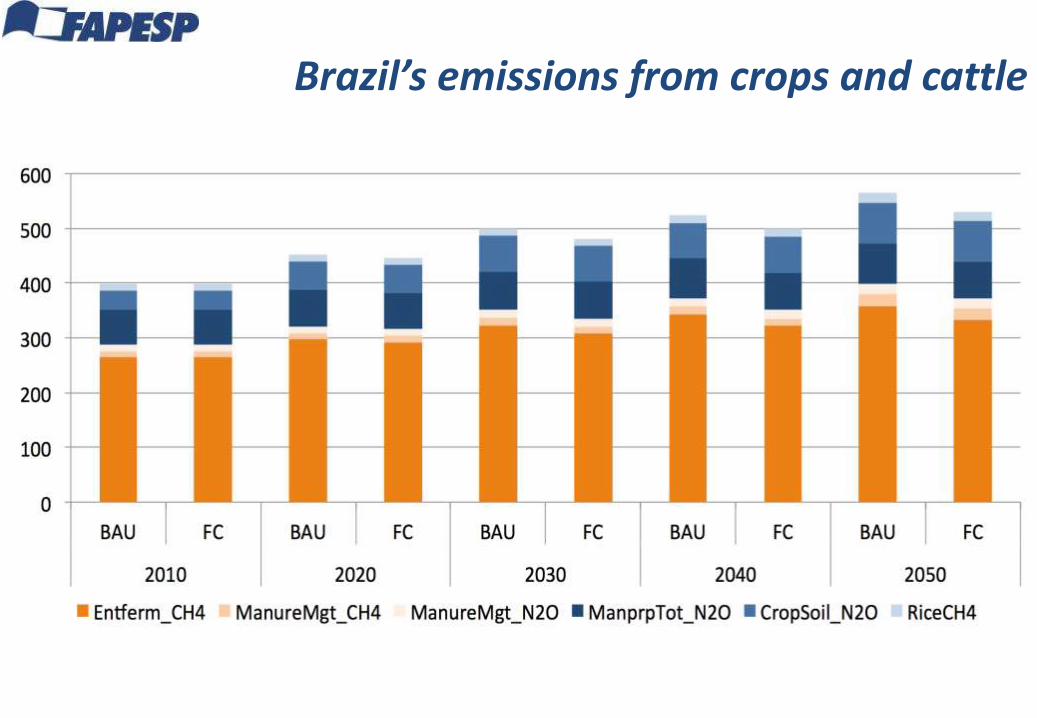
Brazil’s emissions from crops and cattle
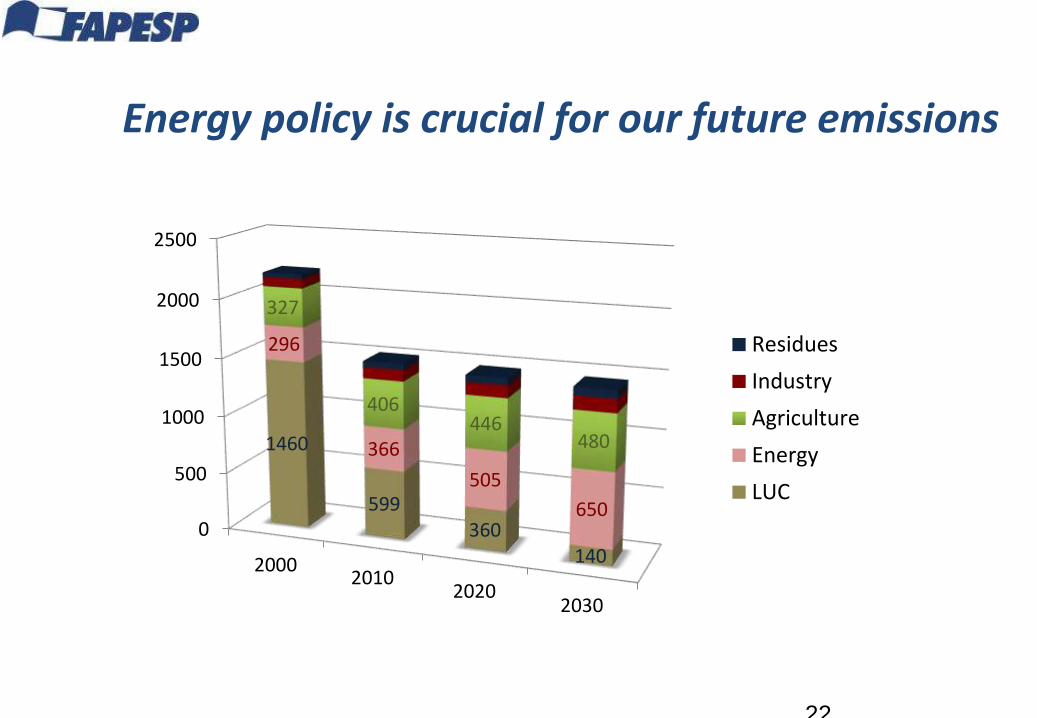
Energy policy is crucial for our future emissions
22
0
500
1000
1500
2000
2500
20002010
20202030
1460
599360
140
296
366
505
650
327
406446
480
Residues
Industry
Agriculture
Energy
LUC

Innovation + policies = low carbon economy
0%
5%
10%
15%
20%
25%
30%
2010 2020 2030
Conservative
Innovative
With the right carbon tax, biofuels can be 30% of energy matrix