Embed Size (px)
Citation preview
Modi Manoj Agarwal Gopal
https://doi.org/10.21278/TOF.44308 ISSN 1333-1124
eISSN 1849-1391
MODELLING, INVESTIGATION OF PROCESS RESPONSES, SURFACE ASSESSMENT AND PARAMETRIC OPTIMIZATION IN
POWDER MIXED ELECTRICAL DISCHARGE DIAMOND GRINDING OF TI6AL4V UTILIZING GREY-BASED TAGUCHI APPROACH
Summary
In this study, the powder mixed electrical discharge diamond grinding (PMEDDG) process was designed and a set-up for machining hard electrically conductive material surfaces built. The paper presents empirical models, investigation, an optimal setting of factors and the distinct surface production in the PMEDDG of Ti6Al4V with aluminium (Al) and silicon carbide (SiC) powder mixed dielectric fluid. The response surface methodology was applied to the modelling. One set of 32 experiments with Al powder and another set of 32 experiments with SiC powder mixed dielectric fluid were performed on a PMEDDG set-up. Current, pulse on time, wheel speed, duty cycle, and volumetric proportion of the powder were taken as input machining variables. Material removal rate and surface roughness were computed as outputs. The behaviour of the input factors against the responses was studied and compared with the SiC and Al powder mixed dielectric fluid used in the PMEDDG process. Further, scanning electron microscopy (SEM) investigations were carried out to determine the impact of different factors on the PMEDDG-produced surfaces as well as the effect of powder presence in the dielectric fluid on white recast layer thickness of the produced surfaces. The grey-based Taguchi approach was used to determine an optimal set of process variables when aluminium powder is used and a confirmation test was conducted on the optimal set to estimate the effectiveness of this approach.
Key words: powder mixed electrical discharge diamond grinding, analysis of variance (ANOVA), grey-based Taguchi approach, hybrid process, RSM, SEM, Ti6Al4V
1. Introduction Titanium and its alloys are generally utilized in aerospace, automotive and biomedical
industries as well as in various assembly companies because of their good strength/weight ratio, high resistance to corrosion, etc. Jilani et al. [1] carried out experiments with electrical discharge machining (EDM) of cemented carbide and proposed a model for single release. This study showed the impact of various factors and diverse carbide grades on the material removal rate (MRR), relative electrode wear (REW) and cavity size. The formulated models were utilized to determine the cavity size, swept volume/release and thickness of the re-solidified layer. Mahdivian et al. [2] performed experiments with EDM of mild steel. They
TRANSACTIONS OF FAMENA XLIV-3 (2020) 93
M. Manoj, A. Gopal Modelling, Investigation of Process Responses, Surface Assessment and Parametric Optimization in Powder Mixed Electrical Discharge Diamond Grinding of TI6AL4V Utilizing Grey-Based Taguchi Approach
formulated hypothetical models for MRR and surface quality. They also determined the impact of various factors on the responses. In their experimental work, Singh et al. [3] proposed the grey-based Taguchi approach for multiple response optimizations of EDM factors for the machining of aluminium-silicon carbide composites (10% wt). Tsai et al. [4] investigated EDM and suggested the use of the response surface methodology (RSM) for the investigation and modelling of the re-solidified layer of spheroidal graphite cast iron. Gangopadhyay et al. [5] performed experiments with EDM of M2 die steel and utilized the RSM approach for the formulation of surface roughness (SR), white layer thickness (WLT), and surface crack density models. They also revealed that current (I) and pulse on time (Ton) influence the integrity of the produced surface. In their experiments, Jeswani et al. [6] observed that blending of 4 gm/litre graphite powder in lamp oil improves the MRR and tool wear rate (TWR) in the EDM of mild steel. Modi et al. [7] performed the experiments with surface electrical diamond discharge grinding (SEDDG) of Ti6Al4V. They found that the application of the grey-based Taguchi methodology improves the productivity of machining. Lim et al. [8] reported that pulse duration, property of powder, electrodes polarity, current, and workpiece material influence the generation of mirror-like surfaces in powder mixed EDM. They also found that the spark gap in the powder mixing state is double when contrasted with EDM. Oczos et al. [9] clarified the philosophy and the uses of the hybrid machining process (HMP). They also described the issue related to the HMP and the necessity of additional progression in research endeavours to upgrade its uses. Mote et al. [10] conducted their experimental work with electrical diamond discharge grinding of high speed steel and observed that the inclusion of EDM and the grinding procedure improves the EDM effectiveness with respect to specific energy. They also formulated numerical models of the input factors and output responses to examine the relationship between input factors and the output responses. Jain, V K [27] reported on the performance of the HMP. Chakraborty et al. [11] proposed a modified principal component analysis method for multiple response optimization of process factors. This technique was utilized to acquire an optimal setting in two data sets in the wire EDM procedure. Lin et al. [12] performed experiments with computerised numerically controlled turning of SKD-11 steel and utilized the grey-based Taguchi approach in the multiple response optimization of process variables. Ravindra et al. [13] carried out experiments with the electrical discharge face grinding of erosion-abrasion based compound Al/SiC/B4C wheel. They studied the influence of the process factors on MRR and Ra. Umacharan et al. [14] performed tests with diamond electrical discharge drilling of Nimonic alloy. They described in detail the influence of process factors on Ra and the circularity of the drilled hole. Yadav et al. [15] conducted experiments with the cut-off grinding of Al/SiC/B4C in a hybrid process. They reported the impact of process variables on MRR and Ra. Mali et al. [16] conducted experiments with the cut-off diamond electrical discharge grinding of Inconel 718 and optimized the process variables through the combined approach of orthogonal array and grey relational analysis. Modi et al. [17] did tests with the powder mixed EDM of Nimonic 80A with Al and Cr powder mixed dielectric fluid. They described the adequacy of EDM and concluded that the properties of the powders included in the dielectric fluid have impact on the EDM. Rao et al. [18] performed experiments with EDDG of reaction-bonded silicon carbide (RBSiC) ceramics. They reported on the impacts of grit sizes and polarities of diamond grinding wheel on the quality of a machined surface. Singh et al. [19] did experiments with the abrasive mixed diamond electrical discharge grinding of Nimonic alloy. They found that the MRR is affected by speed, current and concentration of powder. Nirala et al. [20] conducted tests with the abrasive mixed diamond electrical discharge grinding of Monel K-500. They developed an ANN model with the input process factors and responses. They also optimised the process factors by applying the ANN-NSGA-II approach. Barzani et al. [21] performed experiments with the abrasive mixed diamond electrical discharge grinding of Nimonic 80A. They utilized the fuzzy logic
94 TRANSACTIONS OF FAMENA XLIV-3 (2020)

Modelling, Investigation of Process Responses, Surface Assessment and M. Manoj, A. Gopal Parametric Optimization in Powder Mixed Electrical Discharge Diamond Grinding of TI6AL4V Utilizing Grey-Based Taguchi Approach
approach to estimate the performance of this hybrid machining process. Unune et al. [22, 23] established numerical models of responses and analysed the effectiveness of artificial neural network and RSM models in forecasting the MRR and surface roughness in the machining of Inconel 718 with the SEDDG process. They also reported that the blending of powders in dielectric fluid enhances the MRR and improves the surface quality. Tripathy et al. [24] did tests with powder mixed EDM of H-11 tool steel. They studied the influence of the input process factors on the responses and utilised the TOPSIS method for the estimation of an optimal setting of process factors. Modi et al. [25] used the dimensional analysis method for establishing MRR and surface roughness models for drilling with the powder mixed electrical discharge machining of EN 31 steel. They also explored the effect of procedure factors on the procedure results.
From the above literature survey, it can be seen that the machining of Ti6Al4V by applying the PMEDDG procedure with silicon carbide (SiC) and aluminium (Al) powder mixed dielectric fluid is another area under development. The goals of this study are as follows: (a) to investigate the impact of process factors on MRR and average roughness of the surface (Ra) in the machining of Ti6Al4V by applying the PMEDDG process with SiC and Al powder mixed dielectric fluid; (b) to formulate numerical models of MRR and Ra by applying the RSM method; (c) to examine the effect of process factors on the machined surfaces and on the white recast layer thickness (WRLT) through the analysis of scanning electron microscopy (SEM) micrographs; (d) to compute an optimal set of factors in the machining of Ti6Al4V by applying the PMEDDG process with Al powder mixed dielectric fluid in multiple output optimizations by utilizing the grey-based Taguchi technique.
To fulfill these objectives, one set of 32 experiments with Al powder and another set of 32 experiments with SiC powder mixed dielectric fluid were performed on a PMEDDG set-up. Mathematical models of responses were developed with Design-Expert software. The grey-based Taguchi approach was utilized to discover an optimal set of process variables in the PMEDDG of Ti6Al4V with aluminium powder mixed dielectric fluid in the multiple response optimization. For this purpose, one set of 18 experiments with Al powder mixed dielectric fluid was conducted in accordance with the L18 Taguchi-orthogonal array using the PMEDDG set-up. To verify the effectiveness of the approach, the optimum combination suggested by this approach and the obtained results were compared with initial values.
2. Experimentation on the PMEDDG set-up Two sets of 32 experiments i.e. one set of 32 experiments with aluminium (Al) powder
and the second set of 32 experiments with silicon carbide (SiC) powder mixed dielectric fluid were performed on a PMEDDG set-up for the processing of Ti6Al4V. All details of this set-up are available in Modi et al. [26]. The schematic photographic diagram of the PMEDDG set-up is shown in Fig. 1.
Fig.1 Schematic diagram of electrical discharge diamond grinding set-up
TRANSACTIONS OF FAMENA XLIV-3 (2020) 95

M. Manoj, A. Gopal Modelling, Investigation of Process Responses, Surface Assessment and Parametric Optimization in Powder Mixed Electrical Discharge Diamond Grinding of TI6AL4V Utilizing Grey-Based Taguchi Approach
The details about the bronze diamond wheel are given in Table 1. The material of the workpiece is Ti6Al4V. Its composition is shown in Table 2. The workpiece is rectangular and flat in shape. Its dimensions are 65 mm x 20 mm x 20 mm.
Table 1 Particulars of bronze diamond grinding wheel
Abrasive Diameter Thickness Bond material Concentration Bore Depth of abrasive Grit size Diamond 100 mm 10 mm Bronze 75 % 32 mm 5 mm 80/100
Table 2 Composition of Ti6Al4V (Grade-5)
Carbon Ti Al V Fe 0.02% 90.1 % 6.05% 3.7 % 0.13%
Eqs 1 and 2 are utilized to compute the MRR (mg/minute) and MRR (mm3/minute), respectively, after every experiment.
(WWBM) (WWAM)MRR (mg/ minute) 1000t
(1)
3 (WWBM) (WWAM)MRR (mm / minute) 1000t
(2)
The machining time (t) in this procedure is equivalent to 45 minutes and the density of the material is ρ = 4.37 gm/cm3. The terms WWBM and WWAM, used in Eqs 1 and 2, refer to the weight of the workpiece before and after the machining. The MRR was evaluated by using a Wensar electronic balance. Ra was assessed by a Surtronic-25 SR analyser at the c-off value of 2.5 mm. An advanced tachometer was used for the estimation of the grinding wheel speed.
3. RS modelling The RSM is a merger of arithmetic and statistical methodology. This method is utilized
to determine the relationship between input and output machining factors. All experiments were performed as per central composite rotary design (CCRD) plan.
The response surface is described by Eq. 3. It is the adequate method to access the second order model.
20
1 1
m m
p p pp p pq p qp p q p
Z b b y b y b y y .
(3)
Where, Z predicted response bpp quadratic term coefficient b0 free term coefficient bpq cross product term coefficient bp linear term coefficient p 1,2, …, m q 2,3, …, m+1 m No. of variables y coded variables
4. Experimental data with aluminium powder In total, 32 experiments were conducted on the PMEDDG set-up with aluminium
powder mixed dielectric fluid. The level and value of the factors associated with these experiments are shown in Table 3.
96 TRANSACTIONS OF FAMENA XLIV-3 (2020)

Modelling, Investigation of Process Responses, Surface Assessment and M. Manoj, A. Gopal Parametric Optimization in Powder Mixed Electrical Discharge Diamond Grinding of TI6AL4V Utilizing Grey-Based Taguchi Approach Table 3 Level and value of factors in aluminium/silicon carbide powder mixed dielectric fluid in PMEDDG
process Parameters Unit -2 -1 0 +1 +2 Current (I) Ampere 1 3 5 7 9
Pulse on time (Ton) µ-s 40 70 100 130 160 Wheel speed (S) RPM 350 450 550 650 750 Duty cycle (DC) % 0.59 0.63 0.67 0.71 0.75
Al/SiC powder concentration (CP) gm/litre 1.5 2 2.5 3 3.5
The practical CCRD plan and its responses in the aluminium powder mixed dielectric fluid in the PMEDDG process are shown in Table 4.
Table 4 Practical CCRD plan and its responses in aluminium powder mixed dielectric fluid in PMEDDG process
Exp. No.
Current I / Ampere
Pulse on time Ton / µ-s
Wheel speedS / RPM
Duty cycleDC / %
Powder concentration CP / gm/litre
Experimental MRR /
mm3/minute Ra / µm
1 ‐2.00 0.00 0.00 0.00 0.00 0.272 2.692 ‐1.00 1.00 1.00 1.00 ‐1.00 0.44 3.803 0.00 0.00 0.00 0.00 0.00 0.48 3.844 ‐1.00 ‐1.00 ‐1.00 1.00 ‐1.00 0.206 3.935 0.00 0.00 0.00 0.00 0.00 0.49 3.826 1.00 1.00 ‐1.00 1.00 ‐1.00 0.614 5.467 ‐1.00 1.00 ‐1.00 1.00 1.00 0.33 4.418 0.00 0.00 0.00 0.00 0.00 0.55 3.769 0.00 0.00 ‐2.00 0.00 0.00 0.336 4.4510 0.00 0.00 0.00 0.00 2.00 0.65 4.7311 0.00 0.00 0.00 0.00 0.00 0.51 3.9612 0.00 0.00 0.00 0.00 ‐2.00 0.46 3.5813 1.00 ‐1.00 ‐1.00 1.00 1.00 0.482 5.1514 1.00 1.00 ‐1.00 ‐1.00 1.00 0.84 4.2715 ‐1.00 ‐1.00 1.00 ‐1.00 ‐1.00 0.398 2.5416 ‐1.00 1.00 ‐1.00 ‐1.00 ‐1.00 0.384 3.0217 0.00 2.00 0.00 0.00 0.00 0.63 3.9818 ‐1.00 1.00 1.00 ‐1.00 1.00 0.54 2.8719 ‐1.00 ‐1.00 ‐1.00 ‐1.00 1.00 0.294 3.0620 1.00 1.00 1.00 1.00 1.00 0.76 5.0221 0.00 0.00 0.00 0.00 0.00 0.53 3.7722 ‐1.00 ‐1.00 1.00 1.00 1.00 0.36 3.5023 0.00 0.00 0.00 0.00 0.00 0.48 3.9524 0.00 0.00 2.00 0.00 0.00 0.66 3.5325 1.00 ‐1.00 ‐1.00 ‐1.00 ‐1.00 0.58 3.6926 1.00 1.00 1.00 ‐1.00 ‐1.00 0.88 3.6527 2.00 0.00 0.00 0.00 0.00 0.921 4.8028 1.00 ‐1.00 1.00 1.00 ‐1.00 0.63 4.2829 0.00 ‐2.00 0.00 0.00 0.00 0.374 3.1330 0.00 0.00 0.00 2.00 0.00 0.405 4.8831 0.00 0.00 0.00 ‐2.00 0.00 0.552 3.0132 1.00 ‐1.00 1.00 ‐1.00 1.00 0.678 3.23
TRANSACTIONS OF FAMENA XLIV-3 (2020) 97

M. Manoj, A. Gopal Modelling, Investigation of Process Responses, Surface Assessment and Parametric Optimization in Powder Mixed Electrical Discharge Diamond Grinding of TI6AL4V Utilizing Grey-Based Taguchi Approach
4.1 Numerical modelling of practical test responses for aluminium powder mixed dielectric fluid The numerical models for MRR and Ra are acquired by the use of Design Expert
software [31]. These models are delineated by Eqs 4 and 5 as follows:
2 2MRR 0 51 0 16 0 070 0 067 0 044 0 022 0 022Al on. . I . T . S . DC . CP . I (4) 2 2 23 88 0 49 0 20 0 25 0 54 0 14 0 078 0 072aAl on onR . . I . T . S . DC . CP . T . CP (5)
From Figs 2 and 3 it can be seen that the predicted values from the empirical model are in a good agreement with the actual values of MRR and Ra. Different graphs have been created between the input factors and the responses by using Eqs 4 and 5. These graphs are shown in Figs 6 to 13.
Fig. 2 Plot of actual and predicted output Fig. 3 Plot of actual and predicted output for MRR with Al powder for Ra with Al powder
4.2 ANOVA investigation for aluminium powder mixed dielectric fluid The results of the analysis of variance (ANOVA) are shown in Table 5. It is observed
that the measure of p is under 0.05 in the models. Hence, it is presumed that the above developed numerical models of the process outcomes are satisfactory to explain the relationship between the process factors and the responses.
Table 5 ANOVA of MRR and Ra models with aluminium powder mixed dielectric fluid MRR model Ra model
Source DF SS MS F P DF SS MS F P Model 6 0.90 0.15 95.7 < 0.0001 7 16.1 2.31 84.8 < 0.0001
Residual error 25 0.04 0.0015 24 0.65 0.027 Total 31 0.94 31 16.7
5. Experimental data with silicon carbide powder Another set of 32 experiments were conducted on the PMEDDG set-up with silicon
carbide powder mixed dielectric fluid. The level and value of factors associated with these experiments are shown in Table 3.
The practical CCRD plan and its responses in the silicon carbide powder mixed dielectric fluid in the PMEDDG process are shown in Table 6.
98 TRANSACTIONS OF FAMENA XLIV-3 (2020)

Modelling, Investigation of Process Responses, Surface Assessment and M. Manoj, A. Gopal Parametric Optimization in Powder Mixed Electrical Discharge Diamond Grinding of TI6AL4V Utilizing Grey-Based Taguchi Approach Table 6 Practical plan for CCRD and outputs for PM EDDG process with silicon carbide mixed dielectric fluid
Exp. No.
Current I / Ampere
Pulse on time Ton / µ-s
Wheel speed S / RPM
Duty cycle DC / %
Powder concentration CP / gm/litre
Experimental MRR /
mm3/minute Ra / µm
1 1.00 -1.00 1.00 1.00 -1.00 0.567 4.322 -1.00 1.00 1.00 1.00 -1.00 0.406 3.893 -1.00 -1.00 -1.00 1.00 -1.00 0.189 4.024 0.00 0.00 0.00 0.00 0.00 0.442 3.935 0.00 0.00 2.00 0.00 0.00 0.595 3.576 1.00 1.00 1.00 1.00 1.00 0.687 5.17 0.00 0.00 0.00 0.00 0.00 0.503 3.838 -1.00 -1.00 1.00 -1.00 -1.00 0.362 2.579 0.00 0.00 0.00 0.00 0.00 0.449 3.9
10 -1.00 -1.00 1.00 1.00 1.00 0.325 3.5511 0.00 0.00 -2.00 0.00 0.00 0.307 4.5312 1.00 1.00 1.00 -1.00 -1.00 0.792 3.6913 -1.00 1.00 1.00 -1.00 1.00 0.49 2.9214 0.00 0.00 0.00 0.00 -2.00 0.419 3.6315 -1.00 1.00 -1.00 1.00 1.00 0.302 4.516 0.00 0.00 0.00 0.00 0.00 0.465 4.0217 -1.00 1.00 -1.00 -1.00 -1.00 0.349 3.0518 1.00 -1.00 1.00 -1.00 1.00 0.6102 3.2619 -2.00 0.00 0.00 0.00 0.00 0.251 2.7620 0.00 0.00 0.00 2.00 0.00 0.3645 4.9321 1.00 1.00 -1.00 -1.00 1.00 0.765 4.3222 1.00 -1.00 -1.00 -1.00 -1.00 0.522 3.7323 0.00 0.00 0.00 0.00 2.00 0.593 4.8124 0.00 2.00 0.00 0.00 0.00 0.572 4.0225 -1.00 -1.00 -1.00 -1.00 1.00 0.266 3.1126 0.00 0.00 0.00 0.00 0.00 0.479 3.8327 0.00 -2.00 0.00 0.00 0.00 0.3366 3.1628 1.00 1.00 -1.00 1.00 -1.00 0.562 5.5729 0.00 0.00 0.00 -2.00 0.00 0.4968 3.0430 0.00 0.00 0.00 0.00 0.00 0.433 431 2.00 0.00 0.00 0.00 0.00 0.8289 4.8532 1.00 -1.00 -1.00 1.00 1.00 0.439 5.22
5.1 Numerical modelling of practical test responses for silicon carbide powder mixed dielectric fluid The empirical models for MRR and Ra are obtained by the utilization of Design-Expert
software [31]. These developed models are outlined by Eqs 6 and 7.
2MRR 0 46 0 14 0 064 0 059 0 039 0 020 0 019SiC on. . I . T . . DC . CP . I (6) 2 23 93 0 49 0 21 0 26 0 55 0 15 0 085 0 073aSiC on onR . . I . T . S . DC . CP . T . CP (7)
The predicted values obtained through the developed model are found to be in a good agreement with the actual experimental values of MRR and Ra as depicted in Figs 4 and 5, respectively.
TRANSACTIONS OF FAMENA XLIV-3 (2020) 99

M. Manoj, A. Gopal Modelling, Investigation of Process Responses, Surface Assessment and Parametric Optimization in Powder Mixed Electrical Discharge Diamond Grinding of TI6AL4V Utilizing Grey-Based Taguchi Approach
Fig. 4 Plot of actual and predicted output Fig. 5 Plot of actual and predicted output for MRR with SiC powder for Ra with SiC powder
5.2 ANOVA investigation for silicon carbide powder mixed dielectric fluid
The obtained ANOVA results are shown in Table 7. It can be seen that the proportion of p is under 0.05 for the models. Thus, it is assumed that the developed empirical models of the process results are essential to clarify the relationship between the process factors and the responses.
Table 7 ANOVA of MRR and Ra models with silicon carbide powder mixed dielectric fluid MRR Model Ra Model
Source DF SS MS F P DF SS MS F P Model 6 0.73 0.12 90.4 < 0.0001 7 16.67 2.38 81.77 < 0.0001
Residual error 25 0.033 0.0013 24 0.70 0.029 Total 31 0.76 31 17.36
Various graphs were created for input factors and responses by using Eqs 6 and 7. These are shown in Figs 6 to 13.
Fig. 6 Effect of I on MRR with distinct DC (S =550 RPM, Ton= 100µ-s, CP = 2.5 gm/litre, Al-P = presence of
aluminium powder in dielectric fluid, SiC-P = presence of silicon carbide powder in dielectric fluid)
100 TRANSACTIONS OF FAMENA XLIV-3 (2020)

Modelling, Investigation of Process Responses, Surface Assessment and M. Manoj, A. Gopal Parametric Optimization in Powder Mixed Electrical Discharge Diamond Grinding of TI6AL4V Utilizing Grey-Based Taguchi Approach
Fig. 7 Effect of I on MRR with distinct Ton (S = 550 RPM, DC = 0.67, CP = 2.5 gm/litre, Al-P = presence of
aluminium powder in dielectric fluid, SiC-P = presence of silicon carbide powder in dielectric fluid)
Fig. 8 Effect of I on MRR with distinct S (Ton= 100µ-s, DC = 0.67, CP = 2.5 gm/litre, Al-P = presence of
aluminium powder in dielectric fluid, SiC-P = presence of silicon carbide powder in dielectric fluid)
Fig. 9 Effect of S on MRR for with distinct I (Ton= 100µ-s, DC = 0.67, CP = 2.5 gm/litre, Al-P = presence of
aluminium powder in dielectric fluid, SiC-P = presence of silicon carbide powder in dielectric fluid)
Fig. 10 Effect of I on Ra with distinct DC (S = 550 RPM, Ton = 100µ-s, CP = 2.5 gm/litre, Al-P = presence of
aluminium powder in dielectric fluid, SiC-P = presence of silicon carbide powder in dielectric fluid)
TRANSACTIONS OF FAMENA XLIV-3 (2020) 101

M. Manoj, A. Gopal Modelling, Investigation of Process Responses, Surface Assessment and Parametric Optimization in Powder Mixed Electrical Discharge Diamond Grinding of TI6AL4V Utilizing Grey-Based Taguchi Approach
Fig. 11 Effect of I on Ra with distinct Ton (S = 550 RPM, DC = 0.67, CP = 2.5 gm/litre, Al-P = presence of
aluminium powder in dielectric fluid, SiC-P = presence of silicon carbide powder in dielectric fluid)
Fig. 12 Effect of I on Ra with distinct S (Ton = 100µ-s, DC = 0.67, CP = 2.5 gm/litre, Al-P = presence of
aluminium powder in dielectric fluid, SiC-P = presence of silicon carbide powder in dielectric fluid)
Fig. 13 Effect of S on Ra with distinct I (Ton = 100µ-s, DC = 0.67, CP = 2.5 gm/litre, Al-P = presence of
aluminium powder in dielectric fluid, SiC-P = presence of silicon carbide powder in dielectric fluid)
6. Analysis and interpretations of results The analysis of the results is summarised in Table 8 which includes also the explanation
of Figs 6 to 13.
Table 8 Analysis and explanation of results from Figs 6 to 13
Fig. number
Two dashed/ Three
dotted line
Dielectric fluid
(with Al and SiC powder)
Pattern 1 in Fig.
Cause for curve trend 1 in Fig.
Pattern 2 in Fig.
Cause for curve trend 2 in Fig.
6
Two dashed
line
With Al powder
MRR increase
with a rise in ampere current.
Extra energy is created by spark because of rising
pattern in I.
MRR increase with
a falling pattern in
DC.
Ton is rising up consistently to get the decreasing tendency in DC. This is why
enough time is available for de-ionization and flushing of DF. Three
dotted line With SiC powder
102 TRANSACTIONS OF FAMENA XLIV-3 (2020)

Modelling, Investigation of Process Responses, Surface Assessment and M. Manoj, A. Gopal Parametric Optimization in Powder Mixed Electrical Discharge Diamond Grinding of TI6AL4V Utilizing Grey-Based Taguchi Approach
7
Two dashed
line
With Al powder
- -
MRR increase with a decrease in
Ton.
Ton is rising up consistently. This is why enough time is available for the
conduction. Three dotted line
With SiC powder
8
Two dashed
line
With Al powder
- -
MRR increase with an increase
in S.
Extra energy created by spark is scattered due to an increase in S. It
occurs because current flowing rate in the crushing zone increases. Three
dotted line With SiC powder
9
Two dashed
line
With Al powder
MRR increase
with a rise in wheel speed.
Flushing rises and gap-width falls because of an increase in wheel speed.
MRR increase with an increase
in I.
Extra energy is created by spark because of rising pattern in I.
Three dotted line
With SiC powder
10
Two dashed
line
With Al powder Ra increase
with an increase in I.
Extra energy is created by spark because of rising
pattern in I.
Ra increase with an
increase in DC.
Ton is diminishing consistently to get the rising pattern in DC. This is why less time is available for deionization and
flushing of DF. Three dotted line
With SiC powder
11
Two dashed
line
With Al powder
- -
Ra increases with a rise in
pulse on time.
Ton is rising constantly with the goal that enough time is available for warmth conduction of workpiece. MRR rises because of conditioning of workpiece
and subsequently Ra increases because of generation of larger craters.
Three dotted line
With SiC powder
12
Two dashed
line
With Al powder
- - Ra falls with a rise in S.
Every single evacuated molecule from IEG is removed by productive flushing.
This is acquired by an increase in S. The adherence of evacuated molecules
from workpiece is reduced. Three
dotted line With SiC powder
13
Two dashed
line
With Al powder Ra falls with
a rise in S.
Flushing increases with an increase in S and
reduces Ra.
Ra increase with an
increase in I.
Extra energy is created by spark because of rising pattern in I.
Three dotted line
With SiC powder
*Variation in MRR and Ra in PMEDDG procedure with SiC and Al powder mixed dielectric fluid (comment on Table 8)
Figs 6 to 9 show that the mechanism of the removal of metal in the PMEDDG process with the powder mixed dielectric fluid is such because of the occurrence of the (spark + series) discharge and the grinding between the wheel and the workpiece. The molecules of the SiC/Al powder in the interelectrode gap (IEG) get empowered and quickened by the connected electric field and then they move along criss-cross paths. The powder molecules help the breakdown in the IEG and increase the spark gap between the electrodes. The series discharge happens in the IEG because of the occurrence of short circuiting between the electrodes. This happens due to a reduction in the insulating strength of the dielectric fluid because of the bridging effect of powder molecules. The thermal conductivity of an aluminium powder molecule is higher than that of the silicon carbide powder, which subsequently results in a higher MRR. Figs 10 to 13 show that the spark gap between the electrodes is larger with aluminium powder mixed dielectric fluid. In addition, more silicon carbide powder molecules are available in the IEG because silicon carbide powder possesses higher density resulting in the worst surface generation as compared to the case with aluminium powder in the IEG. This investigation suggested that the best results are acquired in the PMEDDG process with the aluminium powder mixed dielectric fluid as compared to the SiC powder mixed dielectric fluid.
TRANSACTIONS OF FAMENA XLIV-3 (2020) 103

M. Manoj, A. Gopal Modelling, Investigation of Process Responses, Surface Assessment and Parametric Optimization in Powder Mixed Electrical Discharge Diamond Grinding of TI6AL4V Utilizing Grey-Based Taguchi Approach
7. Investigation of PMEDDG-produced surface SEM examinations were conducted to study the impact of different procedure factors on
surfaces created using the PMEDDG process with SiC and Al powder mixed dielectric fluid. The SEM investigation has also been conducted to see the effect of the presence of SiC and Al powder mixed dielectric fluid on the white recast layer thickness.
SEM was used at 500X magnification. The scale used in all SEM images was 20 μm. A flat machined workpiece was prepared for the SEM investigation in the following steps: a) 4/0 sand paper was utilized to granulate the generated surfaces, b) the generated surfaces were rinsed and brightened by polishing followed by etching with an etching solution (accumulation of H2O = 88 %, HNO3 = 10 %, and HF = 2 %) for one minute.
The influence of current (I), and Ton in the case of the surfaces produced by the PMEDDG of Ti6Al4V (with aluminium and silicon carbide powder mixed dielectric fluid) is shown in Figs 14 (a to d), and 15 (a to d), respectively. The following has been deduced by analysing the SEM pictures. The craters on the surface are broader and larger with an increase in I or Ton. This happens because of the creation of extra energy due to the rising pattern in I or Ton. It is also observed from the SEM pictures that the craters on the surface are smaller and cramped with aluminium in comparison to the silicon carbide powder mixed dielectric fluid in the case of the EDDG of Ti6Al4V.
Fig. 14 Effect of current on PMEDDG-produced surface; a) with Al powder, I = 2 ampere; b) with SiC powder,
I = 2 ampere; c) with Al powder, I = 10 ampere; d) with SiC powder, I = 10 ampere; (S = 550 RPM, DC = 0.80, Ton = 300 µ-s, CP = 5 gm/litre)
a) b)
c) d)
104 TRANSACTIONS OF FAMENA XLIV-3 (2020)

Modelling, Investigation of Process Responses, Surface Assessment and M. Manoj, A. Gopal Parametric Optimization in Powder Mixed Electrical Discharge Diamond Grinding of TI6AL4V Utilizing Grey-Based Taguchi Approach
Fig. 15 Effect of Ton on PMEDDG-produced surfaces; a) with Al powder, Ton = 100 µ-s; b) with SiC powder,
Ton = 100 µ-s; c) with Al powder, Ton = 200 µ-s; d) with SiC powder, Ton = 200 µ-s; (I = 6 ampere, S = 550 RPM, DC = 0.80, CP = 5 gm/litre)
The influence of DC in the case of the surfaces produced by the PMEDDG of Ti6Al4V (with aluminium and silicon carbide powder mixed dielectric fluid) is shown in Figs 16a to d. The following has been deduced by analysing the SEM pictures. The craters on the surface are broader and larger with an increase in DC, so that Ra rises due to the occurrence of a continuous spark. It is also observed from the SEM pictures that the craters on the surface are smaller and cramped with aluminium in comparison to silicon carbide powder mixed dielectric fluid in the case of the EDDG of Ti6Al4V.
Fig. 16 Effect of DC on PMEDDG-produced surface; a) with Al powder, DC = 0.70; b) with SiC powder,
DC = 0.70; c) with Al powder, DC = 0.75; d) with SiC powder, DC = 0.75; (I = 6 ampere, S = 550 RPM, Ton = 100 µ-s, CP = 5 gm/litre)
a) b)
c) d)
a) b)
c) d)
TRANSACTIONS OF FAMENA XLIV-3 (2020) 105

M. Manoj, A. Gopal Modelling, Investigation of Process Responses, Surface Assessment and Parametric Optimization in Powder Mixed Electrical Discharge Diamond Grinding of TI6AL4V Utilizing Grey-Based Taguchi Approach
The influence of wheel speed (S) in the case of the surfaces produced by the PMEDDG of Ti6Al4V (with aluminium and silicon carbide powder mixed dielectric fluid) is shown in Figs 17a to d. The following has been deduced by analysing the SEM pictures. The craters on the surface are thinner and smaller with an increase in S, so that Ra falls because of productive flushing in the IEG and, furthermore, the chances of arcing in the IEG decrease. Subsequently, the increase in S is the main reason for the production of thinner and smaller craters on the machined surface.
Fig. 17 Effect of S on PMEDDG-produced surface; a) with Al powder, S = 650 RPM; b) with SiC powder,
S = 650 RPM; c) with Al powder, S = 750 RPM; d) with SiC powder, S = 750 RPM; (I = 6 ampere, DC = 0.80, Ton= 100 µ-s, CP = 5 gm/litre)
It can be seen in all SEM pictures that craters on the PMEDDG-generated surfaces are narrower and smoother when aluminium powder was used as compared to the silicon carbide powder mixed dielectric fluid. It was observed that the gap between the anode and the cathode when aluminium powder was used is marginally larger when contrasted with the silicon carbide powder mixed dielectric liquid, which is attributable to its lower electrical resistivity. This smallest spark gap would be accountable for extreme gas blast pressure when silicon carbide powder is used. Furthermore, the silicon carbide powder density is higher than the aluminium powder density, resulting in arcing rather than sparking. Consequently, Ra is higher in the case of silicon carbide when contrasted with aluminium powder. Al powder delivered superior surface finish as compared to SiC powder.
7.1 Investigation of PMEDDG-produced WRLT By investigating the SEM pictures shown in Figs 18a and b, it is seen that WRLT is
lower in the case of the Al powder mixed dielectric fluid when contrasted with the SiC powder mixed dielectric fluid in the PMEDDG of Ti6Al4V. This happens because the presence of SiC powder in the IEG is responsible for the occurrence of arcing instead of sparking.
a) b)
c) d)
106 TRANSACTIONS OF FAMENA XLIV-3 (2020)

Modelling, Investigation of Process Responses, Surface Assessment and M. Manoj, A. Gopal Parametric Optimization in Powder Mixed Electrical Discharge Diamond Grinding of TI6AL4V Utilizing Grey-Based Taguchi Approach
Fig. 18 Effect of powders on PMEDDG-produced WRLT; a) with Al powder, t = 30 µm, (b) with SiC powder,
t = 44 µm, (I = 6 ampere, Ton = 200 µs, DC = 0.80, S = 750 RPM, CP = 5 gm/litre)
It is noted from the investigation and interpretation of the results as well as from the study of the SEM images that the best result is obtained in the PMEDDG process of Ti6Al4V in the presence of aluminium powder mixed dielectric fluid. The reason for this is that one set of 18 tests was conducted in accordance with L18 Taguchi orthogonal array on the set-up in the presence of aluminium powder mixed dielectric fluid.
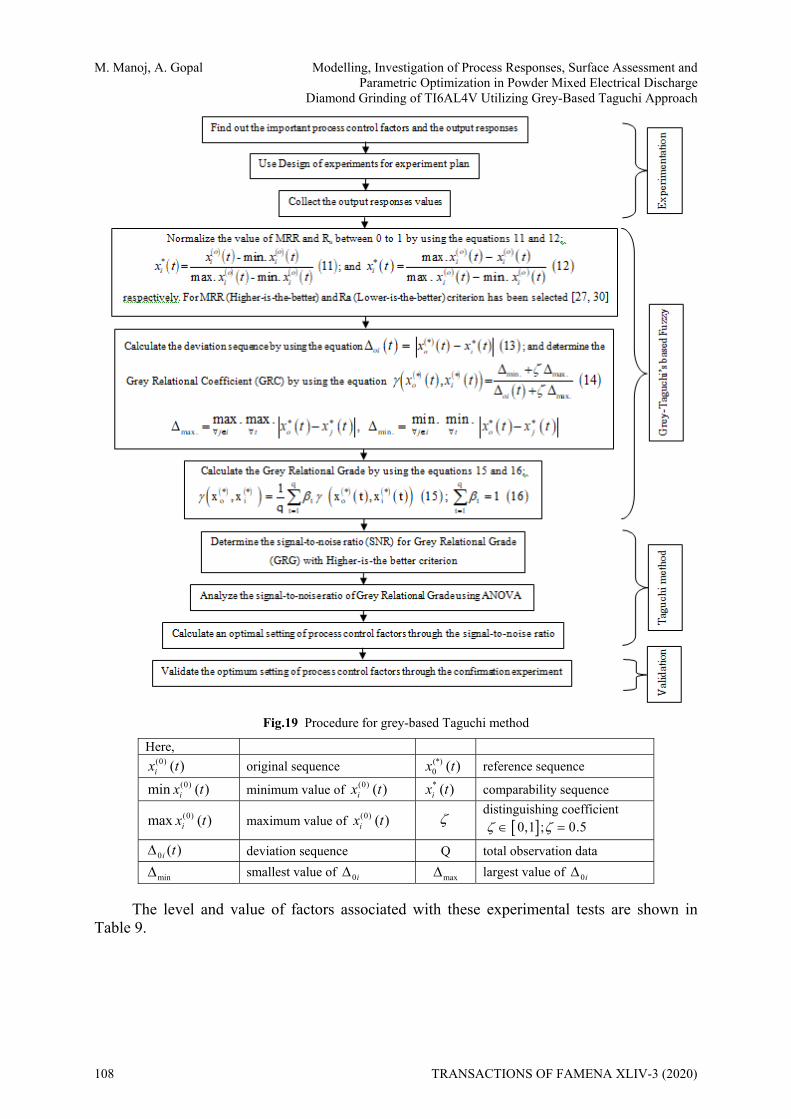
8. Multiple response optimization by applying grey-based Taguchi method The procedure for the application of the grey-based Taguchi method is shown in Fig. 19. There are three sorts of signal-to-noise (SN) proportions: the lower-is-the-better, the
higher-is-the-better, and the nominal-is-the-better, and they are communicated as [29]. The SN ratio is determined by using Eqs 8, 9, and 10.
(i) Lower-is-the-better
2
1
110logn
ii
S yN n
(8)
(ii) Higher-is-the-better
21
1 110logn
i i
SN n y
(9)
(iii) Normal-is-the-better
2
1
110logn
ii
S yN ns
(10)
where yi is the ith estimation of the estimated output, n is the number of runs and s is the standard deviation.
a) b)
TRANSACTIONS OF FAMENA XLIV-3 (2020) 107
M. Manoj, A. Gopal Modelling, Investigation of Process Responses, Surface Assessment and Parametric Optimization in Powder Mixed Electrical Discharge Diamond Grinding of TI6AL4V Utilizing Grey-Based Taguchi Approach
Fig.19 Procedure for grey-based Taguchi method
Here, (0) ( )ix t original sequence (*)
0 ( )x t reference sequence (0)min ( )ix t minimum value of (0) ( )ix t * ( )ix t comparability sequence
(0)max ( )ix t maximum value of (0) ( )ix t distinguishing coefficient
0,1 ; 0.5
0 ( )i t deviation sequence Q total observation data
min smallest value of 0i max largest value of 0 i
The level and value of factors associated with these experimental tests are shown in Table 9.
108 TRANSACTIONS OF FAMENA XLIV-3 (2020)

Modelling, Investigation of Process Responses, Surface Assessment and M. Manoj, A. Gopal Parametric Optimization in Powder Mixed Electrical Discharge Diamond Grinding of TI6AL4V Utilizing Grey-Based Taguchi Approach
Table 9 Level and value of factors in aluminium powder mixed dielectric fluid in PMEDDG process Parameters Unit Level 1 Level 2 Level 3 Al powder concentration (CP) gm/litre 1.5 3 - Current (I) Ampere 3 7 11 Pulse on time (Ton) µ-s 100 150 200 Wheel speed (S) RPM 450 650 850 Duty cycle (DC) % 0.61 0.69 0.77
The L18 orthogonal array, responses and their signal-to-noise ratios (SNR), grey relational normalization (GRN), grey relational coefficient (GRC), grey relational grade (GRG), and signal-to noise-ratio value for the overall GR grade are given in Table 10.
Table 10 Grey relational normalization (GRN), grey relational coefficient (GRC), grey relational grade (GRG), and signal-to-noise ratio (SNR) value for overall GR grade
Ex. No
Control factor Responses SNR value NormalizedSNR value
Grey relational co-efficient (GRC) GR grade
(GRG) SN ratio value
for overall GR grade CP I Ton S DC MRR /
mm3/minute Ra / m MRR Ra MRR Ra MRR Ra
1 1 1 1 1 1 0.521 2.21 -5.66 -6.89 0.000 0.00 0.333 0.333 0.33 -9.56 2 1 1 2 2 2 0.540 2.60 -5.35 -8.30 0.052 0.15 0.345 0.370 0.36 -8.94 3 1 1 3 3 3 0.660 3.20 -3.61 -10.10 0.345 0.34 0.433 0.431 0.43 -7.31 4 1 2 1 1 2 0.790 3.40 -2.05 -10.63 0.606 0.40 0.560 0.453 0.51 -5.93 5 1 2 2 2 3 0.880 4.01 -1.11 -12.06 0.764 0.55 0.679 0.526 0.60 -4.42 6 1 2 3 3 1 0.659 4.65 -3.62 -13.35 0.342 0.69 0.432 0.614 0.52 -5.65 7 1 3 1 2 1 0.956 4.15 -0.39 -12.36 0.884 0.58 0.812 0.544 0.68 -3.39 8 1 3 2 3 2 0.980 4.63 -0.18 -13.31 0.920 0.68 0.863 0.611 0.74 -2.67 9 1 3 3 1 3 0.835 5.80 -1.57 -15.27 0.687 0.89 0.615 0.819 0.72 -2.91 10 2 1 1 3 3 0.780 3.60 -2.16 -11.82 0.588 0.45 0.548 0.476 0.51 -5.83 11 2 1 2 1 1 0.625 4.70 -4.08 -14.15 0.265 0.70 0.405 0.621 0.51 -5.81 12 2 1 3 2 2 0.726 4.98 -2.78 -13.94 0.483 0.75 0.492 0.666 0.58 -4.77 13 2 2 1 2 3 1.025 4.35 0.21 -12.77 0.986 0.62 0.972 0.571 0.77 -2.27 14 2 2 2 3 1 0.880 5.80 -1.11 -15.27 0.764 0.89 0.679 0.819 0.75 -2.53 15 2 2 3 1 2 0.760 5.40 -2.38 -14.65 0.550 0.82 0.526 0.739 0.63 -3.99 16 2 3 1 3 2 0.915 4.70 -0.77 -13.44 0.820 0.70 0.736 0.621 0.68 -3.38 17 2 3 2 1 3 1.035 5.90 0.30 -16.31 1.000 1.00 1.000 1.000 1.00 -0.02 18 2 3 3 2 1 0.840 6.54 -1.51 -15.42 0.696 0.91 0.622 0.840 0.73 -2.74
The response and the ANOVA results for GRG are given in Tables 11 and 12, respectively.
Table 11 Response table for grey relational grade
Symbol Response table for GRG Level 1 Level 2 Level 3 Max-Min
CP 0.5419 0.6839 -- 0.1420 I 0.4536 0.6296 0.7554 0.3018
Ton 0.5789 0.6586 0.6012 0.0797 S 0.6159 0.6187 0.6041 0.0147
DC 0.5867 0.5807 0.6712 0.0905
Table 12 ANOVA table for grey relational grade
Symbol ANOVA table for GRG
DF SS MS F P C (%) CP 1 0.0907 0.0907 3.96 0.064 15 I 2 0.2757 0.1379 11.3 0.001 61
Error 8 0.0394 0.0049 11 Total 17 0.4575 100
TRANSACTIONS OF FAMENA XLIV-3 (2020) 109

M. Manoj, A. Gopal Modelling, Investigation of Process Responses, Surface Assessment and Parametric Optimization in Powder Mixed Electrical Discharge Diamond Grinding of TI6AL4V Utilizing Grey-Based Taguchi Approach
For conducting an ANOVA investigation, Mini-Tab software is utilized. From Table 12 it can be seen that I and CP are important factors. This investigation was undertaken for a degree of significance of 5%, that is, for a degree of certainty of 95%. The F examination [30] is utilized to find out which process factors significantly affect the output. As a rule, the change of process factors significantly affects the output when the F value is higher. The percentages of distinct factors in the grey-based Taguchi method are CP (15 %), Ton (5 %), S (1 %), DC (7 %), and I (61 %). The response graph for the average grey relational grade (AGRG) is delineated in Fig. 20.
Fig. 20 Response chart of average grey relational grade
An optimal set of various factors is PC2-I3-Ton2-S2-DC3. A confirmation test is performed at the optimal setting and its outcomes are given in Table 13. An improvement in the MRR by 100%, an increase in Ra by 135% and an improvement in GRG of 0.29 can be seen.
Table 13 Outcome of the tests conducted at optimal setting
Factor level Initial process parameters Optimal process parameters
(grey-based Taguchi approach)
1 11 1 1PC I T S DCon 2 32 3 2P C I T S DCon
MRR / mm3/minute 0.521 1.045 Ra / µm 2.21 5.21
GR grade 0.33 0.62 Improvement in grey relational grade is 0.29
9. Conclusions The conclusions could be drawn from the experimental results, interpretation of Figs 6
to 13, the application of the multiple response optimization technique and the examination of the SEM images. 1. In comparison to silicon carbide powder mixed dielectric fluid, aluminium powder mixed
dielectric fluid results in a higher MRR and superior surface finish. 2. The maximal MRR is accomplished when I, Ton and S are at the maximal level and DC is
at the lowest level. Similar trends in the MRR with few parameters have been obtained by [20, 22].
3. The maximal Ra is accomplished when I, Ton and DC are at the maximal level and S is at the lowest level. Similar trends in Ra with few parameters have been obtained by [20, 22].
4. The craters on the machined surfaces are broader and larger with an increase in I, Ton, and DC. Similarly, the craters on machined surfaces are thinner and smaller with an increase in S.
110 TRANSACTIONS OF FAMENA XLIV-3 (2020)

Modelling, Investigation of Process Responses, Surface Assessment and M. Manoj, A. Gopal Parametric Optimization in Powder Mixed Electrical Discharge Diamond Grinding of TI6AL4V Utilizing Grey-Based Taguchi Approach
5. In comparison to aluminium powder mixed dielectric fluid, silicon carbide powder mixed dielectric fluid results in higher WRLT.
6. An optimal set of various factors is PC2-I3-Ton2-S2-DC3, computed by the grey-based Taguchi method. In the ANOVA investigation, it is seen that I and CP are important factors. The percentages of distinct factors in the grey-based Taguchi method are CP (15 %), Ton (5 %), S (1 %), DC (7 %), and I (61 %).
7. An increase in the MRR by 100 %, in Ra by 135 % and the overall improvement in GRG of 0.29 has been established.
REFERENCES [1] Pandey, P.C.; Jilani, S.T. Electrical Machining Characteristics of Cemented Carbides, Wear 1987, 116,
77 – 88, https://doi.org/10.1016/0043-1648(87)90269-9. [2] Chen, Y.; Mahdivian, S.M. Analysis of electro-discharge machining process and its comparison
withexperiments, Journal of Materials Processing Technology 2000, 104, 150-157, https://doi.org/10.1016/S0924-0136(00)00531-8.
[3] Singh, P.N.; Raghukandana, K..; Pai, B. C. Optimization by Grey relational analysis of EDM parameters on machining Al–10%SiCP composites, Journal of Materials Processing Technology 2004, 155-156, 1658–1661, https://doi.org/10.1016/j.jmatprotec.2004.04.322.
[4] Chiang, Ko-Ta.; Chang, Fu-Ping.; Tsai, De-Chang. Modeling and analysis of the rapidly resolidified layer of SG cast iron in the EDM process through the response surface methodology, Journal of Materials Processing Technology 2007, 182, 525–533, https://doi.org/10.1016/j.jmatprotec.2006.09.012.
[5] Bhattacharyya, B.; Gangopadhyay, B.; Sarkar, B.R. Modelling and analysis of EDMED job surface integrity, Journal of Materials Processing Technology 2007, 189, 169–177, https://doi.org/10.1016/j.jmatprotec.2007.01.018.
[6] Jeswani, M.L. Effect of the addition of graphite powder to kerosene used as the dielectric fluid in electrical discharge machining, Wear 1981, 70, 133-139, https://doi.org/10.1016/0043-1648(81)90148-4.
[7] Modi, M.; Agarwal, G. Optimization of Electro-Discharge Diamond Surface Grinding Process Parameters with Multiple Performance Characteristics of Ti-6Al-4V using Grey-taguchi approach, International Journal of Advanced Materials Research 2012, 622-623, 14-18, https://doi.org/10.4028/www.scientific.net/AMR.622-623.14.
[8] Wong, Y.S.; Lim, L.C.; Rahuman, I.; Tee, W.M. Near-mirror-finish phenomenon in EDM using powder mixed dielectric, Journal of Material Processing Technology 1998, 79, 30-40, https://doi.org/10.1016/S0924-0136(97)00450-0.
[9] Kozak, J.; Oczos, K.E. Selected problems of abrasive hybrid machining, Journal of Materials Processing Technology 2001, 109, 360-366, https://doi.org/10.1016/S0924-0136(00)00824-4.
[10] Jain, V.K.; Mote, R.G. On the temperature and specific energy during electro-discharge diamond grinding (EDDG), Int. J. Adv. Manuf. Technol. 2005, 26, 56-67, https://doi.org/10.1007/s00170-003-1983-5.
[11] Gauri, S. K.; Chakraborty, S. Multi-response optimization of WEDM process using principal component analysis, Int J AdvManufTechnol, 2009, 41:741–748, https://doi.org/10.1007/s00170-008-1529-y.
[12] Tzeng, Chorng-Jyh.; Lin, Yu-Hsin.; Yang, Yung-Kuang.; Jeng, Ming-Chang. Optimization of turning operations with multiple performance characteristics using the Taguchi method and Grey relational analysis, JournalOf Materials Processing Technology 2009, 209, 2753–2759, https://doi.org/10.1016/j.jmatprotec.2008.06.046.
[13] Yadav, R.N.; Yadava, V. Machining of Hybrid-Metal Matrix Composite using Erosion-Abrasion based Compound Wheel in Electrical Discharge Grinding, Particulate Science and Technology 2017, 35(4), 494- 504, D OI: https://doi.org/10.1080/02726351.2016.1170743.
[14] Yadav, U.S.; Yadava, V. Experimental Investigation on Electrical Discharge Diamond Drilling of Nickel Based Superalloy Aerospace Material, IMechE Part B: Journal of Engineering Manufacture 2015, 231 (7), 1160-1168, https://doi.org/10.1177/0954405415592124.
[15] Yadav, R.N.; Yadava, V. Slotted-Electrical Discharge Diamond Cut-off Grinding of Al/SiC/B4C Hybrid Metal Matrix Composite, Journal of Mechanical Science and Technology 2014, 28 (1), 309~316, https://doi.org/10.1007/s12206-013-0968-z.
TRANSACTIONS OF FAMENA XLIV-3 (2020) 111

M. Manoj, A. Gopal Modelling, Investigation of Process Responses, Surface Assessment and Parametric Optimization in Powder Mixed Electrical Discharge Diamond Grinding of TI6AL4V Utilizing Grey-Based Taguchi Approach [16] Unne, D.R.; Mali, H.S. A study of multi objective parametric optimization of electrical discharge
diamond cut-off grinding of Inconel 718, Int. J. Abrasive Technology 2016, 7 (3), 187-199, https://doi.org/10.1504/IJAT.2016.078281.
[17] Modi, M.; Agarwal, G. Effect of aluminium and chromium powder mixed dielectric fluid on electrical discharge machining effectiveness, Advances in Production Engineering & Management Journal 2019, 14 (3), 323-332, https://doi.org/10.14743/apem2019.3.330.
[18] Rao, X.; Zhang, F.; Li, C.; Li, Y. Experimental investigation on electrical discharge diamond grinding of RB-SiC ceramics, The International Journal of Advanced Manufacturing Technology 2018, 94 (5-8), 2751-2762, DOI 10.1007/s00170-017-1102-7.
[19] Unune, D.R.; Singh, V.P.; Mali, H.S. Experimental Investigation of Abrasive Mixed Electro Discharge Diamond Grinding of Nimonic 80A, Materials and Manufacturing Processes 2015, 31 (13), 1718-1723, https://doi.org/10.1080/ 10426914.2015.1090598.
[20] Unune, D.R.; Nirala, C.K.; Mali, H.S. ANN-NSGA-II dual approach for modelling and optimization in abrasive mixed electro discharge diamond grinding of Monel K-500, Engineering Science and Technology An International Journal 2018, 21 (3), 322-329, https://doi.org/10.1016/j.jestch.2018.04.014.
[21] Unune, D.R.; Barzani, M.M.;Mohite, S.S.;Mali, H.S. Fuzzy logic-based model for predicting material removal rate and average surface roughness of machined Nimonic 80A using abrasive-mixed electro-discharge diamond surface grinding, Neural Comput. Appl. 2016, https://doi.org/10.1007/ s00521-016-2581-4.
[22] Mali, H.S.; Unune, D.R.; Tiwari, S. Modelling and prediction of material removal rate in electrical discharge diamond surface grinding process of INCONEL-718, In: Proceedings of 5th AIMTDR 2014, 822:821–822:828, IIT Guwahati, Assam, India.
[23] Unune, D.R.; Mali, H.S. Artificial neural network-based and response surface methodology-based predictive models for material removal rate and surface roughness during electro-discharge diamond grinding of Inconel 718, Proc Inst Mech Eng B: J Eng Manuf. 2015, https://doi.org/10.1177/0954405415619347.
[24] Tripathy, S.; Tripathy, D.K. Optimization of Process Parameters in Powder mixed EDM, Precision Product-Process Design and Optimization 2018, 239–283. https://doi.org/10.1007/978-981-10-8767-7_10.
[25] Modi, M.; Jha, S. Modelling and Analysis of Powder Mixed Electric Discharge Machining, International Journal of Mechanical Engineering 2009, 2, 219-223.
[26] Modi, M.; Agarwal, G. Powder mixed Electro-Discharge Diamond Surface Grinding Process: Modelling, Comparative Analysis and Multi-Output Optimisation Using Weighted Principal Components Analysis, SV-JME 2013, 59, 735-747. https://doi.org/10.5545/sv-jme,2013.1146.
[27] Jain, V. K. Advanced Machining Processes, Allied Publishers Pvt. Ltd. 2002, New Delhi, [28] Das, M. N.; Giri, N.G. Design and analysis of experiments, second edition, New age int. (P) limited,
Publishers, 1986, New Delhi. [29] Ross, P. J. Taguchi techniques for quality engineering: loss function, orthogonal experiments, parameter
and tolerancedesign. Mc Graw-Hill, 1996, New York. [30] Montgomery, D.C. Design, and analysis of experiments, Wiley, 2009, New York. [31] Design Expert Software 2010, Version 8.0.7.1, User Guide, Technical manual, Stat-Ease Inc.,
Minneapolis, MN.
Submitted: 02.3.2019 Accepted: 07.02.2020
Dr. Manoj Modi Professor, Department of Mechanical Engineering, Acropolis Institute of Technology and Research, Indore, India. Prof. Gopal Agarwal Department of Mechanical Engineering, Malaviya National Institute of Technology, Jaipur, India.
112 TRANSACTIONS OF FAMENA XLIV-3 (2020)