Embed Size (px)
Citation preview

THESIS FOR THE DEGREE OF DOCTOR OF PHILOSOPHY
Modelling Energy Conservation and CO2 Mitigation in the European Building Stock
ÉRIKA MATA
Department of Energy and Environment
CHALMERS UNIVERSITY OF TECHNOLOGY
Göteborg, Sweden 2013

Modelling energy conservation and CO2 mitigation in the European building stock ÉRIKA MATA ISBN 978-91-7385-930-1 © ÉRIKA MATA, 2013 Doktorsavhandlingar vid Chalmers tekniska högskola Ny serie Nr 3611 ISSN 0346-718X Energy Technology Department of Energy and Environment Chalmers University of Technology SE-412 96 Göteborg Sweden Telephone: +46 (0) 31 772 10 00
Printed by Chalmers Reproservice Göteborg, Sweden 2013

i
Abstract This thesis investigates energy conservation in building stocks with the aim of developing a methodology that can be applied to the national building stocks of the European Union (EU). For this purpose, a bottom-up building-stock model and a methodology for describing the building-stock have been established. The model is based on a one-zone building energy balance, which provides the hourly net energy demand for all end-uses and which has been validated by empirical and comparative means for selected buildings. The results for representative buildings are subsequently extrapolated to the entire building stock with respect to net and final energy demand, associated CO2 emissions, and costs for implementing a portfolio of energy conservation measures (ECMs). The methodology for building stock aggregation through archetype buildings comprises the following elements: (1) segmentation, in which the number of archetype buildings required to represent the entire stock is decided according to building type, construction year, heating system, and climate zone; (2) characterization, whereby each archetype is described in terms of its physical and technical characteristics; (3) quantification, whereby the number of buildings in the stock represented by each archetype building is determined. The archetype description is used as an input to the model, from which the final energy use is calculated, and the results are validated by comparison with the available statistics. The archetype description has been developed and validated for the building stocks of France, Germany, Spain and UK, which account for half of the final energy use of the residential and non-residential buildings in the EU-27 countries.
Using the building stock model to apply various ECMs to the Swedish residential building stock and the entire Spanish residential and non-residential building stock, which are representative of Northern and Southern EU buildings, respectively, the final energy demands of the Swedish and Spanish building stock are found to be reduced by 50%. In both countries, the different forms of envelope upgrades confer the largest technical potential reductions for all buildings. However, other ECMs with significant potentials differ between the two countries and subsectors. The levels of CO2 emissions from the Swedish residential buildings and the Spanish buildings can be reduced by 60%–70%. Although the application of the ECMs generally reduces CO2 emissions, the effects of measures that reduce electricity use for lighting and appliances rely on whether the saved electricity production is less or more CO2-intensive than the fuel mix used for space heating. Techno-economical potential reductions of energy demand by 20%–30% are identified for Sweden and Spain, corresponding to CO2 emissions reductions of 40%–50%. These potentials increase when packages of ECMs are applied. Furthermore, the packages were more cost-effective than the individual ECMs. The market potentials identified are substantially lower than the techno-economical potentials. If the techno-economic potentials identified in this work are to be implemented, there is a need for strong policy measures to influence stakeholder actions.
Keywords: archetype building, energy conservation measures, European building stock, bottom-up building modelling, techno-economical potentials, cost assessment

ii

iii
List of papers The thesis is based on the following appended papers:
I. A Modelling Strategy for Energy, Carbon, and Cost Assessments of Building Stocks É. Mata, A. Sasic Kalagasidis and F. Johnsson. Energy and Buildings (2013) 56: 108-116.
II. Description of the European building stock through archetype buildings É. Mata, A. Sasic Kalagasidis and F. Johnsson; Accepted as archival paper in the 8th Conference on Sustainable Development of Energy, Water and Environment Systems – SDEWES Conference, September 22-27, 2013, Dubrovnik, Croatia.
III. Energy usage and technical potential for energy saving measures in the Swedish residential building stock É. Mata, A. Sasic Kalagasidis and F. Johnsson. Energy Policy (2013) 55: 404-414.
IV. Cost-effective retrofitting of Swedish residential building stock – Effects of energy price developments and discount rates É. Mata, A. Sasic Kalagasidis and F. Johnsson; Submitted for publication, April 2013.
V. Opportunities and costs associated with energy conservation in the Spanish building stock É. Mata, G. Medina Benejam, A. Sasic Kalagasidis and F. Johnsson; Submitted for publication, September 2013.
Érika Mata is the main author and is responsible for the modelling of Papers I–V. Angela Sasic Kalagasidis contributed to the earliest modelling in Papers I and III. Georgina Medina Benejam contributed to the data gathering for Paper V, as well as to the initial modelling work and manuscript writing. Filip Johnsson and Angela Sasic Kalagasidis contributed to the discussions and to the editing of all the papers.

iv

v
Contents ABSTRACT I
LIST OF PAPERS III
CONTENTS V
DEFINITIONS VII
NOTATIONS XI
ABBREVIATIONS XIII
1 INTRODUCTION 1
1.1 Aims and scope 5
1.2 Project context 6
1.3 Outline of the thesis 7
2 KEY ISSUES FOR BUILDING-STOCK MODELLING 8
2.1 Building-stock categorisation 8
2.2 Types of models 9 2.2.1 Modelling approach adopted 10
3 METHOD 12
3.1 Building-stock aggregation 12
3.2 The Building-Stock Model ECCABS 14 3.2.1 Model Validation 19
3.3 Energy conservation measures investigated 21 3.3.1 Individual ECMs 23 3.3.2 Possibilities for implementation – packages of ECMs 24
4 RESULTS AND DISCUSSION 26
4.1 Building-stock description 26
4.2 Technical potential energy savings and associated CO2 emissions 29 4.2.1 Individual ECMs 29 4.2.2 Packages of ECMs 33
4.3 Cost assessment 35 4.3.1 Investments 35 4.3.2 Cost-efficiency of the ECMs and packages of ECMs 38 4.3.3 Techno-economical and market potentials 43
5 CONCLUSIONS 46
6 PROSPECTS FOR FURTHER STUDIES 48
ACKNOWLEDGEMENTS 51
REFERENCES 53

vi

vii
Definitions This section defines key concepts that are used in the introductory essay and in the papers. Some of these concepts are established in the literature, while others have been adapted or interpreted in the work performed within the context of this thesis.
Archetype building
A statistical composite of the features found within a category of buildings in the stock (Moffatt, 2001), i.e., a theoretical description based on knowledge of the overall building characteristics of the region (e.g., age, size, construction materials, and house type) in combination with national statistics related to the building sector (e.g., energy use and climate). It is a particular type of representative building.
Building sector Category in the statistical database for energy consumption that represents buildings, both residential and non-residential, in a given region or country.
Building stock A high number of buildings, such as in a city, specified region or country, which are available for use.
Building subsector
Any of the two subcategories of the building sector, i.e., residential and non-residential.
Direct cost The proportion of the price or investment that can be completely attributed to an energy conservation measure, i.e., the materials and labour required for its installation, maintenance, and operation. In the literature, the direct cost is also referred to as tangible or techno-economic cost1 or real private cost (EC, 2012b).
End-use The ultimate use of the energy. In the building sector, the end-use categories are: space heating; hot water; and electricity (for lighting, appliances, and cooking)2.
Energy conservation measure
An action aimed at reducing the net and final energy demands3 of a building. It includes, in addition to the below-defined energy efficiency measures, the supply from on-site renewable energy sources.
Energy efficiency measure
A change to a building that results in a reduction of the building’s final energy demand4. Thus, it includes, in addition to the below-defined energy saving measures, improvements in the efficiencies of the technical systems within the building.
Energy saving measure
An action aimed at decreasing the net energy demand of a building. Typical energy saving measures are: improvement of
1 Based on: MKJA (2002); Ürge-Vorsatz and Novikova (2006, 2008); Ürge-Vorsatz et al. (2007a). 2 According to this definition, cooking is also an end-use, although, due to lack of data, in this work cooking is only considered as a part of the electricity use. 3 Primary energy could also be included, although it has not been investigated in the present thesis. 4 Based on the definition given in the EPBD recast (EC, 2012a), with the exception being that the EPBD recast refers to primary energy.

viii
the performance of the building envelope; climate-adapted and passive strategies; and management of indoor climate environment requirements (e.g., indoor temperature, humidity, ventilation rates, lighting).
Final energy
The energy supplied to a building in different forms and via different carriers, including conversion losses in the technical systems within the building (Sartori et al., 2009). In the literature, final energy is also referred to as delivered energy, secondary energy or end energy use.
Financial calculation
One of the two parts of the global cost calculation5, as defined in the Energy Performance of Buildings Directive (EPBD), which includes investment, running and disposal costs, and residual value, including taxes.
Indirect cost
Any cost (distinct from the direct cost) incurred while implementing an energy conservation measure, These charges include implementation costs6, intangible capital costs7, perceived private costs8, and transaction costs9. As the definitions of these costs overlap, they are referred to in the present thesis in the aggregated form of ‘indirect costs’.
Macroeconomic calculation
One of the two parts of the global cost calculation, as defined in the EPBD recast, which in addition to the costs included in the financial calculation, includes the cost of emitting GHGs but excludes taxes.
5 The global cost is the sum of the present value of the initial investment costs, sum of the running costs, and replacement costs (referred to the starting year), as well as disposal costs, if applicable. For the calculation at the macro-economical level, an additional cost category, termed costs of GHG emissions, is introduced (EC, 2012a). 6 The costs of the interventions required to realize the measure (De Villiers and Matibe 2000), which the author of this thesis interprets as being equivalent tothe cost of the policy measures (ERG 1998, ILWG 2000, Ürge-Vorsatz et al. 2007b). 7 The cost that represents non-financial costs that enter into investment and operational decisions, e.g., changes in comfort levels or effects of subsidies (Jaccard and Denis 2006, EMRG et al. 2007). 8 These are all costs incurred (or perceived as being faced) by the private entity. As these costs are what drives the consumer to make their choices, they determine the compensation required to have consumers do something differently (i.e., to change from using one technology to another) (MKJA 2002). 9 These costs comprise search costs, information costs, as well as computational, negotiating, and monitoring costs, i.e. costs associated with carrying out market transactions. Therefore, transaction costs are only a part of the total hidden costs (Ostertag, 1999). The concept was first described by Coase (1937); a summary of the definition of transaction costs components and cost estimates is given in Hein and Blok (1995) and Michaelowa and Jotzo (2005).

ix
Market potential
The part of the technical potential that is cost-effective when applying market costs using private discount rates, with the carbon prices included in the energy prices10. The concept intends to represent the potentials that are expected to be implemented.
Net energy
The energy required to satisfy the particular energy end-use in a building (Sartori et al., 2009), excluding conversion losses in the technical systems of the building. In the literature, net energy is also referred to as energy use11, useful energy or tertiary energy.
Non-residential building
Construction in which more than the half of the gross floor area is used for purposes other than dwelling; industrial and agricultural constructions are not included12. In the literature, a non-residential building may also be termed a tertiary or services building.
Private discount rate
This is also referred to as implicit discount rate, and represents a consumer´s decision making, i.e., since in making decisions that involve discounting over time, individuals behave in a manner that implies a much higher discount rate than can be explained in terms of the opportunity costs of funds available in credit markets (Marshall, 1890). Implicit discount rates can be established empirically using choice models13, stated preference14, or hedonic price analysis. These discount rates range from 20% to 308%15. For conservation programs, private rates are used to predict the penetration rates of the programs or the levels of energy conservation investments.
Reference building
A building that represents the typical building geometry and systems, typical energy performances for both the building envelope and the systems, having the typical functionality and typical cost structure for a building stock, and is representative of the climatic conditions and geographical location16. The building can be hypothetical (i.e., an archetype building) or real (i.e., a sample building). In the literature, a reference building may also be referred to as a representative building.
10 Adapted from the 4th IPCC Assessment Report on Climate Change (Levine et al., 2007), which defines the market potential as the level of GHG mitigation that occurs under forecast market conditions, including policies and measures based on private unit costs and discount rates. 11 EPBD (EC, 2012b) includes in energy use the thermal energy from renewable energy sources on-site. In addition, an initial level, the so-called “energy need”, is defined, which includes the net energy demands for space heating and cooling and for hot water. 12 Grundsell (2013). Based on the different definitions in the international databases (ESA, 1995; Lapillone et al., 2012; Eurostat, 1997; OECD, 2001). 13 As described in Newlon and Weitzel (1991), Train (2002) and in Jaccard and Denis (2006). 14 As described in Hausman (1979) and Train (1985). 15 As summarised by Train (1985). 16 Adapted from the EPBD recast (EC, 2012a), which restricts the definition to Member States.

x
Residential building
A construction that is used primarily for dwelling. In the literature, a residential building may also be called a household building.
Sample building A particular type of representative building with all its characteristics derived from actual buildings, using data obtained from measurements.
Societal discount rate
The discount rate used by the society to give relative weighting to social consumption or income accruing at different points in time (Price, 1988). Justifications for discounting as part of public decisions mainly rely on the opportunity cost of the capital, and are thus assumed to be equal to the market rate agreed by a lender17. This rate is generally used in the life-cycle cost analysis of capital investment public projects and ranges from 2% to 10%18.
Technical potential
The amount by which it is possible to reduce energy use and CO2-associated emissions through implementing certain energy conservation measure without specific reference to costs19.
Techno-economical potential
The part of the technical potential that is cost-effective if applying market costs using societal discount rates, at zero social cost and at particular carbon prices, the latter being included implicitly in the energy prices in this thesis20.
17 Note that in this thesis a simplified interpretation of the societal discount rate is used, and that it is based on the standardised procedures for economic evaluation of energy systems in buildings (EC, 2012a,b; EN 15459, 2007; Rushing et al., 2010). A broader environmental interpretation, not used in this thesis, is the focus of an unsettled debate on discounting as intergenerational equity and linked to the theoretical conception of sustainability (cf. reviews by Price and Nair, 1985; IPCC, 1995; Almansa Sáez and Calatrava Requena, 2007; Sterner and Persson, 2008). 18 According to the review of what different European countries propose for the life-cycle cost assessment of their public projects (Cruz Rambaud and Muñoz Torrecillas, 2005), and in line with the key reference rates set by the European Central Bank and national central bank, which for the period 2001–2012 were in the range of 1.5%–5.0% (EC, 2011). 19 Adapted from the 4th IPCC Assessment Report on Climate Change (Levine et al., 2007), which applies the definition to “GHG” instead of to “energy use and CO2 emissions”. 20 Adapted from Levine et al. (2007) and Ürge-Vorsatz and Novikova (2008). In Levine et al., (2007) the economic potential is defined as “a cost-effective potential for GHG mitigation when non-market social costs and benefits associated with mitigation options are considered with market costs and benefits using societal discount rates instead of private ones at particular levels of carbon prices”. In the paper by Ürge-Vorsatz and Novikova (2008), since the majority of the studies reviewed did not consider all the social cost elements or the price of carbon, the economic potential was assumed to be equivalent to the cost-effective potential for zero social cost and zero carbon price.

xi
Notations 𝐴 Floor area m2
𝐴𝐶 Net unit cost for CO2 avoidance €/tCO2 avoided
𝐶𝑒 Change in the cost of the energy saved due to the application of an energy conservation measure or package
€/ yr
𝐶𝐼 Investment cost of an energy conservation measure or package €
𝐶𝑜 Operational cost of an energy conservation measure or package €/yr 𝐶𝑚 Effective volumetric heat capacity of a heated space (whole
building) J/K
𝐶𝑟 Running cost of an energy conservation measure or package €/yr
𝐶𝐸 Net unit cost for energy saving €/kWh saved
𝐶𝐸𝑇𝐸 Net unit cost for techno-economic energy saving €/kWh saved
𝐸𝐷𝑒𝑙𝑖𝑣𝑒𝑟𝑒𝑑 Total annual delivered energy demand kWh/yr
𝐷𝐸𝑙 Annual electricity demand, including the electricity required for lighting, appliances, water pumps and fans
kWh/yr
𝐷𝐻𝑒𝑎𝑡 Annual heating energy demand for space heating kWh/yr
𝐷𝐻𝑜𝑡𝑊 Annual heating energy demand for hot water production kWh/yr
𝐸𝑡𝑜𝑡 Total annual net energy demand kWh/yr
𝐸𝐴𝐶 Equivalent annual cost an energy conservation measure or package
€/yr
𝐸𝑆 Technical potential energy saving for an energy conservation measure or package
kWh/yr
𝐸𝑆𝑇𝐸 Techno-economical potential energy saving for an energy conservation measure or package
kWh/yr
𝐻𝑅𝑒𝑐_𝐸𝑓𝑓 Efficiency of the heat recovery unit 0–1
𝐼𝐸 Transmitted solar energy through an eastern window kWh/m2 a
𝐼𝐻 Transmitted solar energy through a horizontal window kWh/m2 a
𝐼𝑁 Transmitted solar energy through a northern window kWh/m2 a
𝐼𝑆 Transmitted solar energy through a southern window kWh/m2 a
𝐼𝑠𝑜𝑙 Global irradiation on horizontal surface W/m2
𝐼𝑊 Transmitted solar energy through a western window kWh/m2 a
𝑀𝑐 Maintenance cost of an energy conservation measure or package €/ yr
𝑛 Lifespan for the energy conservation measure yr
𝑁 Years to be discounted from the investment year back to the starting year
yr
𝑁𝐴𝐶 Net annual cost of an energy conservation measure or package €/yr

xii
𝑞 Total heat provided by the heating/cooling system W
𝑞𝑖𝑛𝑡 Total internal heat gains W
𝑞𝑟 Solar radiation gains through windows W
𝑞𝑡 Transmission heat losses through a building envelope W
𝑞𝑣 Ventilation heat losses (sanitary and natural) W
𝑅 Discount rate 0–1
𝑇𝑖𝑛𝑡 Indoor air temperature ºC
𝑇𝑜𝑢𝑡 Outdoor air temperature ºC
𝑇𝑠 Coefficient of solar transmission of the window 0–1
𝑇𝑣 Set point temperature for natural ventilation ºC
𝑇𝑣𝑒𝑛𝑡 Temperature of the supply air ºC
𝑆𝑤 Total surface of windows in the building m2
𝑉𝑐 Sanitary ventilation rate l/s/m2
𝑊𝑐 Shading coefficient of the window 0-1
𝑊𝑓 Frame coefficient of the window 0-1
𝜌𝑎 Air density kg/m3
𝑐𝑝𝑎 Specific heat capacity of the air J/kg K
𝜇 Weighted-average efficiency of the energy conversion equipment and apparatus for delivery or production of space heating, hot water and the electricity for lighting and household appliances
0–1
𝜇𝐶𝑜𝑜𝑙 Weighted-average efficiency of the energy conversion equipment and apparatus for delivery or production of space cooling
0–1
𝜇𝐸𝑙 Weighted-average efficiency of the energy conversion equipment and apparatus for delivery or production of the electricity for lighting and household appliances
0–1
𝜇𝐻𝑒𝑎𝑡 Weighted-average efficiency of the energy conversion equipment and apparatus for delivery or production of space heating
0–1
𝜇𝐻𝑜𝑡𝑊 Weighted-average efficiency of the energy conversion equipment and apparatus for delivery or production of hot water
0–1
𝜔𝐶𝑜𝑜𝑙 Weighting coefficient that represents the percentage of cooling demand in the total demand
0–1
𝜔𝐸𝑙 Weighting coefficient that represents the percentage of electricity demand for lighting and appliances in the total demand
0–1
𝜔𝐻𝑒𝑎𝑡 Weighting coefficient that represents the percentage of heating demand in the total demand
0–1
𝜔𝐻𝑜𝑡𝑊 Weighting coefficient that represents the percentage of hot water demand in the total demand
0–1
xiii
Abbreviations AP Apartment block of <10 floors
B Bungalow
BA Baseline scenario
BETSI Description of the existing buildings: technical characteristics, indoor environment and energy consumption [Bebyggelsens Energianvändning, Tekniska Status och Innemiljö, in Swedish].
C Commercial CO2 Carbon dioxide
D Detached house
DD Degree day
DDn Degree day of reference
DE Germany
DH District heating
DSM Demand side management
E Educational EABS Energy assessment of building stocks (model)
EC European Commission
ECCABS Energy, carbon and cost assessment of building stocks (model)
ECM Energy conservation measure
EED Energy Efficiency Directive
EEOS Energy Efficiency Obligation Scheme
EL Ecodesign and labelling directive
EPBD Energy performance of buildings directive
ES Spain
ESM Energy saving measure
EU European Union
FR France
GDP Gross domestic product
GHG Greenhouse gas
H Health HH High-rise buildings of >10 floors
HPI High-price-increase
LPI Low-price-increase
MFD Multi-family dwelling
MS Member State
NR Non-residential

xiv
O Offices PrMFD Private MFD
PuMFD Public MFD
PV Photovoltaic
R Residential
Re Retail RES Renewable energy source
SCL Sports, culture and leisure SD Semi-detached house
SE Sweden
SFD Single-family dwelling
T Terraced house
UK United Kingdom
VAT Value added tax
W Warehouses X-NR Other services
X-R Other type of house

1
1 Introduction Climate change, security of energy supply, and competitiveness21 in the energy market are all factors that underline the need to reduce energy use and greenhouse gas (GHG) emissions. In the European Union (EU)-27 countries, the building sector accounts for 35%–40% of the total final energy consumption and associated carbon dioxide (CO2, which is the main GHG from buildings’ energy consumption) emissions, of which 25%–27% is attributed to residential buildings and 10%–13% to non-residential buildings (Figure 1.1). Six member states (MS) account for about 70% of the final energy use and associated CO2 emissions of the EU-2722 building sector, namely France, Germany, Italy, Poland, Spain and the UK (Figure 1.2).
Figure 1.1. Contributions of residential and non-residential buildings to final energy consumption23 and associated CO2 emissions24, for the EU-27 and selected MS.
Figure 1.2. Contributions of selected MS to the final energy consumption and associated CO2 emissions of the EU-27 building sector.
21 A nation's competitiveness can be viewed in terms of its position in the international marketplace compared to other nations with similar levels of economic development (Önsel et al. 2008). 22 Croatia is a MS of the EU since July 1, 2013; however, there are as yet no statistical data for the EU-28. 23 Year 2011 data from the Eurostat database (EC, 2011). 24 Year 2005 data from the Odyssee database (Enerdata, 2010).
0%
10%
20%
30%
40%
50%
EU-2
7
Fran
ce
Ger
man
y
Italy
Pola
nd
Spai
n
Swed
en UK
Final energy consumption
Service Sector
0%
10%
20%
30%
40%
50%
EU-2
7
Fran
ce
Ger
man
y
Italy
Pola
nd
Spai
n
Swed
en UK
CO2 emissions
Residential Sector
13%
18%
11%
6% 7% 3%
12%
30%
Final energy consumption
10%
20%
12%
8% 8% 1%
13%
28%
CO2 emissions
FranceGermanyItalyPolandSpainSwedenUKRest EU

2
The CO2 emission contributions (i.e. 35%) correspond to the contributions to final energy demands for the entire EU-27 (i.e. 37%). However, the percentages of the CO2 emissions and energy use (in relation to the total emissions and total energy use of the building sector of the MS) differ between the MS, owing to disparities in the energy supply systems of the MS. Figure 1.3 shows the final energy consumption by fuel for the building sectors of selected MS. For example, Polish buildings use more than 30% coal, yielding high CO2 emissions. In contrast, Swedish buildings mostly use electricity and district heating (DH), with the electricity being generated from hydro and nuclear sources and the heat from biomass fuels, with the consequence that the CO2 emissions are low.
Figure 1.3. Final energy consumption levels for the building sector (residential [R] and non-residential [NR] buildings) in relation to different fuels, for the EU-27 and selected MS.
Since the turnover of building stock is low in developed countries, the greatest challenge for reducing energy use in the building sector is to find effective strategies for retrofitting existing buildings. While significant potentials for energy savings and mitigation of GHG emissions within the building sector have been reported for many countries (for a summary of potentials worldwide25, see Levine et al. 2007), these potentials have not been exploited to date. As a result, the energy use and associated CO2 emissions of the building sector in Europe continue to grow26 (EC 2011; Enerdata 2010). In other words, despite the technical efficacy of energy-saving actions, large-scale implementation of such actions has not taken place. To respond to these issues, the European Commission (EC) has designed the Energy Efficiency Directive (EED) (EC, 2012c), which establishes a common framework of measures for the promotion of energy efficiency within the EU, so as to ensure a 20% improvement in energy efficiency by the year 2020 (compared to projections).
25 The estimation of the potentials is based on data obtained from bottom-up studies. 26 In 2008, the EU-15, whereby most of the countries had certain binding targets, had increased final energy consumption by 15%, as compared to the levels in 1990.
0%10%20%30%40%50%60%70%80%90%
100%
Fran
ce
Ger
man
y
Italy
Pola
nd
Spai
n
Swed
en UK
EU 2
7
Final energy consumption by fuels in R and NR buildings
ElectricityRenewableHeatGasOilCoal

3
Although the EDD targets primary energy demand, the directive also includes measures related to building renovation and the use of Energy Efficiency Obligation Schemes (EEOS). The aim of these schemes is to ensure that either all energy distributors or all retail energy sales companies operating in the territory of an MS achieve annual energy savings27 equal to 1.5% of their energy sales, by volume, in that MS, excluding the energy used in transport. In this context, understanding the potential roles and costs of different retrofitting strategies is a prerequisite for the achievement of these energy reduction targets in the building sector.
In the literature, it is frequently and variously proposed the failure to realise the potentials for energy savings is due to: (a) a lack of knowledge regarding the characteristics of the buildings; (b) a lack of awareness of the best steps to take for each building stock; and (c) the complexity associated with implementing energy conservation measures (ECMs).
Knowledge regarding the characteristics of the buildings is fundamental to understanding how the energy performance of the building stock can be improved. What are the size, structure, and dynamics of change of the building stock of the EU? Are there sufficiently robust data for the buildings in each MS and the regions therein upon which to base studies of the building-stocks’ energy use? Kohler and Hassler (2002) used the German building stock as a case study and concluded that most studies are strongly limited by the absence of reliable statistical data, and international research confirmed the global scale of this knowledge gap (Moffatt, 2001). Similar conclusions have been reached by others (Balaras et al. 2007; Bradley and Kohler 2007; Pérez-Lombard et al. 2008; Dineen and Ó Gallachóir 2011). Despite the apparent paucity of consistent data, there has been a surge in recent years in the development and use of models of energy consumption in national building stocks (Summerfield and Lowe, 2012). A noteworthy effort to gather relevant data is the European project TABULA, which has very recently mapped data for the existing residential buildings of 13 MS (IWU, 2012)28.
The lack of awareness as to the best steps to take for improving building stocks is linked to the formulation and use of modelling tools. What does each MS have to do to reduce the energy use and CO2 emissions associated with buildings? Where to start, and are there clear opportunities that should not be missed? Although several studies have provided valuable information on how to evaluate the ECMs for a building stock (Ürge and Novikova 2008; Swan and Ugursal 2009; Kavgic et al. 2010), they have applied modelling methodologies that are tailored to a specific region or to the conditions for which they were designed. Although the procedures and algorithms upon which their methodologies are based are publicly available, their limitations and
27 This level of energy savings, for which it is not clear that an expansion of the market share of the company is allowed, shall be achieved by the obligated parties among final customers. However, there are no clear guidelines as to how these energy savings should be estimated. 28 The project also provides an Excel calculation tool for one building. The calculation of the energy need for space heating is based on the seasonal method of the standard EN-13790 (2008).

4
assumptions are difficult to understand, and key parameters and results may be fundamentally flawed due to distribution and uncertainty issues. As a consequence, the tools needed for a comprehensive assessment of the entire building stock are not yet readily accessible outside the research community. In contrast, user-friendly tools for energy assessments of individual buildings are already available commercially.
The complexity of the implementation of ECMs refers to the difficulties associated with exploiting the potentials. There are difficulties linked to the different characteristics and targets of the energy saving actions and policies, as well as issues with decision makers’ reactions. First, the EC has designed a set of directives to promote energy efficiency in the building sector of EU MS, in addition to the above-mentioned EED, and this set includes the Energy Performance of Buildings Directive (EPBD) (EC, 2012a), and the Ecodesign and Labelling Directive (EL) (EC, 2009). These directives target different end-uses, ranging from primary energy to net energy, and also involve different responsible agents; additional targets may be established by regional and national strategies. In addition, there are subsidies (e.g., to increase the use of renewables), as well as regular renovation cycles. How do the existing energy saving actions and policies overlap and influence each other? What is the nature of the connections between the different sets of agents, stakeholders, and decision makers involved? In addition, why have consumers, through their daily market decisions, not undertaken the level of energy efficiency expenditures that has been found to be economically attractive? One reason for this is that in addition to the direct costs most commonly considered in the assessments (i.e., investment and operational costs), there are indirect costs associated with imperfect markets, non-rational behaviour, transaction costs, etc. Thus, factors other than the economical operate in a highly complex manner when ECMs are being implemented.
In summary, much work is still needed to investigate the implementation of energy conservation and CO2 mitigation strategies in building stocks. This thesis explores the questions that are posed above, by establishing methodological bases, providing first insights, and pointing towards future studies.

5
1.1 Aims and scope The main objective of this thesis is to investigate the large-scale implementation of ECMs in existing building stocks from an energy systems perspective. This overall objective may be divided into two distinct aims: (1) to develop, apply, and evaluate an assessment methodology; and (2) to quantify the effects of ECMs in terms of net energy, delivered energy, associated CO2 emissions, and costs for building stocks in selected EU countries. The thesis is based on the research presented in the five appended papers (Papers I–V). The appended papers, which are listed conceptually rather than chronologically, focus on the following topics:
I. Paper I focuses on building-stock modelling, reviewing the modelling tools available in the literature and proposing a modelling strategy for assessing ECMs in building stocks with respect to energy reductions, CO2 emissions, and cost. The details of the proposed modelling strategy and the ECCABS building stock model are presented.
II. Paper II reviews current knowledge regarding the characteristics of the EU building stock, and introduces the methodology for building stock aggregation through archetype buildings, which has been developed within the work of this thesis. Paper II also describes how the methodology is applied and validated for the building stocks of France, Germany (only the residential sector), Spain, and the UK. The four countries are considered to be representative of the different climatic regions within the EU.
III. Paper III analyses the current energy usage and CO2 emissions of the Swedish residential building stock, taken as being representative of Northern European countries. The technical potentials for reducing energy use through the application of a portfolio of energy saving measures are also assessed.
IV. Paper IV addresses the costs of reducing energy use, investigating the techno-economic potentials and discussing the market potentials. In addition, the effects of different interest rates and energy price developments are studied, as they are of significant relevance to the cost efficiencies of the energy saving measures. Again, the Swedish residential stock is used as a case study.
V. Paper V studies the applicability of the methodologies presented in Papers I and II to a Southern European country, with Spain being chosen as a case study. The specific aims were to assess how to account for regional climate and how to include the non-residential subsector in the technical assessment of energy saving and CO2 mitigation potentials, as well as in the cost assessment.
The research described in this thesis addresses the above-discussed key issues, which have been identified as factors that have contributed to the failure to realize the potentials for energy savings and associated CO2 emissions in the building stock.

6
Delimitations The ECMs studied include the retrofitting of existing buildings by means of different measures, including energy sufficiency, increased efficiency, and increased supply from renewable energy sources. The effects of the measures are assessed in terms of net and final energy, CO2 emissions, and costs. In terms of GHG emissions, the presented results are restricted to CO2, since it is the major GHG emanating from buildings29. The assessment only takes into account the operating phase of buildings, which means that the construction and demolition phases are not considered. Cooling demand30 is not included in the analysis, since in the EU, space heating remains as the most relevant energy demand in buildings. Improvements to the transformation and distribution systems outside the buildings are not included in the analyses.
1.2 Project context The work described in this thesis is linked to the project Pathways to Sustainable European Energy Systems (hereinafter referred to as the Pathways Project), which is looking at the ways in which the European energy system might be transformed so as to be more sustainable, with a special focus on meeting targets for energy efficiency, reductions in CO2 emissions, and increased use of renewable energy (AGS 2011a). One of the aims of the Pathways Project is to develop a modelling package that can be used to represent the European energy system, including a work package to analyse the building sector. Therefore, in addition to the modelling work presented in this thesis, there are two additional models for the building sector within the Pathways Project, namely a top-down econometrical model (see Chapter 19 in AGS 2011a) and a bottom-up engineering distribution model (see Chapter 23 in AGS 2011a). The three models have been used to provide an overall assessment of ECMs and associated CO2 emissions in the existing European building stock under different scenarios up to Year 2050 (AGS 2011b). Ó Broin et al. (2011) have reported on how the modelling approach used in this thesis has been used in combination with a top-down econometrical approach to investigate future demand for space and water heating in the existing Swedish residential stock. Mata et al. (2010b) have described how the methodology has been tailored to the needs of the Pathways Project, while the paper of Mata et al. (2011) is an early version of Paper IV that focused on the scenario analysis for the Pathways Project.
In addition, an initial part of the work presented in this thesis was developed and validated within the framework of a project to assess the Swedish building stock, which was carried out by the Swedish National Board of Housing, Building, and
29 This is not a model limitation but an input-related issue, i.e., CO2-equivalent emissions can be also used as input to the model. 30 Although cooling demand is calculated in the model (see Paper I), the model output has not been used in the analyses presented in this thesis. For an example of how the modeling methodology presented here, including the cooling demand, has been used to study the impact of climate change on the energy performances of buildings in Stockholm, see Nik and Sasic Kalagasidis (2013). Further work is needed to include latent loads in the calculation of cooling demand.

7
Planning (NBHBP; Boverket, in Swedish). That work was connected to a large field investigation of the building stock, called the BETSI Program (NBHBP, 2009). The assessment performed in the initial work included a quantification of the energy saving potentials of existing residential buildings, based on data collected during the BETSI investigation of 1,400 sample buildings. The aim of that assessment was to elucidate the means and costs to achieve the Swedish target of reducing end-use energy demand in the Swedish building stock by 20% by 2020 and 50% by 2050. The results from the initial analysis are published in part in two reports issued by the NBHBP (NBHBP 2009, 2010).
1.3 Outline of the thesis This thesis consists of two parts, an introductory essay and the appended papers. The introductory essay synthesises the results described in the papers, which means that it does not give a paper-by-paper description. The thesis introductory essay is organized as follows:
After a short presentation of the research context, aims, and scope of this thesis in Chapter 1, Chapter 2 discusses the key issues related to building-stock modelling, such as the different modelling approaches and the corresponding data requirements. Chapter 3 presents the methodology for describing the building stock through archetype buildings, the building-stock model developed within the work of this thesis, and the energy conservation measures and packages investigated. Chapter 4 presents the key results, and a discussion of some critical issues arising from this work. Conclusions are drawn in Chapter 5, and the possibilities for further research are summarised in Chapter 6.

8
2 Key issues for building-stock modelling The key issues for building-stock modelling discussed in this Chapter are grouped under the general headlines of building stock categorisation (i.e., what to model) and types of models (i.e., how to model). The first topic deals with the definition of the building sector and the subsectors therein. The second topic relates to the different modelling types, with their strengths and limitations, and includes a description of how the chosen modelling approach fits the aims of this thesis. This section is restricted to modelling that has the specific purpose of studying improvements of the building stock’s energy performance and associated CO2 emissions on the national or European scale.
2.1 Building-stock categorisation Building stocks are generally categorised into residential and non-residential buildings (also known as the tertiary or commercial subsector), both of which types are considered in this work. In the residential subsector, allocations of main and second residences and vacant units are difficult to follow up due to the constant transfer from one category to another (Wilhelmsen, 1982). Nevertheless, in general, the residential subsector is better documented than the non-residential because:
• There is a particular political interest in the residential subsector, especially with respect to social housing (Kohler and Hassler, 2002);
• The non-residential subsector has generally only been documented for isolated buildings for technical or cultural reasons (public buildings, industrial monuments, etc.), with the primary focus being on individual buildings that are perceived as having outstanding architectural value (Kohler and Hassler 2002);
• Shops and offices can be located within residential buildings, which means that they are difficult to control and enumerate;
• The classification of non-residential buildings is unclear, as different sources use different definitions.
A building stock can be described in terms of sample buildings or archetypes. Sample buildings are herein designated as representing actual buildings (for data obtained from measurements) and are used as the input for modelling. As the building stock of a country consists of buildings with different characteristics, an extensive sample of the buildings is required for derivation of the thermal characteristics of the building stock. Thus, establishment of the sample requires significant efforts for measuring and quantifying the parameters of the building sample. Archetype buildings are statistical composites that provide an approximate description of the building stock, based on knowledge of the overall building characteristics within the region (e.g., age, size, construction materials, and house type), in combination with national statistics

9
relating to the building sector (e.g., energy use, climate) (Moffatt, 2001; Swan and Ugursal, 2009).
In Papers III and IV, the Swedish residential building stock is described in terms of circa 1400 sample buildings, based on information gathered by Boverket in the BETSI project. Further details regarding how the buildings were selected and how the survey was performed are given in Paper III. As such detailed knowledge of the national building stock based on sample buildings is very rare, a description of a building stock through archetype buildings is proposed in this thesis work (Paper II).
2.2 Types of models Currently used techniques to model end-use energy consumption in a building stock31 have recently been reviewed by Swan and Ugursal (2009) and Kavgic et al. (2010). The current techniques and available models can be divided into bottom-up and top-down models. Top-down models are based on historic aggregated energy values and regress the energy consumption of the housing stock as a function of top-level variables, such as macroeconomic indicators (e.g., gross domestic product, unemployment, and inflation), energy price, and general climate conditions. The reliance on historical data is a drawback, as top-down models lack an inherent capability to model discontinuous advances in technology. Furthermore, the lack of detail regarding the energy consumption of individual end-uses makes it impossible to identify key areas for improvements that would reduce energy consumption. Therefore, top-down modelling is more appropriate to an analysis of the past situation than to estimations of the effects of changes in consumption trends.
In contrast to the top-down models, bottom-up models calculate the energy consumption of individual or groups of houses and then extrapolate these results to represent the region or nation. Bottom-up models can be statistical or engineering-based. Statistical methods rely on historical information and regression analyses, which are used to attribute dwelling energy consumption to particular end-uses. Engineering methods explicitly account for the energy consumption of end-uses based on power ratings and the use of equipment and systems and/or heat transfer and thermodynamic relationships. Therefore, bottom-up models have the capability to determine the energy consumption of each end-use; in doing so, they can identify areas for improvement and address explicitly the effects of occupant behaviour and climate-adapted building design. The primary drawbacks associated with this level of detail are the magnitude of the required input data and the complexities of the calculation and simulation techniques used.
The choice to be made is not necessarily between a top-down and a bottom-up approach. A third, so-called hybrid, approach combines an element of bottom-up technological explicitness with estimations of the behaviours of consumers and firms, which are part of the top-down modelling approach (Jaccard 2004). Some examples of
31 Swan and Ugursal (2009) focus on residential buildings, but the same modeling techniques can be applied to non-residential buildings.

10
hybrid methodologies applied to the building sector have been reported (Jacobsen, 1998; Koopmans and te Velde, 2001; Rivers and Jaccard 2005; Yang and Kohler 2008, Giraudet et al., 2012), and these have focused on understanding the possibilities for changing the energy consumption of the building stock (e.g., consumer behaviour, rebounds, and policy effects) without taking into account the different end-uses or technologies or the interactions between these factors (i.e., only discrete levels of improvement are assumed).
2.2.1 Modelling approach adopted For both the objectives of the BETSI project, which focused on quantifying the effects on specific energy use of applying ECMs, and for the initial steps of the Pathways Project, which emphasises the energy system perspective, a bottom-up engineering approach was found to be suitable. This was the case because bottom-up engineering modelling can be used both to calculate the energy demand for the different end-uses and to estimate the effects of ECMs, for a set of individual representative buildings, with the results being extrapolated to represent an entire region. Furthermore, the link to the BETSI project facilitated the input data for the sample buildings, which were subsequently employed as representative buildings in the modelling.
Models of this type (reviewed in Paper I) are not readily available, and those that are available are tailored specifically to the region for which they were developed. Therefore, a model was developed in the present work with the aim of making it applicable to any EU MS. This building stock model is called the Energy, Carbon and Cost Assessment of Building Stocks (ECCABS) model. Figure 2.1 illustrates the general modelling process.
Figure 2.1 Overview of the modelling process, as conceived for the Pathways Project.
The main challenge of bottom-up engineering models, as identified above, is to find a level of detail with a reasonable input data requirement, while retaining sufficient spatial and temporal resolutions to allow investigations of changes in demand and the indoor climate environment. To meet this challenge, the ECCABS model combines hourly calculations and a one-zone approach. The hourly temporal resolution of the heat-balance allows considerations of temporal changes in demand that result from occupancy, the use of different appliances, and the effect of solar radiation gains. This
BUILDING STOCK
Results of ECCABS
model
Building
TO FEED AN OVERALL EU-MODEL
Scen
ario
s

11
level of resolution reflects the complexity of implementing measures that involve management of the building technical systems or user behaviour, and allows analyses of the effects on indoor temperature of applying ECMs.
The one-zone spatial resolution of the heat-balance implies that the representative building is modelled, in the so-called building model, as a single thermal zone by means of an equivalent volumetric heat capacity. This simplified representation has been chosen for the following reasons:
• To reduce computational time;
• To facilitate data gathering, in that when the data that describe a building stock are difficult to find, reducing the input data makes it easier to gather data for regions in which these data are lacking;
• To maintain coherence with respect to the approach. Since the buildings to be analysed should represent a building stock, they are by definition created from average values. For instance, instead of separately simulating buildings that are predominantly exposed to each one of the possible orientations of north, south, east, and west, it is assumed that the buildings in the stock include all possible orientations.
In summary, the aim has been to develop a model that represents a good compromise between providing a sufficiently detailed analysis and minimising the data requirements and computational time while offering a robust way to determine the effects and costs of ECMs on entire building stocks under different assumptions for the future. Thus, the model is in line with the ideal requirements for building stock models used for energy consumption, as summarized by Kavgic et al. (2010). Thus, such models should: a) estimate the ‘baseline’ energy consumption of the building sector disaggregated by different building categories and energy end-uses; b) explore the effects of different ECMs with respect to costs and CO2 emission reductions; and c) not be restricted to issues that are directly related to energy, but should be capable of assessing the effects of ECMs on indoor environmental quality.

12
3 Method This Chapter presents the overall bottom-up methodology developed within the work of this thesis, i.e., the methodology for describing the building stock through archetype buildings, the building-stock model, and the strategies for energy conservation investigated.
3.1 Building-stock aggregation The methodology used to describe a building stock through archetype buildings is illustrated in Figure 3.1. The methodology follows three distinct steps:
• Segmentation of the building stock, in which the number of archetype buildings required to represent the entire stock is decided. The segmentation criteria, as given in Table 3.1, include building type, construction year, heating system, and climate zone. These criteria are chosen because they give a good representation of the energy demand of the buildings while facilitating data compilation (i.e., matching the forms of data sources).
• Characterisation of the building stock, in which each archetype building is described by defining and computing its technical characteristics, based on the segmentation criteria listed in Table 3.1. Reports from official authorities responsible for dwellings (e.g., national Ministries of Dwellings/Energy/Environment) provide information about the buildings’ physical characteristics, and regulatory codes are useful for determining the indoor conditions and thermal properties of the building envelope.
• Quantification of the building stock, in which the total number of buildings in the stock represented by each archetype building is determined. National statistics are generally adequate to quantify the buildings and their heated floor areas.
Table 3.1. Segmentation categories to define the archetype buildings proposed in this work, and relevant building data dependent upon the category.
Category Relevant building data dependent upon the category Building type Effective heat capacity of the building
Floor area External surface area Internal gains Minimum desired indoor temperature Maximum desired indoor temperature Sanitary ventilation rate
Construction year Average U-value of the building Window area Ventilation rate
Heating system Indoor temperatures Fuels used
Climate zone Average U-value of the building Outdoor climate data

13
Figure 3.1. Illustration of the bottom-up methodology to describe a building stock through archetype buildings, as developed in this thesis. The illustration is based on a figure from Ribas Portella (2012).
After the aggregation of the building stock based on archetype buildings is completed, it is used as an input to the ECCABS model, in which the net and final energy demands for the entire building stock under investigation are simulated. To validate the building stock description, the final energy demand and associated CO2 emissions for the building stock, derived from the model, are compared with the corresponding values from national and international statistical databases.
The following EU and international databases are used for the validation of the final energy demand and CO2 emissions that are obtained from the model. These databases provide data on the building sector and are updated on a regular basis and include: Eurostat (EC 2011), which is the official database of the European Commission; ODYSSEE-MURE (Enerdata 2010), which is co-ordinated by the French Environment and Energy Management Agency [Agence de l'Environnement et de la Maîtrise de l'Energie, ADEME] with the technical support of Enerdata and Fraunhofer32; and the Greenhouse Gas and Air Pollution Interactions and Synergies (GAINS) database of the International Institute for Applied Systems Analysis (IIASA, 2010). The three databases are described in greater detail in Mata (2011), and their main components are summarised in Paper II.
32 Fraunhofer-Gesellschaft, Munich, Germany, 2010.
2 Characterisation of the physical and technical properties of the archetypes
3 Quantification of the archetype buildings in the building stock
1 Segmentation Number of archetypes according to building type, climate zone, construction year, and heating system
4 Validation of the annual final energy demand of the building stock (ECCABS model)

14
3.2 The Building-Stock Model ECCABS The ECCABS model has been developed in the Matlab and Simulink software environments33 and consists of two parts: a Simulink building-model, which solves the energy balance for the representative buildings; and a user interface written in Matlab, which handles the input and output data from the Simulink model, thereby extending the results to the building stock.
The net energy demand is calculated using the energy balance building model (calculated for all archetypes or sample buildings that represent the building stock). The building is modelled as a single thermal zone, with the building thermal inertia represented by its effective internal heat capacity, Cm, according to ISO 13790 (2008). It is assumed that the indoor air temperature and the temperature of all the internal layers are identical. The modelling is carried out using a time series of climatic data with a 1-hour time step and duration of 1 year. The indoor air temperature is derived from the differential heat-balance equation:
𝐶𝑚 ∙𝑑𝑇𝑖𝑛𝑡(𝑡)𝑑𝑡
= 𝑞𝑡(𝑡) + 𝑞𝑣(𝑡) + 𝑞𝑟(𝑡) + 𝑞𝑖𝑛𝑡(𝑡) + 𝑞(𝑡) (1)
where 𝐶𝑚 is the effective internal heat capacity of the building (J/K), 𝑇𝑖𝑛𝑡 is the indoor air temperature (°C), 𝑞𝑡 is the transmission-related heat losses through the building envelope (W), 𝑞𝑣 is the ventilation heat loss (W), 𝑞𝑟 is the solar radiation gains through windows (W), 𝑞𝑖𝑛𝑡 is the total internal heat gains (W), and 𝑞 is the total heat provided by the heating/cooling system (W).
Transmission heat losses are calculated for the average thermal transmittance of the total surface of the building envelope.
The ventilation flow rate encompasses sanitary ventilation and natural ventilation. Thus, heat loss due to ventilation is modelled as:
𝑞𝑣(𝑡) =𝑉𝑐 ∙ 𝐴 ∙ �𝜌𝑐𝑝�𝑎
1000∙ [𝑇𝑣𝑒𝑛𝑡(𝑡) − 𝑇𝑖𝑛𝑡(𝑡)] (2)
where 𝑉𝑐 is the sanitary ventilation rate (l/s/m2), 𝜌𝑎 is the air density (kg/m3), 𝑐𝑝𝑎is the specific heat capacity of the air (J/kg K), 𝐴 is the heated floor area of a building (m2), and 𝑇𝑣𝑒𝑛𝑡 is the temperature of the supply air (°C). The sanitary ventilation corresponds to the minimum ventilation flow rate required to assure a healthy indoor environment, and it does not necessarily have to be provided mechanically. Regarding natural ventilation, it is assumed that the occupants open the windows when the indoor air temperature exceeds the upper comfort limit 𝑇𝑣. Thus, natural ventilation occurs normally during the summer season. In buildings that lack heat recovery from the exhaust air, the temperature of the supply air is the same as the outdoor air 33 www.mathworks.com

15
temperature. If a heat recovery system is present, the supply air is preheated by the exhaust air. Depending on the outdoor air temperature 𝑇𝑜𝑢𝑡, the temperature of the supply air is obtained from:
𝑇𝑣𝑒𝑛𝑡(𝑡) = 𝑇𝑜𝑢𝑡(𝑡) + 𝐻𝑅𝑒𝑐_𝐸𝑓𝑓 ∙ [𝑇𝑖𝑛𝑡(𝑡) − 𝑇𝑜𝑢𝑡(𝑡)] , 𝑖𝑓 𝑇𝑜𝑢𝑡 < 15℃ (3a)
𝑇𝑣𝑒𝑛𝑡(𝑡) = 𝑇𝑜𝑢𝑡(𝑡), 𝑖𝑓 𝑇𝑜𝑢𝑡 ≥ 15℃ (3b)
where 𝐻𝑅𝑒𝑐_𝐸𝑓𝑓 is the efficiency of the heat recovery unit (0–1).
Since the model is to be applied to all buildings in a building stock, no specific orientation of the windows is considered, and a single horizontal window is taken as representing the total area of all the windows in the building. The difference in the levels of solar irradiation on differently oriented facades is compensated by the constant 𝐶𝑠𝑜𝑙. Solar gain from the solar radiation through windows is defined by:
𝑞𝑟 = 𝑇𝑠 ∙ 𝑊𝑐 ∙ 𝑊𝑓 ∙ 𝑆𝑤 ∙ 𝐼𝑠𝑜𝑙 ∙ 𝐶𝑠𝑜𝑙 (4)
where 𝑇𝑠 is the coefficient of solar transmission of the window (0–1), 𝑊𝑐 is the shading coefficient of the window (0–1), 𝑊𝑓 is the frame coefficient of the window (0-1), 𝑆𝑤 is the total surface of windows in the building (m2), 𝐼𝑠𝑜𝑙 is the global irradiation on horizontal surface (W/m2), and 𝐶𝑠𝑜𝑙 is the above-mentioned constant, which can be derived from:
𝐶𝑠𝑜𝑙 = (𝐼𝑁 + 𝐼𝑆 + 𝐼𝑊 + 𝐼𝐸)𝐼𝐻� (5)
where 𝐼𝐻, 𝐼𝑁, 𝐼𝑆, 𝐼𝑊, and IE are the solar energy levels transmitted through, respectively, a horizontal, north, south, west, and east window (kWh/m2 per year). The weather files that are required as input to the model have to be created according to the structure described in the International Building Physics Toolbox (Sasic Kalagasidis, 2006), and they must include hourly values for: outdoor temperature (ºC); global solar irradiation of horizontal surfaces (W/m2); diffuse irradiation of horizontal surfaces (W/m2); and normal direct irradiation (W/m2). Each representative building has to be assigned to a specific location or climatic zone, as the investigated region may have to be subdivided into different climatic zones. The values for the constant 𝐶𝑠𝑜𝑙 obtained in the present work for the different countries investigated are summarised in Table 3.2.
Table 3.2. Values for the constant 𝐶𝑠𝑜𝑙 obtained in the present work for the five countries investigated.
Country investigated France Germany Spain Sweden United Kingdom
Csol 0.585 0.634 0.514 0.650 0.610
Internal heat gains include heat generated in the building by internal sources other than the space heating system, i.e., heat gains derived from the metabolic activities of the occupants, as well as the heat released by appliances, lights, and ventilation fans.

16
Heat demand is defined as the heating power that is required to maintain the indoor air temperature at a given level. The heating system, which is characterised by a finite power and response time, is turned ON if the indoor air temperature is lower than a minimum indoor temperature. Otherwise, the heating is in the OFF position. Cooling demand is calculated in a similar way, which means that it does not include latent loads. In buildings with mechanical supply-exhaust ventilation systems or exhaust air heat pumps, the part of the heating demand for the sanitary ventilation losses recovered in a heat exchanger is also taken into account.
The total net energy demand, ETot , is calculated from:
𝐸𝑇𝑜𝑡 = 𝐷𝐸𝑙 + 𝐷𝐻𝑒𝑎𝑡+𝐷𝐻𝑜𝑡𝑊 (6)
where 𝐷𝐸𝑙 is the annual electricity demand, including the electricity required for lighting, appliances, water pumps, and fans (kWh/yr), 𝐷𝐻𝑒𝑎𝑡 is the annual heating demand minus the total heat recovered by the supply-exhaust ventilation system and the exhaust air heat pump (kWh/yr), and 𝐷𝐻𝑜𝑡𝑊 is the annual heat demand for hot water (kWh/yr). The net energy demand is converted into final energy demand using:
𝐸𝐷𝑒𝑙𝑖𝑣𝑒𝑟𝑒𝑑 = 𝐸𝑇𝑜𝑡/𝜇 (7)
where μ is the overall (weighted-average) efficiency of the energy conversion equipment and apparatus used for the delivery or production of space heating, hot water, and electricity for lighting and appliances. The value of μ is calculated from:
𝜇 = 𝜔𝐻𝑒𝑎𝑡 ∙ 𝜇𝐻𝑒𝑎𝑡 + 𝜔𝐶𝑜𝑜𝑙 ∙ 𝜇𝐶𝑜𝑜𝑙 + 𝜔𝐸𝑙 ∙ 𝜇𝐸𝑙 + 𝜔𝐻𝑜𝑡𝑊 ∙ 𝜇𝐻𝑜𝑡𝑊 (8)
where ω-s represents the weighting coefficients for the different end-uses. If more than one energy carrier is used, the weighting coefficient for, for example, space heating is calculated from:
𝜔𝐻𝑒𝑎𝑡 = ∑ 𝐷𝐻𝑒𝑎𝑡,𝑖𝑖 /𝐸𝑡𝑜𝑡 = ∑ 𝜔𝐻𝑒𝑎𝑡,𝑖𝑖 (9)
where i denotes the energy carrier. The CO2 emissions associated with the energy demand in the building stock are deduced by applying the emission factors for the different energy carriers to the energy delivered, as obtained from the modelling. The reductions in energy demand and CO2 emissions that could be achieved by the application of the ECM are calculated in relation to a baseline year in which no ECMs are applied.
The cost of reducing energy use and associated CO2 emissions is calculated based on the investment costs provided as inputs (cf. Table 3.3) and the modelled technical potential energy reductions (𝐸𝑆) to be achieved by implementing the ECMs.

17
Since both the technical potential energy savings and their corresponding saved energy costs (𝐶𝑒) are calculated on an annual basis, the net annual costs are calculated as (EC, 2012):
𝑁𝐴𝐶 = 𝐸𝐴𝐶 + 𝐶𝑟 (10)
where 𝐸𝐴𝐶 is the equivalent annual cost (€/yr); and 𝐶𝑟 is the annual running costs (€/yr). The investment cost is also given as equivalent annual cost according to:
𝐸𝐴𝐶 = 𝐶𝐼 ∙ 𝑅1 − (1 + 𝑅
100� )−𝑛� (11)
where CI is the initial investment cost of the measure (€), which can be provided as Euro per heated area, as Euro per surface to be retrofitted or as Euro per dwelling; R is the discount rate (0–1); and n is the lifespan of the considered measure (yr). Both the investments and the savings are annualised. Therefore, Eqn. (10) implies a continuous investment perspective for the calculation period. The annual running costs are given by:
𝐶𝑟 = 𝑀𝑐 + 𝐶𝑜 + 𝐶𝑒 (12) where 𝑀𝑐 is the maintenance costs, 𝐶𝑜 represents the operational costs, and 𝐶𝑒 is the energy costs (EN 15459, 2008) calculated as the annual cost of the energy saved ES, based on the energy prices for the different scenarios and time periods applied, and thus are generally an economic gain. If the calculation period is longer than 1 year, 𝐶𝑟 is multiplied by a discount factor 𝑅𝑑 :
𝑅𝑑 = 1�1 + 𝑅
100� �𝑁� (13)
where R is the discount rate, and N is the number of years to be discounted back to the starting year.
The cost-effectiveness of the ECMs is given by the net annual unit cost for energy saving CE (€/kWh saved):
𝐶𝐸 = 𝑁𝐴𝐶𝐸𝑆� (14)
where NAC is the net annual cost of the ECM (€/yr) defined above, and 𝐸𝑆 is the annual energy saved due to the application of the measure (kWh/yr). A measure is considered cost-effective if the value of 𝐶𝐸 is negative, i.e., the achieved cost saving from applying a measure exceeds the investment cost for the measure. The net annual cost for CO2 avoidance (𝐴𝐶, in €/tCO2 avoided) is calculated in a similar way using the reduction in CO2 emissions arising from the application of the ECM (tCO2/yr) obtained from the modelling.

18
Table 3.3. Summary of inputs and outputs in the ECCABS model (see Paper I for a detailed description of the inputs and outputs and their units).
Inputs Outputs Building stock description1 Area of heated floor space Total external surfaces of the building Total window surface area of the building Shading coefficient of the window Frame coefficient of the window Effective volumetric heat capacity of a heated space Coefficient of solar transmission of the window Average U-value of the building envelope Response capacity of the heating system Maximum power rating of the heating system Heat losses of the fan to the indoor air Specific fan power Efficiency of the heat recovery system Electricity consumption of water pumps Minimum indoor temperature Indoor temperature level above which the opening of windows/natural ventilation is assumed to occur Initial indoor temperature Minimum ventilation flow rate (sanitary ventilation) Natural ventilation flow rate Average constant heat gain due to people being present in the building Average power demand for hot water production
Net Energy demand by End-Uses1 Space Heating Hot Water Electricity Total
Fuel description1 Fuels used in each building type Efficiency of each fuel Carbon intensity of each fuel
Final Energy Use by Fuels1, 2 Space heating Hot water Lighting Appliances Total CO2 emissions associated
Technical potentials1, 2, 3
Costs description Interest rate3 Lifetime of the measure over which the annual cost saving is supplied3 Cost per heated area3 Cost per surface below ground to be retrofitted (basements) 3 Cost per surface above ground to be retrofitted (facades) 3 Cost per surface of roof/attic to be retrofitted3 Unitary cost3 Average surface of an apartment dwelling Surface of the building envelope below ground (basements) 1 Surface of the building envelope above ground (facades) 1 Surface of the building envelope corresponding to roof /attic1
Cost assessment1, 3 Equivalent annual costs Cost of energy saved Net cost for energy-saving Net abatement cost Techno-economical potentials1, 3 Market potentials1, 3
1For each building type 2For each of the fuel types: Electricity; Oil; Gas; Biomass/Waste; and District Heating. 3For each energy conservation measure assessed

19
The ECCABS model provides the outputs of net energy demand by end-uses and final energy demand (Table 3.3). The outputs are given for each different building type analysed and in aggregated form for the building stock. As the data regarding net energy demand are not given in the statistics, the model contributes to the description of energy use in a building stock. Other model outputs, such as the final energy use of an entire country building stock, are readily found in the national statistics, although they are rarely available for other sizes of building stocks (e.g., for a housing company, a neighbourhood or a local region).
The model is explained in Paper I, and the latest update for the cost calculations is provided in Paper IV. Mata and Sasic Kalagasidis (2010) have described how the initial so-called EABS model (Mata and Sasic Kalagasidis, 2009) was extended to include carbon and cost assessments; Mata et al. (2010a) have demonstrated a simplified method for cost calculations, which are essential for allowing the model to be used with the available inputs for any building stock.
3.2.1 Model Validation The different parts of the model have been tested as follows:
The accuracy of the energy balance model (in Simulink) has been validated using comparative and empirical methods (for a description of these validation methods, see Judkoff and Neymark, 1995), as presented in Paper I. In the comparative validation, the modelling results for two buildings, an office building located in Barcelona, Spain and a residential building in Köping, Sweden, were compared to the results obtained from other models that have been validated using the standard BESTest procedure (ANSI/ASHRAE, 2007). Specifically, for the Swedish residential building, the calculated heat demand was found to be in good agreement (within 1%) with the values calculated using HAM-tools [see the model validation description in Sasic Kalagasidis et al. (2006)] (Mata and Sasic Kalagasidis, 2009). Regarding the Spanish office building, the calculated heat demand was also in a good agreement with the values calculated using DesignBuilder/EnergyPlus [see the model validation description in Henninger et al. (2003)]. In addition, the results for indoor temperature obtained in the present work were compared with those obtained for the Spanish building during a warm week, using the DesignBuilder software. As DesignBuilder allows detailed simulation of natural ventilation, it provided hourly based results that were closer (i.e., in terms of the amplitude and phase of the indoor temperatures) to the measured values than those provided by the model used in the present work. These discrepancies between the ECCABS model and the measured temperatures in terms of the results for the amplitude and phase of the indoor temperatures can be attributed in part to uncertainties related to some of the input values, given the characteristics of the buildings (i.e., large glass facades, ventilated basement, natural ventilation, and extensive exposure to the sun), and also to the fact that the cooling demand is covered exclusively by natural ventilation. Nevertheless, the average temperature values obtained with the two models were similar (26.1°C with ECCABS and 26.3°C with DesignBuilder).

20
In the empirical testing, the results of the model were compared with experimental data for the above-mentioned buildings. For the Swedish residential building, the calculated annual heat demand (101.6 kWh/m2) was found to be in good agreement with the measured values (97.4 kWh/m2), corresponding to a difference of <1% (Mata and Sasic Kalagasidis, 2009).
For the validation of final energy demand, the aggregated model results have been compared to corresponding data for the Swedish and Spanish building stocks, which are found in the national statistics and international databases. The resulting final energy demand for all countries is in general agreement (within +2% to -7%, as summarised in Table 3.4) with the international statistics. Further details are presented on the validation for Sweden (residential buildings only) in Paper III, on the validation for Germany (residential buildings only), the UK, and France in Paper II, and on the validation for Spain in Papers II and V, as well as in the paper of Medina Benejam et al. (2012).
Table 3.4. Deviation of the resulting final energy demand in the reference year (TWh/yr) from the corresponding data available in statistics, for the different countries studied. The sources used for the comparison are specified in the table.
Country Subsector In this work In other sources Deviation from sources
France R 437.1
472.1 (Enerdata, 2010) 460.0 (ADEME, 2006)
-7 % -5%
NR 186.3 188.3 (MSD, 2007) -1%
Germany R 684.2
680.0 (Mayer, 2010) 688.3 (BWT, 2010)
+1% -1%
Spain R 178.4 175.2 (EC, 2011) 176.2 (IIASA, 2010)
+2% +2%
NR 91.9
98.6 (EC, 2011) 97.7 (IIASA, 2010)
-6% -5%
Sweden R 91.8 92.2 (NBHBP, 2009) -1%
UK R 571.8 563.7 (DECC, 2011) +1%
NR 81.4 79.9 (DECC, 2011) +2%
Furthermore, the influence of each specific model input/building characteristic on the total energy demand, as obtained from the modelling, has been quantified by normalized sensitivity coefficients. These coefficients represent the corresponding percentage change in the output variables given a 1% change in the input parameter (Firth et al., 2010). The results of the sensitivity analysis, which are presented in Paper II, highlight the six input parameters that have the greatest influences on the modelled energy demand. For all the countries studied, indoor temperature has the highest impact on the modelled energy demand, which is directly related to occupants’ behaviours and lifestyle preferences. The properties of the building envelope have the second highest impact on the energy demand. These properties include of course the average U-value of the envelope, but also the surface area of the

21
envelope and the characteristics of the windows (i.e., area, and percentage of window frame). Finally, hot water demand exerts an influence in the residential sector, as this demand corresponds to 9%–20% of the total final energy demand for the sector in the five countries investigated. However, for the non-residential sector, ventilation and lighting have higher relevance than hot water demand.
The validation of CO2 emissions is done by comparing the results obtained from the modelling for the baseline year to the corresponding available statistics. The validation for the Swedish case for baseline year 2005 is presented in Paper III. The values for CO2 emissions derived from the overall residential stock are provided by Enerdata (2010) (4.77 MtCO2) and the Swedish Energy Agency (2011) (5.32 MtCO2), and are similar to the value of 4.92 MtCO2 estimated in the present work. The validation for the Spanish case is presented in Paper V. The total annual CO2 emissions for baseline year 2005 excluding electricity (29.3 MtCO2) are similar to the corresponding level given by the EC (2011) (29.6 MtCO2), while for the CO2 emissions related to electricity there are no data available in the statistical databases that could be compared to the figures obtained in the present work34. Furthermore, neither the literature nor the statistics contain disaggregated data on CO2 emissions for the different building categories of the subsectors for any of the countries investigated. Thus, a comparison on this level using the results obtained in the present work could not be performed.
In summary, the modelling methodology described in this thesis is a first attempt to establish a tool to quantify the effects of energy saving and CO2 mitigation strategies for an entire building stock, thereby laying the groundwork for discussions of policy implications. In its present form, the methodology developed within this work is applicable to any of the EU countries investigated, whereas applications to other countries may require adaptations to local conditions.
3.3 Energy conservation measures investigated Conservation measures can be regarded as a combination of sufficiency (decreasing demand), efficiency (increasing the efficacy with which a specific outcome is produced), and the use of renewable energy sources (RES). In this thesis, conservation measures are investigated with respect to their effects both on energy and associated CO2 emissions.
Sufficiency measures refer to reductions in net energy demand, i.e., the actual needs of the building that are modelled from the energy balance equation. Therefore, sufficiency represents the interplay that occurs between transmission, radiation,
34 Pagès-Ramon (2012) and EC (2011) report on equivalent CO2 emissions, which includes other GHGs in addition to CO2, such as CH4 and NO2, which means that the reported values cannot be used for comparison here. The current work investigates how to include all GHG emissions; the main obstacle to this task is that data for all the GHG emissions related to the production of the different fuels are lacking.

22
ventilation, and internal loads to minimise the net energy demand for space heating35 and lighting. Transmission and radiation loads can minimise net energy demand by means of a well-performing building envelope, as well as climate-adapted design and passive strategies, such as the orientation of the building, its form, volume and placement with respect to the surroundings, or the fulfilment of sunshine and daylight requirements. Ventilation and internal loads are dependent upon the number of occupants and the equipment installed in the building (i.e., fans, lighting, and appliances), as well as on the management of the equipment, which can be performed by the occupants or automatically [e.g., via smart systems for Demand Side Management (DSM)]. An additional determinant of the net energy demand is the use to which the building is put, e.g., the allocation of activities with respect to climate loads36. However, climate-adapted design, passive strategies, and improvement of the use and management37 of the building are not investigated as ECMs in the present work.
Efficiency measures refer to the efficacy with which the above-described net energy needs are met by the technical systems of the building, which encompass the technical equipment for heating, cooling, ventilation, hot water, and lighting.
In addition, the final energy demand of a building can be reduced by using on-site RES, such as solar thermal, photovoltaic (PV) systems and biomass boilers. In fact, buildings may be regarded as power generators rather than as energy consumers.
In the assessment of the Swedish residential stock (Papers III and IV), only so-called energy saving measures (ESMs) are investigated, since the Swedish targets (as outlined in Section 1.2) refer to reductions in net energy use. These ESMs are described in detail in Section 3.3.1. The assessment of the Spanish building stock includes, in addition to these ESMs, boiler replacements, changes in energy carrier for heating systems and supply from on-site RES. Therefore, in Paper V, so-called energy conservation measures (ECMs) are investigated.
Regarding the potential reductions in energy use and associated CO2 emissions described in the present work, it is important to note that they relate to the application of ECMs both individually and in an aggregated form, with the aggregated application being used to investigate different implementation possibilities. In the individual case, the ECMs are modelled one at a time, to provide simply an indication of the potential energy saving and CO2 emission reduction that can be obtained from each ECM, together with their associated costs. However, these potentials cannot be 35 For the end-uses of hot water and electricity, the net energy demand is directly linked to the occupants’ consumption patterns (and for hot water, also to the use of aerator taps). 36 For instance, when assigning the lectures for a summer workshop in a university building that is rather unoccupied, one can choose between the highly irradiated lecture rooms of the southern facade, or the fresher rooms on the northern side. The former option implies a cooling demand, while the latter option probably does not. 37 See López and Cuchí (2005) and López Plazas (2006) for an example of how optimisation of the use and management of the buildings confers a 30% reduction in the energy demand of a university campus.

23
summed to derive the overall effect of the ECMs. In the aggregated approach, several measures are applied simultaneously, given that the effect of one measure can influence the effects of other ECMs. Nevertheless, when ECMs are applied in an aggregated form in packages it is not possible to distinguish the contribution of each ECM to the overall effect of the ECM package.
With respect to the technical potential, it is assumed that the energy savings from each individual ECM or package are fully achieved. Thus, in this thesis, the technical potential is defined as the reduction of energy use and associated CO2 emissions that could be obtained by implementing an already demonstrated ECM, without specific reference to costs. In addition, the techno-economical potential is also calculated, i.e., the part of the technical potential that is cost-effective in relation to market costs using societal discount rates, with CO2 taxes included in the energy prices, as discussed in Paper IV. Finally, an approximate estimate of the market potentials is derived from the techno-economical potentials, albeit using private discount rates instead of societal discount rates. Market potentials are discussed in Papers IV and V.
3.3.1 Individual ECMs The number of measures is not predetermined in the model, which allows assessment of any measure that entails a change in the inputs listed in Table 3.3 (Section 3.2).
In total, thirteen ECMs have been assessed during the course of the work described in this thesis. The ECMs are listed by number in Table 3.5, together with the corresponding numbers that are used to identify the measures in this introductory essay and in Papers III–V. The types of measures can be interpreted in the light of the above. Thus, the sufficiency measures are: improvement of the U-values of cellars, facades, and attics (ECMs 1–3); window replacement (ECM 4); reduction of hot water demand by installing aerator taps (ECM 8); and reduction of indoor temperature (ECM 10). Efficiency measures are defined for the different building technical systems: installation of heat recovery systems (ECM 5); replacement of lighting equipment, appliances, and water pumps by equipment that is 50% more efficient (ECMs 6, 7, and 9); and replacement of the existing oil and gas boilers by boilers that have an assumed efficiency of 90% (ECM 12). The measures based on RES include solar collectors for hot water production (ECM 11) and replacement of the existing oil and gas boilers by biomass boilers with an assumed efficiency of 90% (ECM 13).
The development of the modelling methodology started with a list of twenty-three measures to be assessed for the Swedish building stock, as suggested by Boverket in the framework of the above-mentioned co-operation within the BETSI program. A detailed description of the measures is provided elsewhere (NBHBP, 2009). To facilitate the modelling and data-gathering for other countries, the measures were grouped into a portfolio of ten measures. Validation of the reduced number of measures has been presented by Mata et al. (2010a). The validation involves comparing the resulting energy saving potentials and costs obtained using the twenty-

24
three measures with those obtained using the ten measures. The results for the ten measures are presented in Papers III and IV.
Of the ECMs studied for Sweden, i.e., ECMs 1–10, the reduction of indoor temperature was found not to be applicable to Spain, where the indoor temperature of dwellings was assumed to be acceptable from 18ºC. The results presented in Papers V refer to the ten ECMs (1–7 and 11–13).
Table 3.5. Summary of the ECMs investigated in this thesis.
# In this essay
Papers III and IV
Paper V Description of ECM
1 1 1 Improvement of U-value of cellar/basement 2 2 2 Improvement of U-value of facades 3 3 3 Improvement of U-value of attics/roofs 4 4 4 Replacement of windows 5 5-6 5 Installation of ventilation systems with heat recovery 6 7 6 Replacement of lighting equipment by more efficient
equipment 7 8 7 Replacement of appliances by more efficient equipment 8 9-10 na Reduction of hot water demand 9 11 na Replacement of water pumps by more efficient ones 10 12 na Reduction of indoor temperature 11 na 8 Installation of solar collectors for hot water production 12 na 9a Replacement of the existing boilers by boilers with an assumed
efficiency of 90% 13 na 9b Replacement of the existing gas and oil boilers by biomass
boilers with an assumed efficiency of 90% na, Not applicable.
3.3.2 Possibilities for implementation – packages of ECMs In Papers III and IV, ECMs are applied simultaneously (Package A338: ECMs 1– 10). Nevertheless, other groupings of measures, created either for technical or operational reasons, may be reasonable. For instance, one could replace the windows and at the same time check the building envelope for air leakages. It may also be reasonable to retrofit the envelope before installing a ventilation system with heat recovery. However, a building owner might consider it easier to switch from a private boiler to DH rather than retrofit the envelope. Furthermore, subsidies (to increase the use of renewables, for instance) and regular renovation cycles influence decisions as to the retrofitting of a building.
38 Although this package is termed ‘A3’, it appears in this introductory essay before packages A1 and A2. This is done to avoid any confusion linked to renaming packages A1 and A2, which are referred to as such in Paper V, from which the figures are taken.

25
Thus, in Paper V, the following alternative combinations of ECMs have been investigated:
1) Application of a large number of ECMs, aiming at extensive energy-saving renovations:
o Package A1 (ECMs 1–7 and 11–13) corresponds to a comprehensive retrofit, which includes energy sufficiency, energy efficiency, and use of renewables. This intervention is in line with a standard-based retrofit, as required by the Spanish building energy code (CTE, 2006) for integral renovation projects (>1000 m2).
o Package A2 (ECMs 1–7) excludes the installation of boilers and solar collectors. This package is applicable, for instance, to the majority of existing apartment buildings (MFD) in Spain with individual heating systems and no access to a solar-irradiated surface.
2) Application of ECMs that have a different focus, based on technical, constructional, and operational considerations, in an unregulated renovation market39, namely:
o Package B1 (ECMs 1– 4) improves the building envelope, thereby targeting net energy demand. This intervention is linked to natural renovation cycles and applies, for instance, to facades that have to be renovated anyway. The window of opportunity is a key issue here, since the lifespan of these EMSs (30–40 years) is the longest of all the ECMs;
o Package B2 (ECMs 4 and 5) involves improvements to the ventilation system, i.e., heat recovery and airproofing of the building envelope through windows replacement;
o Package B3 (ECMs 6 and 7) reduces the electricity demand for lighting and appliances, thereby targeting final energy demand. As an example, this package conforms with the EL directive (EC, 2009), and has the shortest lifespan (1–5 years), since lighting and appliances are frequently replaced;
o Package B4 (ECMs 11–13) meets the net energy demand by renewable means, i.e., through the use of solar collectors and the installation of efficient (biomass) boilers, thereby targeting CO2 emissions. This package is concordant with the need to replace a boiler that is no longer operational and provides the possibility to benefit from subsidies designed to increase the use of RES.
39 For instance, if there are no requirements for improvements in the building energy performance when the building is renovated.

26
4 Results and Discussion The results described in this Chapter are based on the work presented in Papers I–V. The results are not presented on a paper-by-paper basis, but are instead discussed according to topic, whereby some of the results are taken directly from the papers while other results have been added during the course of this thesis.
4.1 Building-stock description Table 4.1 presents the numbers of archetypes for the four countries investigated. Note that Swedish buildings are not included in the table, as sample buildings were used to represent the building stock for Sweden. The numbers of subtypes in the categories of building type and construction year show the greatest differences between the countries, since these subtypes reflect historical events, traditions in relation to building styles, and changes in construction techniques and building regulation codes. With respect to building type, the way in which the data sources are compiled generally allow clear differentiation between residential (R) and non-residential (NR) buildings. Within the R buildings, the numbers of subtypes required to define the building stock range from only single-family dwelling (SFD) and multi-family dwelling (MFD) subtypes in Spain to the more detailed four or five subtypes required for the building stocks in Germany and the UK (Table 4.2).
Table 4.1. Numbers of archetype buildings for the different countries, as obtained from the analysis described in Section 3.1 (cf. Table 3.1 for a detailed description of the categories).
Segmentation category France Germany Spain UK R NR R R NR R NR Building type 3 5 5 2 4 5 3
Construction year 3 3 10 4 4 7 7 Climate zone 3 3 3 5 5 4 4 Heating system 2 - - - - 2 - Total number of archetypes 54 45 122 40 80 192 84
R, Residential; NR, non-residential (Paper II).
Table 4.2. Subtypes within the Building-Type category proposed in this work, and the countries in which it is used.
Categories Residential type Non-residential type Building type MFD, Multi-family Dwelling (DE, ES, UK)
SFD, Single-family Dwelling (DE, ES, FR) AP, Apartment block <10 floors (DE) HH, High-rise buildings >10 floors (DE) PrMFD, Private MFD (FR) PuMFD, Public MFD (FR) D, detached (UK) SD, semidetached (UK) T, Terraced (DE, UK) B, Bungalow (UK) X, Others (UK)
O, Office (ES, FR,UK) C, Commercial (ES, FR) SCL, Sports, Culture and Leisure (ES, FR) E, Educational (FR) H, Health (FR) Re, Retail (UK) W, Warehouse (UK) X, Other services (ES)
DE, Germany; FR, France; ES, Spain; UK, United Kingdom (Paper II).

27
The required number of climate zones in the country, when defining the archetype buildings, depends on the country’s variations in altitude and latitude, as well as differences in exposure to seas/oceans. Thus, Germany needs only three climate zones, while five weather zones are needed for Spain. In all, fifteen climate zones are identified in the four countries. Since the archetypes described in the present work aim to be representative of a fraction of the the buildings in the EU, it should be cautioned that the literature in this field variously proposes different climatic zones for EU, ranging from three zones (Ciscar, 2009) to five zones (Tsikaloudaki, 2012). Both of these reports group EU countries into regions, although Tsikaloudaki (2012) takes into account both the heating and cooling energy needs (i.e., in degree days, DD) of each specific location, regardless of the country. While an analysis of the number of climatic zones required for modelling the EU is outside the scope of the present work, it should be noted that the countries considered in this thesis belong to the regions considered in the above-mentioned different climatic zone proposals for the EU.
Figure 5.1 shows the average U-values of the buildings in each country for residential (SFD and MFD) and non-residential buildings, as obtained from the archetype description in this work. In general, the U-values are lower in the colder climate zones and higher in the warmer zones, with Spain and Sweden having the highest and lowest average U-values, respectively, for all the building types investigated. Eurostat reports the number of annual degree-days of reference (DDn/yr) for EU countries as follows: Spain, 2136; France, 2250; UK, 3164; Germany, 3749; and Sweden 3806. However, in spite of the colder climate in Germany, the U-values of German buildings (i.e., 1.1 W/m2K for SFD and 1.5 W/m2K for MFD) are higher than the corresponding values for UK buildings (i.e., 1.1 W/m2K for SFD and 1.2 W/m2K for MFD). MFD buildings in the UK have on average surprisingly low U-values, perhaps due to the fact that residential buildings constructed before 1985 have an average U-value of around 1.3 W/m2K, as reported previously (cf. Arababadi [2012] for a summary of the U-values reported in [Johnston, 2003; Petersdorff, 2006; Firth, 2010]). In the other three countries, the older buildings (built before 1985) have U-values >2.0 W/m2K, with U-values up to 3.5 W/m2K in France for the oldest Public MFDs which are not yet refurbished. Another interesting result is that despite their similar climates Spanish buildings have significantly higher U-values (i.e., around 1.9 W/m2K for all building types) than French buildings (i.e., 1.1 W/m2K for SFD, 1.6 W/m2K for MFD, and 1.3 W/m2K for NR); and Swedish buildings have significantly lower U-values (i.e., around 0.5 W/m2K for all building types) than German buildings (i.e., 1.1 W/m2K for SFD and 1.5 W/m2K for MFD) . Therefore, it can be concluded that U-values are not related exclusively to climate type.
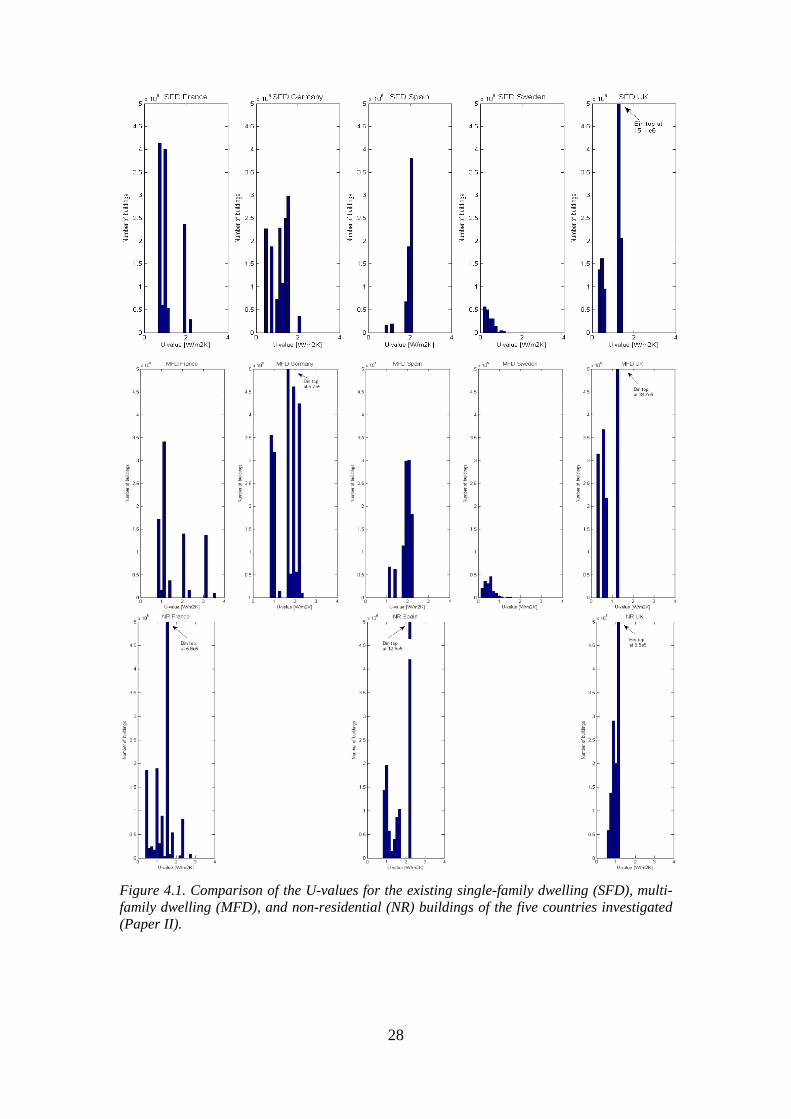
28
Figure 4.1. Comparison of the U-values for the existing single-family dwelling (SFD), multi-family dwelling (MFD), and non-residential (NR) buildings of the five countries investigated (Paper II).

29
Table 4.3. Annual net energy demand (TWh) in the reference year for the different countries studied.
Country France Germany Spain Sweden UK
Subsector R NR R R NR R R NR
Heating 263.2 85.4 560.6 101.9 31.2 65.5 279.8 29.3 Hot water 69.7 16.8 47.7 25.6 1.8 8.8 95.9 5.4 Electricity* 104.2 84.1 76.0 35.0 59.0 17.7 101.8 46.7 TOTAL 437.2 186.3 684.2 178.4 91.9 91.8 472.9 81.4 Heated floor Area (Mm2) 2269.6 758.3 3269.8 1294.1 314.9 537.8 2360.7 432.1
* Electricity for electrical appliances, lighting, hydro pumps, fans and air conditioning. R, Residential; NR, non-residential.
Furthermore, the modelling itself allows characterisation of the energy usage in the existing building stock by providing modelled data. For example, data on net energy by end-use (Table 4.3) is not currently available from existing databases of statistics on building stocks, and it can serve as a basis for other modelling analyses.
4.2 Technical potential energy savings and associated CO2 emissions avoided
The technical potentials for energy savings and associated CO2 emissions have been investigated for Swedish R buildings (Paper III) and for Spanish R and NR buildings (Paper V). This chapter presents the results in an aggregated form for the residential and non-residential buildings in each country, even though Papers III and V give the results for the different building types according to subsector.
4.2.1 Individual ECMs
Effects on net energy demand per end-use The modelling facilitates investigations of the effects of the ECMs on all energy end-uses in the building. Some ECMs influence only a single end-use (e.g., space heating or hot water), whereas other ECMs, such as the installation of heat recovery and increased efficiency of lighting and appliances (ECMs 5–7), exert effects on the net energy demands for both space heating and electricity.
Table 4.4 shows how the installation of mechanical ventilation with heat recovery (ECM 5) decreases heating demand, although in both the Swedish and Spanish R buildings it also increases electricity use due to operation of the fans. Nevertheless, in NR buildings, the implementation of ECM 5 would involve replacement of the installed ventilation systems with heat recovery systems40, which would only result in decreased space heating demand. When the electricity demand for lighting and appliances is reduced (ECMs 6 and 7), so is the heat released from the lights and appliances to the indoor air. Thus, the demand for space heating increases (the
40 It is assumed that both systems are exhaust-only, although one includes an air source heat pump that recovers energy from the exhaust air.

30
negative values in Table 4.4). However, the application of ECMs 6 and 7 results in overall energy savings.
Table 4.4 Effects of selected ECMs on net energy demand reductions by end-use (TWh/yr) in the Swedish residential (R) buildings, and in the Spanish R and non-residential (NR) buildings.
Measure End-use Sweden - R Spain - R Spain - NR Installation of Heat Recovery systems (ECM 5)
Space Heating 22.1 8.1 6.1 Electricity -0.5 -3.3 0 Total 21.6 4.8 6.1
Increased efficiency of lighting (ECM 6)
Space Heating -1.5 -5.9 -16.4 Electricity 1.8 12.1 31.4 Total 0.3 6.2 15.0
Increased efficiency of appliances (ECM 7)
Space Heating -4.3 -4.1 -1.5 Electricity 5.3 8.5 3.2 Total 1.0 4.4 1.7
Figure 4.2. Levels of reduction in final energy demand by fuel (% of baseline year, x-axis) for each of the ECMs studied (y-axis) for Swedish residential (R) buildings, and Spanish R and non-residential (NR) buildings, as obtained in the present work.
-20% 0% 20% 40%
Sweden-RSpain-R
Spain-NRSweden-R
Spain-RSpain-NRSweden-R
Spain-RSpain-NRSweden-R
Spain-RSpain-NRSweden-R
Spain-RSpain-NRSweden-R
Spain-RSpain-NRSweden-R
Spain-RSpain-NRSweden-RSweden-RSweden-R
Spain-RSpain-NR
Spain-RSpain-NR
Spain-RSpain-NR
ECM
1EC
M 2
ECM
3EC
M 4
ECM
5EC
M 6
ECM
7
EC M 8
EC M 9
EC M 10EC
M11
ECM
12EC
M13
Technical potential reductions in final energy demand (%)
Electricity
Oil
Gas
Biomass
District Heating
53%
-48%
ECM 8 ECM 9
ECM 10

31
The overall energy savings from ECMs 5–7 are listed in Figure 4.2, which combines the results presented in Table 4.4 with the details of the fuels used in the different archetype buildings. Thus, Figure 4.2 presents for the Swedish R buildings and Spanish R and NR buildings, the distributions of the potential final energy savings for the individual ECMs categorised by fuel. It is clear from Figure 4.2 that the decrease in electricity demand that results from the implementation of ECMs 6–7 entails an increase in the demand for the other fuels used for space heating. It is also noteworthy from the figure that the potential reductions in final energy demand for installing solar collectors for hot water production (ECM 11) and for replacing gas and oil boilers (ECMs 12–13) are less substantial in the NR than in the R subsectors, owing to the different distributions of end-uses and fuel types within these subsectors. In this context, hot water demand in the NR sector accounts for only 2% of the total energy demand, while it accounts for 10% of the total energy demand in the R sector, and gas and oil consumption in the NR sector accounts for only 4% of the total energy demand, while the corresponding value for the R sector is 42%.
Final energy demand reductions Figure 4.3 summarises the technical potential reductions in terms of reduced final energy and associated CO2 emissions (as % of the final energy demand in the baseline year), as derived from modelling the ECMs individually in the Swedish and Spanish building stocks. These potential savings are calculated on the assumption that there are no changes in the energy systems with respect to the efficiencies of the different energy carriers.
Figure 4.3. Potential reductions in annual final energy (in colour) and associated CO2 emissions (in grey), given as percentages of the baseline values (y-axis) for each of the ECMs studied (x-axis) for Swedish residential (R) buildings, and Spanish R and non-residential (NR) buildings, as obtained in the present work.
-5%
0%
5%
10%
15%
20%
25%Sweden-R Spain-R Spain-NR Sweden-R Spain-R Spain-NR
40% 25%

32
In both countries, the different forms of envelope upgrade (ECMs 1– 4) have the largest energy saving potentials for all buildings (5%–10% reduction for each). However, other ECMs with significant energy saving potentials differ between the two countries and respective subsectors. For Sweden, the measures that give the greatest savings, in addition to the envelope upgrade, are those involving heat recovery systems (22% reduction) and a reduction of indoor temperature to 20ºC (14% reduction). In the Spanish case, for R buildings, the modelling results suggest that the installation of solar collector for hot water production (ECM 11) and boiler replacement (ECMs 12 and 13) lead to reductions of 5%–7% each. For the Spanish NR buildings, the analysis indicates that improved efficiency of lighting (ECM 6) and the installation of heat recovery systems (ECM 5) give the largest energy saving potentials (7%–16% each).
Associated CO2 emissions avoided The corresponding effects of the ECMs on CO2 emissions for the Swedish and Spanish cases range from a 2% increase to a 40% reduction, as compared to the baseline year. The carbon intensities of the fuels are assumed to be the same before and after implementation of the ECMs.
For the Swedish case, increasing the efficiencies of lighting and appliances (ECMs 6 and 7) increases the levels of CO2 emissions, given that the fuel mix41 for the reduction in electricity production has a lower specific emission factor than the fuel mix used for space heating.
In contrast, for the Spanish case, electricity is the most CO2-intensive energy carrier42. Therefore, improvements in the efficiencies of lighting and appliances yield the largest potential reductions in terms of CO2 emissions, since these reductions correspond directly to the reduction in electricity production. The installation of ventilation with heat recovery (ECM 5) in residential buildings decreases heating demand, although it also increases electricity demand due to the additional demand for power fans. Consequently, in the case of ECM 5, there is no potential reduction of CO2 emissions for residential buildings, in spite of the potential for energy savings. The replacement of gas and oil boilers with more efficient boilers using the same type of fuel as used in the existing boiler (ECM 12) has a low potential for CO2 reduction, in spite of the potential for final energy saving, since the least efficient existing boilers in the residential sector are not oil- or gas-fired boilers but biomass-fired boilers, with biomass entailing lower-emissions that the other fuels. However, if all the gas and oil boilers are replaced with biomass boilers (ECM 13) there will be a significant reduction in CO2 emissions (23%).
41 Since this deals with reductions, the CO2 emissions associated with electricity are those for the Nordic generation mix (15 gCO2/kWh; cf. Paper III). 42 The value of 649 gCO2/kWh is used in this thesis for the Spanish mix (IDAE, 2009). The literature gives alternative estimates of 457 gCO2/kWh for Year 2005 and 297 gCO2/kWh for Year 2009 (Pagès-Ramon, 2012)

33
As the results indicate, the potential for reducing CO2 emissions depends on the fuel mix in the energy system, especially with respect to electricity production. This work applies to the Swedish case the Nordic mix, and for the Spanish case, the national electricity production mix as the basis for emission of CO2 from electricity. Thus, the potential for CO2 mitigation through implementation of ECMs will vary between the different countries of the EU-27 depending on assumptions pertaining to the design of the deregulated electricity market and the cross-border trading of electricity. Moreover, the degree of reduction (or increase) in CO2 emissions that results from a change in the building stock depends on whether an average or marginal approach is considered.
4.2.2 Packages of ECMs Figure 4.4 summarises the technical potential reductions that could be achieved by implementing the packages of ECMs as defined in Section 3.3.2, and highlights the different impacts the packages would have on energy and CO2 emissions. The final energy demand of the building stocks of Sweden and Spain could be reduced by about 50% by applying in a package a high number of ECMs, as studied in this work. Specifically, the total annual energy demand of Swedish households could be reduced by 53% by applying all the ECMs aggregated in Package A3; for Spain, the corresponding reductions would be 55% for Package A1 and 48% for Package A2. By retrofitting only the building envelope (Package B1), the energy demand could be reduced by about 33%. Improved ventilation and supply from RES (B2–B4) would each give potential energy reductions of slightly less than 10%.
Figure 4.4. Technical potential reductions of final energy demand (in colour) and associated CO2 emissions (in grey) for the ECMs applied in packages for the Swedish residential (R) buildings and the Spanish R and non-residential (NR) buildings, as obtained in this work.
0%
10%
20%
30%
40%
50%
60%
70%
80%
A1 Allexcept RES
A2 AllECMs
A3 Energyuse
reductions
B1 Buildingenvelope
B2Improvedventilation
B3Electricity
use
B4 Supplyfrom RES
Tec
hnic
al p
oten
tial r
educ
tions
Packages of ECMs investigated
R-Sweden R-Spain NR-Spain R-Sweden R-Spain NR-Spain

34
Nevertheless, from a CO2 mitigation perspective, improved ventilation and the use of RES (Packages B3 and B4) appear to be as efficient as retrofitting the envelope (Package B1). All three packages would confer potential CO2 emission reductions of 20%–25% each, albeit at very different annualised costs, as will be discussed below. Reducing electricity demand and increasing the use of renewables are key solutions for reducing CO2 emissions in Spanish buildings. In both Spain and Sweden, the total technical potential for CO2 emission reductions represents approximately two-thirds of the baseline emissions.
The results from the model for the Swedish and Spanish cases have been compared with the results from previously published studies on this topic. This type of comparison is not straightforward, mainly due to differences among the studies in relation to assumptions made, ECM options, and the approaches used in the modelling processes. For Swedish households, Sandberg (2007) reported a technical potential of 33.7 TWh/yr (versus 51.0 TWh/yr in the present study). However, Sandberg used a top-down model and applied measures that are different from those used in the present work (e.g., reduced indoor temperature was not included). In addition, Sandberg used an interest rate (6%) that is different from the 4% rate used in the present work. In addition, the previous investigation (Sandberg, 2007) was based on a description of the Swedish buildings as they existed in Year 1995 (NBHBP, 1995), whereas the present work is based on the Swedish buildings as they existed in Year 2005 (NBHBP, 2005). For Spain, the potential reductions in final energy demand of 33% achieved by retrofitting the envelope (Package B1) obtained in the present study for the entire building stock is close to the 37% reduction estimated by Andimat (2009). The technical potential reduction of 40% reported in this thesis for the residential buildings is intermediate to the estimates made by Ecofys (2005) and WWF España (2010), which reported potential savings associated with retrofitting of the envelope of 16%–26% and 66%, respectively. While the potentials estimated by Ecofys and WWF España differ significantly from each other, as well as from the values derived in the present work, it is difficult to deduce based on the information provided by these sources the reasons for these discrepancies. Possible explanations include: 1) the different baseline years used [Year 2005 in the present thesis, Year 2000 in Ecofys (2005), and Year 2008 in WWF España (2010)]; and 2) disparities in the U-values considered for the existing buildings, which unfortunately are not specified in the two previous studies (Ecofys, 2005; WWF España, 2010). In summary, comparisons of the estimates of technical potentials provided in this thesis with the estimates presented in the literature are difficult, given the differences in assumptions and scopes (or lack of information thereof) between the previously published data and the results of the present work.

35
4.3 Cost assessment Cost-related model outputs include investments at the building-stock level, annualised investments per building type and ECM or package, and net unit costs for energy savings and CO2 abatement. The costs associated with the technical potentials presented in Chapter 4.2 have been investigated for the Swedish R buildings (Paper IV) and for the Spanish R and NR buildings (Paper V). As in the previous section, for comparative purposes and interpretation from the EU perspective, the results for both countries are here presented in an aggregated form for R and NR buildings.
4.3.1 Investments
Investment levels in the Swedish and Spanish cases Table 4.5 presents the investments for the Swedish and Spanish building stocks as the annuity or EAC43, which is the cost per year required to implement the ECM during its lifespan. It is clear from the table that the EACs for Sweden are generally higher than the corresponding values for Spain, even if the EACs are seen as specific values and it is taken into account that the average Swedish residential building is larger (266 m2 of heated floor area) than the average Spanish residential building (153 m2 of heated floor area). Since the lifespans and interest rates considered for Sweden and Spain are identical, the annuities are higher in the Swedish case simply because the investment costs assumed for the ECMs are higher. For instance, for retrofitting of the envelope, the costs for Swedish households are taken directly as annuities from NBHBP (2009) and are in the range of 5–1044 €/m2 a. The costs for Spanish households are taken as the total investment cost45 and are also in the range of 5–10 €/m2 (Paper V), possibly because they do not account for the installation and labour, as well as that the standard of living is lower in Spain. In summary, choices made as to cost assumptions, such as taking the full or marginal cost or adopting the tenant or the building owner perspective, are of high relevance for the results of the cost assessment.
In the Swedish residential sector, the sum of all the annuities for all the buildings gives as €5.7 billion46 the total required investment to achieve an aggregated technical potential reduction in energy use of 53%47. An annual investment of €0.5 billion is required to meet the Swedish target for Year 2020 (i.e., a 20% reduction in energy
43 EAC as defined in Eq. 11. 44 Exchange rate used is 1 € = 10 SEK. 45 Parameter 𝐶𝐼 in Eq. 11. 46 Billion is used in the sense of 109. Exchange rate used is 1 € = 10 SEK. 47 These are only indicative values obtained by adding in increasing cost order (Mattsson, 2011) the potentials for the individual ECMs; therefore, the synergies between the ECMs are not taken into account.

36
use, as compared to the level in 199548). Moreover, a total of €3.5 billion would have to be invested annually to achieve the 2050 target (i.e., a 50% reduction in energy use). The annual investments represent, 0.2% and 1.2% respectively, of Sweden´s GDP, which in Year 2005 was €298 billion (EC, 2010a). For the 2020 target, the investment would correspond to €2 per m2 and year, i.e., for a dwelling of 100 m2, €200 would have to be invested annually until the year 2020. To meet the 2050 target and for the same dwelling, €1000 would have to be invested annually from now until the year 2050. No corresponding results for Spain are given in Paper V.
Table 4.5. Comparisons of annual investments (EAC) required (€/yr) for the different ECMs in the average Swedish residential (R) building, as well as in the average Spanish R building and non-residential (NR) building.
EAC ECM Sweden-R Spain-R Spain-NR ECM 1 Improved cellar U-value 1241 13 15 ECM 2 Improved facade U-value 1086 67 42 ECM 3 Improved roof U-value 212 36 40 ECM 4 Window replacement 444 315 203 ECM 5 Ventilation with heat recovery 823 35 162 ECM 6 Efficient lighting 0 40 133 ECM 7 Efficient appliances 0 311 1673 ECM 8 Reduced hot water demand 197 n.a. n.a. ECM 9 Efficient water pumps 120 n.a. n.a. ECM 10 Reduced indoor temperature 111 n.a. n.a. ECM 11 Solar collectors for hot water n.a. 390 98 ECM 12 Efficient gas and oil boilers n.a. 297 478 ECM 13 Gas/oil boilers replaced by biomass n.a. 297 478 n.a, Not applicable.
Effects of interest rates and energy prices Figure 4.5 shows the sensitivity analysis of the effects of applying different discount rates on the net annual costs of ECMs for the Swedish R buildings. The chosen range of discount rates is 1%–6%, with the lowest rates representing policy actions aimed at facilitating ECM investments by offering low interest loans, and 6% representing the additional discount rate49 recommended by the EC for financial calculations of the EPBD-related reporting of the cost-optimal levels of energy performance (NBHBP, 2013). As shown in Figure 4.5, discount rates have a strong effect on the net annual costs of the ECMs. Therefore, policy actions that facilitate the financing of ECM investments may promote the adoption of ECMs. The effects of reasonable increases in energy prices on the net annual costs (NAC in Eq. 1) of the ECMs have been assessed in a sensitivity analysis. In Figure 4.6, the NAC per heated floor area is shown to allow comparisons of SFDs and MFDs. The justification for this price range is that the largest 5-year energy price increase seen over the period 1970 to 2005 was
48 The current goals for the specific energy use in Sweden are expressed relative to the reference year of 1995. In the current work, Year 2005 has been used as a baseline year because energy use in the residential sector in 1995 was almost the same as that in 2005 (EC 2011). 49 In addition to the 4% rate, which has been used in the Baseline calculations in this paper.
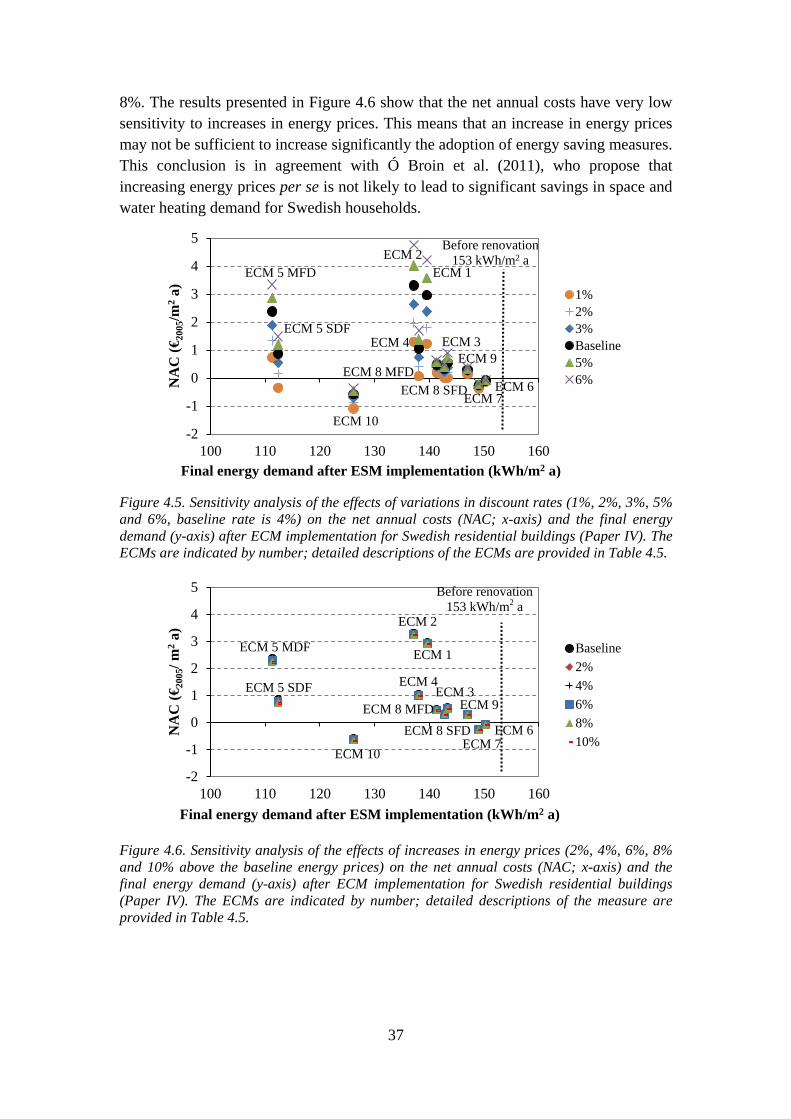
37
8%. The results presented in Figure 4.6 show that the net annual costs have very low sensitivity to increases in energy prices. This means that an increase in energy prices may not be sufficient to increase significantly the adoption of energy saving measures. This conclusion is in agreement with Ó Broin et al. (2011), who propose that increasing energy prices per se is not likely to lead to significant savings in space and water heating demand for Swedish households.
Figure 4.5. Sensitivity analysis of the effects of variations in discount rates (1%, 2%, 3%, 5% and 6%, baseline rate is 4%) on the net annual costs (NAC; x-axis) and the final energy demand (y-axis) after ECM implementation for Swedish residential buildings (Paper IV). The ECMs are indicated by number; detailed descriptions of the ECMs are provided in Table 4.5.
Figure 4.6. Sensitivity analysis of the effects of increases in energy prices (2%, 4%, 6%, 8% and 10% above the baseline energy prices) on the net annual costs (NAC; x-axis) and the final energy demand (y-axis) after ECM implementation for Swedish residential buildings (Paper IV). The ECMs are indicated by number; detailed descriptions of the measure are provided in Table 4.5.
ECM 1 ECM 2
ECM 3 ECM 4 ECM 5 SDF
ECM 5 MFD
ECM 6 ECM 7 ECM 8 SFD
ECM 8 MFD ECM 9
ECM 10 -2
-1
0
1
2
3
4
5
100 110 120 130 140 150 160
NA
C (€
2005
/m2 a
)
Final energy demand after ESM implementation (kWh/m2 a)
1%2%3%Baseline5%6%
Before renovation 153 kWh/m2 a
ECM 1
ECM 2
ECM 3 ECM 4 ECM 5 SDF
ECM 5 MDF
ECM 6 ECM 7
ECM 8 MFD ECM 8 SFD
ECM 9
ECM 10
-2
-1
0
1
2
3
4
5
100 110 120 130 140 150 160
NA
C (€
2005
/ m2 a
)
Final energy demand after ESM implementation (kWh/m2 a)
Baseline2%4%6%8%10%
Before renovation 153 kWh/m2 a

38
4.3.2 Cost-efficiency of the ECMs and packages of ECMs
Cost for energy conservation In this thesis, the cost efficiency of the individual ECMs and packages of ECMs is defined as the net unit cost per energy saving50 (CE; in €/kWh saved per year) and the net CO2 abatement cost51 (AC; in €/tCO2 emissions avoided per year). These units incorporate the value of the energy savings obtained, as well as the investments required to realise these savings. Figures 4.7 and 4.8 present the CE and AC in incremental cost order for the technical potential of reductions obtained in the present work for the ECMs applied individually to the Swedish R buildings and the Spanish R and NR buildings. As explained in Paper IV, a negative value indicates that the cost of the energy saved is higher that the investment required, i.e., that the ECM is profitable or cost-effective.
For both the Swedish case and the Spanish case, installing efficient lighting (ECM 6) is a cost-effective measure (see Figure 4.7). The present work assumes that only in the Spanish case does efficient lighting entail a higher investment cost than a less-efficient alternative; in the Swedish case, no corresponding cost is assumed as incandescent light bulbs are no longer sold. Nevertheless, the energy saving potential is rather low and could be difficult to attain, since the lifespan of this ECM is only 1–3 years and, at least for R buildings, the operation of lighting is subject to user preference. Efficient lighting may be of greater importance for (Spanish) NR buildings, where not only are the potential savings larger, but also operation of the lighting is easier to control (e.g., centralised purchase of lighting equipment, controlled switching according to schedules or detectors). Another feature that these two countries share is that the installation of ventilation systems with heat recovery (ECM 5) is associated with both a low cost (<0.05€ /kWh a) and a large potential for energy saving.
The installation of efficient appliances (ECM 7) appears as a cost-effective measure for the Swedish buildings, as no supplementary cost was assumed for this ECM. In contrast, for the Spanish buildings, this is the least-cost-effective ECM, as the cost of the electricity saved does not compensate for the investment and the increased demand for space heating that is needed to off-set the heat gains from the appliances (as explained in Section 4.2.1). However, the high investment costs for replacing the appliances may be attributed to the approximate description of the use of appliances (i.e., expressed as average constant electricity demand in W/m2) in the NR buildings, which in turn is a consequence of the scarcity of complete data for the NR sector.
50 Defined in Eq. 14. 51 Defined in Eq. 10 in Paper I.

39
Figure 4.7. Average net unit costs for energy savings (EC) for the ECMs (y-axis) for the technical potential energy savings obtained through modelling individually each ECM (x-axis). The results shown are for the Swedish residential buildings (a; adapted from Paper IV52), and the Spanish residential (R) and non-residential (NR) building stocks (b; adapted from Paper V53).The ECMs are indicated by number; detailed descriptions of the ECMs are provided in Table 4.5.
In the Swedish case, reducing the indoor temperature to 20°C (ECM 10) appears to be a profitable ECM. However, decreasing the indoor temperature, despite its strong potential for energy savings, is difficult to implement in less-energy-efficient buildings. In these buildings, the increased air temperature compensates for other factors in the operative temperature (i.e., high air velocity due to infiltrations or low radiation temperatures from the envelope surfaces). Furthermore, if, for example, thermostats are not used as intended, this might lower its performance, thereby increasing occupants’ dissatisfaction levels, as reported by Glad (2012).
52 The original figure appears in Paper IV and is adapted here such that the y-axis is rescaled to facilitate comparisons with the corresponding figure for the Spanish buildings. 53 The original figure appears in Paper V; here, the y-axis is rescaled to facilitate comparisons with the corresponding figure for the Swedish residential buildings.
-0.2
0.0
0.2
0.4
0.6
0.8
1.0C
E( €
/kW
h pe
r ye
ar)
Technical potential energy saving (TWh/yr)
a) Swedish R buildings ECM 7, 1 TWh/yrECM 6, 0.3 TWh/yrECM 10, 13.3 TWh/yrECM 5 SDF, 12 TWh/yrECM 8 SDF, 2.6 TWh/yrECM 8 MFD, 2.1 TWh/yrECM 5 MFD, 9.6 TWh/yrECM 4, 6.5 TWh/yrECM 3, 2.7 TWh/yrECM 9, 0.6 TWh/yrECM 1, 5.3 TWh/yrECM 2, 7.2 TWh/yr
-0.2
0.0
0.2
0.4
0.6
0.8
1.0
CE
(€/k
Wh
per
year
)
Technical potential energy saving (TWh/yr)
b) Spanish R and NR buildings
ECM 6, 19.7 TWh/yrECM 1, 22.9 TWh/yrECM 3, 24.2 TWh/yrECM 2, 19.0 TWh/yrECM 5, 12.3 TWh/yrECM 4, 11.3 TWh/yrECM 12-13 9.1 TWh/yrECM 11 1.4 TWh/yrECM 7, 5.3 TWh/yr
4.2 1.9
1.0
10 20 30
80 100 120 20 40 60
40 50 60

40
Retrofitting the building envelope (ECMs 1–3) appears to be cost-effective for the Spanish case but not for the Swedish case, owing to the different costs used as inputs to the modelling, as discussed in Section 4.3.1. Since only the marginal costs are accounted for in the present work (cf. Papers IV and V), the cost efficiency of these ECMs can only be interpreted in the sense that retrofitting the building envelope with insulation is more cost effective than retrofitting the envelope without insulation. This is in line with the finding reported by the EC that retrofits of facades and roofs are the most cost-efficient ECMs for European residential buildings (CEC 2006). Higher costs are associated with window replacement (ECM 4) in the Spanish case than in the Swedish case because: 1) full costs and not only marginal costs are taken into account (cf. Paper V); and 2) NR buildings are included, which typically have larger windows than R buildings. Furthermore, the window of opportunity is a key issue here. Since the 30–40-year lifespan of ECMs 1–3 is the longest of the ECMs analysed, the technical potential savings may be lost if energy requirements are not considered when the building undergoes refurbishment.
From the data shown in Figure 4.7, it is evident that in the Spanish case, boiler replacement and installation of solar collectors (ECMs 11–13) have significantly higher costs than the other ECMs. It should be noted that subsidies for RES that might lower the costs of solar panels and biomass boilers have not been included in this analysis. The results indicate that factors other than the purely economic ones will need to be appraised for the Spanish building sector to facilitate the introduction of on-site supply from RES, such as solar collectors and biomass boilers (as in ECMs 12 and 13).
In summary, based on the comparisons of the results obtained in this thesis for the Swedish and Spanish cases, as well as on the comparisons with results in the literature, as presented in Papers IV and V, it is concluded that profitable ECMs differ between EU countries, and that no ECM can be identified as being profitable for all the EU countries. However, before any conclusions can be drawn as to how large the differences are in ECM cost effectiveness between the building stocks of the EU MS, more countries should be investigated individually. In any case, it should be borne in mind that the promotion exclusively of the adoption of individual ECMs, even if they are profitable, could lock-in the potential for achieving further energy reductions in line with current European targets.
Cost for CO2 abatement With regard to CO2 abatement, Figure 4.8 shows that the cost-effective ECMs for each country are the same as the ECMs presented above as being cost-efficient from an energy savings perspective. For Swedish households, since the CO2 emissions associated with the energy savings presented in Figure 4.7 are very low (10% of the total emissions of the country, corresponding to just 4.9 MtCO2; cf. Paper III), the resulting costs are very high (1400–7300 €/tCO2). It is clear that CO2 abatement is not the driving force for energy conservation measures in the Swedish context. Rather, the profits gained from ECMs and indirect effects, such as reduced dependency on

41
electricity (which may give indirect reductions in terms of CO2 emissions), are potent motivations for implementing the ECMs. Therefore, this thesis does not give prominence to CO2 emissions in the Swedish buildings, which means that CO2 abatement costs have not been calculated in Paper IV. The situation is different for the Spanish building stock, since the energy system is very emissive (as discussed in Section 4.2.1), which means that most of the ECMs (ECMs 1–3 and ECMs 5 and 6) represent cost-effective opportunities to achieve large reductions in CO2 emissions (3.5–20.0 MtCO2/yr).
Figure 4.8. Average CO2 abatement costs (AC) for the ECMs (y-axis) in the Swedish residential (R) buildings stock (a; Mata et al. 2010b54) and the Spanish residential (R) and non-residential (NR) building stock (b; Paper V55) for the technical potentials for CO2 emission reductions obtained from modelling individually each ECM (x-axis). The ECMs are indicated by number; detailed descriptions of the ECMs are provided in Table 4.5.
54 The original figure appears in Mata et al. 2010b and is adapted here such that the y-axis is rescaled to facilitate comparisons with the corresponding figure for the Spanish buildings. 55 The original figure appears in Paper V and is adapted here such that the y-axis has been rescaled to facilitate comparison with the corresponding figure for the Swedish residential buildings.
-500
0
500
1000
1500
2000
2500
3000
AC
(€/tC
O2 pe
r ye
ar)
Technical CO2 emissions reduction potential (MtCO2)
a) Swedish R buildings
ECM 6, 20 ktCO2/yECM 7, 65 ktCO2/yECM 10, 720 ktCO2/yECM 5 SFD, 545 ktCO2/yECM 8 SFD, 130 ktCO2/yECM 8 MFD, 125ktCO2/yECM 5 MDF, 545ktCO2/yECM 4, 360ktCO2/yECM 3, 102ktCO2/yECM 9, 44ktCO2/yECM 1, 394ktCO2/y
-500
0
500
1000
1500
2000
2500
3000
AC
(€/tC
O2 p
er y
ear)
Technical CO2 emissions reduction potential (MtCO2)
b) Spanish R and NR buidings
ECM 1, 8.5 MtCO2/yrECM 3, 8.9 MtCO2/yrECM 5, 3.5 MtCO2/yrECM 6, 17.3 MtCO2/yrECM 2, 6.2 MtCO2/yrECM 13 28.0 MtCO2/yrECM 11 4.9 MtCO2/yrECM 7, 5.5 MtCO2/yrECM 4, 3.5 MtCO2/yr
20 60 40 80
4300
7300
-2900 -2500
1 3 2

42
Cost-optimal packages of ECMs The cost efficiencies of the different packages of ECMs have been described in Paper V for the Spanish R and NR buildings. Figure 4.9 presents the annualised costs of renovation per building56 (y-axis) for the different renovation packages (with the individual ECMs included for comparison) and the corresponding final energy demands after applying the ECMs (x-axis) for the building types, as obtained in the present work. The results presented in Figure 4.9 indicate that the lowest levels of final energy demand can be achieved at low cost or cost-effectively only by applying packages of ECMs (filled symbols; shaded area in plot). As shown, application of all the ECMs with or without RES options and improvement of the building envelope and ventilation system (Packages A1, A2, B1, and B2, respectively) are the most cost-efficient packages for all the building types analysed. Therefore, it is advantageous to undertake as many ECMs as possible when a building is being retrofitted, not only from an economic point of view, but to exploit the opportunities mentioned above. The importance of taking advantage of the window of opportunity has been identified in the literature, and the savings potential that may be lost if the energy efficient solutions are not implemented concomitantly with major renovations are referred to as the lock-in effect of the energy savings in the building sector (Ürge-Vorsatz et al. 2011).
Figure 4.9. Net annual costs of ECMs per building57 for all building types (i.e., investment minus cost of energy saved; y-axis) and the corresponding final energy demands after renovation (x-axis) obtained in this work for ECM packages A1 to B4, for the Spanish building stock. The results from modelling the ECMs individually are included for comparison (open symbols) (data from Paper V).
56 Investment minus cost of energy saved, NAC, as defined in Eq. 10. 57 For MFDs, the costs are provided per dwelling rather than per building, so that they are comparable to those shown for SFDs, bearing in mind that the average MFD in Spain has 11.8 dwellings per building (Medina Benejam, 2011).
A1 A2 B1 B2 B3 B4 A1 A2 B1
B2
B3
B4
A1
A2
B1
B2
B3
B4
A1
A2
A3
B2
B3
B4
A1 A2
B1
B2
B3
B4
A1 A2
B1
B2
B3
B4
-3000
-2000
-1000
0
1000
2000
3000
50 100 150 200 250 300 350
NA
C o
f ren
ovat
ion
per
build
ing
(€/y
r)
Final energy demand after renovation (kWh/m2)
SFD Individual ECMsMFD Individual ECMsNR-C Individual ECMsNR-L Individual ECMsNR-O Individual ECMsNR-X Individual ECMsSFD Packages A1-B4MFD Packages A1-B4NR-C Packages A1-B4NR-L Packages A1-B4NR-O Packages A1-B4NR-X Packages A1-B4

43
Figure 4.9 also shows that the specific energy use that can be achieved by applying a high number of ECMs in the packages studied in the present work is in the range of 100–150 kWh/m2 for the NR buildings and 50–70 kWh/m2 for the Spanish R buildings. These levels of specific energy demands are limited by the fact that in the present work the building envelope is retrofitted to the standard of the current building energy code, whereas higher insulation levels are required to achieve the additional energy demand reductions required for passive housing or almost-zero energy standards.
4.3.3 Techno-economical and market potentials
Techno-economical potentials Figure 4.10 summarises the techno-economical potentials associated with the different ECMs for Sweden and Spain, showing the cost-effective ECMs (i.e., the negative values in Figures 4.7 and 4.8) together with their potentials for energy saving and associated CO2 emissions. The latter values are shown as percentages of the baseline year, to facilitate comparisons between the countries and subsectors. The figure shows no values for some of the ECMs (i.e., ECMs 9, 11, and 12) because there are no cost-effective potentials for these ECMs.
For Swedish households, Paper III reports that applying ECM Package A3 yields a total techno-economical potential reduction of 50%, for the final energy demand, which corresponds to a 60% reduction in CO2 emissions58. As can be seen from Figure 4.10, the bulk of the reduction in CO2 emissions arises from the installation of heat recovery systems (ECM 5) and reduction of indoor temperature (ECM 11), i.e., from reducing space heating demand for which the fuel mix has higher emissions than the electrical mix, as discussed in Section 4.2.1.
For the Spanish R and NR buildings, Paper V shows that the application of ECM Package A1 yields a total techno-economical potential for reducing the final energy demand by 33%, which corresponds to a 37% reduction in CO2 emissions. The potentials arise from a combination of retrofitting the envelope (ECMs 1–4), ventilation with heat recovery (ECM 5), and installation of efficient lighting. In addition to these measures, the CO2 emission level of the Spanish R sector could be reduced by 34% in a cost-effective way by replacing gas and oil boilers with biomass boilers (ECM 13)59.
58 In Paper IV, lower overall potentials are given. These are only indicative potentials, as they correspond to the sum of the potentials for the individual ECMs and therefore do not include synergies between ECMs. 59 This means that Figure 4.9 masks the difference in the results between the R and NR buildings. Thus, it should be of interest (for the updated Paper V) to plot the subsectors separately.

44
Figure 4.10. Techno-economical potential reductions in final energy and associated CO2 emissions, given as percentages of the baseline (y-axis) for each of the ECMs studied (x-axis) for the Swedish residential (R) and Spanish R and non-residential (NR) buildings, as obtained in this thesis.
Effects of energy price developments Three different price scenarios have been investigated, so as to analyse alternative scenarios for future developments in the energy system. These scenarios include: 1) a Baseline (BA) scenario, which assumes that the current trends in energy prices will continue; 2) a high-price-increase (HPI) scenario; and 3) a low-price-increase (LPI) scenario. The resulting energy prices for the different scenarios are listed in Paper IV. Although the extent of the increase is likely to differ across energy carriers, the following annual weighted average increases in energy prices are assumed: for BA, 0.37%; for HPI, 0.47%; and for LPI, 0.44%. These average increases are postulated to yield energy prices for HPI and LPI in Year 2050 that are 40% and 28% higher, respectively, than for the BA scenario.
The three price scenarios give similar cost-effectiveness rankings for the ECMs investigated, average net unit costs for energy saving, and levels of techno-economic potential energy savings. The techno-economical potentials up to Year 2050 for reduced energy demand in the Swedish residential buildings are 19.9 TWh for the HPI scenario and 19.5 TWh in the LPI scenario compared to the potential of 16.7 TWh in the baseline scenario60. Despite the energy prices in Year 2050 being on average 10% higher in the HPI scenario than in the LPI scenario, the techno-economical potentials 60 To be compared to an annual demand of 97.7 TWh in reference Year 2005.
0%
5%
10%
15%
20%
25%Sweden-R Spain-R Spain-NR Sweden-R Spain-R Spain-NR
34%

45
are almost the same. However, the HPI scenario results in lower net costs, i.e., the average annual net unit cost over the period 2010–2050 is 0.047 €2005/kWh for the HPI scenario, as compared to 0.051 €2005/kWh for the LPI scenario. These results are of course influenced by changes in energy prices; thus, the ECMs show highest profitability in the HPI scenario. In summary, for either the HPI scenario or the LPI scenario, regardless of the development of energy prices, there will be economically feasible retrofitting options.
Expected implementation of the potentials The market potentials, i.e., the ECMs that can be expected to be realised, are estimated using private discount rates. Private discount rates represent implicit discount rates that include consumer preferences, which reflect consumer willingness to make investments related to ECMs in their homes. According to the literature, the private discount rates are: 18%–308% in Newlon and Weitzel (1991); 50%–80% in Bailie et al. (1996); 20%–65% in ERG (1998); and 34.7% in Jaccard (2009). Therefore, for the sensitivity analysis, the market potentials have been approximated for Sweden (Papers IV) and Spain (Paper V) using discount rates up to 80% (disregarding the outlying value of 308%).
Figure 4.11 presents the estimated market potentials for the Swedish and Spanish buildings, which are substantially lower than the above-reported techno-economical potentials. This implies a need for strong policy measures if the techno-economical potentials identified in this work are to be implemented. In addition, Paper IV shows that for the Swedish residential buildings, the average unit cost for energy saving for all ECMs (i.e., for the entire technical potential energy saving of 63.2 TWh/yr) will increase almost linearly from -0.011 €2005/kWh (at a 4% discount rate) to 0.731 €2005/kWh over the range of discount rates investigated.
Figure 4.11. Estimates of the total market potentials for the private discount rates given in the literature (grey shaded area). The techno-economical potentials obtained in this work are shown for comparison.
0%
10%
20%
30%
40%
50%
60%
0 10 20 30 40 50 60 70 80
Ann
ual p
oten
tial e
nerg
y sa
ving
(%)
Discount rate (%)
Sweden-R Package A3Spain-R Package A1Spain-NR Package A1Spain-R Package A2Spain-NR Package A2Spain-R Package B1Spain-NR Package B1
Market potentials
Techno-economic potentials

46
5 Conclusions The first part of this thesis (Papers I and II) presents the development of the methodology in terms of modelling tools and data aggregation, based on case studies. Using this methodology, in the second part of the thesis (Papers III–V) individual ECMs and packages of ECMs are used to assess for selected building stocks the energy demands, associated CO2 emissions, and costs. The cases for the building stocks aggregation using archetypes are the R and NR buildings in France, Spain, and the UK, as well as R buildings in Germany. The cases for which the opportunities and costs for ECMs are further investigated are Swedish R buildings and Spanish R and NR buildings.
In the course of this thesis, it has become clear that for the EU countries investigated there are datasets available regarding the size, physical and technical structure, and dynamics of the existing building stock to form the basis for an assessment of reduced energy use and associated CO2 emissions, although data for the NR sector are fewer. Nevertheless, these data are neither empirical nor consistent, and ownership and access issues arise. Therefore, there is a need to quantify and analyse the robustness of key parameters, and to understand their roles in a long-term transformation of the building-stock that balances divergent social, environmental, and economic objectives.
Numerous tools are available for building-stock modelling. The challenge remains to define the resolution levels that allow a better understanding of the linkages between the different scales, from issues within buildings’ boundaries to the interactions between markets and policy. The building-stock modelling approach used in this thesis represents a framework that allows a combination (or choice) of different assessments at a reference-building level to be extrapolated to the building-stock level for a different combination (or choice) of outputs. The assessment at the building level currently includes indoor air environment, energy use, technical building systems, and some on-site generation based on RES. The variety of outputs is tailored for investigations of indoor environment, energy system issues, climate change mitigation, and policy targets.
In the present work, large technical potential reductions in energy use (50%–60%) and in associated CO2 emissions (60%–70%) are identified for the Swedish R building stock and the entire Spanish R and NR building stock. However, the individual ECMs that have significant potentials and their cost efficiencies differ between these two countries and their respective subsectors. In any case, the technical potentials increase when packages of ECMs that target simultaneously net and final energy demands and CO2 emissions are applied. Furthermore, the packages are more cost-effective than the individual ECMs. Therefore, there is much to be gained by applying as many ECMs as possible during the retrofitting of a building, with respect to not only monetary savings, but also because general repairs and renovation activities are usually undertaken only every 25 years.

47
Whereas the application of ECMs in most instances reduces CO2 emissions, the specific ECMs that would reduce electricity use for lighting and appliances would increase demand for space heating. Thus, in this case, the levels of CO2 emissions reflect whether the saved electricity production is less or more CO2-intensive than the fuel mix used for space heating. Furthermore, these ECMs have a short lifespan and are strongly dependent upon behavioural preferences. In summary, these ECMs should be assessed comprehensively in terms of final energy and associated CO2 emissions for the entire energy system, as well as in terms of implementation issues.
A total techno-economical potential reduction of the final energy demand of 20%–30%, corresponding to a 40%–55% reduction of the associated CO2 emissions, is identified in this thesis for the Swedish R building stock and the Spanish R and NR building stock. It should be noted that the levels of emissions from the Swedish building sector are already low, so allocating the costs of the ECMs to reduce CO2 emissions gives high abatement costs. Therefore, emission reduction is not likely to provide the main impetus for introducing ECMs in the Swedish context. In the costs assessment, the resulting net annual costs are highly influenced by specific assumptions, such as adopting the perspective of the tenant or building owner, considering the full or marginal cost for the ECM, and the interest rates used. However, future energy price developments are likely to have less impact on the net annual costs for the ECMs. Therefore, increases in energy prices per se may not promote energy conservation, and other policy actions, such as low interest loans, will be necessary to influence the taking of positive decisions in relation to building energy retrofitting. Furthermore, the market potentials for ECM implementation, estimated using the implicit discount rates reported in the literature for households regarding home energy-retrofitting, are substantially lower than the techno-economical potential reductions in energy use and CO2 emissions identified in the present work. This underlines the need for strong policy measures to influence stakeholder actions and participation, if the techno-economical potentials are to be realised.

48
6 Prospects for further studies Further work is required to complete the assessment of the building stock of the entire EU. The hypothesis is that France, Germany, Spain, UK, Sweden, Italy and Poland, which represent about 70% of the total energy use in buildings within the EU-27, are sufficiently representative of the EU building stock for the purpose of modelling energy use in the building stock. The building stocks of Italy and Poland remain to be aggregated through archetype buildings. To analyse the data from these countries, the methodologies used for describing and modelling the building stock may need to be further adapted to account for region-specific traits. Furthermore, additional work is needed to determine whether dividing the EU into only three to five climatic zones, as suggested in the literature, instead of the fifteen described in the present work, gives a valid estimate of the energy use of buildings.
Future analyses using these modelling and building stock data are likely to elucidate the potentials and costs for energy savings and associated CO2 emissions in the building sector. Since the potential to avoid CO2 emissions is dependent upon the fuel mix in the energy system, especially in the case of electricity production, it varies among the different EU-27 countries in relation to the design of the electricity market and cross-border trading of electricity. Thus, it will be of interest to assess the extent of the reduction (or increase) in CO2 emissions afforded by ECMs in the building sector with respect to the use of an average or marginal approach. Thereafter, the investment costs for the different countries and subsectors could be further developed following homogenous assumptions from either an EU perspective or a national perspective (e.g., including all the singularities of the building-retrofitting context in the country, such as policies in force and relevant stakeholders). An additional determinant of the future energy demand of buildings involves the estimated changes in climate; further investigations are needed to establish the influences of climate uncertainties on the design of strategies for the long-term development of the building sector.
With respect to model development, from the application of the modelling methodology to the non-residential sector it can be concluded that, since the energy demand in the non-residential sector is dominated by electricity, more emphasis should be placed on allowing more detailed modelling of the lighting, appliances, and heat pump systems that includes a detailed description of the equipment and its hourly patterns of use. Such detailed modelling of electricity usage would increase understanding of the electricity demand and its interactions with space heating demand and would facilitate investigations of demand-side management options in the building sector. The energy demand for cooling purposes should be included in this analysis. Furthermore, hot water demand warrants detailed characterisation, since in the residential sector it corresponds to 9%–20% of the total final energy demand for the five countries investigated.

49
More research is needed to gain a better understanding of the optimal approach to implementing the ECMs, so as to achieve the technical potentials identified in this thesis. First, the approach used in this thesis of using private discount rates to derive market potentials could be further developed, and different discount rates could be used for each ECM. This, since the implicit discount rates can be empirically measured, using for instance choice models of consumer durable goods or stated preference. Second, the global cost suggested by the EPBD could be used, thereby including a societal perspective via the GHG costs. Third, the additional cost associated with implementing policy measures required to introduce the ECM could be added to the direct cost, since each measure requires the application of a policy for the purpose of achieving one or more actions that are necessary to implement the measure. Recent studies that have measured and reported energy savings are promising and will help to quantify the costs associated with successful policies. The direct costs can also be complemented by other additional costs that reflect the various factors, e.g., implementation costs, intangible capital costs, perceived private costs, expected resource costs, and transaction costs. The assessment could be expanded to include co-benefits associated with energy conservation.
In the broader context, research is also needed to determine how the inclusion of the construction and demolition phases might change the magnitudes of the potentials and the associated costs presented in this thesis. Although the current work focuses on Europe, where turnover of the capital stock of buildings is rather low, the inclusion of demolition and construction parameters is of importance for applying this analysis to estimate long-term changes in energy use in the building sector. Furthermore, in the case of the existing stock, the implementation of ECMs results in an increased use of materials and requires the disposal of the replaced materials. As the energy for building operation decreases, the relative importance of the energy used in the production phase increases and influences the optimisation process aimed at minimising the life cycle energy use. Therefore, it will be important to extend and refine the modelling methodology developed in the work of this thesis, so as to include, for example, life cycle assessments, as well as demolition and construction dynamics.

50
51
Acknowledgements The work of this thesis was carried out as a joint project between the Division of Energy Technology at the Department of Energy and Environment and the Division of Building Technology at the Department of Civil and Environmental Engineering, both at Chalmers University of Technology. Merging the expertise of these two units was crucial for advancing this specific niche in which I have been working. My supervisors, one from each Division, Filip Johnsson and Angela Sasic Kalagasidis, are gratefully acknowledged for their commitment: for shooting for the moon and for making it possible to get there. Thanks for providing the tools, clarifications, and strategies, as well as for the encouragement and wise advice in all matters and at all hours.
Funding for this work was provided by the AGS project Pathways to Sustainable European Energy Systems, Boverket, and FORMAS. Thanks to all the researchers in all the projects for creating a stimulating research environment. Special thanks goes to those who have contributed to this work as co-authors or who have contributed with valuable discussions and outputs from their own work. Thanks to Björn Mattsson, Vahid Moussavi Nik, Anders Göransson, Mikael Odenberger, Thomas Unger, Erik Axelsson, Jonas Nässén, and Emil Nyholm. Special thanks to Eoin Ó Broin, the other knight in the building crusade, for all the fun we had during the battles. Special thanks to Ulrika Claeson Colpier for being an excellent discussion partner during the writing process, with additional thanks to Vincent Collins for suggestions and text editing. Thanks to the EST group for fruitful discussions in our lunch meetings. Thanks to the colleagues at Building Technology for making me feel at home from the first day. I would also like to thank my former colleagues at UPC Barcelona Tech, from whom I learnt the basics of how to make a living from working in what you like. Thanks to all the MSc students who have been in some way linked to this work: Catherine Martinlagardette, Milena Ràfols Salvador, Georgina Medina Benejam, Josep Maria Ribas Portella, Sohejl Lazemi-Wanjani, Artur Bauer, Reza Arababadi, Johanna Grundsell, Hanna Lundevall, Tri-Cang Ding, Tillman Gauer, Anders Dahl, Morten Egestrand, Sanket Puranik and Umberto Frateily. They have all contributed to my learning far more than I may have contributed to theirs. Thanks to Henrik Thunman, Massimo Bongiorno, David Pallarès, Mikael Odenberger, and Fredrik Hedenus for valuable tips and long discussions on the dynamics of academic work and career planning. Thanks to Henriette Söderberg, Henrik Thunman, Klas Andersson, Massimo Bongiorno, Fredrik Lind and the PhD Council (with Sadegh Seddighi, Lina Reichenberg and Patrick Moldenhauer as ET representatives) for keeping on trying to improve our work environment and for facing every challenge with a bigger or smaller smile.
Le plus grand merci à François-Xavier pour être toujours prêt à faire partie des aventures, et pour les rendre toutes possibles. Muchas gracias a Leah por recordarme, ¡tan a tiempo!, lo que son la inocencia y la alegría en estado puro. Muchísimas gracias a mis padres por inculcarme el idealismo, el espíritu de superación y la constancia; también por su apoyo incondicional. A los que siguen buscando maneras de acortar la distancia, gracias a todos: la lista de nombres es muy larga. Un grand merci à ma belle-famille, de plus en plus nombreuse, qui m’a appris à toujours regarder du côté positif et à profiter de la vie.
Gothenburg, October 2013

52

53
References
ADEME, 2006. Les chiffres clés du bâtiment (in French). Environment and Energy Management Agency [Agence de l'Environnement et de la Maîtrise de l'Energie ADEME (in French)].
ADEME, 2011. Les chiffres clés du bâtiment (in French).
AGS, 2011a. Methods and Models used in the project Pathways to Sustainable European Energy Systems, ISBN/ISSN: 978-91-978585-2-6, AGS, Mölndal, Sweden.
AGS, 2011b. European Energy Pathwyas - Pathways to a Sustainable European Energy System, ISBN/ISSN: 987-91-978585-1-9, AGS, Mölndal, Sweden.
Almansa Sáez, C., Calatrava Requena, J., 2007. Reconciling sustainability and discounting in Cost–Benefit Analysis: A methodological proposal. Ecological Economics 60 (4): 712-725.
Andimat, 2009. Propuesta de revisión del código técnico de la edificación: sección HE 1 Limitación de demanda energética (in Spanish). http://www.etresconsultores.com/wp-content/uploads/ETRES_Consultores_Propuesta_revision_CTE_IPUR_ANDIMAT_V3-resumen.pdf.
ANSI/ASHRAE 140-2007 Standard Method of Test for the Evaluation of Building Energy Analysis Computer Programs.
Arababadi, R., 2012. Energy use in the EU building stock – Case study: UK, MSc Thesis, Linköping University, Linköping, Sweden.
Bailie, A., Jaccard, M. and J. Nyboer, 1996. CO2 emission reduction costs in the residential sector: behavioral parameters in a bottom-up simulation model. The Energy Journal 17 (4): 107-134.
Balaras, C.A., Gaglia, A.G., Georgopoulou, E., Mirasgedis, S., Sarafidis, Y., Lalas, D.P. 2007. European residential buildings and empirical assessment of the Hellenic building stock, energy consumption, emissions and potential energy savings. Building and Environment 42 (3) 1298-1314.
Bradley, P. E. and N. Kohler, 2007. Methodology for the survival analysis of urban building stocks. Building Research & Information 35 (5): 529- 542
BWT, 2010. Energie in Deutschland - Trends und Hintergründe zur Energieversorgung (in German). Bundesministerium für Wirtschaft und Technologie Öffentlichkeitsarbeit, Berlin, Germany.
Ciscar, J.C. (Ed), 2009. Climate change impacts in Europe. Final report of the PESETA research project, Joint Research Centre EC, Seville, Spain.
Coase, 1937. The nature of the firm. Economica, New Series 4 (16): 386–405.
Cruz Rambaud, S., Muñoz Torrecillas, M. J., 2005. Some considerations on the social discount rate. Environmental Science & Policy 8 (4): 343-355.
De Villiers, M. and K. Matibe, 2000. Greenhouse Gas Baseline and Mitigation Options for Residential Sector. Energy and Development Research Centre, University of Cape Town, Cape Town, South Africa.
DECC, 2011. Energy consumption in the United Kingdom: 2011. Department of Energy and Climate Change, UK.
Dineen D. and B.P . Ó Gallachóir, 2011. Modelling the impacts of building regulations and a property bubble on residential space and water heating. Energy and Buildings 43 (1): 166-178.

54
EC, 2009. Directive 2009/125/EC of 21 October 2009 establishing a framework for the setting of ecodesign requirements for energy-related products.
EC, 2011. Eurostat Database, European Commission (EC), Brussels, Belgium.
EC, 2012a. Commission delegated regulation (EU) No 244/2012 of 16 January 2012 supplementing Directive 2010/31/EU on the energy performance of buildings by establishing a comparative methodology framework for calculating cost-optimal levels of minimum energy performance requirements for buildings and building elements. EC, Brussels, Belgium.
EC, 2012b. Notice 2012/C 115/01: Guidelines accompanying Commission Delegated Regulation (EU) No 244/2012. EC, Brussels, Belgium.
EC, 2012c. Directive 2012/27/EU of the European Parliament and of the Council of 25 October 2012 on energy efficiency. EC, Brussels, Belgium.
ECOFYS, 2005. Estudio sobre el ahorro energético en edificios en España (in Spanish).
EMRG et al., 2007. CIMS Introduction, Algorithms & Operations Manual, Energy and Materials Research Group (EMRG), Canadian Industrial End-Use Energy and Data analysis Center (CIEEDAC), School of Resource and Environmental Management Simon Fraser University & M.K. Jaccard and Associates, Ltd., Vancouver, Canada.
EN 15459 - Energy performance of buildings - Economic evaluation procedure for energy systems in buildings, 2007.
EN ISO 13790, Energy performance of buildings - Calculation of energy use for space heating and cooling, 2008.
Enerdata, 2010. ODYSSEE database European Energy Efficiency Indicators, Enerdata, Grenoble, France.
ERG, 1998. Cost Curve Estimations for Reducing CO2 Emissions in Canada: An Analysis by Province and Sector, Prepared for Natural Resources Canada, The Energy Research Group, School of Resource and Environmental Management, Simon Fraser University, Vancouver, Canada.
ESA, 1995, Annex 7.1 (1995) Definition of Each Asset Category. Available at: http://circa.europa.eu/irc/dsis/nfaccount/info/data/esa95/en/een00338.htm
Eurostat, 1997. Glossary: Building. Available at: http://epp.eurostat.ec.europa.eu/statistics_explained/index.php/Glossary:Non-
residential_building
Firth, S.K., Lomas, K.J., Wright. A.J, 2010. Targeting household energy-efficiency measures using sensitivity analysis. Building Research & Information 38 (1): 25-41.
Giraudet, L.G., Guivarch, C., Quirion, P., 2012. Exploring the potential for energy conservation in French households through hybrid modelling. Energy Economics 34 (2): 426-445.
Glad, W., 2012. Housing renovation and energy systems: the need for social learning. Building Research & Information 40 (3): 274–289.
Grundsell, J., 2013. Bottom-up description of the Swedish non-residential building stock – Archetype buildings and energy demand, MSc Thesis, Dept. Energy and Environment, Chalmers University of Technology, Gothenburg, Sweden.
Hausman, J.A., 1979. Individual discount rates and the purchase and utilization of energy-using durables. The Bell Journal of Economics 10 (1): 33-54.

55
Hein L. G. and K. Blok, 1995. Transaction costs of energy efficiency improvement, The energy efficiency challenge for Europe. ECEEE summer study, report ADEME - 95-10-024 Mandelieu, France.
Henninger, R. H., Witte, M. J., 2003. EnergyPlus Testing with ANSI/ASHRAE Standard 140-2001 (BESTEST) EnergyPlus Version 1.1.0.020, Ernest Orlando Lawrence Berkeley National Laboratory Berkeley, California for U.S. Department of Energy, Washington, USA.
IDAE, 2009. Coeficientes de paso desde energía final a emisiones de CO2. Capítulo VI anexos Condiciones de aceptación de Procedimientos alternativos a LIDER y CALENER (in Spanish). Ministerio de Industria, Turismo y Comercio, Madrid, Spain.
IIASA, 2010. Database GAINS on line. International Institute for Applied Systems Analysis IIASA, Laxenburg, Austria.
ILWG, 2000. Scenarios for a Clean Energy Future, Interlaboratory Working Group Oak Ridge, TN; Oak Ridge National Laboratory and Berkeley, CA; Lawrence Berkeley National Laboratory), ORNL/CON-476 and LBNL-44029,
IPCC, 1995. Economic and Social Dimensions of Climate Change. Contribution of Working Group III to the Second Assessment Report of the IPCC, Cambridge University Press, Cambridge.
IWU, 2012. Executive Summary TABULA Project – Typology approach for Building Stock Energy Assessment, Institut Wohnen und Umwelt IWU, Darmstadt, Germany.
Jaccard, M. and M. Dennis, 2006. Estimating home energy decision parameters for a hybrid energy-economy policy model. Environmental Modeling & Assessment 11 (2): 91-100.
Jaccard, M., 2004. Greenhouse Gas Abatement: Controversies in Cost Assessment, Encyclopedia of Energy 3: 57-65.
Jaccard, M., 2009. Combining Top-Down and Bottom-Up in energy economy models, Chapter 13 in: International Handbook on the Economics of Energy, Edward Elgar, Cheltenham, UK.
Jacobsen, H.K., 1998. Integrating the bottom–up and top–down approach to energy–economy modeling: the case of Denmark, Energy Economics 20 (4): 443–461.
Johnston, D., 2003. A Physically-based energy and carbon dioxide emission model of the UK housing stock, PhD Thesis, Leeds Metropolitan University, UK.
Judkoff, R. and Neymark, J., 1995. International Energy Agency Building Energy Simulation Test (BESTEST) and Diagnostic Method, NREL, Colorado, USA.
Kavgic, M., Mavrogianni, A., Mumovic, D., Summerfield, A., Stevanovic, Z., and M. Djurovic-Petrovic, 2010. A review of bottom-up building stock models for energy consumption in the residential sector. Building and Environment 45 (7): 1683-1697.
Kohler, N. and U. Hassler, 2002. The building stock as a research object. Building Research & Information 30 (4): 226 – 236.
Koopmans, C.C., and te Velde, D.W., 2001. Bridging the energy efficiency gap: Using bottom–up information in a top–down energy demand model. Energy Economics 23 (1): 57–75.
Lapillone, B. et al., 2012. Energy Efficiency trends in Buildings in the EU. Lessons from the ODYSSEE/MURE project. Available at:
http://www.odyssee-indicators.org/publications/PDF/Buildings-brochure-2012.pdf

56
Levine, M., Ürge-Vorsatz, D., Blok, K., Geng, L., Harvey, D., Lang, S., Levermore, G., Mongameli Mehlwana, A., Mirasgedis, S., Novikova, A., Rilling, J., Yoshino, H., 2007. Residential and commercial buildings. In Climate Change 2007: Mitigation. Contribution of Working Group III to the Fourth Assessment Report of the Intergovernmental Panel on Climate Change [B. Metz, O.R. Davidson, P.R. Bosch, R. Dave, L.A. Meyer (eds)], Cambridge University Press, Cambridge, United Kingdom and New York, NY, USA.
López Plazas, F., 2006. Sobre el uso y la gestión como los factores principales que determinan el consumo de energía en la edificación. Una aportación para reducir el impacto ambiental de los edificios (in Spanish). PhD Thesis, Technical University of Catalonia, Barcelona, Spain. Available at: http://hdl.handle.net/10803/6122
López, F. Cuchí, A., 2005. About the environmental impact of buildings: analysis of the incidence of the use of buildings in the energy consumption, 3rd Conference on Sustainable Development of Energy, Water and Environmental System, Dubrovnik, Croatia, 450–462.
Marshall, A., 1890. Principles of Economics. London: Macmillan.
Mata, É. and Sasic Kalagasidis, A., 2010. Description of the building-stock model: ECCABS Energy Assessment of Building Stocks, Report A 2010-01, ISSN 0281-0034, Chalmers University of Technology, Gothenburg, Sweden.
Mata, É. and Sasic Kalagasidis, A., 2009. Calculation of the energy use in the Swedish housing. Description of the building energy simulation model: EABS Energy Assessment of Building Stocks, Report 2009:4, ISSN 1652-9162, Chalmers University of Technology, Gothenburg, Sweden.
Mata, É., 2011. Energy efficiency and carbon dioxide mitigation in building stocks – Development of methodology using the Swedish residential stock. Licentiate Thesis, Chalmers University of Technology, Gothenburg, Sweden.
Mata, É., Sasic Kalagasidis, A. and Johnsson, F., 2011. Costs of retrofit measures in Swedish residential building stock – an evaluation for three scenarios on future energy prices. In: Proceedings of the 9th Nordic Symposium on Building Physics. 29 May - 2 June, Tampere, Finland.
Mata, É., Sasic Kalagasidis, A. and F. Johnsson, 2010a. Assessment of retrofit measures for reduced energy use in residential building stocks– Simplified costs calculation. Sustainable Building Conference SB10mad April 28-30, Madrid, Spain.
Mata, É., Sasic Kalagasidis, A. F. Johnsson, 2010b. Retrofitting measures for energy savings in the Swedish residential building stock – assessing methodology. Thermal Performance of the Exterior Envelopes of Whole Buildings XI International Conference December 5-9, Florida, USA.
Mattsson, B., 2011. Costs for reducing the energy demand in the Swedish building stock according to national energy targets, Swedish National Board of Housing, Building and Planning. Available at:
http://www.boverket.se/Global/Om_Boverket/Dokument/about_boverket/betsi_study/energy.pdf
Mayer, H., 2010. Statistisches Bundesamt Wiesbaden (in German). Available at: https://www.destatis.de/DE/PresseService/Presse/Pressemitteilungen/2010/10/PD10_372_85.
html.
Medina Benejam, G., 2011. Bottom-up characterization of the Spanish building stock. Archetype buildings and energy demand, MSc Thesis, Chalmers University of Technology, Gothenburg, Sweden.

57
Medina Benejam, G., Mata, É., Sasic Kalagasidis, A. and Johnsson, F., 2012. Bottom-up characterization of the Spanish building stock for energy assessment and model validation, Retrofit 2012 Conference, 24 - 26 Jan, Manchester, UK.
Michaelowa, A. and F. Jotzo, 2005. Transaction costs, institutional rigidities and the size of the clean development mechanism. Energy Policy 33 (4): 511-523.
MKJA, 2002. Construction and analysis of sectoral, regional and national cost curves of GHG abatement of Canada. Jaccard, M.K., and Associates, Vancouver, Canada.
Moffatt, S., 2001. Stock aggregation, in Annex 31—Energy related environmental impact of buildings, International Energy Agency IEA.
MSD, 2007. La consommation d’énergie du secteur tertiaire (in French), Ministy of Sustainable Developement (MSD) [Ministère de l’Écologie, du Développement Durable et de l'Énergie (in French)]
NBHBP, 1995. ELIB (Elhushållning i bebyggelsen). Statens Institut för Byggnadsforskning SIB and Boverket, National Board of Housing, Building and Planning (NBHBP), [Boverket (in Swedish)].
NBHBP, 2005. Piska och Morot, Boverkets utredning om styrmedel för energieffektivisering i byggnader. Boverket, Karlskrona, Sweden (in Swedish).
NBHBP, 2009. Så mår våra hus. Redovisning av regeringsuppdrag beträffande byggnaders tekniska utformning m.m. (in Swedish). NBHBP, Karlskrona, Sweden.
NBHBP, 2010. Energi i bebyggelsen – tekniska egenskaper och beräkningar. Resultat från projektet BETSI (in Swedish). NBHBP, Karlskrona, Sweden.
Newlon, S. T. and D. Weitzel, 1991. Do Market Imperfections Justify Utility Conservation Programs? A Review of the Evidence. The Electricity Journal 10: 40-53
Nik, Vahid M., and Sasic Kalagasidis, A., 2013. Impact Study of the Climate Change on the Energy Performance of the Building Stock in Stockholm Considering Four Climate Uncertainties, Building and Environment 60: 291-304.
OECD, 2001. Glossary of Statistical Terms – Non-residential Buildings – UN Definition. [online] Available at: http://stats.oecd.org/glossary/detail.asp?ID=1833
Ó Broin, E., Mata, É., Nässen J., and Johnsson, F., 2011. Quantifying the Energy Efficiency Gap for Space and Water heating in the Residential Sector in Sweden. In: eceee 2011 Summer Study, 6–11 June, Belambra Presqu'île de Giens, France.
Önsel, S. et al., 2008. A new perspective on the competitiveness of nations. Socio-Economic Planning Sciences 42 (4): 221-246.
Ostertag, K., 1999. Transaction costs of raising efficiency. Working paper presented at the IEA International Workshop on Technologies to Reduce Greenhouse Gas Emissions: Engineering-economic Analyses of Conserved Energy and Carbon, 5–7 May 1999, Washington, DC.
Pagès-Ramon, A., 2012. Caracterització del sector de l'edificació des del punt de vista de les emissions de GEH (in Catalan). PhD Thesis, Universitat Politècnica de Catalunya, Barcelona, Spain.
Pérez-Lombard, L., Ortiz, J., and C. Pout, 2008. A review on buildings energy consumption information. Energy and Buildings 40 (3): 394-398.
Petersdorff, C. et al., 2006. Mitigation of CO2 Emissions from the EU-15 Building Stock. Beyond the EU Directive on the Energy Performance of Buildings. Cologne, Germany.
Price C. and Nair, C., 1985. Social discounting and the distribution of project benefits. Journal of Development Studies 21 (4): 525–532.

58
Price, C., 1988, Investment, reinvestment, and the social discount rate for forestry, Forest Ecology and Management 24 (4): 293–310.
Rivers, N. and M. Jaccard, 2005. Combining Top-Down and Bottom-Up Approaches To Energy-Economy Modeling Using Discrete Choice Methods. The Energy Journal 26 (1): 83-106.
Rushing, A. S.,Kneifel, J. D., Lippiatt, B. C., 2010. Energy prices indices and discount factors for life-cycle cost analysis. Annual Supplement to NIST Handbook 135 and NBS Special Publication 709, Sponsored by U.S. Department of Energy, Washington, USA.
Sandberg, E., 2007. Energieffektiva åtgärder vid renovering och utbyte. ATON teknikkonsult AB (in Swedish). Stockholm, Sweden.
Sartori, I., Wachenfeldt, B.J., and Hestnes, A. G., 2009. Energy demand in the Norwegian building stock: Scenarios on potential reduction. Energy Policy 37: 1614-1627.
Sasic Kalagasidis, A. et al., 2006. ENLOSS testing with HAM-Tools. SMHI Common exercise 0. Calculation of energy use for space heating. Report 2005:6 ISSN 1652-9162. Department of Civil and Environmental Engineering, Division of Building Technology, Chalmers University of Technology, Gothenburg, Sweden.
Sterner T., Persson U.M., 2008. An even sterner review: Introducing relative prices into the discounting debate. Review of Environmental Economics and Policy 2 (1): 61-76.
Summerfield A. J. and Lowe, R., 2012. Challenges and future directions for energy and buildings research. Building Research & Information 40 (4): 391-400.
Swan, L.G., and V.I. Ugursal, 2009. Modeling of end-use energy consumption in the residential sector: A review of modeling techniques. Renewable and Sustainable Energy Reviews 13 (8): 1819-35.
Train, K., 1985. Discount rates in consumers’ energy-related decisions: a review of the literature. Energy 10 (12): 1243-1253.
Train, K., 2002. Discrete Choice Methods with Simulation. Cambridge University Press, Cambridge.
Tsikaloudaki, K., 2012. On the Establishment of Climatic Zones in Europe with Regard to the Energy Performance of Buildings. Energies 5 (1): 32-44.
Ürge-Vorsatz, D. and A. Novikova, 2008. Potentials and costs of carbon dioxide mitigation in the world's buildings. Energy Policy 36 (2): 642-661.
Ürge-Vorsatz, D., Koeppel, S. and S. Mirasgedis, 2007. Appraisal of policy instruments for reducing buildings' CO2 emissions. Building Research & Information 35 (4): 458 – 477.
Ürge-Vorsatz, D., Petrichenko, K. and Butcher, A. C., 2011. How far can buildings take us in solving climate change? A novel approach to forecasting. In: eceee 2011 Summer Study, 6–11 June, Belambra Presqu'île de Giens, France.
Wilhelmsen A.M., 1982. Methods for surveying and describing the building stock. Proceeding of the CIB W70 1981 Symposium, Swedish Council for Building Research.
WWF España and Etres Consultores, 2010. Potencial de ahorro energético y de reducción de emisiones de CO2 del parque residencial existente en España en 2020 (in Spanish). European Climate Foundation, Madrid, Spain.
Yang, W. and N. Kohler, 2008. Simulation of the evolution of the Chinese building and infrastructure stock. Building Research & Information 36 (1): 1 – 19.